Article

Forecasting the Collapse-Induced Ground Vibration Using a GWO-ELM Model

1
School of Civil Engineering, Harbin Institute of Technology, Harbin 150090, China
2
Key Lab of Structures Dynamic Behavior and Control of the Ministry of Education, Harbin Institute of Technology, Harbin 150090, China
3
Key Lab of Smart Prevention and Mitigation of Civil Engineering Disasters of the Ministry of Industry and Information Technology, Harbin Institute of Technology, Harbin 150090, China
4
School of Civil and Transportation Engineering, Hebei University of Technology, Tianjin 300401, China
*
Author to whom correspondence should be addressed.
Buildings 2022, 12(2), 121; https://doi.org/10.3390/buildings12020121
Submission received: 14 December 2021 / Revised: 15 January 2022 / Accepted: 23 January 2022 / Published: 25 January 2022
(This article belongs to the Special Issue Dynamic Response of Structures)

Abstract

:
Blasting demolition is a popular method in the area of building demolishing. Due to the complex process of the building components’ collapse, it is difficult to predict the collapse-induced ground vibrations. As the accuracy of the empirical equation in predicting the collapse-induced ground vibration is not high, there is a significant risk of damage to the surrounding structures. To mitigate this risk, it is necessary to control and predict the peak particle velocity (PPV) and dominant frequency of ground vibration with higher accuracy. In this study, the parameters on the PPV and frequency of collapse-induced ground vibration are analyzed based on the Hertz theory. Then, fall tests are performed to simulate the collapse process of structural components and to investigate the characteristics of influential parameters on PPV and frequency. Using kernel density estimation (KDE) and Pearson correlation, the PPV and frequency are correlated with the distance from the falling point to the monitored point (R) and the mass of the falling structural component (M). Using recorded ground vibration data, the PPV and frequency are predicted using an extreme learning machine in combination with gray wolf optimization. The efficiency of the proposed algorithm is compared with other predictive models. The results indicate that the accuracy pre-diction of the proposed algorithm is better than those of plain extreme learning machines and the empirical equations, which indicates that the approach can be applied for PPV and frequency prediction of collapse-induced ground vibrations during blasting demolition.

1. Introduction

Due to the rapid urban and industrial development and growth, many unsafe buildings, chimneys, and bridges need to be demolished. As a rapid and economical means of concrete fragmentation, blasting demolition is widely used in demolition engineering. Compared with other demolition techniques, the advantage of blasting demolition is its short duration, which leads to reduced costs and reduced resource requirements [1,2]. However, many engineers worry are concerned that the collapse of structures may cause ground vibrations, which can threaten the safety of surrounding urban structures and communities (e.g., tunnels, underground pipelines, and aboveground buildings).
Experimental studies and numerical simulations have been used to investigate the acceleration time series of the ground vibration at specific distances during blasting demolition [3,4,5,6,7]. To investigate the collapse-induced ground vibrations, the collapse process of structural components is often simplified through fall tests or dynamic compaction. Lin et al. [7] used the dynamic compaction method to investigate collapse-induced ground vibrations. The method acted as a simulation, which was then verified using actual collapse-induced ground vibration. Furthermore, it was found that the vibration attenuated rapidly as the distance increased, while the effects of the collapse profile parameters, soil geologies, and the presence of an isolation trench were also investigated. Gu et al. [8] used two-dimensional finite element analyses to investigate the induced ground vibration of dynamic compaction in dry sand. The results showed that the stress wave attenuation could be predicted and the improvement of reducing the induced ground vibration. Song et al. [6] realized a centrifugal similarity model of collapse-induced ground vibration using dimensional analysis, numerical modeling, and actual measurements, and found that the simulated model and actual measurements were similar when the gravity was increased by a factor of n times and the scale ratio of the model was 1/n.
To predict the peak particle velocities (PPV) and frequency of induced vibration, some researchers tried to investigate the influence of various parameters on ground vibration and make the predictive equations simple and accurate. The empirical equation for the PPV of a collapsed component [9] is expressed as follows:
V   =   K M g H 1 / 3 R β
where M is the maximum mass of the collapsed component (kg); g is the acceleration of gravity (m/s2); H is the height of the collapsed component from the ground (m); R is the distance from the monitoring point to the location of the collapsed component (m); K and β are the constants determined by the condition of the contact surface. Other researchers have proposed different equations for PPV prediction based on energy conservation theory and considering the distribution of the plastic zones of the foundation, respectively. These equations are listed in Table 1. Except for velocity, frequency is also one of the basic parameters of a collapse seismic wave, but these waves are not harmonic waves with a single frequency component. Spectrum analysis of seismic waves is extensively performed in safety research and commonly assigns a high priority to the dominant frequency components. If the natural frequency of the collapsed seismic wave is close to the natural frequency of the surrounding buildings, damages to the buildings may be incurred. Therefore, Fei [9] proposed an empirical equation to predict dominant frequency through dimensional analysis, and the equation is also listed in Table 1.
Consideration of all the parameters of collapse-induced ground vibration was difficult in the early studies, and these empirical equations show low accuracy in predicting frequency and PPV. To improve higher prediction accuracy, researchers have used machine learning techniques to predict collapse-induced ground vibration characteristics. Various such algorithms have been applied for predicting PPV and frequency in blasting engineering, such as artificial neural networks (ANNs), support vector machines, classification and regression trees, and so on [10,11,12,13]. For example, ANNs [14,15,16] have been adopted to predict the ground vibration in blasting engineering with a higher degree of correlation, and the results showed that the prediction performance of machine learning-based models is better than that of the empirical equations. However, the ANN models require considerable training time and easily fall in local minima. As a new algorithm, the extreme learning machine [17] (ELM) shows the advantages of fast learning, good generalization capability, and optimal solutions. ELMs are single hidden layer feedforward neural networks, which have been applied to civil engineering problems. Because the performance of ELMs depends on the weights between the input and hidden layers and the biases of the hidden layer, it is necessary to adjust their parameters to ensure the accuracy of the models. Many optimization algorithms have been applied to determine the parameters of ELMs, such as the grid search method, particle swarm optimization, artificial bee colony algorithm, and so on [18,19,20]. The grey wolf optimizer [21,22] (GWO) is a new optimization algorithm that can be used to calculate the weights and biases of ELM. Through imitating the hunting behavior of a wolf pack, GWO has the advantages of few adjustment parameters, fast convergence, and strong global searchability. Therefore, it has been widely used for the optimization of various intelligence algorithms. For example, the hybrid GWO-ELM algorithm [23,24] has been successfully used for solving complex problems in different areas and shows better performance than other algorithms.
PPV, frequency, and duration are the parameters commonly used to assess the damage caused by stress waves to urban structures [25,26]. Since PPV and frequency are regarded as important indicators of a ground vibration’s effect on the surrounding buildings, the International Organization for Standardization (ISO) and many countries [27] have outlined the typical ranges of PPV and frequency of ground vibrations according to the bearing limitations of different structures and urban settings. The PPV value limits (extracted based on “Safety Regulations for Blasting” and the relevant ISO standards) for different building types are shown in Figure 1.
As a contribution to the assessment and prediction of collapse-induced ground vibrations, in this study a survey of the literature on the prediction models for ground vibration in blasting demolition is first presented, followed by a series of single-object fall tests to simulate collapse-induced ground vibrations. Then, the Pearson correlation coefficient is used to investigate the influence of primary factors on ground vibration characteristics. Based on the test results, the GWO-ELM algorithm is applied to the prediction of the PPV and frequency. Then, the prediction results are analyzed according to two performance metrics, the root mean square error (RSME) and the determination coefficient (R2). Based on these results, comparisons are presented on the accuracy of the empirical equations, ELM, and GWO-ELM models, and the optimal model for predicting PPV and frequency is selected.

2. Theoretical Analysis on the Collapse-Induced Ground Vibration

Due to the variety of structural types, the conditions and requirements of demolition, as well as the surrounding communities and environment of the collapsed structures, the collapse type is selected according to the specific situation. During the demolition of structures, the velocity of the collapsed building components will be reduced to 0 at the moment of impact on the contact surface. The collapsed components’ kinetic energy is then converted into the deformation energy of the contact surface and vibration energy of particles. The impact and vibration caused by the collapsed building components pose a safety threat to urban structures. Due to the difficulty of the associated theoretical analysis and the poor accuracy of the empirical equations, there have been few previous studies on collapse-induced vibration. Therefore, research on the vibrations induced from collapsing bodies has important theoretical value and practical significance.
Based on the Hertz theory [28], the collapsed component’s contact with the surface can be regarded as an elastic collision between two elastic spheres. The equation of stress distribution can be expressed as:
P l   =   3 F 2 π L 2 1     l L 2 1 / 2
where, L is the radius of contact surface: L   =   r     δ , with r being the equivalent radius: r   =   r 1 r 2 r 1   +   r 2 , r 1 and r 2 are the radius of the two spheres; δ is the total compression; δ   =   δ 1   +   δ 2 , δ 1 , δ 2 are the compression of the two spheres. l is the radius variable of the contact surface and F is the impact force, expressed as:
F   =   4 r E δ 3 / 2 3
where, E is the equivalent modulus: E   =   E 1 E 2 ( 1     μ 1 2 ) E 2   +   1     μ 2 2 E 1 , E 1 and E 2 are the elastic modulus of the two spheres; μ 1 and μ 2 are the Poisson ratios of the two spheres, respectively. Therefore, the impact force is directly affected by the total compression δ , which is calculated as:
δ   =   5 m v 2 4 K 2 / 5
where m is the equivalent mass: m   =   m 1 m 2 m 1   +   m 2 , m 1 and m 2 are the mass of the two spheres; v is the instantaneous velocity of two elastic spheres; K is the constant and calculated as:
K   =   4 r E 3
According to Equations (6)–(8), the elastic impact force can be expressed as:
F e   =   5 m 1 m 2 v 2 4 m 1   +   m 2 3 / 5 4 E 1 E 2 r 3 E 2 1     μ 1 2   +   E 1 1     μ 2 2 2 / 5
Assuming that the mass of ground surface is m 2     , the radius of ground surface is r 2     , the instantaneous velocity is v 2   =   2 g H . Therefore, Equation (9) can be simplified as:
F e   =   5 m 1 g H 2 3 / 5 4 E 1 E 2 r 1 3 E 2 1     μ 1 2   +   E 1 1     μ 2 2 2 / 5
The effects of various factors on the impact forces are expressed in Equation (10). According to the existing empirical equations, the distance (R) should be considered as the major parameter in predicting the PPV and frequency. Therefore, the parameters related to PPV and frequency are as follows:
PPV   =   f m 1 , r 1 , E 1 , E 2 , μ 1 , μ 2 , H , R
f   =   f m 1 , r 1 , E 1 , E 2 , μ 1 , μ 2 , H , R

3. Falling Tests

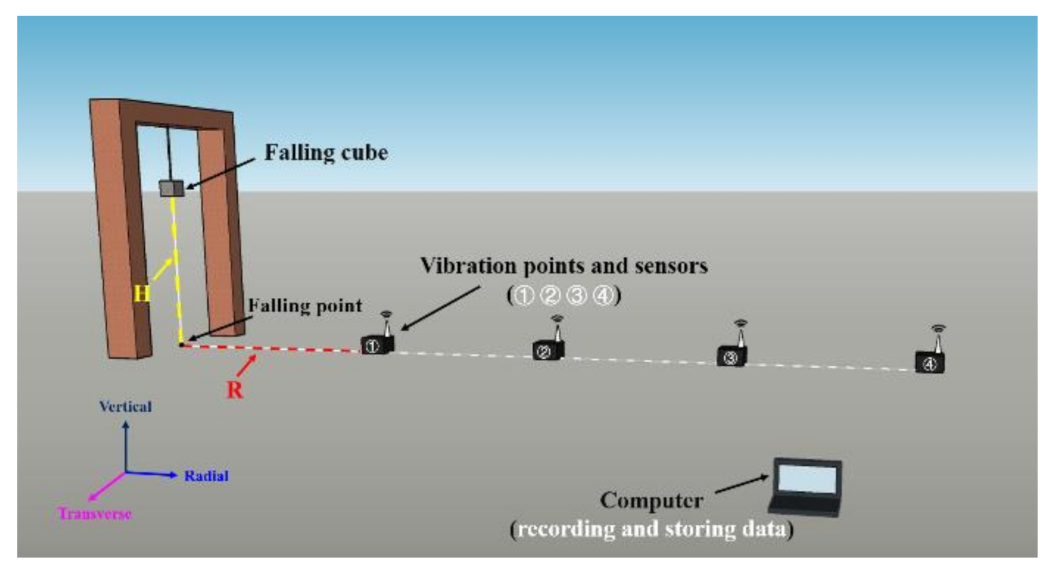
3.1. Description of the Test
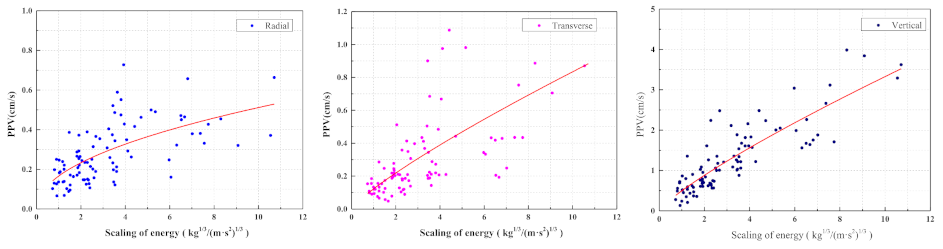
Fall tests are conducted to simulate a collapsing structure. As is shown in Figure 2, cubes with different masses are dropped from different heights on a concrete contact surface. The pressure applied during impact and the size of the falling cubes are 57 MPa and 100 mm × 100 mm × 100 mm, respectively. The ground vibration was measured using a TC-4850 sensor, at a distance of 0.5 m from the impact site. The mass and height of the cubes, along with the distance from the impact points to the monitored points, are listed in Table 2.

3.2. Test Results

The ground vibrations were recorded in the form of velocity histories in the radial, transverse and vertical directions. Since a large amount of test data can not be performed intuitively, the test PPV and frequency are fitted for analysis. It is widely accepted that the scaling of energy is defined as the relation between R and the energy of the collapsed component, so the scaling of energy can be calculated as:
Scaling   of   energy   =   M g H 1 / 3 R
In this study, the failure stress of the falling concrete cubes is uniform because the masses of the concrete cubes used were the same. Therefore, the failure stress can be regarded in Equations (1) and (4). To obtain a clearer plot of the vibration data, the relations between the PPV of the three components and the scaling of energy were plotted using Equation (1), while the frequency was determined using Equation (4). The constants of empirical equations are determined by non-linear regression analysis, the calculated values of the constants for Equations (1) and (4) are shown in Table 3. Moreover, Table 3 also lists the R2 to enable evaluating the accuracy of the empirical equation. Based on Table 3, the empirical equation of PPV obtains higher R2 than the empirical equation of frequency. In general, the empirical equations are unsuitable for predicting the PPV and frequency, and these result in a worse performance of prediction.
The comparison of the PPV along the three directions shows that the PPV prediction in the vertical direction is better in terms of R2 value compared to the radial and transverse directions. Figure 3 shows the nonlinear curve of the relationship between the scaling of energy and the PPV in different directions for the case of a concrete surface. It can be seen that the PPV values increase as the scaling of energy increases. Meanwhile, the values of PPV in the vertical direction are higher than those in the radial and transverse directions. Therefore, the results indicate that PPV in the vertical direction should be the main factor measured when investigating the potential effect of a building collapse on the surrounding structures. Meanwhile, according to the test results, the value of the dominant frequency of ground vibration is in the range of 0–1 Hz. The relationship between the scaling of energy and dominant frequency is shown in Figure 4. In contrast to the PPV, the dominant frequency decreases with the increase of the scaling of energy. The frequency in the transverse direction is lower than that of the other two directions.

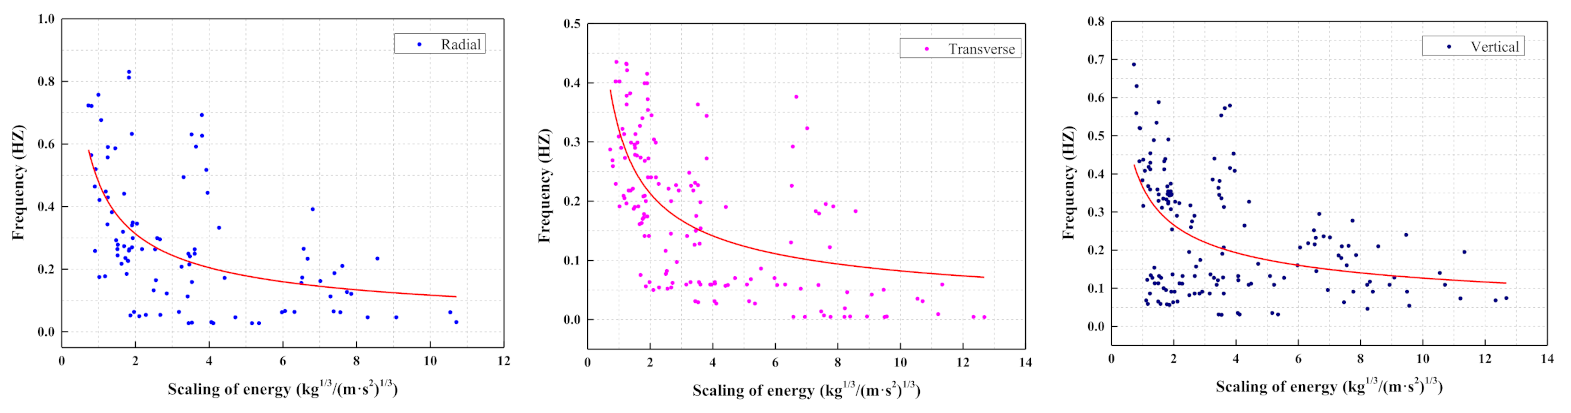
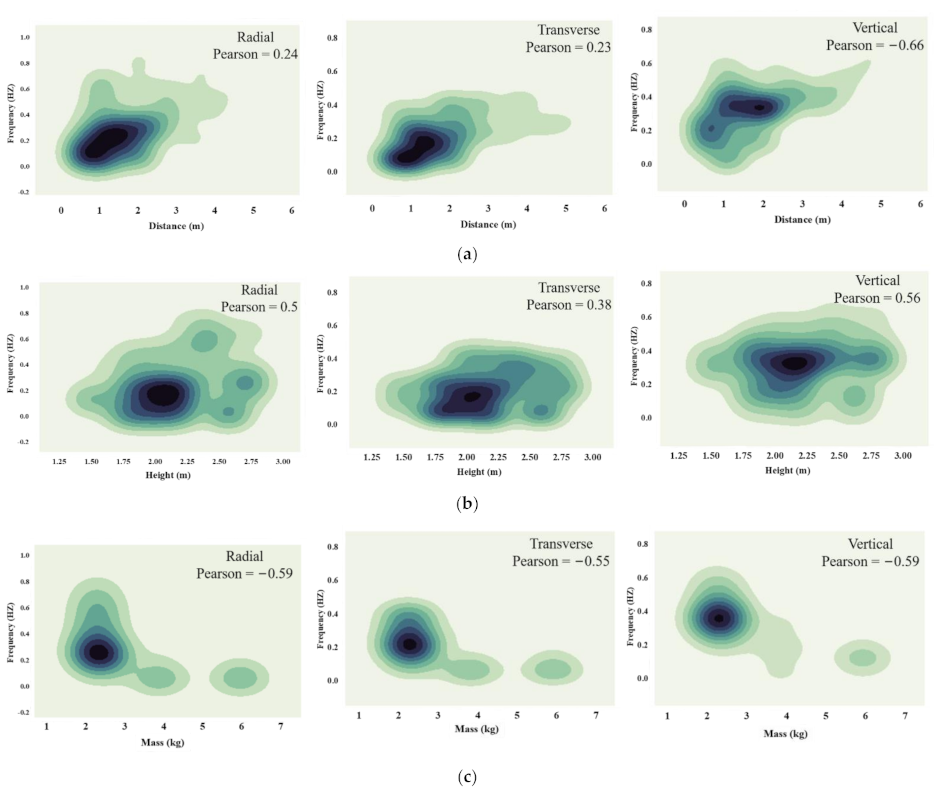
3.3. Effect of the Main Parameters

To investigate the main parameters affecting collapse-induced ground vibrations, it is necessary to consider whether these parameters have an impact on the PPV and frequency. Due to the results of the fall tests, the distance between collapsed components and monitored points, the height, and the mass are considered as the major factors affecting the prediction of PPV and frequency. The Pearson correlation coefficient was selected to analyze the correlation between these parameters, PPV, and frequency. When the Pearson correlation coefficient between a parameter and the PPV (or frequency) is close to 1 or −1, this indicates that the parameter has a strong effect on PPV (frequency). In addition, kernel density estimation (KDE) was used to analyze the overall distribution of data from the fall tests.
The KDE and Pearson correlation coefficients between the main parameters and PPV in the three directions are depicted in Figure 5. It can be seen that the PPVs increase as the mass is increased and decrease as distance increases. Figure 5 also shows the Pearson correlation coefficients between the main parameters and PPV. Among the three parameters, the distance is the most important parameter affecting the PPV along the radial direction, with a Pearson correlation coefficient value of −0.54. In the transverse and vertical directions, the results show that the mass can be regarded as the most important parameter affecting PPV in the transverse and vertical directions, with correlation coefficient values of 0.72 and 0.71, respectively. Therefore, the distance and mass should be paid more attention to when predicting the PPV of blasting demolitions.
The relationship between the main parameters and frequency was also investigated using KDE and Pearson correlation. The results of the KDE between the main parameters and frequency are shown in Figure 6. From the KDE aspect, distance and mass have significant impacts on frequency, but the influence of height is not obvious. As in the case of PPV, the Pearson correlation coefficient was used to analyze the sensitivity of frequency to each of the main parameters. According to the results, the mass is the most important parameter affecting frequency in the radial and transverse directions. Meanwhile, the correlation coefficient between the mass and frequency had a value of −0.59 in the radial direction and −0.55 in the transverse direction. Among the three parameters, the correlation coefficient between the distance and frequency in the vertical direction was −0.66, which indicates the influence of the distance on predicting frequency is more pronounced than that of the other two parameters.

4. Predictive Model Development

4.1. Theoretical Background of Various Models

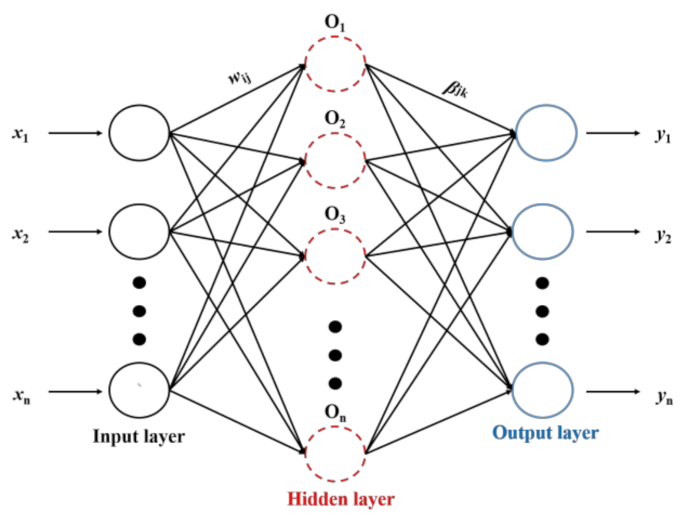
4.1.1. Extreme Learning Machine (ELM)

ELM is a novel method for feedforward neural networks [29]. Unlike most neural networks, in ELM algorithms there is only one hidden layer, the weights, and biases of which are determined randomly. To determine the optimum ELM algorithm, the weights of the hidden layer and the biases of the output layer are calculated so as to make the speed of calculation faster. Assuming there is a set of samples D with different samples x i , y i , which can be expressed as:
D   =   x j , y j , j   =   1 , 2 , , N
If there are L hidden layer neuron nodes, the function of the output of the standard feedforward neural network can be calculated as follows:
f L x   =   i   =   1 L β i g w i     x j   +   b i   =   t i , j   =   1 , 2 , , N
where x j   =   x j 1 , x j 2 , , x j m T is the input vector; b j   =   b i 1 , b i 2 , , b i m T is the bias vector; the weights which connect the hidden neurons to the input and output neurons are w i   =   w i 1 , w i 2 , , w i m T and β i   =   β i 1 , β i 2 , , β i m T , respectively; the output vector is t j   =   t j 1 , t j 2 , , t j m T ; g x is the activation function, which can take various forms, such as a radial basis function, sigmoid, sine and so on. To minimize the training error, it is necessary to reduce the difference of the output values from the target values. Therefore, Equation (15) can be written as:
f L x   =   i   =   1 N β i g w i     x j   +   b i   =   y i , j   =   1 , 2 , , N
where y j   =   y j 1 , y j 2 , , y j m T is the target vector. Equation (16) can be in matrix form as H β   =   Y , in which
H   =   g w 1     x 1   +   b 1 g w L     x 1   +   b 1 g w 1     x N   +   b 1 g w L     x N   +   b 1 N   ×   L
In the ELM, output weights are obtained when the training errors between the target values and the predicted values are minimized. The output weights can be calculated as follows:
β   =   H Y
where H represents the Moore Penrose generalized inverse of the matrix H . The architecture of a standard ELM is shown in Figure 7. The input weights and hidden neuron thresholds of a standard ELM are generated randomly and thus do not require an iterative solution. However, the output matrix is usually a non-full rank matrix, which weakens the generalization performance of the model, while the ELM parameters are adjusted repeatedly to improve the prediction accuracy and stability, which leads to increased computational cost to achieve a solution. Therefore, it is necessary to determine methods for optimizing ELM parameters while improving the model’s accuracy and stability.

4.1.2. Grey Wolf Optimizer (GWO)

The GWO is a new optimization algorithm first proposed by Mirjalili et al. [21], which aims to imitate the progress of the social order of grey wolves and their hunting behavior. Due to the strict social dominant hierarchy of the grey wolves, the entire wolf pack is divided into four categories: alpha ( α ), beta ( β ), delta ( δ ), and omega ( ω ). The alpha wolves are the leaders of the wolf group, and make decisions about hunting, resting, sleeping, and so on. According to the social stratification, the beta wolves are in the second tier; they obey the commands of the alphas and assist the alphas in decision-making. Delta wolves are at a lower tier than alphas and betas, and their main tasks are reconnaissance, sentry, and guarding. The omega tier is the lowest in the entire pack, and its members must submit to all the other wolves of the pack and satisfy the entire pack. In the GWO, the best solution found is considered as the alpha. Beta and delta constitute respectively the second and third solutions. The remaining solutions are considered to be omega, and follow alpha, beta, and delta. The social dominance hierarchy of a grey wolf pack is shown in Figure 8.
During hunting, the behavior of grey wolves encircling the prey can be mathematically described as:
D   =   C     X P w     X w
X w   +   1   =   X p w     A     D
where D represents the distance from the wolf to prey, w represents the current iteration index, X and X p represent the position vector of individual grey wolves in generation and the position vector of the prey in generation respectively. A and C are the coefficient vectors, whose values can be calculated as follows:
A   =   2 a r 1     a
C   =   2 r 2
where r 1 and r 2 are two random vectors in the range of 0 , 1 , the value of a decreases linearly from 2 to 0 during the iteration.
After encircling, the grey wolves are generally guided by the alphas to begin to attack the prey. However, it is impossible to obtain the location of the prey because of its initial position. While hunting, the encircling process is mainly dominated by alphas, betas, and deltas because they have strong abilities to identify the positions of prey. Thus, these tiers look for the current position of prey, while omega updates their optimal positions based on the three higher tiers’ locations. So, the hunting behavior can be expressed as:
D α   =   C 1     X α     X D β = C 2     X β     X D δ = C 3     X δ     X
X 1   =   X α     A 1     D α X 2 = X β     A 2     D β X 3 = X δ     A 3     D δ
X w   +   1   =   X 1   +   X 2   +   X 3 3
where X α , X β and X δ are the position vectors of alpha, beta, and delta, respectively; D α , D β and D δ are the corresponding distances to the prey; C 1 , C 2 and C 3 are the coefficient vectors; X 1 , X 2 and X 3 are the moving step size and direction of the alpha, beta, and delta, respectively. When the position of the prey has been determined, the wolves reach the location of the prey and attack it. From the mathematical point of view, the optimum point is found when A   <   1 . It can be seen that to decrease the value of A , it can be seen that the value of a should also decrease in Equation (21).

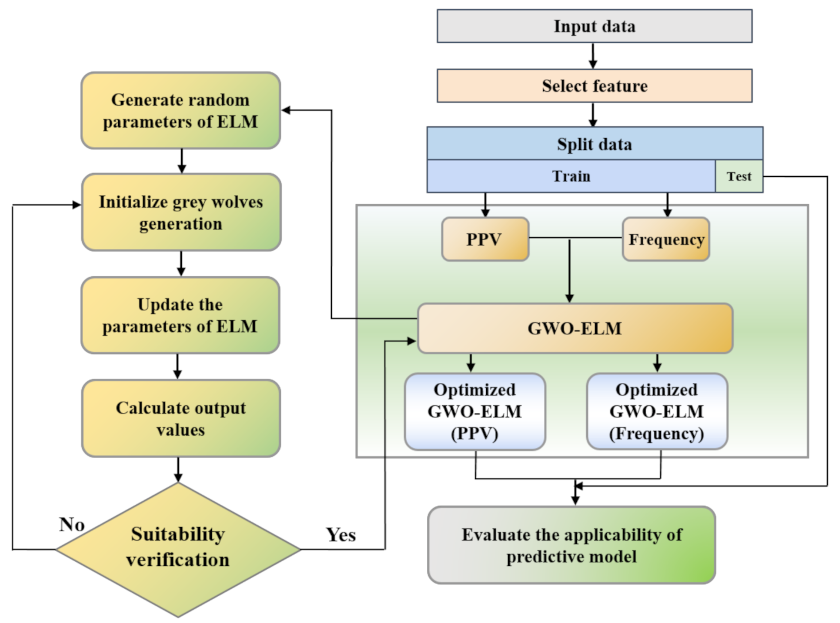
4.2. Methodology of GWO-ELM

The proposed workflow of the prediction process shown in Figure 9 is applied to develop, train and test GWO-ELM for accurate PPV and frequency prediction. The first step of this workflow is sampling. The data samples, which include input and output parameters, are mentioned in Section 3.2. The next step is feature selection, which is based on the parameters of the impact force and the decay of the stress wave with distance. Consistent with the fall tests, the mass and height of the falling cubes and the distance between the impact and the monitored points are selected as the final parameters. After that, 80% of the datasets are selected for training and the rest for testing and validation. Then, different PPV prediction models, frequency in different directions, and contact surfaces are proposed to predict the ground vibration, respectively. Based on the ELM algorithm presented above, the weights and biases should be calculated to ensure the ground vibration prediction accuracy. Therefore, in this study, the GWO is utilized to optimize the ELM, and the hybrid regression approach is named GWO-ELM. The final step is evaluating the performance of GWO-ELM and comparing its accuracy with the empirical equations and the plain ELM algorithm.

4.3. Performance Assessment

To examine the prediction performance of the model, two statistical indices, namely, R2 and RSME are used to evaluate the performance of the empirical equations, the ELM, and GWO-ELM. The RSME is often used to calculate the differences between predicted and actual values. If the value of RSME approaches 0, this indicates that the accuracy of the predictive model is high. The determination coefficient (R2) is used to judge the performance of a statistical model by fitting the training set. The expressions for R2 and RSME are shown in Equations (26) and (27), respectively.
R 2   =   i = 1 n x i     x m e a n 2     i   =   1 n x i     x p 2 i   =   1 n x i     x m e a n 2
RSME   =   1 n   ×   i   =   1 n x i     x p 2
where n is the number of data sets, x i is the measured variable, x p is the predicted variable, and x mean is the average variable.

5. Results and Discussion

According to Section 3.3, the PPV values in the radial and transverse directions are lower than those in the vertical direction. Based on “Safety Regulations for Blasting” [27], the maximum PPV value in a single direction or the resultant velocity is selected as the criterion to predict the damage degree to the surrounding structures. Therefore, the ground vibration in the vertical direction is used to investigate GWO-ELM’s accuracy in predicting PPV and frequency.

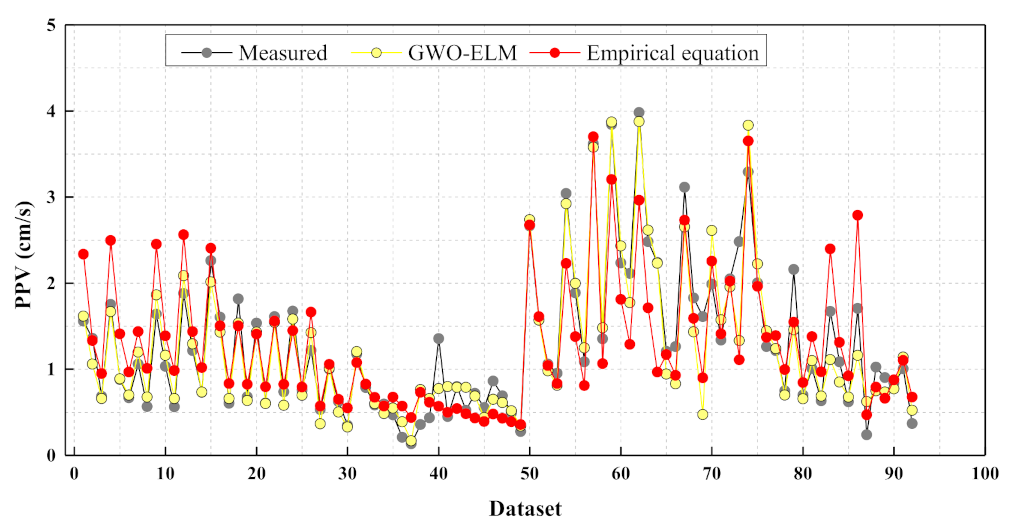
5.1. Prediction of PPV

According to the fall tests, H, M and R should be considered as the input neurons to predict the collapse-induced ground vibration. The number of hidden neurons was determined through a trial-and-error process. To evaluate the performance of different numbers of hidden layer neurons of the GWO-ELM model, the RMSE was selected to formulate the best model. According to the results presented in Figure 10, the value of training-RSME for GWO-ELM models decreases as the number of hidden neurons increases. The gap in values of training-RSME is very small. However, the test-RSME value for the configuration with 16 hidden neurons yielded the best accuracy compared to other GWO-ELM models. Therefore, the optimal structure of the GWO-ELM model for PPV prediction was determined.
After optimizing the GWO-ELM model using the fall test data, it is necessary to examine the efficacy of the GWO-ELM model. Therefore, the ELM and the empirical equations were selected as benchmarks for comparison with the GWO-ELM algorithm. In order to compare the performance of predicting the PPV intuitively, an ELM with the same number of hidden layer neurons as the GWO-ELM was used for this comparison. Figure 11 shows the comparison between the measured and predicted PPV of the different prediction methods and the performance assessment of the models. As shown in Figure 11, the prediction of GWO-ELM was closer to the identity line than those of the other models of the comparison. To verify the performance of the predictive models, the values of R2 were calculated and shown in Table 4. Comparing the three predictive models, it is evident that GWO-ELM, with its values of R2-training (0.96) and R2-test (0.65) yields better performance than ELM and the empirical equations.

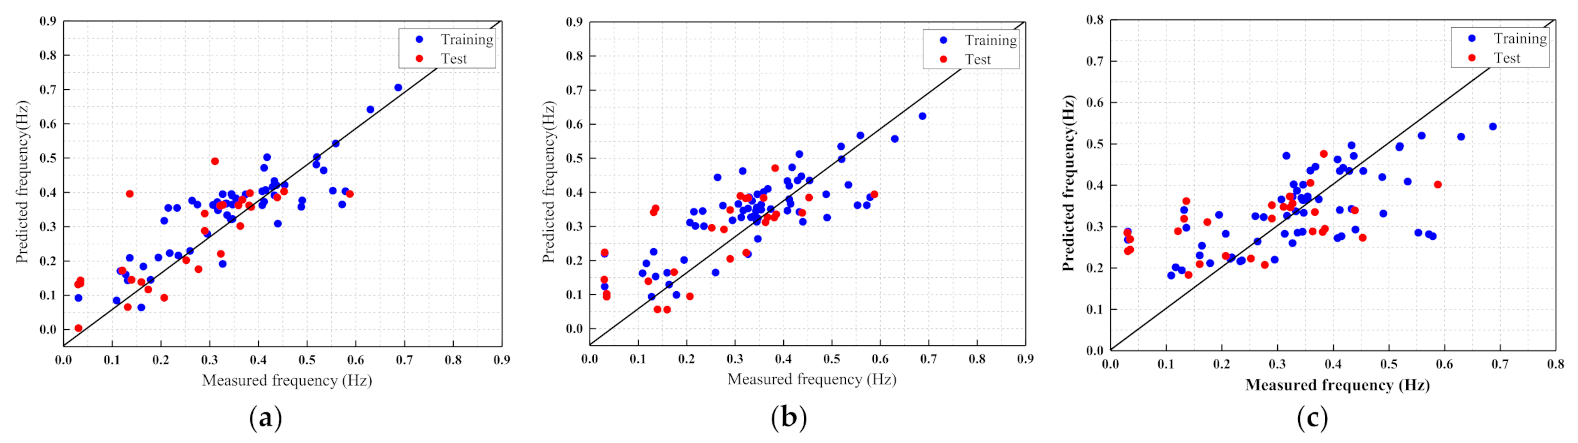
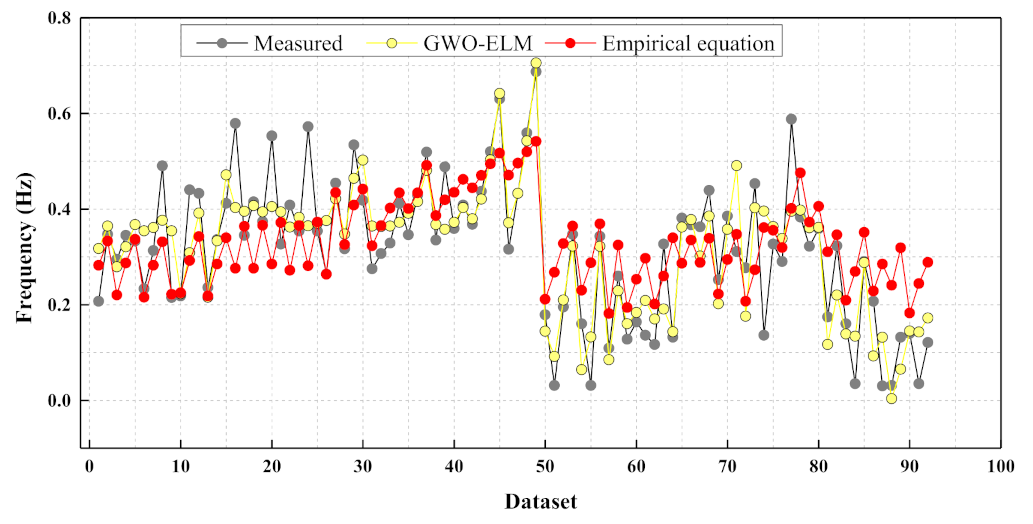
5.2. Prediction of Frequency

Similar to the prediction of the PPV, the frequency was also predicted using the workflow mentioned in Section 4.2. First, trial-and-error was utilized to optimize the models’ configuration and achieve higher accuracy. Figure 12 shows the performance of the GWO-ELM model with different numbers of hidden layer neurons. Considering the training-RSME and test-RSME, the optimal model with 11 hidden layer neurons shows high accuracy predictions of the actual frequency and was therefore selected.
The comparison between the frequency measured and predicted by GWO-ELM is shown in Figure 13a, while (b) and (c) show the corresponding performance of the ELM and the empirical equations, respectively. It can be seen that the majority of the points of GWO-ELM are closer to the identity line than those of the other two models. In order to compare the performance of the models more intuitively, Table 5 lists the statistical metrics’ results for frequency prediction. The GWO-ELM model achieved R2-training (0.75) and R2-test (0.59) and was therefore slightly better compared to the other two predictive models. Thus, combined with the above results, the comparison confirms GWO-ELM’s suitability for frequency prediction.

5.3. Discussion

In order to compare the pros and cons between the predictive models, the calculation results of the empirical equation and GWO-ELM were compared with the actual PPV and frequency values, respectively. The performance differences for PPV and frequency prediction are shown in Figure 14 and Figure 15, respectively. In terms of PPV prediction, the accuracy of GWO-ELM was much higher than that of the empirical equations, and this was the case for frequency prediction.
Based on the results, GWO-ELM can be regarded as a good approach for predicting collapse-induced ground vibrations. Compared with the empirical equations, GWO-ELM’s performance in predicting PPV and frequency during blasting demolition is superior. Although the optimized GWO-ELM model predicts PPV and frequency with high accuracy, the number of influential parameters analyzed through the fall tests was still relatively small. If the prediction is to take more parameters into account, it is necessary to record or collect more data to improve the applicability of the GWO-ELM model.

6. Conclusions

This study attempted to simulate collapse-induced ground vibrations through fall tests. To assess and predict the PPV and frequency of collapse-induced ground vibrations, in this study the GWO-ELM algorithm is proposed. For this purpose, the dataset of 92 data including PPV, frequency, the distance from the collapsed center to the monitored point (R), the mass (M), and the height was used. The data were recorded using a blast vibrometer. Then, the KDE and Pearson correlation was used to investigate the relationship between the main parameters and the collapse-induced ground vibration data. The results of this study can be summarized as follows:
(1)
The study presents a theoretical analysis for screening the parameters which can be considered to predict collapse-induced ground vibration in blasting demolition. Based on Hertz theory, the mass of the falling structural components, the elastic modulus and Poisson ratios of the component and the contact surface, the radius of component, the height between the component and the contact surface, and the distance from the falling point to the monitored point should be considered as the influential parameters for PPV and frequency prediction of collapse-induced ground vibration.
(2)
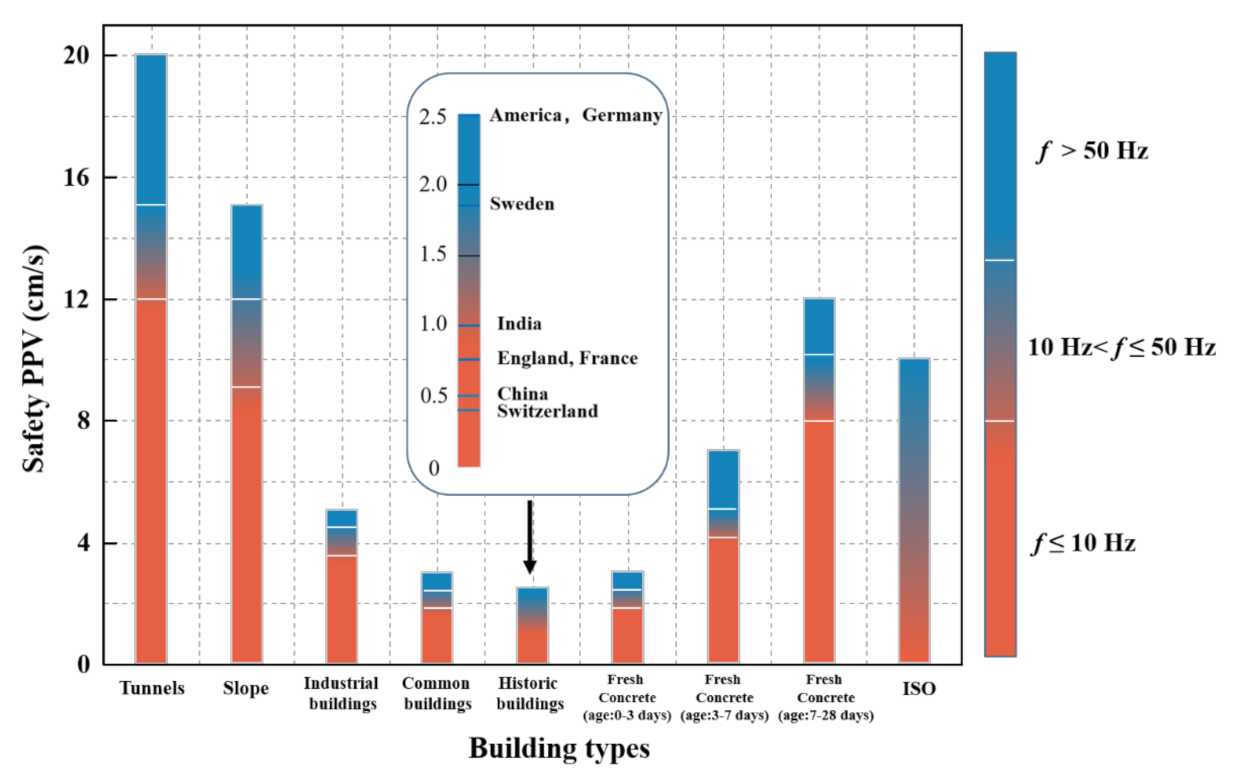
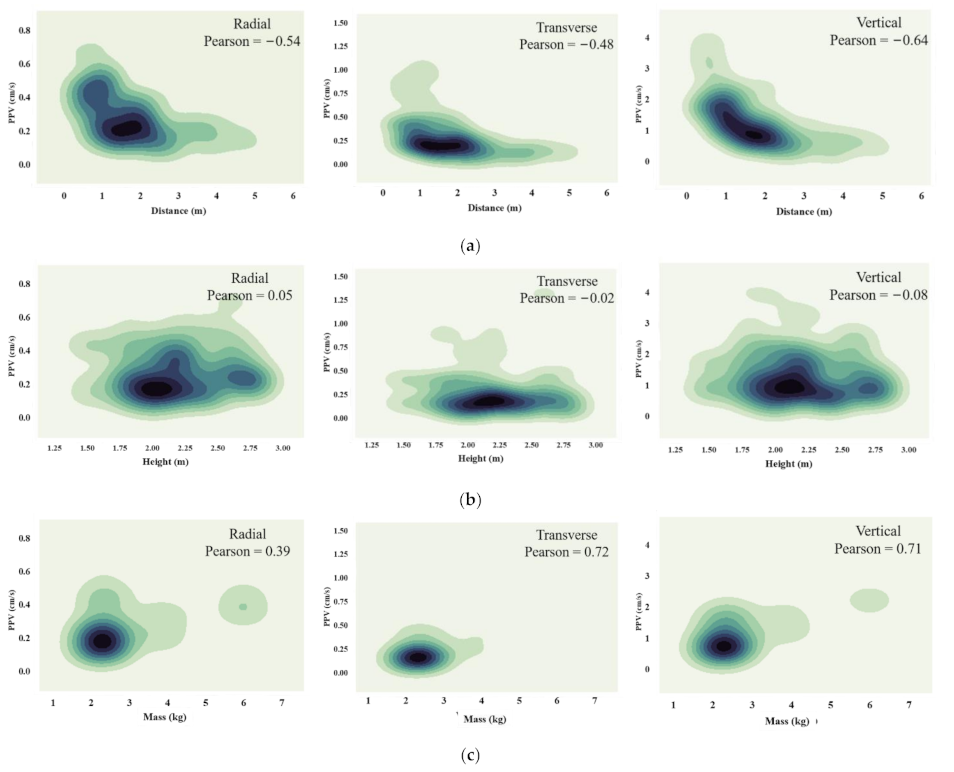
Fall tests were conducted to simulate the generation of collapse-induced ground vibrations. According to the test results, the values of PPVs in the vertical direction were larger than those in the radial and transverse directions. Meanwhile, the value of the dominant frequency was in the range of 0–1 Hz in all three directions. Due to the lower PPV values in the radial and transverse directions and the lower dominant frequency of the ground vibration, the PPV and frequency in the vertical direction were selected to investigate the application of GWO-ELM. Then, KDE and Pearson correlation coefficients were used to analyze the distribution of the fall tests and investigate the influence of the main parameters on PPV and frequency. Among the three parameters, R and M were found to be more effective in predicting the PPV and frequency of ground vibrations induced by blasting demolition.
(3)
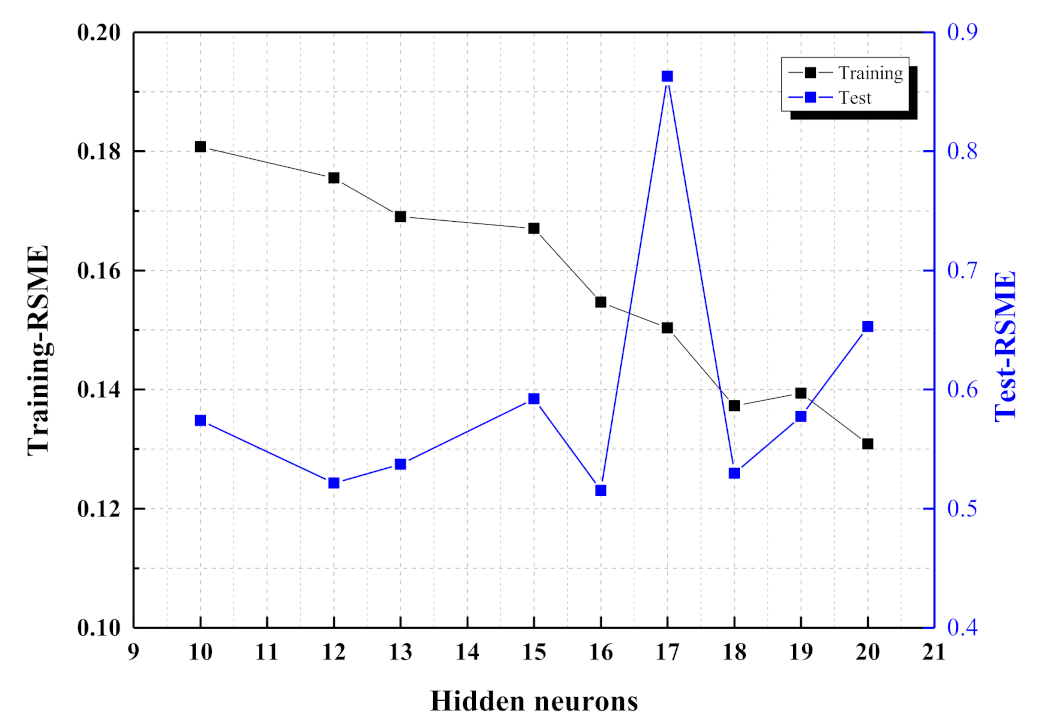
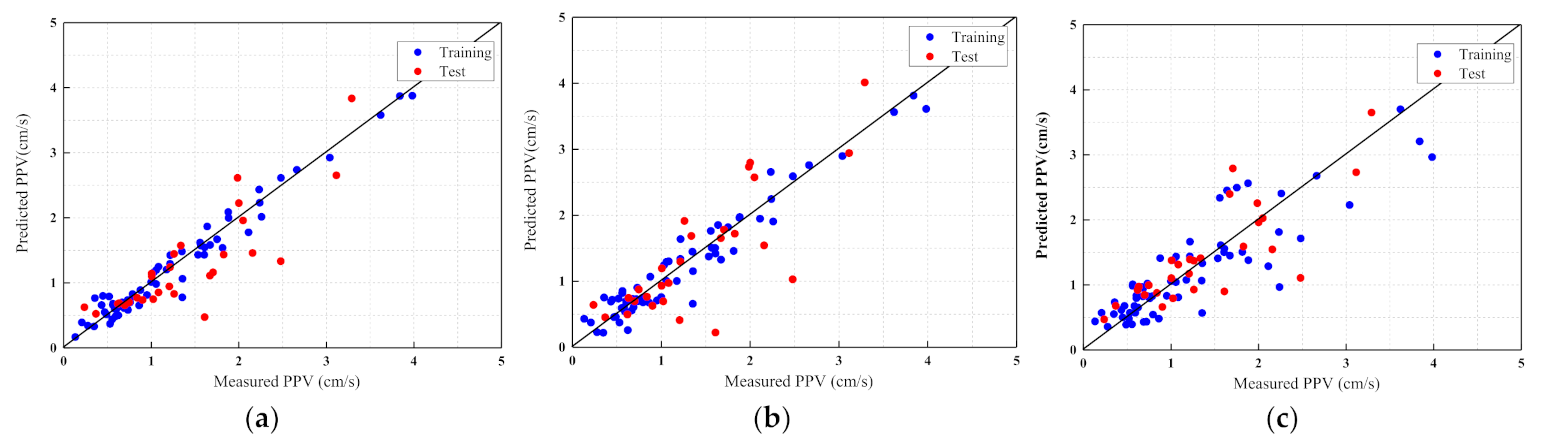
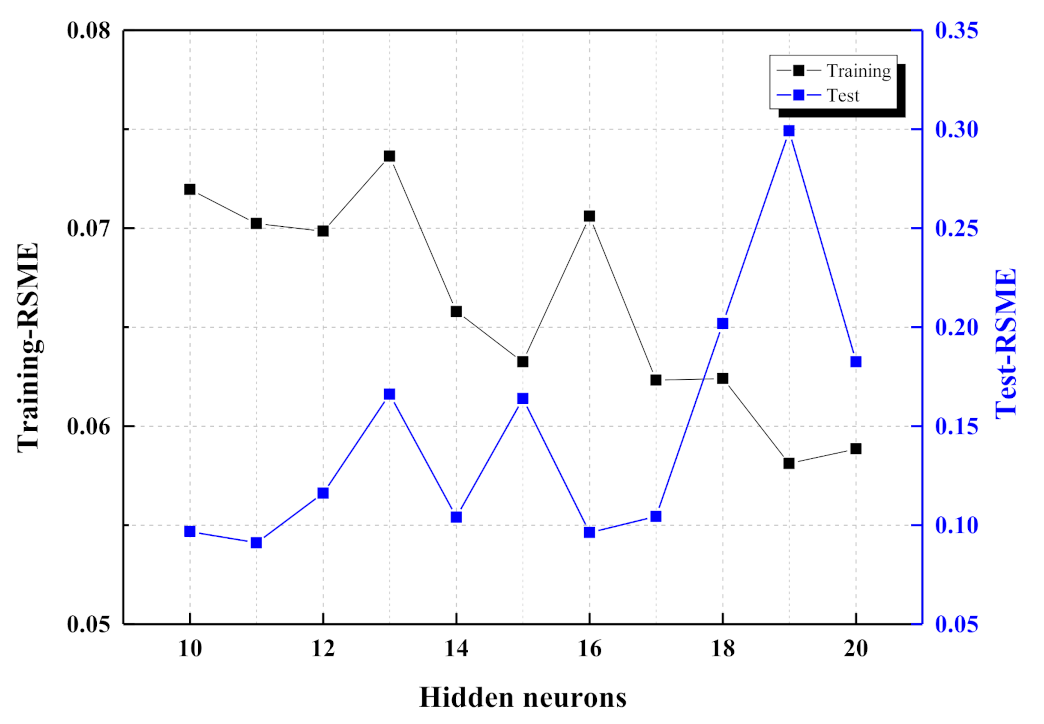
After the analysis of the influential parameters, R, H and M were selected to evaluate the performance of the predictive models. The empirical equations, an ELM, and the GWO-ELM were adopted to predict the PPV and frequency. The comparison shows that the GWO-ELM yields training-R2 (0.96) and test-R2 (0.65) values of predicting PPV superior to those obtained using the empirical equations and the ELM. In addition, the GWO-ELM, with training-R2 (0.75) and test-R2 (0.59), shows better performance compared to the other two models. Therefore, the hybrid algorithm has the potential for broad application in predicting the PPV and frequency in blasting demolition.
Therefore, due to its superior performance, the GWO-ELM can be used to determine the potential risk of a blasting demolition project to the surrounding structures and ensure the safety of structures and inhabitants. Further study should focus on more parameters for predicting the PPV and frequency in blasting demolition.

Author Contributions

Conceptualization, Y.Y. and X.H.; methodology, Y.Y. and R.L.; software, Y.Y.; validation, S.C.; formal analysis, Y.Y.; investigation, Y.Y.; resources, X.H.; data curation, W.Z.; writing—original draft preparation, Y.Y.; writing—review and editing, X.H.; visualization, W.Z.; supervision, X.H.; project administration, X.H.; funding acquisition, X.H. All authors have read and agreed to the published version of the manuscript.

Funding

This research was funded by National Natural Science Foundation of China (Nos. 52078169 and 51578184) and Excellent Youth Science Foundation of Heilongjiang Province (No. YQ2019E028).

Data Availability Statement

The data presented in this study are available on request from the corresponding author. The data are not publicly available as the data contain confidential information which cannot be publicly disclosed.

Conflicts of Interest

The authors declare no conflict of interest.

References

  1. Sun, J.; Jia, Y.; Yao, Y.; Xie, X. Experimental investigation of stress transients of blasted RC columns in the blasting demolition of buildings. Eng. Struct. 2020, 210, 110417. [Google Scholar] [CrossRef]
  2. Fujikake, K.; Aemlaor, P. Damage of reinforced concrete columns under demolition blasting. Eng. Struct. 2013, 55, 116–125. [Google Scholar] [CrossRef]
  3. Lin, F.; Ji, H.; Li, Y.; Zuo, Z.; Gu, X.; Li, Y. Prediction of ground motion due to the collapse of a large-scale cooling tower under strong earthquakes. Soil Dyn. Earthq. Eng. 2014, 65, 43–54. [Google Scholar] [CrossRef]
  4. Lin, F.; Jiang, W. Design-oriented acceleration response spectrum for ground vibrations caused by collapse of large–scale cooling towers in NPPs. Nucl. Eng. Technol. 2018, 50, 1402–1411. [Google Scholar] [CrossRef]
  5. Lin, F.; Zhong, Q. Mitigation of Ground Vibration due to Collapse of a Large-Scale Cooling Tower with Novel Application of Materials as Cushions. Shock Vib. 2017, 6809246. [Google Scholar] [CrossRef] [Green Version]
  6. Song, G.; Zhong, M.S.; Wang, M.; Long, Y.; Liu, Y.; Xu, J. lin Collapse process and impact effect of viaduct demolition based on centrifugal model. Soil Dyn. Earthq. Eng. 2018, 115, 246–251. [Google Scholar] [CrossRef]
  7. Lin, F.; Li, Y.; Gu, X.; Zhao, X.; Tang, D. Prediction of ground vibration due to the collapse of a 235 m high cooling tower under accidental loads. Nucl. Eng. Des. 2013, 258, 89–101. [Google Scholar] [CrossRef]
  8. Gu, Q.; Lee, F.H. Ground response to dynamic compaction of dry sand. Geotechnique 2002, 52, 481–493. [Google Scholar] [CrossRef]
  9. Fei Honglu, Z.L.Z. Forecast of collapsing vibration frequency of demolition blasting and its regression analysis. Blasting 2014, 31, 1–5. [Google Scholar] [CrossRef]
  10. Yan, Y.; Hou, X.; Fei, H. Review of predicting the blast-induced ground vibrations to reduce impacts on ambient urban communities. J. Clean. Prod. 2020, 260, 121135. [Google Scholar] [CrossRef]
  11. Behzad, M.; Asghari, K.; Eazi, M.; Palhang, M. Generalization performance of support vector machines and neural networks in runoff modeling. Expert Syst. Appl. 2009, 36, 7624–7629. [Google Scholar] [CrossRef]
  12. Ongen, T.; Karakus, D.; Konak, G.; Onur, A.H. Assessment of blast-induced vibration using various estimation models. J. African Earth Sci. 2018, 145, 267–273. [Google Scholar] [CrossRef]
  13. Hasanipanah, M.; Faradonbeh, R.S.; Amnieh, H.B.; Armaghani, D.J.; Monjezi, M. Forecasting blast-induced ground vibration developing a CART model. Eng. Comput. 2017, 33, 307–316. [Google Scholar] [CrossRef]
  14. Amiri, M.; Bakhshandeh Amnieh, H.; Hasanipanah, M.; Mohammad Khanli, L. A new combination of artificial neural network and K-nearest neighbors models to predict blast-induced ground vibration and air-overpressure. Eng. Comput. 2016, 32, 631–644. [Google Scholar] [CrossRef]
  15. Monjezi, M.; Ghafurikalajahi, M.; Bahrami, A. Prediction of blast-induced ground vibration using artificial neural networks. Tunn. Undergr. Sp. Technol. 2011, 26, 46–50. [Google Scholar] [CrossRef]
  16. Álvarez-Vigil, A.E.; González-Nicieza, C.; López Gayarre, F.; Álvarez-Fernández, M.I. Predicting blasting propagation velocity and vibration frequency using artificial neural networks. Int. J. Rock Mech. Min. Sci. 2012, 55, 108–116. [Google Scholar] [CrossRef]
  17. Feng, G.; Huang, G.; Lin, Q.; Gay, R. Error minimized extreme learning machine with growth of hidden nodes and incremental learning. IEEE Trans. Neural Netw. 2009, 20, 1352–1357. [Google Scholar] [CrossRef]
  18. Catalão, J.P.S.; Pousinho, H.M.I.; Mendes, V.M.F. Hybrid wavelet-PSO-ANFIS approach for short-term electricity prices forecasting. IEEE Trans. Power Syst. 2011, 26, 137–144. [Google Scholar] [CrossRef]
  19. Moayedi, H.; Mehrabi, M.; Mosallanezhad, M.; Rashid, A.S.A.; Pradhan, B. Modification of landslide susceptibility mapping using optimized PSO-ANN technique. Eng. Comput. 2019, 35, 967–984. [Google Scholar] [CrossRef]
  20. Jahangir, H.; Rezazadeh Eidgahee, D. A new and robust hybrid artificial bee colony algorithm–ANN model for FRP-concrete bond strength evaluation. Compos. Struct. 2021, 257, 113160. [Google Scholar] [CrossRef]
  21. Mirjalili, S.; Mirjalili, S.M.; Lewis, A. Grey Wolf Optimizer. Adv. Eng. Softw. 2013, 69, 46–61. [Google Scholar] [CrossRef] [Green Version]
  22. Shariati, M.; Mafipour, M.S.; Ghahremani, B.; Azarhomayun, F.; Ahmadi, M.; Trung, N.T.; Shariati, A. A novel hybrid extreme learning machine–grey wolf optimizer (ELM-GWO) model to predict compressive strength of concrete with partial replacements for cement. Eng. Comput. 2020. [Google Scholar] [CrossRef]
  23. Subudhi, U.; Dash, S. Detection and classification of power quality disturbances using GWO ELM. J. Ind. Inf. Integr. 2021, 22, 100204. [Google Scholar] [CrossRef]
  24. Ma, R.; Karimzadeh, M.; Ghabussi, A.; Zandi, Y.; Baharom, S.; Selmi, A.; Maureira-Carsalade, N. Assessment of composite beam performance using GWO–ELM metaheuristic algorithm. Eng. Comput. 2021. [Google Scholar] [CrossRef]
  25. Ainalis, D.; Ducarne, L.; Kaufmann, O.; Tshibangu, J.P.; Verlinden, O.; Kouroussis, G. Improved analysis of ground vibrations produced by man-made sources. Sci. Total Environ. 2018, 616–617, 517–530. [Google Scholar] [CrossRef] [PubMed]
  26. Navarro Torres, V.F.; Silveira, L.G.C.; Lopes, P.F.T.; de Lima, H.M. Assessing and controlling of bench blasting-induced vibrations to minimize impacts to a neighboring community. J. Clean. Prod. 2018, 187, 514–524. [Google Scholar] [CrossRef]
  27. Lu, W. bo; Luo, Y.; Chen, M.; Shu, D. qiang An introduction to Chinese safety regulations for blasting vibration. Environ. Earth Sci. 2012, 67, 1951–1959. [Google Scholar] [CrossRef]
  28. Zhang, X.; Vu-quoc, L. Modeling the dependence of the coefficient of restitution on the impact velocity in elasto-plastic collisions. Int. J. Impact Eng. 2002, 27, 317–341. [Google Scholar] [CrossRef]
  29. Huang, G. Bin; Zhu, Q.Y.; Siew, C.K. Extreme learning machine: Theory and applications. Neurocomputing 2006, 70, 489–501. [Google Scholar] [CrossRef]
Figure 1. The ranges of PPV and frequency for different communities based on different standards.
Buildings 12 00121 g001
Figure 2. Experimental setup for fall tests and ground vibration measurements.
Buildings 12 00121 g002
Figure 3. The plot of PPV in different directions.
Buildings 12 00121 g003
Figure 4. The plot of frequency in different directions.
Buildings 12 00121 g004
Figure 5. The KDE and Pearson correlation coefficient between the main parameters and PPV: (a) Distance; (b) Height; (c) Mass.
Buildings 12 00121 g005
Figure 6. The KDE and Pearson correlation coefficient between the main parameters and frequency: (a) Distance; (b) Height; (c) Mass.
Buildings 12 00121 g006
Figure 7. A typical model of ELM.
Buildings 12 00121 g007
Figure 8. Social dominant hierarchy of grey wolf pack.
Buildings 12 00121 g008
Figure 9. Workflow of the proposed GWO-ELM.
Buildings 12 00121 g009
Figure 10. Comparison results of GWO-ELM models with different numbers of hidden layer neurons.
Buildings 12 00121 g010
Figure 11. Comparison between measured and predicted PPV: (a) GWO-ELM; (b) ELM; (c) Empirical equation.
Buildings 12 00121 g011
Figure 12. RSME values for different numbers of hidden layer neurons.
Buildings 12 00121 g012
Figure 13. Comparison between measured and predicted frequency: (a) GWO-ELM; (b) ELM; (c) Empirical equation.
Buildings 12 00121 g013
Figure 14. Performance differences in PPV prediction.
Buildings 12 00121 g014
Figure 15. Performance differences in frequency prediction.
Buildings 12 00121 g015
Table 1. The list of empirical equations.
EquationNo.Notations
V   =   M 2 g H 4     4 sin φ i ρ L R     w 2 cot φ i 2 e π tan φ i sin φ i   +   e π tan φ i   +   sin φ i     1 β (2)w is the length of the collapsed component (m);
φ i is internal friction angle;
ρ is density of plastic zone (kg/m3);
L is the length of plastic zone (m).
V   =   η M / M d λ K 2 g H 1 / 2 e     α R (3) η and λ are the constants determined by the geological conditions;
M d is the mass of collapsed components on the ground (kg).
f   =   K R 2 M g h σ R 3 β (4) σ is the failure stress of the material of the collapsed component (MPa);
f is the dominant frequency (Hz)
Table 2. The range of the parameters of falling tests.
Contact SurfaceMass (M)Height (H)Distance (R)
Concrete2–6.5 kg1.5–2.77 m0.4–5 m
Table 3. Values of the constants computed by regression analysis.
DirectionEquationR2
PPVRadial V   =   0.166   ×   M g H 3 R 0.489 0.41
Transverse V   =   0.122   ×   M g H 3 R 0.831 0.43
Vertical V   =   0.497   ×   M g H 3 R 0.825 0.73
FrequencyRadial f   =   0.478   ×   M g H 3 R 0.611 0.29
Transverse f   =   0.321   ×   M g H 3 R 0.592 0.33
Vertical f   =   0.366   ×   M g H 3 R 0.461 0.21
Table 4. Statistical criteria for predicting PPV.
ModelR2
TrainingTestTotal
Empirical equation0.760.620.73
ELM0.940.290.78
GWO-ELM0.960.650.88
Table 5. Statistical criteria for predicting frequency.
ModelR2
TrainingTestTotal
Empirical equation0.410.160.39
ELM0.640.490.63
GWO-ELM0.750.590.72
Publisher’s Note: MDPI stays neutral with regard to jurisdictional claims in published maps and institutional affiliations.

