
Efficacy of Korea’s Diagonal Plane Restriction for Daylight: Focusing on South-North Direction Blocks within Seoul’s General Residential Districts


Abstract
:1. Introduction
1.1. Zoning Regulations and Daylight
1.2. Building Codes and Daylight
1.3. Seoul’s Residential Districts
2. Materials and Methods
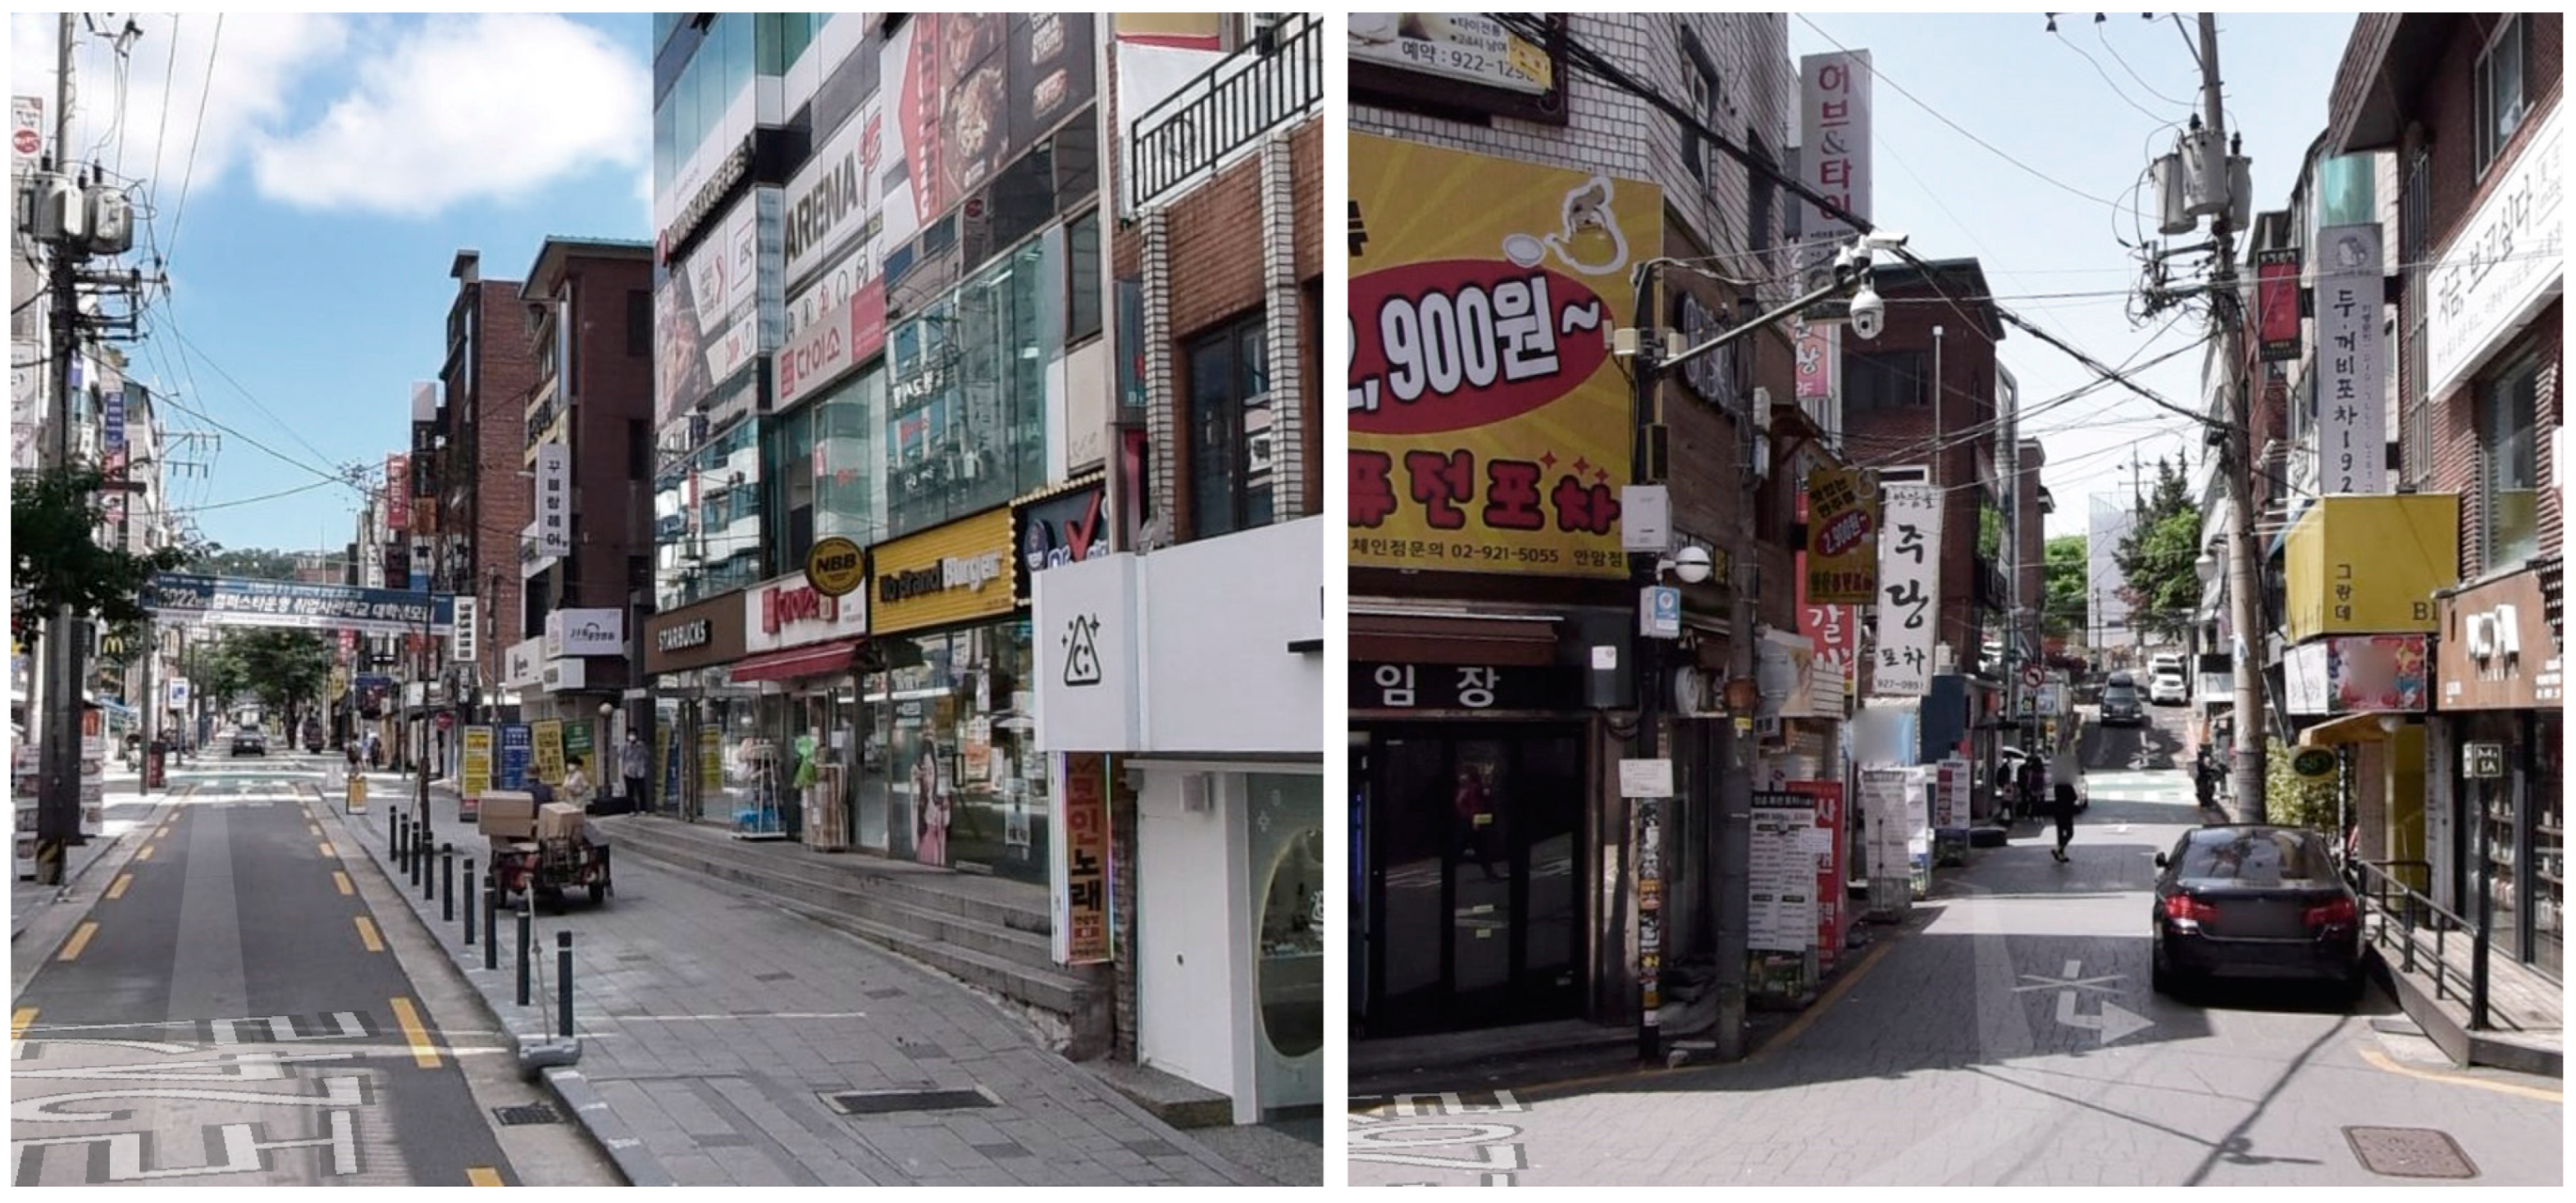
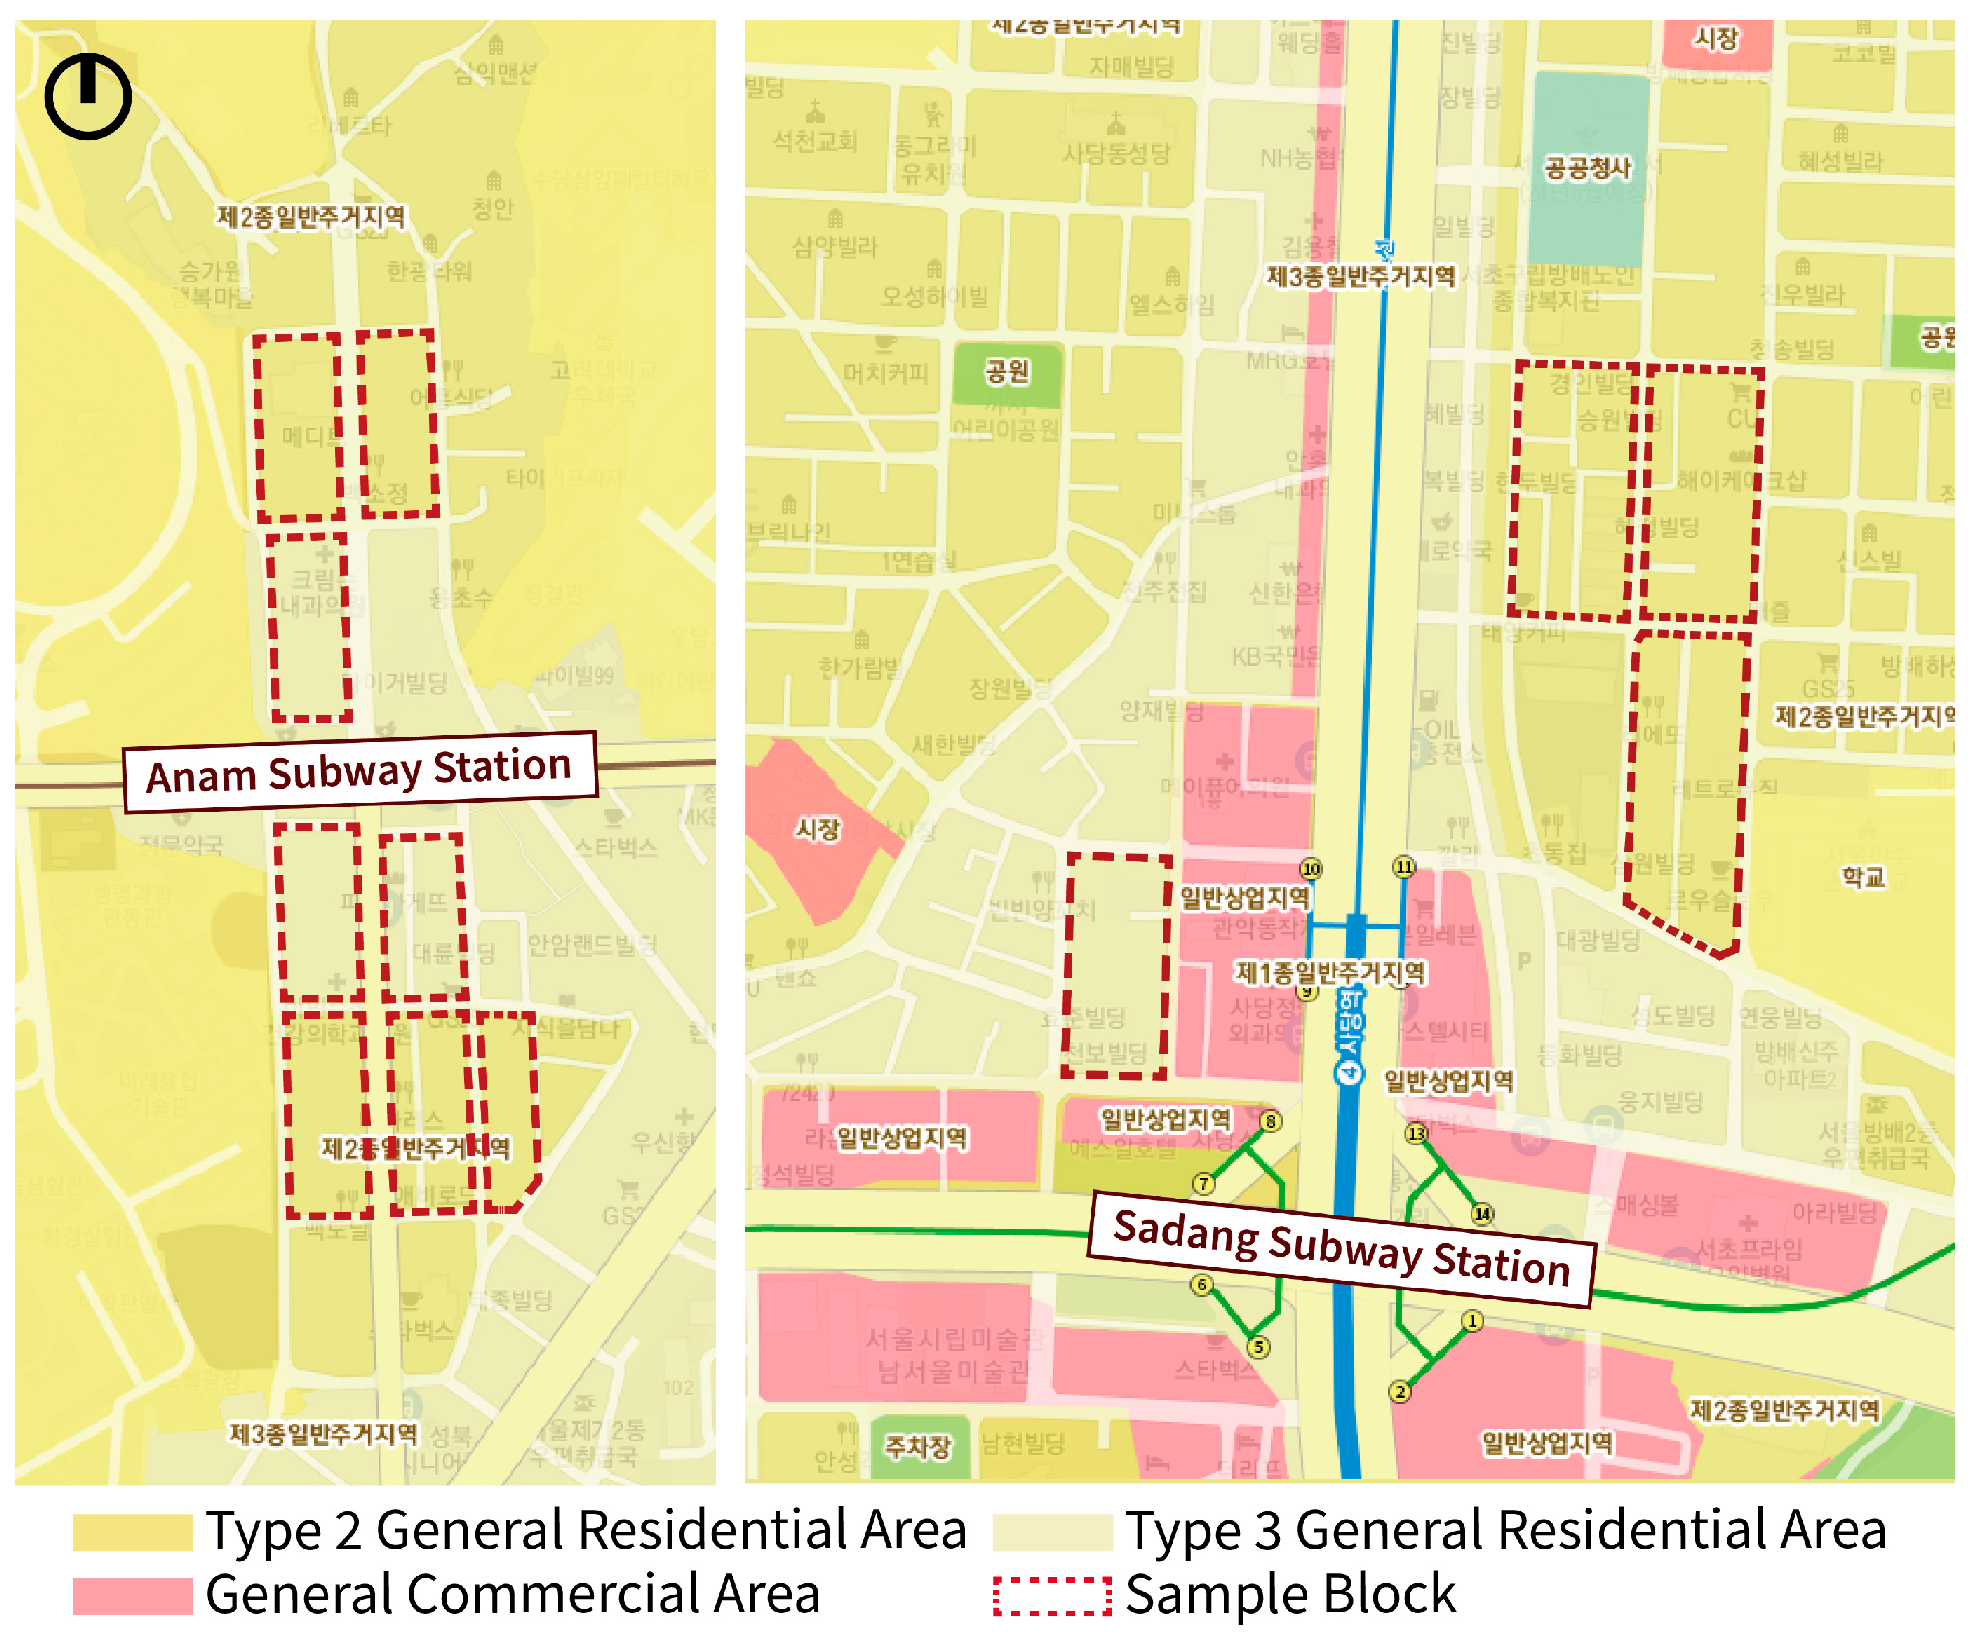
2.1. Research Scope and Data Preparation
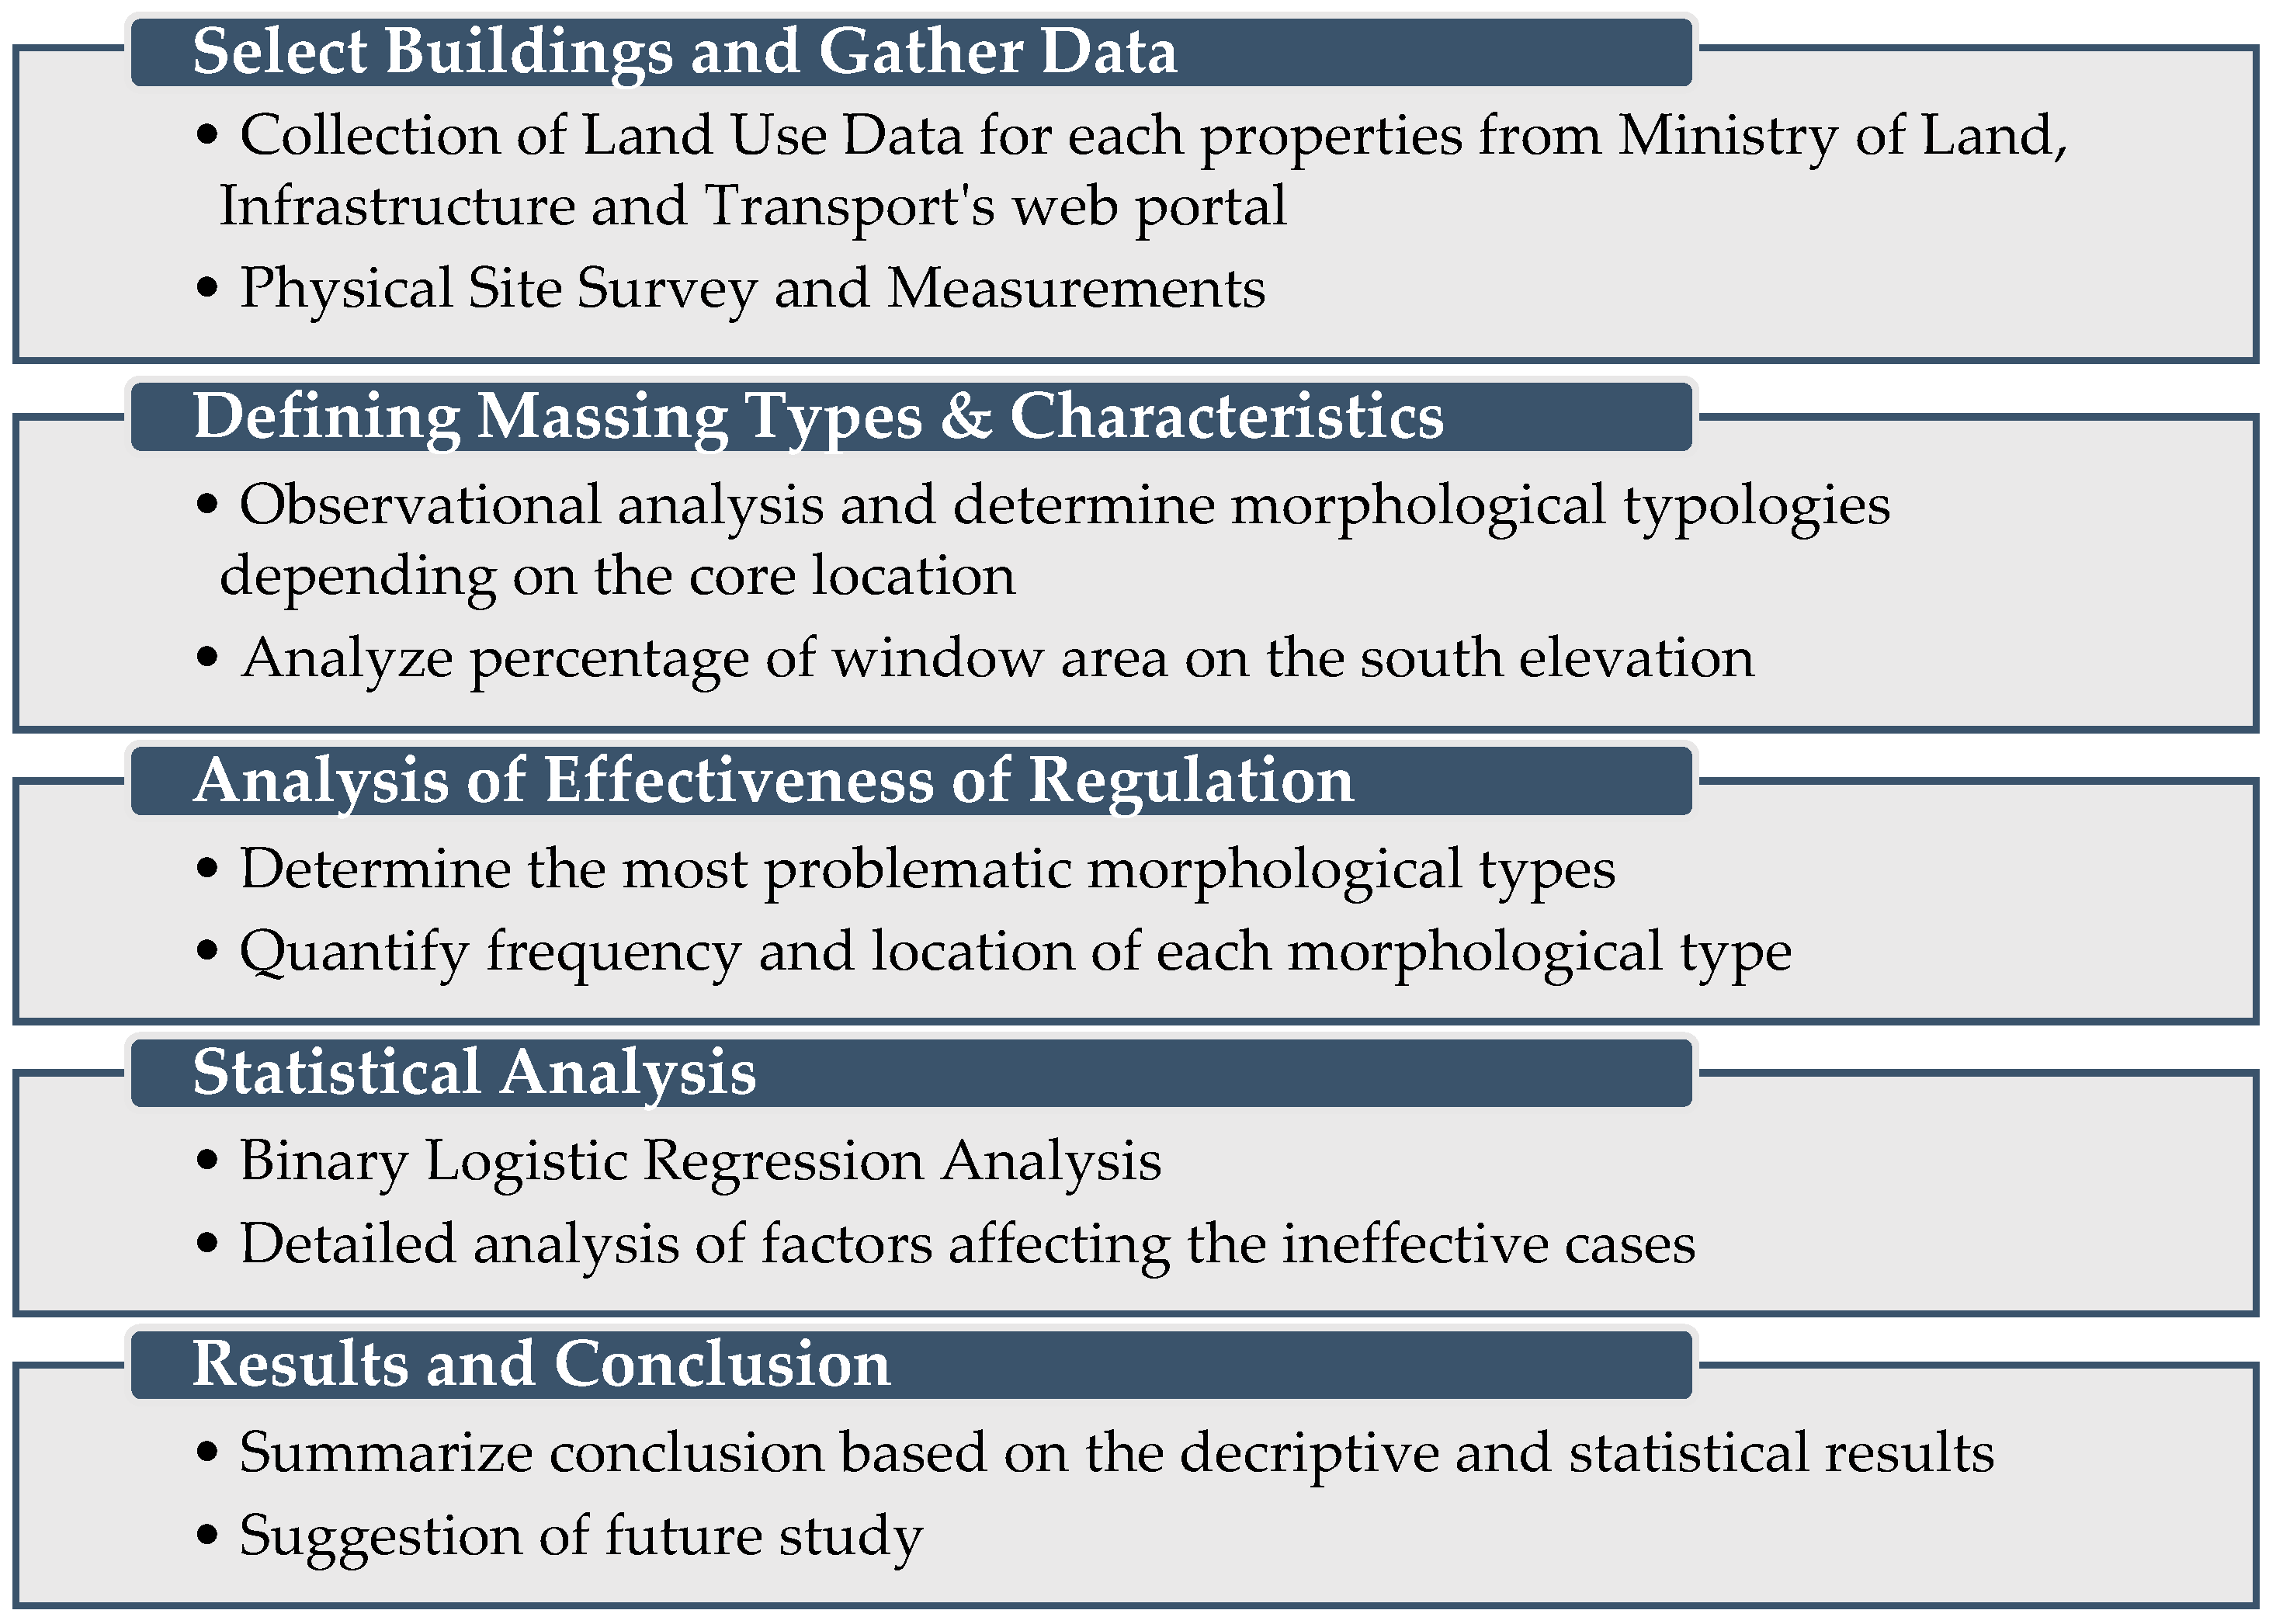
2.2. Methods and Process
2.3. Defining Massing Types and Variables
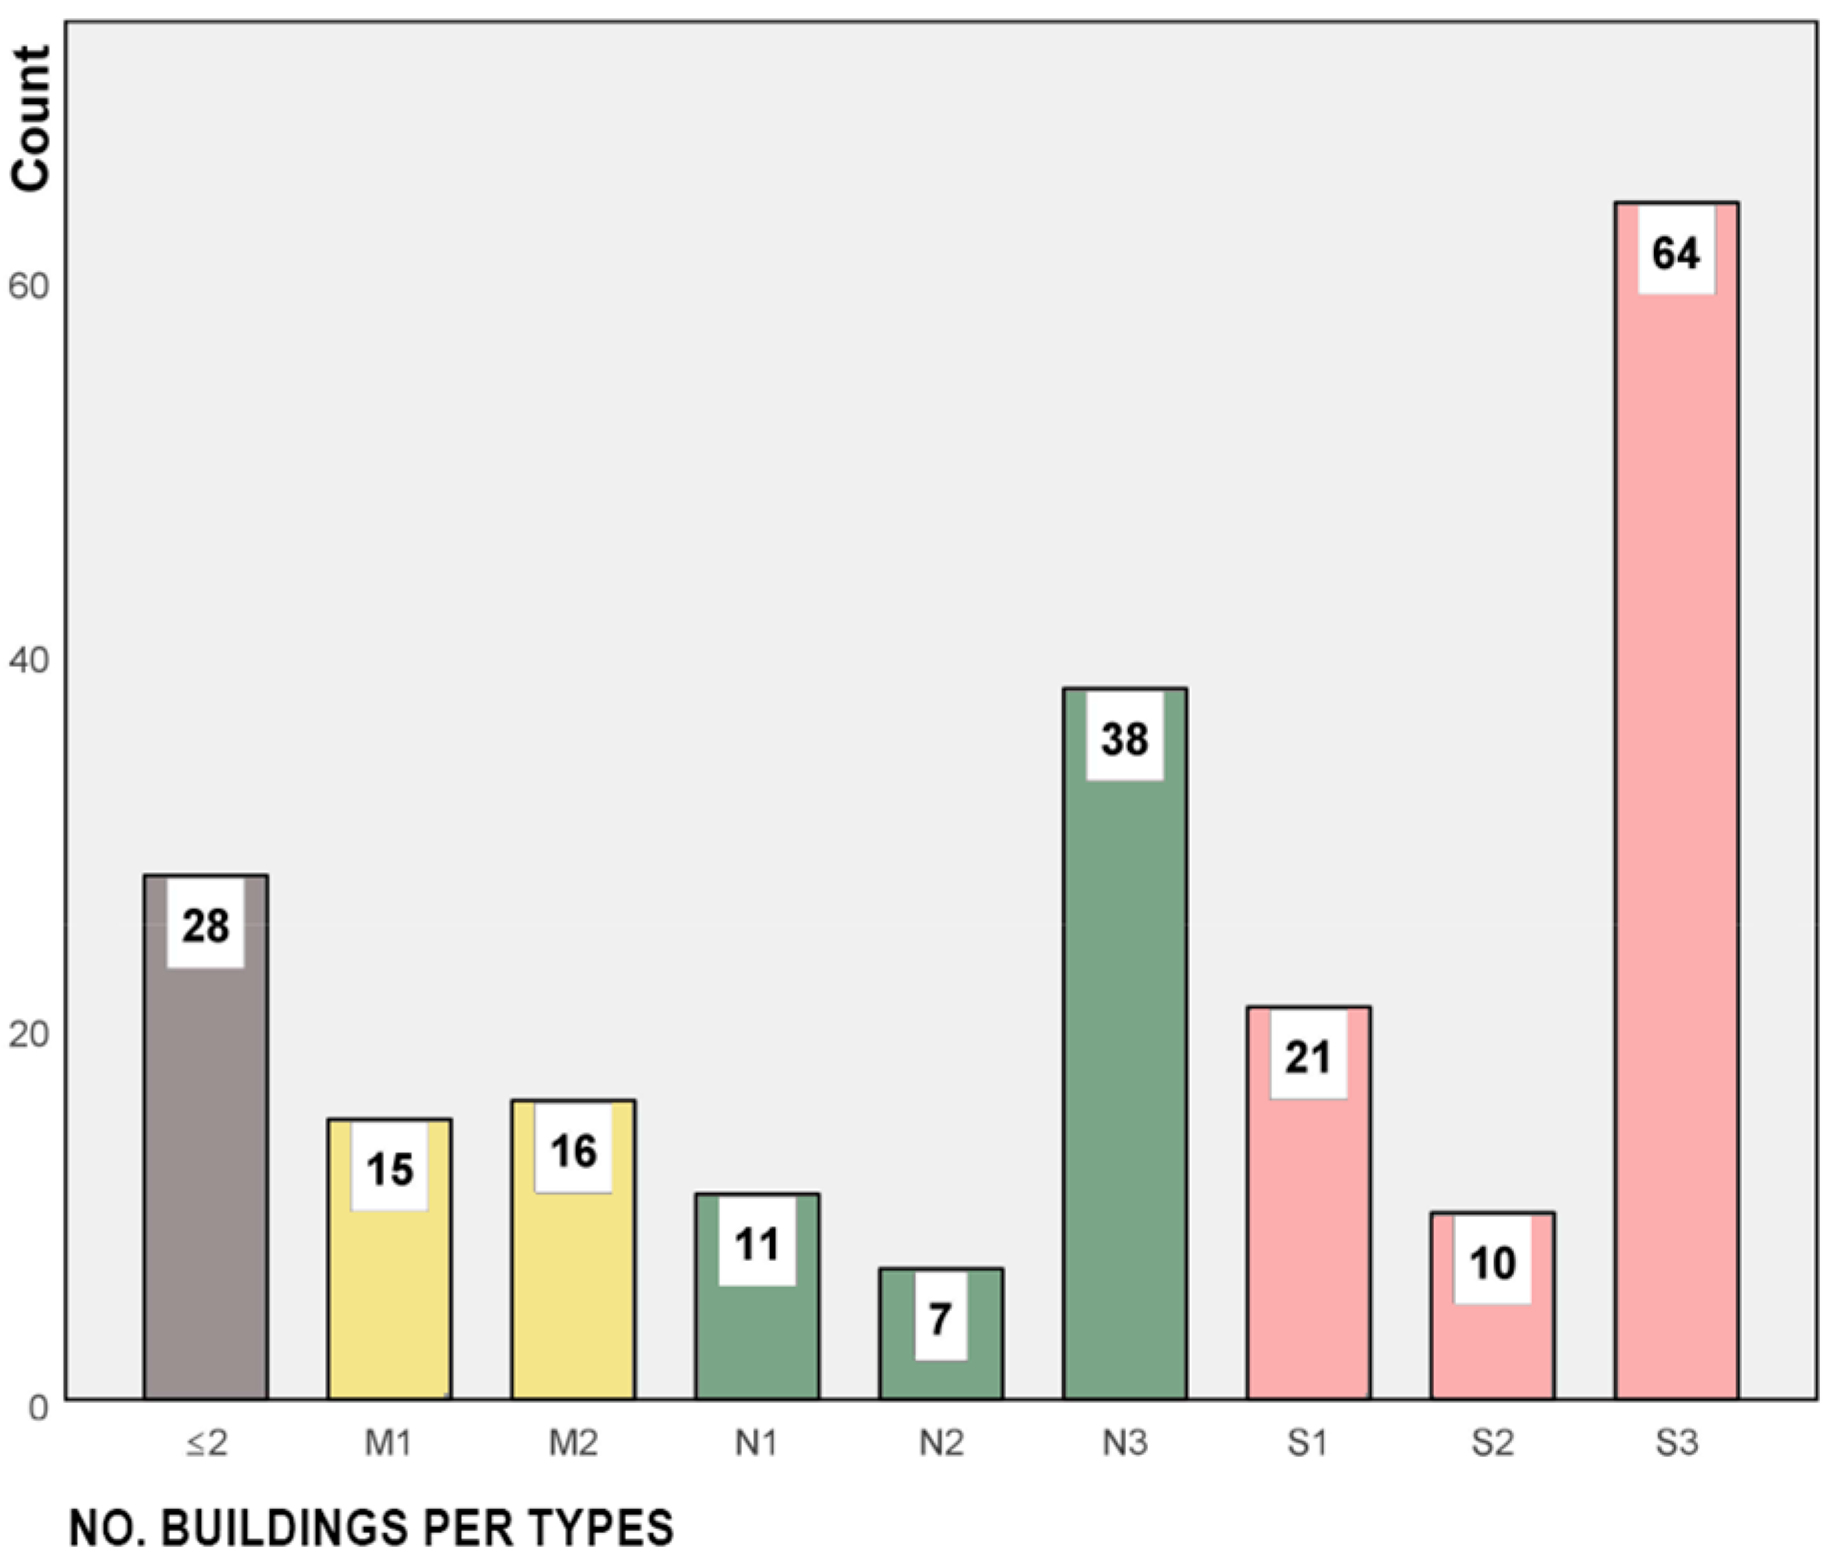
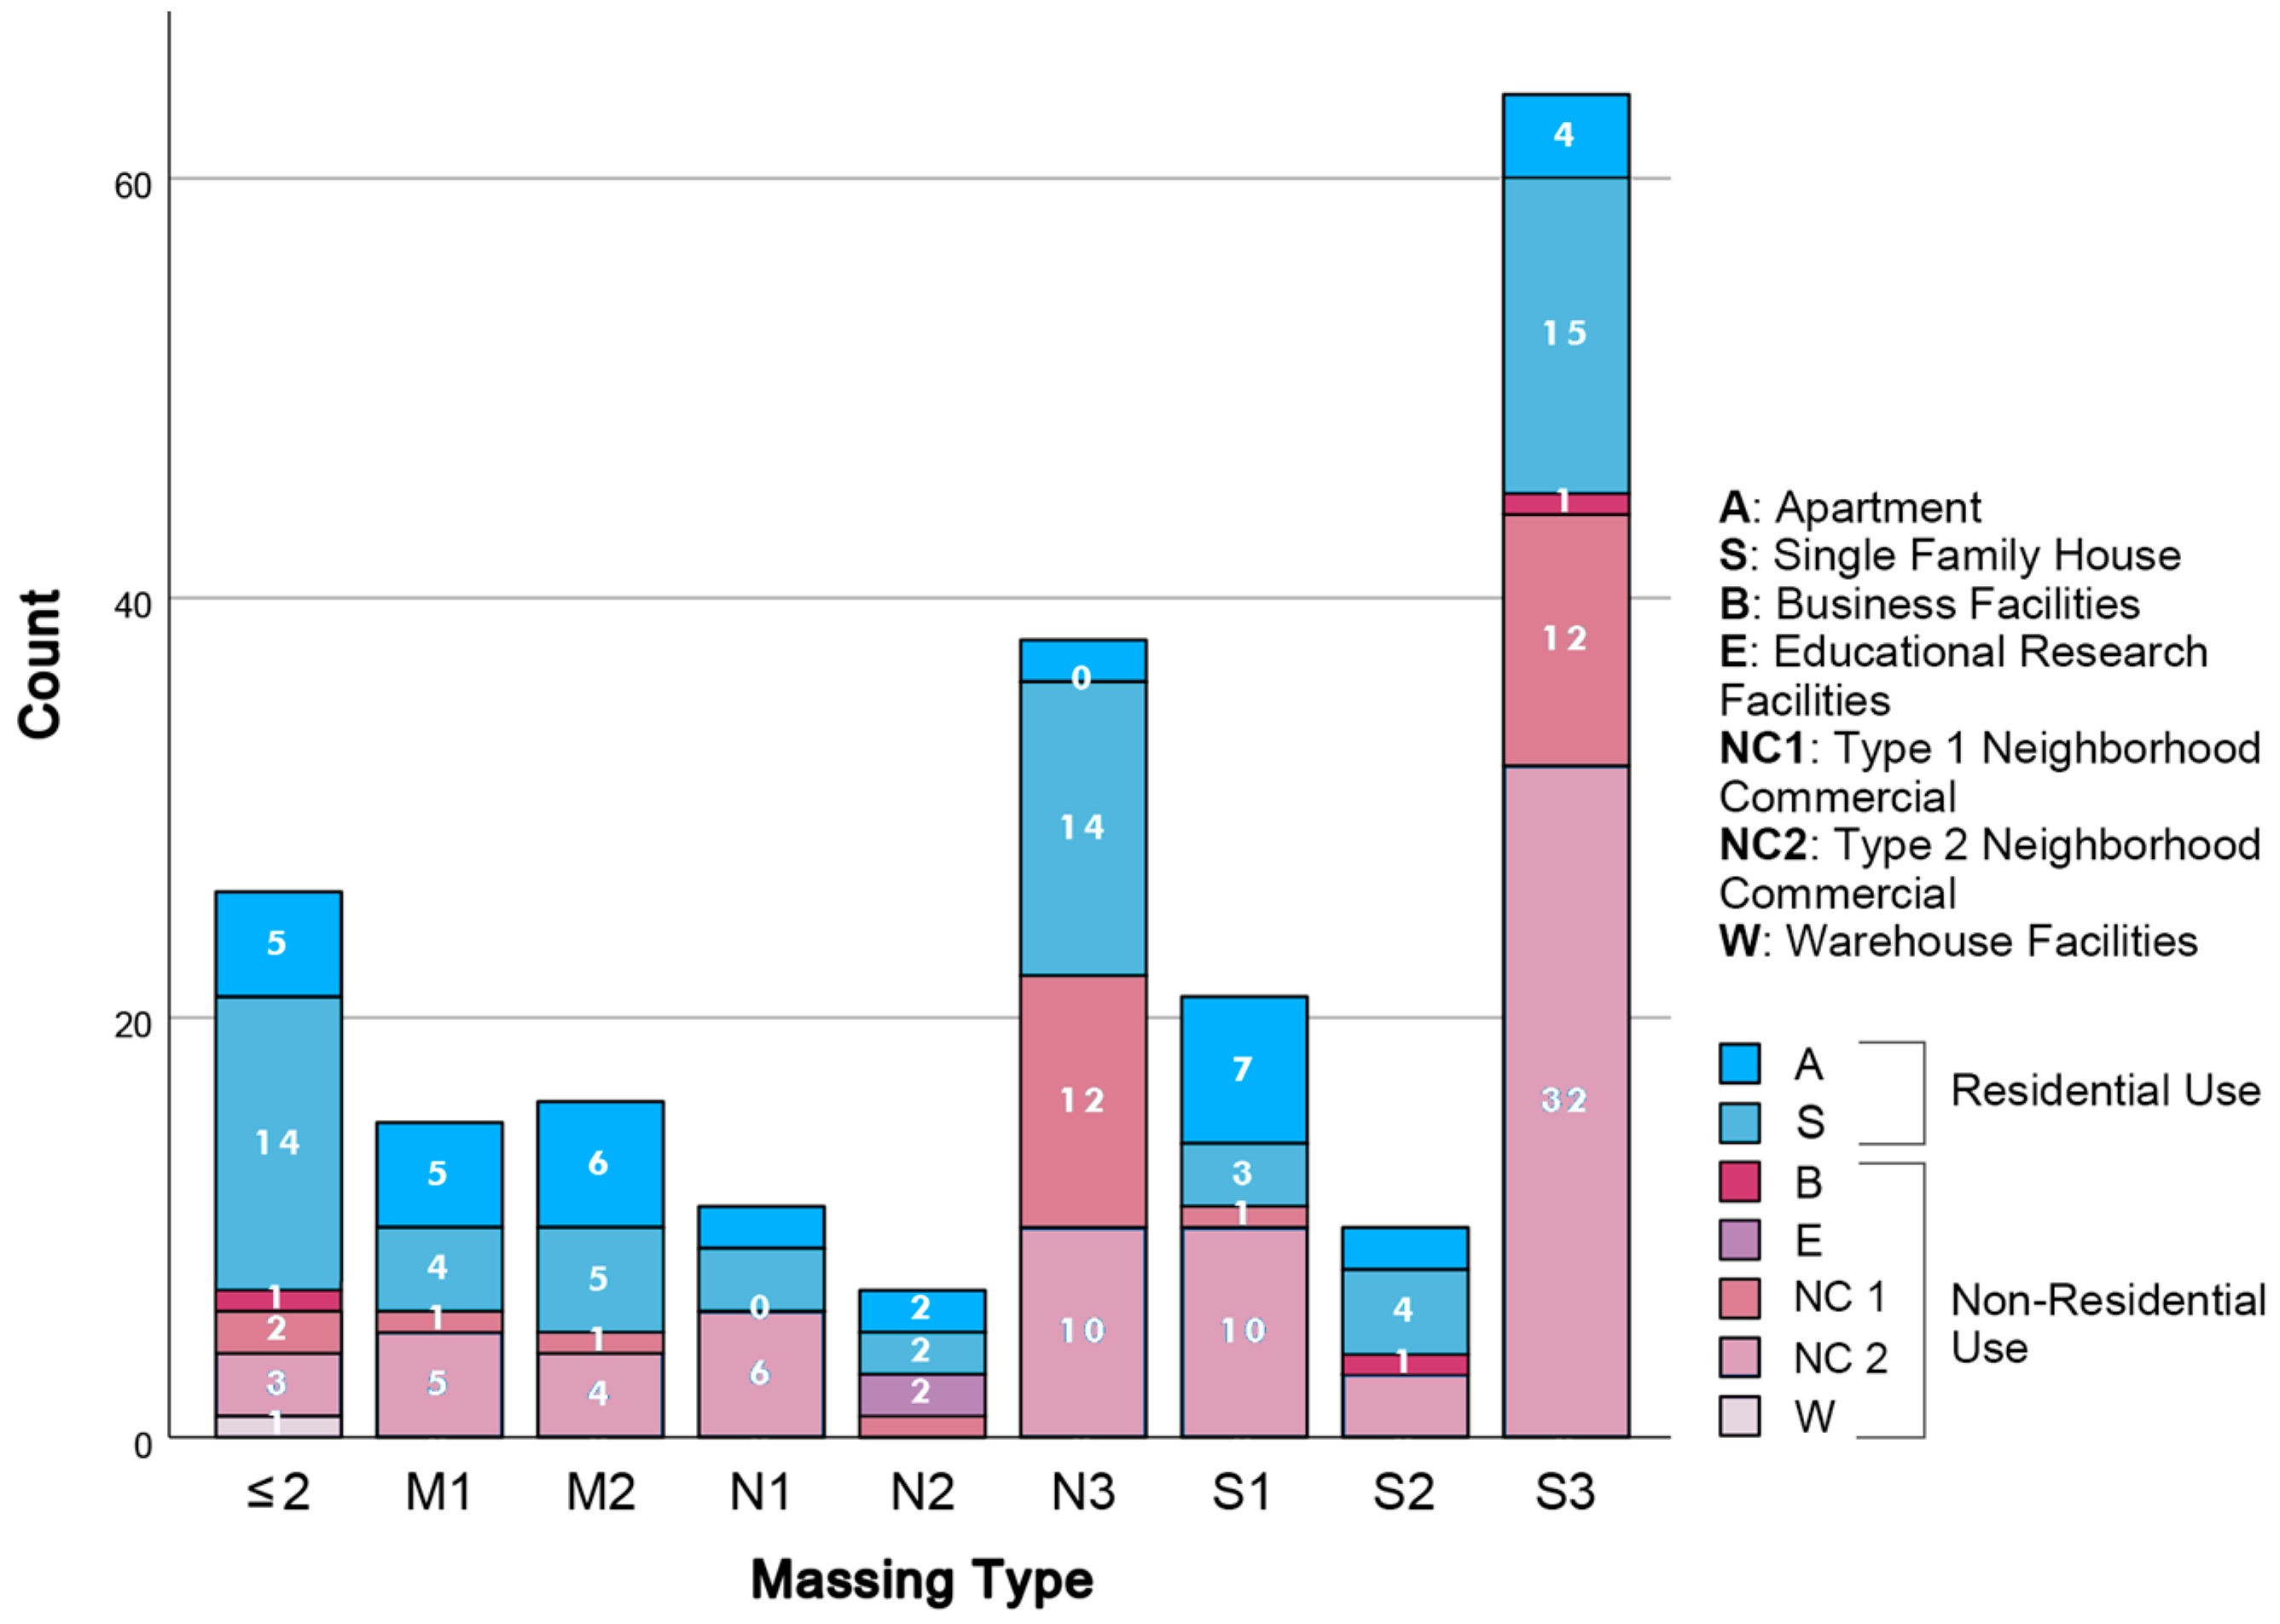
2.3.1. Massing Types
2.3.2. Primary Use
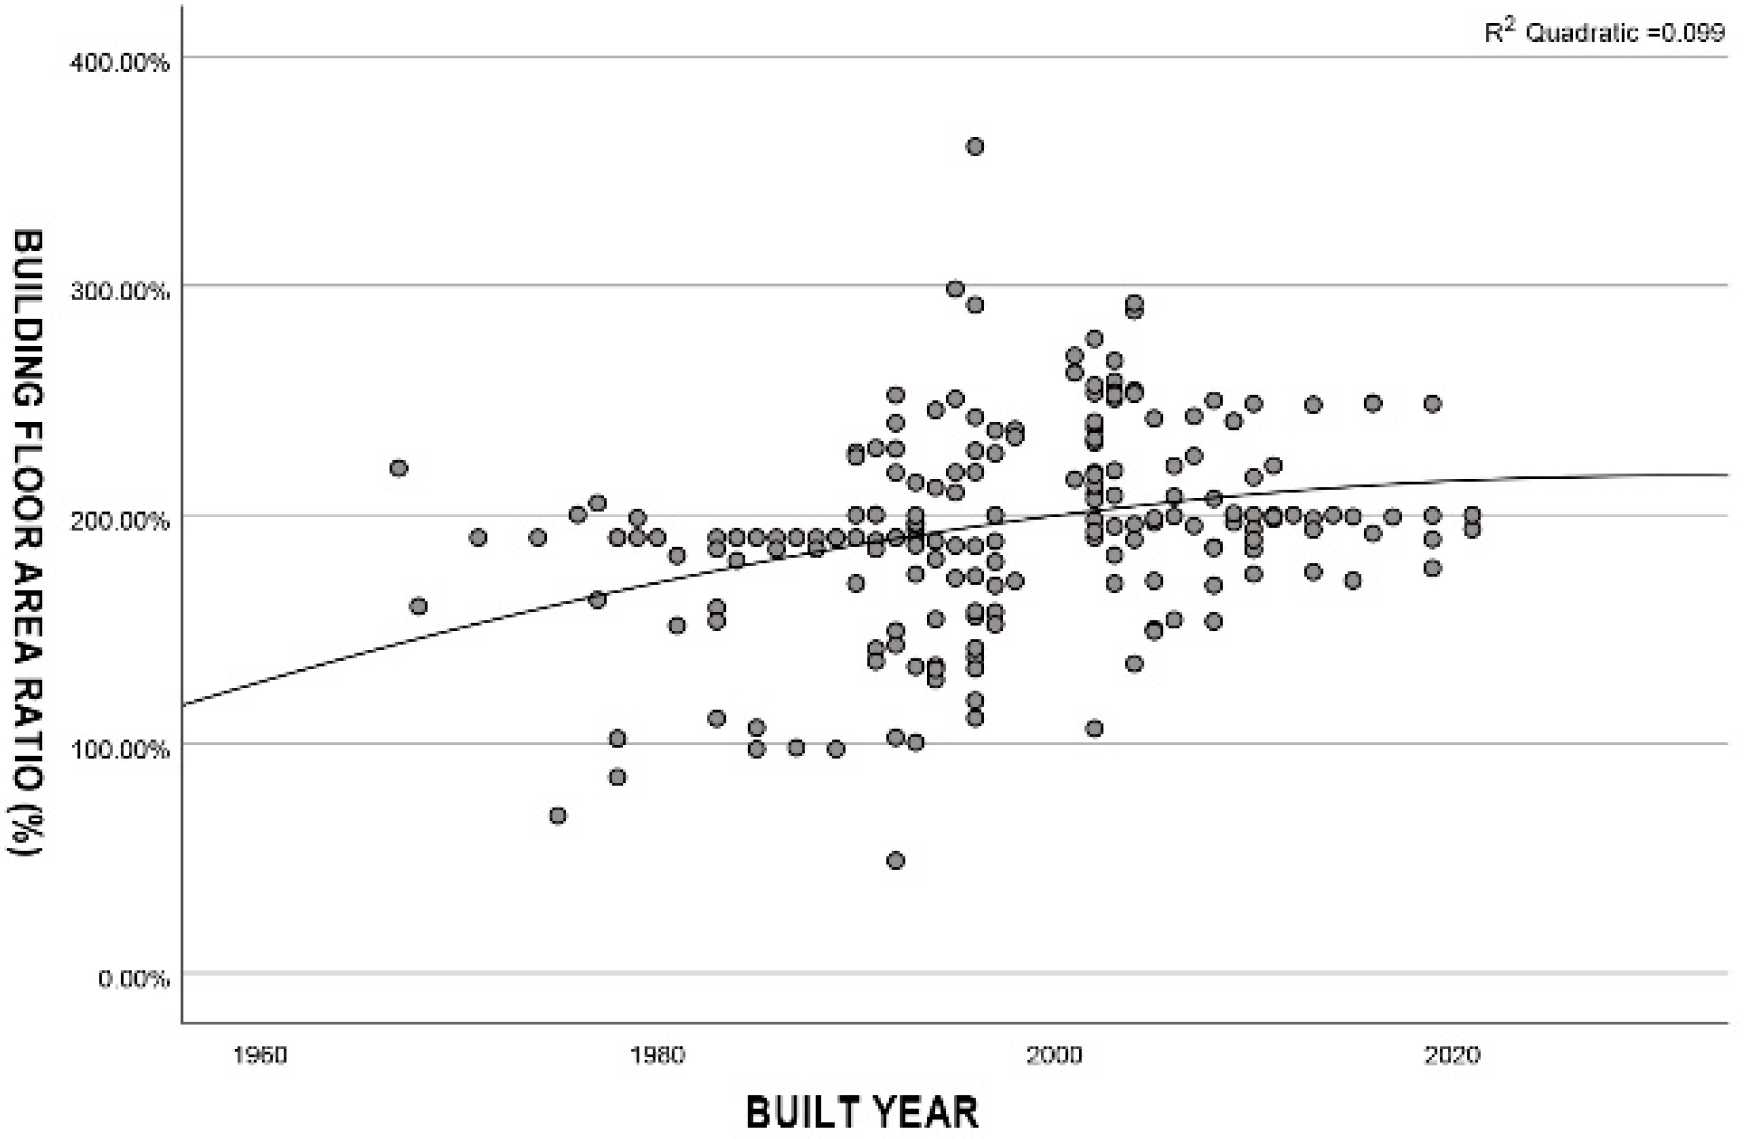
2.3.3. Building FAR
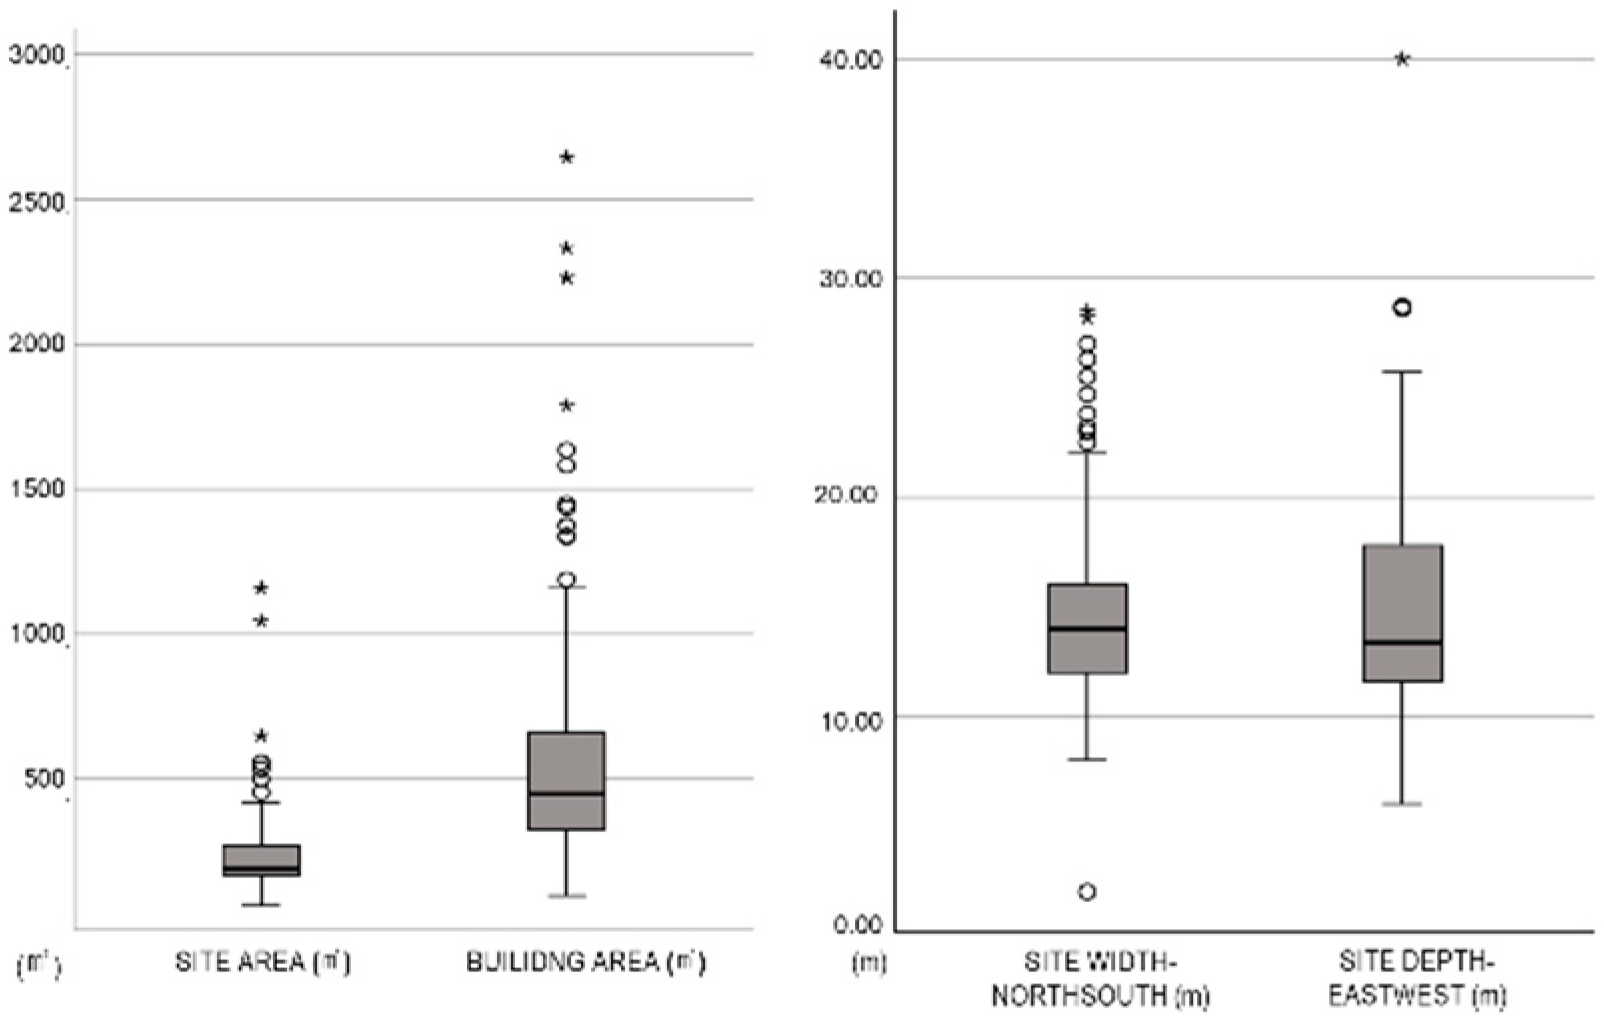
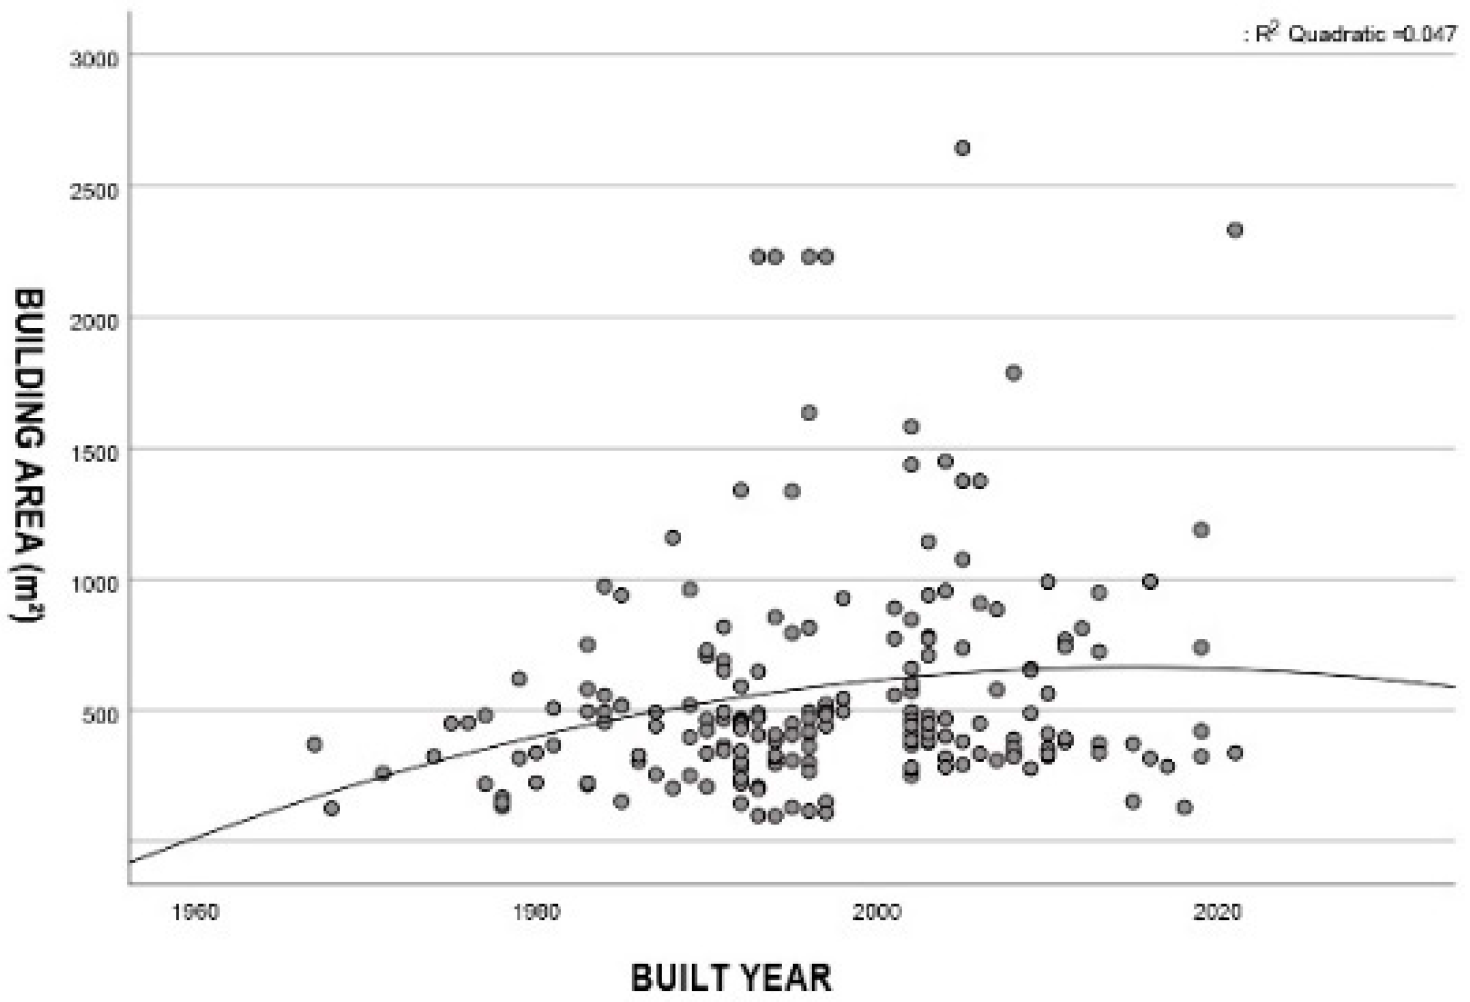
2.3.4. Building Areas
2.4. Analysis of Southern Elevations for Daylighting
2.5. Effectiveness of Regulation on Selected Buildings
3. Results
Binary Logistic Regression Analysis
4. Discussion
4.1. Built Year and Effectiveness of the Regulation
4.2. Primary Uses and Effectiveness of the Regulation
5. Conclusions
Author Contributions
Funding
Conflicts of Interest
References
- Rosin, P.; Adamatzky, A.; Sun, X. Cellular Automata in Image Processing and Geometry; Springer International Publishing AG: Cham, Switzerland, 2014. [Google Scholar]
- Leather, P.; Pyrgas, M.; Beale, D.; Lawrence, C. Windows in the Workplace: Sunlight, View, and Occupational Stress. Environ. Behav. 1998, 30, 739–762. [Google Scholar] [CrossRef]
- An, M.; Colarelli, S.M.; O’Brien, K.; Boyajian, M.E. Why We Need More Nature at Work: Effects of Natural Elements and Sunlight on Employee Mental Health and Work Attitudes. PLoS ONE 2016, 11, e0155614. [Google Scholar] [CrossRef] [PubMed] [Green Version]
- Holick, M.F. Biological Effects of Sunlight, Ultraviolet Radiation, Visible Light, Infrared Radiation and Vitamin D for Health. Anticancer Res. 2016, 36, 1345–1356. [Google Scholar] [PubMed]
- Weiss, M.A.; Ward, D.; Zunz, O. Density and Intervention: New York’s Planning Traditions. In The Landscape of Modernity: Essays on New York City, 1900–1940; JHU Press: Baltimore, MD, USA, 1992; pp. 46–75. [Google Scholar]
- Fischler, R. The Metropolitan Dimension of Early Zoning: Revisiting the 1916 New York City Ordinance. J. Am. Plan. Assoc. 1998, 64, 170–188. [Google Scholar] [CrossRef]
- Revell, K.D. Regulating the Landscape: Real Estate Values, City Planning, and the 1916 Zoning Ordinance. In The Landscape of Modernity: Essays on New York City, 1900–1940; JHU Press: Baltimore, MD, USA, 1997; pp. 19–45. [Google Scholar]
- Wang, H.; Tan, Z.B.; Liu, J. Research on Building Height Control of Greater London in England. Urban Plan. Int. 2018, 33, 109–116. [Google Scholar]
- Koga, Y.; Nakamura, H. Daylighting Codes, Standards and Policies Mainly in Japan. In Proceedings of the International Conference on Daylighting Technologies for Energy Efficiency in Building, Ottowa, ON, Canada, 10–13 May 1998; pp. 279–286. [Google Scholar]
- Bournas, I. Swedish Daylight Regulation throughout the 20th Century and Considerations Regarding Current Assessment Methods for Residential Spaces. Build. Environ. 2021, 191, 107594. [Google Scholar] [CrossRef]
- Julian, W. Daylighting Standards, Codes and Policies. In Proceedings of the International Daylighting Conference, Ottowa, ON, Canada, 11–13 May 1998. [Google Scholar]
- Daylight in Buildings: A Source Book on Daylighting Systems and Components | Facades. Available online: https://facades.lbl.gov/daylight-buildings-source-book-daylighting-systems (accessed on 4 November 2022).
- Kunkel, S.; Kontonasiou, E. Indoor Air Quality, Thermal Comfort and Daylight Policies on the Way to NZEB—Status of Selected MS and Future Policy Recommendations. In Proceedings of the ECEEE Summer Study, First Fuel Now, Belambra Les Criques, Toulon, France, 1–6 June 2015. [Google Scholar]
- Saratsis, E.; Dogan, T.; Reinhart, C.F. Simulation-Based Daylighting Analysis Procedure for Developing Urban Zoning Rules. Build. Res. Inf. 2017, 45, 478–491. [Google Scholar] [CrossRef]
- Elliott, D.L.; Goebel, M.; Meadows, C.B. The Rules That Shape Urban Form, 1st ed.; Routledge: Chicago, IL, USA, 2013; ISBN 978-1-61190-009-5. [Google Scholar]
- Kwartler, M.; Masters, R. Daylight as a Zoning Device for Midtown. Energy Build. 1984, 6, 173–189. [Google Scholar] [CrossRef]
- Sorensen, A.; Okata, J.; Fujii, S. Urban Renaissance as Intensification: Building Regulation and the Rescaling of Place Governance in Tokyo’s High-Rise Manshon Boom. Urban Stud. 2010, 47, 556–583. [Google Scholar] [CrossRef]
- Šprah, N.; Košir, M. Daylight Provision Requirements According to EN 17037 as a Restriction for Sustainable Urban Planning of Residential Developments. Sustainability 2020, 12, 315. [Google Scholar] [CrossRef] [Green Version]
- Kim, D.N.; Lim, H.J. A Study on the Architectural Form of the Height Control Methods. J. Archit. Inst. Korea Plan. Des. 2004, 20, 146–156. [Google Scholar]
- Lee, M.Y.; Kim, S.; Lee, J. A Study on the Effects of the Diagonal Plane Control on the Physical Elements of the Buildings in the General Commercial Zone. Available online: http://scienceon.kisti.re.kr/srch/selectPORSrchArticle.do?cn=DIKO0014185021 (accessed on 4 November 2022).
- Lee, J.B. A Study on the Analysis of the Effects and Supplementary Method of the Revised Architectural Slant Line Restriction for Daylight. J. Archit. Inst. Korea Plan. Des. 2013, 29, 233–242. [Google Scholar]
- Moon, S.; Eo, I.J.; Chea, W.Y.; Lee, W.G.; Kim, Y.H. A study on the oblique line limitation provisions in Residential Area. J. Archit. Inst. Korea Plan. Des. 2003, 19, 95–102. [Google Scholar]
- Ander, G.D. Daylighting Performance and Design; John Wiley & Sons: Hoboken, NJ, USA, 2003. [Google Scholar]
- Boubekri, M. Daylighting, Architecture and Health; Routledge: London, UK, 2008; ISBN 978-0-08-094071-7. [Google Scholar]
- Bertaud, A.; Brueckner, J.K. Analyzing Building-Height Restrictions: Predicted Impacts and Welfare Costs. Reg. Sci. Urban Econ. 2005, 35, 109–125. [Google Scholar] [CrossRef]
- Kim, D.N.; Jeong, J.Y.; Jeong, S.H.; Lim, H.J.; Lee, B.H. Height Management of Major Cities in the World; Urban Design Research Center: Seoul, Republic of Korea, 2001; pp. 96–97. [Google Scholar]
- Batty, M. Inventing Future Cities; MIT Press: Cambridge, MA, USA, 2018. [Google Scholar]
- NYC Planning 81-272 | Zoning Resolution. Available online: https://zr.planning.nyc.gov/article-viii/chapter-1/81-272 (accessed on 4 November 2022).
- National Legal Information Center, Korea Building Code, Article 60. Available online: https://www.law.go.kr/LSW/lsInfoP.do?efYd=20220420&lsiSeq=236303#0000 (accessed on 4 November 2022).
- Park, I.S. Effect and Issues of Abolishing Diagonal Plane Restriction from Roadside, Issues and Discussions; Land, Transport & Maritime Affairs. Issues and Perspective; National Assembly Research Service: Seoul, Republic of Korea, 2015. [Google Scholar]
- What Is the Height Standard by Street Area? Available online: https://news.seoul.go.kr/citybuild/archives/1551 (accessed on 4 November 2022).
- Lee, J.A.; Chang, Y.B. Effect of Building-Height, Regulations on the Physical Environment of the Street-Block. Korea Plan. Assoc. 2006, 41, 119–132. [Google Scholar]
- National Legal Information Center, Enforcement Ordinance of Korea Building Code, Article 86. Available online: https://www.law.go.kr/LSW/lsInfoP.do?efYd=20220804&lsiSeq=244003#0000 (accessed on 4 November 2022).
- Li, D.H.W.; Wong, S.L.; Tsang, C.L.; Cheung, G.H.W. A Study of the Daylighting Performance and Energy Use in Heavily Obstructed Residential Buildings via Computer Simulation Techniques. Energy Build. 2006, 38, 1343–1348. [Google Scholar] [CrossRef]
- Wang, L.; Gwilliam, J.; Jones, P. Case Study of Zero Energy House Design in UK. Energy Build. 2009, 41, 1215–1222. [Google Scholar] [CrossRef]
- Movilla Vega, D. 99 Years of the Housing Question in Sweden; Studentlitteratur AB: Lund, Sweden, 2017. [Google Scholar]
- Liu, E.; Wu, J. Housing Standards of Domestic Buildings in Hong Kong; Research and Library Services Division, Legislative Council Secretariat: Hong Kong, China, 1999. [Google Scholar]
- National Legal Information Center, Korea Building Code, Article 17, Section. 1. Rules on Standards for Evacuation and Fire Protection Structures for Buildings. Available online: https://www.law.go.kr/LSW/lsInfoP.do?efYd=20220420&lsiSeq=236303#0000 (accessed on 4 November 2022).
- Choi, S.C. Urban Planning. Available online: http://encykorea.aks.ac.kr/Contents/Item/E0015744 (accessed on 1 November 2022).
- Kim, J.; Potter, C.; Cho, A. Flexible Zoning and Mixed Use in Seoul, Korea Planning Implications of Seoul’s Zoning Model. Archit. Res. 2020, 22, 145–154. [Google Scholar]
- Lim, Y.K.; Ahn, K.H.; Lim, K.R. Understanding Regulatory Impacts on the Street Environments of Residential Zone, through a Typo-Morphological Approach-With Case Study on the Bangi-Dong Area Formed by Land Readjstment Project. J. Urban Des. Inst. Korea 2014, 15, 67–87. [Google Scholar]
- Landau, S.; Everitt, B.S. A Handbook of Statistical Analyses Using SPSS; Chapman and Hall/CRC: New York, NY, USA, 2003; ISBN 978-0-203-00976-5. [Google Scholar]
- Garson, G.D. Logistic Regression: Binary and Multinomial; Statistical Associates Publishing: Asheboro, NC, USA, 2014. [Google Scholar]
- National Legal Information Center, Korea Building Code, Article 17, Rules for the Entry and Management of the Building Registration 5; Section. 1. Available online: https://www.law.go.kr/LSW/lsInfoP.do?efYd=20220420&lsiSeq=236303#0000 (accessed on 4 November 2022).
- Cho, W.; Kim, M.; Kim, H.; Kwon, Y. Transforming Housing to Commercial Use: A Case Study on Commercial Gentrification in Yeon-Nam District, Seoul. Sustainability 2020, 12, 4322. [Google Scholar] [CrossRef]
- Yoon, Y.; Park, J. Stage Classification and Characteristics Analysis of Commercial Gentrification in Seoul. Sustainability 2018, 10, 2440. [Google Scholar] [CrossRef] [Green Version]
- Shim, J.H.; Lee, W.G.; Lee, J.K. A Study on the Building Use Code and Use Change. J. Korean Digit. Archit. Inter. Assoc. 2003, 3, 39–46. [Google Scholar]
- Lee, S.O.; Hwang, E.K. Improvement for Classification System of Building Use on Neighborhood Living Facility. J. Archit. Hist. 2012, 21, 53–62. [Google Scholar] [CrossRef]


| Variable Type | Data Source |
|---|---|
| Massing Arrangement; Site Depth-D(m); Site Width-W(m); Window-Wall Ratio | Site Visit and Physical Survey; https://map.naver.com (accessed on 2 September 2022) https://www.landbook.net (accessed on 2 September 2022) https://www.valueupmap.com/ (accessed on 2 September 2022) https://smap.seoul.go.kr/ (accessed on 2 September 2022) |
| Primary Use; Building FAR (%); Building Coverage Ratio (%); Built Year; No. of Floors | http://www.eum.go.kr/web/am/amMain.jsp (accessed on 2 September 2022) |
| Type | Plan Arrangement | Massing Types | Primary Use | Building FAR | Building Coverage Ratio | Built Year | Building Area | Site Depth (D) | Site Width (W) | |
|---|---|---|---|---|---|---|---|---|---|---|
| S1 | 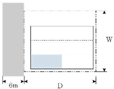 |  | - | R: 47.6% B: 0.0% NC1: 4.8% NC2: 47.6% | 155.54%~ 276.8% (Mean: 208.8%) | 45.85%~ 59.98% (Mean: 56.2%) | 1979~ 2021 | 319 m2~ 1582 m2 (Mean: 599 m2) | 10.5 m~ 22.4 m (Mean: 14.5 m) | 10.7 m~ 20.3 m (Mean: 14.4 m) |
| S2 | 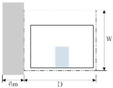 |  |  | R: 60.0% B: 10.0% NC1: 0.0% NC2: 30.0% | 135%~ 245.7% (Mean: 190%) | 49.8%~ 59.93% (Mean: 56.7%) | 1985~ 2015 | 97 m2~ 938 m2 (Mean: 390 m2) | 9.6 m~ 15.9 m (Mean: 13.3 m) | 11.7 m~ 23.9 m (Mean: 13.3 m) |
| S3 | 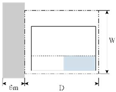 |  |  | R: 29.7% B: 1.6% NC1: 18.8% NC2: 50.0% | 127.97%~ 292.39% (Mean: 205%) | 45.03%~ 63.25% (Mean: 55.9%) | 1980~ 2019 | 144 m2~ 2230 m2 (Mean: 625 m2) | 9.9 m~ 22.6 m (Mean: 15.4 m) | 8.6 m~ 21.7 m (Mean: 14.2 m) |
| M1 |  |  | - | R: 60.0% B: 0.0% NC1: 6.7% NC2: 33.3% | 137.85%~ 258.21% (Mean: 193%) | 40.2%~ 59.94% (Mean: 56%) | 1987~ 2021 | 292 m2~ 2332 m2 (Mean: 678.5 m2) | 11.3 m~ 22.7 m (Mean: 14.2) | 9.4 m~ 20 m (Mean: 17 m) |
| M2 |  |  |  | R: 68.8% B: 0.0% NC1: 6.3% NC2: 25.0% | 125.19%~ 288.96% (Mean: 202%) | 45.88%~ 59.96% (Mean: 56%) | 1974~ 2019 | 250 m2~ 2230 m2 (Mean: 613.9 m2) | 10.1 m~ 23.4 m (Mean: 12.5 m) | 9.3 m~ 25.5 m (Mean: 15.8 m) |
| N1 |  |  | - | R: 45.5% B: 0.0% NC1: 0.0% NC2: 54.5% | 97.67%~ 242.53% (Mean: 180%) | 49.46%~ 59.87% (Mean: 56%) | 1968~ 2018 | 128 m2~ 960 m2 (Mean: 575.2 m2) | 9.6 m~ 28.7 m (Mean: 17.7 m) | 2 m~ 28.2 m (Mean: 13.3 m) |
| N2 | 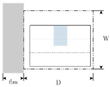 |  |  | R: 57.1% B: 28.6% NC1: 14.3% NC2: 0.0% | 132.5%~ 269.35% (Mean: 210%) | 57.69%~ 59.81% (Mean: 59%) | 1986~ 2003 | 303 m2~ 889 m2 (Mean: 528.6 m2) | 13.4 m~ 16.7 m (Mean: 15 m) | 10.5 m~ 18.3 m (Mean: 14 m) |
| N3 | 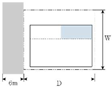 |  |  | R: 42.1% B: 0.0% NC1: 31.6% NC2: 26.3% | 49%~ 298.56% (Mean: 201.43%) | 39.37%~ 143.6% (Mean: 205%) | 1967~ 2017 | 98 m2~ 2230 m2 (Mean: 510.8 m2) | 9.1 m~ 19.5 m (Mean: 13.4 m) | 8.7 m~ 20.8 m (Mean: 14.3 m) |
| EX | 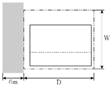 |  | - | R: 73.1% B: 7.7% NC1: 7.7% NC2: 11.5% | 68.66%~ 205% (Mean: 157%) | 43.07%~ 57.04% (Mean: 56%) | 1968~ 1989 | 115 m2~ 2644 m2 (Mean: 479.4 m2) | 8.9 m~ 23.4 m (Mean: 14.5 m) | 10.3 m~ 24.5 m (Mean: 14.6 m) |
| Type 1 | Type 2 | Type 3 | Type 4 | ||||
|---|---|---|---|---|---|---|---|
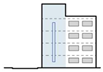 |  |  |  |  | 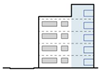 | 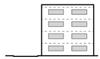 |  |
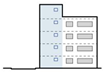 | 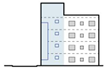 | 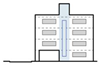 |  | 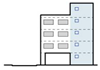 | 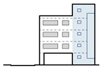 |  |  |
| Massing type: S1 | Massing type: S2 | Massing type: S3 | Massing type: M/N | ||||
| Core Exterior Glazing Ratio: 1.6%~39.2% | Core Exterior Glazing Ratio: 1.5%~9.6% | Core Exterior Glazing Ratio: 3.2%~23.3% | Core Exterior Glazing Ratio: 0% | ||||
| Habitable Space Gazing Ratio: 6.5%~27.8% | Habitable Space Gazing Ratio: 16%~43.7% | Habitable Space Gazing Ratio: 12.3%~29.3% | Habitable Space Gazing Ratio: 42.3~66.4% | ||||
| Variables in Equation S1S3 or NOT | ||||||
|---|---|---|---|---|---|---|
| B (Coefficients) | Wald | df | p-Value (Sig.) | Odds Ratio: Exp(B) | ||
| Step 1a | Built Year | −0.067 | 10.013 | 1 | 0.002 *** | 0.935 |
| Main Program: Residential vs. Non-residential | −0.392 | 5.446 | 1 | 0.020 ** | 0.676 | |
| Site Area | 0.004 | 1.286 | 1 | 0.257 | 1.004 | |
| Building Coverage Ratio (%) | 0.002 | 0.013 | 1 | 0.908 | 1.002 | |
| Site Width-North South Direction | 0.082 | 1.533 | 1 | 0.216 | 1.086 | |
| Site Depth-West East Direction | −0.043 | 0.458 | 1 | 0.499 | 0.958 | |
| Building Area | 0.006 | 1.389 | 1 | 0.239 | 1.006 | |
| Building FAR | −0.003 | 0.380 | 1 | 0.538 | 0.997 | |
| Residential Use | 0.092 | 0.984 | 1 | 0.321 | 1.097 | |
| Non-residential Use | 0.078 | 0.688 | 1 | 0.407 | 1.081 | |
| No. of Floors | −0.112 | 0.294 | 1 | 0.588 | 0.894 | |
| Variables in Equation S or NOT | ||||||
|---|---|---|---|---|---|---|
| B (Coefficients) | Wald | df | p-Value (Sig.) | Odds Ratio: Exp(B) | ||
| Step 1a | Built Year | −0.056 | 7.363 | 1 | 0.007 *** | 0.945 |
| Main Program: Residential vs. Non-residential | −0.498 | 8.138 | 1 | 0.004 *** | 0.608 | |
| Site Area | 0.004 | 1.698 | 1 | 0.193 | 1.004 | |
| Building Coverage Ratio (%) | 0.000 | 0.000 | 1 | 0.982 | 1.000 | |
| Site Width-North South Direction | 0.090 | 1.889 | 1 | 0.169 | 1.094 | |
| Site Depth-West East Direction | −0.102 | 2.890 | 1 | 0.089 | 0.903 | |
| Building Area | 0.007 | 1.683 | 1 | 0.195 | 1.007 | |
| Building FAR | 0.000 | 0.006 | 1 | 0.936 | 1.000 | |
| Residential Use | 0.129 | 1.273 | 1 | 0.259 | 1.138 | |
| Non-residential Use | 0.128 | 1.227 | 1 | 0.268 | 1.136 | |
| No. of Floors | −0.240 | 1.383 | 1 | 0.240 | 0.787 | |
| Variables in Equation M or NOT | ||||||
|---|---|---|---|---|---|---|
| B (Coefficients) | Wald | df | p-Value (Sig.) | Odds Ratio: Exp(B) | ||
| Step 1a | Built Year | −0.048 | 2.437 | 1 | 0.118 | 0.953 |
| Main Program: Residential vs. Non-residential | 0.066 | 0.065 | 1 | 0.799 | 1.068 | |
| Site Area | 0.000 | 0.003 | 1 | 0.954 | 1.000 | |
| Building Coverage Ratio (%) | 0.030 | 0.337 | 1 | 0.561 | 1.030 | |
| Site Width-North South Direction | −0.266 | 9.300 | 1 | 0.002 *** | 0.766 | |
| Site Depth-West East Direction | 0.154 | 3.273 | 1 | 0.070 | 1.166 | |
| Building Area | −0.018 | 0.944 | 1 | 0.331 | 0.982 | |
| Building FAR | −0.001 | 0.029 | 1 | 0.866 | 0.999 | |
| Residential Use | −0.349 | 0.677 | 1 | 0.411 | 0.705 | |
| Non-residential Use | −0.326 | 0.594 | 1 | 0.441 | 0.722 | |
| No. of Floors | 0.093 | 0.098 | 1 | 0.755 | 1.098 | |
| Variables in Equation N or NOT | ||||||
|---|---|---|---|---|---|---|
| B (Coefficients) | Wald | df | p-Value (Sig.) | Odds Ratio: Exp(B) | ||
| Step 1a | Built Year | 0.097 | 16.344 | 1 | 0.000 *** | 1.102 |
| Main Program: Residential vs. Non-residential | 0.411 | 4.966 | 1 | 0.026 *** | 1.508 | |
| Site Area | −0.001 | 0.127 | 1 | 0.722 | 0.999 | |
| Building Coverage Ratio (%) | −0.009 | 0.178 | 1 | 0.673 | 0.991 | |
| Site Width-North South Direction | 0.108 | 2.523 | 1 | 0.112 | 1.114 | |
| Site Depth-West East Direction | 0.010 | 0.031 | 1 | 0.860 | 1.010 | |
| Building Area | 0.001 | 0.040 | 1 | 0.841 | 1.001 | |
| Building FAR | 0.004 | 0.511 | 1 | 0.475 | 1.004 | |
| Residential Use | 0.024 | 0.035 | 1 | 0.852 | 1.024 | |
| Non-residential Use | 0.024 | 0.036 | 1 | 0.850 | 1.024 | |
| No. of Floors | −0.579 | 6.283 | 1 | 0.012 *** | 0.560 | |
| Zoning Period | Years | Floor Area Ratio (%) | Diagonal Plane Restriction Changes |
|---|---|---|---|
| P1 | Before 1979 | 200 | Enactment of the relevant law (1971) |
| P2 | 1980~1985 | 180 | |
| P3 | 1986~1999 | 250 > 300 > 400 (1994) | |
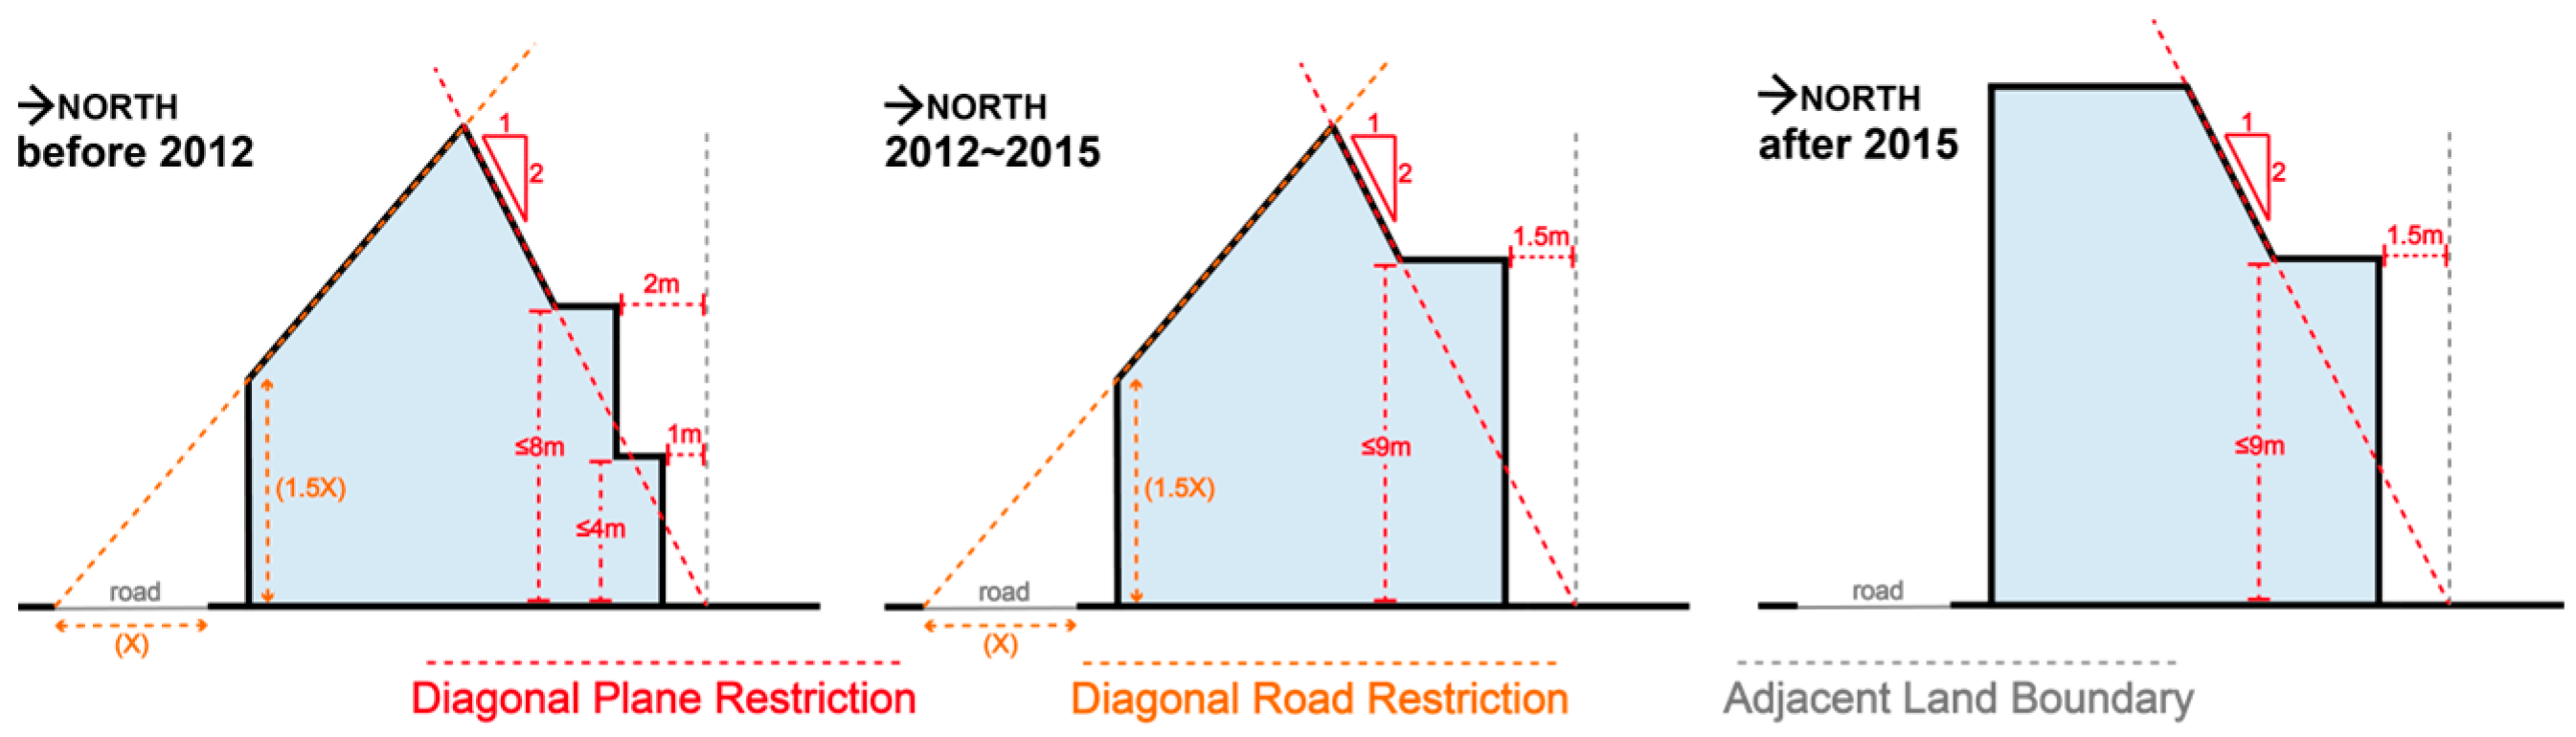
| P4 | 2000~2015 | 250 | 9m Offset from North Side, (2012, See Figure 3) |
| P5 | 2015- | 250 | Abolishment of Road Side Restriction (2015) |
Publisher’s Note: MDPI stays neutral with regard to jurisdictional claims in published maps and institutional affiliations. |
© 2022 by the authors. Licensee MDPI, Basel, Switzerland. This article is an open access article distributed under the terms and conditions of the Creative Commons Attribution (CC BY) license (https://creativecommons.org/licenses/by/4.0/).
Share and Cite
Liu, J.; Won, C. Efficacy of Korea’s Diagonal Plane Restriction for Daylight: Focusing on South-North Direction Blocks within Seoul’s General Residential Districts. Buildings 2022, 12, 2198. https://doi.org/10.3390/buildings12122198
Liu J, Won C. Efficacy of Korea’s Diagonal Plane Restriction for Daylight: Focusing on South-North Direction Blocks within Seoul’s General Residential Districts. Buildings. 2022; 12(12):2198. https://doi.org/10.3390/buildings12122198
Chicago/Turabian StyleLiu, Jingwen, and ChungYeon Won. 2022. "Efficacy of Korea’s Diagonal Plane Restriction for Daylight: Focusing on South-North Direction Blocks within Seoul’s General Residential Districts" Buildings 12, no. 12: 2198. https://doi.org/10.3390/buildings12122198
APA StyleLiu, J., & Won, C. (2022). Efficacy of Korea’s Diagonal Plane Restriction for Daylight: Focusing on South-North Direction Blocks within Seoul’s General Residential Districts. Buildings, 12(12), 2198. https://doi.org/10.3390/buildings12122198