Article

Data-Based Analysis of Environmental Attractiveness towards Low-Carbon Development in Seaside Cities

School of Architecture and Urban Planning, Beijing University of Civil Engineering and Architecture, Beijing 100044, China
*
Author to whom correspondence should be addressed.
Buildings 2022, 12(12), 2197; https://doi.org/10.3390/buildings12122197
Submission received: 8 November 2022 / Revised: 29 November 2022 / Accepted: 8 December 2022 / Published: 12 December 2022
(This article belongs to the Section Architectural Design, Urban Science, and Real Estate)

Abstract

:
Data-based technologies have been implemented in urban planning projects and environmental sciences. However, in the field of the environmental attractiveness analysis of seaside urban space, these technologies have not been fully studied. This paper critically assesses the attractiveness using data-based technologies with a focus on Chinese seaside cities’ low-carbon development. The analysis addresses the research question: How to use data-based technologies and their instruments to analyze environmental attractiveness of seaside cities towards low-carbon development? Methodologies include a case study of Dalian (China), field investigation, observation, and heatmapping. Results indicate that data-based technologies can support analysis of behavior and activity interests of inhabitants, as well as heatmapping with attractiveness consideration. The results provide a rational foundation for decision making during urban planning of seaside cities. Findings include insights and principles of planning seaside urban areas for smart sustainable development.

1. Introduction

Since 2008, the majority of the population on the earth has been living in urban areas [1]. Urban areas have become one of the most essential habitats of human beings [2]. It is believed that over 4.6 billion people will be urban residents by around the year 2030 [3]. This may bring the challenges that about 70% of the world’s greenhouse gas is released from cities [4]. Global urbanization leads to more stresses in urban environmental aspects and energy saving is one of the most important concerns for urban sustainability [5,6]. Low-carbon development has become a major consideration for contemporary cities.
The low-carbon city has become a global consensus to generate a low-carbon economy which collaborates on adaptive measures to make urban areas respond to climate change through a sustainably planned urban environment [7]. Carbon consumption has resulted from greenhouse gas emissions, and carbon dioxide is the major component of greenhouse gas. This phenomenon has been affected by various human behaviors, particularly the exploitation of fossil fuels, deforestation, and changing land usage [8]. It is believed that the largest source of greenhouse gas emissions are from human behaviors in cities [9]. According to Aihuaa and Mingjun’s research, excessive carbon dioxide emissions resulting from the greenhouse effect have become a focal point around the world [10]. Bahi and Ranjbar argue that for low-carbon urban areas, two key points should be noticed [11]. Firstly, a low-carbon city tends to reduce carbon dioxide emissions, but it relies on economic improvement. Secondly, the city is considered as a low-carbon city in terms of economy, society, culture, etc. [12,13].
Sustainable development in urban areas is conceptualized as combining environmental, spatial, and economic aspects [14]. In urban planning and space shaping, the low-carbon concept suggests that energy consumption and carbon emission can be affected through design approaches, for example, altering the urban morphology and building patterns to fulfill low-carbon requirements [15]. According to Rodrigues (2021), London can work as an example to indicate how carbon missions vary from the perspective of urban planning. Londoners have various carbon footprints according to the place they live; and these differences are largely caused by transportation carbon dioxide [16]. Islington and Hackney boroughs—denser and closer to the urban center—have low values of transport emissions per capita [16]. More rural areas can have transport emissions three or four times higher than the former [16]. This phenomenon reflects that urban planning and greenhouse gas emissions have close relations. Sustainable development relies on a socio-ecological balance and intergrowth with nature [11].
Seaside cities work as an example to pursue sustainability in this research. They generally refer to cities built by the sea. A seaside urban area may contain both natural and artificial environments within the central zones. Because of the sea and beaches, seaside cities, such as Sydney, Hawaii, and Dalian, could have pleasant scenery and a comfortable climate all year round. As Knapp presents, the seaside contains blue tourism economy. The treasure of a recreational and aesthetic seaside area brings tourism development and economic chance [17]. Considering seaside cities’ intrinsic dependence on the natural resources and its role on inhabitants’ health, industrial development and social level dissemination are both essential issues in low-carbon growth [18]. This paper uses Dalian, a seaside metropolis in the Liaoning province of China, as a study case to explore the smart sustainable development. As of the 2020 census of China, Dalian’s total population was more than 7 million, and 5 million settled in the built-up area made of 6 out of 7 urban districts [19]. This century is being marked by several challenges affecting more sustainable urban development as the urban population continues to grow [20]. Although being in an economic rising stage, Dalian has been concerned with environment reservations [21]. Recently, its ecological protection efforts have been processing and expanding [22]. Dalian has set a five-year plan in 2021 for the marine environment that included conserving populations of the endangered, black-faced spoonbill [22]. In 2019, about 49 nests were built for the black-faced spoonbill on nearby uninhabited islands [23]. There have also been conservation and rescue efforts targeting spotted seal populations [22,24]. Dalian protects the National Spotted Seal Nature Reserve within Liaodong Bay. This reserve is home to a spotted seal population and is a breeding ground for multiple marine species [25]. Not only Dalian, but many Chinese cities are also strengthening environmental regulation to inhibit the formation of new pollution havens and to change its growth mode [26]. Balancing natural reservation and artificial development is of central importance for local governments, developers, and local citizens.
Information generation and dissemination are transforming people’s daily lives, as well as urban project practices and urban issue analysis. According to Goldstein, information age has created mountains of data that continue to grow exponentially [27]. Recent developments in data-related science have brought efficient access, storage, and analysis of massive on-site measurements, leading to a new data-driven research paradigm [28]. Data-based technologies, especially remote sensing data and spatial data, offer potential for combining multiple source and datasets for spatial analysis, evaluation, and flexible management in urban planning projects [29]. Data-based technologies have the characteristics of efficiency, convenience, and flexibility. Modern data systems can support researchers to run real-time simulations at various scales, allowing them to analyze system sizes previously impossible to achieve [30]. Thus, data-based technologies may have the capability to support smart sustainable development of urban areas. In the context of the environmental attractiveness analysis of seaside urban space, however, data-based technologies have not been fully studied. This research targets the use of data-based technologies to fill the research gap. It limits the study range to its sample urban zones close to the sea and harbor, rather than the whole of Dalian city. The research question is as follows: How to use data-based technologies and their instruments to analyze environmental attractiveness of seaside cities towards low-carbon development? The objective is to facilitate smart sustainable development in a seaside urban context to achieve a quality ecosystem and attractive urban space for inhabitants. Methods and instruments are presented in the Methods Section 2. By using the methods, results of data collection, heatmapping, and environmental attractiveness calculation are presented in the Results Section 3. According to the former analysis, the Discussion Section 4 presents upgrading industrial structure and balancing artificial–natural resources for low-carbon development, as well as proposing principles towards smart sustainable development. Finally, the usage of data-based tools as applied to seaside urban space is explored, evaluating the benefits that data may have in generating a sustainable urban environment.
Building a livable city is essentially about improving the attractiveness of the living environment in cities. According to former analysis, seaside cities have relatively rich natural resources. Protecting natural resources works to enhance the environmental attractiveness towards a low-carbon development. Environmental attractiveness in seaside cities relates to various elements, including industrial construction and employment, the relationships between human activities and natural carrying capacity, and service quality of public facilities. These elements could be enhanced from the perspective of low-carbon development. In the aspect of industrial construction and employment, upgrading traditional industrial construction is beneficial to reduce natural resource consumption, provide more occupations for workers, as well as improve workers’ salaries. These help to attract people to settle down in seaside cities with low-carbon industrial systems. In the aspect of relationships between human activities and natural carrying capacity, chasing on the balance between them could facilitate a suitable and attractive living space, meanwhile, promoting low-carbon development by protecting the natural environment. In the aspect of service quality of public facilities, quality service means a high utilization rate and strong accessibility. It can support a sustainable usage of public facilities as well as reduce demolishing and rebuilding, which benefits low-carbon development in a long-term future.

2. Methods

The method framework of this research consists of two phases (Figure 1). The phases work together to explore the current situation, including population, economy, society, and residents’ activities of Dalian, to assess the impacts of human beings on the built and natural environment. The first phase targets the analysis of the inhabitants and their activities in the selected zones. Methods include field studies, data collection, and observation. Three zones of Dalian close to the coast were selected as the study samples. They work to understand the built-up environment and inhabitants’ daily activities, and examine the data-based approach to facilitating low-carbon development. The analysis of inhabitants and their activities relates to both environmental attractiveness and low-carbon development. For example, we analyzed the inhabitants in the aspect of population, age structure, employment, and income to see if the urban environment in sample areas has attractiveness. We found that young people tend to move out and the communities are becoming old. The young and middle-aged work force has left because of the outdated industrial structure and low salaries. We propose that upgrading the current industrial structure could attract more young and middle-aged inhabitants and reduce the emission of industrial waste gas, such as carbon dioxide. We also analyzed the inhabitant activities by heatmapping. The heatmapping results could reflect the areas and trajectories of inhabitants’ daily activities by using data-based technologies. According to the results, it can be indicated whether there is a functional balance between the built-up areas and the nature reserve. For the natural places that people tend to visit but need to be protected, there should be regulations or strategies to prevent excessive visiting. For the built-up areas that people are not willing to visit, they should be replaced by natural areas in planning and practice towards a low-carbon development. The second phase targets the data usage indicated in assessing environmental attractiveness. Methods include data crawling, quantitative analyzing, and heatmap drawing. The two phases work together to answer the research question about how data-based technology and its instruments support the seaside city’s sustainable development.

2.1. Field Study

Field study acts as a process where information is collected through a qualitative method. The objective of the field study in this research is to observe and interpret the built environment and inhabitants’ daily activities in the seaside urban space of Dalian city. Three urban zones, Hutan Zone, Xiuyue Zone and Bayilu Zone, were selected as the analyzing sample (Figure 2). The reasons for selecting these zones as samples include two aspects. On the one hand, the sample zones all locate at the seaside of Dalian. They are all typical urban areas close to the coasts. The location and spatial characteristics are consistent with the research objectives. Multiple samples corroborate each other to indicate reliable findings. On the other hand, the three sample areas have different functional characteristics. Different functions lead to different human behaviors and activity interests. These differences help analyze the socio-environmental attractiveness under different uses. According to Enago (2022), sample selection allows to fill the gap in data which can be understood by conducting in-depth research [30].
  • Hutan Zone. It is close to a famous scenery destination called Dalian Laohutan Ocean Park. Plenty of tourists visit this area, especially in summer. That brings periodic fluctuations in the number of individuals in this zone.
  • Xiuyue Zone. It is located on the west side of Hutan Zone, near the coast and adjacent to a large sea area. This zone is composed of mixed commercial and residential functions.
  • Bayilu Zone. Different from the previous two zones, Bayilu is a historic zone with traces of historic buildings and places.
The selected urban zones were analyzed by comparison method to indicate the current situation devoted to the research subjects. The comparison method is based on data collection in field study. Data collection works as a procedure of gathering and analyzing data from different sources to pursue answers to research questions, assess outcomes, and indicate trends and possibilities [31]. China’s 2020 census and field observation are both the initial data source. Information such as population composition, industries and income of each zone are collected by the census. This information is beneficial to indicate the development status of the selected zones. To supplement the information that not covered by the census data, this research also uses the observation method to describe and collect relevant information by observing [32], such as the movement trends and destinations. Observation was conducted between 1 January 2022 to 1 June 2022, taking about 5 months. The selected zones of Hutan, Xiuyue, and Bayilu were observed in the aspects of people’s activities, destinations, and usage of urban public spaces.

2.2. Big Data Obtaining

The data crawling method is used for data purification and targets the collection of data from either the website or in data crawling cases [33]. In this research, web scrawling gathered pages to create the collection. The AutoNavi map acted as the data crawling source. AutoNavi Software Co., Ltd., Beijing, China, is a Chinese web mapping, navigation, and location-based service provider. Since 2006, AutoNavi map has provided mapping data to Google. Crawling data works to purify data from search engines and e-commerce websites by filtering unnecessary data out and picking required data. The data from AutoNavi map need to be processed by the online platform of AutoNavi Software Co., Ltd. A series of heatmaps are automatically presented according to the scrawled data at a later stage.
Heatmap drawing also works as a main method in data analysis. A heatmap is an information visualization map that shows data magnitude as color in two dimensions. The colored variation can be by spectrum or intensity, giving visual figures about how the phenomenon is integrated or dispersed over space. The target of using heatmap technology is to indicate and visualize the possible carbon emissions in the selected zones. It could support the planning of low-carbon seaside urban space by providing the results of massive data analysis.
Data crawling and heatmap drawing are both based on big data. As a recently developed data-based technology, big data provides magnitude data that have complex structure with the challenges of storing and visualizing for whole research or design processes [34]. Planners are experiencing plenty of data that are too complex to be managed and analyzed through conventional manners [35]. It is believed that big data is of a greater variety than traditional data, arriving in increasing volumes, and with more velocity [36]. Data-based technology has been implemented in urban planning and design projects for decades. Its instruments enable planning and design cooperation, multiple scenario assessing, and real-time modeling [37]. Data-based design practices are used in urban projects to enhance efficiency and smartness. Pioneer urban designers have implemented data-based design practices on urban scales [38]. Considering the capability of data-based instruments has intensified technological investments in the last few years [39]. As per Gu, data-based modeling originates from generative design [40]. It is an integrated approach based on rules or algorithms (e.g., in generative grammars or evolutionary systems) [40]. Driven by the characteristics of urban as a hybrid habitat, the methods of urbanism take advantage of data-related instruments to update urban-scale design models and manipulate the dynamics of urban form [38]. As Nagy mentions, from the first experiments using data-based tools in architectural design processes, it was clear that these tools could similarly benefit urban design projects, including higher-scale urban cases [41].
Although data-based tools have proved their capability in urban-scale research and projects, the big data approach has not yet been fully used in the seaside urban space for low-carbon development in Dalian. Hence it has been introduced into Dalian’s urban environment toward smart sustainable development.

2.3. Calculating the Service Capability of Public Facilities

The service capability of public facilities is one of the main factors to evaluate the environmental attractiveness. In order to analyze the environmental attractiveness of the selected zones, a quantitative evaluation method has been hired. As Formula (1) presents, the service capability relates to the variables of service intensity, quality, and walkability of public service facilities. This calculation method was adopted by Bell and Baron (1974) [42]. The score is calculated acceding to the factors and the superposition of factor weights. The corresponding score could be gained according to the various weights.
G = i = 1 , j = 1 m , n λ F i , j + μ Q i + v R i
where:
  • G is the score of public service capability of specified area,
  • Fi,j is the normalized service strength of facility I in walkable distance j,
  • λ is the weight of Fi,j,
  • Qi is the normalized service quality of facility i,
  • μ is the weight of Qi,
  • Ri is the normalized walkability of facility i,
  • v is the weight of Ri,
  • m is the number of facilities that could provide services, and
  • n is the service distance of the facilities.
The public service facilities selected in this research include four categories. They are primary education facilities, medical clinics, sport facilities, and cultural facilities. Service intensity and service quality were measured using a Likert scale. The Likert scale is named after Rensis Likert. Psychologist Likert differentiated between a scale proper, which emerges from collective responses to a set of items, and the format in which responses are scored within a value range [43]. All obtained data are normalized. Database normalization is the process of integrating data into charts in a manner in which the results of using the database are always unambiguous and as intended [44]. According to Zhang’s research, normalized data facilitate the comparison of multiple types of values, making the calculation results dimensionless [37]. The walking distance of the service is recorded by actual measurement.

3. Results

3.1. Data Collection Results

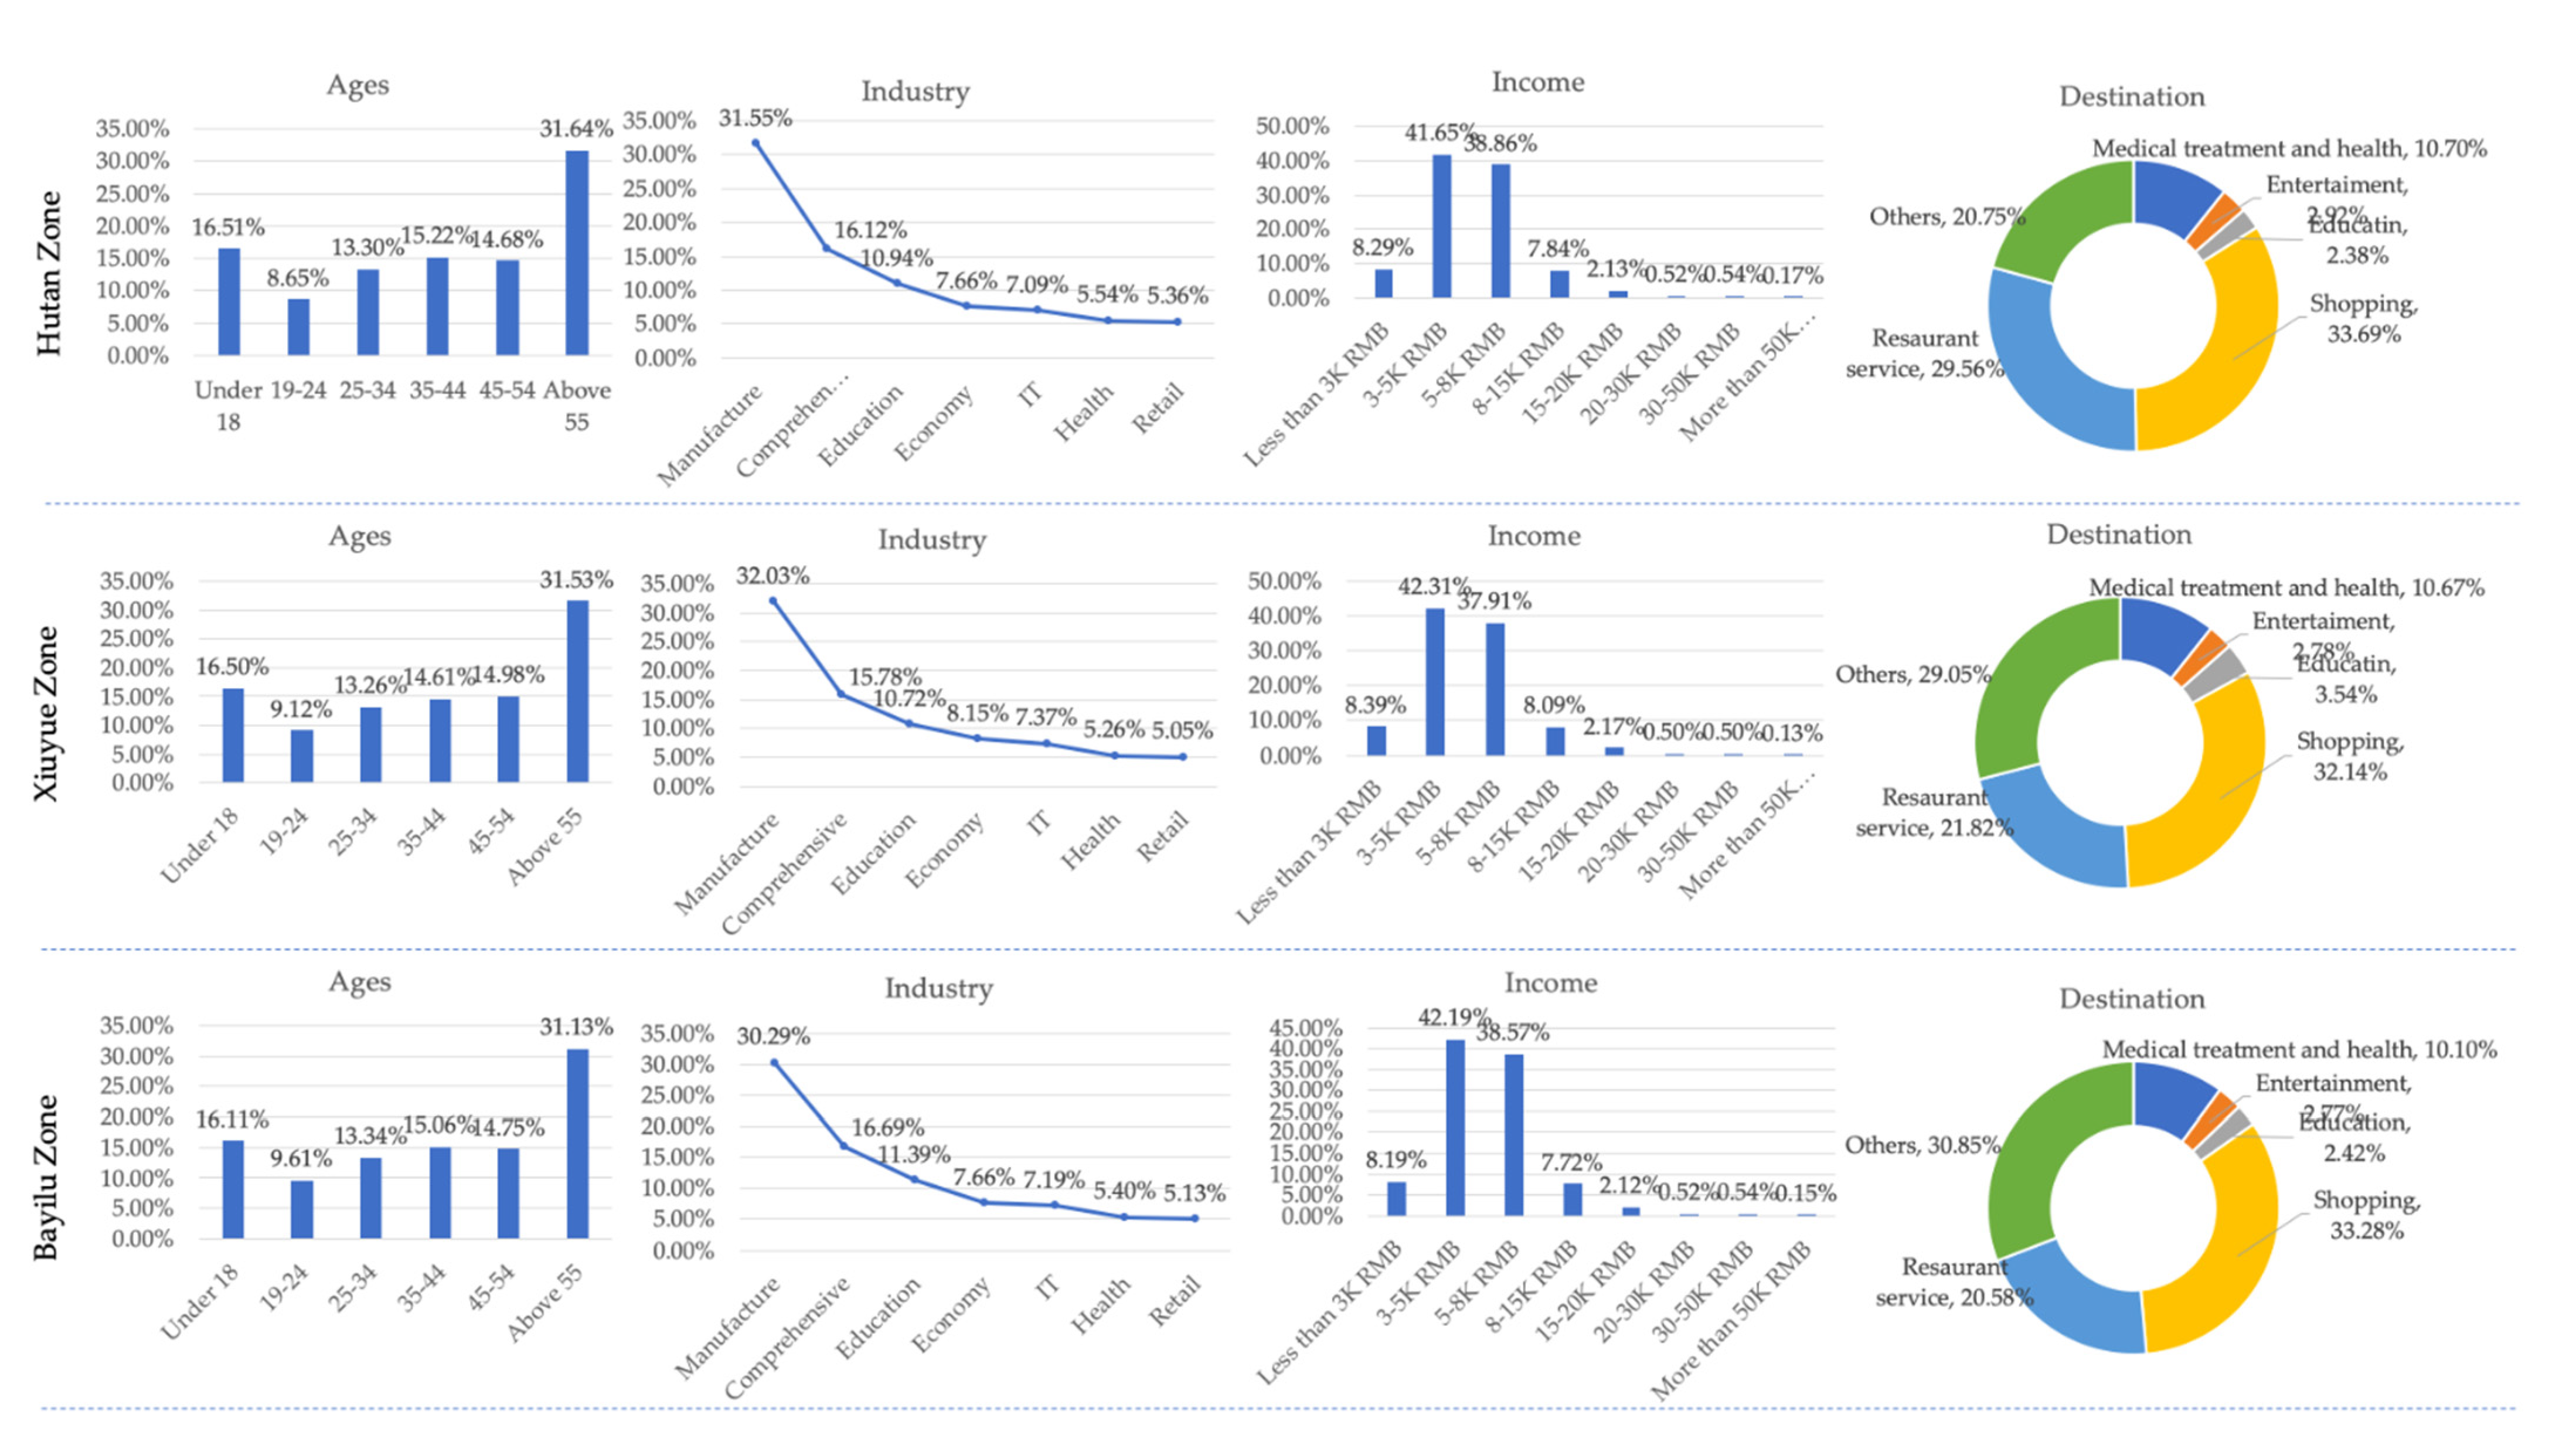
Results from the data collection of inhabitants and their activities are presented in Figure 3. In the Hutan Zone, according to the census data, the number of inhabitants above 55 years old is the largest percentage (31.64%) compared with other age periods. An aging society has emerged in this zone. Despite its short distance to the coast and famous tourist destinations, the younger generation is still reluctant to stay here. Most current residents work in the manufacture industry (31.55%) and the least number of residents work in the retail industry (5.36%). Traditional industries such as shoemaking and clothing are dominant in the industry system of Hutan Zone. Tertiary industries such as retail services have not attracted many practitioners.
Correspondingly, the income of the population is unbalanced. Data analysis found that the highest proportion of people (41.65%) has a monthly income of RMB 3000 to 5000 (about USD 414 to 690). Some individuals, 38.86% of the total population, have a monthly income of RMB 5000 to 8000 (about USD 690 to 1104). It indicates that the average annual income of most people is between RMB 36,000 to 60,000, or about USD 5000 to 8000. According to the World Bank, the average income per year of China was USD 10,390 in 2021, which ranked 44 in the world. The economy in Hutan Zone is lower than the average of China and similar to Ecuador or Peru.
In the aspect of expenditure, the largest number of the residents choose to go shopping (33.69%) and to restaurants (29.56%) during their leisure time according to the data of AutoNavi Software Co., Ltd. The company draws relevant states based on check-in information of online social platforms, online discussion volumes, and the transaction activities disclosed by users. Living consumption is the main part of people’s financial expenditure. The least amount of residents in the population (2.38%) choose to pay for education. These results are consistent with the observations from field research. Observation in Hutan Zone found that people had a relatively strong activity trend in buying daily consumables. They could afford meal consumption in restaurants occasionally. Medical care and entertainment might not be so attractive for most people.
A similar situation can be found in Xiuyue Zone. Results present that the aging trend is also an obvious phenomenon that Xiuyue Zone is experiencing. The number of elderly people (above 55) accounts for the highest proportion (31.53%) of the total population. Some young and middle-aged laborers do not tend to stay in this zone. From the perspective of industrial structure, most people are engaged in the traditional manufacturing or comprehensive industries, while the amount of practitioners in retail, health, and IT industries is relatively low. These industry types generally require a higher level of education and service capabilities. It is one of the important reasons why only a few people work in these industries.
In the aspect of income level, there are few difference between Xiuyue Zone and Hutan Zone. The income level of the majority of the population is still at the level of a monthly income of RMB 3000 to 5000. This is related to the fact that most people work in labor-intensive industries. The industrial structure and proportion can also be reflected by the income level of Xiuyue Zone. From the perspective of consumption structure, inhabitants in Xiuyue Zone prefer to pay for shopping (32.14%). Moreover, people have a variety of other options (29.05%). Consumer destinations in this zone are relatively diverse.
The population structure of Bayilu Zone is similar to the other two zones. The elderly population is the highest proportion (31.53%), and the proportion of minors follows (16.50%). According to this analysis, it could be speculated that the aging phenomenon may be common in the seaside areas of Dalian. Even if seaside space has pleasant scenery, the willingness of the young and middle-aged labor force to work here is still not strong as the relatively single type of industries.
In Bayilu Zone, industrial structure and income salary levels are correlated. People engaged in traditional manufacturing and comprehensive industries are the largest proportion. Their incomes range from RMB 3000 to 8000 (about USD 414 to 1104) per month. The income histogram in Figure 3 confirms this analysis as well. There are several consumer destinations in this zone, including shopping, dining, medical treatment and health, entertainment, education, and other options. The largest number of people would like to go shopping for daily living use, and a considerable number of people choose the other option. Consumption has certain characteristics of diversification.

3.2. Heatmapping Results

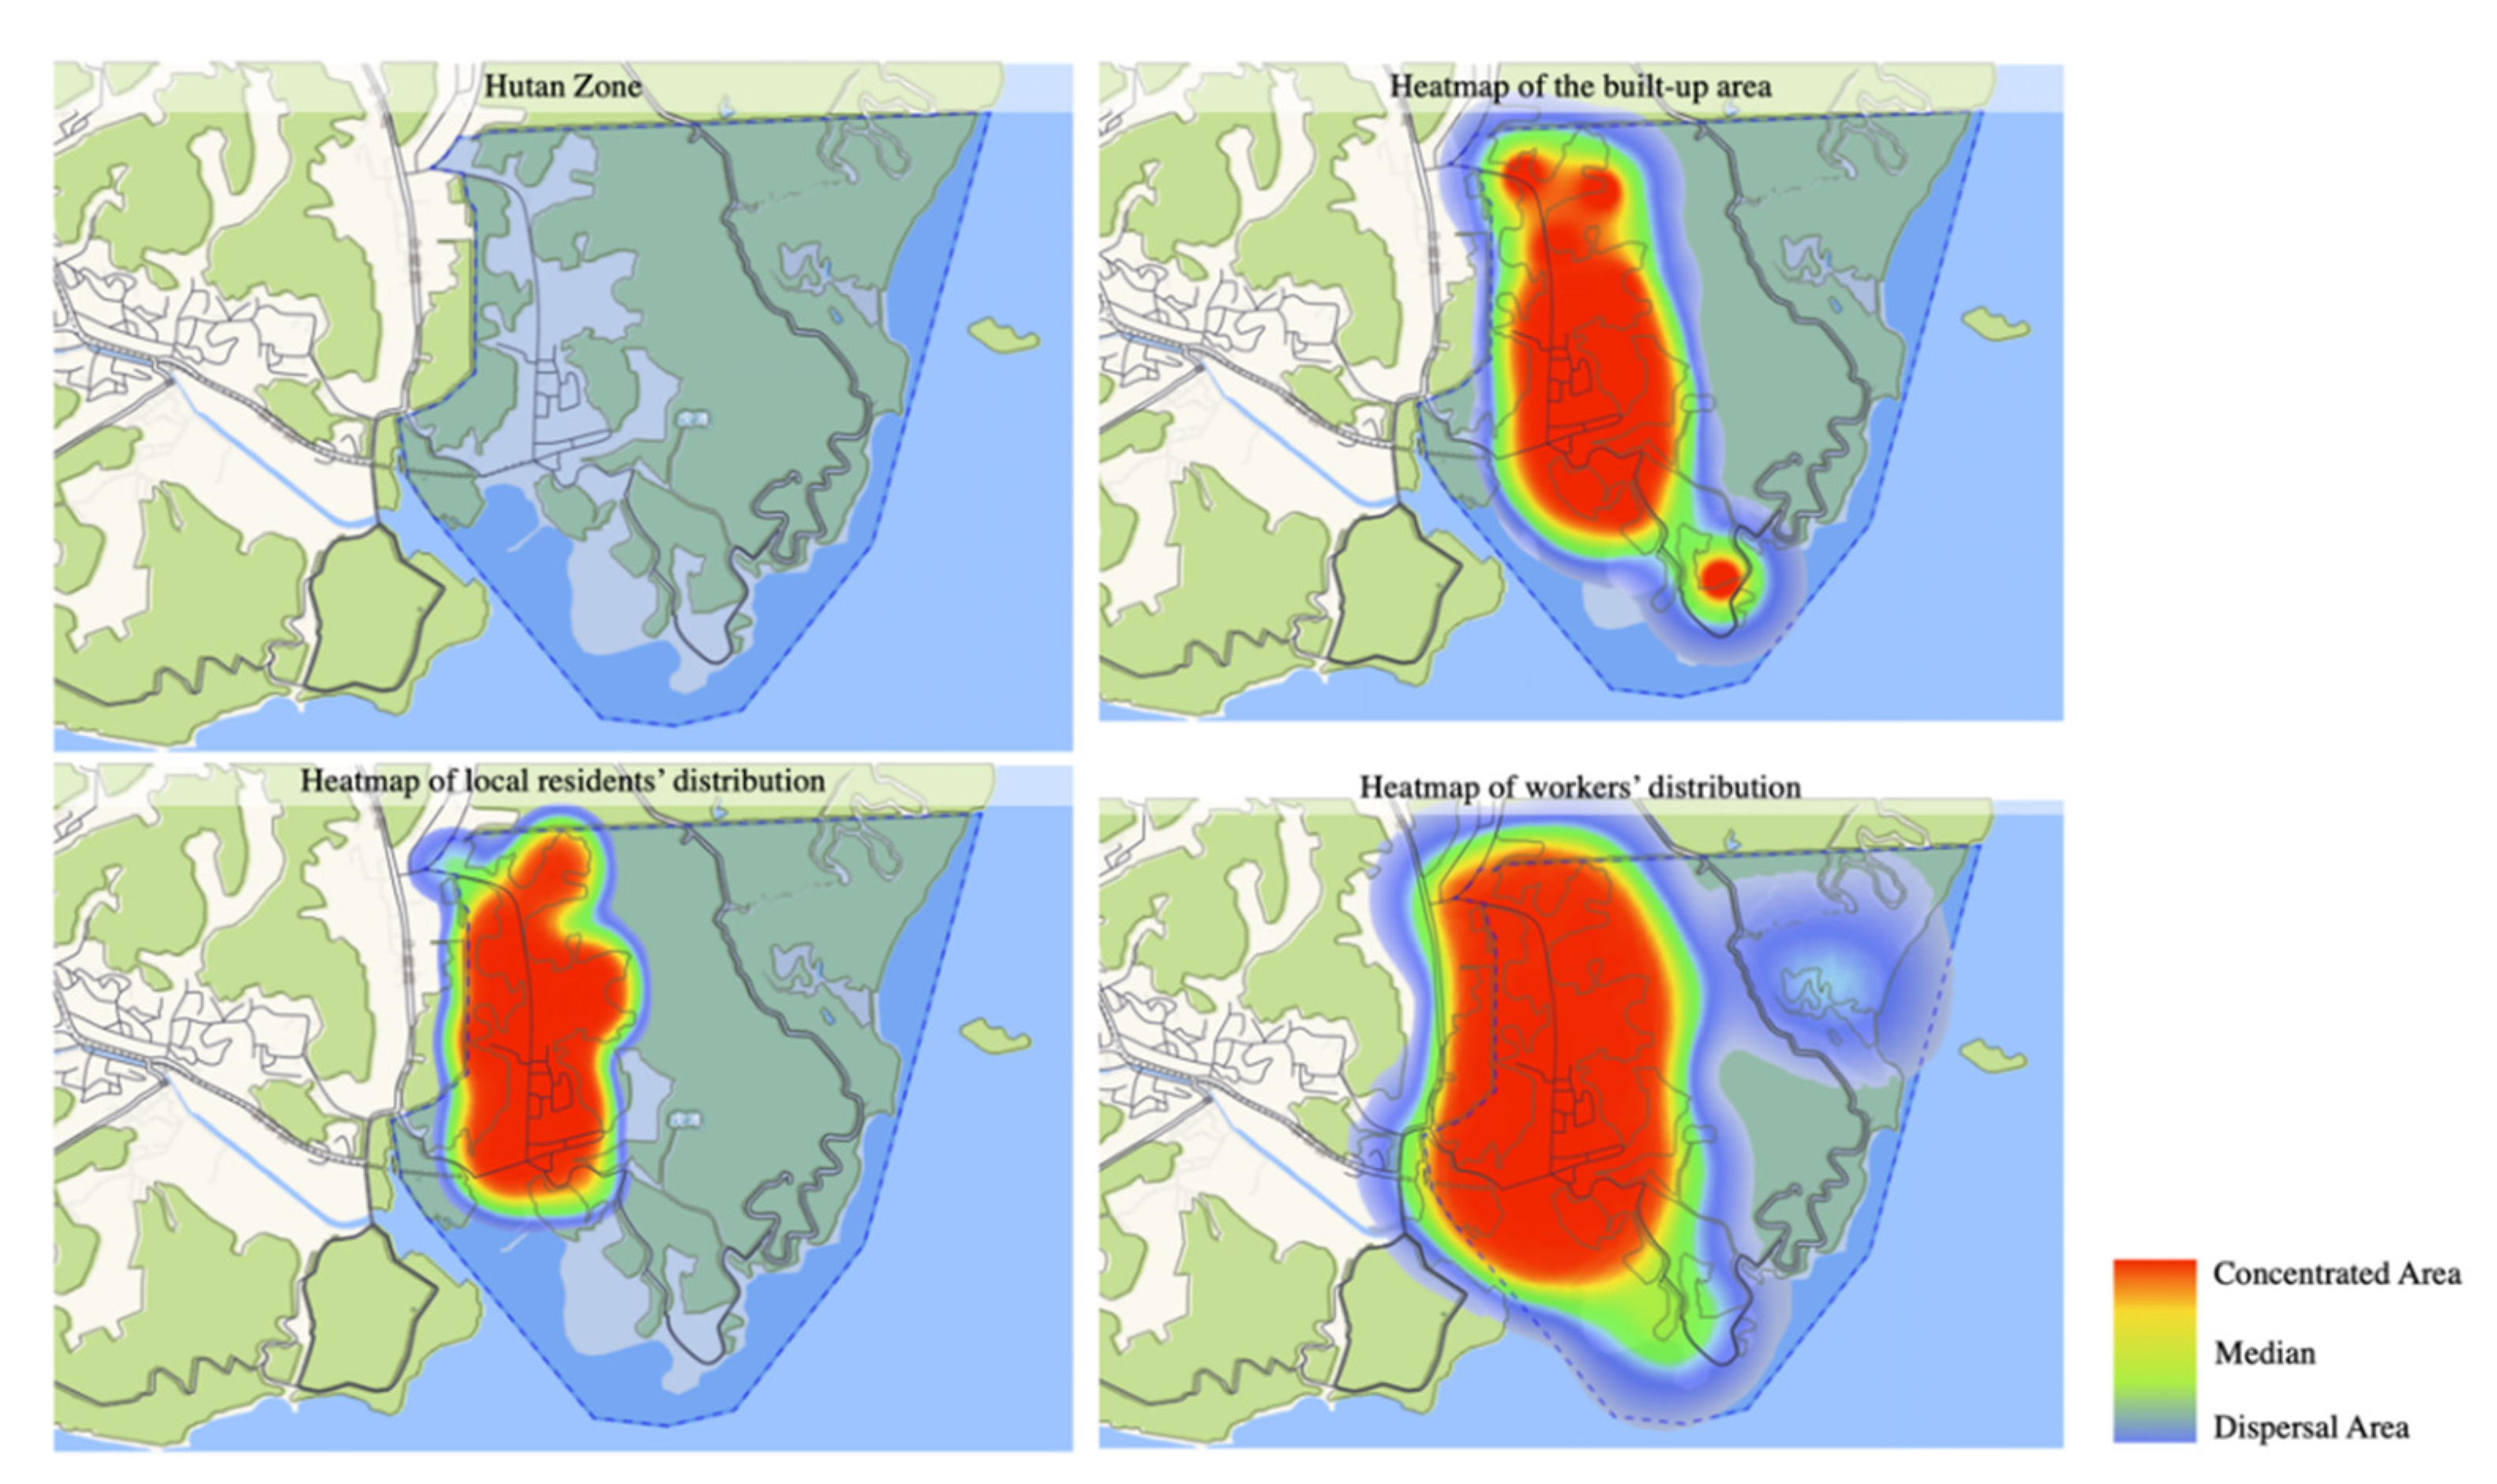
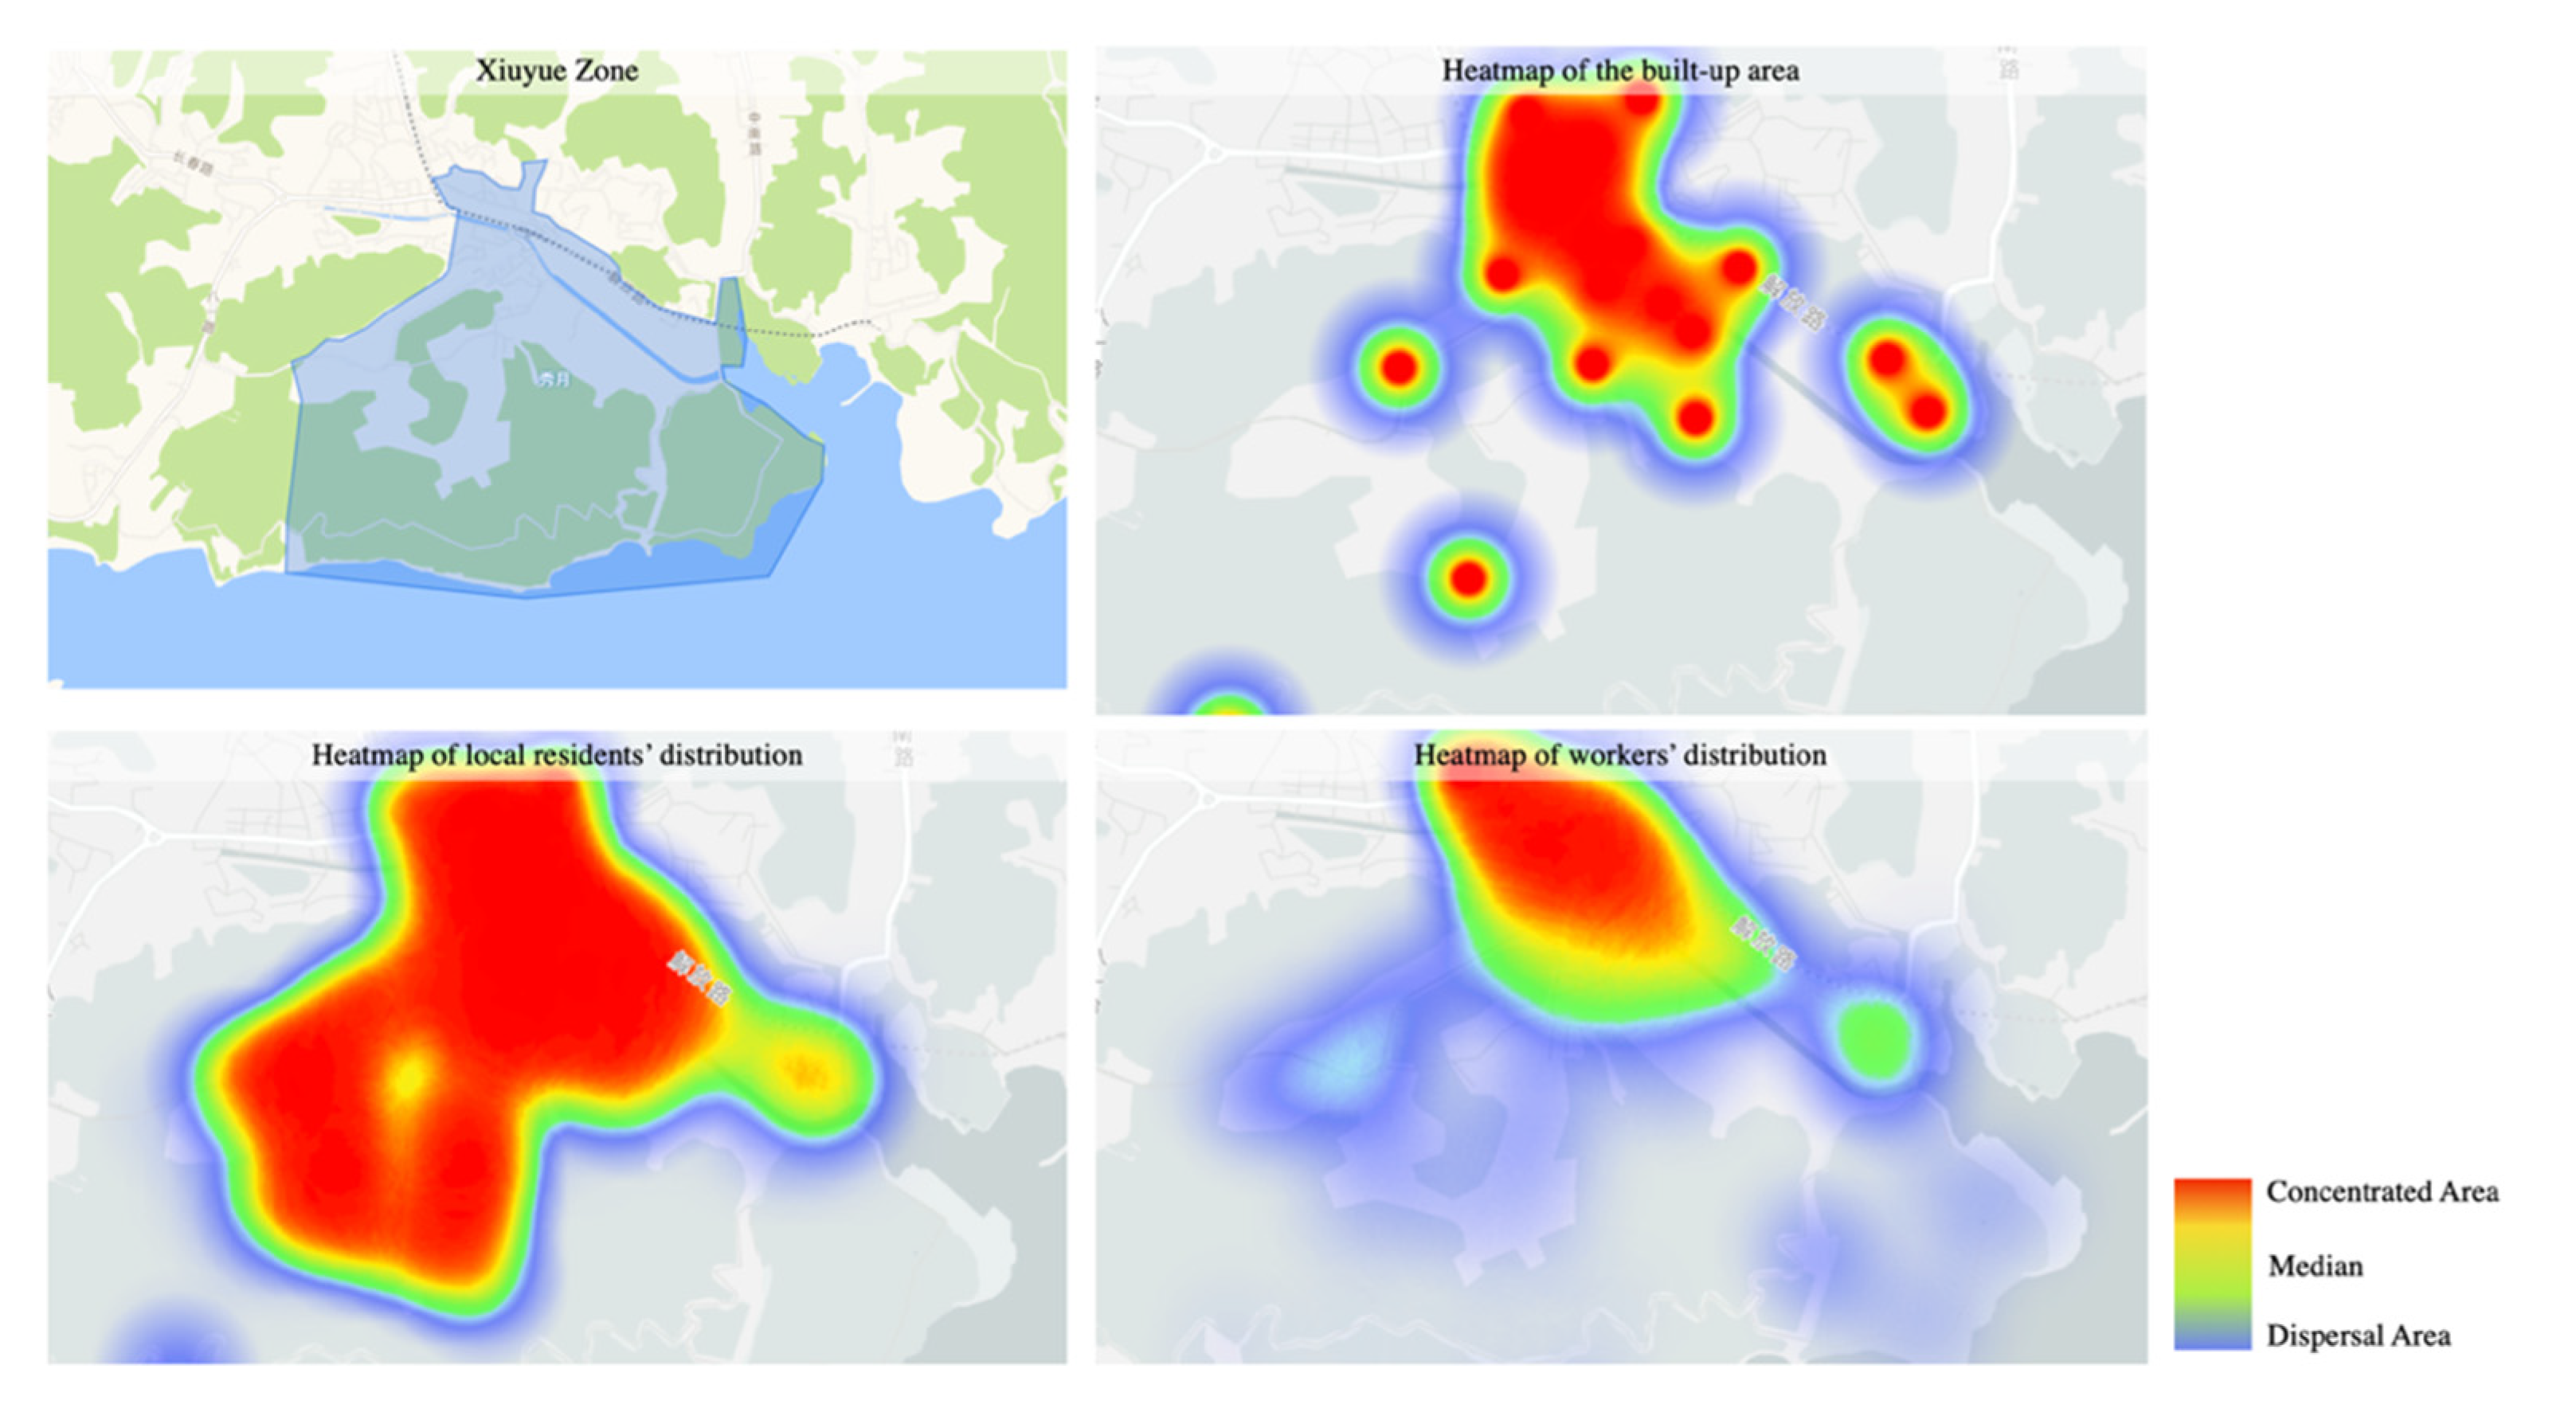
Data mapping results generally include a heatmap of the built-up area, a heatmap of local residents’ distribution, and a heatmap of workers’ distribution. Heatmap drawing results can reflect the construction and human activities in the selected zones. The warm color in heatmaps indicates a dense integration of construction or movement. The cold color indicates a decentralized construction or movement.
The heatmaps in Hutan Zone generally present a centralized mode (Figure 4). The heatmap of the built-up area and the heatmap of local residents’ distribution can be mostly overlapped. It means local residents’ daily activities basically happen around the built-up areas. However, the activity areas of the office workers working in Hutan Zone are relatively large, encroaching on part of the natural areas. As a result, the activities of people may have a certain destructive effect on the natural environment and affect the protection of natural areas.
In Xiuyue Zone, the heatmap of the built-up area presents in a decentralized pattern (Figure 5). Due to topographical constraints, urban construction has been basically divided into small groups. However, the decentralized pattern does not continue in the heatmap of location residents’ distribution. Local residents’ activities tend to be contiguous and centralized. In the heatmap of workers’ distribution, the proportion of cool colors is relatively large, which means the office workers tend to only move in a small area. The areas that are difficult to reach due to terrain or distance reasons are not that popular.
Similar to the heatmaps of Xiuyue Zone, the heatmap of the built-up areas in Bayilu Zone is presented as a scattered pattern (Figure 6). The existing built-up areas have been constructed under the consideration of natural terrain influences, while the heatmap of local residents’ distribution presents a continuous form. Local residents would like to move in both artificial and natural environments. According to the heatmap of workers’ distribution, it is reflected that the movement range of the workers is contiguous as well. Compared with the heatmap of local residents’ distribution, there are significantly more cool-toned areas in the heatmap of workers’ distribution. It can be seen that the range of activities of workers is relatively concentrated. Workers would rather conduct activities near their workplaces than go far areas.

3.3. Calculation Results of Public Service Facilities

The normalized values of public service facilities in the selected areas are shown in Table 1. Data normalization means to generate a relational data integration based on normal forms [37]. Through decreasing the dependency and redundancy, the original data can be classified [37]. The service capability of primary education, medical clinics, sport facilities, and cultural facilities can be calculated by using the weights of 0.3 (service intensity), 0.4 (service quality), and 0.3 (walkability). The division of weights depends on the public perceptions reflected in the fieldwork. Table 2 presents the service capability of public service facilities in Xiuyue Zone, Hutan Zone, and Bayilu Zone.
The calculated results reflect that Hutan Zone has a relatively high score (2.4) in service capabilities. It may provide quality public service to residents in the aspects of primary education, medical clinics, sports, and cultural supports. As it shows in Table 1, Hutan Zone has the highest score in the categories of service quality (2.9) and walkability (2.0). It means residents could enjoy the services from public facilities with a short walking distance. Environmental attractiveness should be improved according to the measurement. Bayilu Zone ranks second in the selected samples. It performs well in the aspect of service intensity with a score of 2.6. It means residents may obtain a relativity strong quality service from public service facilities. Xiuyue Zone provides the poorest public services with a score of 1.3. Although performing well in the walkability category with a score of 2.0, the service intensity and service quality are measured as both 1.0.

4. Discussion

4.1. Upgrading Industrial Structure for Low-Carbon Development

The living environment of seaside cities could be benefit from ascendant natural resources. However, the consumption of natural resources by the development of traditional manufacturing cannot be ignored. Taking economic and social development into consideration, the traditional manufacturing industry should be upgraded and transformed. Upgrading and transforming traditional manufacturing are not only to support the low-carbon development of the living environment, but are also to effectively improve the income level of the population by supporting diversified urban industries, as well as attract a young and middle-aged work force to respond to aging trends. It is believed that the upgrading of the industrial structure has changed the distribution of regional occupations. Moreover, according to Dalian’s current natural and social environmental statistics, reducing carbon emission can be achieved through upgrading industrial structure and urban industrial planning strategies.

4.2. Balancing Built-Up Areas and Natural Resources for Low-Carbon Development

The heatmap simulation results indicate that current built-up areas could basically guarantee the reservation of the natural terrain. The sample zones have created a seaside urban space where people and nature coexist in relative harmony with the requirements of protecting the water system. However, the scope of people’s activities is generally larger than the actual built-up scope, especially the activity scope of local residents. It indicates that urban planning needs to reconsider the extent of built-up areas and their relationship to natural lands. The proportion of land use should ensure that the daily needs of residents are met. Meanwhile, land use limitations are required to be delineated to protect natural areas from being eroded by artificial construction projects.

4.3. Principles for Planning Smart Sustainable Urban Space

According to the former analysis, it is believed that environmental attractiveness in seaside cities relates to various elements, including industrial construction and employment, the relationships between human activities and natural carrying capacity, and the service quality of public facilities. This research indicates planning principles in a broader context.
The first is limiting the unnecessary expansion of construction areas, meanwhile practicing low-carbon renewal planning within the existing built-up areas. The sprawl of the human habitat is identified as a land-use issue, resulting in the immoderate change of public space and natural areas into a residential usage [45]. Planners need to change the conventional dichotomy of pro-development and pro-environment approaches and balance planning objects toward not only preservation but also natural resource management [46,47].
The second is providing green and low-carbon industries for local work forces. The development of the green energy industry is conductive to solving the employment of the population and offering a relatively stable economic source for the labor force. Moreover, it can realize the transformation of the industrial structure, and turn into a sustainable industrial chain without high resource consumption. Inhabitants, especially the local residents, have a demand for being hired by quality industries and improving salary levels. Industrial system planning works as a major component in realizing low-carbon development for addressing the climate issues on a large scale [48].
The third is advocating the mixed-use of urban space and facilities. The phenomenon of tidal activities of workers could benefit to use urban space efficiently and intensively. The functions of buildings and places may be used alternately with the commute time. Moreover, for the historical zones, appropriative renewal of buildings is a way of organic urban regeneration because it extends the buildings’ life and avoids material waste, supports energy reuse, and also offers social and economic advantages to the communities [49]. Public service facilities need to be improved towards quality service intensity, service quality and walkability towards a sustainable urban environmental attractiveness.
This research uses three sample zones of Dalian city to analyze environmental attractiveness for low-carbon development. It limits the research scope to the environmental attractiveness measurement of seaside cities, in terms of industrial structure, the relation between artificial and natural environments, and service quality of public facilities. Although it is proved that data-based technologies have the capability to support the improvement of environmental attractiveness, there is a gap in how emerging data-based technologies fit into various stages and scales of low-carbon planning, not only in seaside cities, but also different city types. The specific manners in which to hire data-based technologies in the whole planning processes, master planning, or urban design projects are still unclear. For future studies, these should be deeper analysis towards smart sustainable development.

5. Conclusions

Low-carbon development in seaside cities is a significant opportunity to generate or regenerate the living environment. This research highlights that socio-environmental elements, including population structure, industries, income, and built-up areas, could have an influence on carbon emissions and natural conservation. Through analyzing how local residents and workers behave in the selected zones of Hutan, Xiuyue, and Bayilu, it has been found that, firstly, Dalian’s seaside areas lack the attractiveness for a young work force because of its industrial structure. It is necessary to improve industrial structure by introducing green, knowledge-intensive industries. Secondly, people’s activities happen not only in the built-up areas but also natural areas, particularly for local residents. It is believed that promoting nature connectedness may augment the advantages from nature [50]. Thus, three principles of improving environmental attractiveness towards low-carbon developments are indicated, including limiting unnecessary expansion of construction areas, providing green and low-carbon industries, and advocating the mixed-use of urban space and facilities. The planning principles are beneficial to improve the environmental attractiveness towards low-carbon development. It is a challenge for urban planners, designers, and architects to establish environments that are inclusive and caring to their residents. Through field investigating and big data usage, it has been found that seaside cities have natural resources, pleasant landscapes, and opportunities for industrial transformation. These advantages have laid the foundation for green and smart sustainable development. The principles proposed in this research could support the enhancement of the environment’s attractiveness and the well-being of local people, and stimulate low-carbon development towards net-zero emissions.

Author Contributions

Conceptualization, Y.Z.; methodology, Y.Z. and M.Q.; software, M.Q. and Y.L.; validation, M.L., Y.L. and Y.Z.; formal analysis, Y.Z. and M.L.; investigation, Y.Z.; resources, M.L.; data curation, Y.L.; writing—original draft preparation, Y.Z.; writing—review and editing, Y.Z.; visualization, Y.L.; supervision, Y.Z.; project administration, Y.Z.; funding acquisition, Y.Z. All authors have read and agreed to the published version of the manuscript.

Funding

This research was funded by Beijing Municipal Education Commission, grant number KM202110016017 and “the Pyramid Talent Training Project of Beijing University of Civil Engineering and Architecture, grant number 01082722012”.

Data Availability Statement

Not applicable.

Conflicts of Interest

The authors declare no conflict of interest.

References

  1. Ho, C.S.; Matsuoka, Y.; Simson, J.; Gomi, K. Low carbon urban development strategy in Malaysia—The case of Iskandar Malaysia development corridor. Habitat Int. 2013, 37, 43–51. [Google Scholar] [CrossRef] [Green Version]
  2. Graviola, G.R.; Ribeiro, M.C.; Pena, J.C. Reconciling humans and birds when designing ecological corridors and parks within urban landscapes. Ambio 2022, 51, 253–268. [Google Scholar] [CrossRef] [PubMed]
  3. Parry, M.L.; Canziani, O.; Palutikof, J.; Van der Linden, P.; Hanson, C. Climate Change 2007-Impacts, Adaptation and Vulnerability: Working Group II Contribution to the Fourth Assessment Report of the IPCC (Vol. 4); Cambridge University Press: Cambridge, UK, 2007. [Google Scholar]
  4. Satterthwaite, D. The contribution of cities to global warming and their potential contributions to solutions. Environ. Urban. ASIA 2010, 1, 1–12. [Google Scholar] [CrossRef]
  5. Global Health Observatory (GHO) Data. Available online: https://www.who.int/data/gho (accessed on 25 March 2022).
  6. Liu, Y.; Tian, W.; Zhou, X. Energy and carbon performance of urban buildings using metamodeling variable importance techniques. Build. Simul. 2021, 14, 535–547. [Google Scholar] [CrossRef]
  7. Joss, S.; Tomozeiu, D.; Cowley, R. Eco-Cities—A Global Survey 2011, University of Westminster International Eco-Cities Initiative; University of Westminster: London, UK, 2011. [Google Scholar]
  8. Metz, B.; Davidson, O.; Bosch, P.; Dave, R.; Meyer, L. Climate Change: Mitigation. Contribution of Working Group iii to the Fourth Assessment Report of the Intergovernmental Panel on Climate Change; Cambridge University Press: Cambridge, UK, 2007. [Google Scholar]
  9. Kongboon, R.; Gheewala, S.H.; Sampattagul, S. Greenhouse gas emissions inventory data acquisition and analytics for low carbon cities. J. Clean. Prod. 2022, 343, 130711. [Google Scholar] [CrossRef]
  10. Ji, A.; Liu, M. Industrial structure adjustment based on the concept of low carbon-A case of Qingdao city. Energy Procedia 2011, 5, 1621–1625. [Google Scholar]
  11. Bahi, E.S.M.S.; Ranjbar, E. Seeking low carbon urban design through modelling of carbon emission from different sources in urban neighborhoods, case study: Semnan. Int. J. Urban Sustain. Dev. 2021, 13, 546–568. [Google Scholar]
  12. Su, M.; Zheng, Y.; Yin, X.; Zhang, M.; Wei, X.; Chang, X.; Qin, Y. Practice of low-carbon city in China: The status quo and prospect. Energy Procedia 2016, 88, 44–51. [Google Scholar] [CrossRef] [Green Version]
  13. Su, M.; Chen, B.; Xing, T.; Chen, C.; Yang, Z.F. Development of low-carbon city in China: Where will it go? Procedia Environ. Sci. 2012, 13, 1143–1148. [Google Scholar] [CrossRef] [Green Version]
  14. Mirzoev, T.; Tull, K.I.; Winn, N.; Mir, G.; King, N.V.; Wright, J.M. Systematic review of the role of social inclusion within sustainable urban developments. Int. J. Sustain. Dev. World Ecol. 2022, 29, 3–17. [Google Scholar] [CrossRef]
  15. Liu, B.; Liu, X.; Lu, C.; Godbole, A.; Michal, G. Computational fluid dynamics simulation of carbon dioxide dispersion in a complex environment. J. Loss Prev. Process Ind. 2016, 40, 419–432. [Google Scholar] [CrossRef] [Green Version]
  16. Rodrigues, G. How Urban Planning Is Key to Net Zero: Evidence from London. Available online: https://www.centreforcities.org/blog/how-urban-planning-is-key-to-net-zero/ (accessed on 2 August 2021).
  17. Knapp, E.; Vandegehuchte, M.B. The tourism values of the coast: Modeling seaside amenity values in Belgium. Int. J. Hosp. Tour. Adm. 2022, 6, 1–18. [Google Scholar] [CrossRef]
  18. Fink, H. Human-nature for climate action: Nature-based solutions for urban sustainability. Sustainability 2016, 8, 254. [Google Scholar] [CrossRef] [Green Version]
  19. Demographic Census Data. Available online: http://www.stats.gov.cn/ztjc/zdtjgz/zgrkpc/dqcrkpc/ (accessed on 15 July 2022).
  20. Russo, A.; Escobedo, F.J. From smart urban forests to edible cities: New approaches in urban planning and design. Urban Plan. 2022, 7, 131–134. [Google Scholar] [CrossRef]
  21. China Daily: Dalian on UN List of Greenest Urban Areas. Available online: http://www.china.org.cn/english/2001/Jun/14005.htm (accessed on 22 May 2022).
  22. Shi, Y. China Set to Expand Targets for Marine Environmental Protection. Available online: https://www.maritime-executive.com/editorials/china-to-expand-targets-for-marine-environmental-protection (accessed on 10 May 2022).
  23. Yan, L. Endangered Spoonbill Birds Thrive in Dalian, Liaoning. Available online: http://www.ecns.cn/hd/2019-08-13/detail-ifzmwwnr7047278.shtml (accessed on 18 January 2022).
  24. Xinhua Net. Eight Spotted Seals Released into Sea in Dalian. Available online: http://www.xinhuanet.com/english/2021-04/17/c_139886029.htm (accessed on 18 January 2022).
  25. Dalian National Spotted Seal Nature Reserve. Available online: https://rsis.ramsar.org/ris/1147 (accessed on 12 June 2022).
  26. Wang, Q.; Du, Z.; Wang, B.; Chiu, Y.; Chang, T. Environmental regulation and foreign direct investment attractiveness: Evidence from China provinces. Rev. Dev. Econ. 2022, 26, 899–917. [Google Scholar] [CrossRef]
  27. Goldstein, I.; Spatt, C.S.; Ye, M. Big Data in Finance (Working Paper). Available online: https://ssrn.com/abstract=3809447 (accessed on 22 March 2021).
  28. Fan, C.; Yan, D.; Xiao, L.F.; Ao, L. Advanced data analytics for enhancing building performances: From data-driven to big data-driven approaches. Build. Simul. 2021, 14, 3–24. [Google Scholar] [CrossRef]
  29. Lee, A.; Lee, K.W.; Kim, K.H.; Shin, S.W. A geospatial platform to manage large-scale individual mobility for an urban digital twin platform. Remote Sens. 2022, 14, 723. [Google Scholar] [CrossRef]
  30. Van Dam, K.K.; Lansing, C.; Elsethagen, T.; Hathaway, J.; Guillen, Z.; Dirks, J.; Skorski, D.; Stephan, E.; Gorrissen, W.; Gorton, I.; et al. Nationwide buildings energy research enabled through an integrated data intensive. Build. Simul. 2014, 7, 335–343. [Google Scholar] [CrossRef]
  31. Duggal, N. Most Effective Data Collection Methods with Their Techniques and Use Cases Explained. 2021. Available online: https://www.simplilearn.com/data-collection-methods-article (accessed on 14 October 2021).
  32. Bhasin, H. Observation Methods—Definition, Types, Examples, Advantages. Available online: https://www.marketing91.com/observation-method/#:~:text=The%20observation%20method%20is%20described,information%20and%20data%20by%20observing (accessed on 5 March 2020).
  33. Fatenaite, G. Web Scraping vs. Web Crawling: The Differences. Available online: https://oxylabs.io/blog/crawling-vs-scraping (accessed on 4 May 2021).
  34. Sagiroglu, S.; Sinanc, D. Big data: A review. Int. Conf. Collab. Technol. Syst. 2013, 5, 42–47. [Google Scholar]
  35. Davenport, T.H.; Barth, P.; Bean, R. How big data is different. Sloan Manag. 2012, 54, 22–24. [Google Scholar]
  36. What Is Big Data. Available online: https://www.oracle.com/hk/big-data/what-is-big-data/#:~:text=The%20definition%20of%20big%20data,especially%20from%20new%20data%20sources (accessed on 8 January 2022).
  37. Zhang, Y.; Liu, C. Parametric Modeling for Form-Based Planning in Dense Urban Environments. Sustainability 2019, 20, 5678. [Google Scholar] [CrossRef] [Green Version]
  38. Zhang, Y.; Liu, C. Parametric Urbanism and Environment Optimization: Toward a Quality Environmental Urban Morphology. Int. J. Environ. Res. Public Health 2021, 18, 3558. [Google Scholar] [CrossRef] [PubMed]
  39. Pinto, G.M.; Vieira, A.P.; Neto, P.L. Parametric Urbanism as Digital Methodology: An Urban Plan in Beijing. In Proceedings of the eCAADe Regional International Workshop, Porto, Portugal, 18 September 2013. [Google Scholar]
  40. Gu, N.; Yu, R.; Behbahani, P.A. Parametric Design: Theoretical Development and Algorithmic Foundation for Design Generation in Architecture. In Handbook of the Mathematics of the Arts and Sciences; Springer: Cambridge, UK, 2018. [Google Scholar]
  41. Nagy, D. Urban Magazine: Towards a Collective Purpose; Publication of the Students of Columbia University: New York, NY, USA, 2009. [Google Scholar]
  42. Bell, P.A.; Baron, R.A. Environmental influences on attraction: Effects of heat, attitude similarity, and personal evaluations. Bull. Psychon. Soc. 1974, 4, 479–481. [Google Scholar] [CrossRef] [Green Version]
  43. Likert, R. A technique for the measurement of attitudes. Arch. Psychol. 1932, 140, 1–55. [Google Scholar]
  44. Rouse, M.; Vaughan, J. Data Normalization. Available online: https://www.techtarget.com/searchdatamanagement/definition/normalization (accessed on 7 July 2022).
  45. Daniels, T.L.; Lapping, M. Land preservation: An essential ingredient in smart growth. J. Plan. Lit. 2005, 19, 316–329. [Google Scholar] [CrossRef]
  46. Bengston, D.N. Changing forest values and ecosystem management. Soc. Nat. Resour. 1994, 7, 515–533. [Google Scholar] [CrossRef]
  47. Broussard, S.R.; Washington-Ottombre, C.; Miller, B.K. Attitudes towards policies to protect open space: A comparative study of government planning officials and the general public. Landsc. Urban Plan. 2008, 86, 14–24. [Google Scholar] [CrossRef]
  48. Nakamura, K.; Hayashi, Y. Strategies and instruments for low-carbon urban transport: An international review on trends and effects. Transp. Policy 2013, 29, 264–274. [Google Scholar] [CrossRef]
  49. Yung, E.H.K.; Chan, W.H.W. Implementation challenges to the adaptive reuse of heritage buildings: Towards the goals of sustainable, low carbon cities. Habitat Int. 2012, 36, 352–361. [Google Scholar] [CrossRef]
  50. McGinlay, J.; Parsons, D.J.; Morris, J.; Graves, A.; Hubatova, M.; Bradbury, R.B.; Bullock, J.M. Leisure activities and social factors influence the generation of cultural ecosystem service benefits. Ecosyst. Serv. 2018, 31, 468–480. [Google Scholar] [CrossRef]
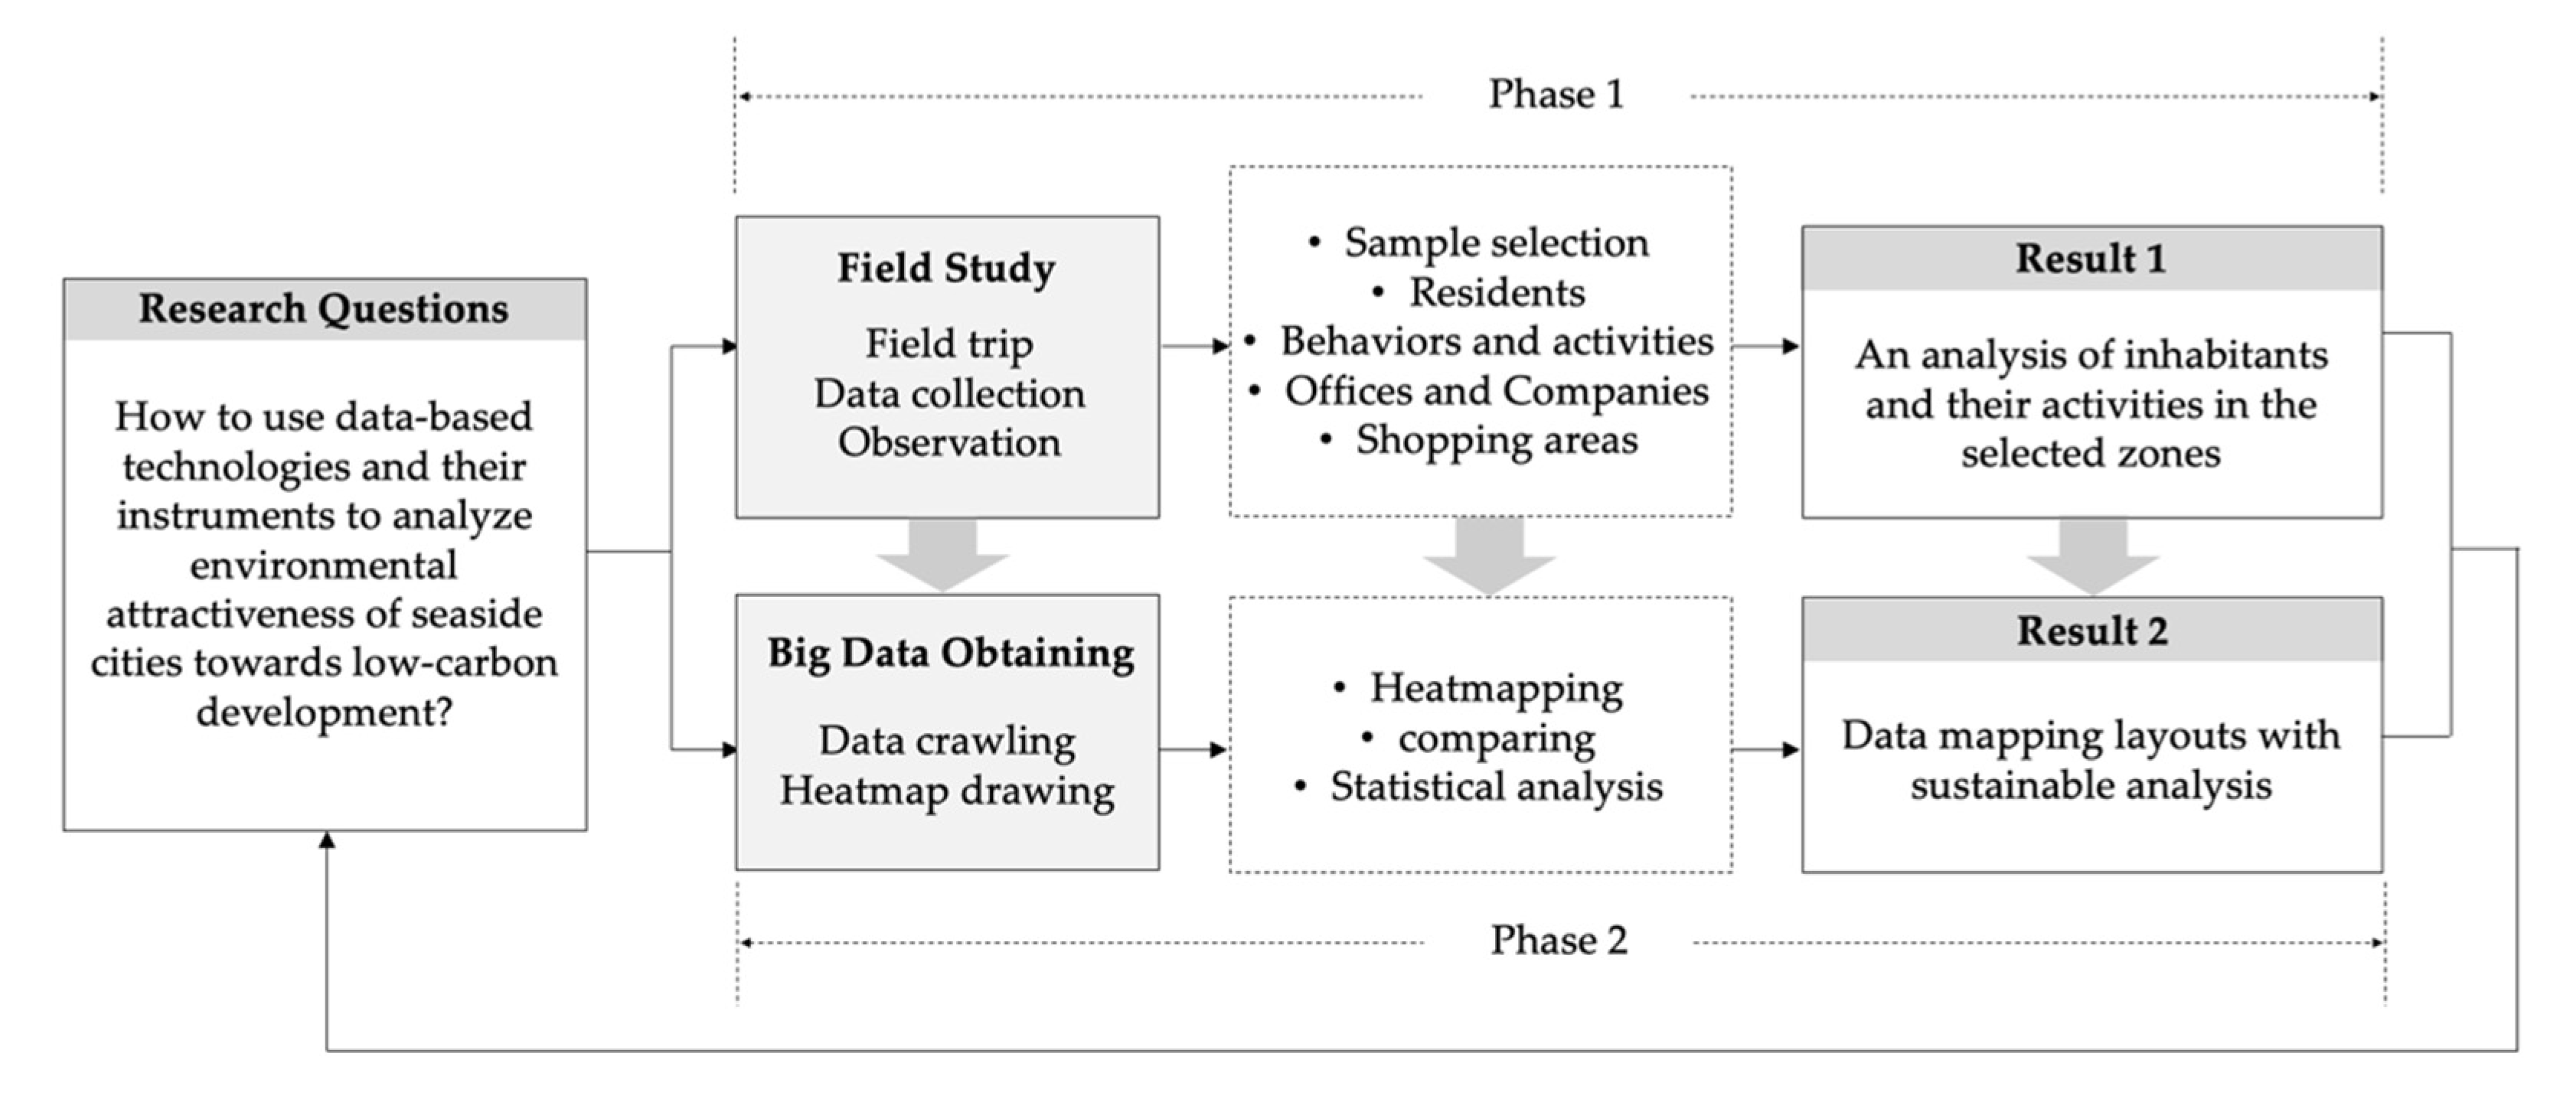
Figure 1. Methodology framework. Source: Authors.
Buildings 12 02197 g001
Figure 2. Scenes of Hutan Zone, Xiuyue Zone, and Bayilu Zone. Source: Authors.
Buildings 12 02197 g002
Figure 3. Data analysis of the selected zones of Dalian. Source: Authors.
Buildings 12 02197 g003
Figure 4. Heatmaps of Hutan Zone. Source: Authors.
Buildings 12 02197 g004
Figure 5. Heatmaps of Xiuyue Zone. Source: Authors.
Buildings 12 02197 g005
Figure 6. Heatmaps of Bayilu Zone. Source: Authors.
Buildings 12 02197 g006
Table 1. Data normalization of public service facilities. Source: Authors.
Sample ZonesPrimary
Education
Medical ClinicsSport FacilitiesCultural
Facilities
TotalWeights
Service Intensity
Xiuyue Zone0.00.01.00.01.00.3
Hutan Zone10.50.20.32.0
Bayilu Zone0.61012.6
Service Quality
Xiuyue Zone01001.00.4
Hutan Zone1010.92.9
Bayilu Zone0.60.40.412.4
Walkability
Xiuyue Zone00112.00.3
Hutan Zone0.710.20.12.0
Bayilu Zone10.4002.4
Table 2. Service capabilities of public service facilities. Source: Authors.
Sample ZonesService
Intensity
Service QualityWalkabilityScore of Service Capabilities
Xiuyue Zone0.30.40.61.3
Hutan Zone0.61.20.62.4
Bayilu Zone0.810.42.2
Publisher’s Note: MDPI stays neutral with regard to jurisdictional claims in published maps and institutional affiliations.