1. Introduction
The separator layer is placed between the pavement structural layers as a functional layer to separate the surface layer from the base course or between the overlay layer and the old pavement surface. It can reduce the interlayer constraint and improve the capability of flushing resistance of the base layer and the long-term performance of pavement structure.
In the United States, the separator layer was used in the construction of the base layer of lean concrete pavement earlier to reduce the binding force between structural layers. AASHTO’s Pavement Design Guide in 1993 gives the recommended values for the interlayer friction coefficient for treating poor concrete pavements and applying wax-based curing agents [
1]. From 2006 to 2007, under funding from organizations such as the U.S. Federal Highway Administration, researchers conducted a thorough investigation of cement pavements in Europe and Canada, and the results showed that there are separator layers in many countries’ cement pavements, including Canada, Austria, and the Netherlands. The effect is good, and the pavement can reach a service life of 30~40 years [
2]. Currently, the United States International airports which have the capacity for large aircraft landing and taking off tend to have separator layers under concrete slabs. The U.S. Federal Aviation Administration proposed in the airport construction standard AC 150/5370-10G that a separator layer should be provided when paving cement concrete on a cement-stabilized base layer [
3].
As the primary function of the separation layer is to reduce interlayer constraint and prevent erosion, scholars did lots of research on the interlayer contact property between the separation layer and the upper layer. The interlayer treatment method included setting cement slurry, oil, wax, sand, stone, asphalt, paper, geomembrane, etc. was studied by Stott [
4] through sliding experiment. Furthermore, the base layer treated with a double-layer geomembrane was studied [
5]. Later the slip-friction curve of regular interlayers was studied under dry and wet conditions [
6], and the sliding-friction curve was obtained under sheering of a different number of times [
7]. The influence of the separator layer on the mechanical response of concrete was studied as well. The strain and deflection of different parts of the pavement were studied with a separator layer of geomembrane, wax curing agent, emulsified asphalt, and asphalt concrete [
8]. A team from Changsha University of Science and Technology researched the impact of the two separator layers on the cement pavement, namely the wax-made separator layer and slurry seal [
9,
10]. Chang’an University’s team studied the influence of asphalt mixture separator layers on the mechanical response of the pavement structure through numerical calculation [
11,
12]. The effect of a 5 cm asphalt concrete separator layer on temperature displacement was studied by Han [
13].
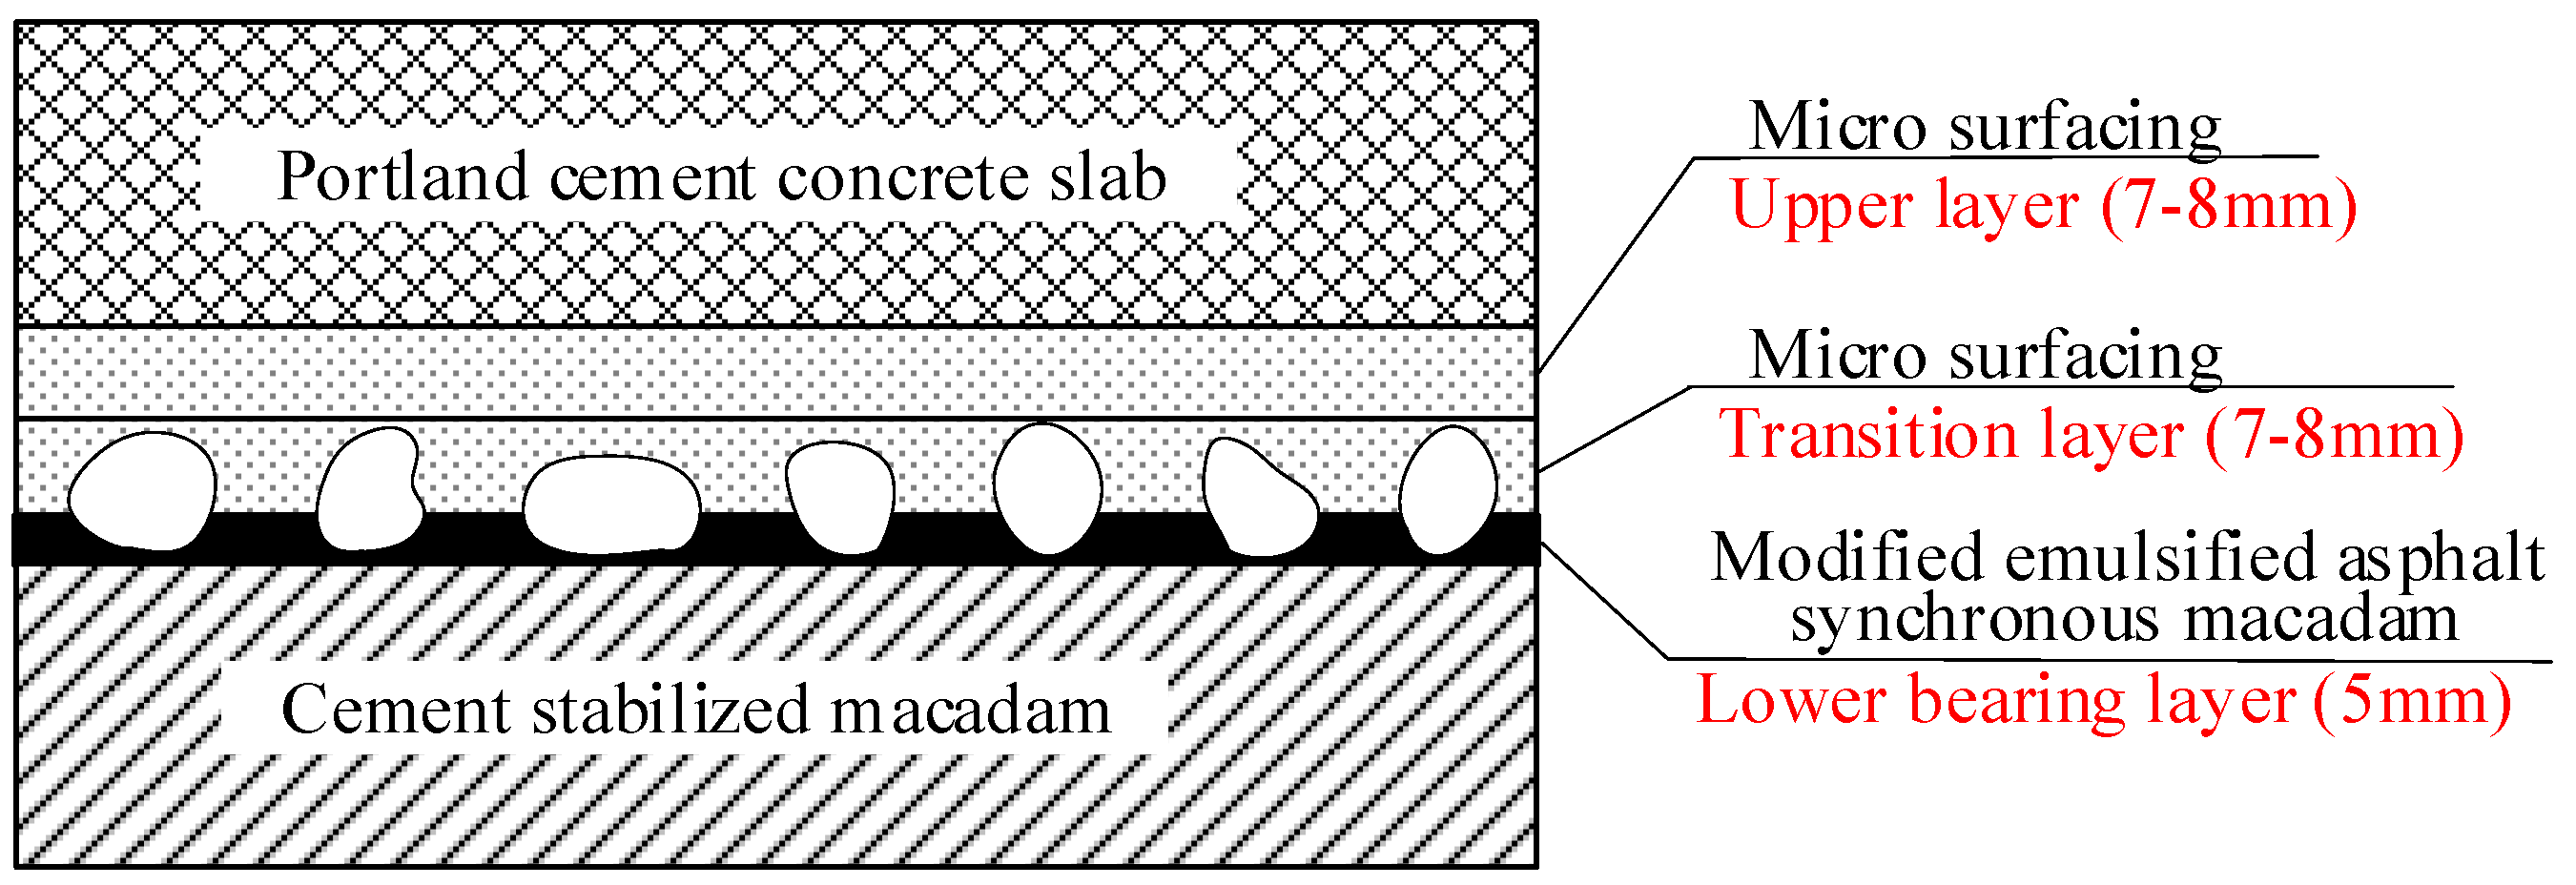
However, in literature, the composite separator layer was seldom studied. The composite separator layer proposed in this paper consists of a lower bearing layer and micro surfacing. It is also known as Cape Seal because it first appeared in Cape, South Africa, in the 1950s. The 5 mm bearing layer consists of a very sticky modified emulsified asphalt and macadam. The transition layer and upper layer both have a thickness of 7–8 mm, made up of a less sticky modified emulsified asphalt mixture. The structure of the composite separator layer is shown in
Figure 1.
The emulsified asphalt and the single-size macadam are uniformly spread onto the base course. They form the lower bearing layer or the synchronous macadam layer. Former research shows that a synchronous macadam layer can improve the resistance of pavement to water seepage and wear [
14]. The double micro-surfacing structure ensures the micro-surfacing completely covers the macadam layer and the interconnected pores were eliminated in the separation layer. The double micro-surfacing structure also ensures the waterproof and anti-scouring performance of the pavement. Furthermore, the micro-surfacing provides a smooth interlayer for the cement concrete.
Because of its good performance and low construction cost, the composite separator layer is widely used in the maintenance and construction of highways [
15]. The cape seal treatments with either a slurry seal or a micro surfacing were proven to extend pavement life at the least cost [
16,
17]. The Texas Department of Transportation concluded that underlying chip seal in terms of aggregate loss or insufficient chip seal-pavement bond affect the performance of the cape seals [
18]. The same study also found that for cape seals bleeding and shoving were the most significant distresses, so the bond between the chip seal and the underlying layer must be strong enough. It can be concluded that previous Investigations on the cape seal focus on its use as a pavement surface treatment, but almost no previous study was found on its use as a separator layer between concrete and base course. The separator layer undergoes very different loads beneath the concrete layer because it does not directly bear the shearing force of wheels. Therefore, the cape seal used as separator layer should be thoroughly studied. Besides, it is seldom used in airports, and the traffic load in airports is quite different from the regular highway load. Due to its great potential for airport application, in 2018, the composite separator layer was applied in the construction of a new airport in Qingdao, China, hoping to save the maintenance cost by 1.5 million dollars per year. However, the properties and the influence of the composite separator layer lack investigation as theoretical support.
In this paper, the properties and the benefits of the composite separator layer on airport concrete pavement were studied. Firstly, tests were carried out to get the properties such as modulus and bonding characteristics with concrete. Secondly, the measured modulus and contact characteristic were used in the finite element model (FEM) as input data. Through FEM the effect of reducing contraction stress in concrete was confirmed. Also, the benefit of extending pavement longevity was quantitatively estimated.
2. Materials and Experiments
2.1. Micro-Surfacing Ingredients
2.1.1. Emulsified Asphalt
The emulsified asphalt used in different layers of Cape Seal has different properties to satisfy different application requirements. The tests were done per Standard Test Methods of Bitumen and Bituminous Mixtures for Highway Engineering in China, and the results are shown in
Table 1.
Table 1 shows that the emulsified asphalt is cationic, contributing to its adherence to negatively charged aggregates. The micro surfacing asphalt is slow-breaking so that asphalt has enough time to flow into the voids in the aggregate layer before demulsification and formation of strength. The asphalt in synchronous macadam is rapid-breaking, supporting adherence formation immediately after spraying.
2.1.2. Aggregates
The aggregate properties were tested per Test Methods of Aggregate for Highway Engineering (JTG E42-2005, Beijing, China). The tested items and the results are shown in
Table 2.
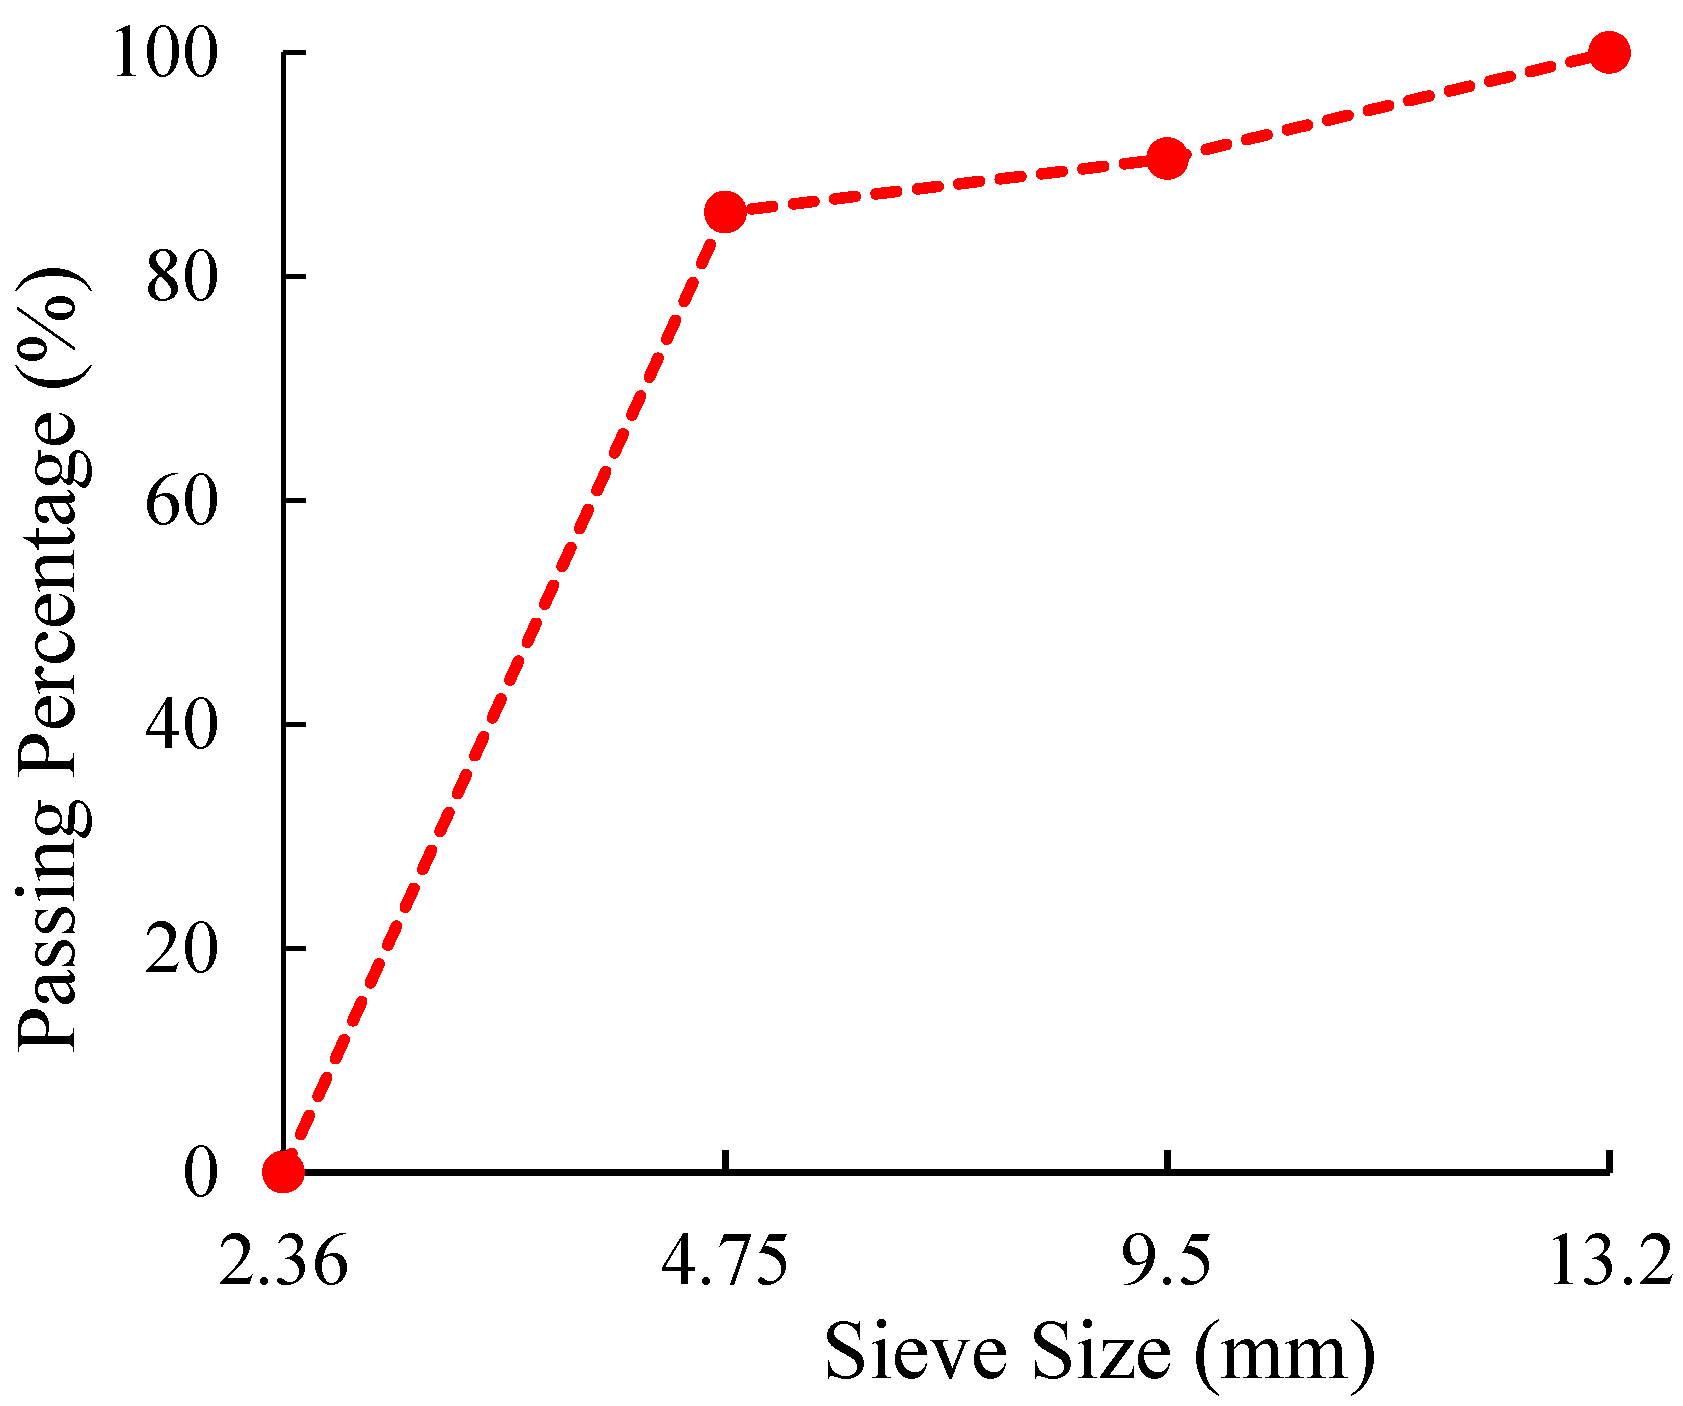
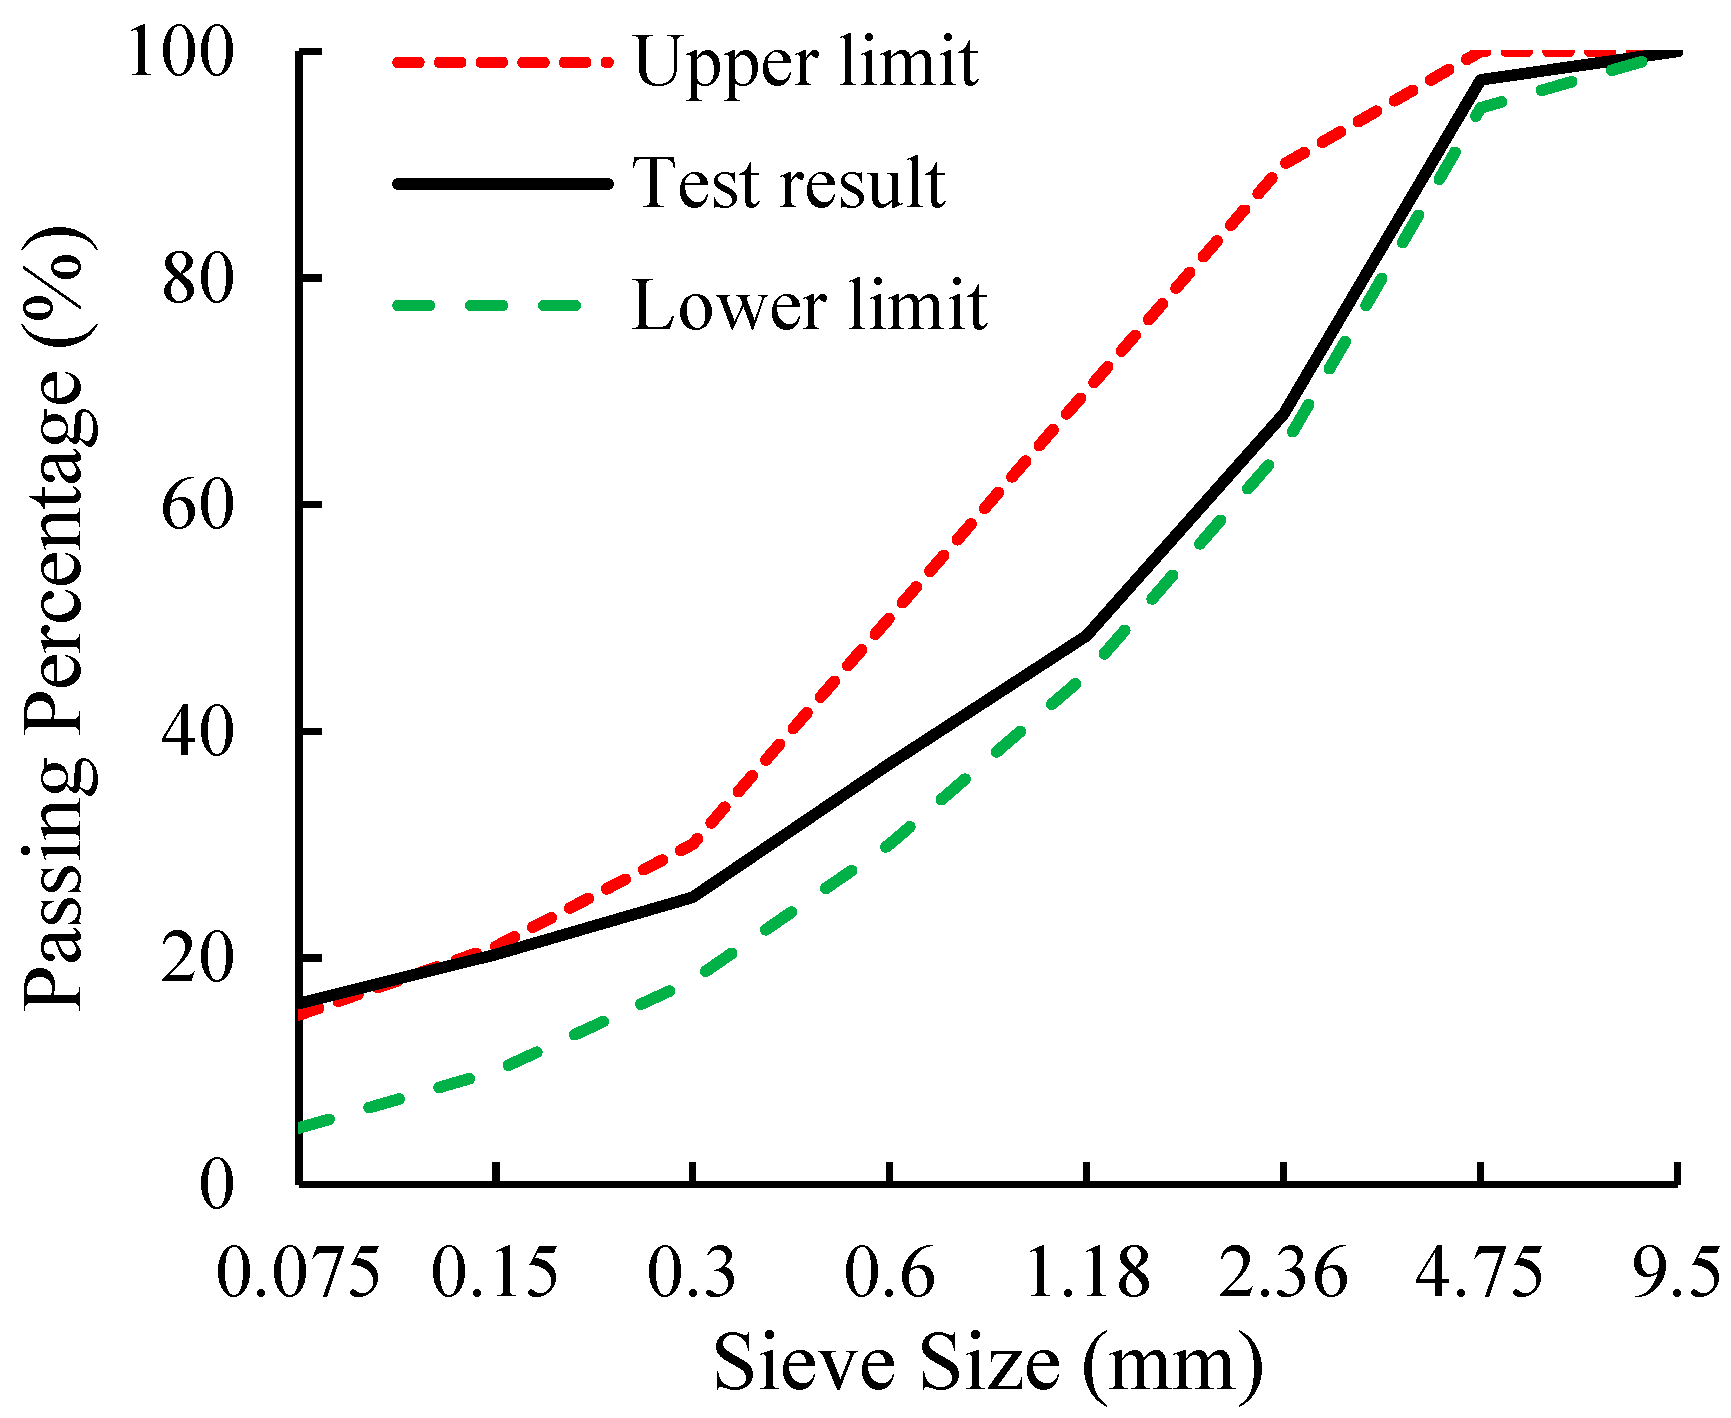
The gradation curve of aggregates for the Synchronous macadam and micro surfacing is shown in
Figure 2 and
Figure 3. The gradation design of micro surfacing is controlled by an upper and lower limit per Technical Specifications for Construction of Highway Asphalt Pavements (JTG F40-2004, Beijing, China). The proportion design of micro surfacing is shown in
Table 3.
2.2. Resilient Modulus Test
Resilient modulus is a crucial input parameter in airport pavement structure design. While no test results of the resilient modulus of the composite separator layer were found in the literature, in this study, the resilient modulus was tested in the laboratory at Tongji University.
Unlike ordinary uniform asphalt mixture, the Cape Seal consists of a synchronous macadam layer and a micro surfacing layer. Therefore, its resilient modulus is an equivalent modulus of the two layers. As the resilient modulus of macadam is far larger than the asphalt mixture, resilient deformation is mainly provided by micro-surfacing under traffic load. In contrast, the deformation of the macadam is negligible. Therefore, the resilient modulus of the micro-surfacing was tested.
The micro-surfacing material was mixed according to the proportion in
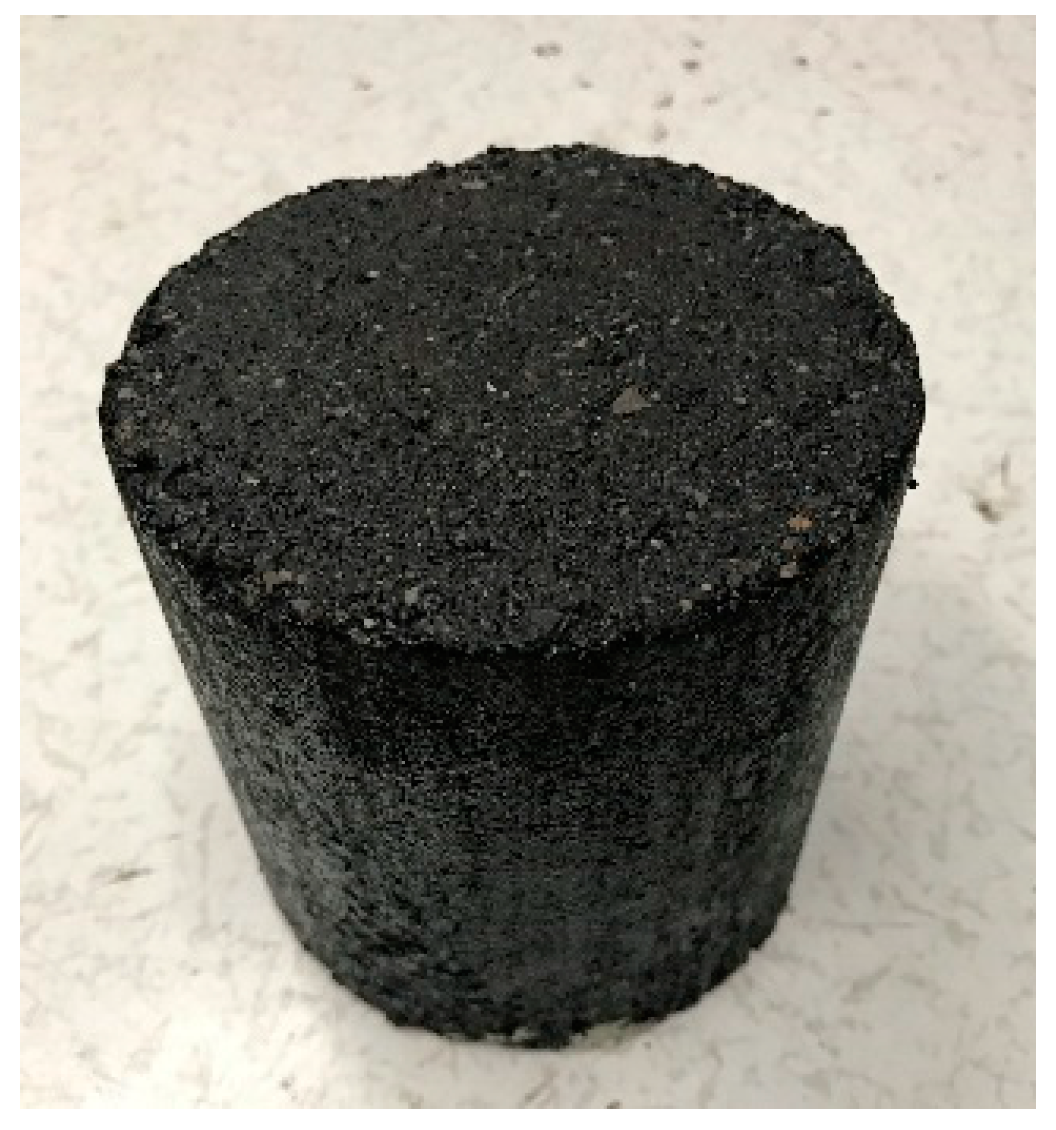
Table 3, and then specimens were prepared as cylinders of Φ100 mm × 100 mm (as shown in
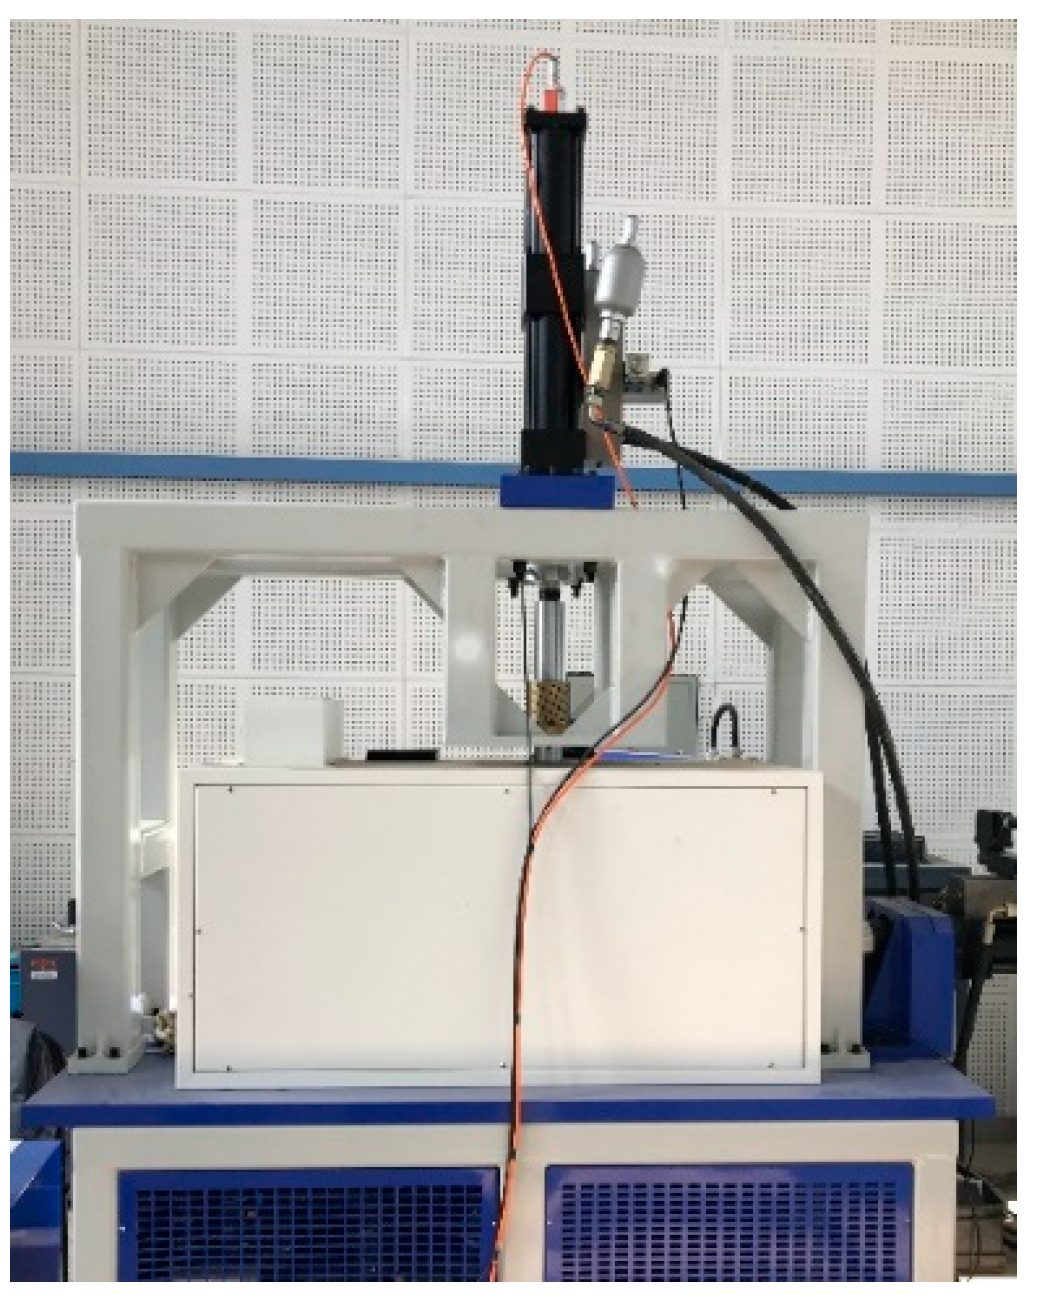
Figure 4). Specimens were tested under a vertical sine force of frequency 0.1 Hz, 0.5 Hz, 1.0 Hz, 5 Hz, 10 Hz, and 20 Hz with the cycle number 15, 15, 20, 100, 200, and 200, respectively. The unconfined compression deformation of the specimens was controlled in the range of 300~600με. The system recorded real-time force and displacement. The material testing system includes an environment box (as shown in
Figure 5) so that the test temperature was controlled. Five temperatures were chosen, which were 0 °C, 10 °C, 20 °C, 30 °C, and 40 °C.
2.3. Shearing Test
The push-off test on the full-sized slabs was recorded in the literature [
5,
6]. However, the ability to push off a large slab and take real-time measurement make the test facility expensive and not accessible to everyone. Instead, this study employed the shearing test, a more convenient method to measure the interlayer friction characteristic. As the shearing test uses much smaller specimens, a larger number of specimens could be obtained. In this study, a self-developed shearing tester device was employed to look into the interlayer mechanical characteristic of Cape Seal and slab.
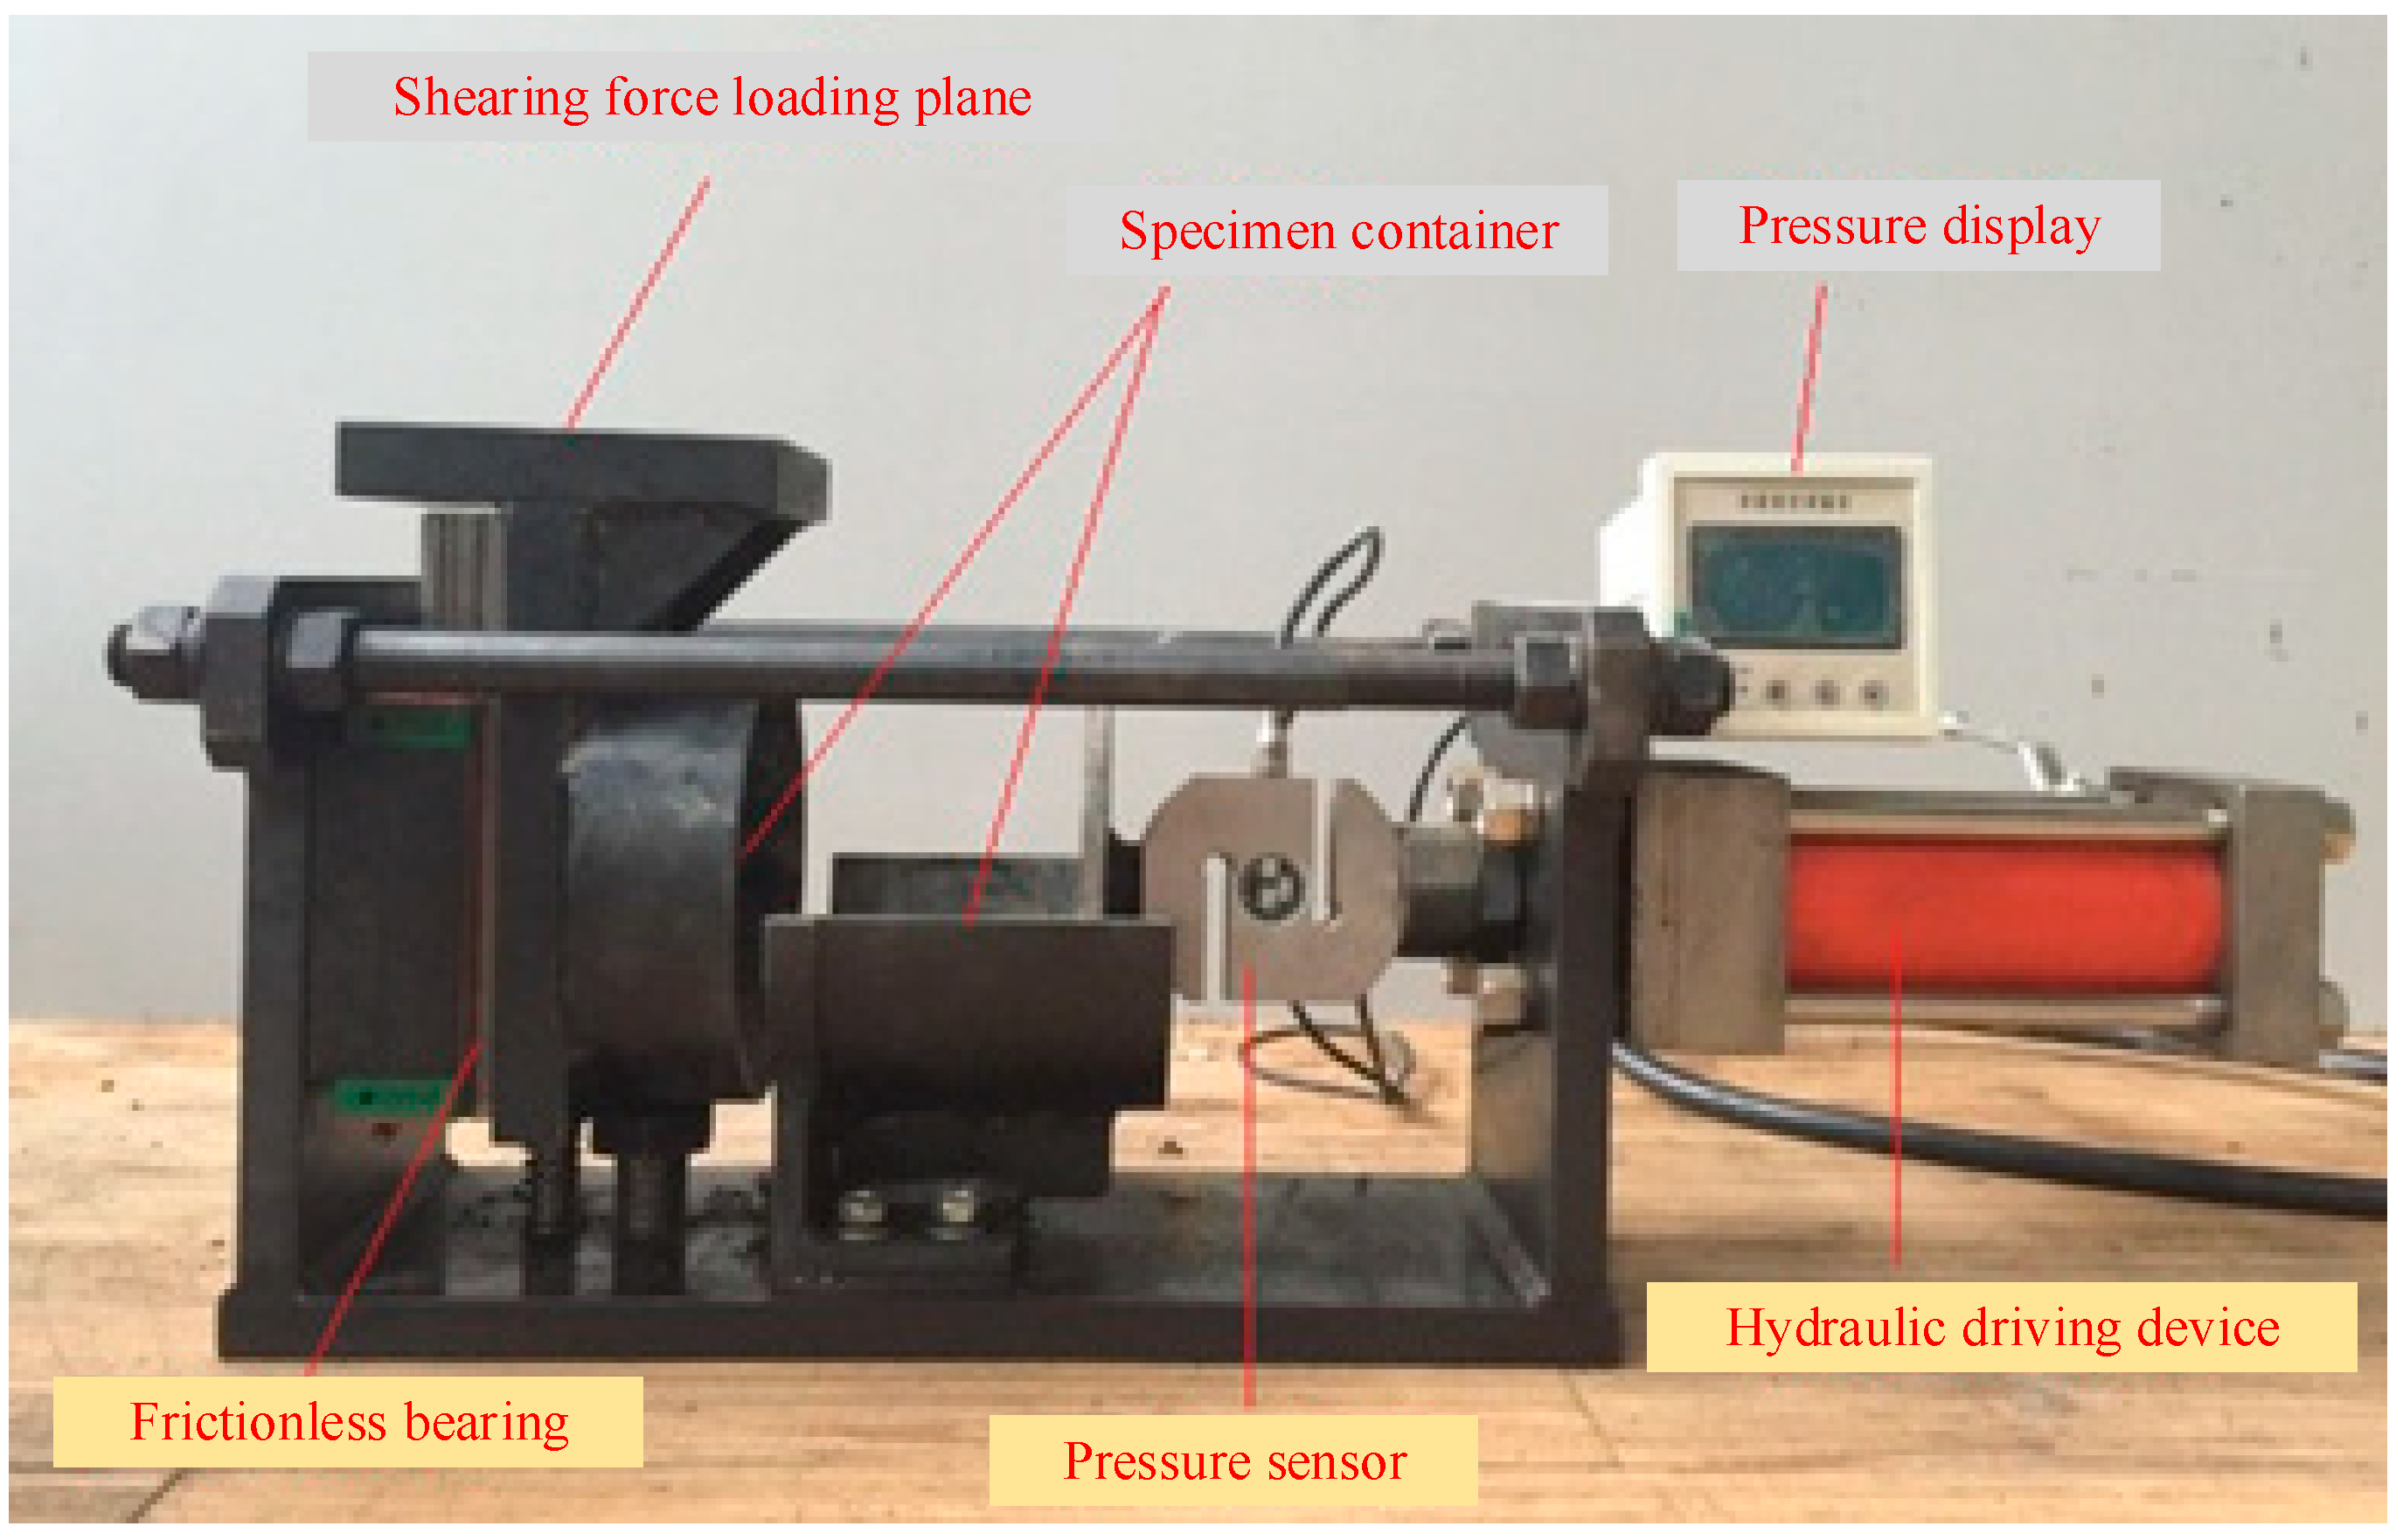
The shearing tester includes a specimen container consisting of a movable ring and a U-shaped pit (
Figure 6) to hold a 150 mm diameter cylinder specimen. The ring vertically shears the specimen when force is applied on the shearing force loading plane. The normal-direction force was applied using a hydraulic driving device monitored by a pressure sensor.
The shearing tester worked together with the Material Testing System (MTS), which provided the shearing force. MTS has an environmental chamber that controlled the test temperature. The specimens of diameter 150 mm were put in the tester, followed by the activation of a hydraulic driving device to apply a normal pressure, and then MTS applied force on the shearing force loading plane. The shearing rate was 2.5 mm/min. Three test temperatures were set at 0 °C, 20 °C, and 40 °C, representing low temperature, room temperature, and high temperature, respectively. In the shear test, the normal pressure was set at 0 MPa, 0.1 MPa, 0.3 MPa, 0.4 MPa, or 0.5 MPa. The shearing was done at the interface of concrete and Cape Seal, which has weaker shear strength than the interface of Cape Seal and base course.
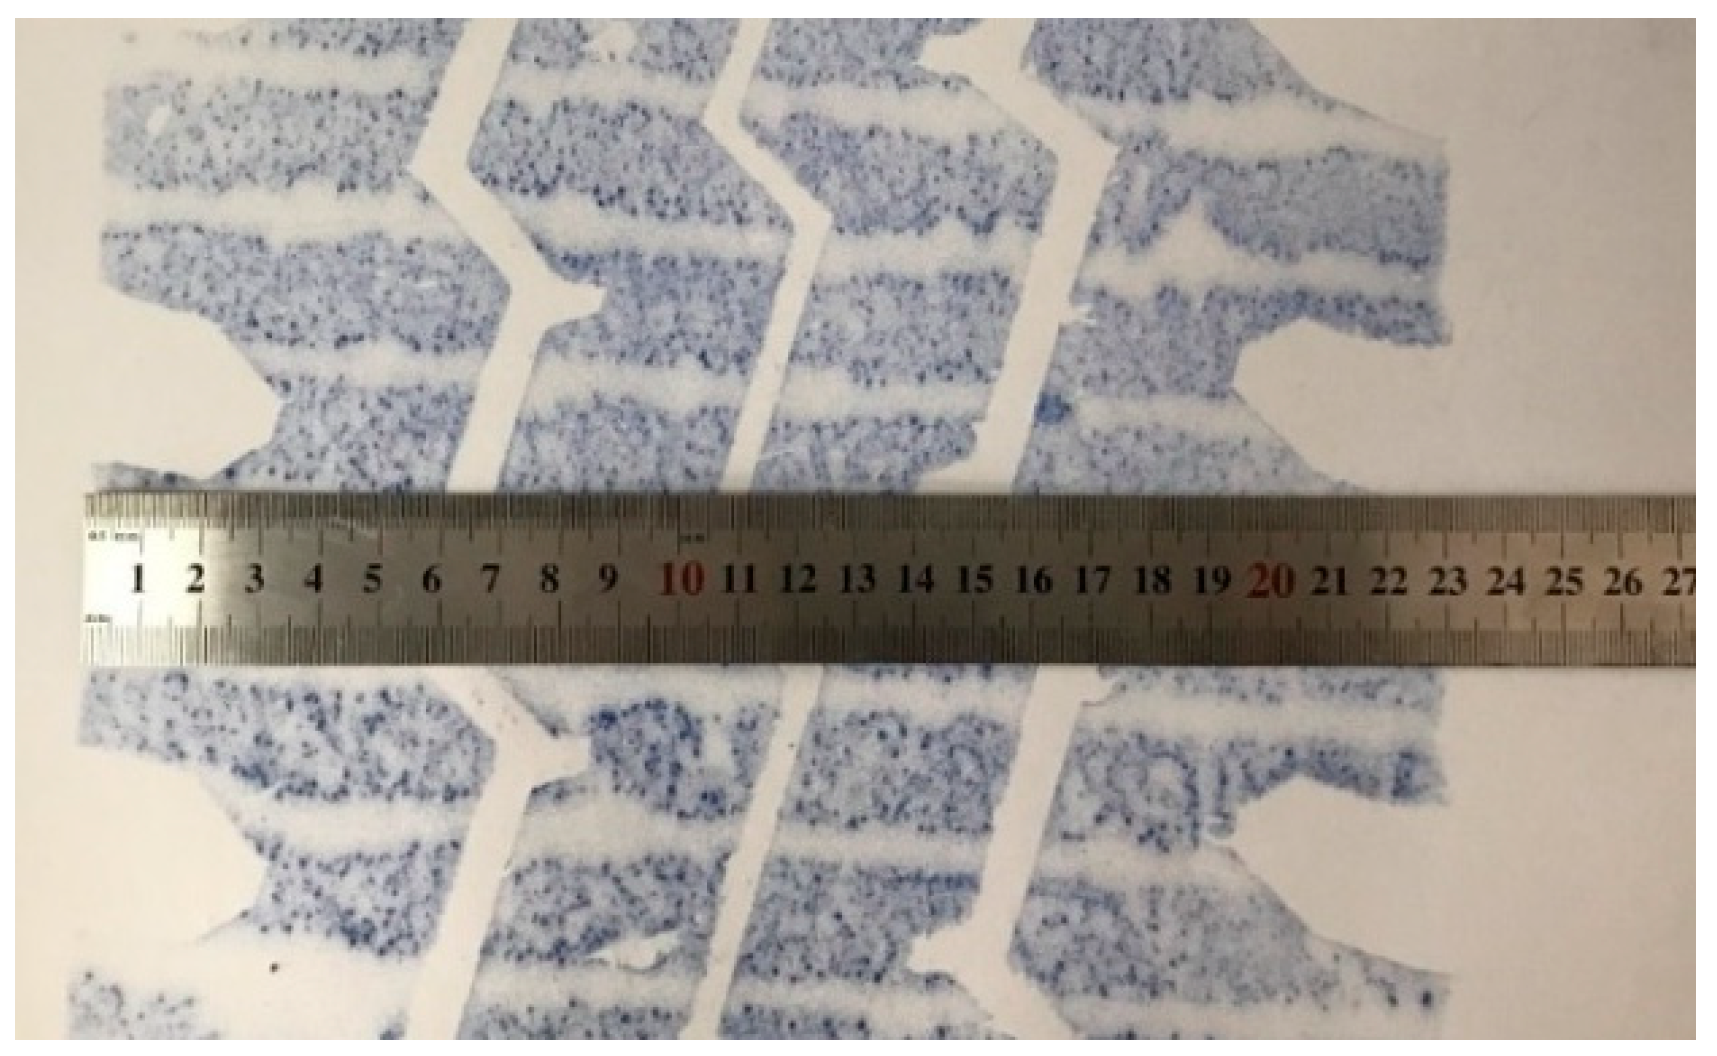
A 1.0 × 1.7 m pavement structure was built to get the samples for the shearing test. Cement (5% wt.) stabilized macadam 5 cm thick was laid and compacted by a handy mini roller, and then it was covered by a plastic film during curing. Water was sprayed to assist in the curing. Seven days later, the separator layer was laid on the cement-stabilized macadam. The amount of micro surfacing laid is 12 kg/m2. In the synchronous macadam layer, the amount of emulsified asphalt used was 1.0 kg/m2. The total coverage rate of macadam in the synchronous macadam layer is 60%. The total thickness of the separator layer was about 20 mm. As soon as the separator layer was finished, a 5 cm thick concrete layer was constructed. Core samples of diameter 150 mm were obtained after 28 days to use as the objects of the shearing test.
2.4. In Situ Erosion Test
The anti-erosion property is one of the essential properties of the pavement base layer because a good base layer should be able to resist the repetitive scouring of water without losing any materials. While most of the tests on the anti-erosion property of the base layer were done in the laboratory with self-developed equipment [
19], this study carried out an in situ scouring test on a newly built separator layer and a base layer without a separator layer at an airport under construction in China.
The water source was provided by a runway cleaner truck, which could produce a pressure of 0–10 MPa through a high-pressure water pipe. The pressure of scouring water is related to the deflection of the concrete slab, and literature [
20] shows the deflection of the slab can reach 5000 μm. According to [
3], the interlayer dynamic water pressure can get around 2.5 MPa. As there can be other negative factors in real scourings, such as super heavy aircraft load, the erosion test used the 10 MPa water pressure.
The scouring time
T is calculated by Equation (1):
where:
α is the maximum frequency of wheel track horizontal distribution;
β is the local rainfall days percentage;
Q is the total number of takeoffs and landings;
b is the longitudinal length of the airplane wheel path (m);
v is the taxiing speed of an airplane (m/s).
Based on the statistical database of the airport, the total number of takeoffs and landings is approximately 100,000. History climate database shows the rainfall days percentage of a year is about 0.4; the maximum wheel track horizontal distribution is 0.23 based on literature [
21]; the airplane wheel path is 0.5 m; the taxiing speed is 250 km/h, or 70 m/s. From Equation (1), the scouring time is calculated as 65 s.
Water was sprayed to the surface of the separator layer and the cement stabilized base layer to soak them 30 min before the scouring test.
3. Numerical Simulations
3.1. Model Description
Two FEMs was employed to investigate the two major mechanical influence attributed to the separator layer.
The first influence is the contraction stress caused by the drop in temperature in long slabs. In the early stage of concrete paving, the cumulative deformation caused by water-loss shrinkage is less than the deformation caused by the sudden drop in temperature. Therefore, the contraction stress caused by the sudden drop in temperature was studied. According to an investigation, the daily temperature difference in East China varies between 0 and 15 °C. A sudden temperature drop of 10 °C was considered in the FEM model. The test results of elastic modulus and the contact property at 20 °C were used.
The second influence is the stress in concrete under aircraft load. The difference with or without Cape Seal was compared. Besides, a void beneath the slab was set up to show the advantage of using Cape Seal. The simplified rectangular void was employed at the slab edge, whose length and width are 5 m and 0.3 m. The square void was employed at the slab corner, whose edge length is 1.5 m. The depth of voids was neglected.
The basic pavement structure and properties of materials are shown in
Table 4. In the first model, a single slab was used to investigate the influence of temperature on long slabs. In the second model, 3 × 3 = 9 slabs were used to study the mechanical characteristics of pavement, and B737-800 was employed as the representative aircraft. The ground contact pressure of the wheels was set as the tire pressure of the main landing gear 1.47 MPa, and the loading area for each wheel was simplified to a rectangle of 0.431 × 0.297 m.
Figure 7 shows the distribution of B737-800 wheels and also shows the loading location at the middle slab. The loading location was proved to cause the greatest maximum principal stress at the bottom of the concrete slab in our trial simulations. In both of the FEM models, two input parameters, the elastic modulus of the separator layer and the contact properties with the concrete slab, were obtained from experiments in 2.1 and 2.2, respectively. Joints were simulated by spring unit to keep the joint at a certain stiffness [
22], and the joint stiffness is distributed among nodes at joints. The mesh type in the simulation is incompatible mode eight-node brick element (C3D8I) under the element size of 0.1 m. The boundary condition is zero displacements at the side of each layer. The structure of the pavement for the second model is shown in
Figure 7. The structure of the first model is a simplified form of the second model because it involves one long slab instead of nine square slabs, and the airplane load is not applied, so the model is not shown here.
3.2. Resilient Modulus of Separator Layer
The stress and strain were calculated by the difference of peak and valley of the force-time curve and displacement-time curve. Then the resilient modulus of micro-surfacing was calculated.
The deformation of the separator layer consists of the deformation of the synchronous macadam layer and the micro-surfacing layer. In this study, the strain of the micro-surfacing is regarded as the strain of the whole separator layer because the limestone macadam has a modulus greater than 20 GPa, and the synchronous macadam layer is only 1/4 of the separator layer. Therefore, the modulus of the separator layer was calculated based on the modulus of micro-surfacing (
Table 5).
It can be seen in
Table 5 that the modulus varies between 176 MPa and 1010 MPa, less than the regular asphalt mixture. The separator layer show more plasticity at high temperature and low frequency, and more elasticity at low temperature and high frequency.
3.3. Contact Characteristic
The results of the shearing test without normal pressure are shown in
Figure 8. It can be seen that at 0 °C, the curve has a peak shearing force, while at 20 °C and 40 °C, there is no peak. The shear force-relative slide relationship under normal stress at 20 °C when the separator layer is present is shown in
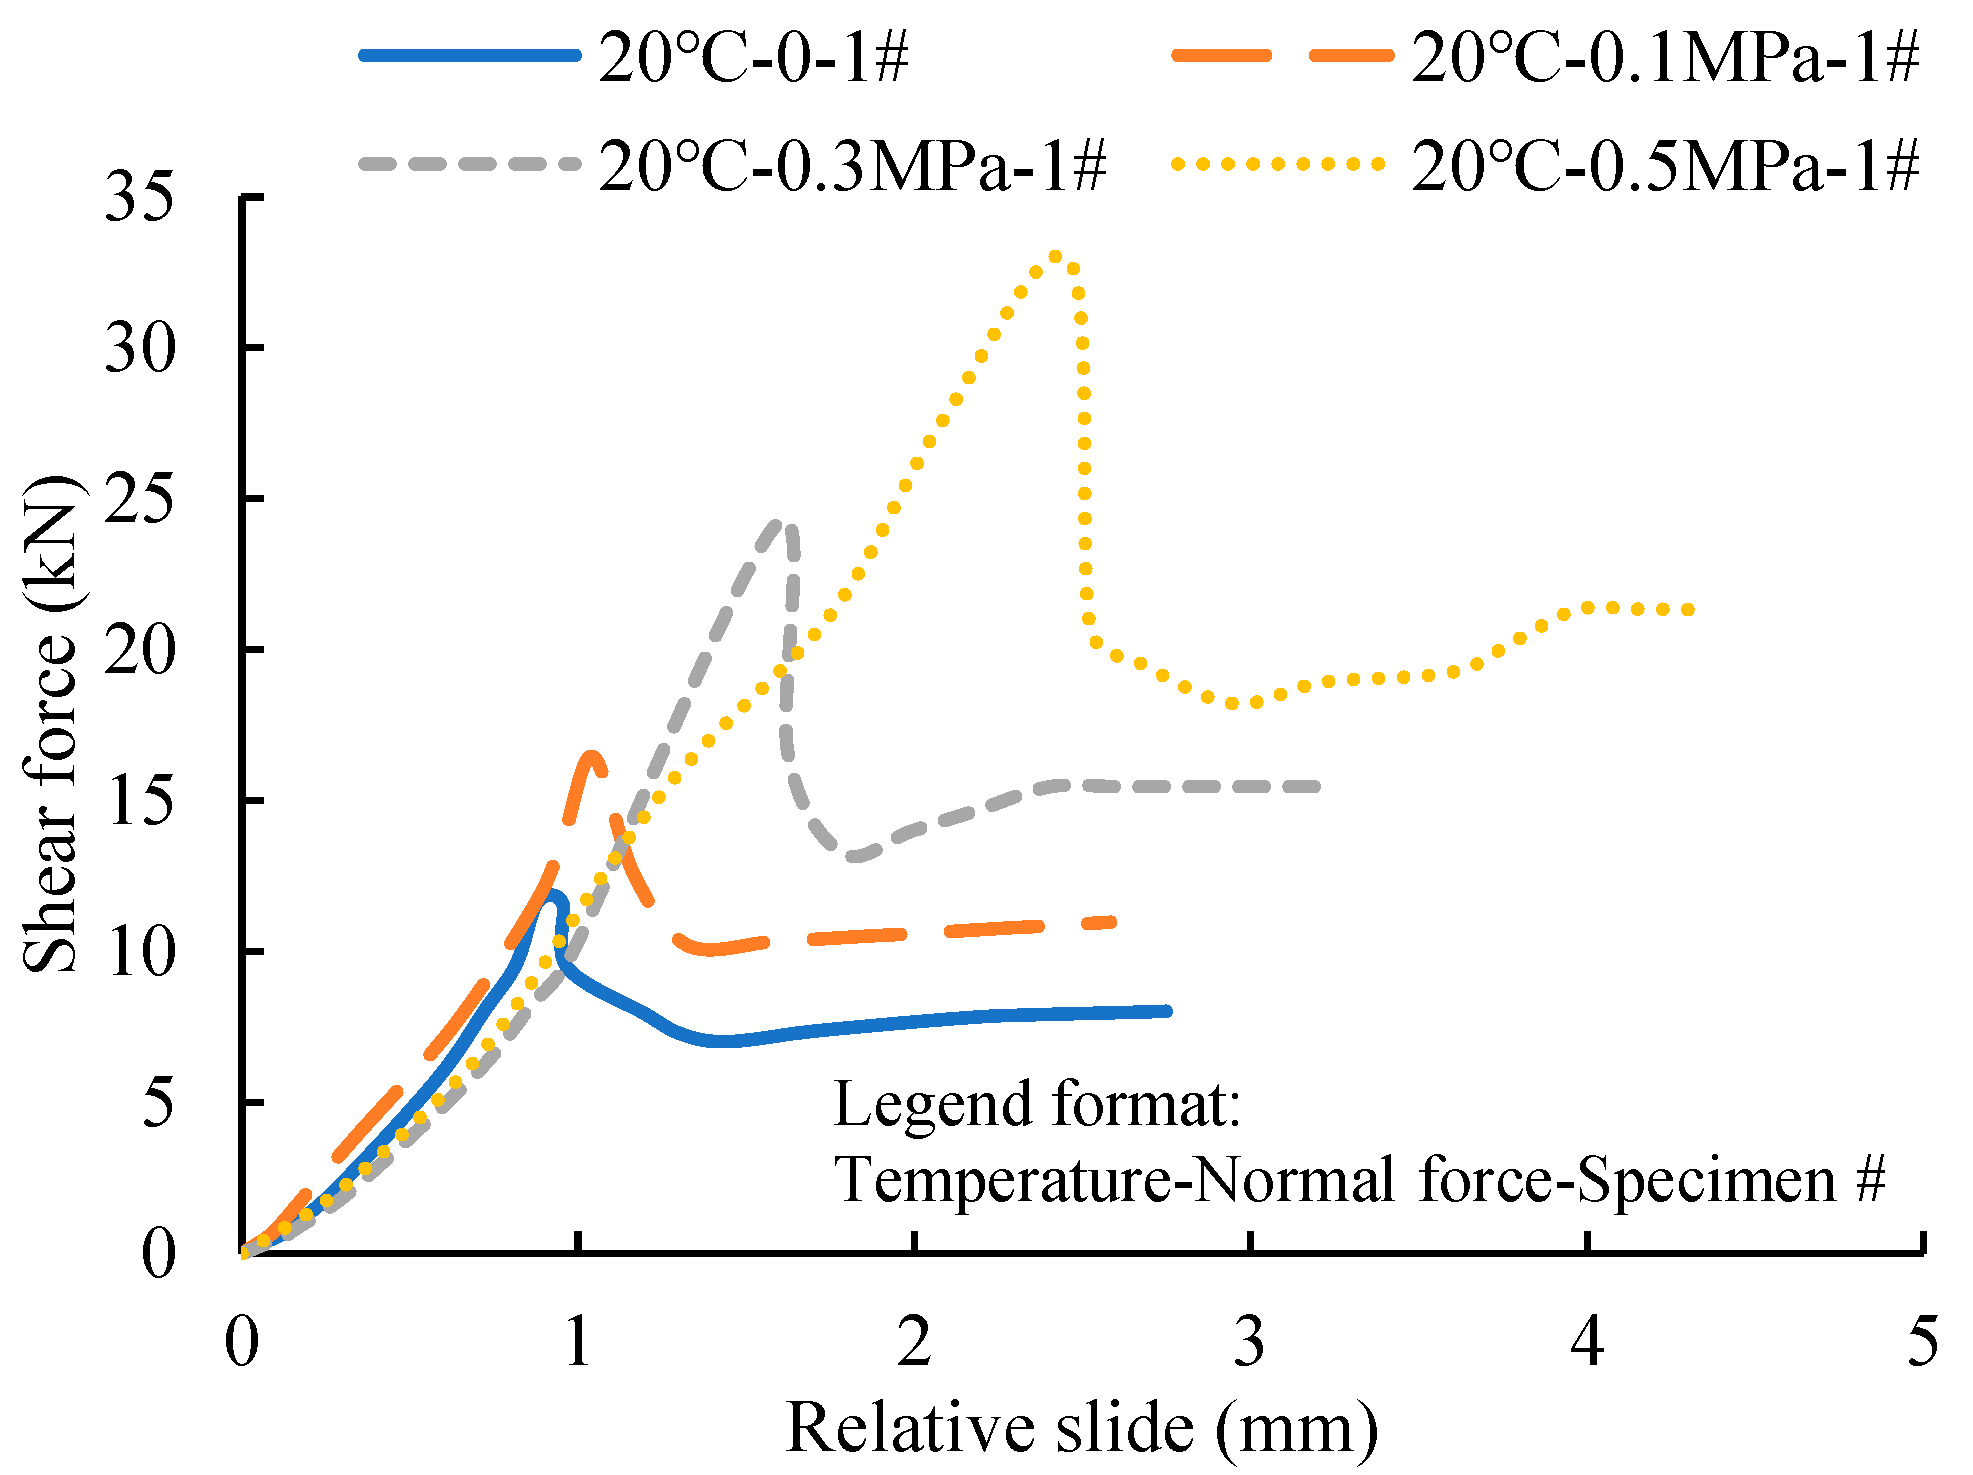
Figure 9. The normal stress does not obviously influence the slope in the elastic range but has a great influence on the maximum shear force. The shearing characteristic without a separator layer is shown in
Figure 10. It can also be seen that the slope of the curves is not affected much by normal stress, but the shear force at the peak and ultimate state is influenced. By comparison of
Figure 9 and
Figure 10, it is concluded that the separator layer greatly weakens the bond between the concrete and the underlying layer.
If only considering the shearing relationship’s last stage (stable status) in
Figure 9, the shear stress shows a linear increase with the increase of normal stress, which is a typical Mohr-Coulomb constitutive characteristic [
23]. The relationship between shear stress (
SS) and normal stress (
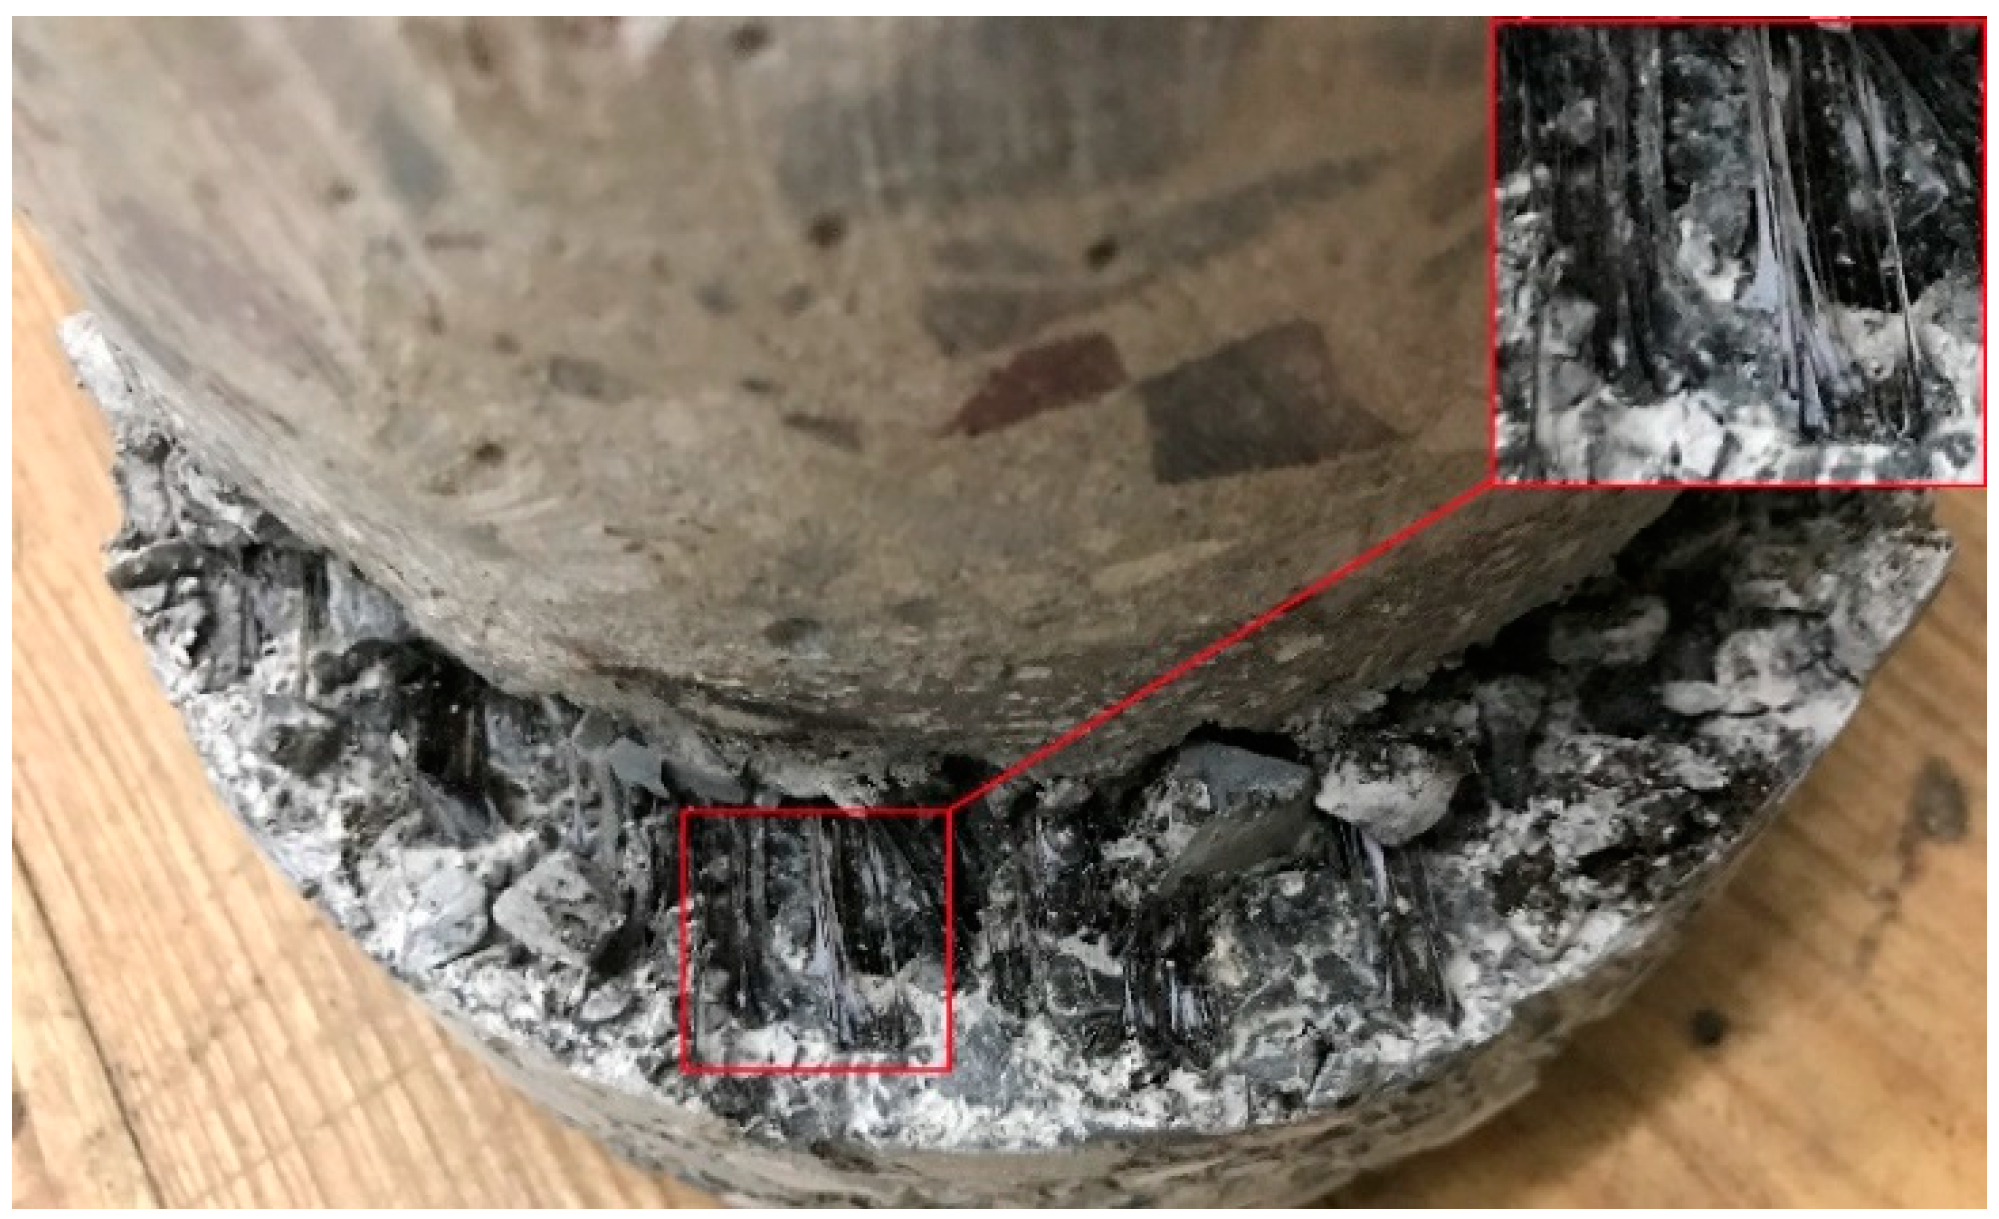
SN) is shown in Equations (2) and (3). The equations show the shear force between the separator layer and concrete consists of two parts. One part is the Coulomb friction proportional to normal pressure. The other part is considered provided by the tension of asphalt. The picture of the fracture interface (
Figure 11) shows the contribution of asphalt coherence to the total shear force.
Scholars proposed hypotheses to develop the constitutional property of the interface of pavement layers, such as the non-thickness linkage type element [
24] and thin layer element [
25]. Though these constitutional models can realize multiple functions such as slip, non-slip, debonding, and rebonding, they involve complicated control over nodes with programs and difficult to get convergent results in common FEM software.
In this study, the interlayer shearing constitutional property is simplified based on the shear force-relative slide curve so that the shearing characteristic is not oversimplified but can be integrated into the FEM in ABAQUS. The shear force-relative slide is induced to two groups, “with peak” or “without peak,” shown in
Figure 12 (the dash lines are the measured curves). The “with peak” group is simplified to Form 1, and the “without peak” group is simplified to Form 2, represented by the solid line.
It can be seen in
Figure 12 that the two forms of curves both consist of two stages, the “elastic stage” and the “stable stage.” The
ks in the elastic stage can be obtained from the slope of the tested curves. In the stable stage, the
ks is 0, and the shear stress is a fixed number. Another important parameter is the turning point determining whether the shearing relationship has reached a stable state. For Form 1, the turning point is the shearing force of the peak, while for Form 2, the turning point is the relative slide at the intersection of the elastic state and stable stage. Overall, the constitutional relationship was established using
ks, turning point values, and stable shear force. To simplify the model, the
ks in the elastic stage under different normal stress is taken as the same value.
The simplified shearing constitutional model was defined and input with a ‘FRIC’ subroutine provided by ABAQUS. The interaction of shear stress in X and Y directions in one plane is neglected. Its constitutional relation is shown in Equation (4).
where Δτ is the interlayer shear stress increment (Pa);
ks is the interlayer shear stiffness; Δγ interlayer relative displacement increment.
FRIC subroutine enables the determination of the stage while calculating. When the turning point is not reached, the shearing properties at the elastic stage are employed, but when the turning point is reached, the shearing properties are switched to the stable stage.
4. Validation of FEM Simulation
The mechanical response of the pavement structure under load was monitored in an airport in East China during a flight area expansion project to validate the simulation in this study.
The structures under test include two cement pavements, one with the composite separator layer and the other with no separator layer. The size of the slab is 5 m × 5 m. The elastic modulus of concrete and base course and the reaction modulus of subgrade were obtained from the airport’s test report, which are 34 GPa, 8.5 GPa, and 87.4 MN/m3.
The air temperature during the in-situ test was 32 °C. The temperature at the bottom of the pavement slab is closer to 20 °C, so the modulus value of the separator at 20 °C was used. The Poisson ratios of the materials were the same as stated earlier in this paper. The contact properties were also modeled with the method previously stated. The joint stiff was set as 1000 MN/m2.
A number of BGK-FBG-4200T fiber grating strain sensors were embedded in the concrete to get the strain along the longitudinal direction. The sensors were embedded at the center of the longitudinal joint and the corner of the slabs. The vertical position of the sensors was 3.5 cm to the top or bottom due to the size of the sensors. A paving truck was used to apply load on the slab. The rear axial of the biaxial double wheel was employed, weighing 94 kN. The wheel load was applied right above the strain gauges. The size of the wheel mark was measured and approximated to a square of 0.2 m × 0.2 m (seen in
Figure 13).
The FEM results were also obtained based on the load and pavement parameters. Strains at 3.5 cm from the top and bottom were extracted as the strain of the slab top and bottom to be consistent with the position of the embedded strain gauges.
A comparison of the measured and calculated strain is shown in
Table 6. It can be seen that the FEM results are close to the measured values. The maximum relative error with the existence of Cape Seal is within 7.5%, and that without the layer is within 8.5%. Therefore, the modeling method can be considered reasonable and feasible.
Table 6 also shows that the separator layer will not significantly affect the mechanical response of the concrete slab. Both measured data and simulated data prove this point. The benefit of the separator layer is not to improve the mechanical response of a normal-functioning pavement structure but to ensure the life of pavement when the pavement has some defects, such as voids beneath the slab or weakened load transfer at joints. Furthermore, the reduction of deterioration under temperature variation is another advantage.
5. Results and Analysis
5.1. Influence of Separator Layer on the Contraction Stress before Joint Sawing
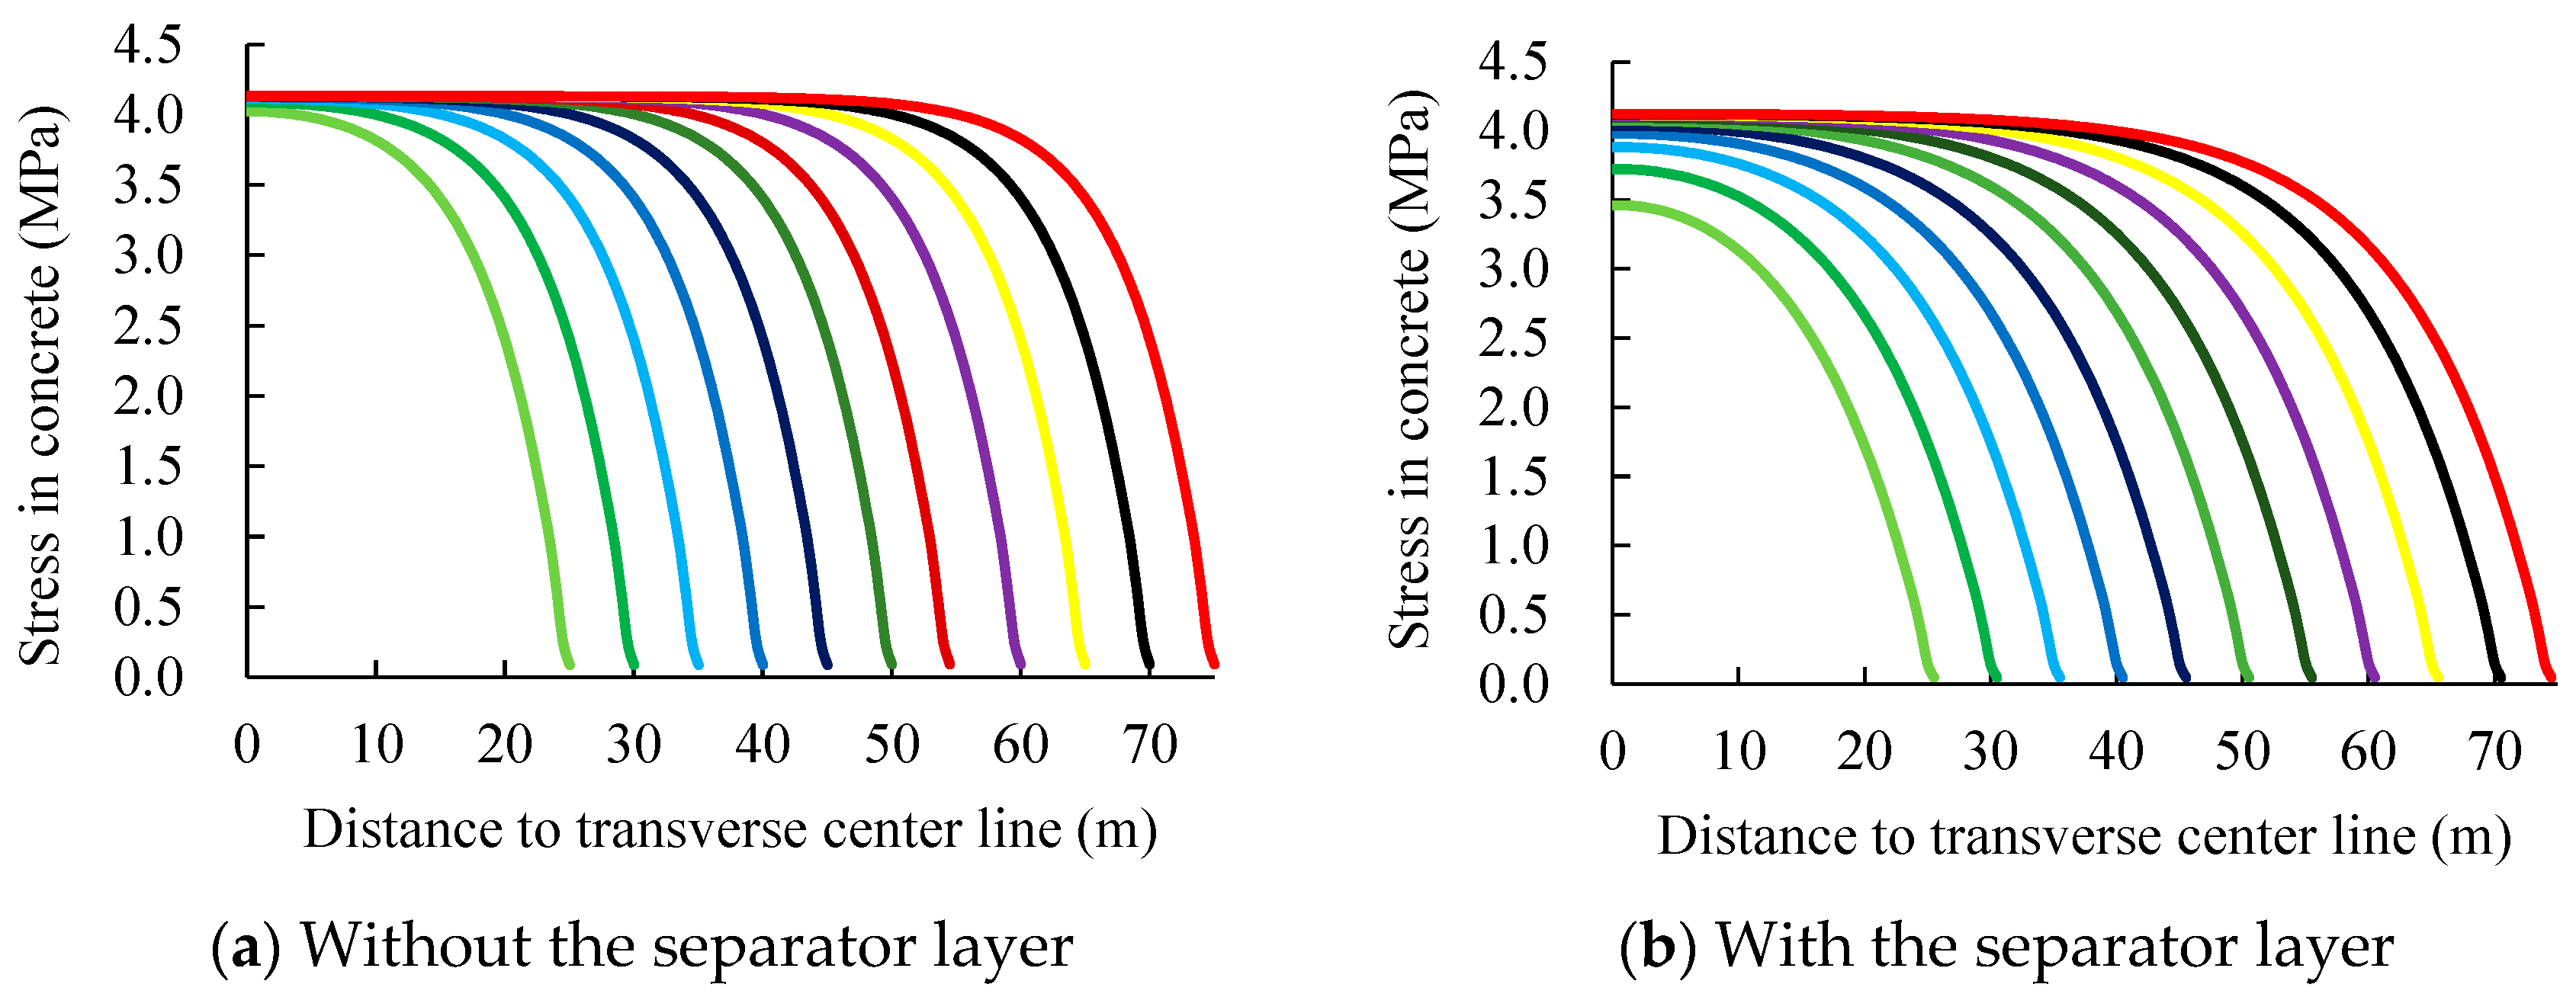
The contraction stress in long concrete slabs attributed to a sudden drop of 10 °C in temperature was calculated, shown in
Figure 14. The one-time paving length of the slab was set as 50 m~150 m. The structure is symmetrical, so only half was used in FEM. The mechanical properties at 20 °C were used.
Yuan [
26] measured the strength of the pavement of 35 airports in China, showing that the average tensile strength of concrete is 4.07 MPa. It can be seen in
Figure 14a that when the separator layer is not laid, the maximum contraction stress of the concrete is greater than 4.07 MPa, no matter how long the slab is. Meanwhile, the greater the paving length is, the more possible is concrete getting crack. When the separator layer is present, as seen in
Figure 14b, the maximum tensile stress in the concrete is less than 4 MPa when the length of the surface layer is less than 80 m, which can eliminate the risk of concrete cracking.
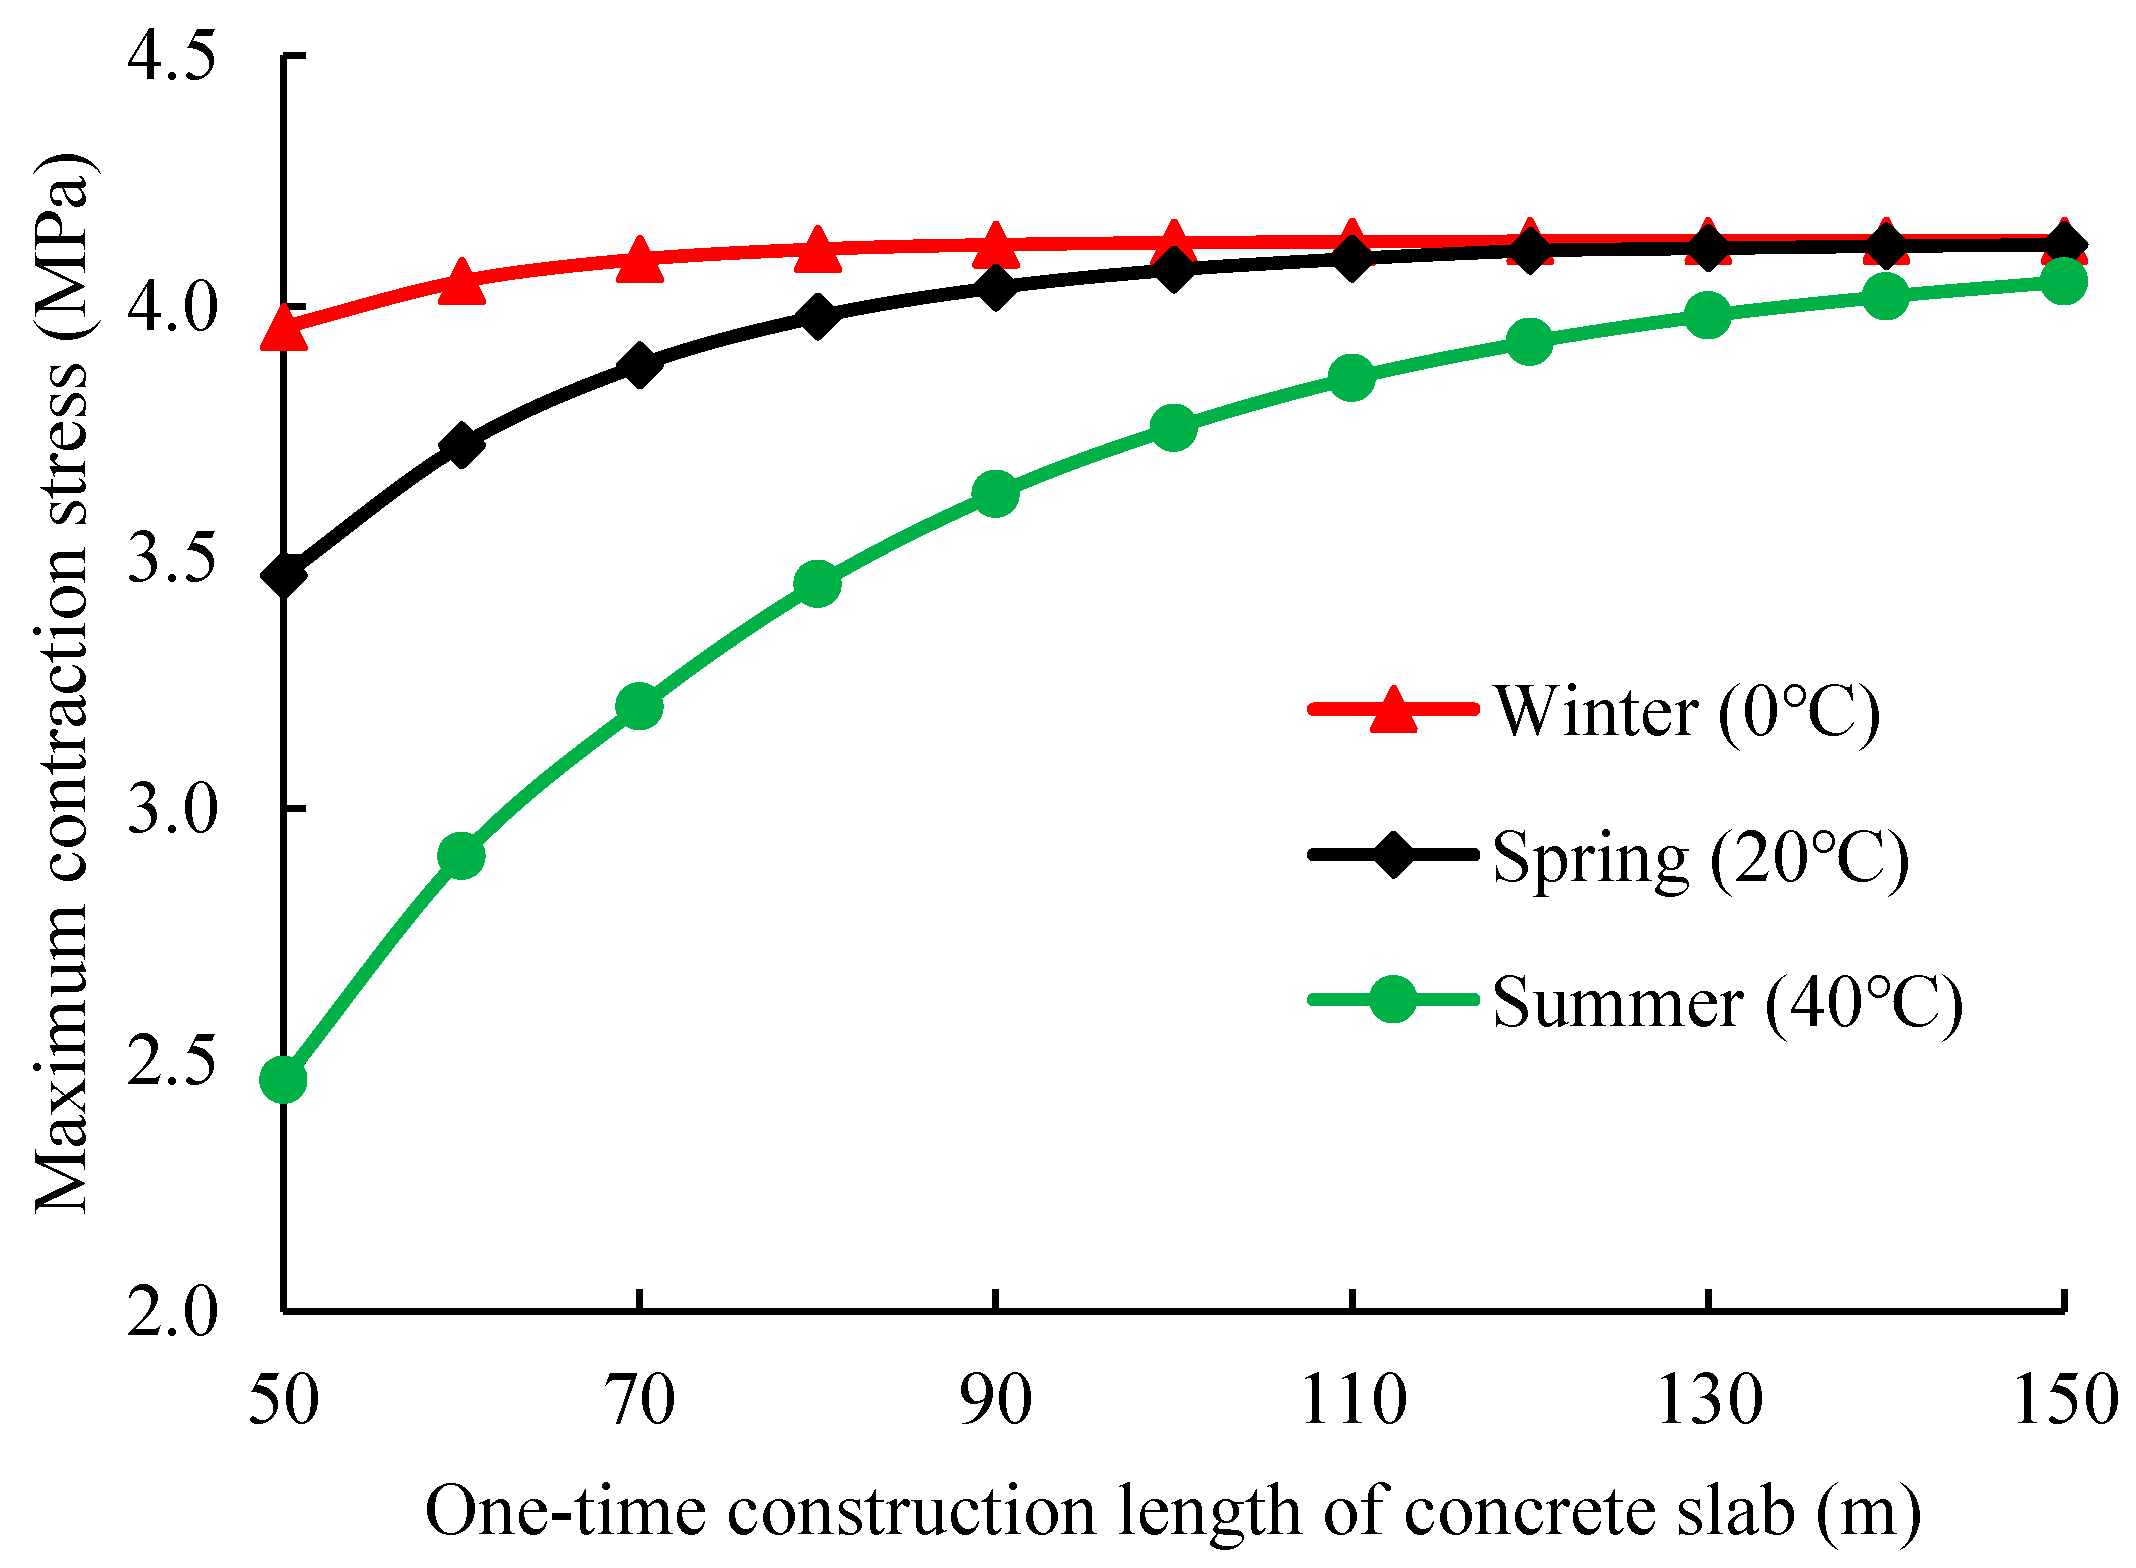
It is known in 3.3 that the shearing characteristic between concrete and the separator layer is quite different when the temperature changes. The influence of temperature was investigated on the mechanical response of concrete under a sudden temperature drop of 10 °C. The result is shown in
Figure 15.
Figure 15 shows lower temperatures cause a stronger interlayer bond between the separator layer and concrete and a more significant influence by paving length. At low a temperature in winter (0 °C), the risk of cracking appears when the construction length is greater than 50 m; in spring/autumn, the risk occurs at 80 m; in summer, the risk shows when the length is larger than 130 m. In summary, if the concrete joints cannot be sawed in a timely manner, the maximum paving length should be adjusted based on seasons to avoid the premature cracking of concrete.
5.2. Results of In Situ Erosion Test
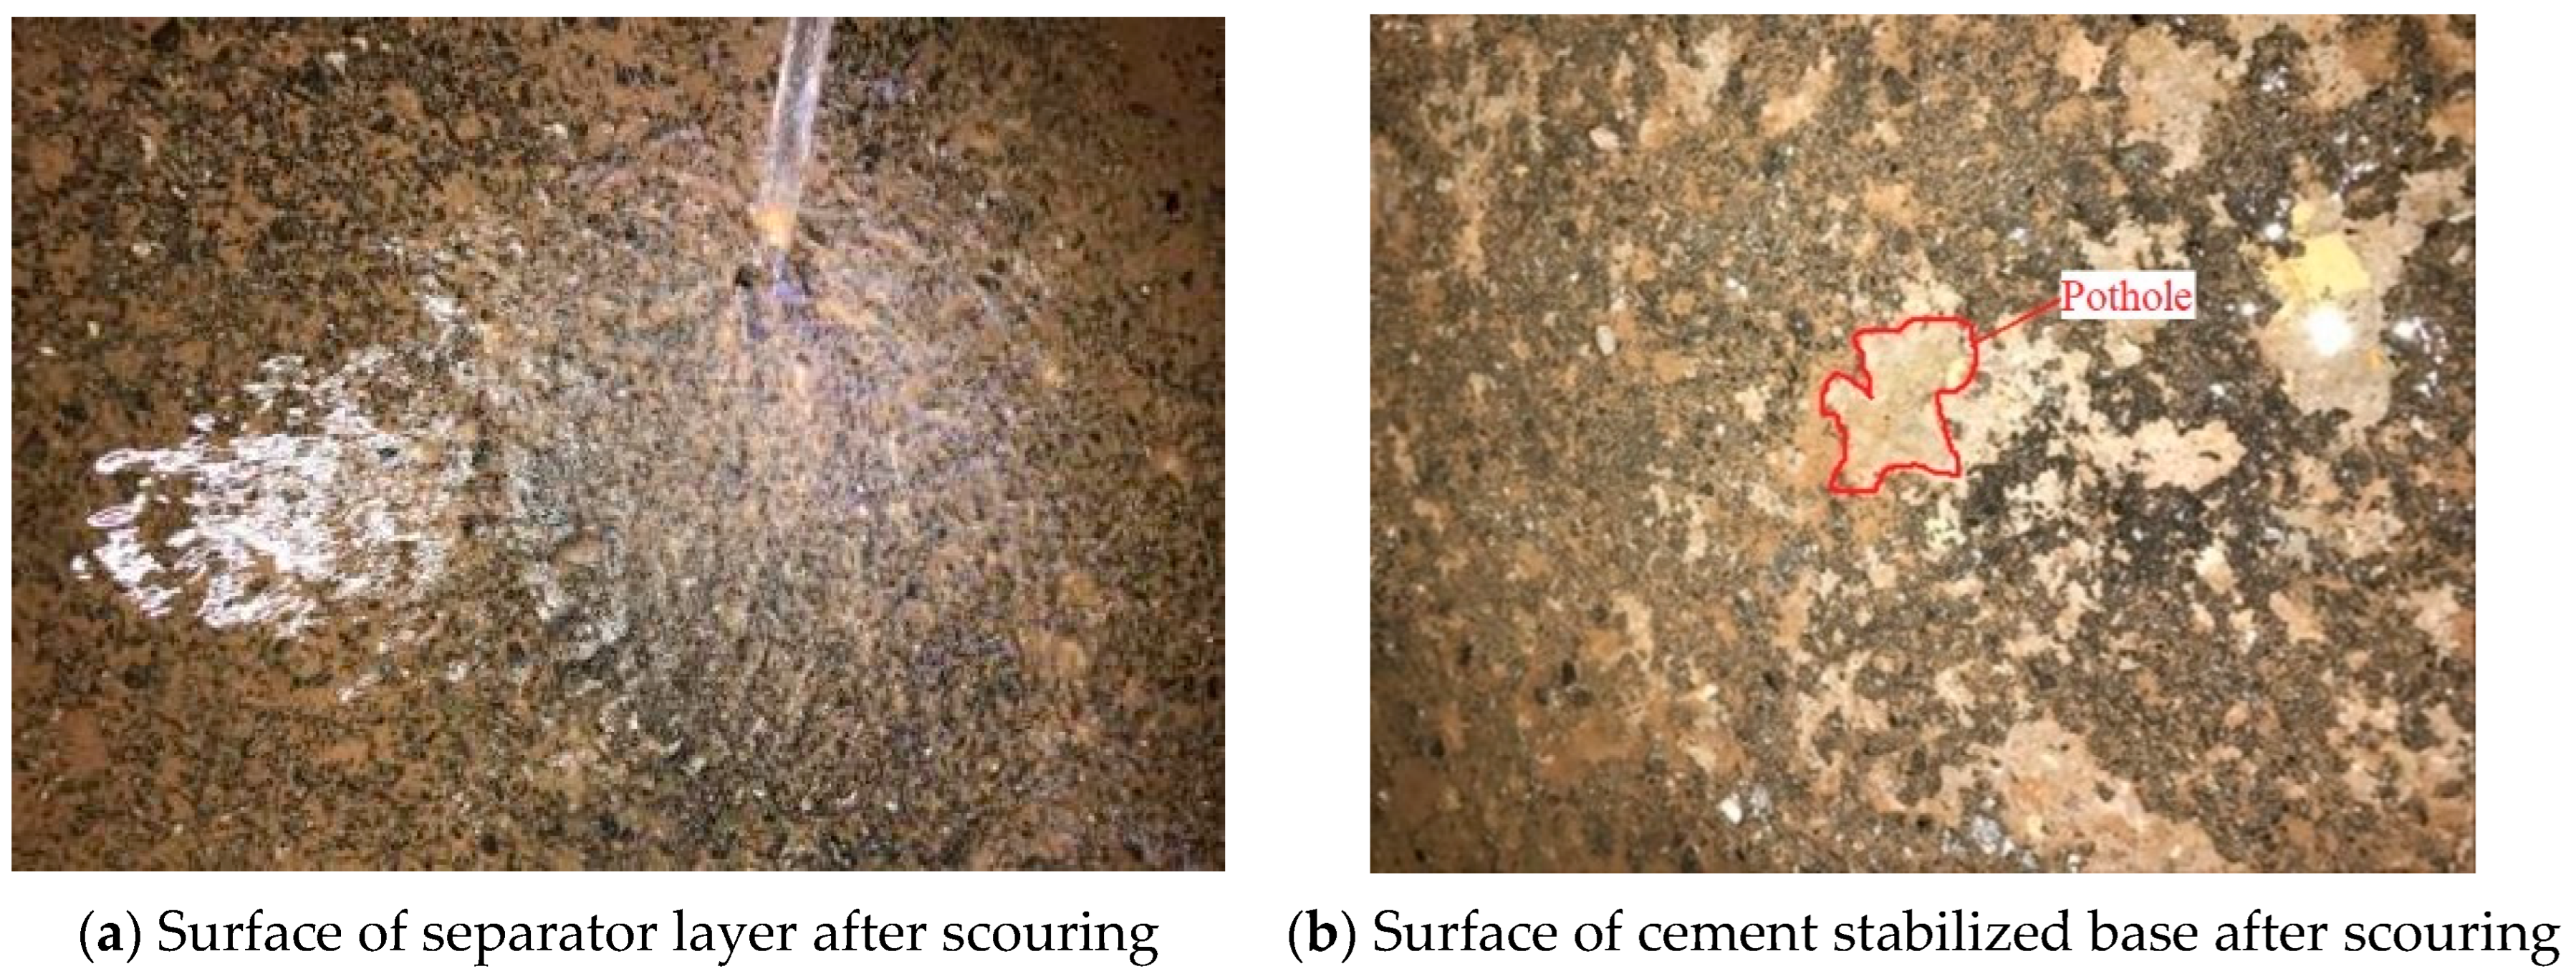
The results of in situ erosion test are shown in
Figure 16. After scouring, the separator layer’s surface does not show any sign of material loosening or being lost. On the contrary, the cement-stabilized base has an apparent pothole of about 5 mm deep. This comparison indicates that the separator layer can withstand dynamic water pressure, while the surface of the cement-stabilized base will get exfoliated. Applying a separator layer on cement stabilized base can make the whole pavement structure more resistant to pumping or more severe failure.
5.3. Benefit of Separator Layer When Voids Occur
Overall, the FEM results show that the separator layer makes the tensile stress at the bottom of the slab increase only by 2.1–3.4%, indicating that the layer produces very limited influence on the stress of the slab when there is no void beneath the slab. However, if there are voids beneath the slab, the stress in the slab increases significantly. Voids beneath the slab are very common in airports. According to a survey on the pavement condition of 56 airports in China [
27], only 5.36% of airports have a void rate of less than 10%; 69.64% of airports have a void rate of greater than 30%; 28.57% of airports have void rate larger than 60%.
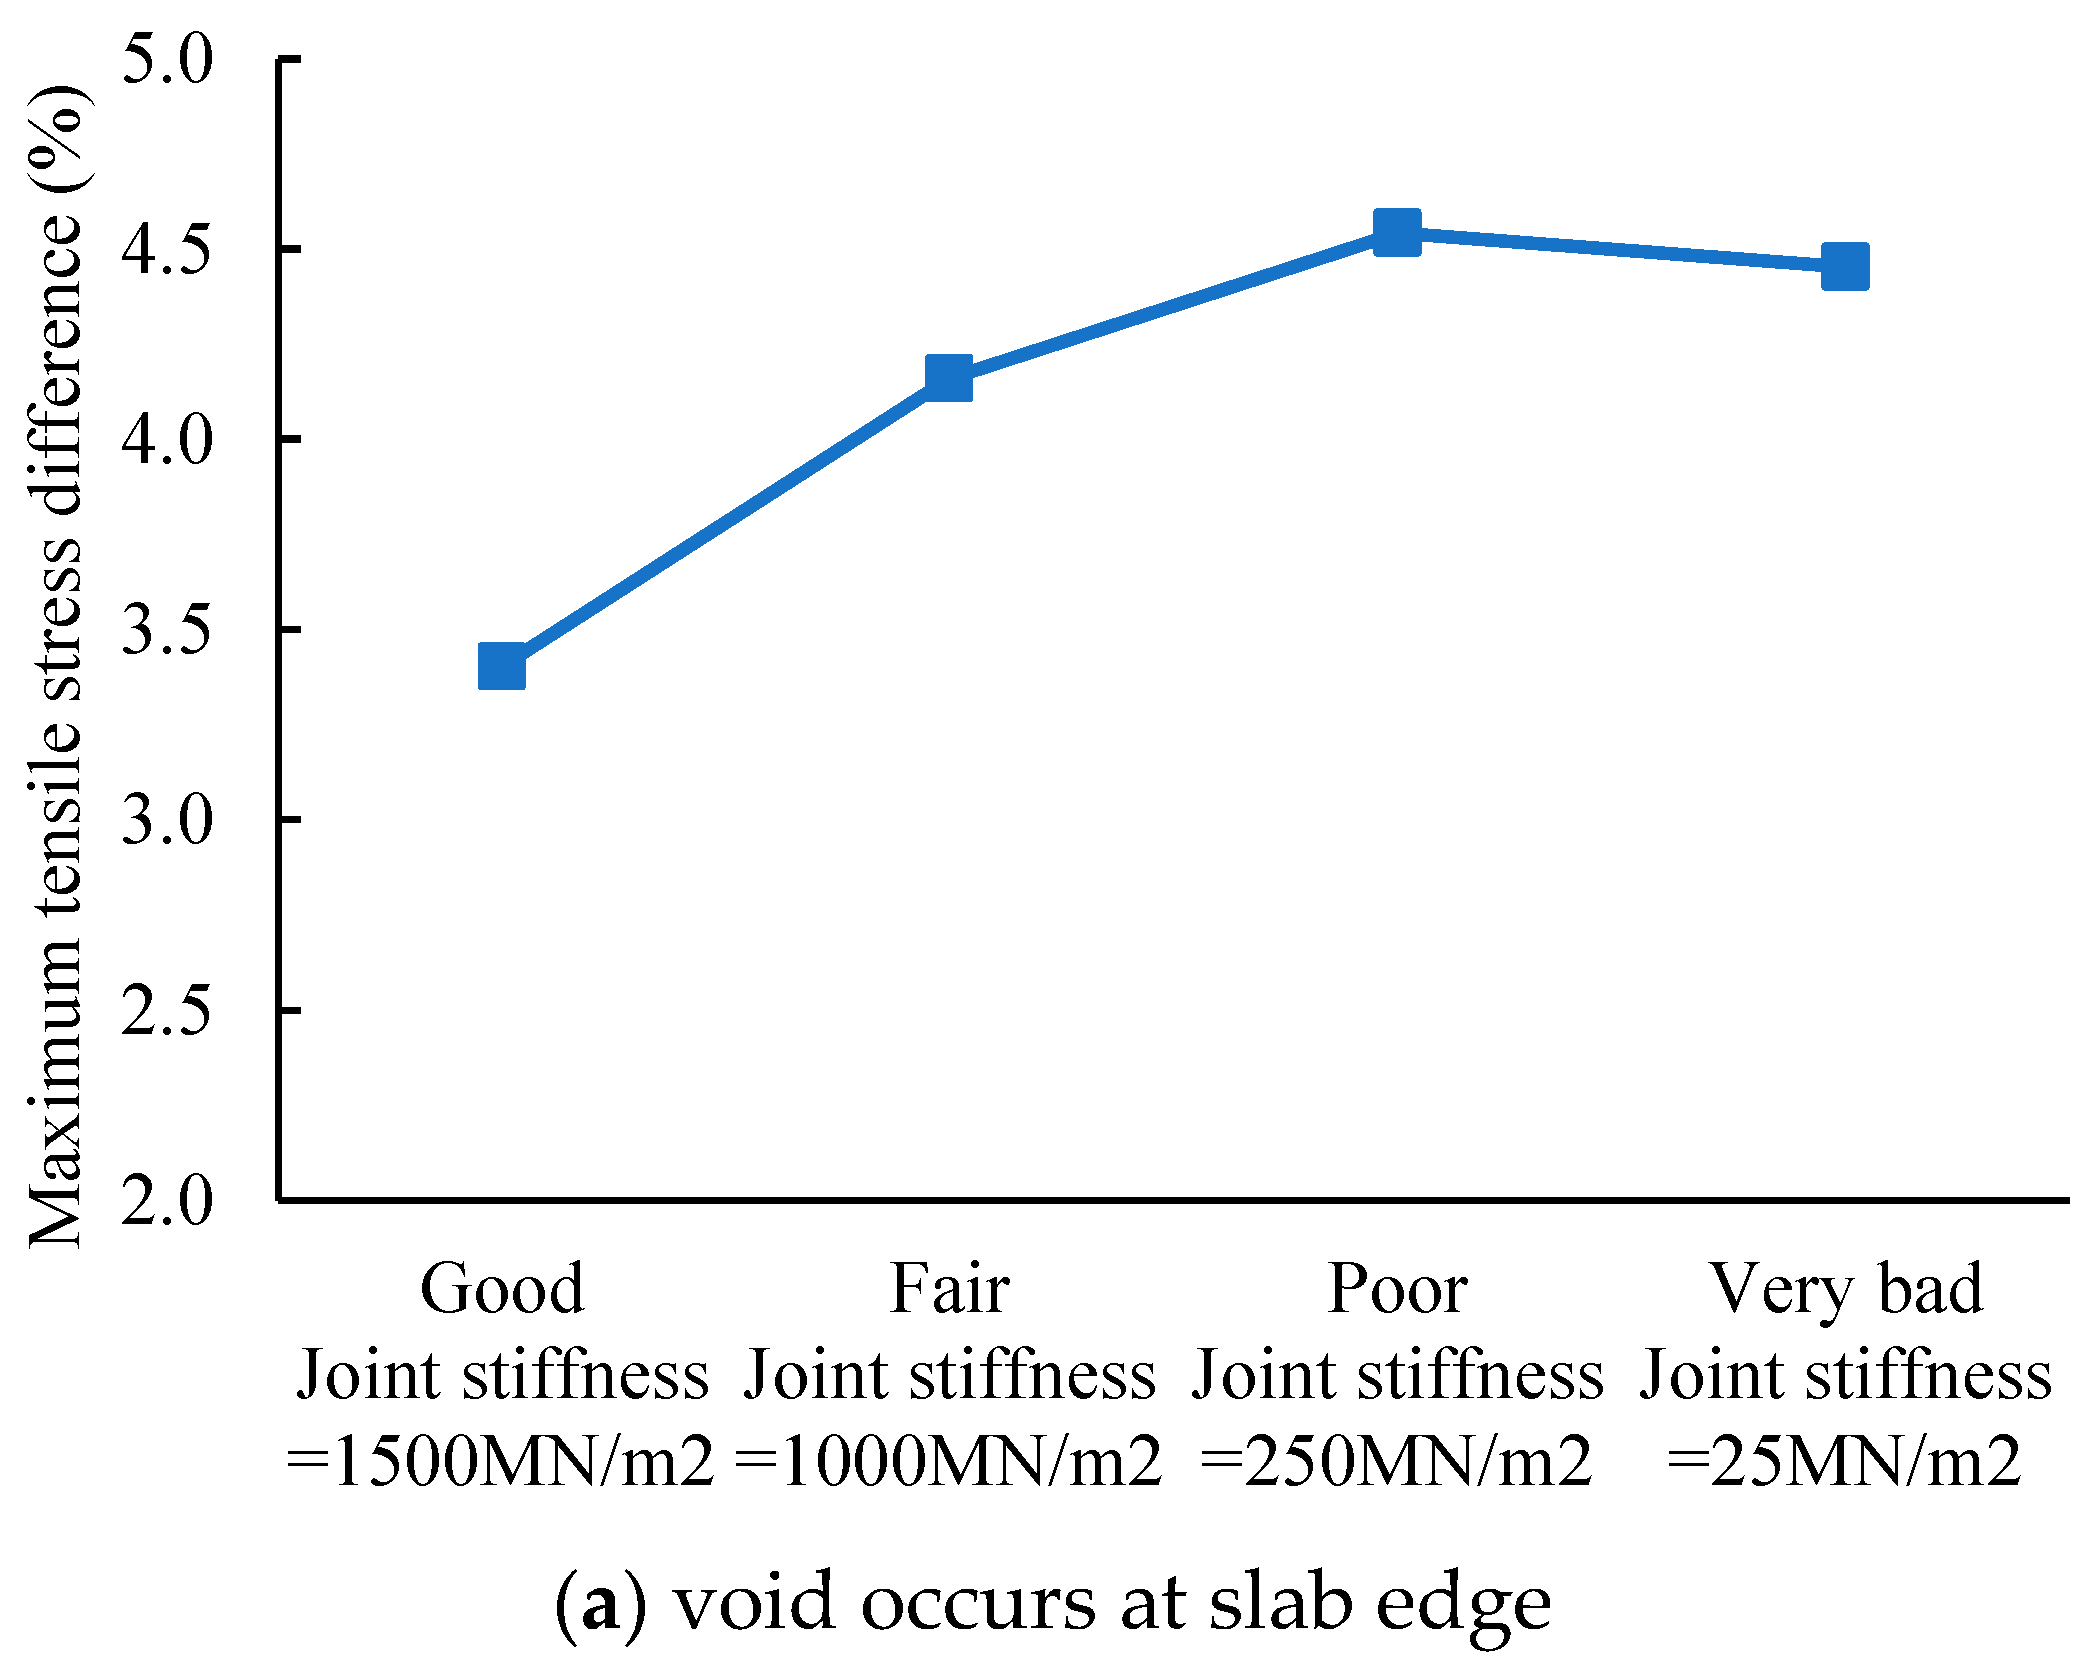
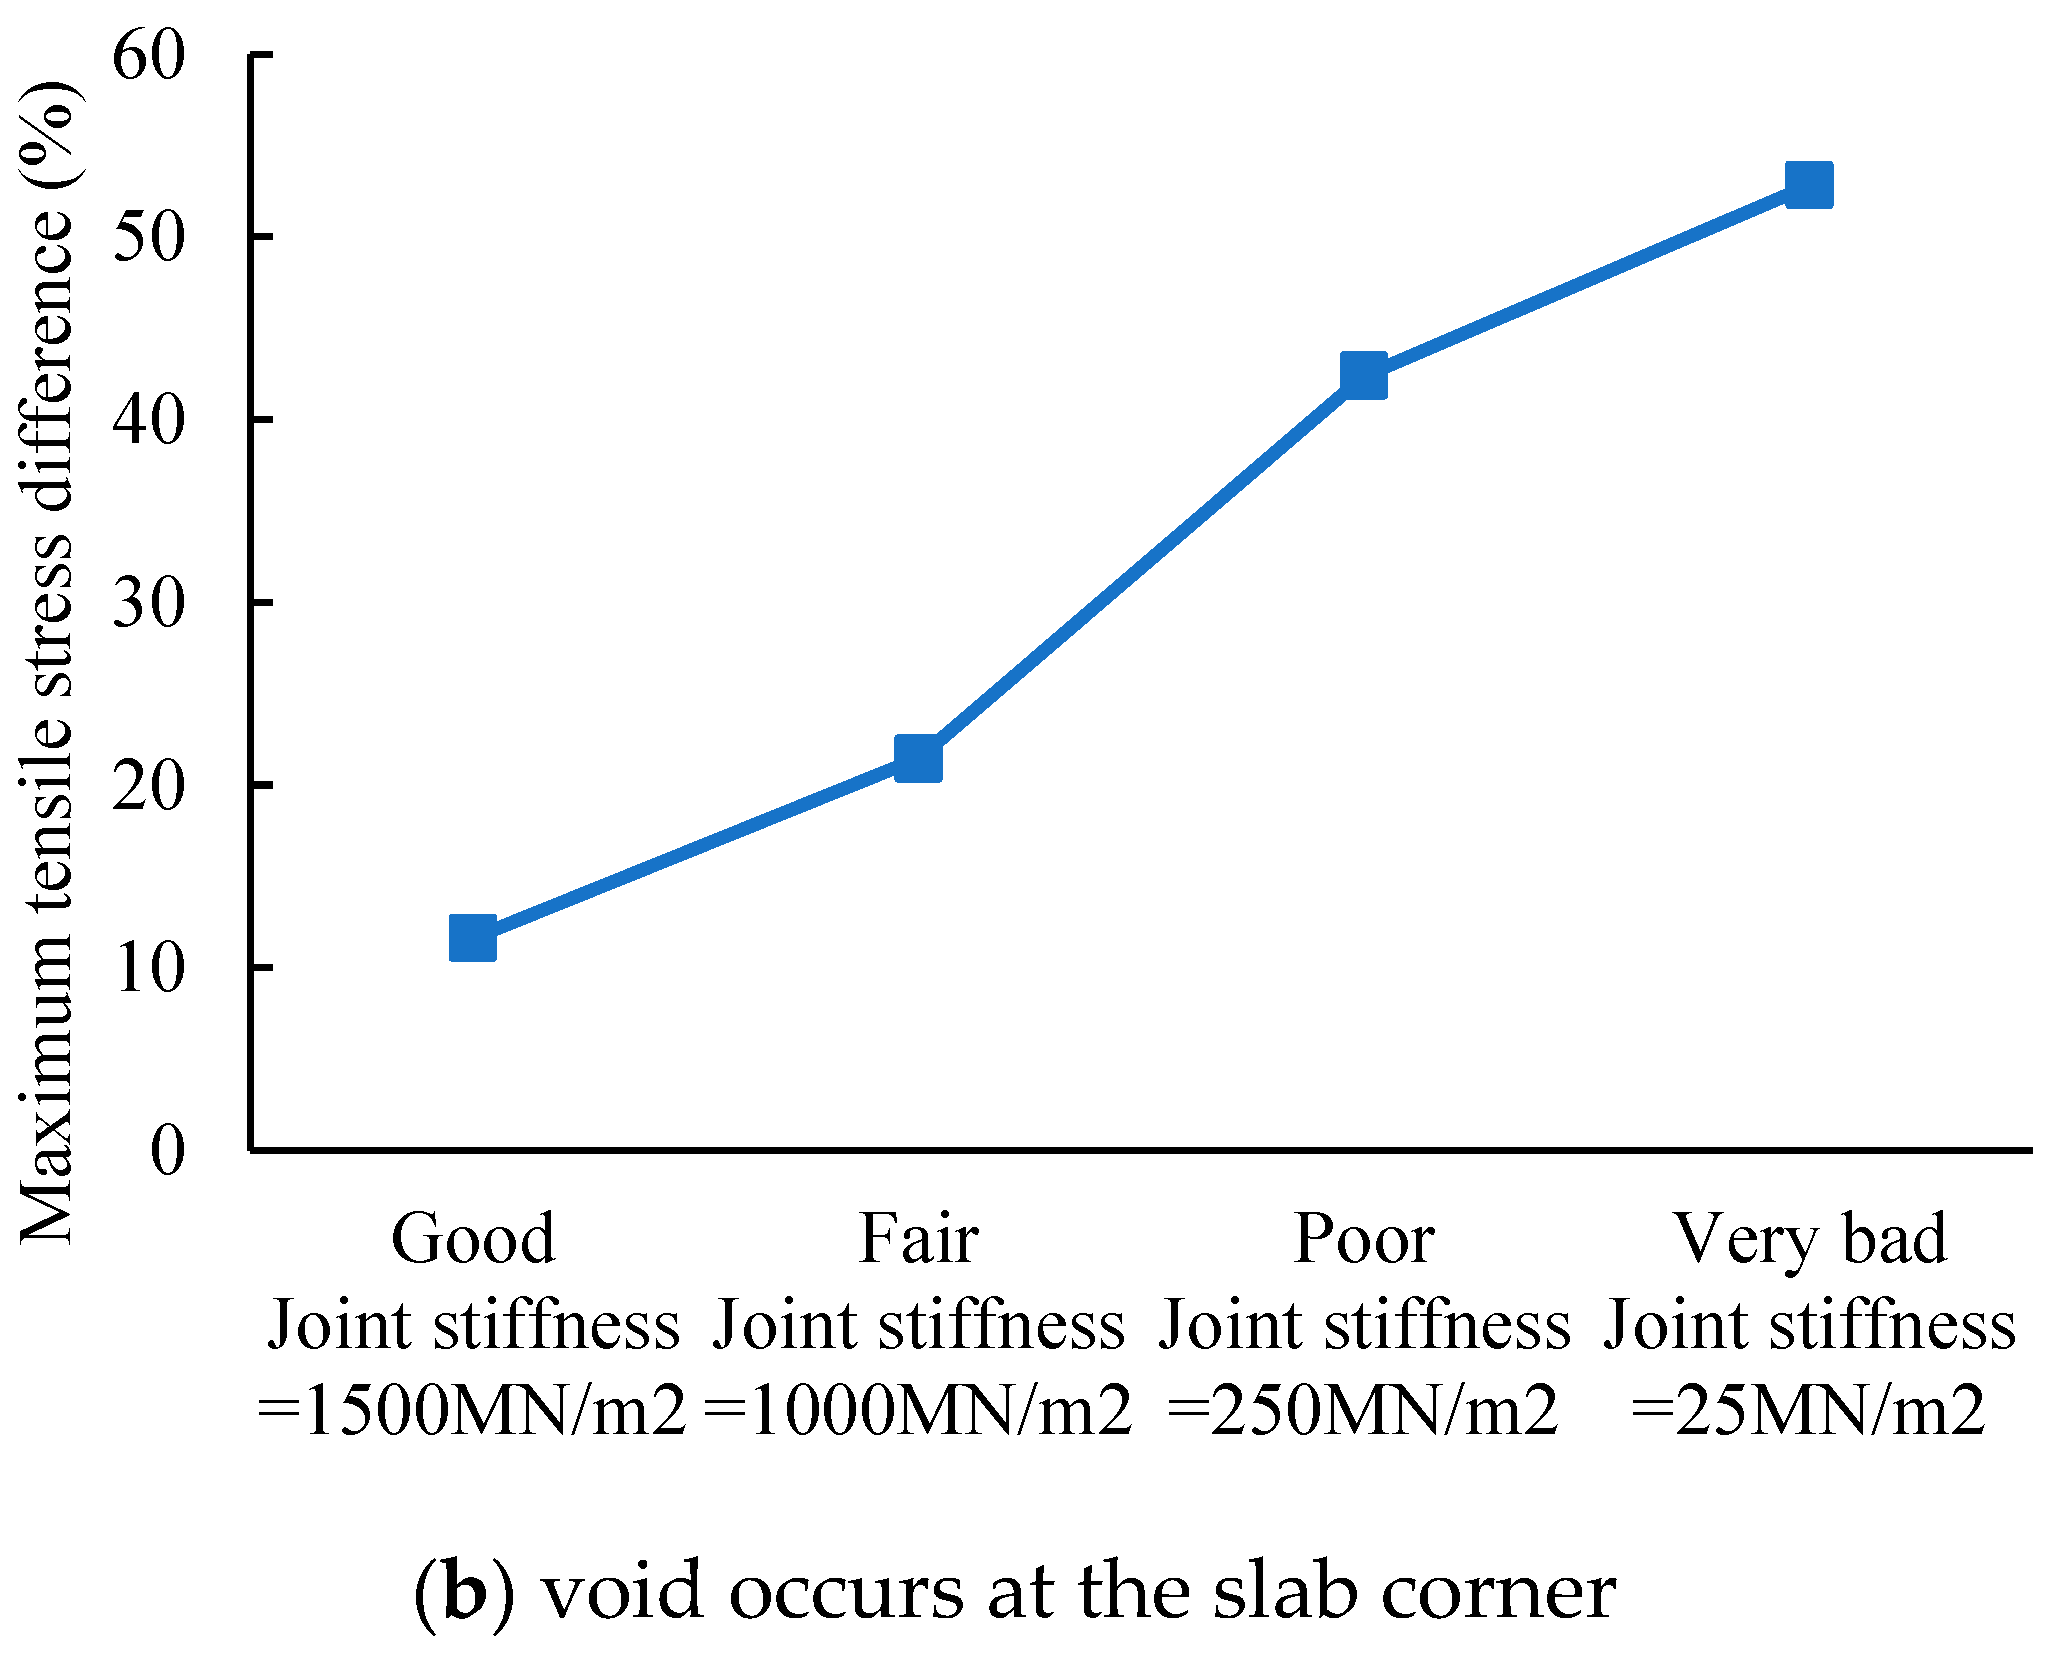
A comparison between the stress in a pavement with voids and another pavement without voids because of the separator layer was made to show the difference. The void beneath the concrete slab is simulated by a 1.5 m × 1.5 m square at the corner of the slab or by a 5 m × 0.3 m rectangle, both with a thickness of 2 cm. The maximum tensile stress of the slab when the void exists was compared with that of no void because of the separator layer, shown in
Table 7. The difference percentage was calculated based on
Table 7 to reflect the influence of the separator layer, as shown in
Figure 17a,b.
Figure 17a shows that the separator layer makes the tensile stress in the slab decrease by 3.4–4.5%.
Figure 17b shows that the stress difference is greater than 10% even under the best load transfer ability; when the load transfer ability is weak, the difference in stress in concrete can be greater than 50%. Therefore, the void at the corner generates much more negative influence. It is counterintuitive in (a) that the separator layer’s effect does not grow when joint load transfer is “very bad.” This is because when the joint stiffness is very good, the airplane load is like applying on a simply supported beam so that the stress at the bottom of the slab is greater than the slab supported by the separator layer. The simply supported beam transforms into a cantilever beam when the joint stiffness worsens. The cantilever beam has a different stress mode, for its bottom undergoes compression stress while its top undergoes tensile stress. As a result of the counteraction effect, the tensile stress in the slab decreases. By contrast, in (b), the transformation from simply supported beam to cantilever beam happens much earlier, so the maximum tensile stress keeps increasing on the cantilever beam status.
6. Benefits on Pavement Longevity
As the composite separator layer prevents the common disease of erosion and voids beneath the slab, the maximum tensile stress in concrete is reduced. In engineering practice, it is more meaningful to discuss the fatigue life than the tensile stress so that the advantage of extra life of pavement attributed to the separator layer was calculated in the study. A 4E-level airport was used to perform the calculation. The total takeoffs and landings in the initial year are presumed to be 70,000, with an annual growth rate of 4%. Type C aircraft (B737-800 as the representative) takes account for 80% of the traffic; type D (B767-300 as the representative) 10%; type E (B777-20 as the representative) 10%. FEM calculated the stress in concrete under the three types of aircraft. B767 and B777 airplane has more wheels in the landing gear than B737, and their respective wheel number and dimension were used in the calculation. The single tire pressure is 1.38 MPa and 1.28 MPa, smaller than B737’s 1.47 MPa.
The damage of concrete under extreme load is caused by large inelastic strain [
28,
29]. Still, for concrete under aircraft load, the stress usually does not exceed 50% of concrete capacity, so the inelastic strain slowly accumulates until the concrete fails [
30]. The permissible loading time of an aircraft [
31] is calculated by the following fatigue equation (Equation (5)), recommended by Specifications for Airport Cement Concrete Pavement Design in China (MH/T5004-2010).
where
Ne is the permissible airplane loading times;
fcm is the flexural strength of concrete;
σp is the calculated concrete tensile stress.
Based on Miner Law [
32], fatigue damage can accumulate through linear superposition. That is to say, the total damage of the concrete results from damage accumulation of different airplane types which produce different levels of tensile stress in the concrete. Therefore, adding fatigue damage caused by type C, D, and E aircraft can get the final cumulative fatigue damage
FD. Thus, the cumulant of the damage is calculated by Equation (6). Once the
FD = 1, the pavement is considered to have fatigue cracks.
where
FD is cumulative fatigue damage;
nei is the cumulative loading times of a certain type of aircraft;
Nei is the permissible loading times of a certain type of aircraft.
Based on the tensile stress in concrete and Equation (5), the permissible loading times of each aircraft type are shown in
Table 8.
Table 8 indicates that the separator layer can effectively increase airplane loading times.
Using the results in
Table 8 and Equation (6), combined with the airport’s airplane combination, one can calculate the extra life (years) the separator layer causes. The fatigue life increase is also influenced by the time void occurs. The earlier voids arise, the more benefit the separator layer brings, as shown in
Table 9.
It can be seen in
Table 9 that the separator layer effectively increases the service life of the pavement. The earlier void appears the more pronounced the separator layer plays its role. It should be noted that the load transfer ability used in life estimation is ‘good,’ so the extra life attributed to the separator layer is the minimum value. The actual life extension will be greater than in
Table 9 because the load transfer deteriorates in service.
7. Conclusions
In this paper, the composite separator layer for Portland cement concrete pavement, formed by modified emulsified asphalt synchronous macadam and micro surfacing, was studied comprehensively, including its basic properties and benefits for the pavement. Though similar composite layer as pavement surface treatment was studied previously by engineers, the composite layer working as separator layer beneath the concrete was seldom studied before. Hence, a thorough investigation of the characteristics of the composite separator layer is essential for its application in airports.
The resilient modulus of micro-surfacing was measured, and the modulus of the separator layer was calculated. The modulus of the separator layer was found to be less than the regular asphalt mixture. The interlayer characteristic between the separator layer and concrete was studied by a self-developed facility. Temperature was found to affect the shape of the shear force-relative slide curve. The normal stress does not significantly influence the slope in the elastic range but greatly influences the maximum shear force. With the increase of normal stress, the shear stress shows a linear increase, which is a typical Mohr-Coulomb constitutive characteristic. The shearing curves were simplified based on the shape of the shearing curves and were further programmed with the FRIC subroutine to use as parameter input in FEM. In situ erosion test directly proved the anti-scouring effect of the composite separator layer compared to the regular cement stabilized base.
The measured modulus of the composite separator layer and interlayer characteristic was inputted in FEM, which was validated by monitored data of mechanical response of the pavement structure under load in an airport. FEM calculated the contraction stress and the stress of concrete under aircraft load. When the separator layer is present, the maximum tensile stress in the concrete is less than 4 MPa when the length of the surface layer is less than 80 m, which can eliminate the risk of concrete cracking.
The FEM simulation also shows that the separator layer has a minimal influence on the stress of slab when there is no void beneath the slab. However, if the void exists beneath the slab, the stress difference is greater than 10%, even under the best load transfer ability. When the load transfer ability is weak, the difference of stress in concrete can be greater than 50%. Considering the frequency of voids occurring beneath the airports’ slabs, the separator layer can play an essential role in preventing too much stress in concrete.
Based on the FEM results and cumulative fatigue life equations, the separator layer was estimated to elongate the service life for years, depending on the time voids occur. Under a conservative calculation, the separator layer can counteract the earliest void tendency to increase pavement service life for 6 years. In situ pavement data with the composite separator layer will be available in some airports in China after years of service to show the effect of longevity elongation.
Author Contributions
Methodology, Jie Yuan; Software, C.Z.; Validation, C.Z.; Formal analysis, H.L.; Investigation, C.Z.; Resources, Y.W. and R.X.; Data curation, W.Y.; Writing—original draft, H.L.; Writing—review & editing, W.Y., Y.W. and R.X.; Supervision, J.Y. All authors have read and agreed to the published version of the manuscript.
Funding
The work described in this paper was supported by the National Natural Science Foundation of China (No. 51678444).
Data Availability Statement
The data used to support the findings of this study are included within the article.
Conflicts of Interest
The authors declare no conflict of interest.
References
- AASHTO. AASHTO Guide for Design of Pavement Structures; American Association of State Highway and Transportation Officials: Washington, DC, USA, 1993. [Google Scholar]
- Hall, K.; Dawood, D.; Vanikar, S.; Tally, R., Jr.; Cackler, T.; Correa, A.; Deem, P.; Duit, J.; Geary, G.; Gisi, A.; et al. Long-Life Concrete Pavements in Europe and Canada; Concrete Pavements Technical Report FHWA-PL-07-027; American Trade Initiatives: Alexandria, VA, USA, 2007. [Google Scholar]
- Department of Transportation, Federal Aviation Administration. Standards for Specifying Construction of Airports; Department of Transportation, Federal Aviation Administration: Washington, DC, USA, 2014.
- Stott, J.P. Tests on Materials for Use in Sliding Layers under Concrete Road Slabs. Civ. Eng. 1963, 10, 213–230. [Google Scholar]
- Chia, W.S.; Mccullough, B.F.; Burns, N.H. Field Evaluation of Subbase Friction Characteristics; Research Report 401-5; Center for Transportation Research: Austin, TX, USA, 1986; Friction. [Google Scholar]
- Park, M.G.; Nam, Y.K.; Jeong, J.H. Investigation of Friction Characteristics between Concrete Slab and Subbase Layers. Bmc Vet. Res. 2009, 10, 123. [Google Scholar]
- Jeong, J.H.; Park, J.Y.; Lim, J.S.; Kim, S.H. Testing and modelling of friction characteristics between concrete slab and subbase layers. Road Mater. Pavement Des. 2014, 15, 114–130. [Google Scholar] [CrossRef]
- Tarr, S.M.; Okamoto, P.A.; Sheehan, M.J.; Packard, R.G. Bond Interaction Between Concrete Pavement and Lean Concrete Base. Transp. Res. Rec. J. Transp. Res. Board 1999, 1668, 9–16. [Google Scholar] [CrossRef]
- Li, X.; Chen, Y.; Zhang, Q. Effects of isolation layer on the mechanical properties of cement concrete pavement with lean concrete base. J. Chang. Commun. Univ. 2008, 24, 44–48. [Google Scholar]
- Guan, R. The Isolation Layer to Cement Concrete Pavement’s Vibration Reduction Buffer Performance and Application Research. Master’s Thesis, Changsha University of Science and Technology, Changsha, China, 2014. [Google Scholar]
- Liu, X. The Mechanical Properties Analysis for Cement Concrete Pavement Which Have Stress-Absorbing Layer. Master’s Thesis, Chang’an University, Xi’an, China, 2009. [Google Scholar]
- Fu, X. Dynamic Response Analysis of Cement Concrete Pavement with Interlayer Function Layer. Master’s Thesis, Chang’an University, Xi’an, China, 2011. [Google Scholar]
- Oh, H.J.; Cho, Y.K.; Seo, Y.; Kim, S.M. Experimental evaluation of longitudinal behavior of continuously reinforced concrete pavement depending on base type. Constr. Build. Mater. 2016, 114, 374–382. [Google Scholar] [CrossRef]
- Zhao, D. The Construction Technology of Bituminous Macadam Seal. Shanxi Sci. Technol. Commun. 2008, 8, 29–49. [Google Scholar]
- Shuler, S. Chip seals for high traffic pavements. Transp. Res. Rec. 1990, 1259, 24–34. [Google Scholar]
- Sebaaly, P.; Hajj, E.; Weitzel, D. Effectiveness of Cape Seals on Asphalt Pavements. Cur. Trends Civil Struct. Eng. 2019, 2, 1–10. [Google Scholar] [CrossRef]
- Quality Engineering Solutions. Cost Benefit Analysis of Including Microsurfacing in Pavement Treatment Strategies & Cycle Maintenance; Pennsylvania Department of Transportation: Harrisburg, PA, USA, 2011.
- Kennedy, T. Evaluation of the Cape Seal Process as a Pavement Rehabilitation Alternative; Texas Department of Transportation: Austin, TX, USA, 1998.
- Sha, A.; Hu, L. Study of the testing method for anti-erosion properties of semi-rigid base materials. China J. Highw. Transp. 2002, 15, 4–7. [Google Scholar]
- Tan, Y.; Ling, J.; Xu, Z.; Yuan, J. Influence of Void to Load Stresses of Rigid Airport Pavement. J. Tongji Univ. (Nat. Sci. Ed.) 2010, 38, 552–556. [Google Scholar]
- Yuan, J.; Shi, E.; Lei, D.; Shao, X. Lateral deviation pattern and model of aircraft wheel path on Shanghai Hongqiao International Airport. J. Civ. Aviat. Univ. China 2015, 33, 1–6. [Google Scholar]
- Brill, D.R. Field Verification of a 3D Finite Element Rigid Airport Pavement Model; Federal Aviation Administration: Washington, DC, USA, 2000.
- Ma, P.; Wang, J.; Wang, X. Shear Strength between Interlayers of Asphalt Pavement based on Mohr-Coulomb Theory. J. Chang. Univ. (Nat. Sci. Ed.) 2012, 32, 34–38. [Google Scholar]
- Goodman, R.E.; Taylor, R.L.; Brekke, T.L. A model for the mechanics of jointed rock. J. Soil Mech. Found. Div. 1968, 94, 637–659. [Google Scholar] [CrossRef]
- Desai, C.S.; Nagaraj, B.K. Modeling for cyclic normal and shear behavior of interfaces. J. Eng. Mech. 1988, 114, 1198–1217. [Google Scholar] [CrossRef]
- Yuan, J.; Zhang, H.; Chai, Z. Variability analysis of civil airfield concrete pavement structure strength. J. Tongji Univ. (Nat. Sci.) 2013, 41, 390–396. [Google Scholar]
- Teng, L.; Tan, Y.; Chai, Z. Analysis and evaluation on void condition of China’s airport cement concrete pavement. J. Civ. Aviat. Univ. China 2013, 31, 41–45. [Google Scholar]
- Yin, W.; Lu, H.; Yuan, J.; Huang, B. Mechanical characteristics of dowel bar-concrete interaction: Based on substructure experiment. Int. J. Pavement Eng. 2022, 23, 2392–2404. [Google Scholar] [CrossRef]
- Ding, F.; Wu, X.; Xiang, P.; Yu, Z. New damage ratio strength criterion for concrete and lightweight aggregate concrete. ACI Struct. J. 2021, 118, 165–178. [Google Scholar]
- Yin, W.; Lu, H.; Yuan, J.; Huang, B. Characterization of fatigue looseness of dowel bars based on substructure experiment. J. Transp. Eng. Part B Pavements 2022, 148, 04021076. [Google Scholar] [CrossRef]
- Smith, K.D.; Roesler, J.R. Review of Fatigue Models for Concrete Airfield Pavement Design. In Proceedings of the Airfield Pavements Specialty Conference, Las Vegas, NV, USA, 21–24 September 2003; pp. 231–258. [Google Scholar]
- Miner, M.A. Cumulative damage in fatigue. J. Appl. Mech. Trans. ASME 1945, 67, A159–A164. [Google Scholar] [CrossRef]
Figure 1.
Structure of composite separator layer.
Figure 1.
Structure of composite separator layer.
Figure 2.
Aggregate gradation of synchronous macadam.
Figure 2.
Aggregate gradation of synchronous macadam.
Figure 3.
Aggregate gradation of micro surfacing.
Figure 3.
Aggregate gradation of micro surfacing.
Figure 4.
Micro surfacing material specimen.
Figure 4.
Micro surfacing material specimen.
Figure 5.
Material testing system with an environment box.
Figure 5.
Material testing system with an environment box.
Figure 6.
Interlayer shear tester.
Figure 6.
Interlayer shear tester.
Figure 7.
Loading of B737-800 airplane wheels and FEM pavement structure (second model).
Figure 7.
Loading of B737-800 airplane wheels and FEM pavement structure (second model).
Figure 8.
Shear force-relative slide relationship of with separator layer at different temperature.
Figure 8.
Shear force-relative slide relationship of with separator layer at different temperature.
Figure 9.
Shear force-relative slide relationship with separator layer.
Figure 9.
Shear force-relative slide relationship with separator layer.
Figure 10.
Shear force-relative slide relationship without separator layer.
Figure 10.
Shear force-relative slide relationship without separator layer.
Figure 11.
The interface of fracture after the shearing test.
Figure 11.
The interface of fracture after the shearing test.
Figure 12.
Simplified forms of interlayer shear force-relative slide curves.
Figure 12.
Simplified forms of interlayer shear force-relative slide curves.
Figure 13.
Measurement of wheel track.
Figure 13.
Measurement of wheel track.
Figure 14.
Contraction stress of concrete with different paving lengths.
Figure 14.
Contraction stress of concrete with different paving lengths.
Figure 15.
Maximum contraction in concrete slab with separator layer before sawing joints.
Figure 15.
Maximum contraction in concrete slab with separator layer before sawing joints.
Figure 16.
Erosion test results.
Figure 16.
Erosion test results.
Figure 17.
Maximum tensile stress difference between the “without separator layer-void” condition and “with separator layer-no void” condition.
Figure 17.
Maximum tensile stress difference between the “without separator layer-void” condition and “with separator layer-no void” condition.
Table 1.
Properties of emulsified asphalt in the upper layer and transition layer.
Table 1.
Properties of emulsified asphalt in the upper layer and transition layer.
| Properties | Test Results |
|---|
| Micro Surfacing | Synchronous Macadam |
|---|
| Demulsification Speed | Slow-Breaking | Rapid-Breaking |
|---|
| Remaining percentage on the sieve (1.18 mm sieve) | 0.45% | 0 |
| Particle charge | Cationic | Cationic |
| Engler viscosity | 5.4 | 17.6 |
| 5d storage stability | 7.40% | 0.20% |
| Evaporation residue content | 60% | 65% |
| Evaporation residue properties | Penetration (100 g, 25 °C, 5 s) | 55 | 62 |
| Ductility (5 °C) | 14.7 | 23.1 |
Table 2.
Properties of aggregates.
Table 2.
Properties of aggregates.
| Properties | Requirements | Tested Value |
|---|
| Coarse aggregate apparent relative density (g/cm3) | ≥2.5 | 2.8 |
| Water absorption (%) | ≤3 | 1.4 |
| Needle-like particle content (%) | ≤20 | 4.5 |
| Fine aggregate apparent relative density (g/cm3) | ≥2.5 | 2.67 |
Table 3.
Mixing proportion of micro surfacing material.
Table 3.
Mixing proportion of micro surfacing material.
| Ingredients | Wt/% |
|---|
| Emulsified asphalt | 11.0 |
| Aggregates | 84.7 |
| Water | 3.4 |
| Cement (PO32.5) | 0.9 |
Table 4.
FEM structure and material properties for each layer.
Table 4.
FEM structure and material properties for each layer.
| Components | Dimensions | Properties |
|---|
| Portland cement concrete slab | Regular slab: 5 m × 5 m
Length of long slab: 5 m × 50 m~150 m
Thickness: 0.36 m | Elastic modulus: 42 GPa
Poisson’s ratio: 0.15
Linear expansion coefficient: 10 × 10−6/°C |
| Cement stabilized macadam | Horizontal dimension: the same as all slabs and joints all together
Thickness: 0.36 m | Elastic modulus: 7 GPa
Poisson’s ratio: 0.20 |
| Subgrade | Elastic foundation (dimension not needed) | Foundation reaction modulus: 70 MN/m3 |
| Joint | 8 mm wide
Spring unit (dimension not needed) | Joint stiffness: 1000 MN/m3 (distributed among nodes) |
| Separator layer | Horizontal dimension: the same as all slabs and joints all together
Thickness: 0.02 m | Elastic modulus: from results of 2.2
Bond to concrete slab: from results of 2.3
Bond to base layer |
Table 5.
The resilience modulus of the separator layer (MPa).
Table 5.
The resilience modulus of the separator layer (MPa).
| Temperature | 0.1 Hz | 0.5 Hz | 1 Hz | 5 Hz | 10 Hz | 20 Hz |
|---|
| 0 °C | 748 | 826 | 878 | 944 | 978 | 1010 |
| 10 °C | 491 | 561 | 596 | 665 | 685 | 714 |
| 20 °C | 383 | 439 | 460 | 517 | 549 | 585 |
| 30 °C | 280 | 312 | 355 | 391 | 433 | 460 |
| 40 °C | 176 | 203 | 221 | 260 | 281 | 303 |
Table 6.
Comparison of measured and simulated strain in concrete slab.
Table 6.
Comparison of measured and simulated strain in concrete slab.
| Interlayer | Load Location | Measurement Location | Strain from Measurement (με) | Strain from Simulation (με) | Error (%) |
|---|
| With separator layer | Middle of longitudinal joint | Slab top | 6.5 | 6.97 | 7.2 |
| Slab bottom | −8.0 | −8.47 | 5.9 |
| Corner of slab | Slab top | 4.5 | 4.78 | 6.2 |
| Slab bottom | −6.0 | −6.10 | 1.7 |
| No separator layer | Middle of longitudinal joint | Slab top | 6.5 | 6.31 | 2.9 |
| Slab bottom | −8.0 | −7.78 | 2.8 |
| Corner of slab | Slab top | 5.0 | 4.66 | 6.8 |
| Slab bottom | −6.5 | −5.96 | 8.3 |
Table 7.
Maximum tensile stress in concrete with/without separator layer.
Table 7.
Maximum tensile stress in concrete with/without separator layer.
| Void Location | Load Transfer Ability (Joint Stiffness) | Maximum Tensile Stress (MPa)
(Without Separator Layer-Void) | Maximum Tensile Stress (MPa)
(With Separator Layer-No Void) |
|---|
| Slab edge | Good (1500 MN/m2) | 2.702 | 2.610 |
| Fair (1000 MN/m2) | 2.981 | 2.857 |
| Poor (250 MN/m2) | 3.236 | 3.089 |
| Very bad (25 MN/m2) | 3.301 | 3.154 |
| Slab corner | Good (1500 MN/m2) | 1.746 | 1.543 |
| Fair (1000 MN/m2) | 1.986 | 1.560 |
| Poor (250 MN/m2) | 2.750 | 1.584 |
| Very bad (25 MN/m2) | 3.371 | 1.590 |
Table 8.
Permissible loading times for different airplane types under different scenarios.
Table 8.
Permissible loading times for different airplane types under different scenarios.
| Airplane Type | Scenario | Permissible Loading Times |
|---|
| B737-800 | No separator layer + no voids | 5760521 |
| No separator layer + voids | 1776803 |
| Separator layer + no voids | 3274549 |
| B767-300 | No separator layer + no voids | 95138211 |
| No separator layer + voids | 25018911 |
| Separator layer + no voids | 44012764 |
| B777-200 | No separator layer + no voids | 2272068 |
| No separator layer + voids | 617682 |
| Separator layer + no voids | 1086613 |
Table 9.
Fatigue life increase of pavement because of the composite separator layer.
Table 9.
Fatigue life increase of pavement because of the composite separator layer.
| | With Separator Layer | Without a Separator Layer—Assume Voids Appear Beneath the Slab in a Specific Year after the Pavement Construction |
|---|
| 2nd Year | 10th Year | 11th Year | 15th Year | 20th Year | 22nd Year | 25th Year |
|---|
| Pavement Life (years) | 35 | 29 | 30 | 31 | 32 | 33 | 34 | 35 |
| Extra life | - | 6 | 5 | 4 | 3 | 2 | 1 | 0 |
| Publisher’s Note: MDPI stays neutral with regard to jurisdictional claims in published maps and institutional affiliations. |
© 2022 by the authors. Licensee MDPI, Basel, Switzerland. This article is an open access article distributed under the terms and conditions of the Creative Commons Attribution (CC BY) license (https://creativecommons.org/licenses/by/4.0/).
