Article

Effects of Different Frequency Sensitivity Models of a Viscoelastic Damper on Wind-Induced Response of High-Rise Buildings

1
Laboratory for Future Interdisciplinary Research of Science and Technology (FIRST), Tokyo Institute of Technology, Yokohama 226-8503, Kanagawa, Japan
2
Architecture and Building Engineering Department, School of Environment and Society, Tokyo Institute of Technology, Yokohama 226-8503, Kanagawa, Japan
3
Department of Architecture, Faculty of Engineering, Tokyo University of Science, Katsushika 125-8585, Tokyo, Japan
*
Author to whom correspondence should be addressed.
Buildings 2022, 12(12), 2182; https://doi.org/10.3390/buildings12122182
Submission received: 21 November 2022 / Revised: 2 December 2022 / Accepted: 6 December 2022 / Published: 9 December 2022
(This article belongs to the Special Issue Dynamics Analysis of Structures with Viscoelastic Elements)

Abstract

:
The fractional derivative (FD) model is one kind of numerical model of viscoelastic (VE) damper, which can describe the behavior of the frequency sensitivity of VE damper well with some empirical parameters. However, the FD model is difficult to apply to practice design because of its complex calculation. Compared with the FD model, the integer derivative (ID) models are widely used as the VE damper equipped in the high-rise building. However, ID models lack consideration of frequency sensitivity, which significantly affects their accuracy. To consider frequency sensitivity in the ID model, this study attempted to use the 4-element and 6-element models of ID models to approximate the FD model, easily describing the VE characteristic of the damper. The wind forces of 500-year-return periods were employed to analyze the influence of the frequency sensitivity of the VE damper on wind-induced responses and energy dissipation. The results of this study showed that the 4-element and 6-element models not only matched frequency sensitivities well to the FD model in the low-frequency region of wind excitation but also had good agreements with the FD model in wind-induced responses and energy dissipation. Based on the findings in this study, the 4-element and 6-element models were recommended as numerical models for the wind-resistant design of high-rise buildings with VE dampers. It helps improve the wind-induced behavior simulation of VE dampers considering their frequency sensitivity in high accuracy without massive experimental cost.

1. Introduction

High-rise buildings constructed in recent years tend to be lightweight and flexible [1]. These properties unintentionally increase the sensibility of high-rise buildings to wind excitation [2,3]. Wind excitation easily leads to resonance and excessive vibrations on high-rise buildings, decreasing the quality of habitability, and generating squeaking noises inside these buildings due to a wide range of frequencies [2]. The negative effects of the wind excitation are magnified in buildings that are higher than 200 m [4,5].
To solve the excessive vibrations and dissipate kinetic energy from wind excitation, supplemental damping devices have been widely used in not only high-rise buildings [6,7,8,9,10] but also some long-span structures, such as bridges or railways [11,12]. One type of supplemental damping device used with success is the viscoelastic (VE) damper. It can stably dissipate kinetic energy from excessive vibrations with a wide range of frequencies in different scales of amplitude. For instance, wind-induced vibrations with small amplitude and low frequencies, or seismic-induced vibrations with large amplitude and high frequencies [7,13,14,15]. The primary device of the VE damper is composed of a sandwich structure with a thin slab of VE material and steel slabs, as shown in Figure 1a. VE damper properties can be evaluated by its steady-state response to a harmonic loading, and the hysteresis loop considering the damper force and deformation ( F d u d ) . Figure 1b shows an example of a VE damper that tends to form a tilt elliptical loop. The storage stiffness K d = F d / u d , max related to energy absorbing characteristic and the loss factor η d related to the damping characteristic are determined, where F d is the damper force at maximum deformation [6,16].
For the dynamic features of VE dampers, except for the strain- [9,17,18] and temperature sensitivities [16,19,20,21,22,23], they also exhibit the frequency sensitivities [9,18,24,25,26] that affect the performance of the responses significantly. Furthermore, wind forces have high power at low frequencies. The along-wind has a wide range of frequency in particular [7,15]. Therefore, it is necessary to evaluate the wind-induced responses considering the frequency sensitivities of VE dampers. Considering the characteristics of frequency sensitivities of VE dampers, two kinds of numerical models are mostly used in the simulation, including the frictional derivative (FD) model [27,28,29] and the integer derivative (ID) model [30,31,32]. The FD model is one kind of complex numerical model, which can accurately describe viscoelastic behavior by a few empirical parameters of frequency sensitivities [27,33,34,35,36]. On the other hand, the ID model uses springs and dash-pots to model VE dampers with frequency sensitivities [30,31]. Compared with the FD models, simplifying VE dampers into ID models to promote the design of VE dampers equipped in high-rise buildings extensively is valued in practice [18].
Sato et al. (2009) [25] used the Kelvin and Maxwell models of the simplest integer derivative models to compare with the FD model proposed by Kasai et al. [27] (Figure 2a) to investigate frequency sensitivities affecting wind-induced responses. Compared with the FD model, the storage stiffness of the Kelvin model did not exhibit frequency sensitivity and its loss factor varied monotonously with frequency changes. In contrast, the frequency sensitivity of storage stiffness of the Maxwell model had better matching with the FD model, but its frequency sensitivity of loss factor exhibited obvious differences from the FD model. On the other hand, Kasai et al. (2001) [18] compared the 4-element (Figure 2b) and 6-element (Figure 2c) models and the FD model considering the frequency sensitivities of VE dampers. The frequency sensitivities of storage stiffness and loss factor of the 4-element and 6-element models had good agreements within frequencies ranging from 0.01 Hz to 30 Hz . However, the comparison was limited to the high-frequency region such as seismic-induced response, and the low-frequency region such as the wind response has not been considered yet.
The aim of this study is to express the influence of frequency sensitivities of the high-rise building with the VE damper (VE system), using two kinds of ID models, the 4-element model and 6-element model, on wind-induced response and energy dissipation. Then, the 4-element and 6-element models are compared with the FD model proposed by Kasai et al. [27]. Due to the important effect of the low frequency of wind force on the response of high-rise buildings, the wind-induced response is dominated by the 1 st modal wind force [5,37,38,39]. The 1 st modal models are used as target models in this study (see Section 2.1). The wind force used for simulation is determined by a wind tunnel test [3,40]. Ten minutes of the along- and across-wind forces are used in the simulations. Note that the effects of coupling along, across and torsional modes on the target high-rise building are minor [4,38,41]. Thus, the along- and across-wind responses are investigated independently in this study. Furthermore, the temperature sensitivity of VE dampers is also neglected in this study because the aim of this study is to evaluate the influence of frequency sensitivities of VE dampers on wind-induced behavior.
The contents of this study are as follows: Section 2 briefly introduces the analytical models and the theory of VE systems. Section 3 investigates the characteristics of the VE systems under the steady-state response. Section 4 discusses the wind dynamic features of the 4-element and 6-element systems compared with the FD system subjected to both along- and across-winds. Section 5 presents conclusions.

2. Target Building and Numerical Models

2.1. Target Building and the SDOF Model

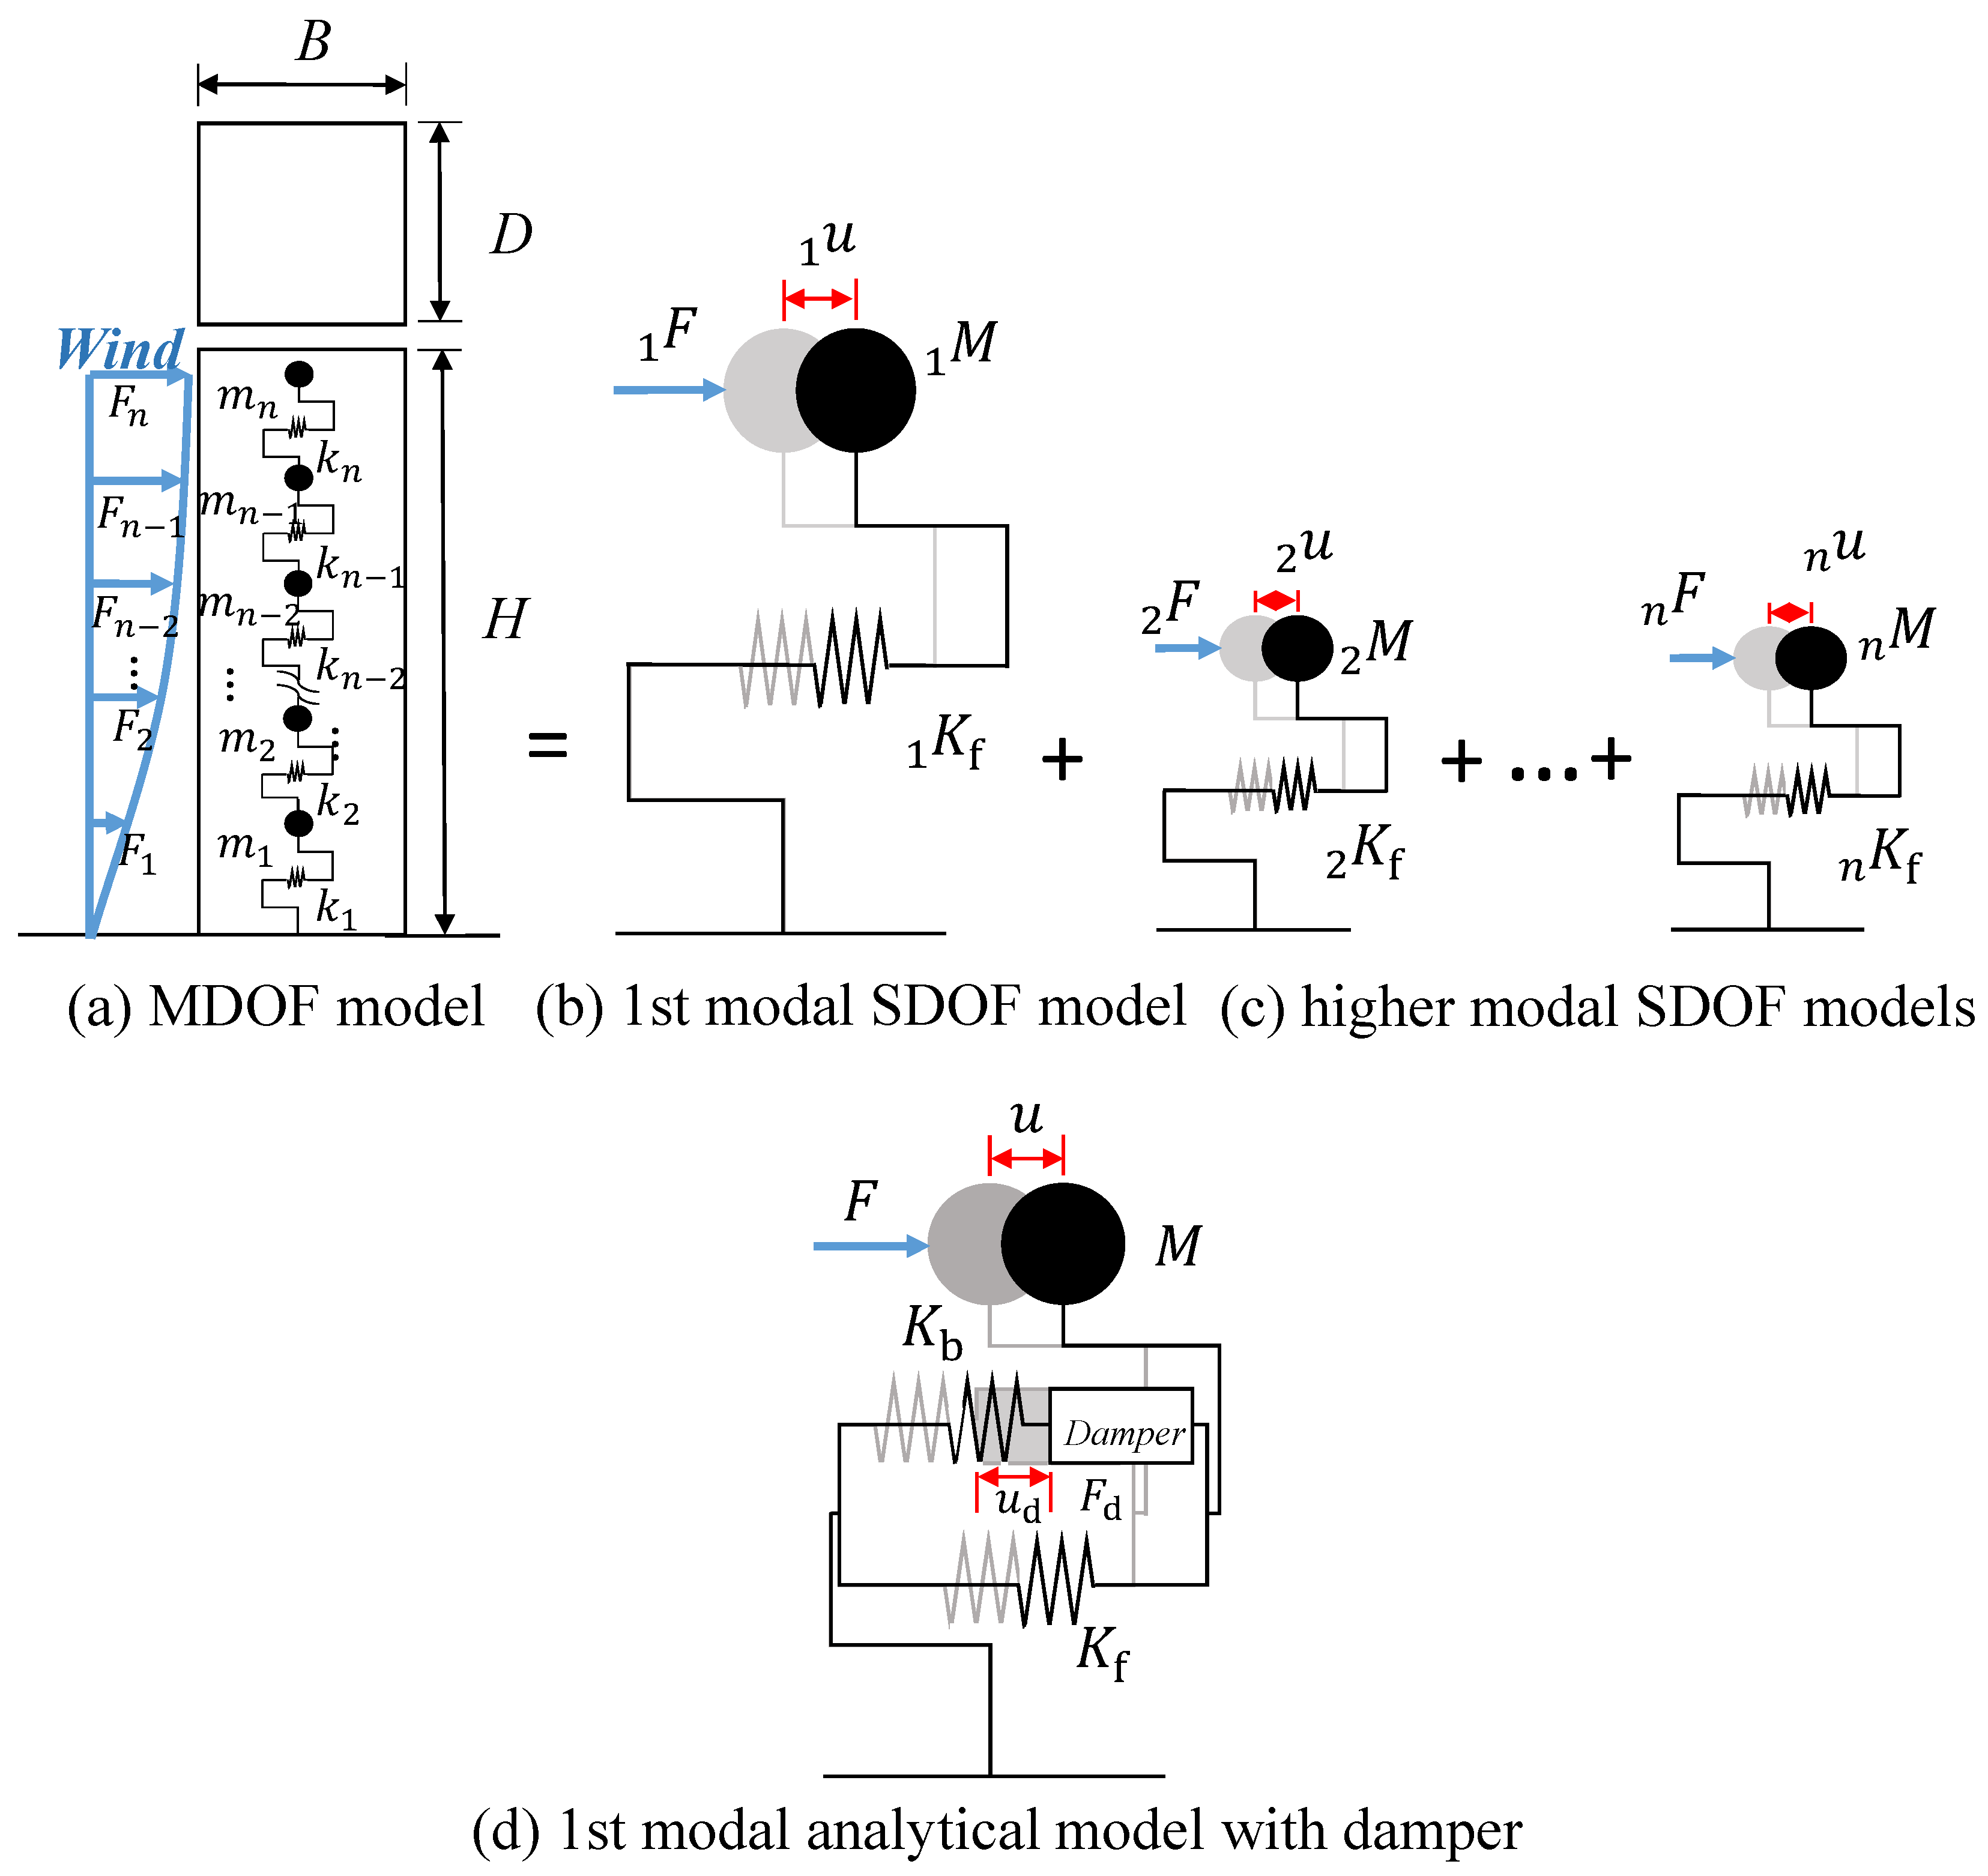
The target high-rise building (Figure 3a) is H = 200 m in height with an aspect ratio of 4.0 . The width and length of the base, D = B = 50 m. The building model is defined as a no-damped frame, in order to compare the effect of frequency sensitivity of the VE damper in this study. Wind-induced response of the multi-degree of freedom (MDOF) model (Figure 3a) can be obtained by the modal analysis of the wind-induced response of the 1 st modal single-degree of freedom (SDOF) model (Figure 3b) along with higher modal SDOF models (Figure 3c). Due to the wind-induced response of high-rise buildings is mainly caused by the contribution of the 1 st mode [5,37,38,39], the simulation in this study focused on the 1 st modal wind force applies to the SDOF model with an added VE damper (Figure 3d). The 1 st modal analytical model with a damper comprises a 1 st modal stiffness of frame K f , a 1 st modal stiffness of brace K b , and a 1 st modal damper. The damper can lead to a 1 st modal damper force F d and deformation u d . In Figure 3d, M is the 1 st modal mass, F is the 1 st modal wind force, and u is the 1 st modal displacement response.
In the wind dynamic analysis, a total of 12 systems (see Table 1) are used. First, three natural periods of the frame are set: T f = 0.01 H = 2 s (1H-frame), T f = 0.02 H = 4 s (2H-frame), and T f = 0.03 H = 6 s (3H-frame). The 1 st modal stiffness of frame K f is given by Equation (1). Then, four types of added components are considered: HH, SH, HS, and SS, which include the combination of hard (H-) or soft (S-) damper, with hard (-H) or soft (-S) brace. The hard brace is a rigid body with the stiffness ratio ( K b / K f ) of , and the soft is set as the stiffness ratio ( K b / K f ) of 3.0 [42]. Furthermore, the hard damper is set as the stiffness ratio ( K d / K f ) of 2.0, and the soft is a damper commonly used in practical, set as the stiffness ratio ( K d / K f ) of 0.4 [42].
K f = M 2 π T f 2 .

2.2. Basic Settings of Numerical Models with the VE Damper

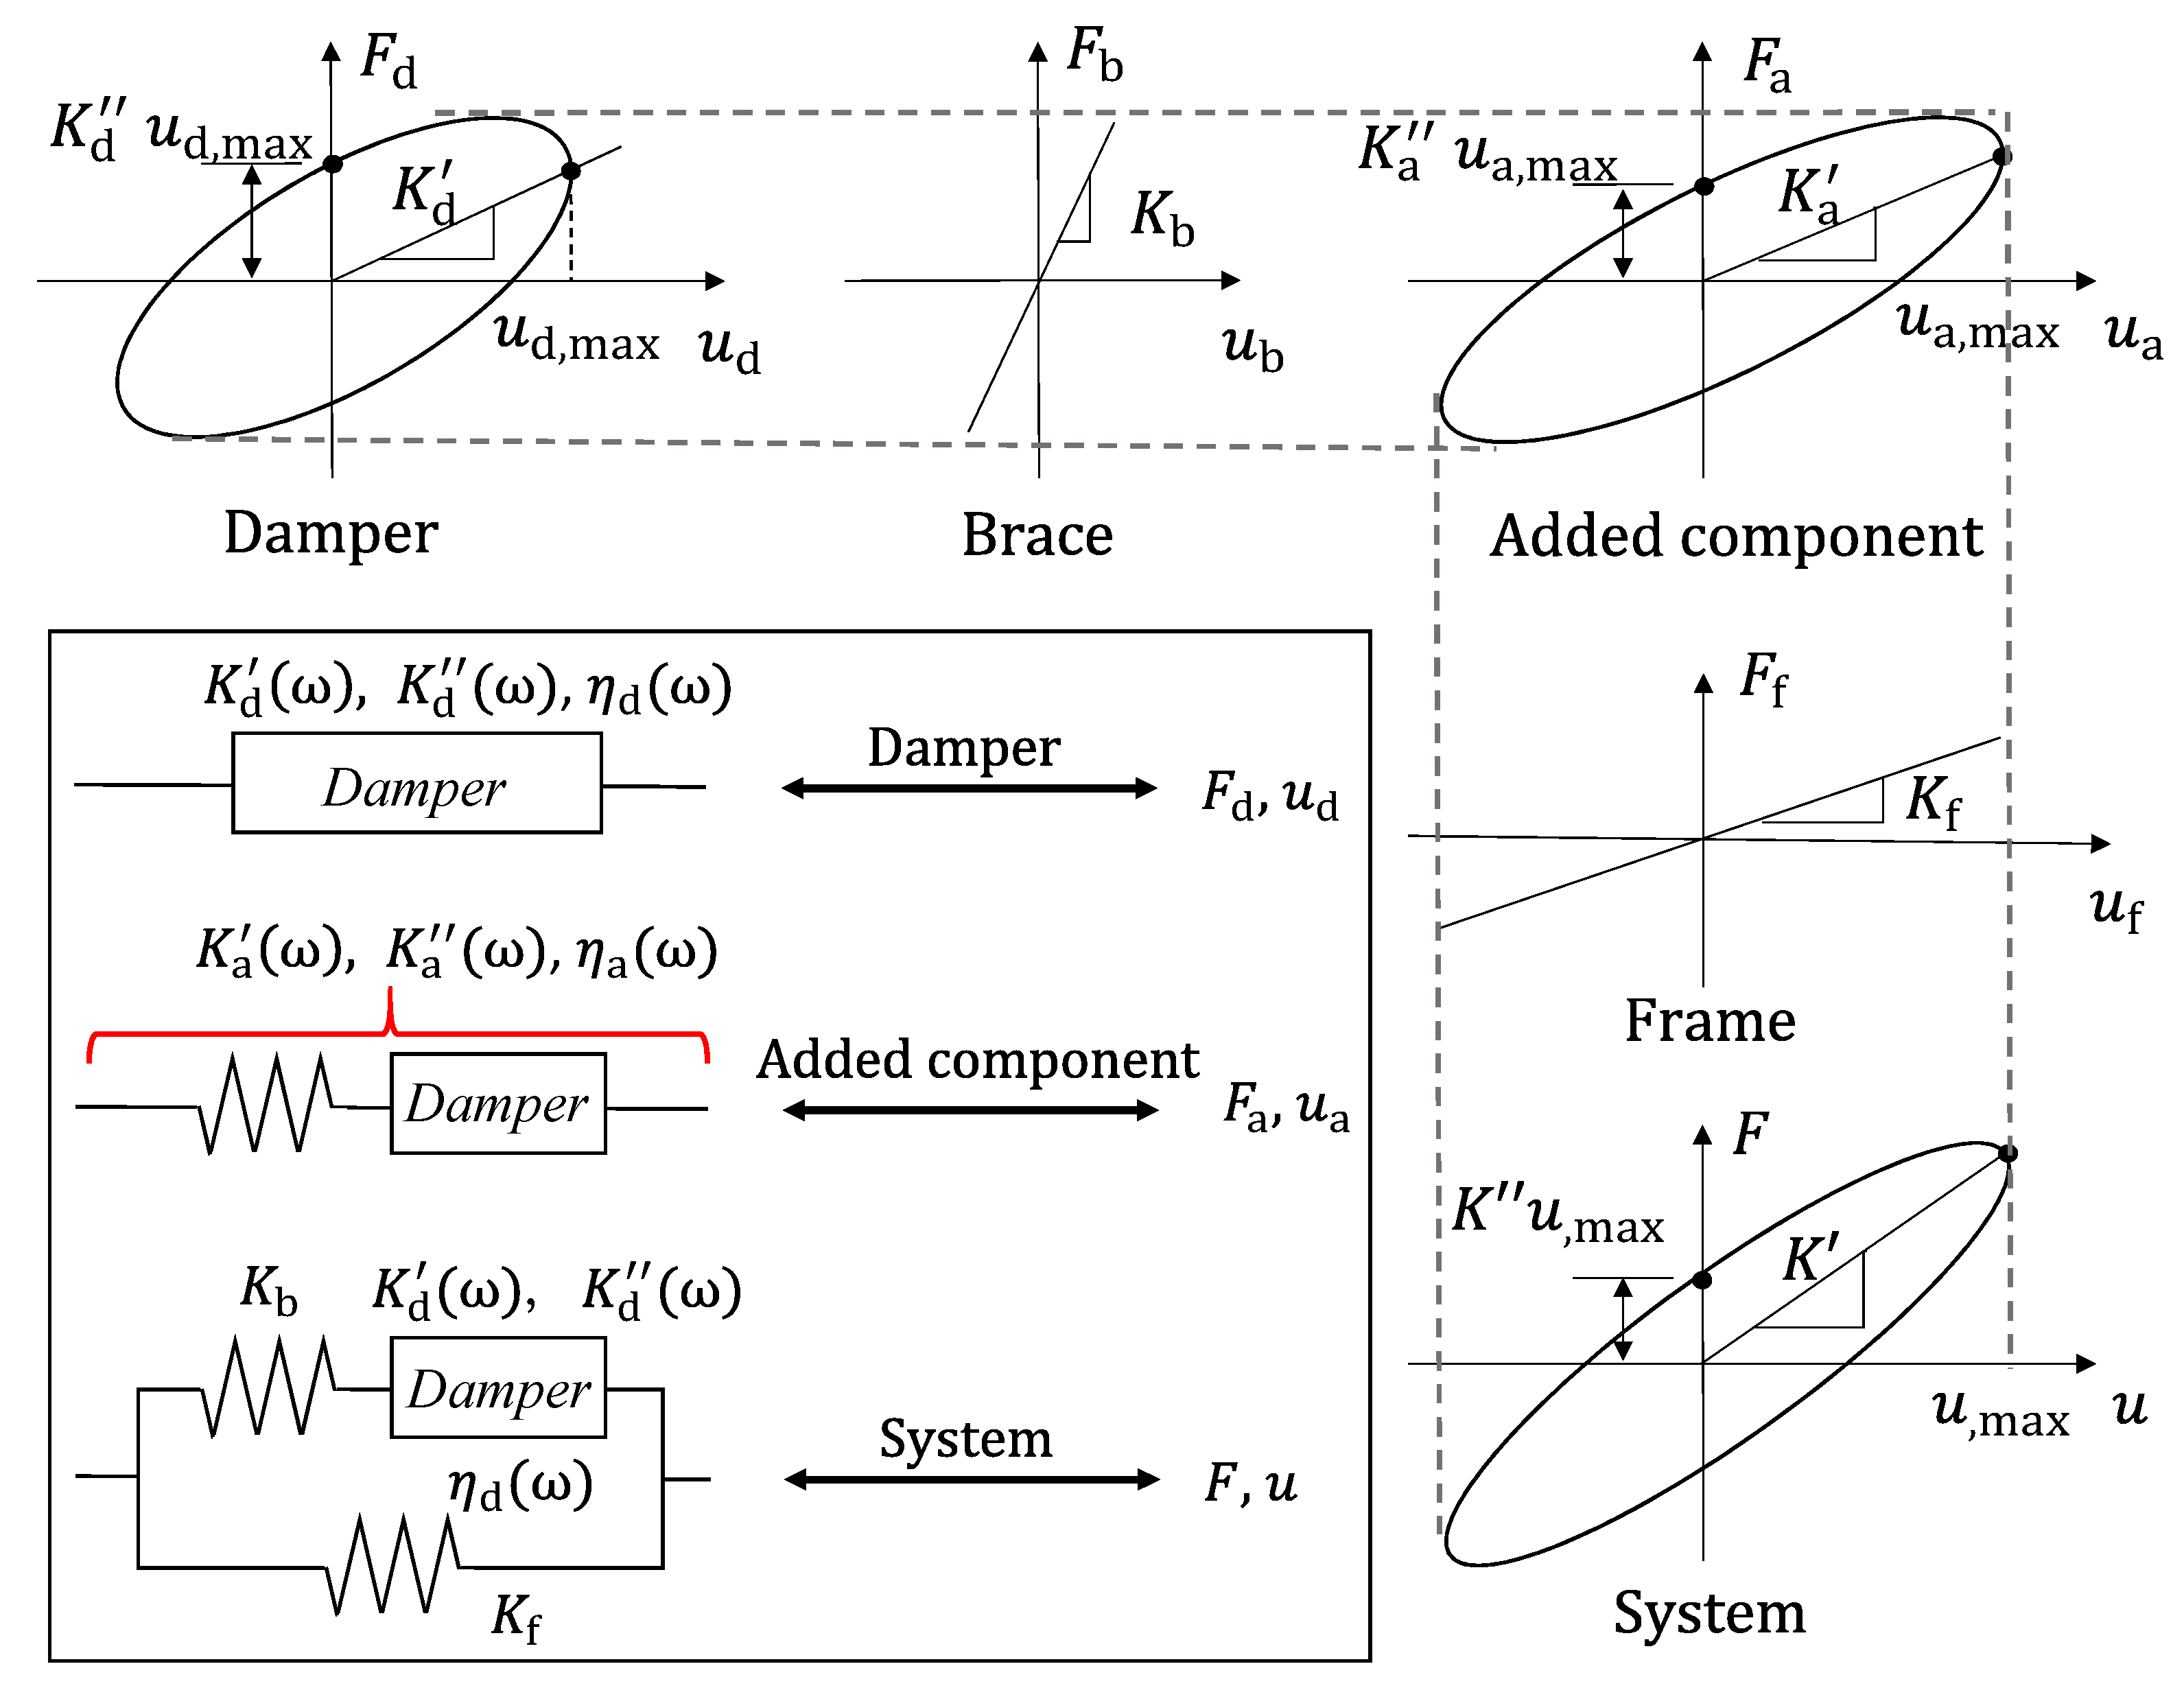
An illustration of the VE system with the relationship of its hysteresis loops is shown in Figure 4. The VE system comprises a frame, brace, and damper. A VE damper’s hysteresis loop is an inclined ellipse, and its dynamic characteristics are expressed by using the storage stiffness K d and loss stiffness K d (or loss factor η d ) [6,16]. A series connection of a brace and a VE damper is called the added component [43]. The storage stiffness of the added component K a , loss stiffness of the added component K a , and loss factor of the added component η a . In addition, a parallel connection of the added component and the frame becomes a VE system. The hysteresis loop of the added component and system is also an inclined ellipse.
Based on the relationship in Figure 4, the storage stiffness K a ( ω ) , loss factor η a ( ω ) , and loss stiffness K a ( ω ) of the added component, respectively, which are given by Equations (2a), (2b) and (2c) [6,43,44].
K a ( ω ) = [ ( 1 + η d 2 ( ω ) ) K d ( ω ) + K b ] K d ( ω ) K b ( K d ( ω ) + K b ) 2 + ( η d ( ω ) K d ( ω ) ) 2 .
η a ( ω ) = η d ( ω ) 1 + ( 1 + η d 2 ( ω ) ) K d ( ω ) / K b .
K a ( ω ) = K a ( ω ) η a ( ω ) .
where K d ( ω ) and η d ( ω ) are the storage stiffness and loss factor of the VE damper.
Thus, the storage stiffness K ( ω ) and loss factor η ( ω ) of the system can be derived by Equations (3a) and (3b).
K ( ω ) = K f + K a ( ω ) .
η ( ω ) = η a ( ω ) 1 + K f / K a ( ω ) .
Due to the VE damper having frequency sensitivity, the natural frequency f n , damping ratio ξ n , and the damping coefficient C n of the system also have frequency sensitivity. The frequency sensitivity of the natural frequency f n , damping ratio ξ n , and the damping coefficient C n of the system can be obtained by Equations (4a)–(4c).
f n ( ω ) = 1 2 π K ( ω ) / M .
ξ n ( ω ) = η ( ω ) 2 · f n ( ω ) 2 π ω .
C n ( ω ) = 2 ω ξ n ( ω ) M = η ( ω ) f n ( ω ) M 2 π .
The resonance frequency f n and damping ratio ξ n of the system ( ω = ω n ; the resonance circular frequency of system) are given by Equations (5a) and (5b). Moreover, f n and ξ n happen at the free vibration of the VE system.
f n = 1 2 π K ( ω n ) / M .
ξ n = η ( ω n ) / 2 .
In this study, the FD system (Figure 5a) and ID systems (the 4-element system (Figure 5b) and the 6-element system (Figure 5c)) are used. The theory of the FD model and ID models of the VE damper is discussed in Section 2.3.

2.3. FD Model and ID Models

2.3.1. FD Model

The equations of the storage stiffness K d and loss factor η d of the FD model (Figure 2a) was proposed by Kasai et al. [27], are given by Equations (6a) and (6b).
K d ( ω ) = G 1 + a b ω 2 α + ( a + b ) ω α cos ( α π / 2 ) 1 + a 2 ω 2 α + 2 a ω α cos ( α π / 2 ) A s d
η d ( ω ) = ( a + b ) ω 2 + sin ( α π / 2 α ) 1 + a b ω 2 α + ( a + b ) ω α cos ( α π / 2 )
In this study, the 3M material, ISD111, is adapted, and its parameters are given as G = 3.92 × 10 4 [ N / cm 2 ] , a = 5.6 × 10 5 , b = 2.10 , and α = 0.558 . Furthermore, A s / d is a parameter of the FD model, where A s means the area of the VE damper and d means the thickness of the VE material lamination [18]. Note that, the increase in temperature owing to energy dissipation is not considered, and the ambient temperature of the damper is fixed at 20 °C in this study.

2.3.2. 4-Element Model

The 4-element model (Figure 2b) is a kind of ID model that comprises two springs and two dash-pots; that is, a parallel connection of one Kelvin model [25] and one Maxwell model [25]. The storage modulus G ( ω ) and loss modulus G ( ω ) of the model can be obtained using Equations (7a) and (7b) [18].
G ( ω ) = k 1 + k 2 ( c 2 ω ) 2 k 2 2 + ( c 2 ω ) 2 .
G ( ω ) = c 1 [ k 2 2 + ( c 2 ω ) 2 ] ω + k 2 2 ( c 2 ω ) k 2 2 + ( c 2 ω ) 2 .
where k 1 and k 2 are the spring parameters, while c 1 and c 2 are the dash-pot parameters. To align with the dynamics characteristics of the FD model, the parameters of stiffness K i and damping coefficient C i of a 4-element model are given by Equations (8a) and (8b).
K i = A s d k i ,
C i = A s d c i , ( i = 1 2 ) .
The frequency sensitivity of the storage stiffness K d ( ω ) and loss factor η d ( ω ) of the 4-element damper are given by Equations (9a) and (9b).
K d ( ω ) = A s d G ( ω ) = A s d k 1 + k 2 ( c 2 ω ) 2 k 2 2 + ( c 2 ω ) 2 .
η d ( ω ) = G ( ω ) G ( ω ) = c 1 [ k 2 2 + ( c 2 ω ) 2 ] ω + k 2 2 ( c 2 ω ) k 1 [ k 2 2 + ( c 2 ω ) 2 ] ω + k 2 ( c 2 ω ) 2 .

2.3.3. 6-Element Model

The 6-element model (Figure 2c) is another kind of ID model that comprises three springs and three dash-pots; that is, a parallel connection of three Maxwell models [25], whose storage modulus G ( ω ) and loss modulus G ( ω ) can be obtained using Equations (10a) and (10b) [18].
G ( ω ) = i = 1 3 k i ( c i ω ) 2 k i 2 + ( c i ω ) 2 .
G ( ω ) = i = 1 3 k i 2 ( c i ω ) k i 2 + ( c i ω ) 2 .
where k 1 , k 2 , and k 3 are the spring parameters, while c 1 , c 2 , and c 3 are the dash-pot parameters. To align with the dynamics characteristics of the FD model, the parameters of stiffness K i and damping coefficient C i of the 6-element model are given by Equations (11a) and (11b).
K i = A s d k i ,
C i = A s d c i , ( i = 1 3 ) .
The frequency sensitivity of the storage stiffness K d ( ω ) and loss factor η d ( ω ) of the 6-element damper are given by Equations (12a) and (12b).
K d ( ω ) = A s d G ( ω ) = A s d i = 1 3 k i ( c i ω ) 2 k i 2 + ( c i ω ) 2 .
η d ( ω ) = G ( ω ) G ( ω ) = i = 1 3 k i 2 ( c i ω ) k i 2 + ( c i ω ) 2 / i = 1 3 k i ( c i ω ) 2 k i 2 + ( c i ω ) 2 .

3. Characteristics of the VE Systems under the Steady-State Response

In this section, the frequency sensitivities of parameters in three different VE systems (Figure 5) are compared. As mentioned in Section 2.3.1, A s / d is the parameter of the FD system (Table 2), which is obtained by calculating the values of K d / K f and K b / K f (Table 1). Then, f n and ξ n of the FD system are obtained from Equations (5a) and (5b), respectively, (Table 2). The spring ( k i ) and dash-pot ( c i ) parameters of the 4-element and 6-element systems are obtained by the least-squares method to match f n and ξ n with the FD systems [18]. Then, the 4- and 6-elements’ K i and C i are given by Equations (8a), (8b), (11a), and (11b), respectively, which are indicated in Table 2. The discussion of frequency sensitivity of the damping coefficient C n is expressed in Appendix A.
Figure 6 and Figure 7 show the effect of frequency sensitivities of VE systems on the parameters of the 2H-HH system and 2H-SS system, respectively.
In Figure 6a, the storage stiffness of the damper K d of the FD model, the 4-element model, and the 6-element model match each other at the resonance frequency of the system ( f n ). In addition, K d of these models have a matching tendency that K d increases as the frequency increases. In contrast, when the frequency is away from the resonance frequency of the system, the difference among these three models gets larger. Especially the statics storage stiffness of the damper ( lim f 0 K d ( f ) ), the 4-element model is higher than the FD model, the 6-element model is lower than the FD model. The storage stiffness of system K (Figure 6b) and the natural frequency f n (Figure 6c) exhibit the same tendency as storage stiffness of the damper K d .
In Figure 6d, when the frequency is below the resonance frequency of the system, the loss factor of the damper η d of the FD model increases sharply as the frequency increases. In contrast, when the frequency is over the resonance frequency of the system, η d increases slowly as the frequency increases. The statics loss factor of the damper ( lim f 0 η d ( f ) ) of the 4-element model is zero. When the frequency is below the resonance frequency of the system, η d of the 4-element model increases as the frequency increases. In contrast, when the frequency is over the resonance frequency of the system, η d decreases slowly as the frequency increases. The 6-element model has the same trend as the 4-element model when it is over f = 0.2 Hz . However, when the frequency is low, η d of the 6-element model decreases sharply when frequency increases. The statics loss factor of the damper ( lim f 0 η d ( f ) ) of the 6-element model approaches infinity. The loss factor of the system η (Figure 6e) exhibits the same tendency as the damper η d .
In Figure 6f, the damping ratio of the system ξ n of the FD model decreases exponentially as frequency increases. Similarly, the 6-element model has the same trend as the FD model. However, the 4-element model decreases linearly as frequency increases.
Moreover, the 2H-SS system (Figure 7) has similar tendency with the 2H-HH system (Figure 6), but the storage stiffness ( K d and K ) and the loss factor ( η d and η ) of 2H-HH system are higher than 2H-SS system.
Comparing with the Kelvin model and Maxwell model used in Sato et al. (2009) [25], the 4-element model and 6-element model aligns with the FD model better. The frequency sensitivities of parameters of the 4-element and 6-element models match the FD model well in wide-band frequencies around the resonance frequency ( f n ).
Furthermore, Figure 8 and Figure 9 show the hysteresis loops of VE dampers of the 2H-HH system and 2H-SS system, respectively. It is subjected to harmonic waves, and it explains the effect of frequency sensitivity of VE dampers on responses, where F d is the damper force and u d is the deformation of the damper.
-
When subjected to harmonic waves of f = 0.2 f n , the hysteresis loop (Figure 8a) of the 4-element model is smaller than the FD model. While the hysteresis loop of the 6-element model is greater than the FD model. The massive difference in the hysteresis loop of the damper among three models when f < f n aligns with the relationship of frequency sensitivity in Figure 6.
-
When subjected to harmonic waves of f = f n , the hysteresis loops (Figure 8b) of the damper of three models align with each other well. The good agreements at f = f n also match the relationship of frequency sensitivity in Figure 6.
-
When subjected to harmonic waves of f = 2 f n , the hysteresis loops (Figure 8c) of the 4-element and 6-element models align with the FD model but having some minor differences. The relationship of frequency sensitivity when f > f n can be observed in Figure 6.
Moreover, the 2H-SS system (Figure 9) has similar tendency to the 2H-HH system (Figure 8).

4. Characteristics of the VE Systems under the Wind-Induced Response

The frequency sensitivities of different numerical VE systems lead to significant differences in the steady-state results, which are expressed in Section 3. Section 4 is going to discuss the effect of frequency sensitivity of the VE systems on along-and across-wind responses. Since the FD system is more complex, having higher accuracy to describe the dynamic characteristics than the ID systems (the 4-element and 6-element systems). Thus, the wind-induced responses of the FD system are expressed at first. Then, the comparison of the 4-element and 6-element systems with the FD system is discussed, respectively.

4.1. Wind Force

Wind force employs wind tunnel test results with a return period of 500 years [40]. The airflow in the experiment is determined by referring to the AIJ recommendation for loads on buildings [3] (terrain: III; directional angle: 0°). The design wind speed at the top of the building is 57.9 m/s.
Figure 10 show the time history samples of the 1 st modal wind force in the (a) along-wind and (b) across-wind directions, where t is time. To avoid the transient response in the time-history analysis of the along-wind force, the first and last 50 s are modified by envelope.
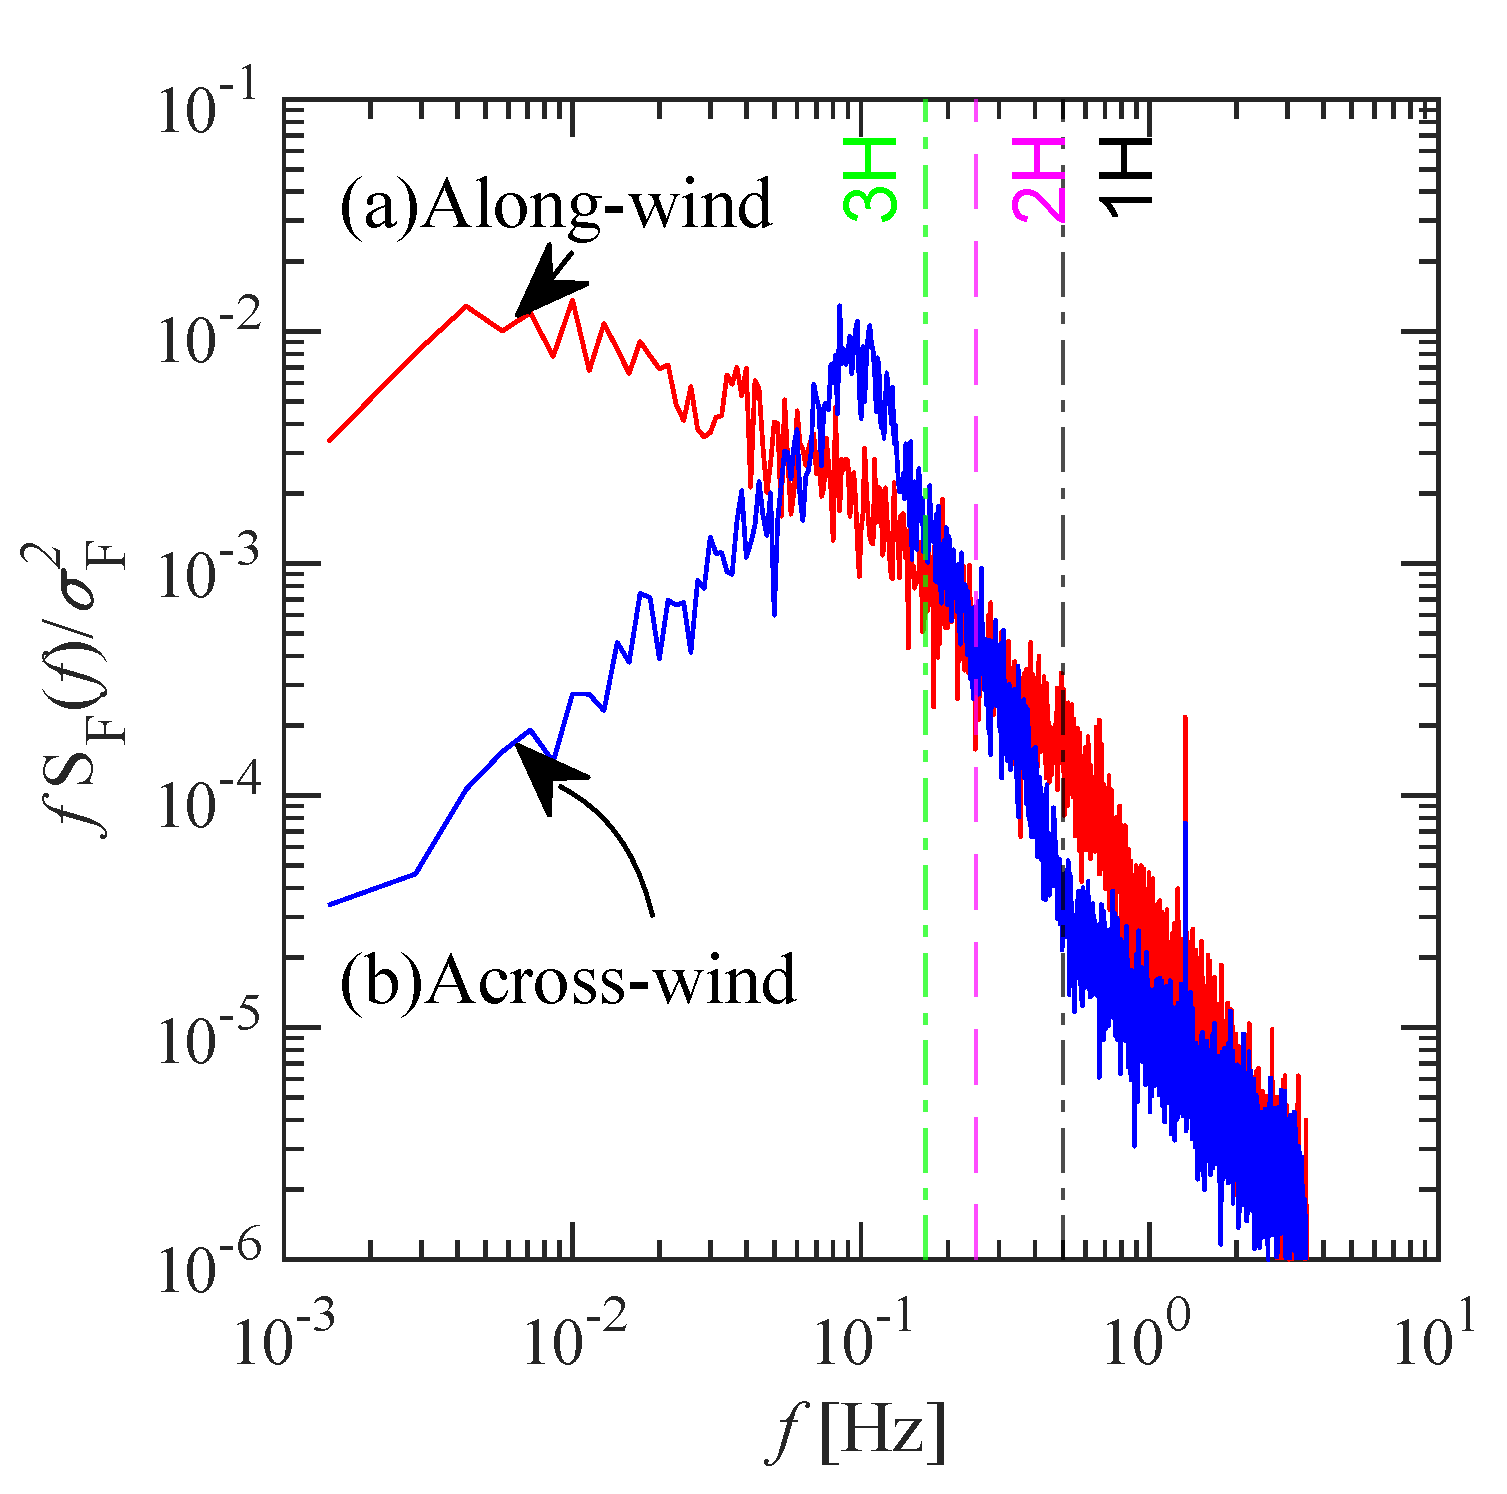
Figure 11 shows the ten-ensemble-averaging normalized power spectral density (PSD) of the 1 st modal wind force in the along-wind and across-wind directions, respectively, where f is frequency, S F is the spectral density of wind force, and σ F is the standard deviation of wind force. Compared with the resonance frequencies of target buildings (3H-frame of 0.167 Hz , 2H-frame of 0.25 Hz , and 1H-frame of 0.5 Hz ), the PSD of the along-wind has high power at low frequencies with wide-band frequencies. In contrast, the PSD of the across-wind has narrow-band frequencies and a peak around the frequency of 0.1 Hz, which is lower than the resonance frequencies of target buildings. The difference between the peak power of the across-wind force and the resonance frequencies of the target buildings is 3H < 2H < 1H.

4.2. Wind-Induced Response of FD Systems

The analysis of the along- and across-wind responses of the FD system are discussed in this section. The time history analysis with time steps of Δ t = 0.05 s, 14 , 000 data, and total execution time of t = 700 s, which includes wind force of 600 s and the envelopes at the first and last 50 s. A total of 600 s (50 s to 650 s) wind-induced responses are used in the analysis. The numerical integration method of the FD system (model) in the time history analysis is expressed in Appendix B. In the time history analysis for the FD model, to promote the accuracy of describing the VE behavior, the window time is used to calculate the deformation history for the integration interval, but it costs time [18]. To reduce the operation time of the simulation, Kasai et al. (2001) determined the window time using 1.5 times of natural period ( T w = 1.5 T n ) [18]. As a result, the window time ( T w ) uses T w = 1.5 T n when subjected to the across-wind force, the same setting as Kasai et al. (2001) [18]. However, T w = 1.5 T n cannot provide enough accuracy for the along-wind response. To obtain a more accurate along-wind response, a window time larger than 60.0 T n is needed (Appendix C). In this study, T w = 60 T n is set for analysis subjected to the along-wind force. Note that, the window time subjected to harmonic waves (Figure 8 and Figure 9) in Section 3 is T w = 1.5 T n .
Figure 12 and Figure 13 show the normalized PSD of the along- and across-wind (a) displacement, (b) velocity, and (c) acceleration of the 2H-HH system and 2H-SS system, respectively.
For the response in PSD of the 2H-HH system:
-
In Figure 12a, the along-wind displacement has high power with wide-band frequencies in the low-frequency region. However, the across-wind displacement has high power around 1.0 Hz.
-
In Figure 12b, the along-wind velocity has high power close to the resonance frequency ( f n ). In contrast, the across-wind velocity spectrum has high power in a range from 1.0 Hz to the resonance frequency ( f n ).
-
In Figure 12c, the along-wind acceleration has a similar tendency with its velocity, having high power close to the resonance frequency ( f n ). Similarly, the across-wind acceleration has high power close to the resonance frequency.
For the response in PSD of the 2H-SS system:
-
In Figure 13a, the along-wind displacement has significantly high power close to the resonance frequency ( f n ) and a wide band of the low-frequency region. However, the across-wind displacement has high power between 1.0 Hz and the resonance frequency ( f n ).
-
In Figure 13b, either the along-wind or across-wind velocity has high power close to the resonance frequency ( f n ). Similarly, the acceleration (Figure 13c) has the same tendency as the velocity.
Figure 14 shows the results of the mean along-wind displacement, velocity, and acceleration of systems, respectively. The mean displacement u ¯ (Figure 14a) decreases as the resonance frequency of the frame increases (Table 1). The mean displacement is caused by the statics storage stiffness of the system ( lim f 0 K ( f ) ). Therefore, the mean displacement of the 1H-HH system is the smallest of all because of the highest static storage stiffness of the system. In contrast, the mean displacement of the 3H-SS system is the biggest because of the smallest static storage stiffness ( lim f 0 K ( f ) ). Figure 14b,c show that the mean velocity v ¯ and acceleration a ¯ are close to zero.
Figure 15 shows the comparison in standard deviation of the along-wind displacement σ u , velocity σ v , and acceleration σ a of the FD systems. The standard deviation of displacement (Figure 15a) decreases as the resonance frequency f n of the system increases since the effect on wind-induced response is based on the resonance frequency of the system (Figure 11). The velocity (Figure 15b) and acceleration (Figure 15c) exhibits the same trend as displacement (Figure 15a).
Figure 16 shows the comparison in standard deviation of the across-wind displacement σ u , velocity σ v , and acceleration σ a of systems, respectively. They follow the same tendency with the along-wind responses (Figure 15).

4.3. Response Comparison between ID Systems and FD System in Along-Wind

Along-wind responses of the ID systems (the 4-element and 6-element systems) are investigated and compared with the FD system in this section. The results of the 2H-HH and 2H-SS systems are expressed. A total of 600 s (from 50 s to 650 s) of the wind-induced responses are considered for the analysis.
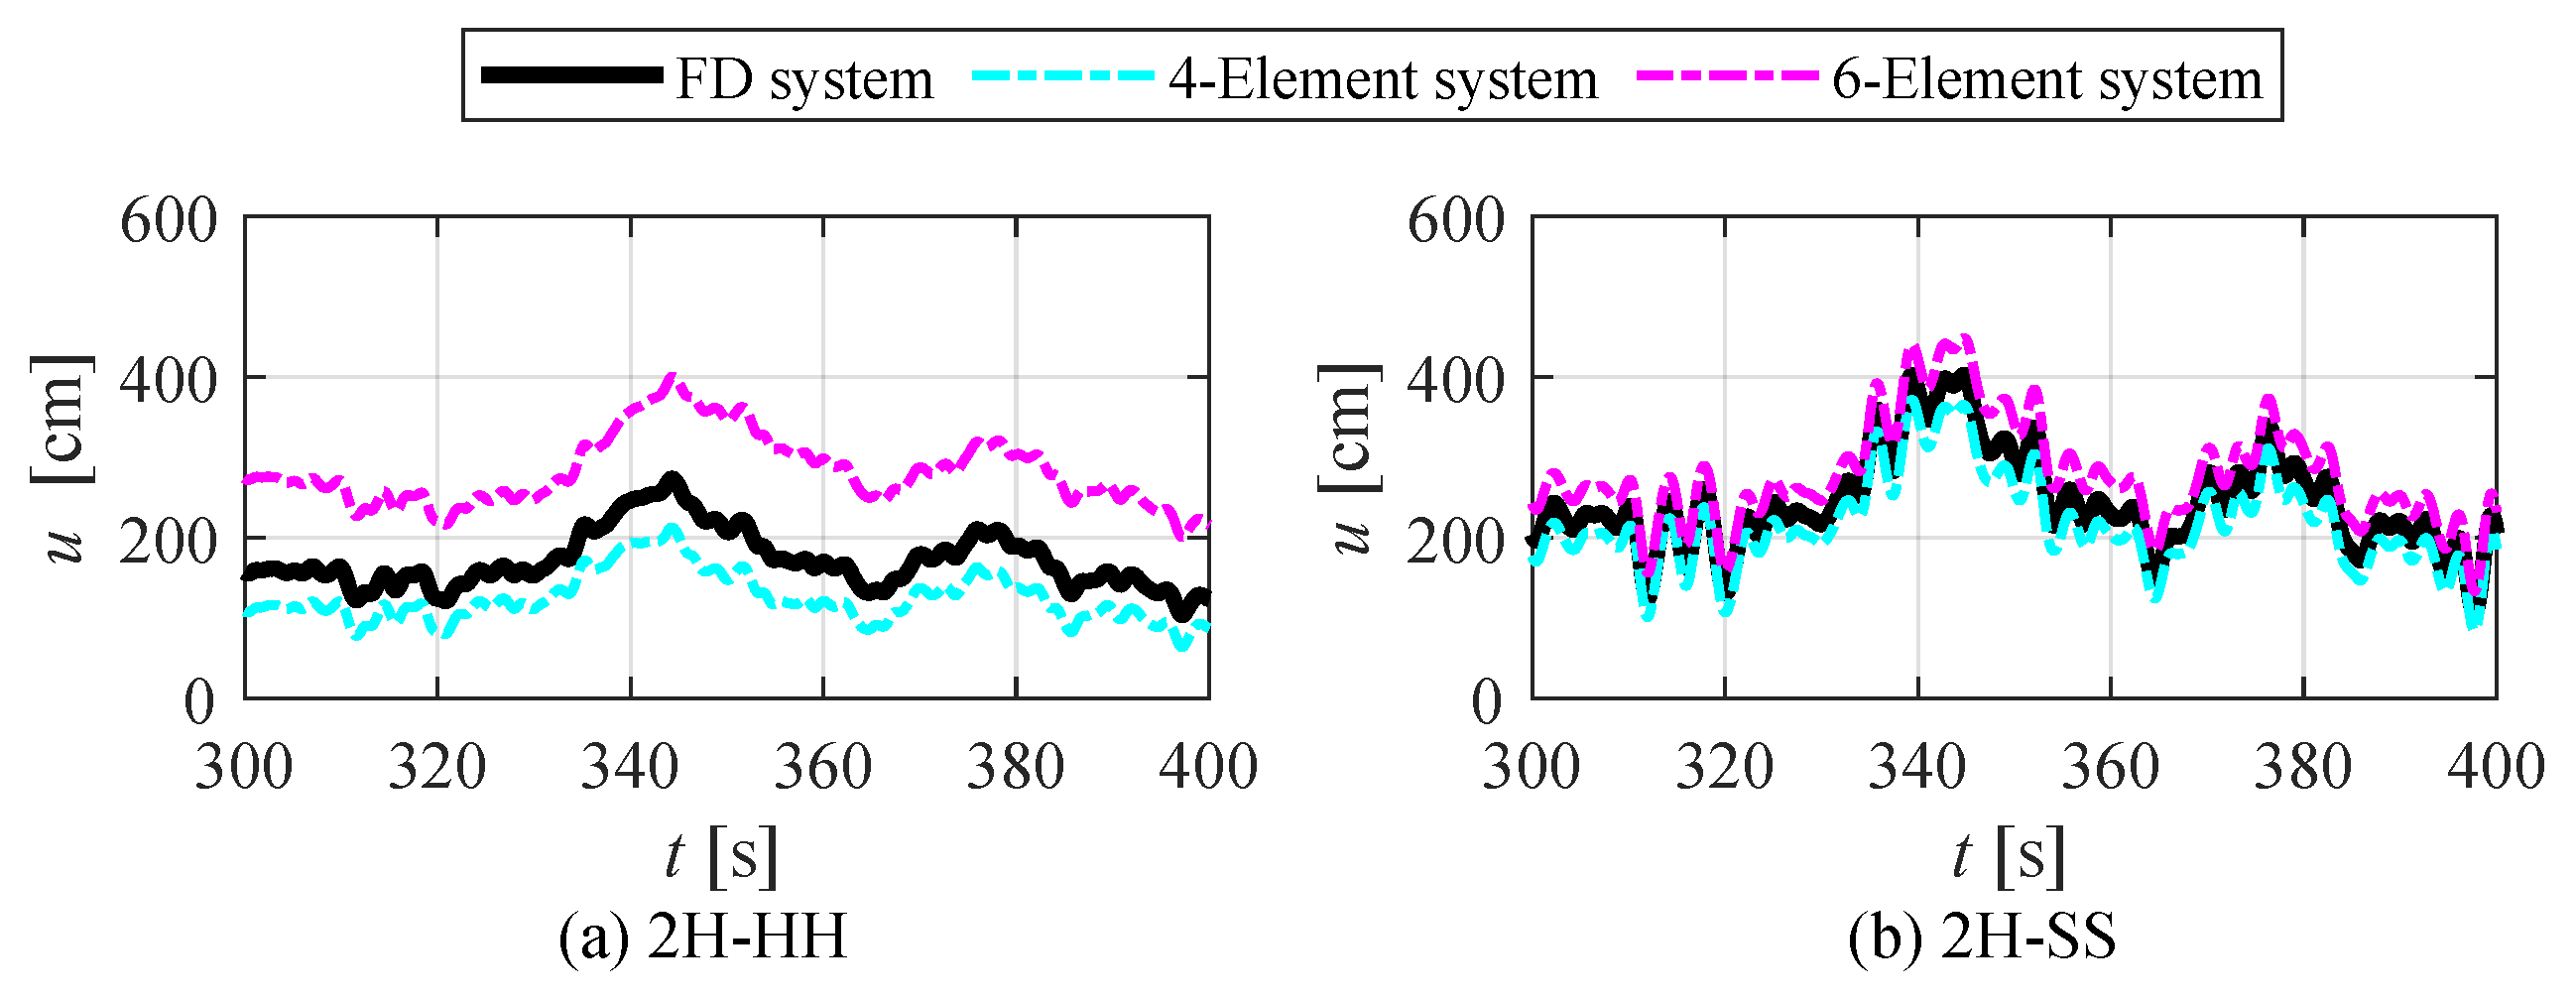
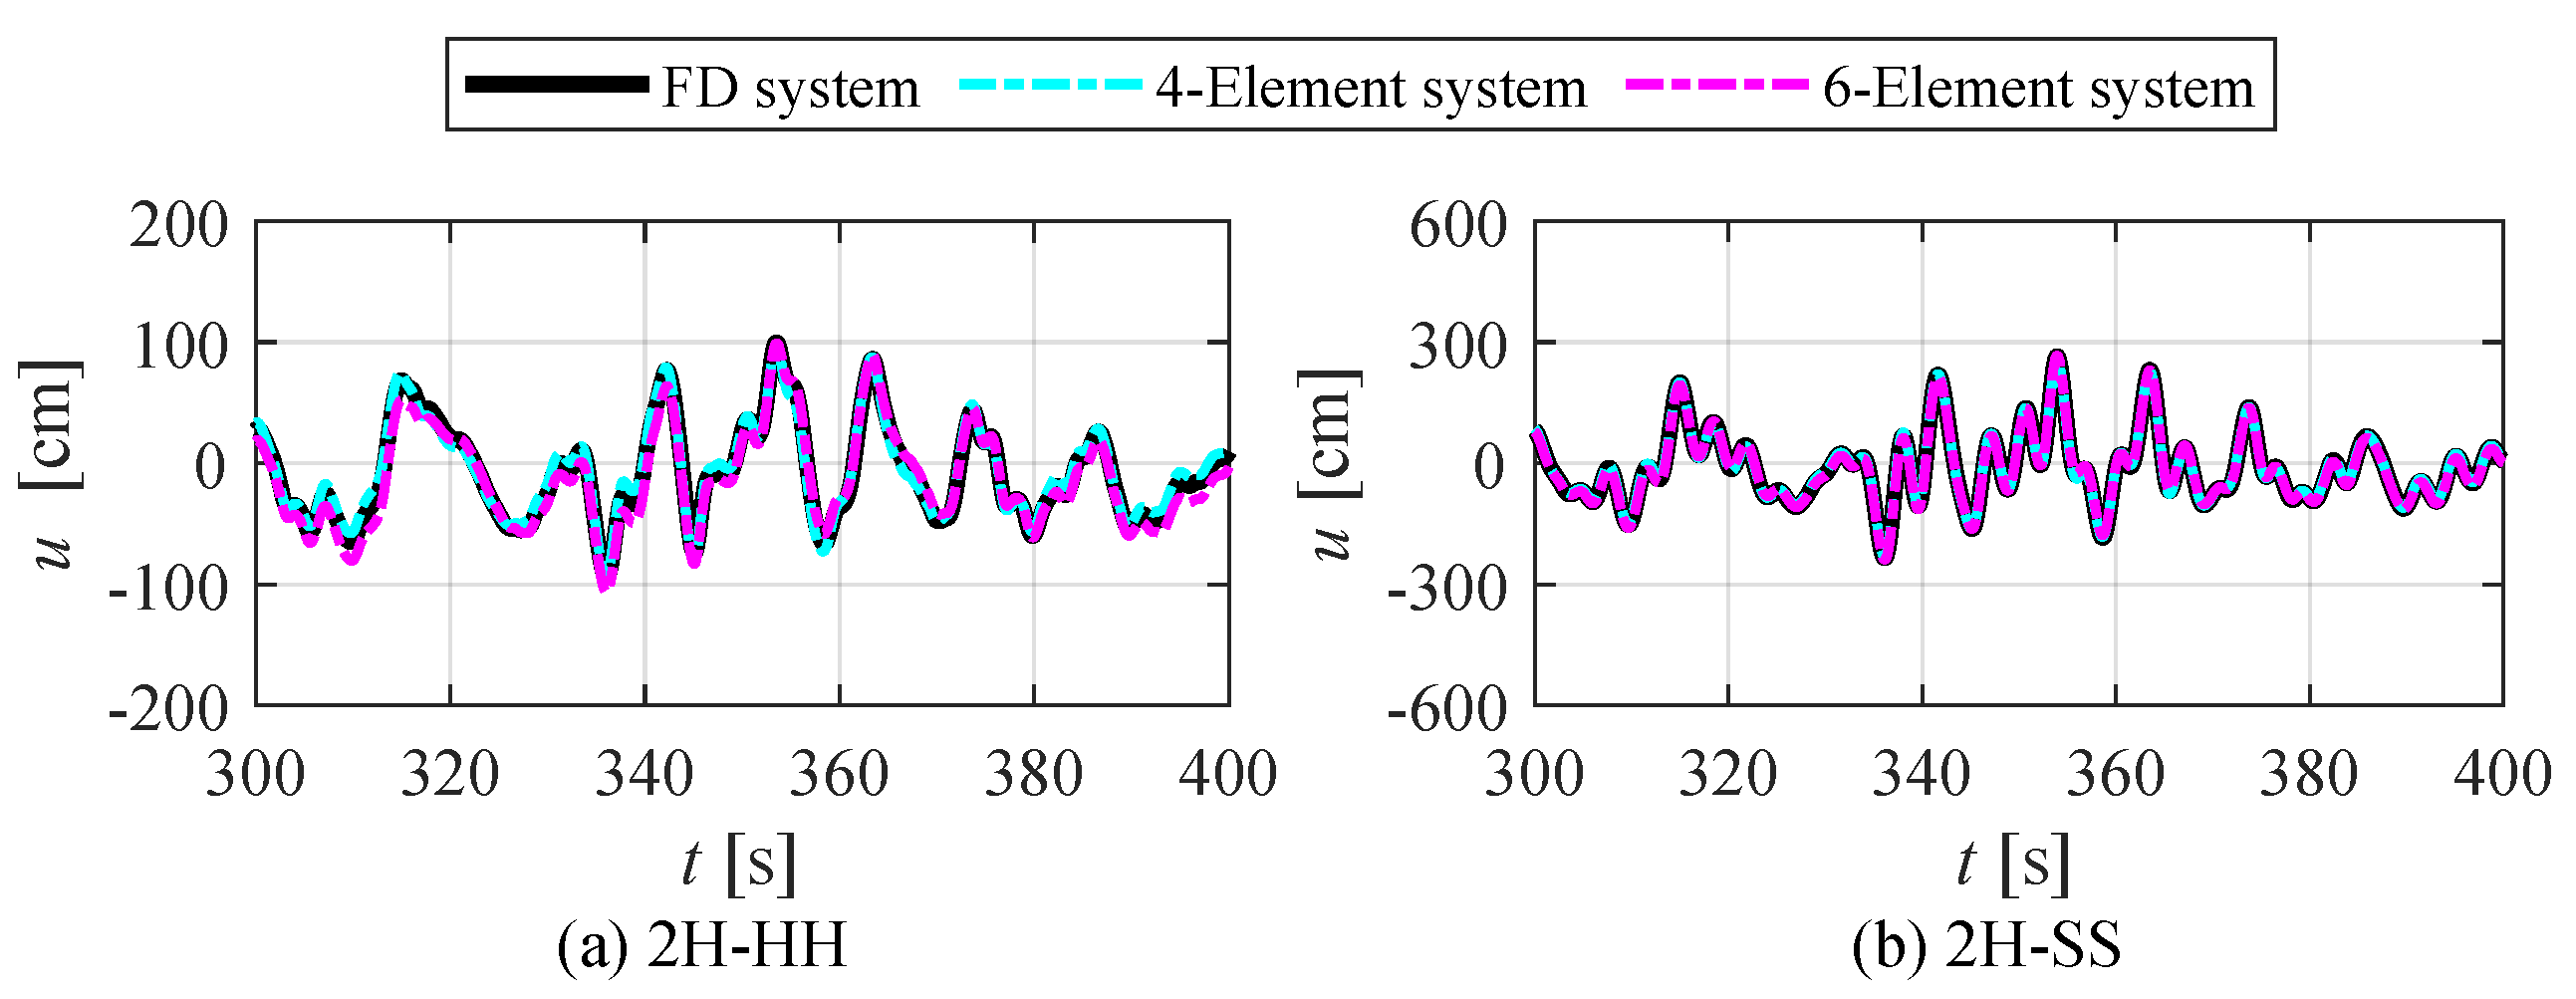
Figure 17 shows the time-history analysis (300–400 s) of the along-wind displacement in comparing the 4-element and 6-element systems with the FD system. In the time-history analysis of the 2H-HH system (Figure 17a), the difference in the along-wind displacement among the 4-element and 6-element systems and FD system is massive because the along-wind response of the 2H-HH system has high power in the low-frequency region (Figure 12), and the frequency sensitivity of three systems (FD system, 4-element system, and 6-element system) in the low-frequency region is significantly different (Figure 6). On the other hand, in the time-history analysis of 2H-SS system (Figure 17b), the along-wind displacement of the 4-element and 6-element systems and FD system aligns well, since it is mainly influenced by a high power close to the resonance frequency (Figure 13), and the frequency sensitivity of three systems at the resonance frequency has good agreements, the detail is discussed in Section 3.
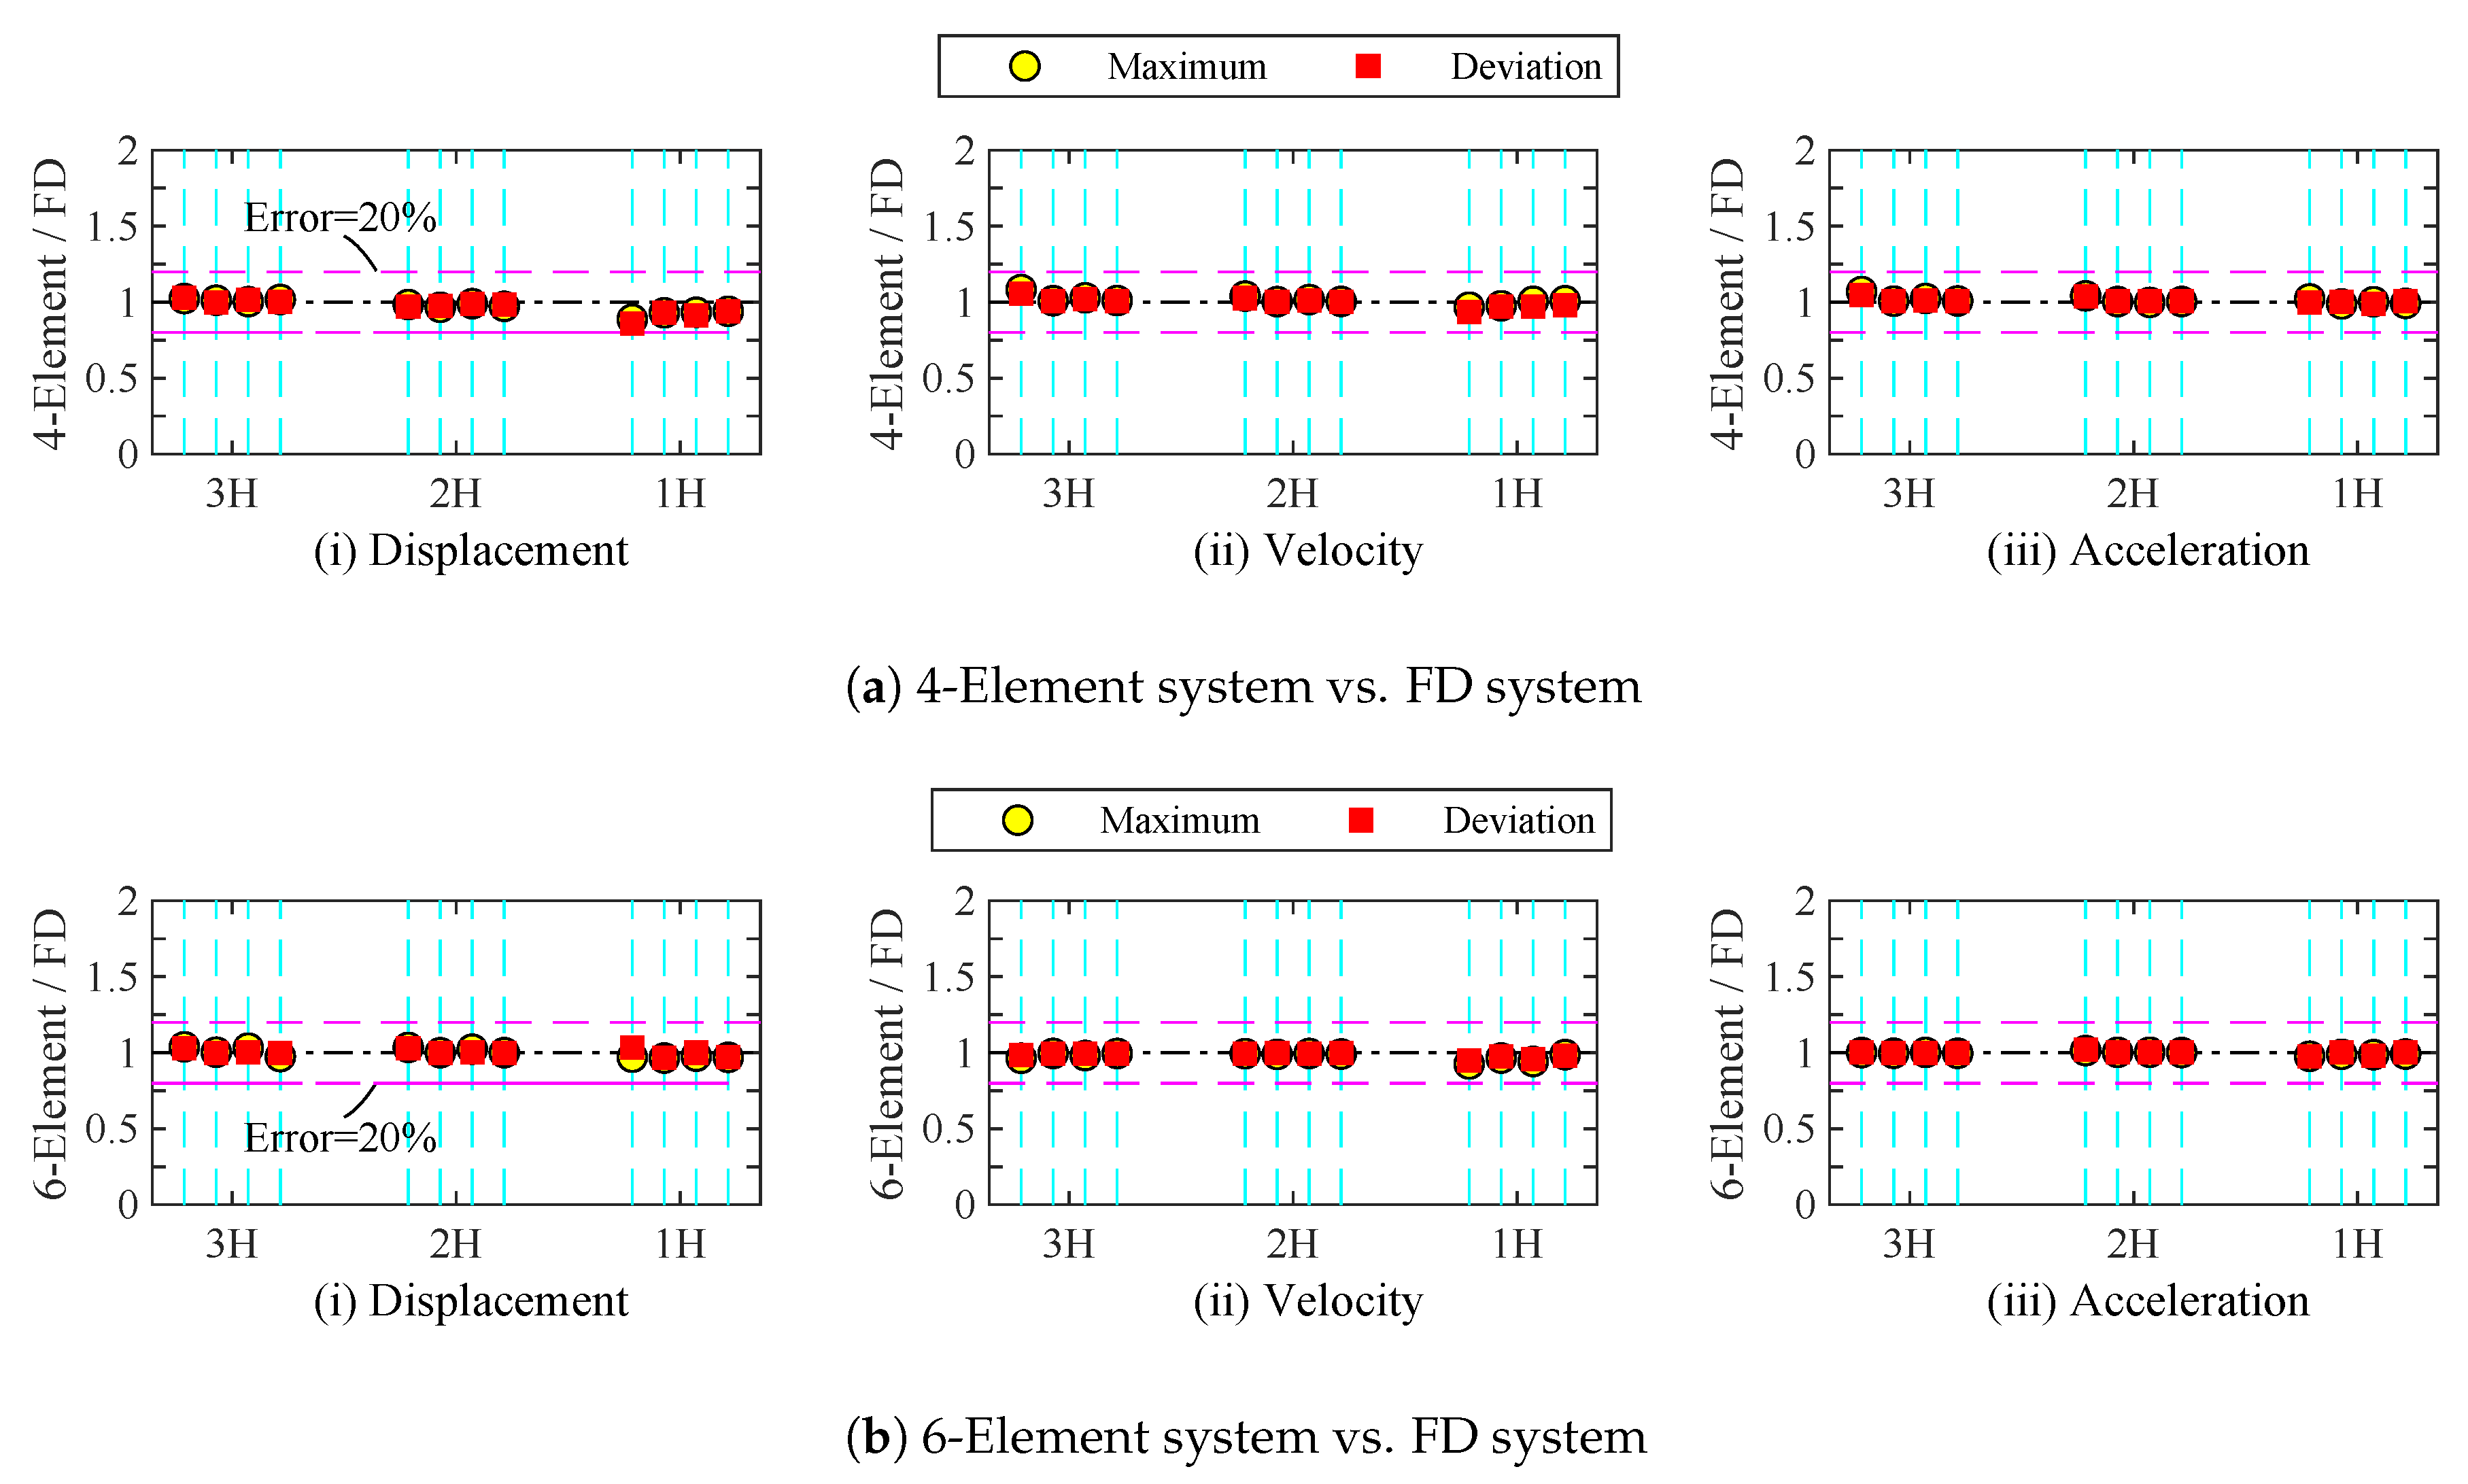
Figure 18a,b shows the comparison of the along-wind responses of (a) the 4-element system and (b) the 6-element system with the FD system, respectively. Note that, the four parallel broken cyan line of each group is HH, SH, HS, and SS added components from left to right, whose groups are separated by 1H, 2H, and 3H of frames (Table 1).
In Figure 18a, the following results of the 4-element system compared with the FD system are obtained:
-
The mean, maximum, and standard deviation of the along-wind displacement of the 4-element system is smaller than the FD system. It shows that the difference increases as the storage stiffness of the damper increases.
-
When the ratio of storage stiffness of the damper ( K d / K f ) is 2.0 (as an added component is -HH or -HS), the difference of the mean, maximum, and standard deviation of the along-wind displacement between the 4-element system and the FD system is about 20 % .
-
The differences in the maximum and standard deviation of the along-wind velocity and acceleration of the 4-element system remain aligned with the FD system.
In Figure 18b, the following results of the 6-element system compared with the FD system are obtained:
-
The mean, maximum, and standard deviation of the along-wind displacement of the 6-element system is larger than the FD system. It shows that the difference increases as the storage stiffness of the damper increases.
-
When the ratio of storage stiffness of the damper ( K d / K f ) is 2.0 (as an added component is -HH or -HS), the difference of the mean, maximum, and standard deviation of the along-wind displacement between the 6-element system and the FD system is over 20 % . In contrast, when the ratio of storage stiffness of the damper ( K d / K f ) is 0.4 (as an added component is -SH or -SS), the difference of the mean, maximum, and standard deviation of the along-wind displacement between the 6-element system and the FD system is about 20 % .
-
The differences in the maximum and standard deviation of both along-wind velocity and acceleration of the 6-element system also remain aligned with the FD system.
In summary, due to the influence caused by the resonance frequency being significant when the damper has low storage stiffness, the 4-element and 6-element systems have similar along-wind responses with the FD system.
In addition, to evaluate the effect of frequency sensitivity on energy dissipation of the VE dampers, the comparison of the 4-element and 6-element systems with the FD system in hysteresis loops, accumulated energy dissipation, and total energy dissipation are discussed as follows.
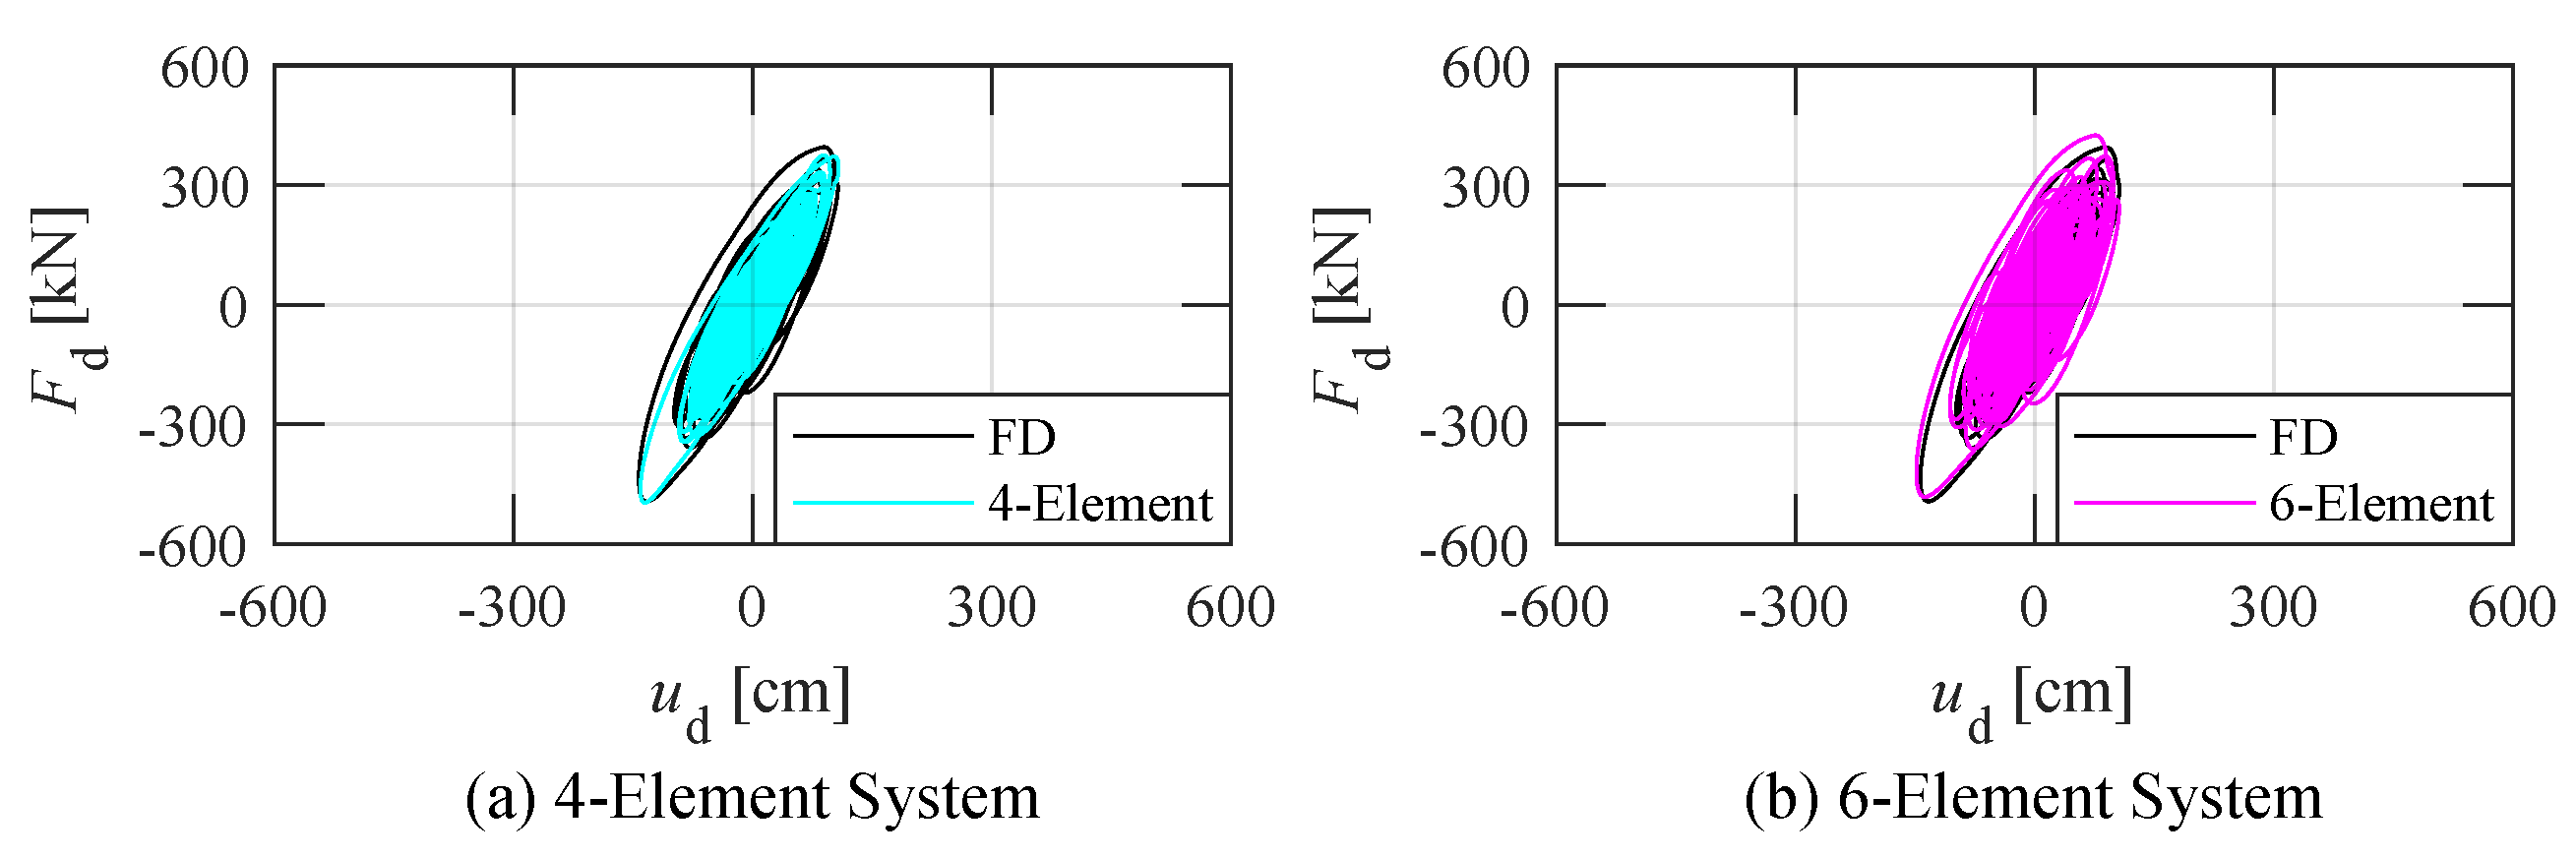
Figure 19 shows the comparison of hysteresis loops of the VE dampers in the 2H-HH system when subjected to along-wind. Figure 19a expresses that the slope (storage stiffness) of the hysteresis loop of the 4-element system is higher than the FD system, and the mean deformation is smaller than the FD system. Figure 19b expresses that the slope (storage stiffness) of the hysteresis loop of the 6-element system is smaller than the FD system, and the mean deformation is higher than the FD system.
Figure 20 shows the comparison of hysteresis loops of the VE dampers in the 2H-SS system when subjected to along-wind. The trend of hysteresis loops is close to the results of the 2H-HH system. The hysteresis loops of the ID systems (the 4-element and 6-element systems) align with the FD system better than the 2H-HH system. In summary, they are affected by the influence of frequency sensitivity of the VE systems (see Figure 7).
Moreover, the 4-element model and 6-element model align with the FD model, which is better than the Kelvin model and Maxwell model used in Sato et al. (2009) [25], the detail is presented in Section 3.
Based on the hysteresis loops of the VE dampers, the accumulated energy dissipation W d ( t ) of the VE dampers can be obtained by Equation (13). Where v d ( t ) is the velocity of the damper.
W d ( t ) = 0 t F d ( t ) v d ( t ) dt .
Figure 21 illustrates the accumulated energy dissipation W d ( t ) of the VE dampers in the along-wind direction. The difference in the accumulated energy dissipation of the VE dampers in the 2H-HH system among the 4-element and 6-element systems and the FD system is significant when subjected to along-wind. The accumulated energy dissipation of the 4-element system is lower than the FD system, but the 6-element system is higher than the FD system. In contrast, the difference in the accumulated energy dissipation of the VE dampers in the 2H-SS system is minor.
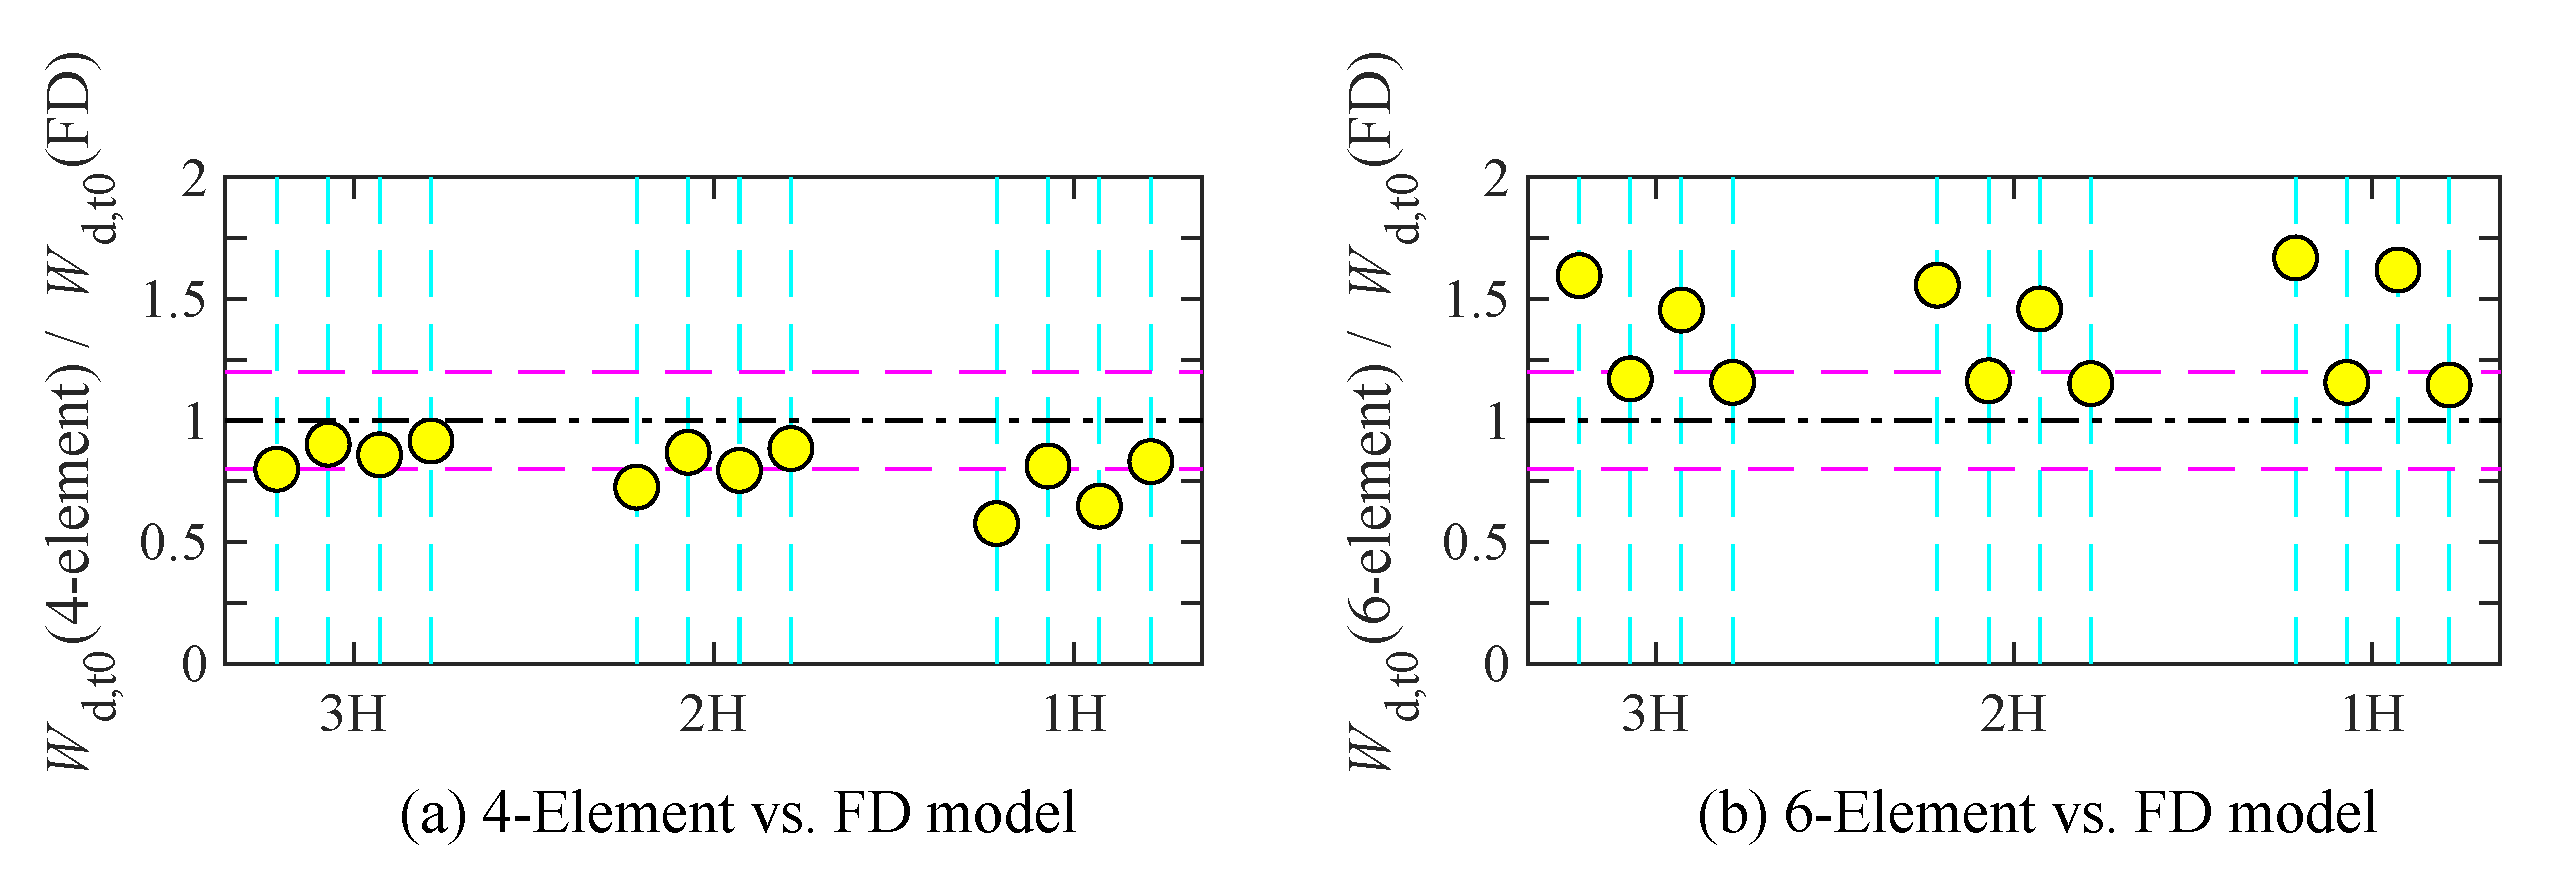
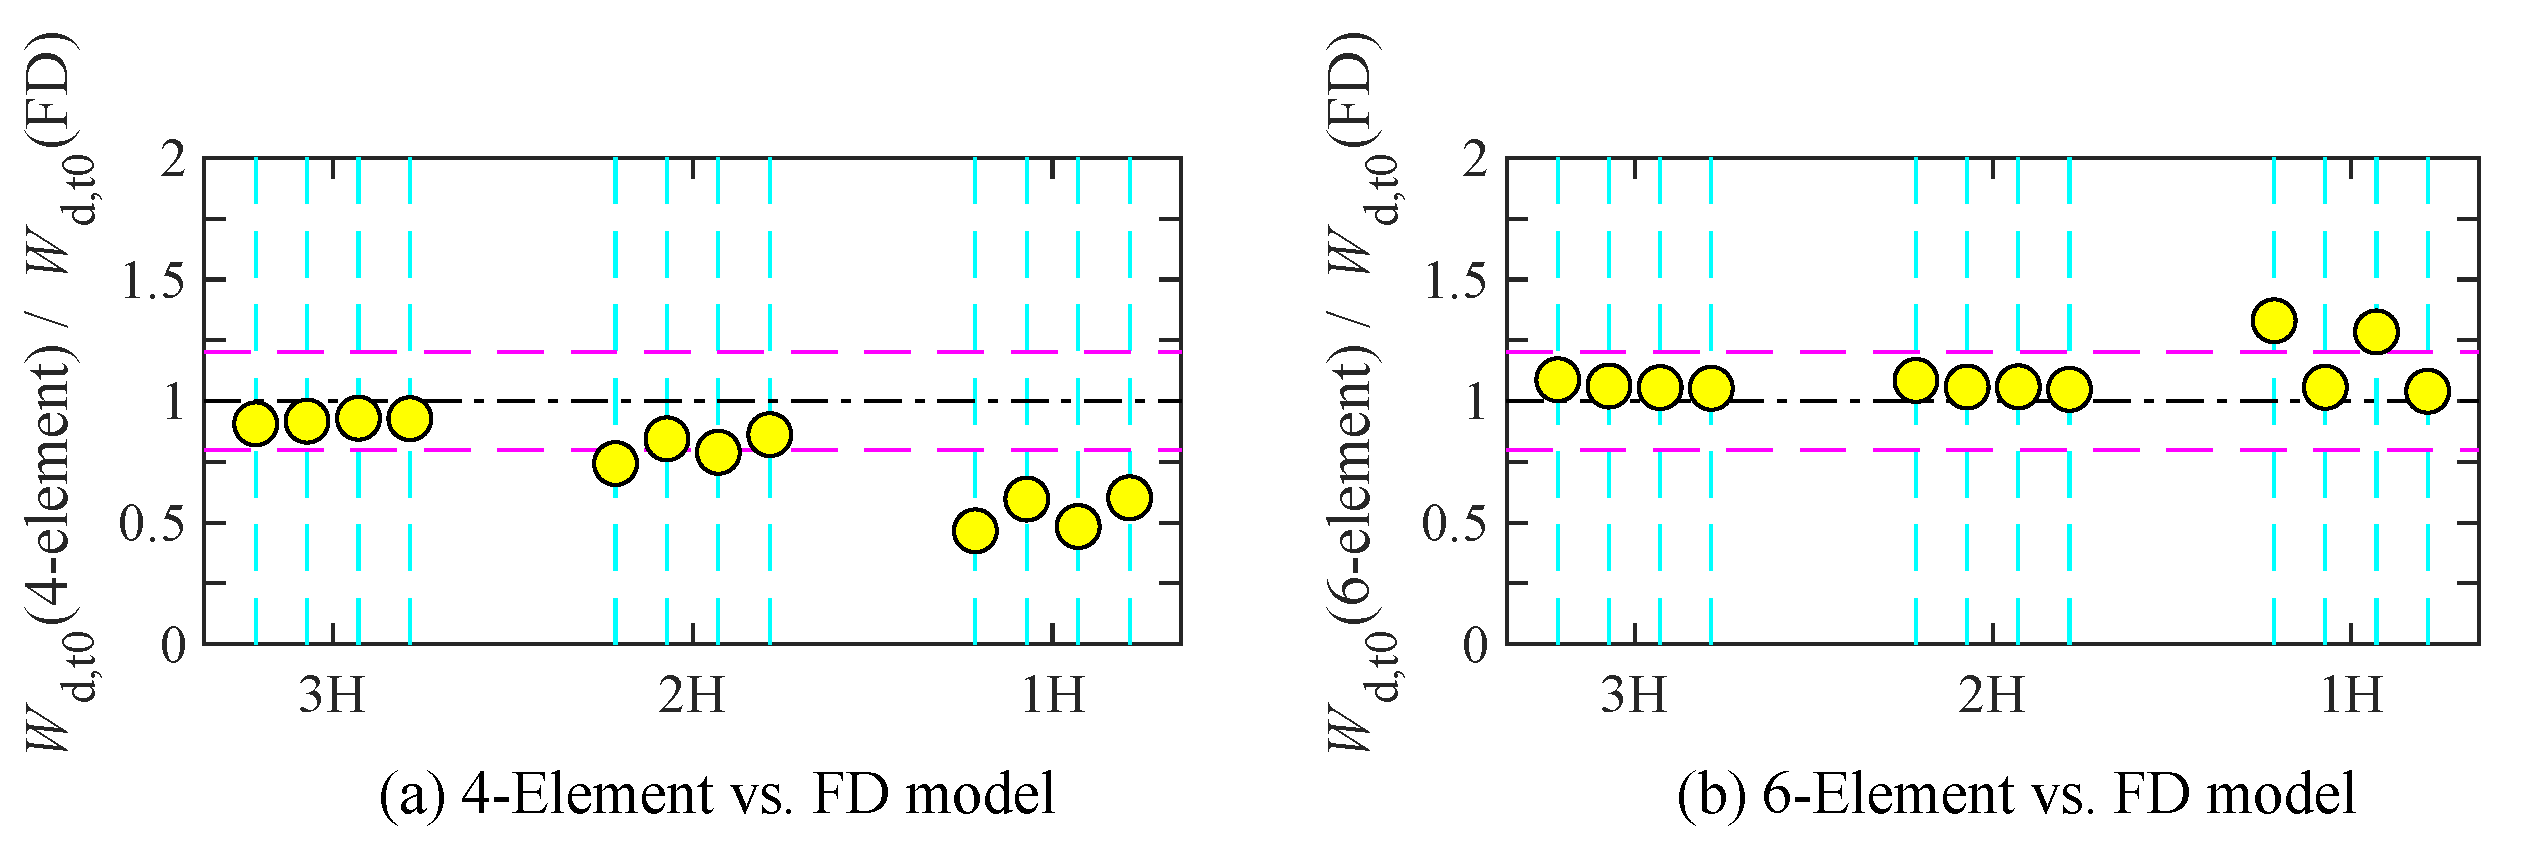
In this study, a total of t 0 = 700 s is considered for energy dissipation. Figure 22 illustrates the comparison of the total accumulated energy dissipation W d , t 0 = W d ( t 0 ) when subjected to along-wind. It compares the differences in (a) the 4-element and (b) the 6-element with the FD system. Figure 22a expresses that the difference in the total accumulated energy dissipation increases as the storage stiffness of the damper increases, and it is under-evaluated. Figure 22b expresses that the 6-element system has a similar trend as the 4-element system, but the differences are over-evaluated and large.

4.4. Response Comparison between ID Systems and FD System in Across-Wind

Across-wind responses of the ID systems (4-element and 6-element systems) are investigated and compared with the FD system in this section.
Figure 23 shows the time-history analysis (300–400 s) of the across-wind displacement in comparing the 4-element and 6-element systems with the FD system. The agreements of the across-wind displacement among the 4-element and 6-element systems and the FD system of both the 2H-HH system and 2H-SS system are well since the main influence by a high power close to the resonance frequency (Figure 12 and Figure 13). Thus, compared with the along-wind response, the across-wind responses align well since the resonance frequency is close to the narrow band of the dominated frequency in the across-wind force.
Figure 24 shows the comparison of the across-wind responses of (a) the 4-element system and (b) the 6-element system with the FD system, respectively. The following results of the 4-element and 6-element systems compared with the FD system are obtained: The maximum and standard deviation of the across-wind displacement, velocity, and acceleration of the 4-element and 6-element systems remain aligned with the FD system. Thus, compared with the along-wind response (Figure 12 and Figure 13), the across-wind responses of the 4-element and 6-element systems are close to the FD system because the influence caused by the resonance frequency on across-wind is greater than along-wind.
Figure 25 shows the comparison of hysteresis loops of the VE dampers in the 2H-HH system when subjected to across-wind. The hysteresis loops of the 2H-HH system of the 4-element and 6-element systems align with the FD system well. Similarly, Figure 26 shows good agreements in the 2H-SS system of the 4-element and 6-element systems compared with the FD system. It is because the across-wind response is dominated by the resonance frequency (Figure 12 and Figure 13). Furthermore, the frequency sensitivity of the 4-element, 6-element, and the FD system at the resonance frequency has good agreements, the detail is discussed in Section 3.
Figure 27 illustrates the accumulated energy dissipation W d ( t ) of the VE dampers when subjected to across-wind. The accumulated energy dissipation of the 6-element system aligns with the FD system well. The accumulated energy dissipation of the 4-element is lower than the FD system with a significant difference. Compared with the along-wind, the across-wind energy dissipation has good agreement because the across-wind response is dominated by the resonance frequency and the narrow-band frequencies (see Figure 12 and Figure 13). The frequency sensitivity of the 4-element, 6-element, and the FD systems at the resonance frequency has good agreements.
Figure 28 illustrates the comparison of the total accumulated energy dissipation W d , t 0 = W d ( t 0 ) when subjected to the across-wind. It compares the differences in (a) the 4-element and (b) the 6-element with the FD system. Figure 28a expresses that the difference in the total accumulated energy dissipation increases as the storage stiffness of the damper increases, and it is under-evaluated. Figure 28b expresses that the 6-element system has a similar trend as the 4-element system, but the difference is over-evaluated. Total accumulated energy dissipation subjected to across-wind has a similar tendency as along-wind, but the results are better.
In summary, the across-wind response is dominated by the narrow-band frequencies, and the along-wind response is dominated by the wide-band with low frequencies (see Figure 12 and Figure 13).

5. Conclusions

This study compared the frequency sensitivities among three different numerical models (fractional derivative (FD) model, 4-element model, and 6-element model) of viscoelastic damper (VE system), using SDOF models and considering wind-induced responses along with energy dissipation. These models were set to lead to the same dynamic characteristics at the resonance frequency. The time-history analysis was used in this study. The findings of the along- and across-wind responses of the FD system, the 4-element system, and the 6-element system are shown as follows:
In the along-wind direction:
-
The along-wind displacement of the 4-element and 6-element systems with the dampers of high storage stiffness has obvious differences with the FD system due to low frequency and the wide-band frequencies dominating the behavior of the VE system significantly. Furthermore, the frequency sensitivity of the 4-element and 6-element systems and the FD system have massive differences at low frequencies.
-
The along-wind displacement of the 4-element and 6-element systems with the dampers of low storage stiffness has better agreement with the FD system due to the resonance frequency dominating the behavior of the VE systems significantly, and the frequency sensitivity of VE systems having good agreements at the resonance frequency. Similarly, the hysteresis loops of the 4-element and 6-element systems with low storage stiffness align well with the FD system. The energy dissipation and the mean deformation of the 4-element and 6-element systems are also matching well with the FD system, respectively.
In the across-wind direction:
-
The responses and the hysteresis loops of the 4-element and 6-element systems have good agreements with the FD system due to the narrow-band frequencies being close to the resonance frequency along with the alignment of frequency sensitivity at resonance frequency dominating the across-wind response, which is more tremendous than the along-wind response.
-
The energy dissipation of the 6-element systems has better matching with the FD systems than the 4-element systems since the 6-element system has better agreement with the FD system at the resonance frequency than the 4-element system.
The results of this study suggest that the 4-element and 6-element systems have the benefit of modeling high-rise buildings equipped with VE dampers considering frequency sensitivities to match the wind-induced responses and energy dissipation.
Extending the consideration of the higher modes effect and the coupling of along-wind, across-wind, and torsion effect on high-rise buildings with VE dampers are future works.

Author Contributions

Conceptualization, D.S. and T.-W.C.; methodology, D.S. and T.-W.C.; software, T.-W.C.; validation, D.S. and T.-W.C.; formal analysis, D.S. and T.-W.C.; investigation, T.-W.C.; data curation, T.-W.C.; writing—original draft preparation, T.-W.C.; writing—review and editing, T.-W.C. and Y.C.; visualization, T.-W.C.; supervision, D.S.; project administration, D.S. All authors have read and agreed to the published version of the manuscript.

Funding

This research received no external funding.

Data Availability Statement

The data that support the findings of this study are available from the corresponding author, T.-W.C., upon reasonable request.

Conflicts of Interest

The authors declare no conflict of interest.

Appendix A. Frequency Sensitivity of the Damping Coefficient in the VE System
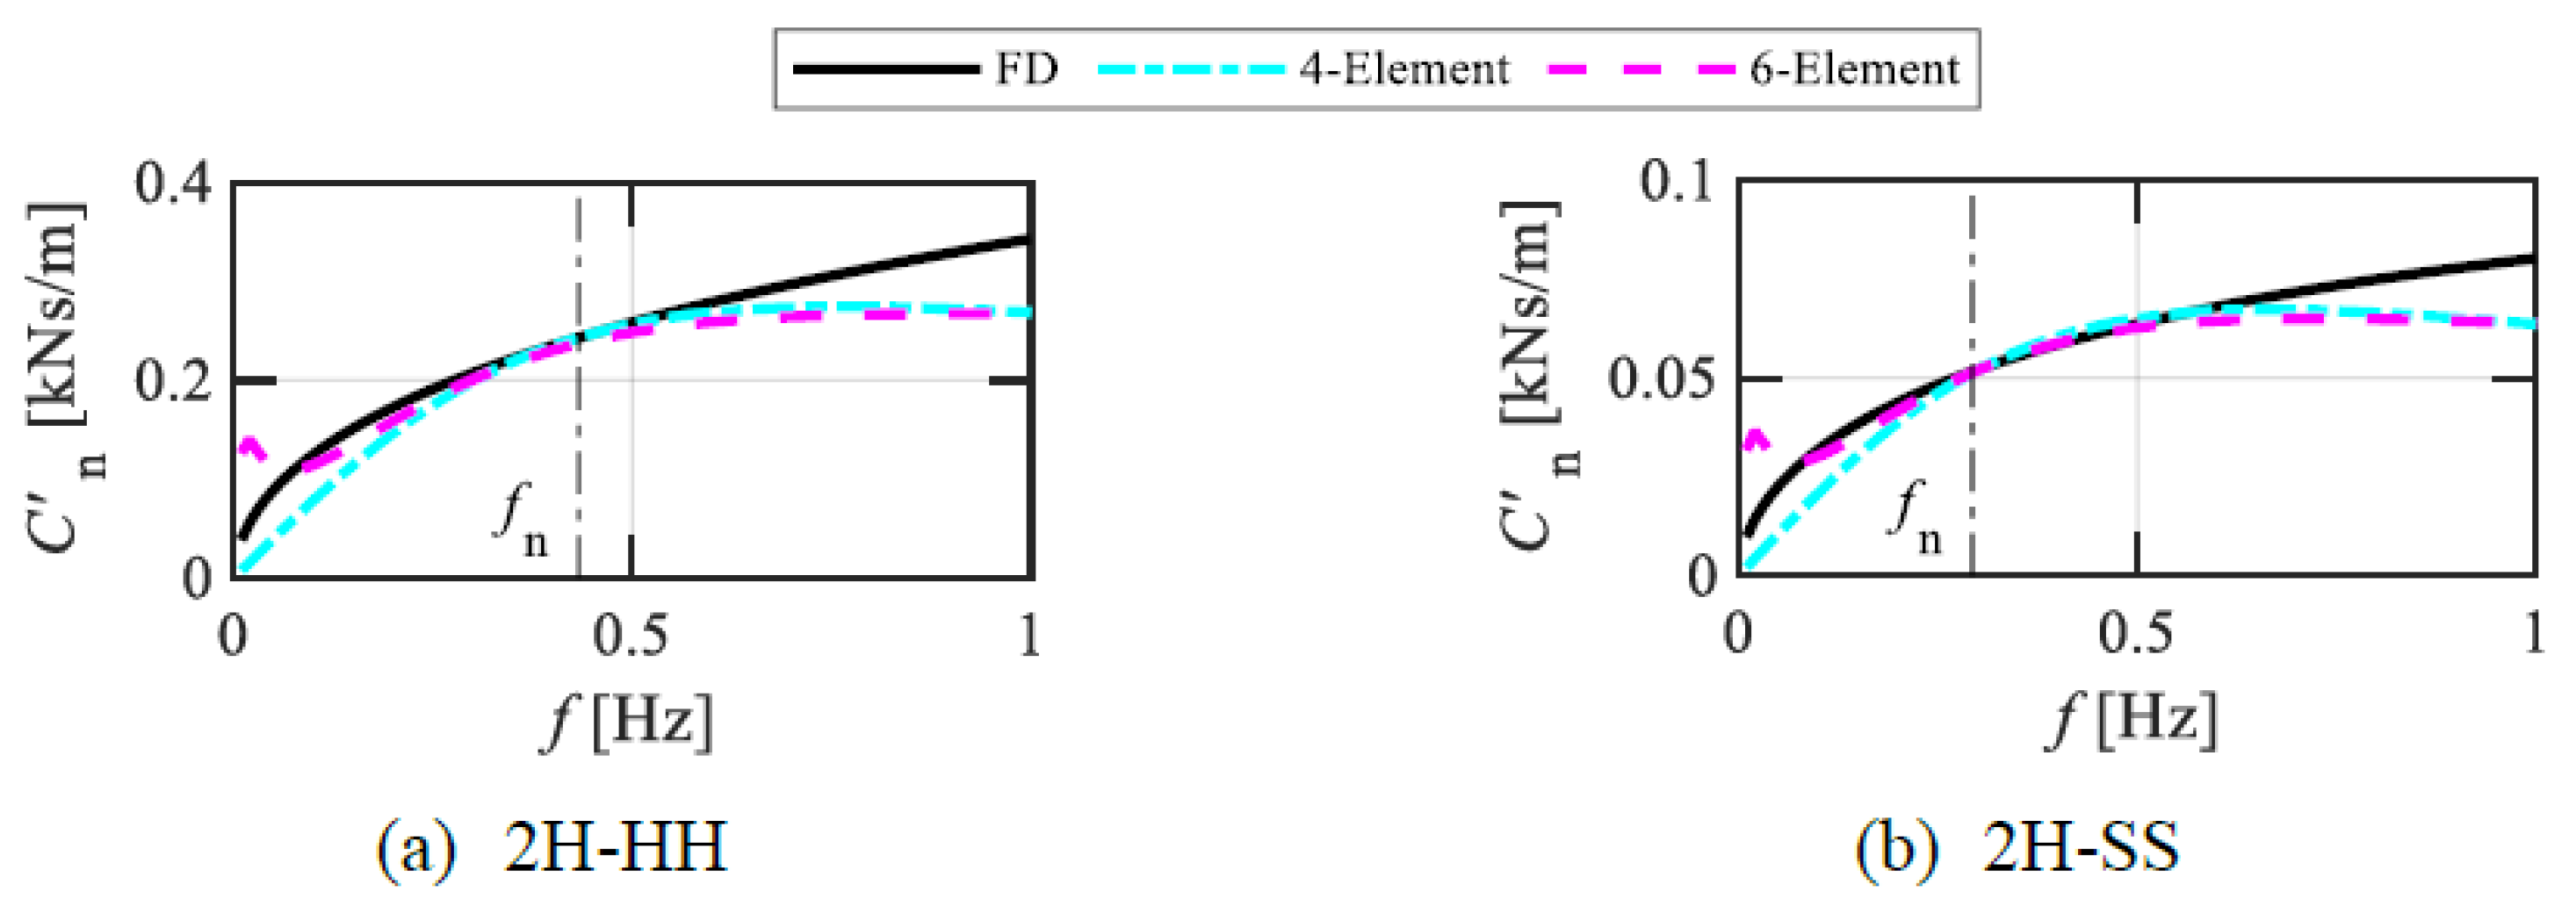
Figure A1 shows the frequency sensitivity of the damping coefficient C n of the 2H-HH and 2H-SS system, which is given by Equation (4c). In Figure A1, the damping coefficient C n of the FD model is small when the frequency is close to zero, and it increases as the frequency increases. C n of the 4-element and 6-element models have the same trend as the FD model.
Figure A1. Effect of frequency sensitivity on the damping coefficient of VE system.
Buildings 12 02182 g0a1

Appendix B. Numerical Integration Method of the Fractional Derivative Model [18,27]

Based on the algorithm of the Riemann–Liouville method (L1), the operator of the FD model is expressed by Equation (A1) when j > α 0 .
D α y ( t ) = d α y ( t ) d ( t s ) α 1 Γ ( j α ) d j d t j s t y ( ξ ) ( t ξ ) α n + 1 d ξ .
where s and n are integers, and Γ is a gamma function. When α < 0 , the operator of the FD model is given by Equation (A2).
D α y ( t ) = d α y ( t ) d ( t s ) α = 1 Γ ( α ) 0 t y ( ξ ) ( t ξ ) α 1 d ξ .
By substituting s as 0 and j as 1, the operator of the FD model leads to Equation (A3).
D α y ( t ) = d α y ( t ) d t α = 1 Γ ( 1 α ) d d t s t y ( ξ ) ( 1 ξ ) α d ξ .
After integrating by part, the operator of the FD model leads to Equation (A4).
D α y ( t ) = 1 Γ ( 1 α ) d d t y ( ξ ) ( t ξ ) α + 1 α + 1 0 t + 0 t y ˙ ( ξ ) ( t ξ ) α + 1 α + 1 d ξ , = 1 Γ ( 1 α ) y ( 0 ) t α + 0 t y ˙ ( ξ ) ( t ξ ) α d ξ .
Subsequently, by changing the variable t ξ = ζ , the operator of the FD model leads to Equation (A5).
D α y ( t ) = 1 Γ ( 1 α ) y ( 0 ) t α + 0 t y ˙ ( t ζ ) ( ζ ) α d ζ .
Here, by substituting time 0 t into the time interval Δ t for analysis, the right side of the integration part can be rewritten as the discrete formula in (A6).
0 t y ˙ ( t ζ ) ζ α d ζ = 1 Δ t i = 0 n 1 y ( n i ) y ( n i 1 ) i Δ t ( i + 1 ) Δ t ζ α d ζ , = Δ t ( α ) ( 1 α ) i = 0 n 1 y ( n i ) y ( n i 1 ) ( i + 1 ) ( 1 α ) ( i ) ( 1 α ) .
To expand the Σ Equation (A7) can be obtained.
0 t y ˙ ( t ζ ) ζ α d ζ = Δ t ( α ) ( 1 α ) y ( n ) y ( n 1 ) 1 ( 1 α ) 0 + y ( n 1 ) y ( n 2 ) 2 ( 1 α ) 1 ( 1 α ) + y ( n 2 ) y ( n 2 ) 3 ( 1 α ) 2 ( 1 α ) + y ( n i + 1 ) y ( n i ) i ( 1 α ) ( i 1 ) ( 1 α ) + y ( n i ) y ( n i 1 ) ( i + 1 ) ( 1 α ) i ( 1 α ) + y ( n i 1 ) y ( n i 2 ) ( i + 2 ) ( 1 α ) ( i + 1 ) ( 1 α ) + y ( 3 ) y ( 2 ) ( n 2 ) ( 1 α ) ( n 3 ) ( 1 α ) + y ( 2 ) y ( 1 ) ( n 1 ) ( 1 α ) ( n 2 ) ( 1 α ) + y ( 1 ) y ( 0 ) n ( 1 α ) ( n 1 ) ( 1 α ) .
After sorting the equation, Equation (A8) can be obtained.
0 t y ˙ ( t ζ ) ζ α d ζ = Δ t ( α ) ( 1 α ) y ( n ) + i = 0 n 1 y ( i ) { ( n i 1 ) ( 1 α ) 2 ( n i ) ( 1 α ) + ( n i + 1 ) ( 1 α ) } + y ( 0 ) { ( n 1 ) ( 1 α ) n ( 1 α ) } .
Subsequently, substituting Equations (A8) into (A5), the operator of the FD model yields Equation (A9).
D α y ( t ) = Δ t ( α ) Γ ( 1 α ) 1 ( 1 α ) y ( n ) + i = 0 n 1 y ( i ) { ( n i 1 ) ( 1 α ) 2 ( n i ) ( 1 α ) + ( n i + 1 ) ( 1 α ) } + y ( 0 ) { ( n 1 ) ( 1 α ) n ( 1 α ) } .
Based on the relationship ( 1 α ) Γ ( 1 α ) = Γ ( 2 α ) , the operator of the FD model yields Equation (A10).
D α y ( t ) = Δ t ( α ) Γ ( 2 α ) y ( n ) + i = 0 n 1 y ( i ) { ( n i 1 ) ( 1 α ) 2 ( n i ) ( 1 α ) + ( n i + 1 ) ( 1 α ) } + y ( 0 ) { ( n 1 ) ( 1 α ) n ( 1 α ) } .
Finally, considering the influence of y ( n i ) and w ( i ) , the operator of the FD model leads to Equations (A11a) and (A11b).
D α y n = i = 0 N w ( i ) y ( n i ) , ( n N ) ,
D α y n = i = 0 n w ( i ) y ( n i ) , ( n < N ) .
where, N is the number of integration points for the window time T w (Equation (A12)).
In Equations (A11a) and (A11b), the influence of weight is considered to trace the previous n-time steps in the integration calculation. However, the calculation of the FD-model operator is different depending on the size of n. When n N , Equation (A11a) is employed; if otherwise, Equation (A11b) is used.
Based on the natural period Tn of the 1st mode passive control system, the number of integration points N is given by Equation (A12), where Δ t is the time interval of the analysis. Parameter w ( i ) is the weight of the numerical integration, which decreases with increasing i = 0 , 1 , 2 , , N 1 .
N = 1.5 T n / Δ t = T w / Δ t .
The weight of the numerical integration is given by Equations (A13a), (A13b), and (A13c).
w ( 0 ) = 1 Γ ( 2 α ) ,
w ( i ) = w ( 0 ) ( i 1 ) 1 α 2 i 1 α + ( i + 1 ) 1 α , ( i = 1 N ) ,
w ( N ) = w ( 0 ) ( n 1 ) 1 α n 1 α + ( 1 α ) n α .
The numerical integration formula of the FD model is given by Equation (A13a). The time step of the time-history analysis equals n steps, which leads to shear strain γ ( n ) corresponding to the stress τ ( n ) . If the window step N w is considered, it leads to Equation (A13b).
τ ( n ) + a ( Δ t ) α i = 0 n w ( i ) τ ( n i ) = G γ ( n ) + b ( Δ t ) α i = 0 n w ( i ) γ ( n i ) , ( n < N ) ,
τ ( n ) + a ( Δ t ) α i = 0 N w w ( i ) τ ( n i ) = G γ ( n ) + b ( Δ t ) α i = 0 N w w ( i ) γ ( n i ) , ( n N ) .
where, a and b are the constant.

Appendix C. Effect of Window Time

The window time ( T w ) is the backtracking time for the fractional derivative (FD) model algorithm in dynamic analysis. This affects the calculation efficiency, accuracy of the simulation, and response of the FD damper. T w = 1.5 T n is proposed for seismic analysis by Kasai et al. (2001) [18], where T n is the natural period of the system. However, the along-wind response (with mean component), which differs from the seismic response, includes a long-duration excitation, a wide range of frequencies, and a mean component of the along-wind force. Therefore, the effect of FD model window time T w on wind analysis needs to be investigated.
T w = 80 T n is set as the theoretical solution in the simulation. Figure A2 illustrated the effects of window time on the maximum and mean components of damper deformation and damper force, respectively. The trend of the results tends to be a stable constant when the window time is longer than T w = 60 T n . Thus, the window time set for the FD model in along-wind is T w = 60 T n . Evaluated by the same method, in across-wind, window time is determined as T w = 1.5 T n .
Figure A2. Analysis of damper energy dissipation (across-wind).
Buildings 12 02182 g0a2

References

  1. Lin, P.; Ding, F.; Hu, G.; Li, C.; Xiao, Y.; Tse, K.; Kwok, K.; Kareem, A. Machine learning-enabled estimation of crosswind load effect on tall buildings. J. Wind. Eng. Ind. Aerodyn. 2022, 220, 104860. [Google Scholar] [CrossRef]
  2. Architectural Institute of Japan (AIJ). Guidelines for the Evaluation of Habitability to Building Vibration; AIJ: Tokyo, Japan, 2004. (In Japanese) [Google Scholar]
  3. Architectural Institute of Japan (AIJ). AIJ Recommendations for Loads on Buildings; AIJ: Tokyo, Japan, 2015. [Google Scholar]
  4. Simiu, E.; Yeo, D. Wind Effects on Structures: Modern Structural Design for Wind; John Wiley & Sons: Hoboken, NJ, USA, 2019. [Google Scholar]
  5. Boggs, D.; Dragovich, J. The nature of wind loads and dynamic response. Spec. Publ. 2006, 240, 15–44. [Google Scholar]
  6. The Japan Society of Seismic Isolation (JSSI). Manual for Design and Construction of Passively-Controlled Buildings, 3rd ed.; JSSI: Tokyo, Japan, 2013. (In Japanese) [Google Scholar]
  7. Samali, B.; Kwok, K. Use of viscoelastic dampers in reducing wind-and earthquake-induced motion of building structures. Eng. Struct. 1995, 17, 639–654. [Google Scholar] [CrossRef]
  8. Takewaki, I. Building Control with Passive Dampers: Optimal Performance-Based Design for Earthquakes; John Wiley & Sons: Hoboken, NJ, USA, 2011. [Google Scholar]
  9. Ghaemmaghami, A.R.; Kwon, O.S. Nonlinear modeling of MDOF structures equipped with viscoelastic dampers with strain, temperature and frequency-dependent properties. Eng. Struct. 2018, 168, 903–914. [Google Scholar] [CrossRef]
  10. Zhou, X.; Sun, T.; Sun, B.; Ma, N.; Ou, J. Vibration-Reduction Strategy for High-Rise Braced Frame Using Viscoelastic-Yielding Compounded BRB. Buildings 2022, 12, 1159. [Google Scholar] [CrossRef]
  11. Ito, M. Wind Engineering of Large Bridges in Japan; Routledge: London, UK, 2017; pp. 71–79. [Google Scholar]
  12. Song, Y.; Zhang, M.; Øiseth, O.; Rønnquist, A. Wind deflection analysis of railway catenary under crosswind based on nonlinear finite element model and wind tunnel test. Mech. Mach. Theory 2022, 168, 104608. [Google Scholar] [CrossRef]
  13. Holmes, J.D. Wind Loading of Structures; CRC Press: Boca Raton, FL, USA, 2007. [Google Scholar]
  14. Kareem, A.; Tamura, Y. Advanced Structural Wind Engineering; Springer: Berlin/Heidelberg, Germany, 2013; Volume 482. [Google Scholar]
  15. Nielsen, E.J.; Lai, M.L.; Soong, T.; Kelly, J.M. Viscoelastic damper overview for seismic and wind applications. In Proceedings of the Smart Structures and Materials 1996: Passive Damping and Isolation, SPIE, San Diego, CA, USA, 26–27 February 1996; Volume 2720, pp. 138–144. [Google Scholar]
  16. Sato, D.; Osabel, D.M.; Kasai, K. Evaluation method for practical application of viscoelastic damper using equivalent sinusoidal waveforms of long-duration random excitations in along-and across-wind directions. Eng. Struct. 2022, 254, 113735. [Google Scholar] [CrossRef]
  17. Chou, C.C.; Tseng, W.H.; Huang, C.H.; Tsuang, S.; Chang, L.M.; Chen, Y.H. A novel steel lever viscoelastic wall with amplified damper force-friction for wind and seismic resistance. Eng. Struct. 2020, 210, 110362. [Google Scholar] [CrossRef]
  18. Kasai, K.; Teramoto, M.; Okuma, K.; Tokoro, K. Constitutive rule for viscoelastic materials considering temperature, frequency, and strain sensitivities. J. Struct. Constr. Eng. 2001, 543, 77–86. (In Japanese) [Google Scholar] [CrossRef] [Green Version]
  19. Wang, S.J.; Zhang, Q.Y.; Yu, C.H. Effectiveness of damaged viscoelastic dampers in seismic protection of structures under main shocks and aftershocks. Eng. Struct. 2021, 242, 112424. [Google Scholar] [CrossRef]
  20. Min, K.W.; Kim, J.; Lee, S.H. Vibration tests of 5-storey steel frame with viscoelastic dampers. Eng. Struct. 2004, 26, 831–839. [Google Scholar] [CrossRef]
  21. Xu, Y.; Xu, Z.; Guo, Y.; Huang, X.; Dong, Y.; Li, Q. Dynamic Properties and Energy Dissipation Study of Sandwich Viscoelastic Damper Considering Temperature Influence. Buildings 2021, 11, 470. [Google Scholar] [CrossRef]
  22. Lewandowski, R. Influence of Temperature on the Dynamic Characteristics of Structures with Viscoelastic Dampers. J. Struct. Eng. 2019, 145, 04018245. [Google Scholar] [CrossRef]
  23. Kasai, K.; Osabel, D.M.; Sato, D. Dynamic response characterization and simplified analysis methods for viscoelastic dampers considering heat transfer. Earthq. Eng. Struct. Dyn. 2022, 1–24. [Google Scholar] [CrossRef]
  24. Dong, Y.R.; Xu, Z.D.; Guo, Y.Q.; Xu, Y.S.; Chen, S.; Li, Q.Q. Experimental study on viscoelastic dampers for structural seismic response control using a user-programmable hybrid simulation platform. Eng. Struct. 2020, 216, 110710. [Google Scholar] [CrossRef]
  25. Sato, D.; Kasai, K.; Tamura, T. Influence of frequency sensitivity of viscoelastic damper on wind-induced response. J. Struct. Constr. Eng. 2009, 74, 75–82. (In Japanese) [Google Scholar] [CrossRef] [Green Version]
  26. Zuo, Z.; Liu, L.; Zhou, Y.; Qin, J.; Cui, W. Acoustic Radiation Study of a Box Girder Viaduct Considering the Frequency-Dependent Viscoelasticity of the Rail Pad. Buildings 2022, 12, 1226. [Google Scholar] [CrossRef]
  27. Kasai, K.; Munshi, J.; Lai, M.; Maison, B. Viscoelastic Damper Hysteresis Model: Theory, Experiment, and Application ATC-17-1 Seminar. Appl. Technol. Counc. 1993, 2, 521–532. [Google Scholar]
  28. Duarte Ortigueira, M.; Tenreiro Machado, J. Fractional derivatives: The perspective of system theory. Mathematics 2019, 7, 150. [Google Scholar] [CrossRef] [Green Version]
  29. Ortigueira, M.D.; Machado, J.T. What is a fractional derivative? J. Comput. Phys. 2015, 293, 4–13. [Google Scholar] [CrossRef]
  30. Jones, D.I. Handbook of Viscoelastic Vibration Damping; John Wiley & Sons: Hoboken, NJ, USA, 2001. [Google Scholar]
  31. Lakes, R.; Lakes, R.S. Viscoelastic Materials; Cambridge University Press: Cambridge, UK, 2009. [Google Scholar]
  32. Lewandowski, R.; Pawlak, Z. Response spectrum method for building structures with viscoelastic dampers described by fractional derivatives. Eng. Struct. 2018, 171, 1017–1026. [Google Scholar] [CrossRef]
  33. Oldham, K.; Spanier, J. The Fractional Calculus Theory and Applications of Differentiation and Integration to Arbitrary Order; Elsevier: Amsterdam, The Netherlands, 1974. [Google Scholar]
  34. Bagley, R.L.; Torvik, P. A theoretical basis for the application of fractional calculus to viscoelasticity. J. Rheol. 1983, 27, 201–210. [Google Scholar] [CrossRef]
  35. Tsai, C.; Lee, H. Applications of viscoelastic dampers to high-rise buildings. J. Struct. Eng. 1993, 119, 1222–1233. [Google Scholar] [CrossRef]
  36. Chang, K.; Soong, T.; Oh, S.T.; Lai, M. Seismic behavior of steel frame with added viscoelastic dampers. J. Struct. Eng. 1995, 121, 1418–1426. [Google Scholar] [CrossRef]
  37. Okuma, K.; Kasai, K. Global damping model of multi-mass system having elastic frame and viscoelastic damper. J. Struct. Constr. Eng. 2010, 75, 347–356. (In Japanese) [Google Scholar] [CrossRef] [Green Version]
  38. Hirai, H.; Yoshie, K.; Sato, D.; Suzuki, Y.; Kitamura, H. Characteristic of higher mode response of high-rise building under fluctuating wind force. AIJ J. Technol. Des. 2012, 18, 79–84. (In Japanese) [Google Scholar] [CrossRef] [Green Version]
  39. Roncallo, L.; Solari, G.; Muscolino, G.; Tubino, F. Maximum dynamic response of linear elastic SDOF systems based on an evolutionary spectral model for thunderstorm outflows. J. Wind. Eng. Ind. Aerodyn. 2022, 224, 104978. [Google Scholar] [CrossRef]
  40. Marukawa, H.; Ohkuma, T.; Kitimura, H.; Yoshie, K.; Tsurumi, T.; Sato, D. 20097 Energy Input of Local Wind Forces for High-Rise Building Based on Wind Tunnel Test: Part. 2 Local Wind Force Characteristics of Rectangular High-Rise Buildings; AIJ: Tokyo, Japan, 2010; pp. 193–194. (In Japanese) [Google Scholar]
  41. Zhang, M.; Xu, F. Tuned mass damper for self-excited vibration control: Optimization involving nonlinear aeroelastic effect. J. Wind. Eng. Ind. Aerodyn. 2022, 220, 104836. [Google Scholar] [CrossRef]
  42. Kasai, K.; Okuma, K. Kelvin-type formulation and its accuracy for practical modeling of linear viscoelastic dampers (Part 1. One-mass system having damper and elastic/inelastic frame). J. Struct. Constr. Eng. 2001, 550, 71–78. [Google Scholar] [CrossRef] [Green Version]
  43. Kasai, K.; Fu, Y.; Watanabe, A. Passive control systems for seismic damage mitigation. J. Struct. Eng. 1998, 124, 501–512. [Google Scholar] [CrossRef]
  44. Fu, Y.; Kasai, K. Comparative study of frames using viscoelastic and viscous dampers. J. Struct. Eng. 1998, 124, 513–522. [Google Scholar] [CrossRef]
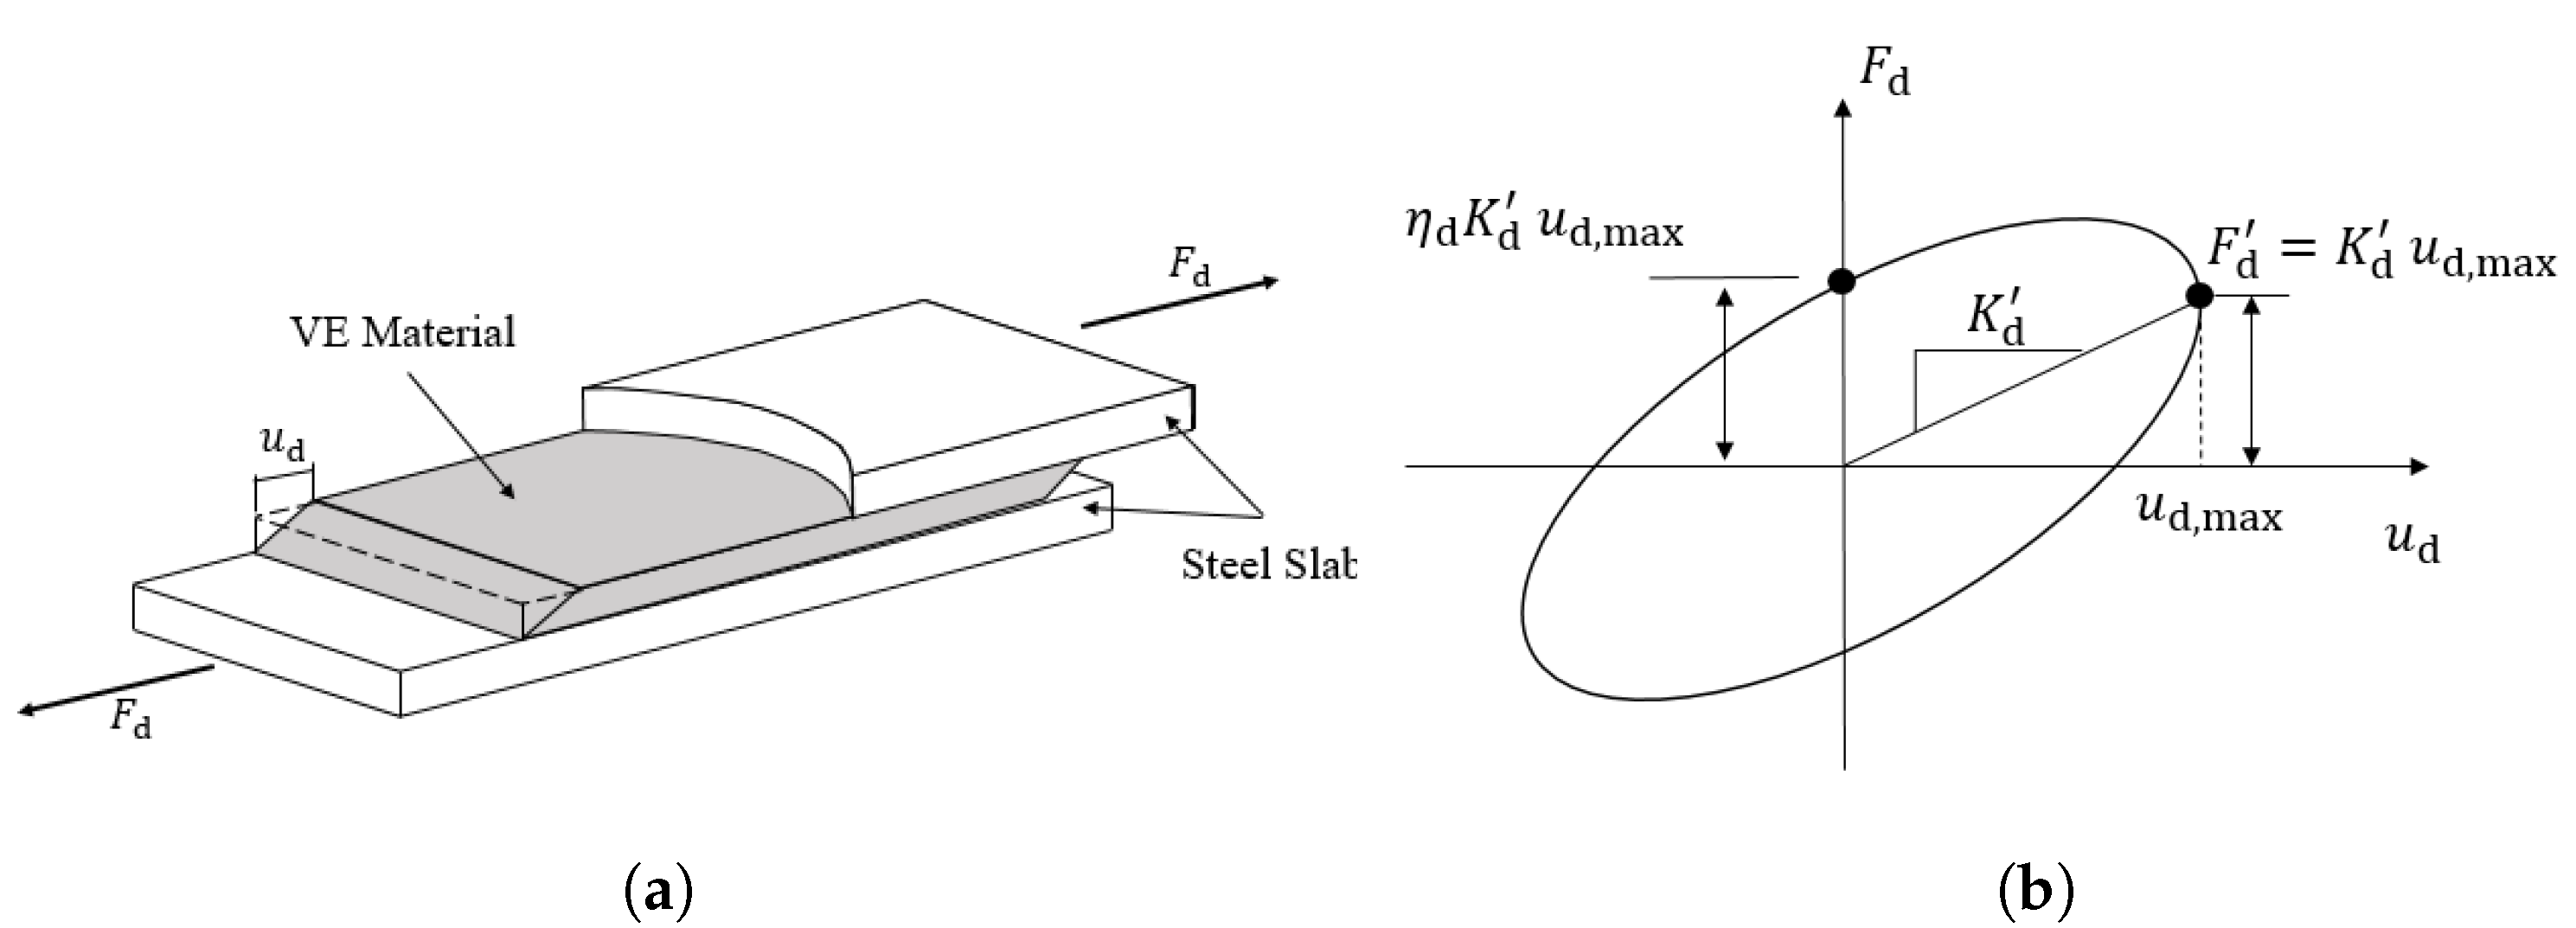
Figure 1. (a) Example of a VE damper; (b) hysteresis loop of a VE damper [6].
Buildings 12 02182 g001
Figure 2. Numerical models of the VE damper.
Buildings 12 02182 g002
Figure 3. Schematic diagram of modal analysis and target building and 1 st modal analytical models.
Buildings 12 02182 g003
Figure 4. VE system and its hysteresis loops [6].
Buildings 12 02182 g004
Figure 5. VE systems.
Buildings 12 02182 g005
Figure 6. Effectof VE system frequency sensitivity on parameters (2H-HH system).
Buildings 12 02182 g006
Figure 7. Effect of VE system frequency sensitivity on parameters (2H-SS system).
Buildings 12 02182 g007
Figure 8. Hysteresis loops of VE dampers subjected to the sinusoidal wave (2H-HH system).
Buildings 12 02182 g008
Figure 9. Hysteresis loops of VE dampers subjected to the sinusoidal wave (2H-SS system).
Buildings 12 02182 g009
Figure 10. Time history of 1 st modal wind.
Buildings 12 02182 g010
Figure 11. Normalized PSD of 1 st modal wind.
Buildings 12 02182 g011
Figure 12. Normalized PSD of wind-induced responses of the FD system (2H-HH).
Buildings 12 02182 g012
Figure 13. Normalized PSD of wind-induced responses of the FD system (2H-SS).
Buildings 12 02182 g013
Figure 14. Mean wind-induced displacement, velocity, and acceleration of the FD system. 1H, 2H, and 3H are types of frame, and HH, SH, HS, and SS are types of added components of systems, which is indicated in Table 1 (along-wind).
Buildings 12 02182 g014
Figure 15. Standard deviation of wind-induced displacement, velocity, and acceleration of the FD system. 1H, 2H, and 3H are types of frame, and HH, SH, HS, and SS are types of added components of systems, which is indicated in Table 1 (along-wind).
Buildings 12 02182 g015
Figure 16. Standard deviation of wind-induced displacement, velocity, and acceleration of the FD system. 1H, 2H, and 3H are types of frame, and HH, SH, HS, and SS are types of added components of systems, which is indicated in Table 1 (Across-wind).
Buildings 12 02182 g016
Figure 17. Comparison of the time-history analysis of the along-wind displacement (300–400 s).
Buildings 12 02182 g017
Figure 18. Ratio of wind-induced responses (along-wind): (HH, SH, HS, SS from left to right of each frame).
Buildings 12 02182 g018
Figure 19. Comparison of hysteresis loop in the 2H-HH system (along-wind).
Buildings 12 02182 g019
Figure 20. Comparison of hysteresis loop in the 2H-SS system (along-wind).
Buildings 12 02182 g020
Figure 21. Comparison of the accumulated energy dissipation of the VE dampers (along-wind).
Buildings 12 02182 g021
Figure 22. Ratio of the total accumulated energy dissipation of the VE dampers (along-wind): (HH, SH, HS, SS from left to right of each frame).
Buildings 12 02182 g022
Figure 23. Comparison of the time-history analysis of the across-wind displacement (300–400 s).
Buildings 12 02182 g023
Figure 24. Ratio of wind-induced responses (across-wind): (HH, SH, HS, SS from left to right of each frame).
Buildings 12 02182 g024
Figure 25. Comparison of hysteresis loop in the 2H-HH system (across-wind).
Buildings 12 02182 g025
Figure 26. Comparison of hysteresis loop in the 2H-SS system (across-wind).
Buildings 12 02182 g026
Figure 27. Comparison of the accumulated energy dissipation of the VE dampers (across-wind).
Buildings 12 02182 g027
Figure 28. Ratio of the total accumulated energy dissipation of the VE dampers (across-wind): (HH, SH, HS, SS from left to right of each frame).
Buildings 12 02182 g028
Table 1. Parameters of the 1 st modal systems.
System T f Damper K d / K f Brace K b / K f
1H-HH2 sHard 2.0 Hard
1H-SH2 sSoft 0.4 Hard
1H-HS2 sHard 2.0 Soft 3.0
1H-SS2 sSoft 0.4 Soft 3.0
2H-HH4 sHard 2.0 Hard
2H-SH4 sSoft 0.4 Hard
2H-HS4 sHard 2.0 Soft 3.0
2H-SS4 sSoft 0.4 Soft 3.0
3H-HH6 sHard 2.0 Hard
3H-SH6 sSoft 0.4 Hard
3H-HS6 sHard 2.0 Soft 3.0
3H-SS6 sSoft 0.4 Soft 3.0
Table 2. Parameters of the FD model, 4-element model, and 6-element model.
FD Model4-Element Model6-Element Model
FrameSystem f n ξ n A s / d K 1 K 2 C 1 C 2 K 1 K 2 K 3 C 1 C 2 C 3
[Hz] [m][ kN / m ][ kN / m ][ kN s / m ][ kN s / m ][ kN / m ][ kN / m ][ kN / m ][ kN s / m ][ kN s / m ][ kN s / m ]
1H-HH 0.866 0.311 1.1295 × 10 4 12.035 36.105 0.7179 3.456 118.256 27.341 13.670 1.195 2.605 32.824
1H1H-SH 0.592 0.126 2.6533 × 10 5 2.953 8.858 0.176 0.848 65.652 10.702 3.087 0.086 0.856 13.849
(0.01 H)1H-HS 0.777 0.121 1.1835 × 10 4 12.838 38.514 0.766 3.687 124.691 28.829 14.414 1.260 2.747 34.610
1H-SS 0.588 0.098 2.6607 × 10 5 2.961 8.884 0.177 0.850 65.834 10.732 3.096 0.086 0.859 13.887
2H-HH 0.433 0.281 3.7592 × 10 5 3.041 9.122 0.168 1.716 74.850 7.485 3.363 0.285 1.425 16.584
2H2H-SH 0.296 0.112 8.6853 × 10 6 0.744 2.231 0.041 0.420 17.761 1.776 0.798 0.068 0.338 3.935
(0.02 H)2H-HS 0.385 0.113 3.9326 × 10 5 3.255 9.766 0.180 1.838 79.310 7.931 3.563 0.302 1.509 17.572
2H-SS 0.293 0.088 8.7135 × 10 6 0.747 2.240 0.041 0.422 17.820 1.782 0.801 0.068 0.339 3.948
3H-HH 0.289 0.261 1.9473 × 10 5 1.364 4.093 0.030 1.137 7.435 3.425 1.712 0.169 0.772 8.242
3H3H-SH 0.197 0.103 4.4504 × 10 6 0.333 0.999 0.007 0.277 1.699 0.783 0.391 0.039 0.176 1.884
(0.03 H)3H-HS 0.256 0.107 2.0341 × 10 5 1.464 4.391 0.032 1.220 7.798 3.592 1.796 0.178 0.810 8.644
3H-SS 0.195 0.081 4.4656 × 10 6 0.334 1.003 0.007 0.279 1.704 0.785 0.393 0.039 0.177 1.889
Publisher’s Note: MDPI stays neutral with regard to jurisdictional claims in published maps and institutional affiliations.