Article

A User Profile of Tendering and Bidding Corruption in the Construction Industry Based on SOM Clustering: A Case Study of China

School of Building Science and Engineering, Yangzhou University, Yangzhou 225127, China
*
Author to whom correspondence should be addressed.
Buildings 2022, 12(12), 2103; https://doi.org/10.3390/buildings12122103
Submission received: 27 September 2022 / Revised: 6 November 2022 / Accepted: 21 November 2022 / Published: 1 December 2022
(This article belongs to the Section Architectural Design, Urban Science, and Real Estate)

Abstract

:
Tendering and bidding is considered the stage most vulnerable to corruption in the construction industry. The prevalence of collusive tendering and bidding induces frequent accidents and even sabotages the fairness of the construction market. Although a large number of tendering and bidding corruption cases are investigated in China every year, this information has not been fully exploited. The profile of the different corruptors remains vague. Therefore, this study uses the user profile method to establish a corruptor characteristic model based on the human paradigm, where 1737 tendering and bidding collusion cases were collected from China to extract the features. Four types of specific corruption groups are detected based on self-organizing feature map (SOM) cluster analysis, comprising low-age corruptors, grassroots mild corruptors, middle-level collapsing corruptors, and top leader corruptors. Furthermore, the profiles of different cluster corruptors are described in detail from four dimensions. This study reveals the law of tendering and bidding corruption from the perspective of the user profile and suggests that a user profile system for corruption in bidding should be developed in the process of the precise control of corruption, which promotes the transformation from strike after corruption to prevention beforehand. It is conducive to forming the resultant force of big data for precise anti-corruption.

1. Introduction

Various stages of engineering construction projects suffer from corruption to varying degrees [1]. As a “fortress” of construction projects, bidding is considered the most corrupt stage, and corruption is bred from the beginning of bidding to the end of the contract award [2]. Globally, the number of bribery cases in bidding and procurement in Russia increased by 11% in 2019 [3]. The amount of public works’ bidding corruption in Germany reaches 700 million euros annually [4]. Corruption in bidding and tendering in Japan was so rampant that scholars estimated that “95% of national public bidding projects are collusive bidding” [5]. Bidding corruption has become a thorny issue in developed countries.
Corruption in bidding for construction projects in developing countries is seen as a “road to wealth”; for example, in India’s “Extraordinary Corruption Case of Commonwealth Games”, the amount of irregularities in project bidding was Rs 5000–8000 crore [6]. In Nigeria, 60% of the corruption cases were related to bidding and procurement [7]. As the largest developing country, China has witnessed new, vigorous development in engineering construction since its fourteenth Five-Year Plan proposed to organize a number of major projects involving infrastructure and improving people’s livelihood [8]. However, during the period of great development and construction, corruption is also prone to high frequency [9]. The survey shows that bidding corruption accounts for the highest proportion, up to 70%, in all stages of construction projects [10]. During the thirteenth Five-Year Plan period, the average growth rate of collusion bidding cases alone was more than 43%, and the annual loss due to corruption was more than 800 billion yuan [11].
To crack down on corruption, Commission or Inspecting Discipline in China has successively reported cases of construction corruption and exhibited accurate punishment measures using big data [12], conveying a clear signal of resolutely cutting off the interest chain of bidding corruption. However, the corruptors involved in the case have led to the alienation and concealment of bidding corruption through identity concealment, disguise, collusion, internal and external union, and other collusive acts [13]. At the same time, the status quo of “data explosion but lack of knowledge” of bidding corruption cases makes the outline of the corruptors vague [9,14], resulting in targeted, precise governance of bidding corruption becoming a dilemma.
Massive corruption cases and data show that corruption behaviors have common characteristics and are “tractable” [15]. Big data has brought a new research paradigm and method system for bidding corruption research [16] and promoted its development from “policy speculative” qualitative research to “data intensive” empirical quantitative research [10,17,18]. Studying the characteristics and preferences of people in the process of bidding corruption and deeply analyzing the relationship between the types of corruption [13], the areas of corruption [15,19], the main characteristics of actors [20], and the amount of corruption involved [10,21] is indispensable. Further, the accurate supervision of corruption will develop toward forward-looking big data analysis such as artificial intelligence, machine learning, and text mining [16], which can be used to mine corrupt text data, identify complex corruption patterns, pay attention to the details of corrupt behavior, and form a portrait of corrupt users.
Previous studies examined the transplantation of user profile technology into the field of corruption, but some shortcomings remain. On the one hand, most of the research on corruption actors is not specific enough, mostly being useable for the macro level of qualitative elaboration [22]. On the other hand, the research in the field of corruption is relatively broad, lacking quantitative, accurate portraits of different levels of corruptors on different labels. Therefore, based on the research paradigm of corruptors, this study describes all kinds of corruptor labels using the self-organizing feature map (SOM) clustering algorithm and statistical analysis. This study utilizes the user profile technology to analyze the micro characteristics and preferences of bidding corruptors to facilitate the transformation of traditional bidding corruption governance to the use of big data precision supervision.

2. Literature Review

2.1. Theory of Collusive Bidding

Corruption in construction is regarded as a catastrophic threat and the largest obstacle to the healthy development of the market, constantly breaking through the shackles of cultural traditions, institutional systems, development stages, and national characteristics [23,24,25]. In the long cycle of project construction, factors such as information asymmetry [11,26], the absence of main responsibility, and the lack of supervision [24,27] make bidding the key, difficult field of corruption prevention and control.
Bidding corruption is an invisible fraud [28], and finding its leak traces before the crime is difficult [29]. Overall, the analysis of bidding corruption from the perspective of vulnerability is still a field that has not been fully explored and described [30]. Several researchers have studied many aspects of collusive bidding, mainly focused on the causes of collusion, the characteristics of collusion, and the governance of collusion. For example, Owusu et al. [31] summarized five types of incentives for construction corruption, which are psychosocial, organizational, regulatory, project, and statutory specific reasons. To explore the vulnerable characteristics of construction corruption, Spector et al. [32] proposed describing the corruption type from the macro level according to “corruption syndrome”, and Jancsics [33] proposed identifying the corruption type from the micro level. Given that a graph has the advantage of “one picture is worth a thousand words”, Ateljevic and Budak [34] drew the corruption vulnerability route map, systematically and visually displaying the key nodes, personnel, and organizations involved in corruption vulnerability [35].
In terms of the governance of abnormal behaviors of bidding subjects, Ballesteros-Pérez [36] obtained the difference in mean and median data between the lowest bid price and the normal bid price of the bid inviter, based on which they targeted against bid inviter behaviors.
Most corruption case data provide support for research, but the long-term accumulation of bidding corruption cases is characterized by data inefficiency, redundancy, and discontinuity, and the fragmentation problem is serious [37]. Therefore, Morselli et al. [38] pointed out that finding a way to extract useful corruption data information quickly is a dilemma that needs to be solved urgently. At present, text mining technology has gradually become a hot spot. For example, Fazekas et al. [39] identified corruption’s “danger signal” in public procurement using more than 53,000 publicly available electronic public procurement records. In addition, in terms of drawing corruption-specific chromatogram, Leischnig and Woodside [40] analyzed the incentive configurations behind corruption behaviors from the perspective of complexity theory, according to the text data of new media and combined with Fs QCA (Fuzzy-Set Qualitative Comparative Analysis). With the arrival of the era of big data, the research on engineering corruption will develop in the direction of combining text mining with data statistics, network modeling, and machine learning. Mining knowledge and information in corruption case texts [41] and using digital platforms to achieve accurate supervision and governance has become a new trend of corruption governance.

2.2. Theory of User Profile

Balog et al. [42] began user profile tasks, which are virtual representations of real users based on real data [43]. Based on the big data of user behavior, user profiling technology determines the dimension of user information, extracts valuable information closely related to users with the help of algorithms, and highly refines the labels that reflect user characteristics [44]. The essence of the user portrait is the modeling of multi-dimensional tag combination. User labels can be extracted from user’s multisource data to depict the user profile [45].
Early user profiles appeared in the field of product design based on the subjective perspective of designers [46]. With the development of internet technology and the arrival of the era of big data, the connotation and extension of the user profile driven by data have changed, and the perspective has also changed from fiction to goal-oriented. A user profile is the result of collecting user data to support the portrait, which describes user needs, preferences, and interests independently by extracting personal information from a huge data pool [47]. Amato et al. [48] interpreted the concept of the user portrait as a collection of massive user information data, which has the function of expressing the needs, interests, and preferences of user groups.
The arrival of the mobile internet era has promoted the exponential growth of user behavior data. The effective combination of data and data generated by users in real time has formed the positive role of the user profile in the context of big data [41,49]. A user profile helps product managers predict and accurately understand user needs to target customer groups accurately, carry out targeted publicity and personalized recommendation, and, ultimately, achieve accurate services.

2.3. User Profile in Bidding Corruption

User profile technology is often applied in the field of e-commerce [49,50], smart library research [51], medical diagnosis research [52], and social media research [53]. In corruption transplantation, user profile technology is first used in the direction of criminal investigation. Criminal cases have similar characteristics. Barry Watson [54] found that the portrait description of criminal characteristics and criminal behaviors could reduce search time, improve investigation efficiency, and effectively reduce crime rate. Accurate portraits of corruptors are lacking [55]. To compensate for this academic gap, scholars applied the user profile to the governance of corruption problems. For example, J Honghao [56] studied the “data profile” of corruption and bribery from the characteristics of the subjects of corruption crimes and further added attributes such as crime time, crime space, and crime type to draw the corruption portrait of senior leading cadres.
User profile technology has attracted much attention in the field of corruption research. In recent years, as bidding corruption becomes more hidden and complex, the research on its governance is refined [9,11]. Few researchers have studied the complex behaviors and characteristics of corrupt actors by using big data. Compared with the descriptive statistical analysis of the broad line of corruption characteristics in bidding, the advantage of the big data user profile is that it can reduce the crossing rate of feature attributes, improve the contour clarity of the portrait of corrupt actors, and achieve the precision of punishment of corruption in bidding. Therefore, this study adopts the user profile technology based on SOM clustering to depict the micro image of the bidding corruptors.

3. Research Design

The user profile method was used to analyze the different corruptors specifically based on a multi-dimensional label, which is an innovative combination to analyze the law of corruption and regulate precisely [49]. The study consisted of five steps, as shown in Figure 1. First, 1737 cases were collected from the Chinese judicial document network, and then these cases were mined. Second, a user profile label system was established thorough the case mining and literature review. Third, the SOM clustering algorithm was used to extract the main corrupt groups. Fourth, the user profiles of the main corrupt groups were established. Lastly, the characteristics of the main corrupt groups were described in detail, and those user profiles were defined.

3.1. Data Collection

Empirical research on engineering corruption often uses the multiparty public data on the website for analysis in the academic community, but some problems exist, such as descriptive and selectivity bias [57]. Compared with the information obtained from the internet, newspapers, and other channels, the judicial documents published by China Judgements Online are more authoritative and reliable in terms of quantity and quality. China Judgments Online is an official website that records all corruption cases in various industries in China and a data source for courts to consult archives. It can provide an unprecedented amount of open data for the study of bidding corruption and retain its most complete, objective, and systematic original appearance [58]. Therefore, this study takes the corruption judgment documents of bidding and tendering published by China’s judgment documents network as the research data source.
Taking “construction project” and “bidding” as the keywords, this study mainly aims to investigate corruption in the bidding of housing construction projects, municipal projects, road projects, bridge projects, water conservancy projects, and electric power projects and removes duplicate documents such as the first instance, second instance, and execution of the same corruption event. As of January 2021, 1737 effective judgment documents related to bidding corruption were retrieved. The “OS” Library in Python was used to traverse the collected case library, and the “Jieba” library was called on to extract the area where the bidding and tendering corruption cases occurred, the personal information of the corruptors, the specific corruption acts, and the corruption links that occurred one by one to form a TXT file. At the same time, manual resource search means were used to search for and supplement the information, such as age and position, that had not been obtained, and complete the collection of datasets.

3.2. Label System

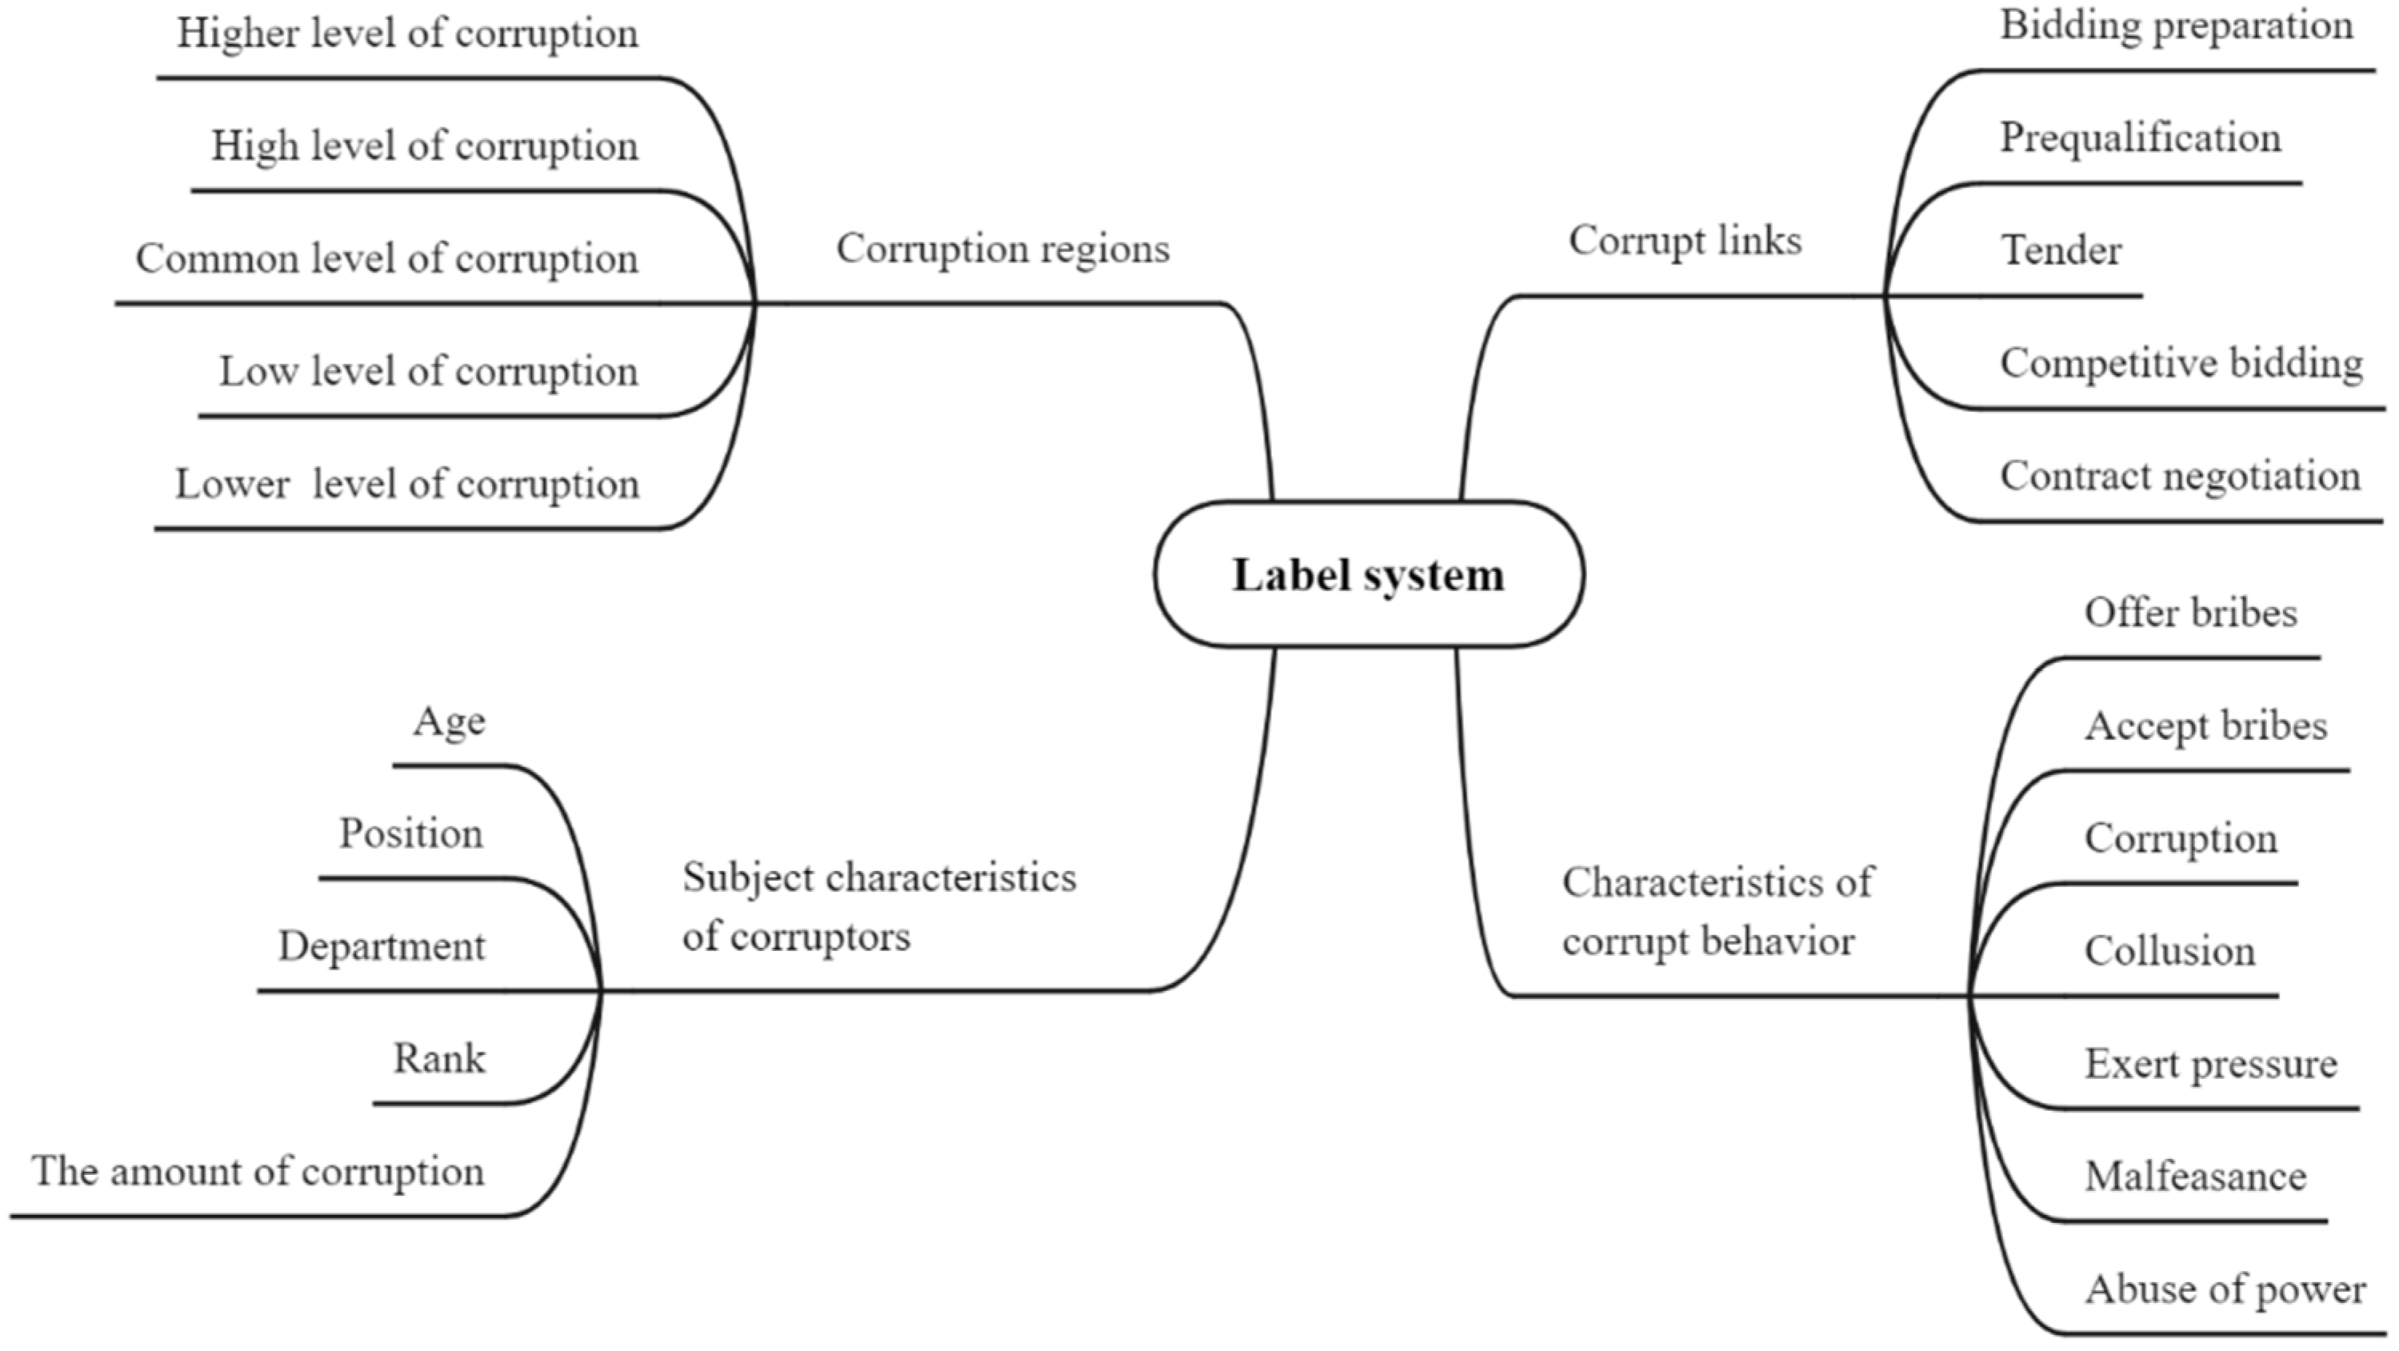
Statistical modeling is a technique used for building a user profile by employing a list of keywords or user labels [49]. The bidding and tendering corruption label system is a characteristic mark analyzed according to the information of corruption cases. Its fineness determines whether it can produce high convenience and remarkable results. Therefore, based on a literature review, this study selects four attributes as categories to build a label system for corrupt actors in bidding. Figure 2 shows multiple data information dimensions stereoscopically present in the target user profile.

3.2.1. Regional Label

Differences were observed between different provinces and cities in the problem of project corruption. In terms of geographical agglomeration characteristics, a large gap exists between the east, the middle, and the west: the middle is high, and the west is low. Considering that the spatial pertinence makes the anticorruption action more effective [15], this study takes the regional characteristics of corruption as one of the first-class labels, combines the spatial data in the empirical cases, and uses the natural breakpoint method to divide the five corruption degree regions. From the perspective of space, the change law of engineering corruption is revealed.

3.2.2. Corruptor Characteristic Label

In addition, the achievements of the research on the characteristics of corruption based on the human paradigm mainly focus on the characteristics of the main corruptors [13], the links, and the manner of corruption [57]. The subject characteristic label of the corruptors, including the amount involve [59], age [60], rank, position [11], department, and other attributes, was extracted. Descriptive statistics can clearly reflect the laws and trends of individual factors and power factors of corruption.

3.2.3. Corruption Preference Link Label

In view of the preference of corrupt actors in implementing corruption links, corresponding to each stage of bidding and tendering, the corruption links involved include preparation, qualification review, bidding, and contract negotiation. The preference corruption link label was extracted and visually displayed in a word cloud to grasp the individual differential selection of the bias links of corruption events clearly, which is conducive to the rational arrangement of regulatory focus.

3.2.4. Corruption Way Label

The characteristic label of the manner of corruption was extracted, corresponding to the nine types of corruption behavior, namely, bribery, corruption, collusion, fraud, pressure, obstruction, dereliction of duty, abuse of power, and benefit [9,57]. The principal component analysis method was used to extract various types of corruption in detail, highlighting the specific behavior patterns used by different corrupt groups, which is conducive to improving the fullness of the profile of corruptors.

3.3. SOM Clustering

For the label processing rules in the user profile model, this study selected clustering analysis. After comprehensively considering the data processing capacity, clustering effect, and analyzability, it determined the SOM neural network, which is mainly used to solve pattern recognition problems [22]. It belongs to the unsupervised learning algorithm, and the framework consists of only two layers. The specific algorithm idea is as follows:

3.3.1. Input Dataset

The characteristic variables of each bidding and tendering corruption case form a vector X according to the order of the corruption region code, the main characteristic index of the corrupt actor, the number of corruption links, and the number of corruption behaviors. All the case vectors form a high-dimensional dataset and are non-linear mapped into the ordered 2D array.

3.3.2. Normalized Dataset

Elimination of the scale difference between each characteristic variable can more accurately obtain the convergent optimal solution. Current input vector x is processed by the normalization function:
X ^ = X X . min ( a x i s = 0 ) X . max ( a x i s = 0 ) X . m i n ( a x i s = 0 )
X. max (axis = 0) is the row vector composed of the maximum value in each column, and X. min (axis = 0) is the row vector composed of the minimum value in each column.

3.3.3. Set Weight Node

The allocation of node weights is randomized using the “np.random.random()” function. The setting of the number of nodes needs to be considered scientifically. If the number is too small, the highly generalized model may omit some typical feature clustering clusters. On the contrary, too similar adjacent feature clusters result in unclear definition and unclear relationship of the type of bidding corrupt behavior. For the competitive layer of the 2D array, each category is also represented by a 2D vector. M is the number of values in the first dimension, n is the number of values in the second dimension, and m * n is the number of categories. The closer the values of M and N are, the better the clustering effect is. Therefore, this study tested 2 × 2, 3 × 3, 4 × 4, and 5 × 5 and other SOM networks of different sizes. The results show that a 2 × A SOM network of 2 sizes can effectively identify the typical characteristics of corrupt actors in bidding.

3.3.4. Define Learning Rate and Clustering Radius

The learning rate and clustering radius gradually decay and converge with the number of iterations. To ensure a good clustering effect, the dynamic learning rate and clustering radius are defined in Python according to Formulas (2) and (3).
R a t e = m a x R a t e ( m a x R a t e m i n R a t e ) ( i + 1 . 0 ) m a x I t e r a t i o n
R a d i u s = m a x R a d i u s ( m a x R a d i u s m i n R a d i u s ) ( i + 1 . 0 ) m a x I t e r a t i o n
maxRate and minRate are the maximum and minimum learning rates, respectively, maxRadius is the maximum clustering radius, minRadius is the minimum clustering radius, maxIteration is the maximum number of iterations, and i is the current number of iterations.

3.3.5. Find Winning Neurons

The normalized input vector X ^ , inner layer weight vector corresponding to all neurons in the competition layer is ( W j ^ ) (j = 1, 2,…, m), their similarities need to be compared.In this study, the method of calculating Euclidean distance dj (Formula (4)) is selected for similarity comparison. The neuron with the smallest distance wins the competition. NP. Linalg. Norm() function is called to calculate the Euclidean distance in 2D space.
d j = X ^ W j ^ = j = 1 m ( X W j ^ ) 2

3.3.6. Iterative Calculation

The learning rate, node dominance radius, and circle all nodes in the winning neighborhood are determined, and the node weight vector W j ^ Adjust is computed as follows:
{ W j ( t + 1 ) = W j ^ ( t ) + Δ W j = W j ^ ( t ) + α ( X ^ W j ^ ) W j ( t + 1 ) = W j ^ ( t )                       j j
“0”< α ≤ “1” is the learning rate. Finally, when α ≤ α m i n or reaches the preset number of iterations, the training is ended.

4. Empirical Results and Data Analysis

According to the corruptor profile label system established in Figure 2, the collected corruption cases were analyzed in detail. Then, based on the label data analysis, four clusters were obtained by SOM clustering analysis, which are the representatives of four types of corruptor in bidding and tendering.

4.1. Corruption Region Label Data Analysis

This study adopted the number of corruption cases in each province as the measurement index of the degree of corruption. Codes 1 to 31 were assigned to each province in the order of corruption degree from low to high to facilitate the subsequent clustering operation, and the five corruption degree regions were divided by using the natural breakpoint method. The results of different levels of corruption in each province based on the 1737 cases are presented in Table 1.

4.2. Corruptor Characteristic Label Data Analysis

At present, the reference [57] indicators that specifically describe the characteristic variables of corruptors are relatively mature. Based on the content of the case text in the case base, this study took the information, such as the age, position, department, rank, and amount of corruption of the corrupt actor in bidding and tendering, as the specific index and carried out digital discretization processing and descriptive statistical analysis for the character type index, as presented in Table 2, to facilitate the analysis of rule clustering and portrait results in the later stage.
The results of the corruptor characteristic label based on the 1737 cases are presented in Table 2, which shows that collusive bidding is mainly concentrated in the age range of 51–54 years old, with the maximum age of 70 and the minimum age of 27. The age span is large, showing a younger trend of corruption in terms of average age. The owner units and administrative departments are the departments with a high incidence of corruption in bidding and tendering, among which special attention should be paid to grassroots deputy leaders and top leaders; 37.08% of the total are involved in corruption with a sum of more than 1 million yuan. The large amount of corruption highlights the severe anticorruption situation.

4.3. Corruption Preference Link Label Data Analysis

Owing to the power constraints of the departments, positions, ranks, and the influence of familiarity with the bidding, the possibility of corruption in each process varies, causing corruptors to have different intervention capabilities and preferences in the bidding. Further forming their preference for corruption, this study measured the degree of preference by the number of words related to corruption. To obtain more comprehensive words related to corruption, first, Python was used to extract all the words in the case base text and count the number of occurrences. Then, referring to the glossary of corruption links in engineering projects sorted out by the relevant literature, all words related to the bidding stage were selected and introduced into the word cloud library, and word clouds were drawn with word frequency parameters, as presented in Figure 3, to display high-frequency keywords clearly.

4.4. Corruption Way Label Data Analysis

Based on the characteristic label of corrupt methods in bidding and tendering, this study carried out Python word frequency statistics according to the corrupt behavior characteristic words marked in the glossary of corrupt behaviors in engineering projects, removed low-frequency corrupt behavior characteristic words, and combed out high-frequency words with word frequency accounting for 0.1% of the corpus. Among them, fraud and obstruction are at extremely low values. To exclude the effect of extreme values on subsequent clustering analysis, these two behaviors were eliminated. The corresponding situation of the seven remaining types and modes of corruption is presented in Table 3.

4.5. SOM Clustering Results

Based on the completion of the data analysis of corruption cases and the construction of the portrait label system, SOM clustering can present good classification results for a large number of cases. Python’s “numpy” library was used to build an SOM algorithm platform. After SOM clustering, the clustering results and the frequency of each group are shown in Figure 4. Each cluster represents a group of corruptors, directly mapping the typical characteristics of each label. Four clusters were obtained, namely, low-age corruptors, grassroots mild corruptors, middle-level collapsing corruptors, and top leader corruptors, and the user profile of each group was analyzed based on this.

5. Findings and Discussion

5.1. Regional Label-Based Description

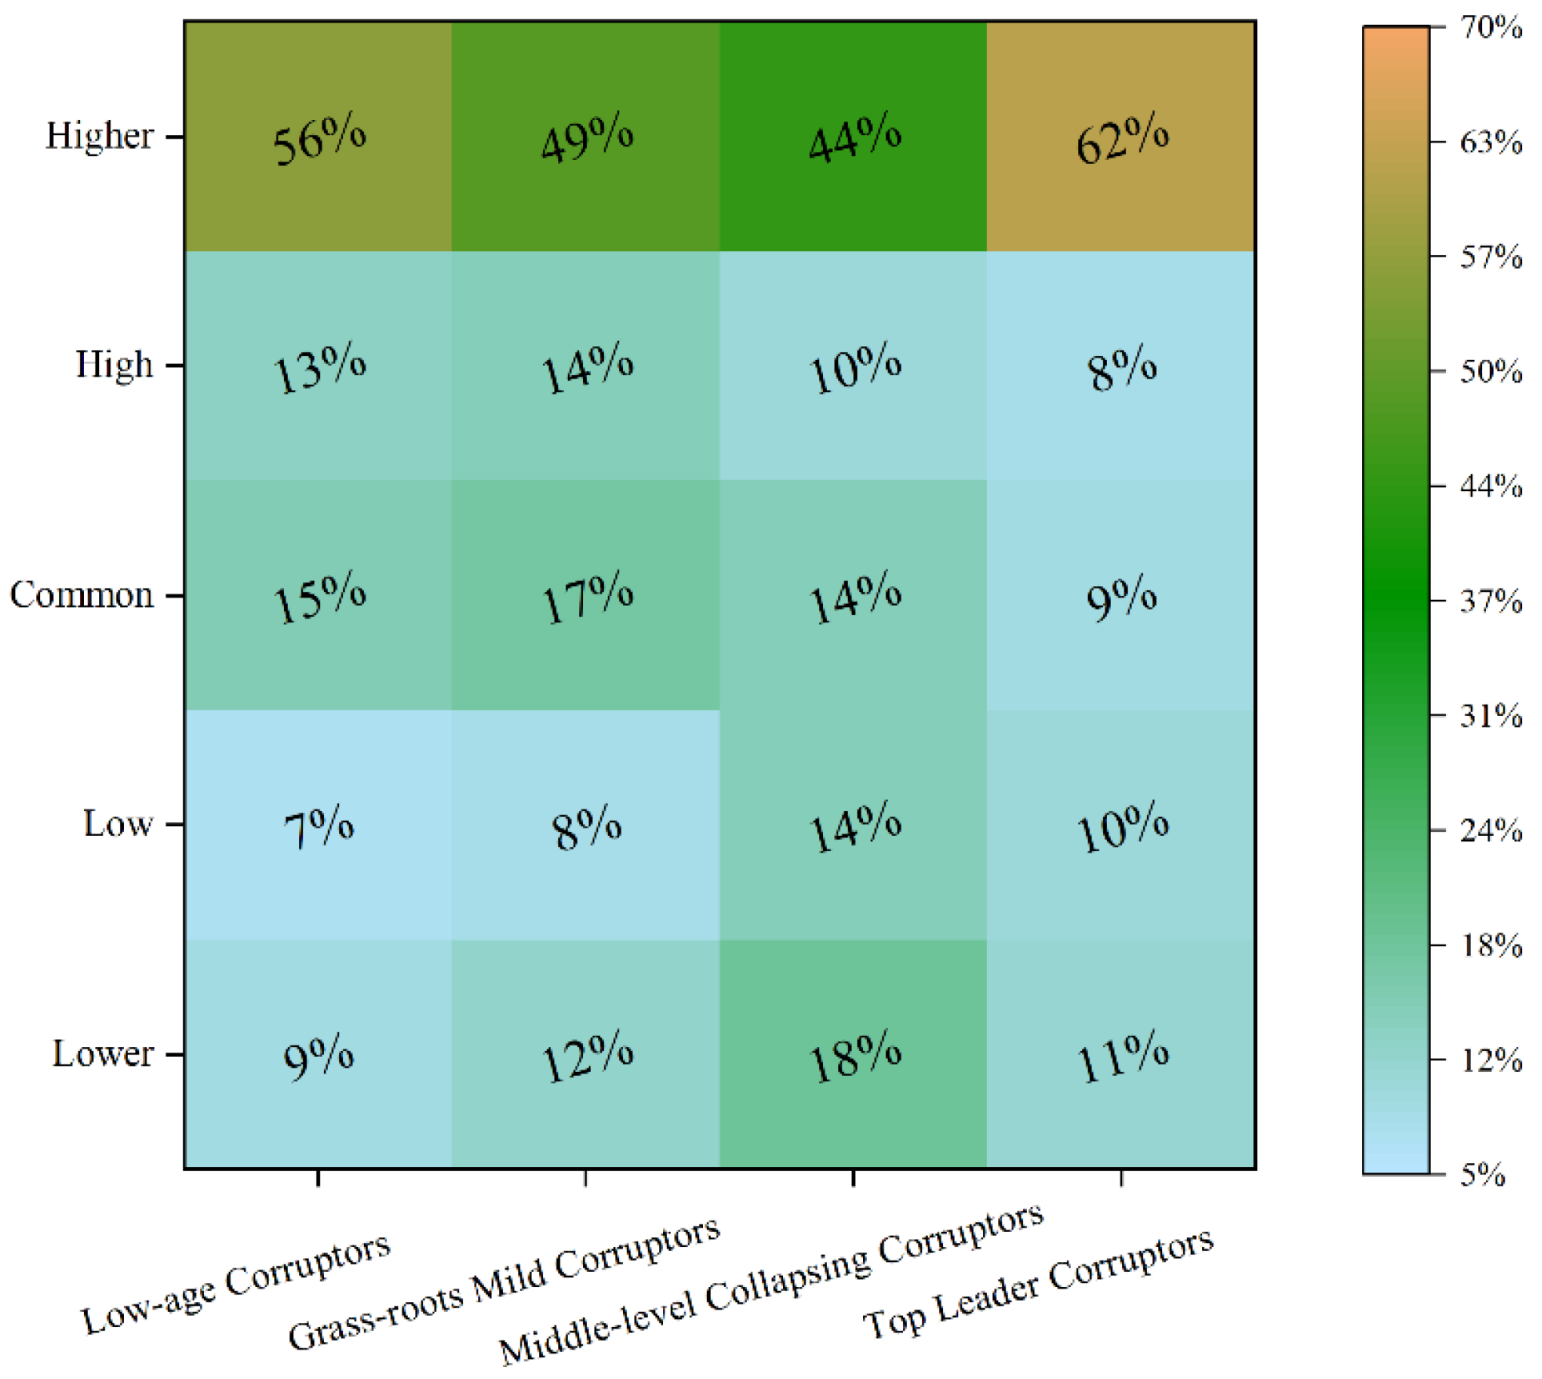
The informational data concerning the regional labels of four corruptor clustering were organized, and a correlation analysis chart, which shows the proportion of the number of cases of four types of corruption groups in different corruption regions, was drawn. The results are presented in Figure 5. Consequently, the vertical comparison of the table reveals that the four types of corruption groups account for the largest proportion of cases in regions with high levels of corruption. Among them, top leader corruptors contribute the most to the increase in the number of corruption cases in this region, which increases the difficulty and complexity of governance in regions with high levels of corruption. The number of corruption cases of low-age corruptors in various regions has a large difference in growth, showing a trend towards younger aged corruptors. The horizontal comparison of the table shows that in the two regions with high and moderate levels of corruption, the case contributions of various types of corruption actors are in the same order, and grassroots mild corruptors account for a large proportion. Middle-level collapsing corrupt actors are the most likely to carry out corrupt activities in the two areas of lower and low corruption degree. However, in the regions with a high degree of corruption, each type of corrupt actor is more active, which reflects the severity of bidding corruption in recent years.

5.2. Corruptor Characteristic Label-Based Description

In the study of the basic characteristics of corruptors, descriptive statistics methods are generally used to summarize the data intuitively and simply. In this study, through the descriptive statistics method, the profiling results of the main characteristics of various bidding corruptors were summarized, as presented in Table 4. The high-incidence age of low-age corruptors is 44–52 years old, that of grassroots mild corruptors is 49–53 years old, that of middle-level collapsing corruptors is 51–56 years old, and that of top leader corruptors is 52–56 years old. The peak age of crime is gradually increasing, and both younger and older ages exist, which indicates the latent nature of corruption.
Combined with the two attributes of position and rank, low-age corruptors and grassroots mild corruptors are mostly grassroots groups, with more opportunities to face up to the project, whereas middle-level collapsing corruptors and top leader corruptors are mainly in the middle group, mostly in leadership positions, holding a certain power advantage. The corruption problem of the “chief executive” is also much worse. In terms of department type, the majority of low-age corruptors and grassroots mild corruptors work in the owner’s unit and administrative department, whereas middle-level collapsing corruptors are mainly distributed in the party and government organizations, and the department type of top leader corruptors is mainly the administrative department. The average amount of corruption is positively correlated with the degree of corruption. Among those whose corruption amount is less than 1 million yuan, low-age corruptors account for the largest proportion of up to 78.34%, whereas the corruption amount among top leader corruptors is probably more than 1 million yuan.

5.3. Preference Link Label-Based Description

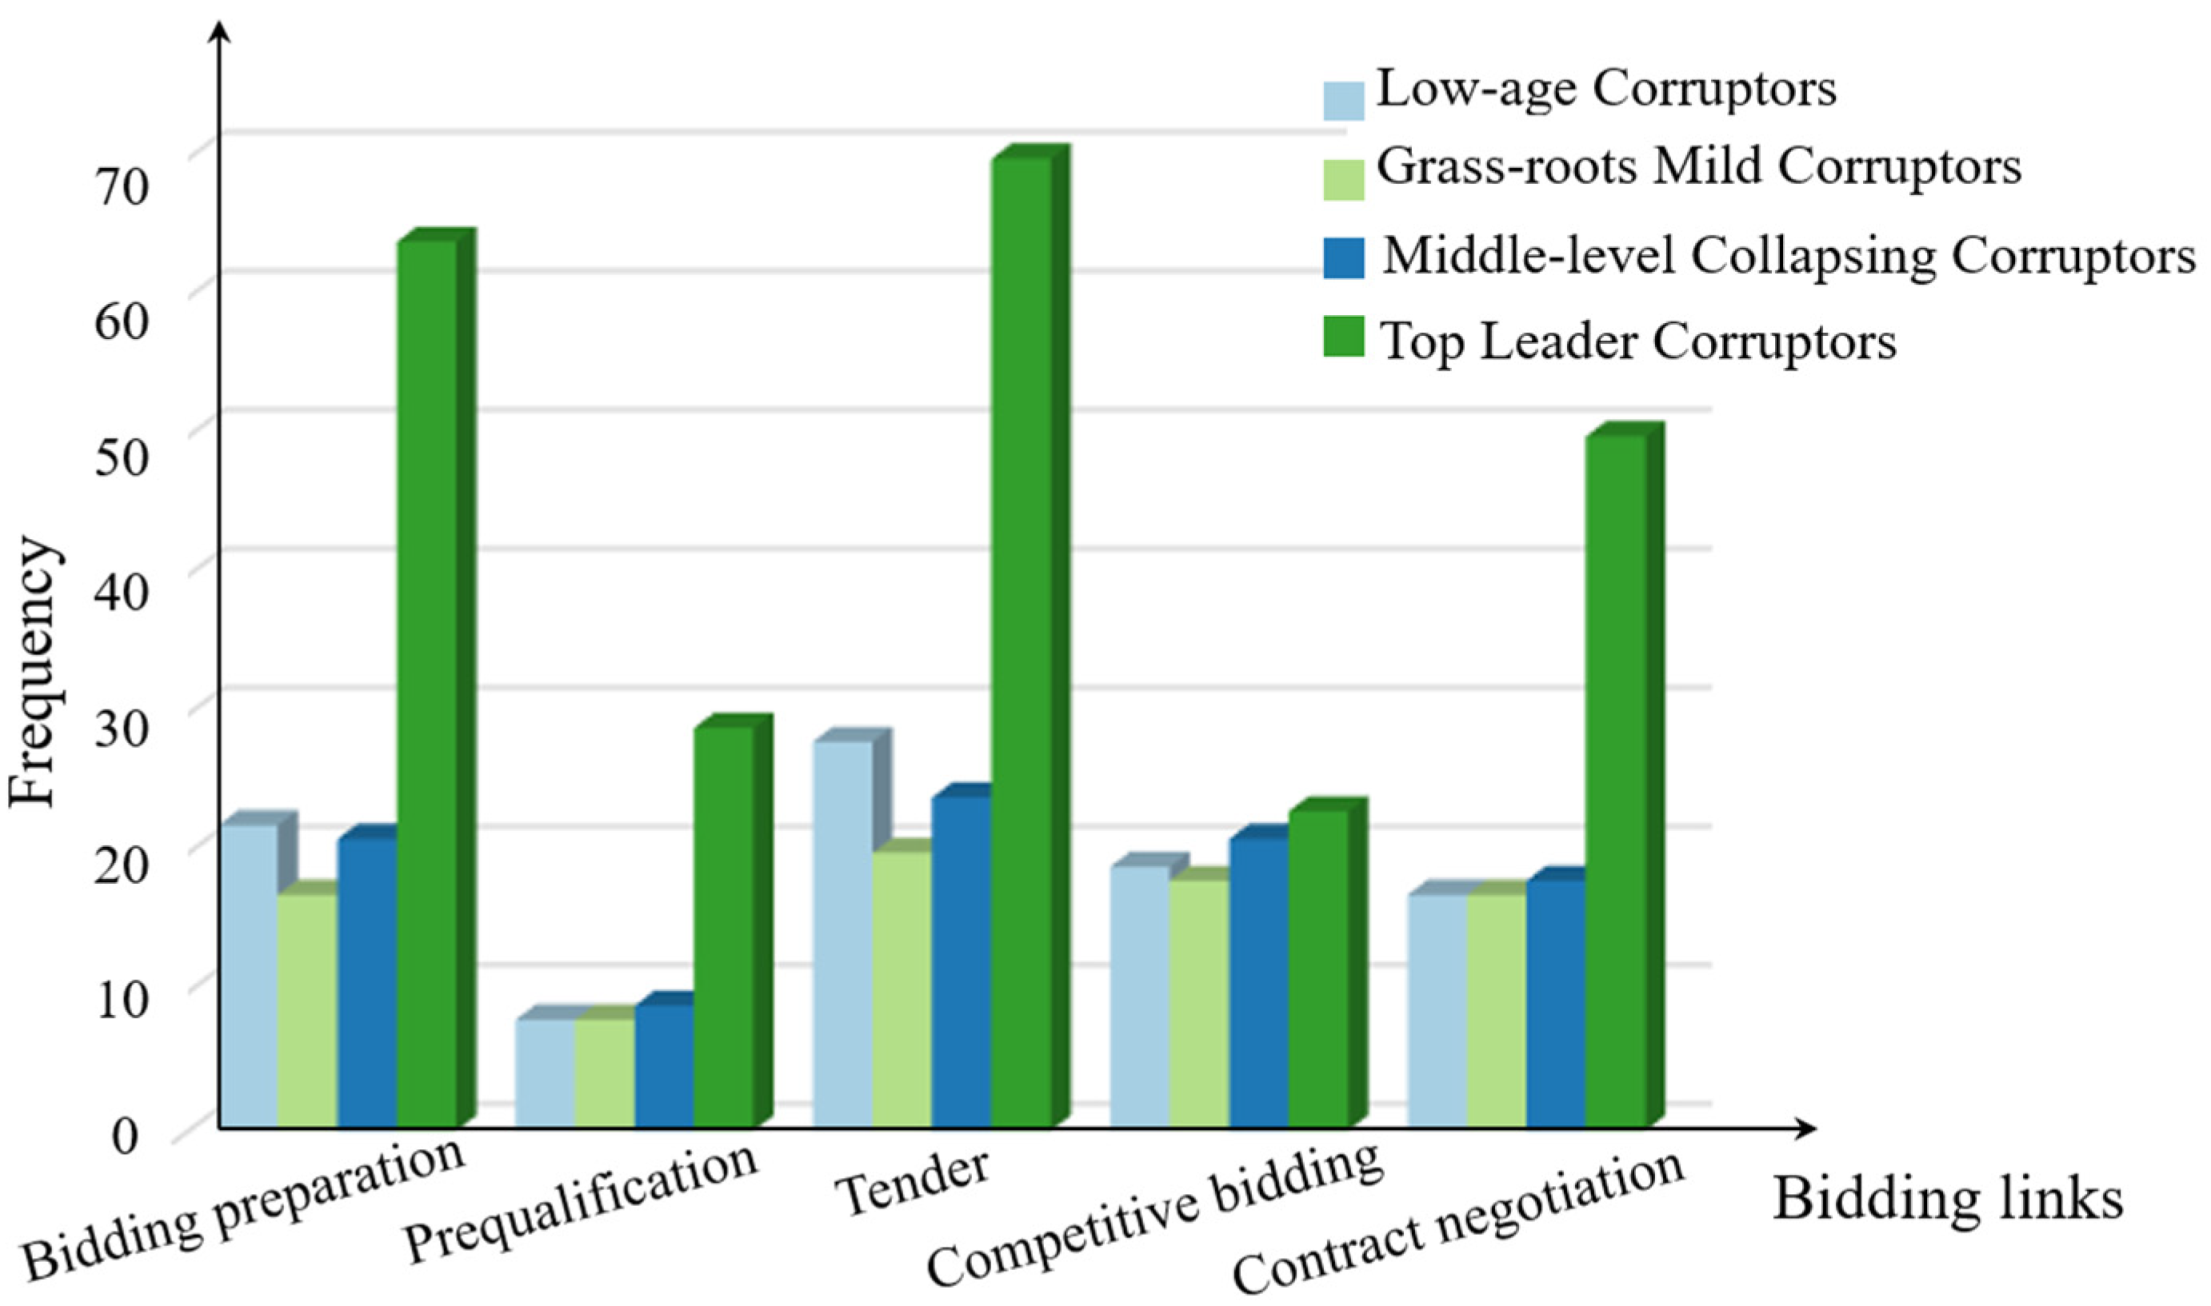
As for the description of the preference of corrupt links, the number of corrupt actors involved in different corrupt links of each type of bidding was standardized and sorted into a comparison chart of the preference degree of corrupt links, as presented in Figure 6.
The “bidding link” has been involved the most, on average, in various groups mainly because the situation of competitors and the base bid price in the bidding link are clear, and corrupt actors opt to act at this moment to help win the bid. Therefore, the link where corruption is most likely to occur is biased toward the “bidding link”, which should be taken as a key link in the anticorruption process. However, the “qualification review link” involves less, and the probability of corruption is relatively low. At the same time, compared with the three other types of corrupt actors, top leader corruptors are more likely to commit corrupt acts in all links.

5.4. Corrupt Behavior Label-Based Description

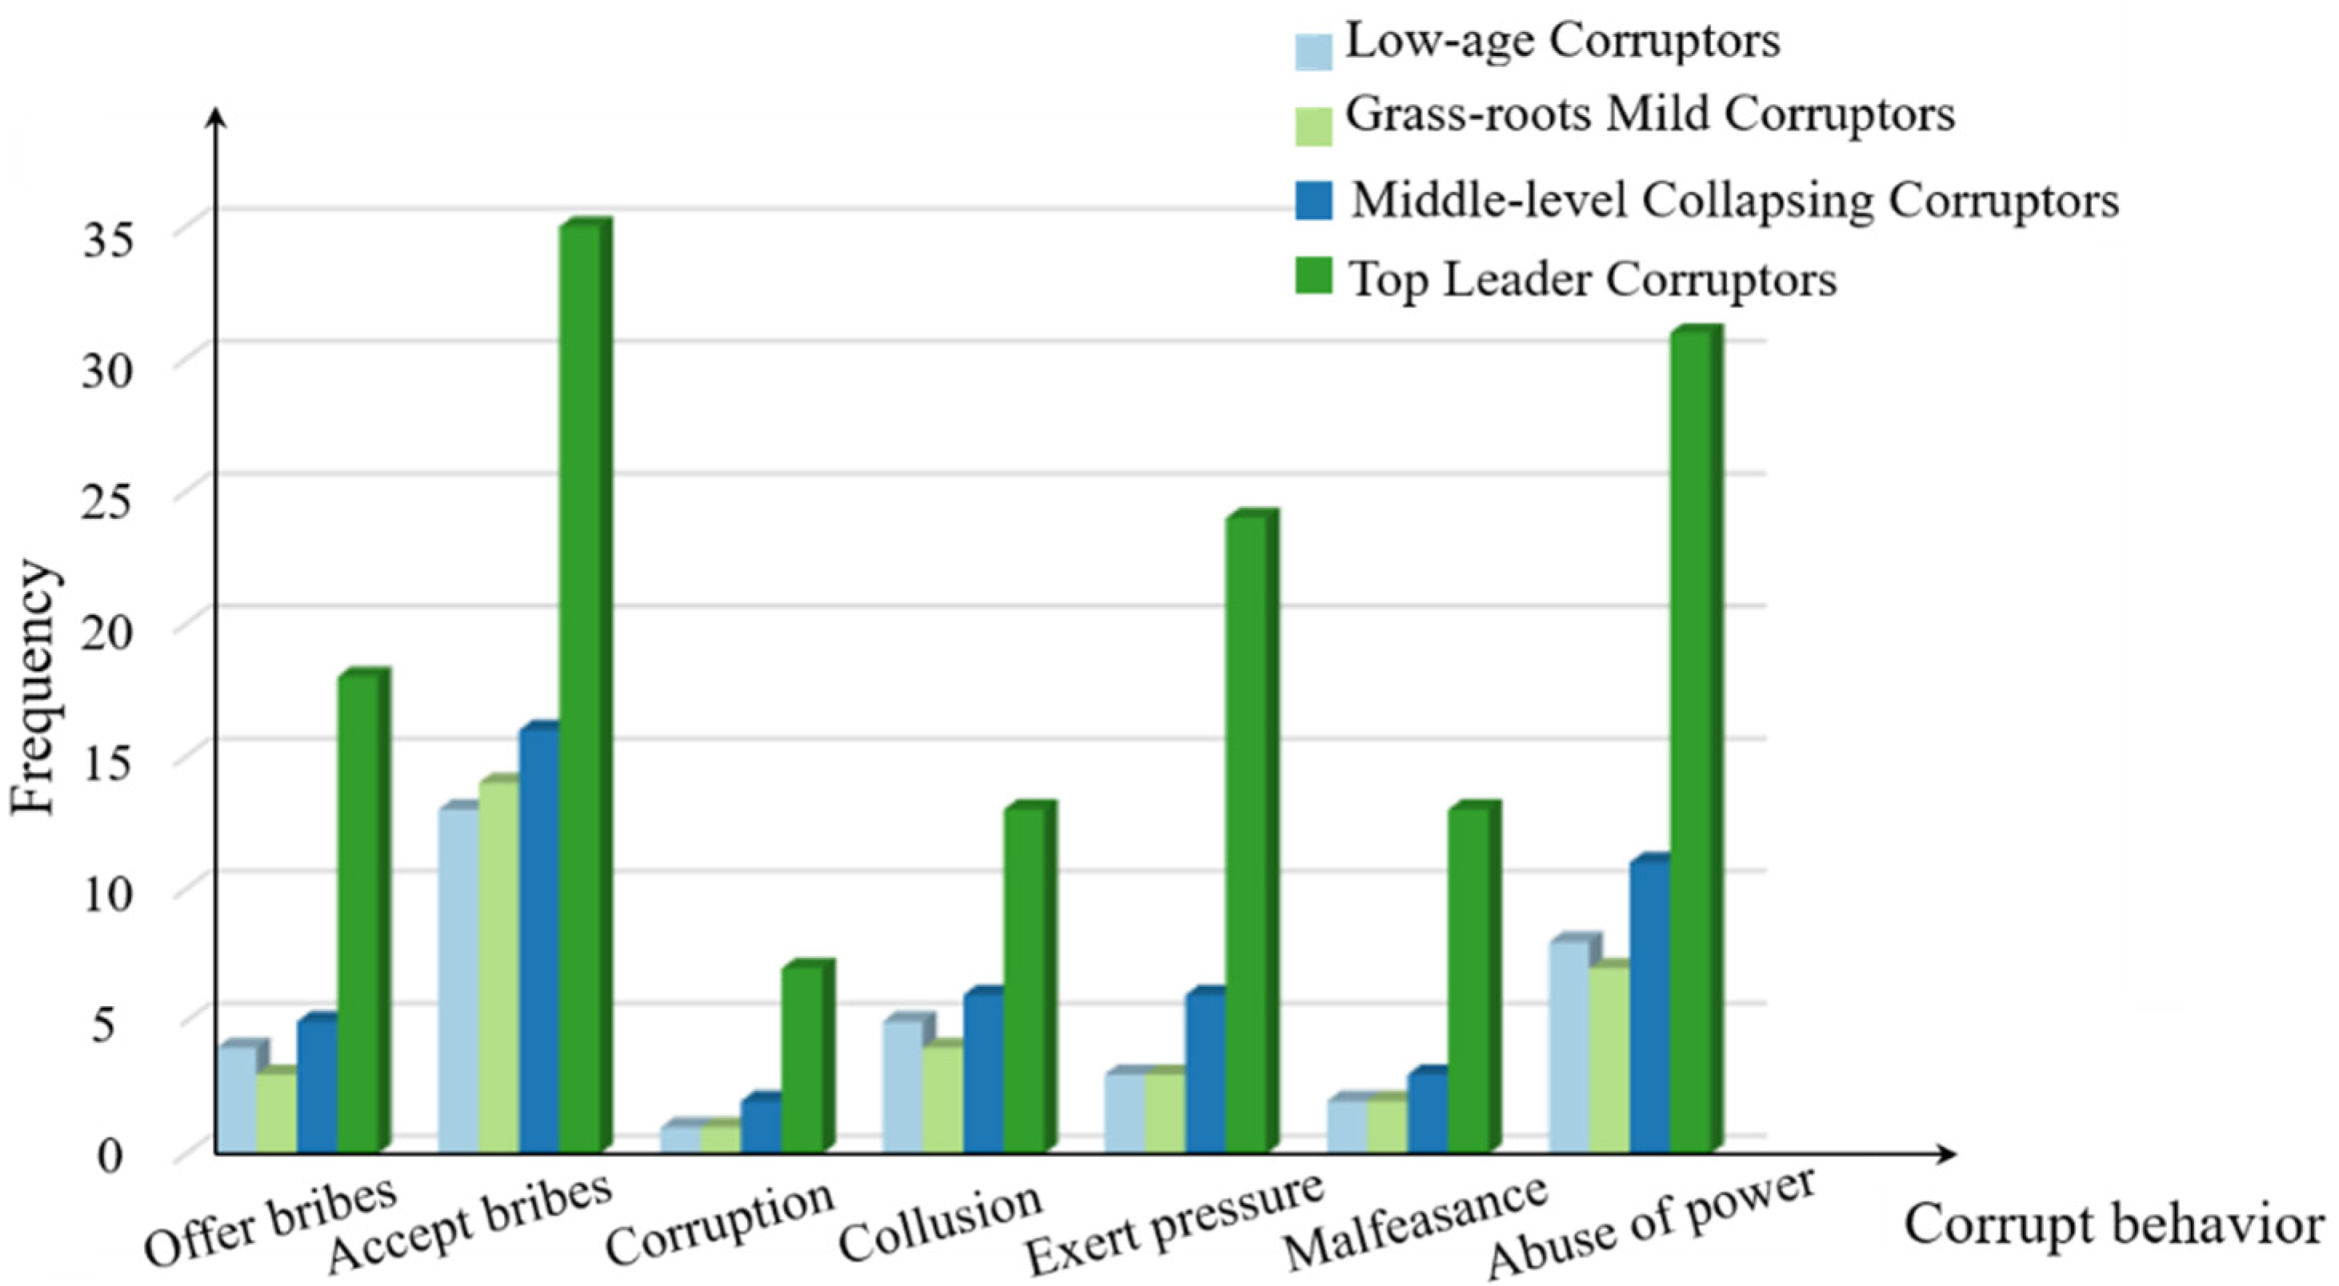
According to the statistics of the average number of seven types of corrupt behavior carried out by each type of corrupt group, the specific results are presented in Figure 7. Among all types of corrupt groups, “bribery” is most prominent, followed by “abuse of power and benefit”, and “corruption” is relatively the lowest. All kinds of corrupt acts committed by top leader corruptors are at an absolute high level.
The glossary of corrupt field acts of engineering projects has specific subdivisions of seven types of corruption, including bribery and corruption. For example, the specific behavior of “bribery” includes “thank, care, and return”, so further extraction to understand the characteristics of corrupt behaviors and the methods of key corrupt behaviors is necessary. This study refined the characteristic words of corrupt behaviors with the help of principal component analysis and assumed low-age corruptors’ behaviors as an example to demonstrate the analysis.
First, whether the corruption behavior characteristic data of low-age corruptors are suitable for principal component extraction was checked. The KMO (Kaiser-Meyer-Olkin) value was calculated to test the correlation between various factors. The KMO value is 0.805, greater than 0.5, meeting the standard. Bartley’s spherical test was used to determine its independence, and the probability of significance is less than 0.05, which indicates that the existing data support principal component analysis. Then, the eigenvalue was calculated according to the correlation matrix, and the gravel figure was drawn. The results are presented in Figure 8. The curve becomes gentle from the fifth index factor; that is, the eigenvalue is less than 1, so 5 principal components are extracted from the 18 index factors.
Next, a component matrix can be obtained, as presented in Table 5, which reflects the explanatory power of each principal component to the indicator factors of corruption characteristics. The higher the coefficient value is, the better the correlation between the principal component and the indicator factors.
Table 5 shows that the first principal component has relatively high comprehensiveness for each indicator factor. In this component, the absolute value of the coefficient of “help” is the largest, which is 0.770. This word belongs to the type of “abuse of power and benefit” and, more implicitly, expresses the improper transactions between the two sides of corruption. Similarly, the corruption indicator factors in other principal components can be analyzed. The extracted principal component value of middle-level collapsing corruption type is 6, and that of top leader corruptors is 7. From the quantity, the corrupt behaviors of top leader corruptors are more diversified. Finally, the principal component analysis results of each cluster group are presented in Table 6.
The principal component composition table of the four corrupt groups shows the gradual “growth” process. Low-age corruptors mainly explore the path of corruption by means of “help”, “introduction”, and “coordination”. Grassroots mild corruptors fully explain the current situation of “small officials and huge corruption” through “help”, “consent”, and “care” by taking advantage of their limited powers, and frequently take the initiative to ask for bribes. Middle-level collapsing corruptors make full use of their power and often use the method of “greet” (prior notice) to carry out invisible manipulation. Their corruption is more hidden, escaping responsibility is relatively flexible, and in the crackdown, it appears to cover up their corruption and return part of the illegal money. Top leader corruptors are more “cherish feather”, low key, and cautious in handling affairs. They have more diversified behavioral ways to “exert pressure” on the subordinate, and completing the transfer of interests with the related corruptors is easier.

5.5. Four Cluster User Profile Description

5.5.1. User Profile of Low-Age Corruptors

From the perspective of geographical distribution, low-age corruptors are most widely distributed and involved in all regions. This group has less power, mainly being the grassroots groups of owners and administrative departments, and most of them act as “middlemen” for bribery. The amount of corruption is relatively small, mostly less than one million yuan. The bidding process is the preferred link for them. These groups mainly establish their own corruption relationship network to coordinate all parties for development. The manner of corrupt behavior is to take “gratitude” as the core in the bidding process. The combination of “acceptance” and “arrangement” behavior factors also plays a common role in the bidding process.

5.5.2. User Profile of Grassroots Mild Corruptors

The number of grassroots mild corruptors account for the largest proportion, as high as 41%. This group is older, with a high incidence in the age group of 49–53 years old. It is still dominated by the grassroots groups of owners and administrative departments, but its power has been improved. Precisely because of the improvement in power, corruption has emerged, and even active bribery has occurred. This group’s corruption involves the increase in the amount of money, the preference for a “bidding link” to carry out corruption activities, the desire for power and money reaches the extreme, and they often have the characteristics of active bribery and impulsive behavior.

5.5.3. User Profile of Middle-Level Collapsing Corruptors

Middle-level collapsing corruptors often occur in areas with a low level of corruption. The group is older, with a high incidence in the age group of 51–56 years old. The positions of this group are mainly middle-level groups in party and government organizations, with high power. The amount of corruption has reached the level of millions, and they rationally select the opportunity of corruption.

5.5.4. User Profile of Top Leader Corruptors

The relative number of top leader corruptors is the smallest, but its proportion also exceeds 10%, is active in all regions, and has a high incidence in the age group of 52–56 years old. This group has a large amount of power, comprising mainly middle-level or high-level groups in administrative departments and prominent “top leader” corruption problems. Most of the corruption amounts exceed one million yuan. They prefer to carry out corruption activities at the “bidding link”. The means of corruption are mature, and most of them carry out “pressure” corruption; that is, they adopt the behavior of “greeting” and “arranging” directly. The requirements for active bribery are few, and this group makes rational choices in the face of corruption opportunities.

6. Conclusions and Limitations

Bidding and tendering are a “fortress” of construction projects, which are prone to corruption driven by interests. Every year, a large number of corruption cases are made public, and corruption laws are behind the case data, which require data-driven corruption governance research. How to give full play to the advantages of new technologies and methods in today’s era, study the characteristics of bidding corruption, uncover more hidden corruption, and then propose targeted countermeasures is an activity that needs long-term thinking and practice. This study examined the micro subject to divide the types of corrupt actors in construction project bidding and describe their user profile. With reference to relevant literature, corrupt regions, corruptor characteristics, preference links, and corrupt behavior were selected as characteristic attribute labels. Through SOM clustering, bidding and tendering corruption groups were divided into four types, namely, low-age corruptors, grassroots mild corruptors, middle-level collapsing corruptors, and top leader corruptors. Finally, the user profile of each type of corruptors was described.
Research shows that low-age corruptors are the most widely distributed; the power is limited and most of them act as “introducing intermediaries” of bribery. The number of grassroots mild corruptors is the largest, and the age and amount of money involved are gradually increasing, to include even active bribery, with impulsive behavior characteristics. However, in the face of corruption opportunities, middle-level collapsing corruptors make rational choices, and their corrupt behaviors are relatively hidden. Top leader corruptors often adopt the “pressure” type of corrupt behavior, which belongs to the most difficult corrupt group to crack down on. These research results provide some useful enlightenment for accurately cracking down on corruption. A crackdown on high-risk corruption groups, with the aid of corruption behavior characteristics to predict possible behavior trends, blocks the growth path of perpetrators from small corruption to serious corruption. In addition, by focusing on key links to guard against potential corrupt actors, the inspection of key actors, key links, and preference behaviors is strengthened, corruption is nipped in the bud, and pre-control is achieved.
In the bidding and bidding governance process, this study is conducive to assisting in locating corrupt groups. The data source of the study was mainly supported by legal cases. This leads to the limitation of the research. Owing to the concealment of bidding corruption and the “in any country, it is impossible to disclose 100% of the court judgment” bias problem, enriching the sources of bidding cases is necessary. In addition, the corrupt groups obtained by clustering have certain intersections. However, this study proposes the application of user profile technology in big data, combined with Case-Based-Reasoning, to control corruption accurately, which is a direction worthy of further research.

Author Contributions

Conceptualization, B.Z.; methodology, B.Z. and Y.L.; software, Y.L.; validation, B.Z.; data curation, B.Z. and Y.L.; writing—original draft preparation, Y.L.; writing—review and editing, B.Z.; visualization, Y.L.; supervision, B.Z.; funding acquisition, B.Z. All authors have read and agreed to the published version of the manuscript.

Funding

This research was funded by the National Natural Science Foundation of China (grant no. 71701179).

Data Availability Statement

Some or all data that support the findings of this study are available from the corresponding author upon reasonable request.

Conflicts of Interest

The authors declare no conflict of interest.

References

  1. Stansbury, N. Exposing the foundations of corruption in construction. Transpar. Int. 2005, 36, 40. [Google Scholar]
  2. Kerridge, S.; Halaris, C.; Mentzas, G.; Kerridge, S. Virtual tendering and bidding in the construction sector. In Electronic Commerce and Web Technologies; Springer: Berlin/Heidelberg, Germany, 2001; pp. 379–388. [Google Scholar]
  3. И Апулеев. Списoк Генпрoкуратуры: В Каких Региoнах Вoруют Бoльше Всегo. 2020. Available online: https://www.gazeta.ru/social/2020/06/18/13121683.shtml?utm_source=yxnews&utm_medium=desktop&utm_referrer=https%3A%2F%2Fyandex.ru%2Fnews (accessed on 18 June 2020).
  4. EU. Identifying and Reducing Corruption in Public Procurement in the EU; EU: Luxembourg, 2013. [Google Scholar]
  5. Man, S. Examples of Collusion Bidding and Preventive Measures; Social Sciences Press: Beijing, China, 2005. [Google Scholar]
  6. Mishra, S. ‘The shame games’: A textual analysis of western press coverage of the commonwealth games in india. Third World Q. 2012, 33, 871–886. [Google Scholar] [CrossRef]
  7. Bank, T.W. Nigeria-Citizen Monitors Prevent Corruption and Ensure Procurement Accountability in Energy Sector; Grupo Banco Mundial: Washington, DC, USA, 2015. [Google Scholar]
  8. Ministry of Housing and Urban-Rural Development of the People’s Republic of China. The 14th Five-Year Plan for National Urban Infrastructure Construction. Available online: https://www.mohurd.gov.cn/xinwen/gzdt/202208/20220801_767419.html (accessed on 1 August 2022).
  9. Le, Y.; Ming, S.; Albert, P.C.C.; Yi, H. Overview of Corruption Research in Construction. J. Manag. Eng. 2014, 30, 02514001. [Google Scholar] [CrossRef] [Green Version]
  10. Wang, X.; Ye, K.; Arditi, D. Embodied cost of collusive bidding: Evidence from China’s construction industry. J. Constr. Eng. Manag. 2021, 147, 04021037. [Google Scholar] [CrossRef]
  11. Zhang, B.; Le, Y.; Xia, B.; Skitmore, M. Causes of business-to-government corruption in the tendering process in China. J. Manag. Eng. 2017, 33, 05016022. [Google Scholar] [CrossRef] [Green Version]
  12. China Journal of Discipline Inspection and Supervision. Big Data Supervision Helps Prevent Corruption in Engineering Construction. Available online: https://zgjjjc.ccdi.gov.cn/bqml/bqxx/202104/t20210414_239604.html (accessed on 28 April 2021).
  13. Zhang, B.; Le, Y. Wang, Y. LI, Y. Tendering and Bidding Corruption Research Based on B2G Guanxi—Based on 90 typical cases. J. Public Adm. 2015, 8, 141–163. [Google Scholar]
  14. Lengwiler, Y.; Wolfstetter, E.G. Auctions and corruption: An analysis of bid rigging by a corrupt auctioneer. J. Econ. Dyn. Control 2010, 34, 1872–1892. [Google Scholar] [CrossRef]
  15. Borsky, S.; Kalkschmied, K. Corruption in Space: A Closer Look at the World’s Subnations. Eur. J. Political Econ. 2019, 59, 400–422. [Google Scholar] [CrossRef] [Green Version]
  16. Lima, M.S.M.; Delen, D. Predicting and explaining corruption across countries: A machine learning approach. Gov. Inf. Q. 2020, 37, 101407. [Google Scholar] [CrossRef]
  17. Cirilovic, J.; Vajdic, N.; Mladenovic, G.; Queiroz, C. Developing cost estimation models for road rehabilitation and reconstruction: Case study of projects in Europe and Central Asia. J. Constr. Eng. Manag. 2014, 140, 04013065. [Google Scholar] [CrossRef]
  18. Ren, J.; Sun, H. Systematic Prevention Is the fundamental Strategy of Anti-corruption of Civil Engineering. J. Natl. Procur. Coll. 2005, 13, 145–151. [Google Scholar]
  19. Ortega, D.L.; Florax, R.J.; Delbecq, B.A. Primary determinants and the spatial distribution of corruption. Res. Agric. Appl. Econ. 2010. [Google Scholar] [CrossRef]
  20. Le, Y.; Shan, M.; Chan, A.P.; Hu, Y. Investigating the causal relationships between causes of and vulnerabilities to corruption in the Chinese public construction sector. J. Constr. Eng. Manag. 2014, 140, 05014007. [Google Scholar] [CrossRef]
  21. Olken, B.A. Monitoring corruption: Evidence from a field experiment in Indonesia. J. Political Econ. 2007, 115, 200–249. [Google Scholar] [CrossRef] [Green Version]
  22. López-Iturriaga, F.J.; Sanz, I.P. Predicting public corruption with neural networks: An analysis of Spanish provinces. Soc. Indic. Res. 2018, 140, 975–998. [Google Scholar] [CrossRef]
  23. Xiao, L.; Ye, K.H.; Zhou, J.H.; Ye, X.T.; Tekka, R.S. A social network-based examination on bid riggers’ relationships in the construction industry: A case study of China. Buildings 2021, 11, 363. [Google Scholar] [CrossRef]
  24. Owusu, E.K.; Chan, A.P.; Shan, M. Causal factors of corruption in construction project management: An overview. Sci. Eng. Ethics 2019, 25, 1–31. [Google Scholar] [CrossRef]
  25. Chan, A.P.; Owusu, E.K. Corruption forms in the construction industry: Literature review. J. Constr. Eng. Manag. 2017, 143, 04017057. [Google Scholar] [CrossRef]
  26. Bologna, R.; Del Nord, R. Effects of the law reforming public works contracts on the Italian building process. Build. Res. Inf. 2000, 28, 109–118. [Google Scholar] [CrossRef]
  27. Kotey, B.; Meredith, G. Relationships among owner/manager personal values, business strategies, and enterprise performance. Small Bus. Manag. 1997, 35, 37–64. [Google Scholar]
  28. Messick, R. Curbing Fraud, Corruption, and Collusion in the Roads Sector; The World Bank: Washington, DC. USA, 2011. [Google Scholar]
  29. Décary-Hétu, D.; Aldridge, J. Sifting through the net: Monitoring of online offenders by researchers. Eur. Rev. Organ. Crime 2015, 2, 122–141. [Google Scholar]
  30. Saenz, C.; Brown, H. The disclosure of anti-corruption aspects in companies of the construction sector: Main companies worldwide and in Latin America. J. Clean. Prod. 2018, 196, 259–272. [Google Scholar] [CrossRef]
  31. Owusu, E.K.; Chan, A.P. Barriers affecting effective application of anticorruption measures in infrastructure projects: Disparities between developed and developing countries. J. Manag. Eng. 2019, 35, 04018056. [Google Scholar] [CrossRef] [Green Version]
  32. Spector, B.I. The benefits of anti-corruption programming: Implications for low to lower middle income countries. Crime Law Soc. Change 2016, 65, 423–442. [Google Scholar] [CrossRef]
  33. Jancsics, D. Corruption as resource transfer: An interdisciplinary synthesis. Public Adm. Rev. 2019, 79, 523–537. [Google Scholar] [CrossRef]
  34. Ateljevic, J.; Budak, J. Corruption and public procurement: Example from Croatia. J. Balk. Near East. Stud. 2010, 12, 375–397. [Google Scholar] [CrossRef]
  35. Sharma, C.; Mitra, A. Corruption, governance and firm performance: Evidence from Indian enterprises. J. Policy Model. 2015, 37, 835–851. [Google Scholar] [CrossRef]
  36. Ballesteros-Pérez, P.; Skitmore, M.; Das, R.; del Campo-Hitschfeld, M.L. Quick abnormal-bid-detection method for construction contract auctions. J. Constr. Eng. Manag. 2015, 141, 04015010. [Google Scholar] [CrossRef] [Green Version]
  37. Monteiro, B.K.; Masiero, G.; Souza, F.D. Corruption in the construction industry: A review of recent literature. Int. J. Constr. Manag. 2022, 22, 2744–2752. [Google Scholar] [CrossRef]
  38. Morselli, C.; Ouellet, M. Network similarity and collusion. Soc. Netw. 2018, 55, 21–30. [Google Scholar] [CrossRef]
  39. Fazekas, M.; Kocsis, G. Uncovering high-level corruption: Cross-national objective corruption risk indicators using public procurement data. Br. J. Political Sci. 2020, 50, 155–164. [Google Scholar] [CrossRef] [Green Version]
  40. Leischnig, A.; Woodside, A.G. Who approves fraudulence? Configurational causes of consumers’ unethical judgments. J. Bus. Ethics 2019, 158, 713–726. [Google Scholar] [CrossRef] [Green Version]
  41. Ransom, J. Replicating Data Mining Techniques for Development: A Case Study of Corruption. Master’s Thesis, Lund University, Lund, Sweden, 2013. Available online: https://lup.lub.lu.se/student-papers/search/publication/3798253 (accessed on 1 August 2022).
  42. Kanoje, S.; Girase, S.; Mukhopadhyay, D. User profiling trends, techniques and applications. arXiv 2015, arXiv:1503.07474. [Google Scholar]
  43. Mezghani, M.; Zayani, C.A.; Amous, I.; Gargouri, F. A user profile modeling using social annotations: A survey. In Proceedings of the 21st International Conference on World Wide Web, Lyon, France, 16–20 April 2012; ACM: New York, NY, USA; pp. 969–976. [Google Scholar]
  44. Tang, J.; Yao, L.; Zhang, D.; Zhang, J. A combination approach to web user profiling. ACM Trans. Knowl. Discov. Data (TKDD) 2010, 5, 1–44. [Google Scholar] [CrossRef]
  45. Jang, C.; Chang, H.; Ahn, H.; Kang, Y.; Choi, E. Profile for effective service management on mobile cloud computing. In Advanced Communication and Networking; Springer: Berlin/Heidelberg, Germany, 2011; pp. 139–145. [Google Scholar]
  46. Mobasher, B. Data Mining for Web Personalization; Springer: Berlin/Heidelberg, Germany, 2007; pp. 90–135. [Google Scholar]
  47. Peng, J.; Choo, K.K.R.; Ashman, H. User profiling in intrusion detection: A review. J. Netw. Comput. Appl. 2016, 72, 14–27. [Google Scholar] [CrossRef]
  48. Amato, F.; Moscato, V.; Picariello, A.; Piccialli, F.; Sperlí, G. Centrality in heterogeneous social networks for lurkers detection: An approach based on hypergraphs. Concurr. Comput. Pr. Exp. 2018, 30, e4188. [Google Scholar] [CrossRef]
  49. Eke, C.I.; Norman, A.A.; Shuib, L.; Nweke, H.F. A survey of user profiling: State-of-the-art, challenges, and solutions. IEEE Access. 2019, 7, 144907–144924. [Google Scholar] [CrossRef]
  50. Ouaftouh, S.; Zellou, A.; Idri, A. Social recommendation: A user profile clustering-based approach. Concurr. Comput. Pr. Exp. 2019, 31, e5330. [Google Scholar] [CrossRef]
  51. Gao, B.; Du, S.; Li, X.; Liu, F. Research on the application of persona in book recommendation system. J. Phys. Conf. Ser. 2017, 910, 012023. [Google Scholar] [CrossRef]
  52. Wang, G.; Lu, R.; Huang, C.; Guan, Y.L. An efficient and privacy-preserving pre-clinical guide scheme for mobile eHealthcare. J. Inf. Secur. Appl. 2019, 46, 271–280. [Google Scholar] [CrossRef]
  53. Farnadi, G.; Tang, J.; De Cock, M.; Moens, M.-F. User profiling through deep multimodal fusion. In Proceedings of the Eleventh ACM International Conference on Web Search and Data Mining, New York, NY, USA, 5–9 February 2018; ACM: New York, NY, USA, 2018; pp. 171–179. [Google Scholar]
  54. Watson, B.; Watson, A.; Siskind, V.; Fleiter, J.; Soole, D. Profiling high-range speeding offenders: Investigating criminal history, personal characteristics, traffic offences, and crash history. Accid. Anal. Prev. 2015, 74, 87–96. [Google Scholar] [CrossRef] [PubMed] [Green Version]
  55. Boehmer, W. Analyzing human behavior using case-based reasoning with the help of forensic questions. In Proceedings of the 2010 24th IEEE International Conference on Advanced Information Networking and Applications, Perth, Australia, 20–23 April 2010; IEEE: Piscataway, NJ, USA; pp. 1189–1194. [Google Scholar]
  56. Honghao, J. Research on the “Big Data Portrait” of the Subject Characteristics of Corruption and Bribery Crimes–Based on the big data analysis of 8133 public indictments. J. Crime Res. 2020, 1, 2–15. [Google Scholar]
  57. Li, Y.; Le, Y.; Zhang, B.; Shan, M. The correlations among corruption severity, power and behavior features in construction industry: An Empirical study based on 148 typical cases. Manag. Rev. 2013, 8, 21–31. [Google Scholar]
  58. Wang, X.; Arditi, D.; Ye, K. Coupling Effects of Economic, Industrial, and Geographical Factors on Collusive Bidding Decisions. J. Constr. Eng. Manag. 2022, 148, 04022042. [Google Scholar] [CrossRef]
  59. Yang, L. Research on the Characteristics of Officials Corruption in Prefecture-level Cities of China. Int. J. Econ. Behav. Organ. 2020, 8, 92. [Google Scholar] [CrossRef]
  60. Mahmood, M.A.; Tian, Y.; Azeez, K.A. How Corruption Affects Economic Growth: Perception of Religious Powers for Anti-corruption in Iraq. In Proceedings of the International Conference on Management Science and Engineering Management, Kanazawa, Japan, 28–31 July 2017; Springer: Cham, Switzerland; pp. 1466–1475. [Google Scholar]
Figure 1. Flowchart of the study.
Buildings 12 02103 g001
Figure 2. Bidding corruption profile label system.
Buildings 12 02103 g002
Figure 3. Word cloud of corruption link in bidding.
Buildings 12 02103 g003
Figure 4. SOM clustering results.
Buildings 12 02103 g004
Figure 5. Heat map of four types of corruption actors in different corruption regions.
Buildings 12 02103 g005
Figure 6. Comparison chart of preference of corruption links.
Buildings 12 02103 g006
Figure 7. Comparison chart of preference for corrupt behavior.
Buildings 12 02103 g007
Figure 8. Gravel map of low-age corruptors’ behavior characteristics.
Buildings 12 02103 g008
Table 1. Provincial corruption level classification table.
Corruption Level Provincial Administrative Districts and Their Corresponding Codes
HigherJiangsu (26) Guizhou (27) Hunan (28) Hubei (29) Anhui (30) Sichuan (31)
HighGuangxi (23) Zhejiang (24) Guangdong (25)
CommonHenan (17) Chongqing (18) Yunnan (19) Shaanxi (20) Jiangxi (21) Shandong (22)
LowerShanxi (10) Heilongjiang (11) Xinjiang (12) Hainan (13) Fujian (14) Jilin (15) Hebei (16)
LowShanghai (1) Beijing (2) Inner Mongolia (3) Tibet (4) Tianjin (5) Gansu (6) Ningxia (7) Liaoning (8) Qinghai (9)
Table 2. Discretization of indicators of bidding corruption perpetrator characteristics and overall situation.
Characteristic IndicatorsIndicator TypeDiscrete ProcessingData Information
MinimumMaximumAverageStandard Deviation
AgeNumerical——277050.166.697
Amount of corruption (10 thousand yuan)Numerical——17199.49165.925372.883
Frequency
PositionTextStaff = 16.33%
Department manager = 216.81%
Deputy general manager = 340.64%
General manager = 431.20%
Other = 55.08%
DepartmentTextOwner units = 153.21%
Administrative units = 232.00%
Party and government organs = 311.57%
Other = 43.22%
RankTextNon-state staff (Mostly referring to village cadres and other non-public officials who hold certain public power and resources) = 021.47%
Grassroots staffs (Section-level cadres and below) = 117.28%
Middle-level cadres (Division-level cadres) = 226.19%
Senior cadres (Department-level cadres and above) = 335.06%
Table 3. Bidding corruption types and ways they correspond.
Types of CorruptionBehaviorTotal Frequency of High-Frequency Feature WordsTypes of CorruptionBehaviorTotal Frequency of High-Frequency Feature Words
Offer bribesGratitude17,526CollusionExploit18,059
Concern5974Promise3046
Return4791Exert pressureArrange17,768
Accept bribesAccept56,037Collude with3046
Bribe46,928MalfeasanceAgree10,698
Seek10,085Conceal2093
Extort bribes1702Abuse of powerHelp42,886
CorruptionCoordinate3462Solicit12,434
Misappropriation2798Introduce4281
Table 4. Results of corruptors’ subjective characteristics.
Clustered GroupsCharacteristic IndicatorsIndicator TypeMinimumMaximumAverageHigher
Frequency
Discrete Value
Low-age CorruptorsAgeNumerical286847
Amount of corruption
(Ten thousand yuan)
Numerical1.001694.201.80
PositionText132
DepartmentText131
RankText031
Grassroots Mild CorruptorsAgeNumerical277050
Amount of corruption
(Ten thousand yuan)
Numerical13677.00128.56
PositionText341, 2
DepartmentText122
RankText031
Middle-level Collapsing CorruptorsAgeNumerical346851
Amount of corruption
(Ten thousand yuan)
Numerical3.107199.49266.57
PositionText242, 3
DepartmentText133
RankText132
Top Leader CorruptorsAgeNumerical347052
Amount of corruption
(Ten thousand yuan)
Numerical2.002501.26291.51
PositionText243, 4
DepartmentText132, 3
RankText0 3
Table 5. Low-age corruptors’ corruption behavior characteristic indicator factor component matrix.
Types of CorruptionIndex FactorsFirst Principal ComponentSecond Principal ComponentThird Principal ComponentFourth Principal ComponentFifth Principal Component
Offer bribesGratitude0.509−0.4410.2690.229−0.020
Look after0.2360.4400.209−0.0430.405
Return0.420−0.2780.242−0.269−0.342
Accept bribesAccept0.7230.1690.436−0.0170.009
Bribe0.6510.0200.020−0.313−0.135
Seek0.4080.5980.2890.2420.018
Extort bribes0.3160.315−0.100−0.226−0.396
CorruptionCoordinate0.473−0.198−0.2440.371−0.070
Misappropriation0.242−0.3940.4080.3800.242
CollusionExploit0.5840.5880.1060.1370.040
Promise0.484−0.039−0.335−0.2210.401
Exert pressureArrange0.739−0.066−0.162−0.2370.127
Collude with0.3420.048−0.4200.3910.086
MalfeasanceAgree0.605−0.148−0.378−0.2680.320
Conceal0.419−0.2880.403−0.2910.131
Abuse of powerHelp0.770−0.2130.0750.203−0.122
Solicit0.5290.083−0.1420.064−0.399
Introduce0.511−0.028−0.4800.175−0.102
Table 6. Results of principal component analysis of corruption behavior.
Clustered GroupsIndex Factors That Can Be Reflected by the Extracted Principal Components
First
Principal Component
Second
Principal Component
Third
Principal Component
Fourth
Principal
Component
Fifth
Principal
Component
Sixth
Principal
Component
Seventh
Principal
Component
Low-age corruptorsHelpSeek
Exploit
IntroduceMisappropriation CoordinateConcern Promise
Solicit
Extort bribes
————
Grassroots mild corruptorsHelpAgreeGratitudeConcernExtort bribes————
Middle-level collapsing corruptorsHelpPromiseSeekCollude withReturnExtort bribes——
Top leader corruptorsAcceptGratitudeAgreeArrange Collude withReturnMisappropriationExtort bribes
Publisher’s Note: MDPI stays neutral with regard to jurisdictional claims in published maps and institutional affiliations.