Article

Quantifying the Effect of Index-Based Operation Logic for Building Environmental Control System—Taking Shading as Example

1
College of Electronic and Information Engineering, Tongji University, Shanghai 201804, China
2
Shanghai Research Institute for Intelligent Autonomous Systems, Tongji University, Shanghai 201210, China
3
School of Mechanical Engineering, Tongji University, Shanghai 201804, China
*
Author to whom correspondence should be addressed.
Current address: Tongji University, No. 1239 Siping Road, Yangpu District, Shanghai 200092, China.
Buildings 2022, 12(12), 2043; https://doi.org/10.3390/buildings12122043
Submission received: 9 October 2022 / Revised: 9 November 2022 / Accepted: 17 November 2022 / Published: 22 November 2022
(This article belongs to the Section Building Energy, Physics, Environment, and Systems)

Abstract

:
Dynamic control of building environment control systems (BECSs) is an important procedure to realize energy consumption reduction while ensuring the occupant’s comfort. Two types of BECSs operation logic exist: parameter-based and index-based. This research concluded that based on the literature review and argumentation, index-based operation logic, advanced from parameter-based operation logic, can better fit the dynamic and complex needs of occupants. However, existing index-based operation logic is generally based on a single performance index, while the BECS operation affects the indoor environment in multiple dimensions, thus, a single index cannot describe the operation comprehensively and accurately. Therefore, this study takes shading as an example, summarizes the performance indices of index-based operation logic for shading from two dimensions, and sorts out six typical control strategies according to different control objectives. The operation effect was analyzed and quantified through simulation. The results demonstrate that the index-based operation strategy has positive effects. It is not sensitive to changes in boundary conditions and the control effect is not affected by individual factors. Meanwhile, advice on the index selection for shading is proposed.

1. Introduction

Under the background of further reducing building operation energy consumption to achieve carbon neutrality and achieving the occupant’s demands for good indoor environment quality, the purpose of the built environment can be summarized as “reducing the operation energy consumption of building and satisfying the basic comfort and health of indoor occupants” [1].
The dimensions of civil building environment mainly include light environment, thermal and humidity environment and air quality. The building environmental control system (BECS) is used to create such a multi-physical field coupling environment. BECSs can be classified as active and passive. “Active system” refers to the creation of an environment through energy consumption, including the air conditioning system, independent fresh air system and lighting system. The air conditioning system and independent fresh air system can realize the dynamic adjustment of the heat and humidity environment and the air quality in the building. The lighting system can realize the dynamic adjustment of the light environment. “Passive systems” do not require energy to adjust the environment, including shading and windows. Shading can simultaneously adjust the thermal and light environment in the building, and windows can adjust thermal and humidity environment and air quality. “Passive systems” are often used as auxiliary methods for “active systems”. However, due to some psychological needs of indoor occupants, the two passive technologies are also endowed with functions to meet the psychological needs of indoor occupants, such as adjusting shading to see the outdoor scenery. Therefore, if the multiple physical fields in the building are dynamically adjusted through the coupling operation of the BECS to achieve the goals of comfort and energy saving, its operation logic is complicated.
On the other hand, in the construction of the building environment, there is often a certain contradiction between the requirements of comfort and health and the energy saving of the system operation [2]. This creates problems for BECS smart control. Taking shading as an example, its adjusting strategy has opposite effects in different seasons because it affects the indoor thermal environment and the light environment simultaneously. For example, if the shading is pulled up in winter, the lighting energy consumption can be reduced by increasing natural lighting, and the air conditioning load can be reduced by increasing the solar radiation, thus reducing the air conditioning energy consumption. However, in summer, the pulling up of shading will increase the air conditioning load, thus increasing the energy consumption of the air conditioning. In addition, pulling up the shading in winter can help reduce the energy consumption of the active system, but it may cause glare, thus affecting the visual comfort of the occupants [3].
Through the description of “complexity” and “contradiction”, it can be seen that traditional manual control is obviously unable to comprise the optimal strategy in most cases, thus, the optimized control algorithm has a wide application prospect. Therefore, research on BECS optimization operation has profound significance.

2. Motivation

Since 2018, optimization of the BECS operation has been widely studied, with the goal of reducing the energy consumption of the system while improving the comfort of the indoor environment, as shown in Figure 1. For example, Du et al. regarded the control of an HVAC system as a Markov decision process, solved it using a model-free deep learning algorithm, and verified through simulation that the proposed control strategy could reduce energy consumption by 15% and occupant discomfort by 79% [4]. Yuan et al. proposed an innovative reinforcement learning-based model-free control strategy for HVAC, which can reduce the operating cost by 2.7% to 4.6% compared to reference strategies [5]. All these experiments proved the feasibility of the method discussed.
Taking the physical parameters describing the indoor environment, such as temperature, humidity and illuminance, as input parameters is a direct approach to establish the operation logic of a BECS, which can be called parameter-based operation logic. However, the comfort sensation of occupants is based on the complex and multidimensional perception of the indoor environment. This cannot be accurately described using physical parameters. Some classic performance indices have been proposed, such as daylight glare probability (DGP), useful daylight illuminance (UDI) and predicted percentage of discomfort (PPD). Therefore, several studies have advanced from parameter-based to index-based operation logic with improvement in computing power and algorithm performance of the related software and hardware. However, through a literature review (Section 3 in this paper), it is found that the current research on index-based operation logic mostly adopts a single performance index, which can not fully reflect the operational effect of a BECS. For example, the adjustment of shading affects the indoor light and thermal environment simultaneously, and a single index cannot describe light and thermal comfort concurrently.
After the review of parameter-based and index-based BECS operation logic, shading, as a representative of BECS, is considered in the following section of this study. First, five performance indices of index-based operation logic for shading were obtained from two-dimensional analysis through literature review and theoretical analysis. Second, six typical control strategies were summarized based on different control objectives. Then, the quantitative effect was analyzed by Grasshopper simulation to study the effects and characteristics of an index-based operation logic that combines a variety of indices. The advice on the index selection for shading is proposed based on the results of the simulation. Figure 2 presents the flowchart of this study.

3. Summary and Discussion of the Operation Logic of BECS

Through literature research, this study divided the currently widely used operation logic of the BECS into two categories, according to input parameters: parameter-based logic and index-based logic. A summary of the existing operation logic is presented in Table 1.

3.1. Parameter-Based Operation Logic

In this operation logic, the input parameters are simple physical environmental parameters, such as the indoor temperature and illuminance, which can be measured directly using sensors. When the input parameters exceeded a predefined threshold, an environmental control device was triggered. To evaluate the control effects, the quantitative indices for evaluation in these logics can be the statistical analysis of environmental parameters in the actual operation process, such as the proportion of time in which the temperature is beyond the preset range within a certain period. These indices can also be complex performance indices, such as DGP, UDI and PPD; which are more suitable for the occupant’s sensation. The realization of this logic depends on real-time monitoring of environmental parameters using sensors. This type is labeled control type 1 in Table 1.

3.2. Index-Based Operation Logic

In recent years, with the improvement in computing performance of hardware devices, such as processors, and the evaluation indices for indoor environment building effects, index-based operation logic has gradually attracted increasing attention. This type of operation is both simple and direct. It selects performance indices that are more suitable for reflecting the comfort of occupants as the input parameters for the operation logic, and they are simultaneously used as quantitative indices for evaluation. The acquisition of performance indices depends on simulation or calculation through the real-time monitoring of simple environmental parameters. This index-based operation logic can be considered an advancement from parameter-based operation logic. The current mainstream evaluation indices for various BECS are listed in Table 2, according to the existing research. This type is labeled as control type 2 in Table 1.

3.3. Discussion of the Operation Logic

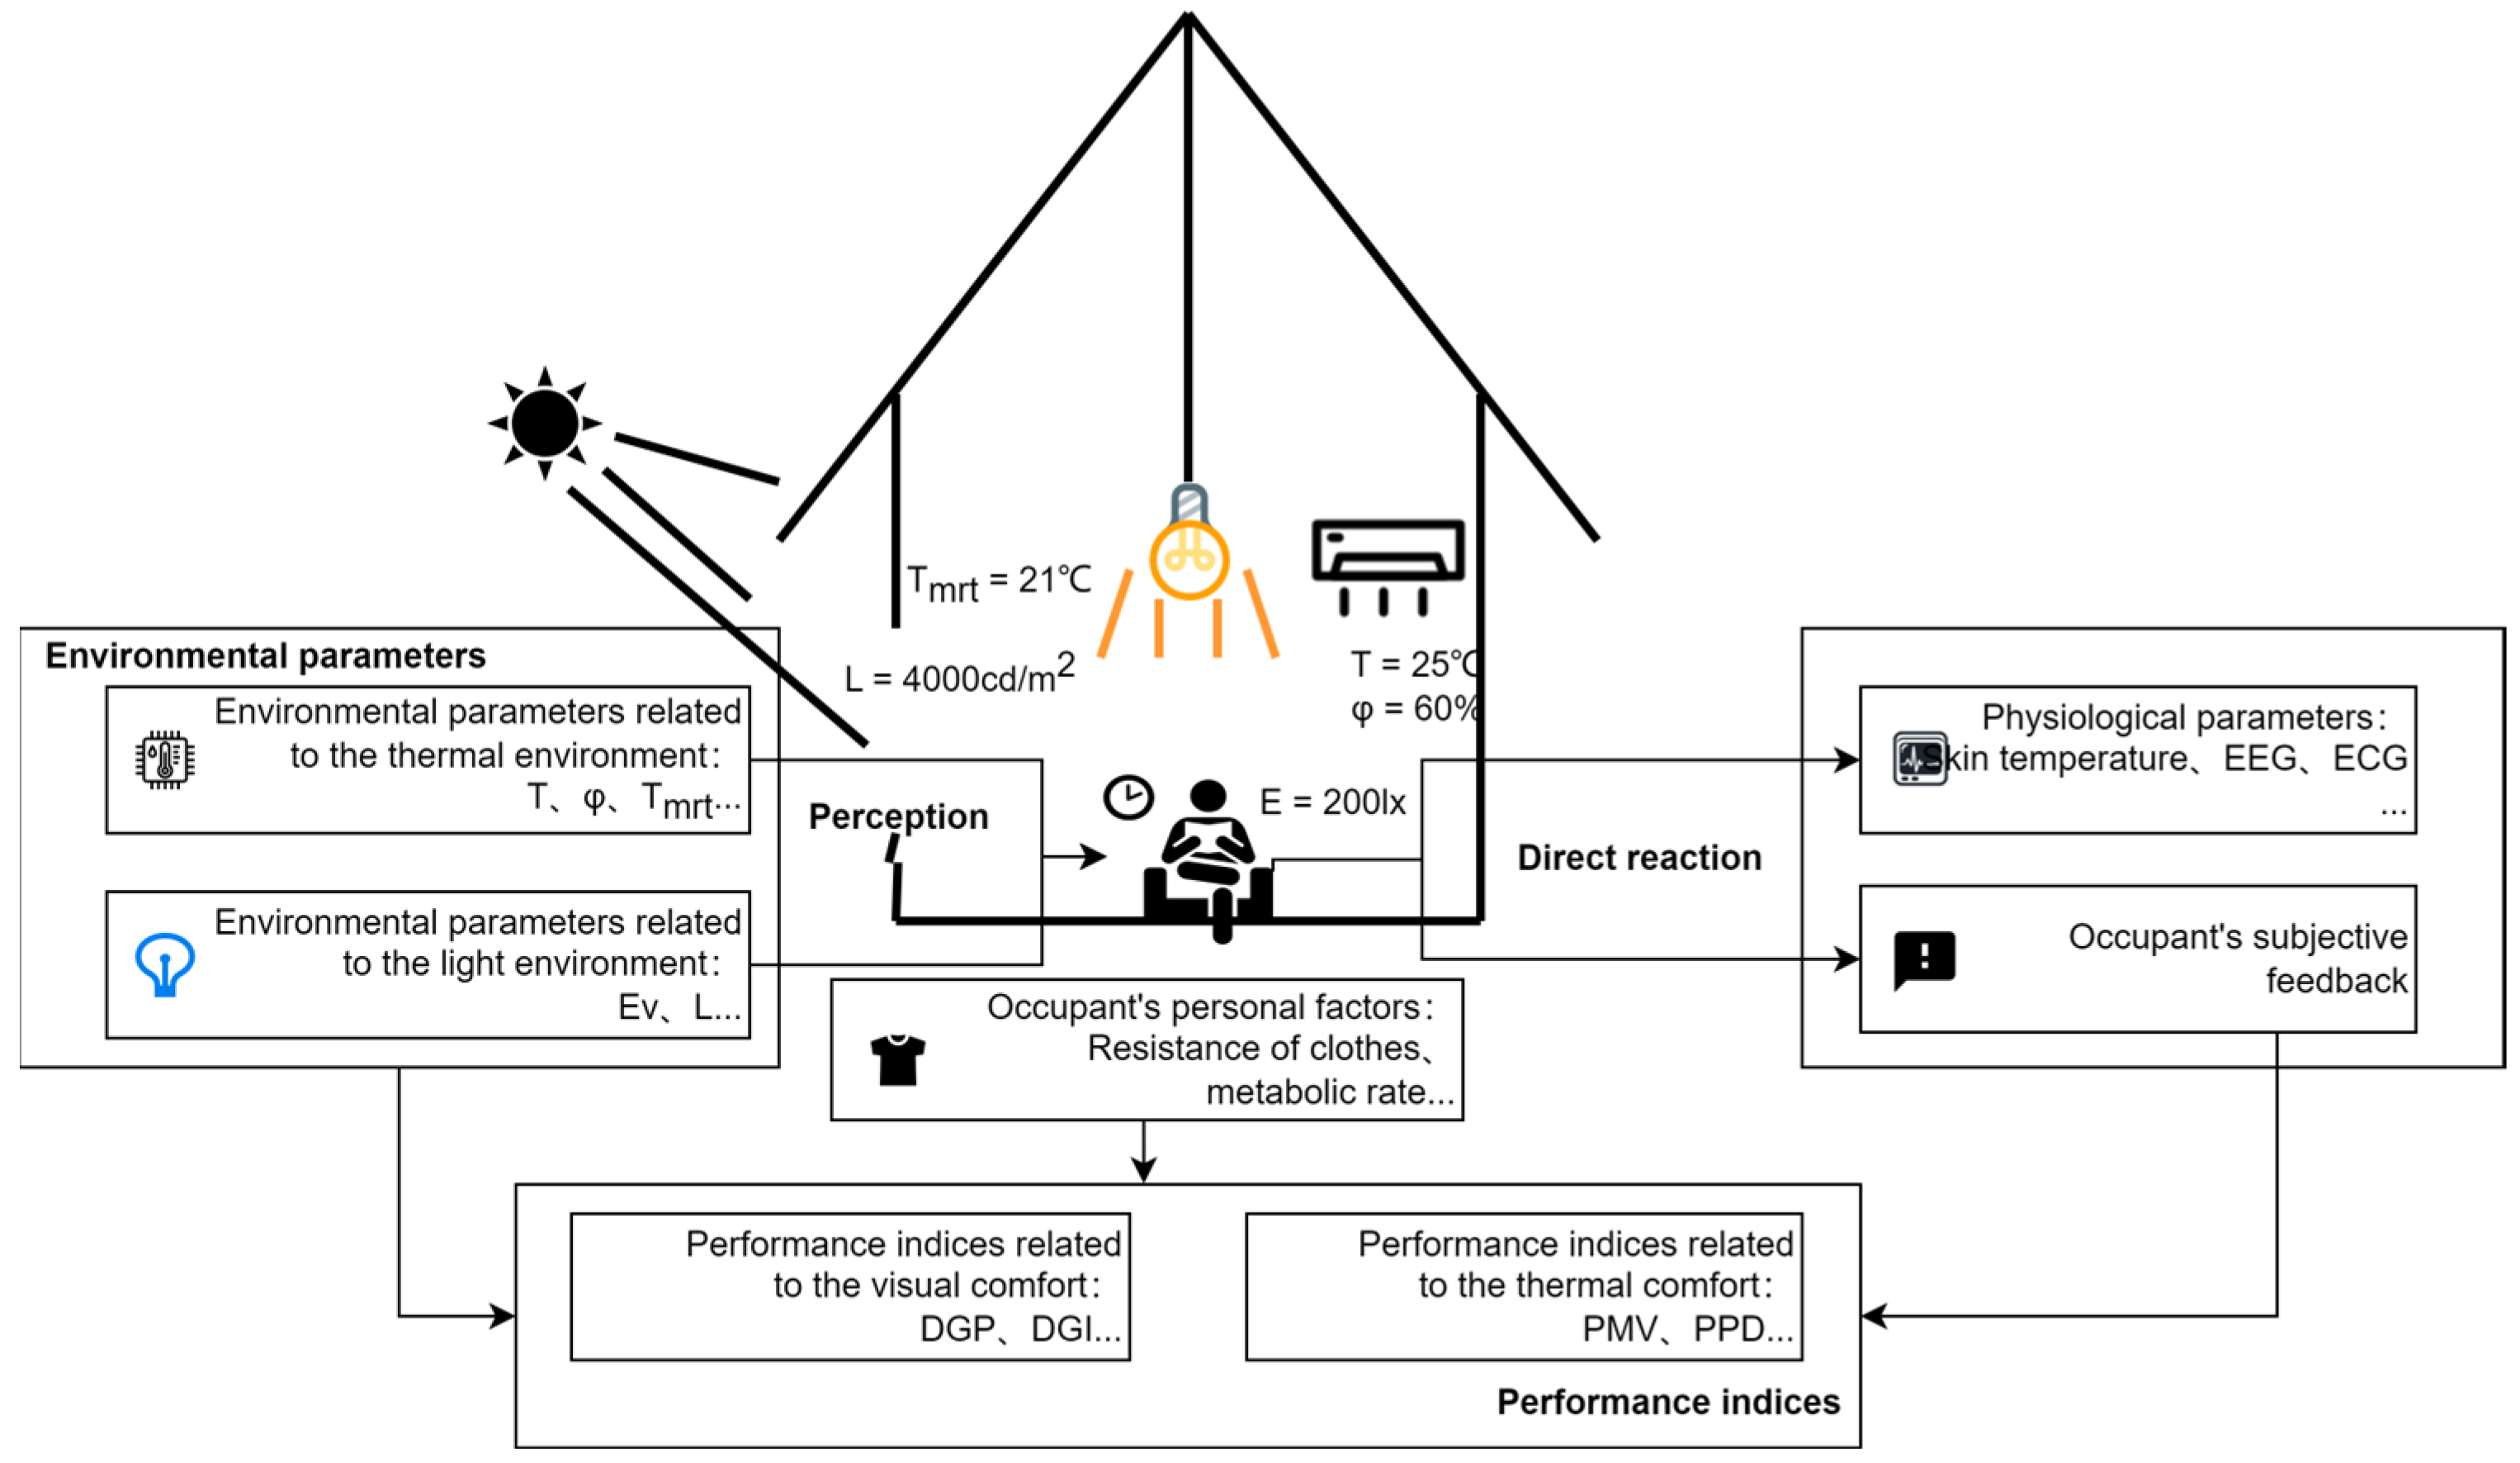
The analysis and comparison demonstrated that existing studies on the two types of operation logic, namely parameter-based and index-based logic, are abundant. The parameter-based logic must be realized on the premise of ensuring the continuous and stable monitoring of relevant environmental parameters, in addition to using them as the input parameters of the control model. However, as shown in Figure 3, occupant demands and preferences for indoor environments are not generated by the direct perception of these environmental parameters. For a long time, and through continuous research, researchers have put forward various indices on the basis of these basic physical parameters to reflect the occupant’s demands and preferences regarding their indoor environment more intuitively, such as DGP [26], daylight glare index (DGI) [31], UDI [27], visual comfort probability (VCP) [29] and other light environmental indices, as well as thermal environmental indices, such as predicted mean vote (PMV) [29], PPD [28], thermal sensation vote (TSV) [32] and thermal preference vote (TPV) [32]. For example, the PMV index reflects the thermal comfort of the occupants while taking multiple environmental parameters into consideration, such as air temperature and humidity, in addition to personalized parameters, such as human metabolic rate and clothing thermal resistance. On the other hand, the DGP index, which reflects the light comfort of occupants, considers environmental parameters such as the luminance of the source and vertical eye illuminance. Therefore, since there is no direct relation between physical environmental parameters and the occupant’s needs and preferences, the operation logic of the BECS, built based on these parameter thresholds, cannot completely fit the needs of occupants [21], which may lead to dissatisfaction and to manual override control.
Index-based logic can effectively avoid the aforementioned problems. It directly uses performance indices that are more related to the occupant’s comfort, such as the parameters in the second box in Figure 3, as the input parameters. Therefore, this method is equivalent to using the direct requirements of the occupant as the input, which may increase the occupant’s satisfaction, reduce the frequency of manual override control and ensure the desired control effect. In addition, these complex performance indices can be obtained based on simulation tools and may reduce the number of traditional sensor data acquisition systems, which can be costly [21], and avoid complex installation, commissioning work and interference from indoor occupants. For example, simulation of DGP only needs outdoor meteorological parameters, building structure, time of the day, eye position and orientation as input. In this way, we do not need indoor illuminance data as input for shading control.
However, Table 1 summarizes that the input parameters of the existing index-based operation logic are relatively single, and mostly consider a single performance index, such as a single DGP reflecting visual comfort or PMV reflecting thermal comfort, as input. Studies have shown that different states of equipment in the BECS will not only have an impact on the different aspects of the occupant’s comfort, but also on a variety of sub-energy consumption of buildings. For example, the different states of shading will not only affect the visual comfort and thermal comfort of occupants, but also affect the energy consumption of the air conditioning, heating and lighting. Therefore, for better operation effects, the operation of the BECS should consider, in addition to the comfort of the occupants, the energy consumption generated under different control strategies to choose the strategy with the best performance. The rest of this study considers shading as an example to comprehensively extract performance indices from two dimensions, develop automatic control strategies for shading comprehensively and analyze its impact on the visual comfort, thermal comfort, lighting, air conditioning and heating energy consumption. This considers both the comfort of the occupants and the energy savings.

4. Selection of Key Performance Indices for BECS—Taking Shading as an Example

Because of the length limitation, this study uses the shading system as an example, selects key performance indices for the realization of index-based operation logic (comfort and energy saving), and presents their calculation methods.
The shading adjustment can change the indoor light and thermal environment, which mainly affects the latter by changing solar radiation transmission. Changes in the thermal environment affect the cooling and heating loads of the room. The change in the light environment affects the illuminance of work plane in the room. If the lighting system also has an intelligent control module, it will also affect lighting energy consumption.
Therefore, as shown in Figure 4, with the room as a unit, the performance indices of intelligent shading can be divided into the two dimensions of light and radiant thermal environment, and energy saving and indoor comfort. They should contain indices related to the comfort of indoor light and radiant thermal environment, as well as indices for evaluating air conditioning and lighting energy consumption.

4.1. Performance Indices of “Light Environment”

4.1.1. Index for Light Comfort—DGP

When the lighting is too plentiful, glare and uneven illumination appear, causing visual discomfort. Glare is a subjective sensation that describes a phenomenon in which the intensity of light or the contrast between light and dark in the field of view exceeds the intensity to which a person can adapt to. Glare is divided into a disability and uncomfortable. An uncomfortable glare can be obtained by analyzing the brightness distribution in an observer’s field of vision.
The glare index has been under development for a long time. It is an important index in lighting design that reflects the quality of the lighting. The lighting glare index is suitable for the measurement of glare caused by small-area light sources, but is not suitable for natural lighting conditions with large-area light sources. In 2006, Wienold et al. [26] conducted an experimental study on the relationship between visual comfort and light environment on 72 test subjects in Denmark and Germany. They analyzed the brightness distribution in the field of vision based on the highly dynamic images generated by a CCD camera and obtained the DGP through fitting regression, as shown below:
D G P = 5.87 × 10 5 E v + 9.18 × 10 5 log ( 1 + i L s , i 2 ω s , i E v 1.87 P i 2 )
where, E v is the illuminance perpendicular to the human eye, L s , i is the luminance of the source, ω s , i is the solid angle of the source and P i is the Guth position index, which indicates the relative positional relationship between the human eye and glare source. Table 3 presents the threshold information for the DGP.
Several researchers have used this evaluation index in research on light environment and shading design. Pesenti [34] used a simulation to calculate DGP and compared natural lighting and visual comfort under 27 shading configurations. Lavin [35] used UDI and DGP as optimization objectives and used a genetic algorithm to obtain the optimal structure of the shading curtain wall. Compared with the original structure, the discomfort glare phenomenon no longer appears. Therefore, the DGP can accurately reflect glare under natural lighting conditions. The use of the DGP as an evaluation index for visual comfort has become a consensus. Therefore, we selected the DGP as the performance index to describe visual comfort.

4.1.2. Index for Lighting Energy Consumption—Illuminance of Work Plane

Shading blocks part of the sunlight and reduces the effective use of natural lighting. According to architectural lighting design standards in China, the illuminance of a work plane should not be less than 450 lx under the natural lighting of office buildings [36]. When the illuminance of the work plane is lower than the threshold, the artificial light source should be turned on to maintain a suitable working environment. To maintain the indoor illuminance level, the artificial light source is needed. Therefore, the lighting energy consumption for daylighting compensation can be measured by using the illuminance of the work plane.
To determine whether it is necessary to turn on the artificial light source, a daylighting simulation is used to obtain the illuminance of the work plane. Radiance is the most widely used software for daylight simulations.
In this study, the illuminance of the work plane was selected as an index to measure lighting energy consumption.

4.2. Performance Indices of Radiant Thermal Environment

4.2.1. Indices for Radiant Thermal Comfort—PMV* and RTA*

PMV [29] is a common index used to evaluate indoor thermal environments. The index integrates air temperature, air humidity, air flow speed, average radiation temperature, human metabolism rate, clothing thermal resistance and so on. It reflects the thermal comfort level. The calculation formulas for the PMV are shown as follows:
P M V = 0.303 0.036 M + 0.028 L
L = f M , t a , p a , θ m r t , I c l , v a = M W 0.0014 M 34 t a 0.0173 M 5.867 p a 0.35 × 5.733 0.007 ( M W ) p a 0.42 × ( M W 58.15 ) 3.96 × 10 8 f c l t c l + 273 4 θ m r t + 273 4 f c l h c t c l t a
where M is the metabolic rate of the human body, W is the external work of the human body, p a is the partial pressure of water vapor, t a is the air temperature, θ m r t is the average radiation temperature, t c l is the surface temperature of the human body, f c l is the clothing area coefficient, and h c is the convective heat transfer coefficient of clothing. It is generally believed that when the PMV value exceeds ±1, the environment deviates from a thermal comfort state.
PMV does not consider the direct influence of solar radiation on people’s bodies. Consequently, the influence of radiant heat cannot be completely described owing to the changing shading state on the indoor occupant’s comfort. Therefore, the Gennusa model [37,38], in which solar radiation is divided into direct and diffused radiation, was used in this study. A new calculation model for the average radiation temperature was established and PMV* was proposed as a performance index.
According to the Gennusa model, the calculation method for the average radiation temperature is shown as follows:
T r = Σ i = l N F S i T i 4 + α irr , d Σ j = l M F S j I d , j ε S σ + α irr , b f p I b ε S σ 4
where F S i represents the angle factor between the human body and the envelope surface, F S j is the angle factor between the human body and the glass surface, T i is the envelope surface temperature, α irr , d is the absorption coefficient of the diffuse radiation of the human body, I d , j is the diffuse radiation entering the room, α irr , b is the absorption coefficient of the direct radiation of the human body, I b is direct radiation that strikes humans, f p is AP/Ar, which is the ratio of the projected area of the subject onto a plane normal to the direction of the solar beam to the effective area of the human body, σ is the Stefan-Boltzmann constant, and ε S represents emissivity of the human body.
Therefore, we replaced the θ m r t in Equation (3) with the T r which is obtained in Equation (4). This improves the PMV because it considers the direct impact of solar radiation on the human body, which is called PMV* in this study.
Radiant temperature asymmetry (RTA) [39] is used to describe the thermal environment of the human body in a nonuniform thermal environment, which is defined as the radiation temperature difference between two sides felt by an indoor human. It is often used to evaluate cold radiation ceilings or other radiation heat sources, and its description is shown in Equation (5).
T r = T p r i T p r j = i = 1 N F s i T i 4 4 j = 1 N F s j T j 4 4
where T r is the RTA, T i denotes the surface temperature and Fs-i represents the angle factor between planes s and i. According to the Gennusa model, the influence of solar radiation should be considered when calculating radiation temperature in a shaded room. If a room has a window on one side and no window on the opposite side, the RTA inside the room can be described as follows:
When the shading is pulled up, RTA is described as follows:
T r = T p r i T p r j = i = 1 N F s i T i 4 + α irr , d k = 1 M F s k I d , j ε s σ + 2 α irr , b f s I b ε s σ 4 j = 1 N F s j T j 4 4
where, Ti is the surface temperature.
When the shading is pulled down, RTA is as follows:
T r = T pri T prj = i = 1 N F s i T i 4 + α irr , d k = 1 M F s k I d , j ε s σ 4 j = 1 N F s j T j 4 4
Compared with Equation (5), the radiation asymmetry after considering solar radiation mainly reflects the former between the irradiated and unirradiated surfaces. The calculation of solar radiation was added to the first factor, which was named RTA* in this study.

4.2.2. Indices for HVAC Energy Consumption—Solar Radiation Heat Gain

Solar radiation enters the room through the transparent envelope, which forms a cooling load during the cooling season and increases the indoor temperature during the heating season. Shading changes the heat gain of the solar radiation entering the room through the transparent envelope to reduce or increase the energy consumption of the HVAC. The simulation method for solar radiation heat gain through a shading roller shutter is mature. EnergyPlus was the simulation program used in this study. Its calculation theory can be seen in reference [40].

4.3. Simulation Calculation of Shading Control Performance Indices

In this study, EnergyPlus and Radiance were selected as the simulation kernels, and Diva, Ladybug and Honeybee plug-ins in the Rhino–Grasshopper module were used to simulate the shading performance under actual weather conditions. The Grasshopper is a visual programming plug-in that runs on a Rhino platform. Grasshoppers are primarily used to solve two problems: one is to automatically generate visual results by inputting instructions into the program components, and the other is to replace several repeated operations with visual programming.
Specifically, the Diva plug-in was used to run the Radiance kernel to calculate the heat gain of direct and scattered solar radiation, illuminance of the work plane, and glare possibility index. The radiance map, annual daylight, and glare calculation modules were used to output the direct sunlight, scattering, total radiation, illuminance of the working plane and DGP values of the indoor occupants throughout the year. The calculations of PMV* and RTA* were based on the calculation of the average radiation temperature considering the solar radiation. This temperature was calculated using the Grasshopper Honeybee plug-in running the OpenStudio kernel. EnergyPlus (8.9.0 DOE and LBNL) energy consumption simulation software was used to calculate the solar radiation heat gain of the room.
The performance index results for different shading gears can be obtained by inputting the required parameters into various simulation operation cores, and the shading is adjusted to the appropriate position according to the control objectives.

5. Analysis and Discussion of Index-Based Operation Logic through Simulation

Index-based operation logic is objective-oriented and does not need to adopt a complex control strategy. Therefore, this chapter considers shading as a representative of the BECS. First, six typical index-based control strategies are summarized based on the arrangement and combination of various objectives. To verify the effectiveness of the operation logic, referring to existing studies in South Korea [13] and Germany [41], this study defined, presented and analyzed the control effects of two cases with different shading system forms and room layouts by means of simulation.

5.1. Several Typical Index-Based Control Strategies

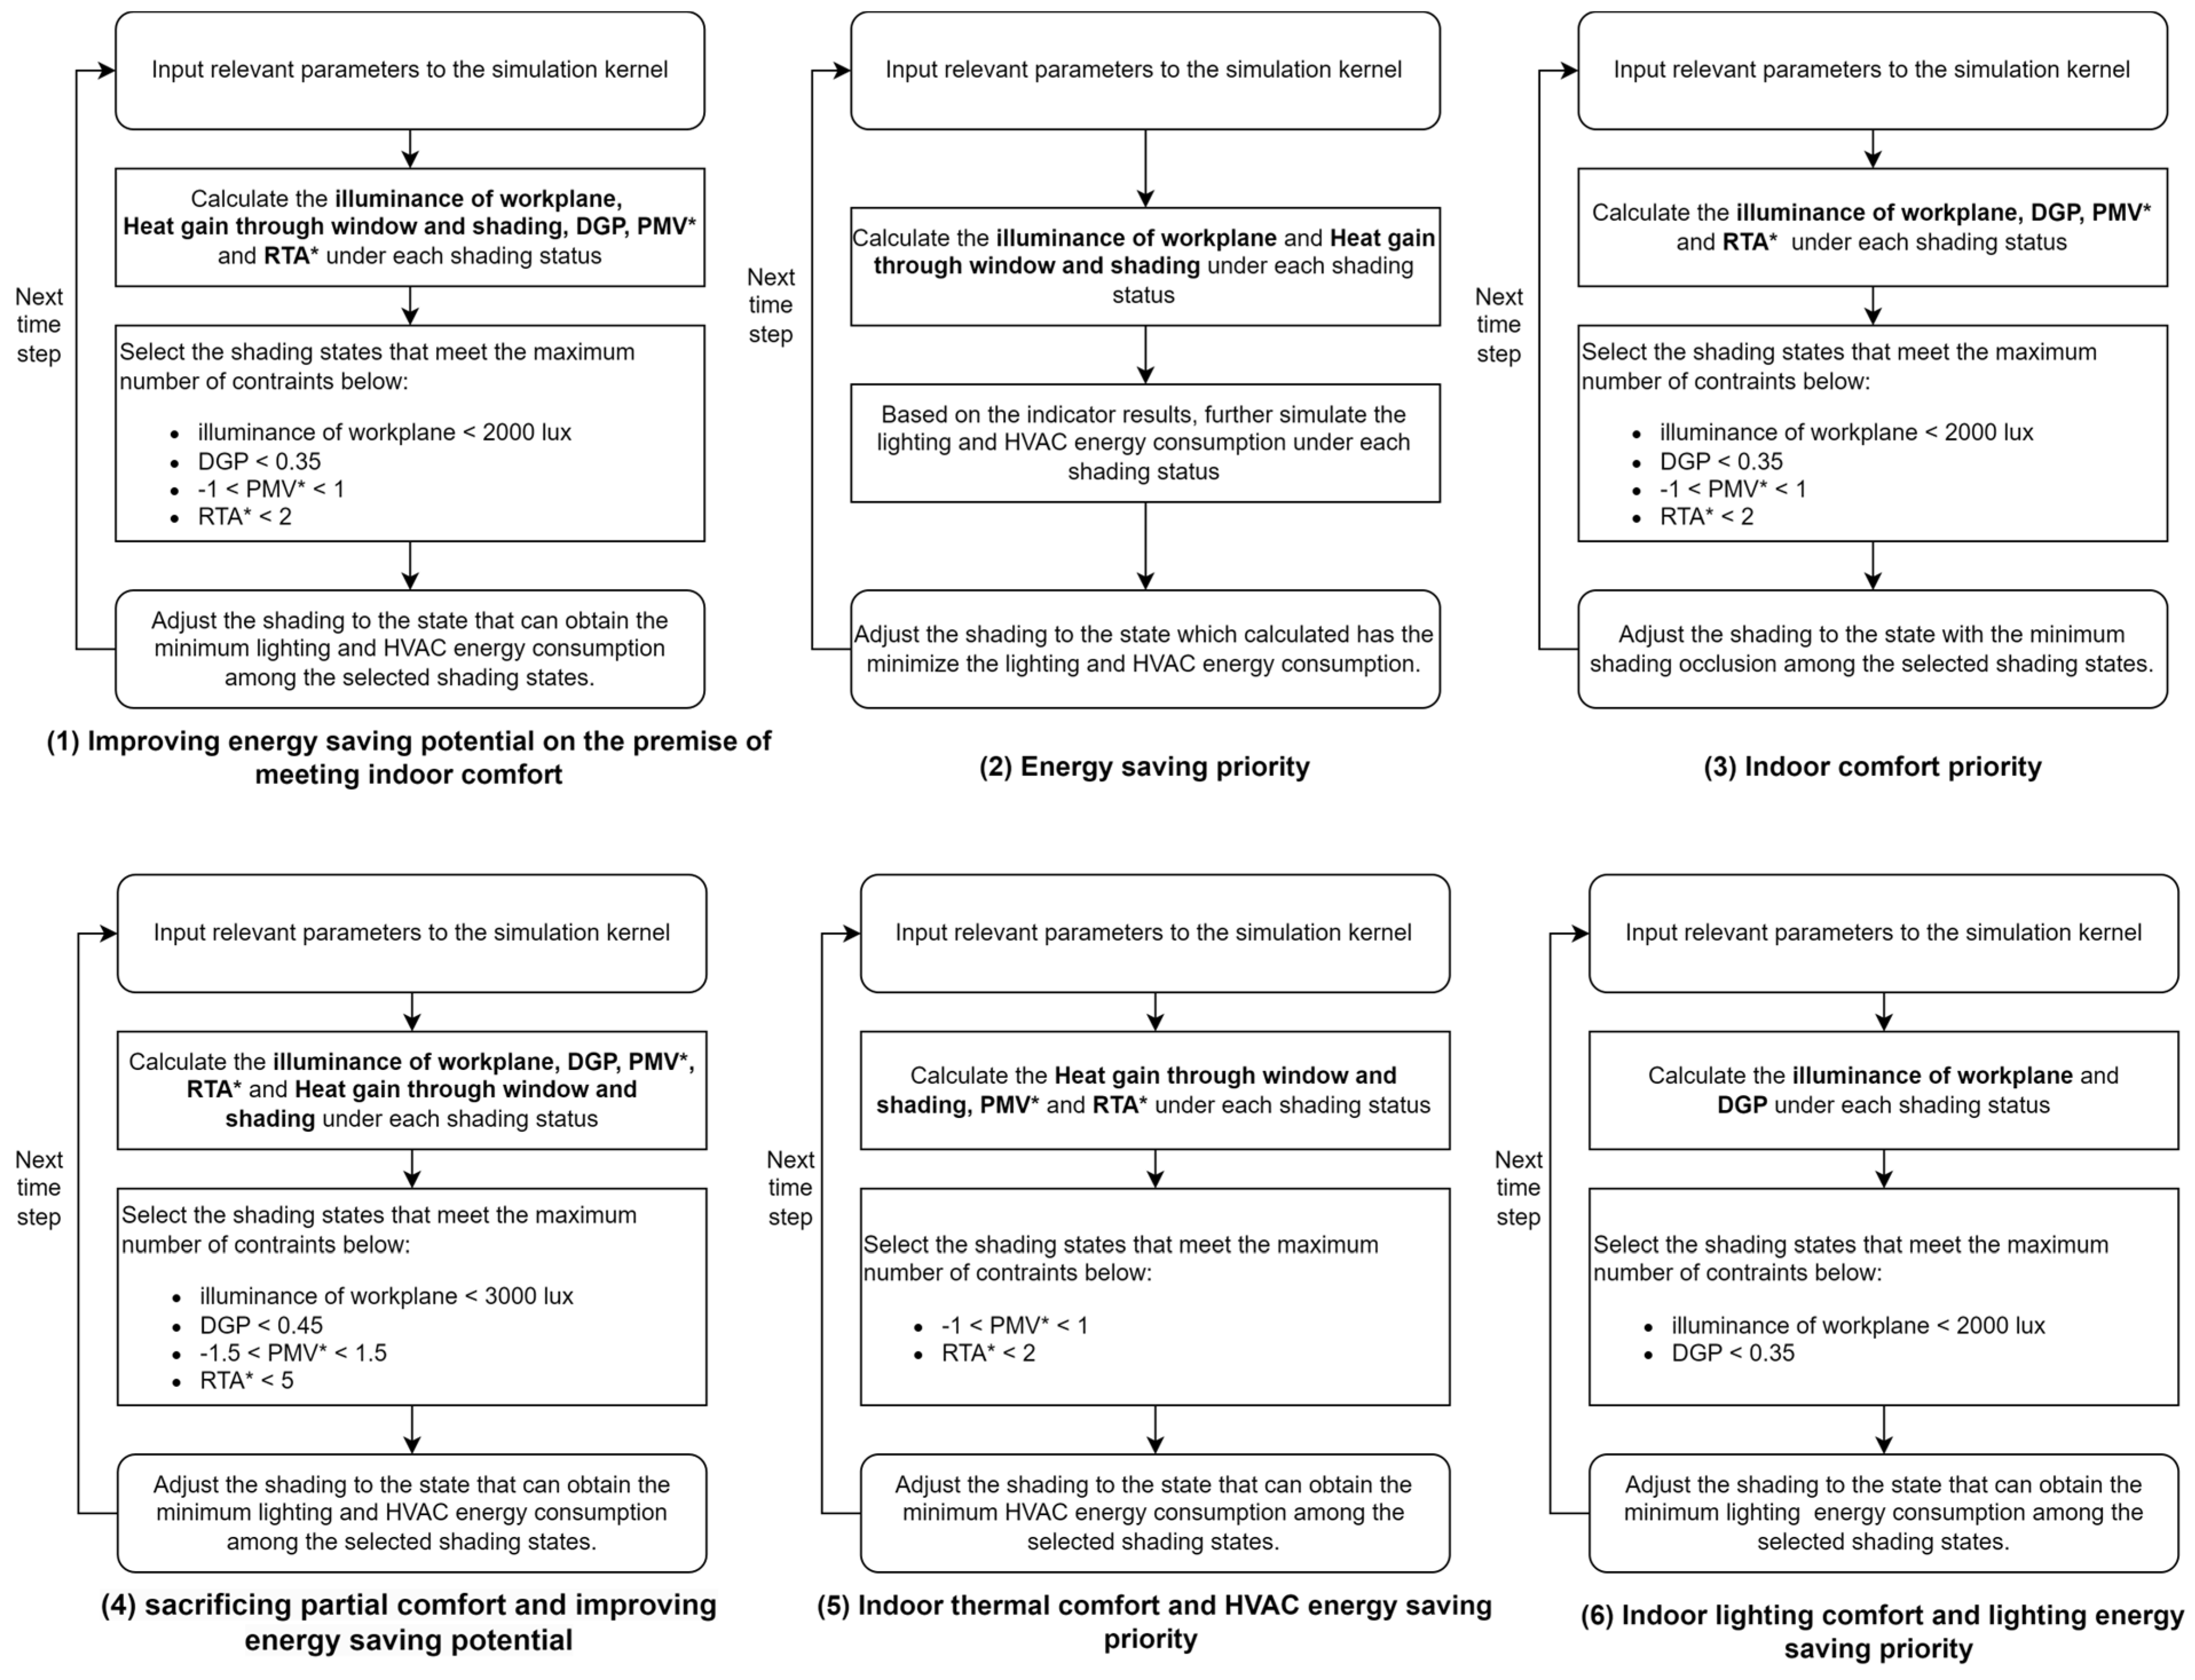
According to the performance indices of the shading operation shown in Figure 4, to achieve the two objectives of energy saving and occupant comfort based on the concept of threshold control, six typical control strategies are proposed in this study, as shown in Figure 5. The constraint conditions of each control strategy were defined according to the different control objectives, and the shading state that met the most constraint conditions was first screened out. If multiple states can satisfy the maximum number of constraints simultaneously, the corresponding objective function is used for the second round of screening to select the optimal shading state and adjust to it.

5.2. Case Description

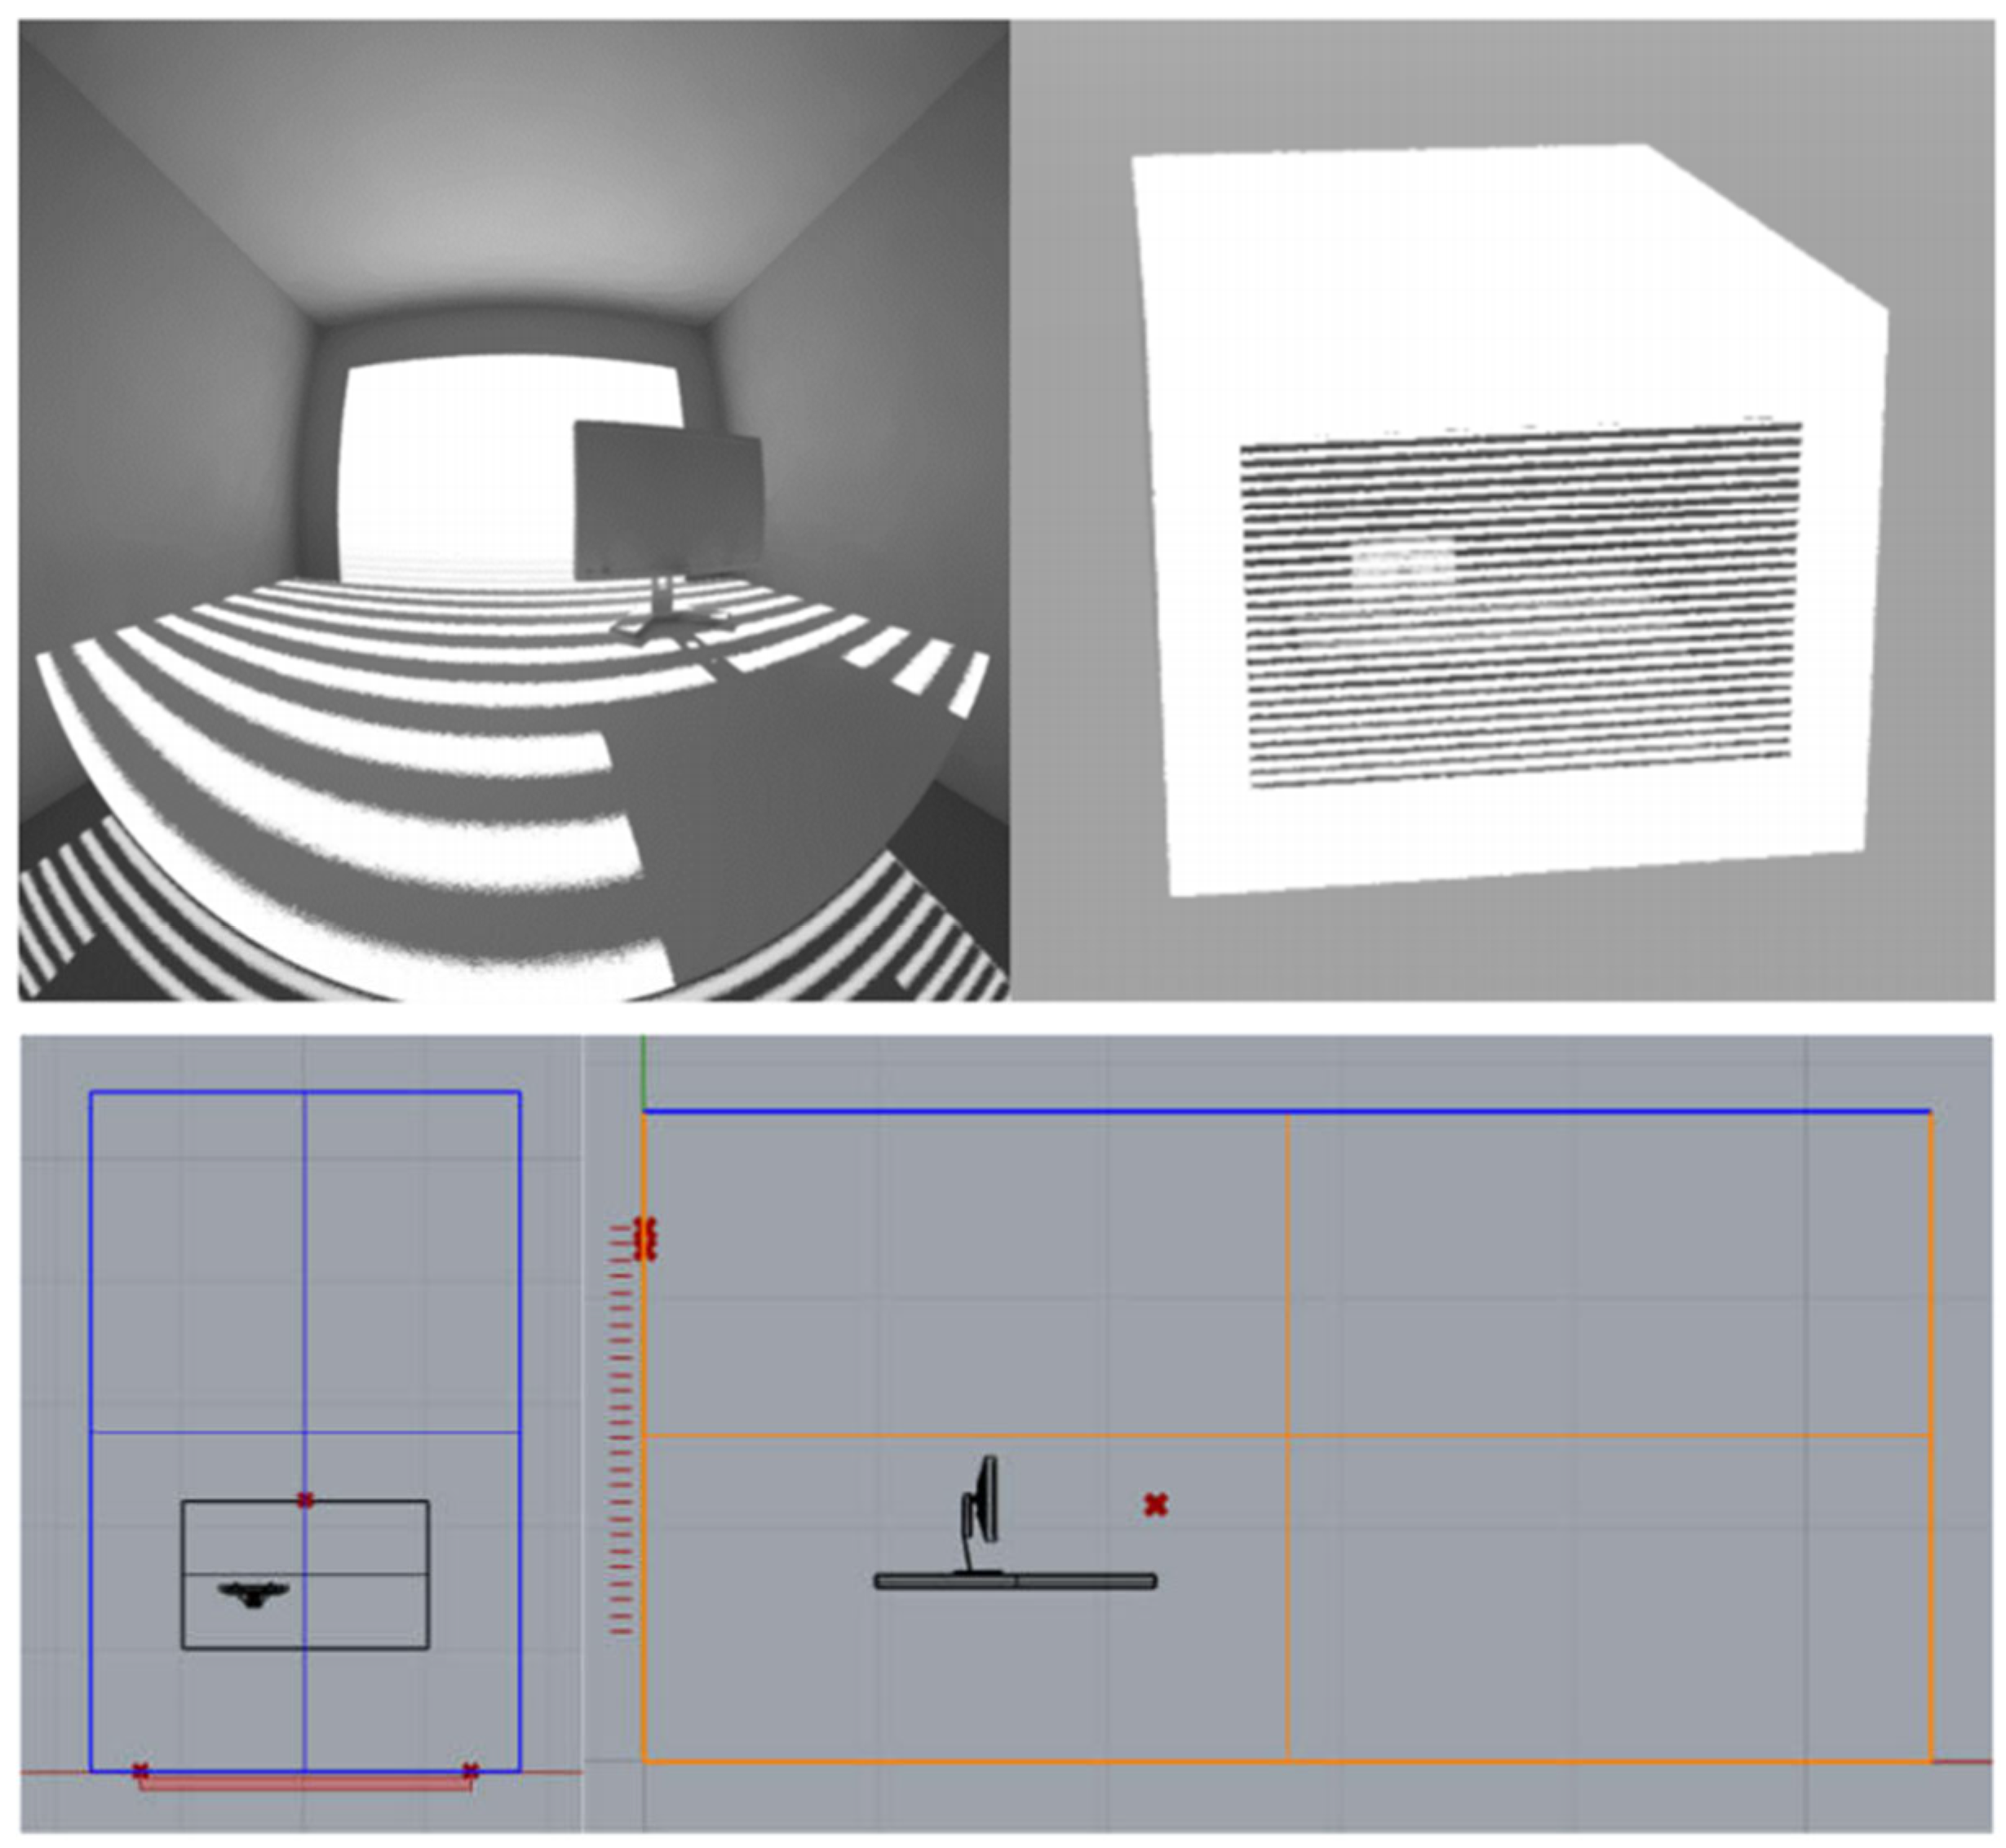
Case 1 was conducted in Seoul, Republic of Korea. The window of the room faced south and its layout is shown in Figure 6. The occupant was 1 m near the window, and was positioned facing the window. The specific parameter settings are listed in Table 4.
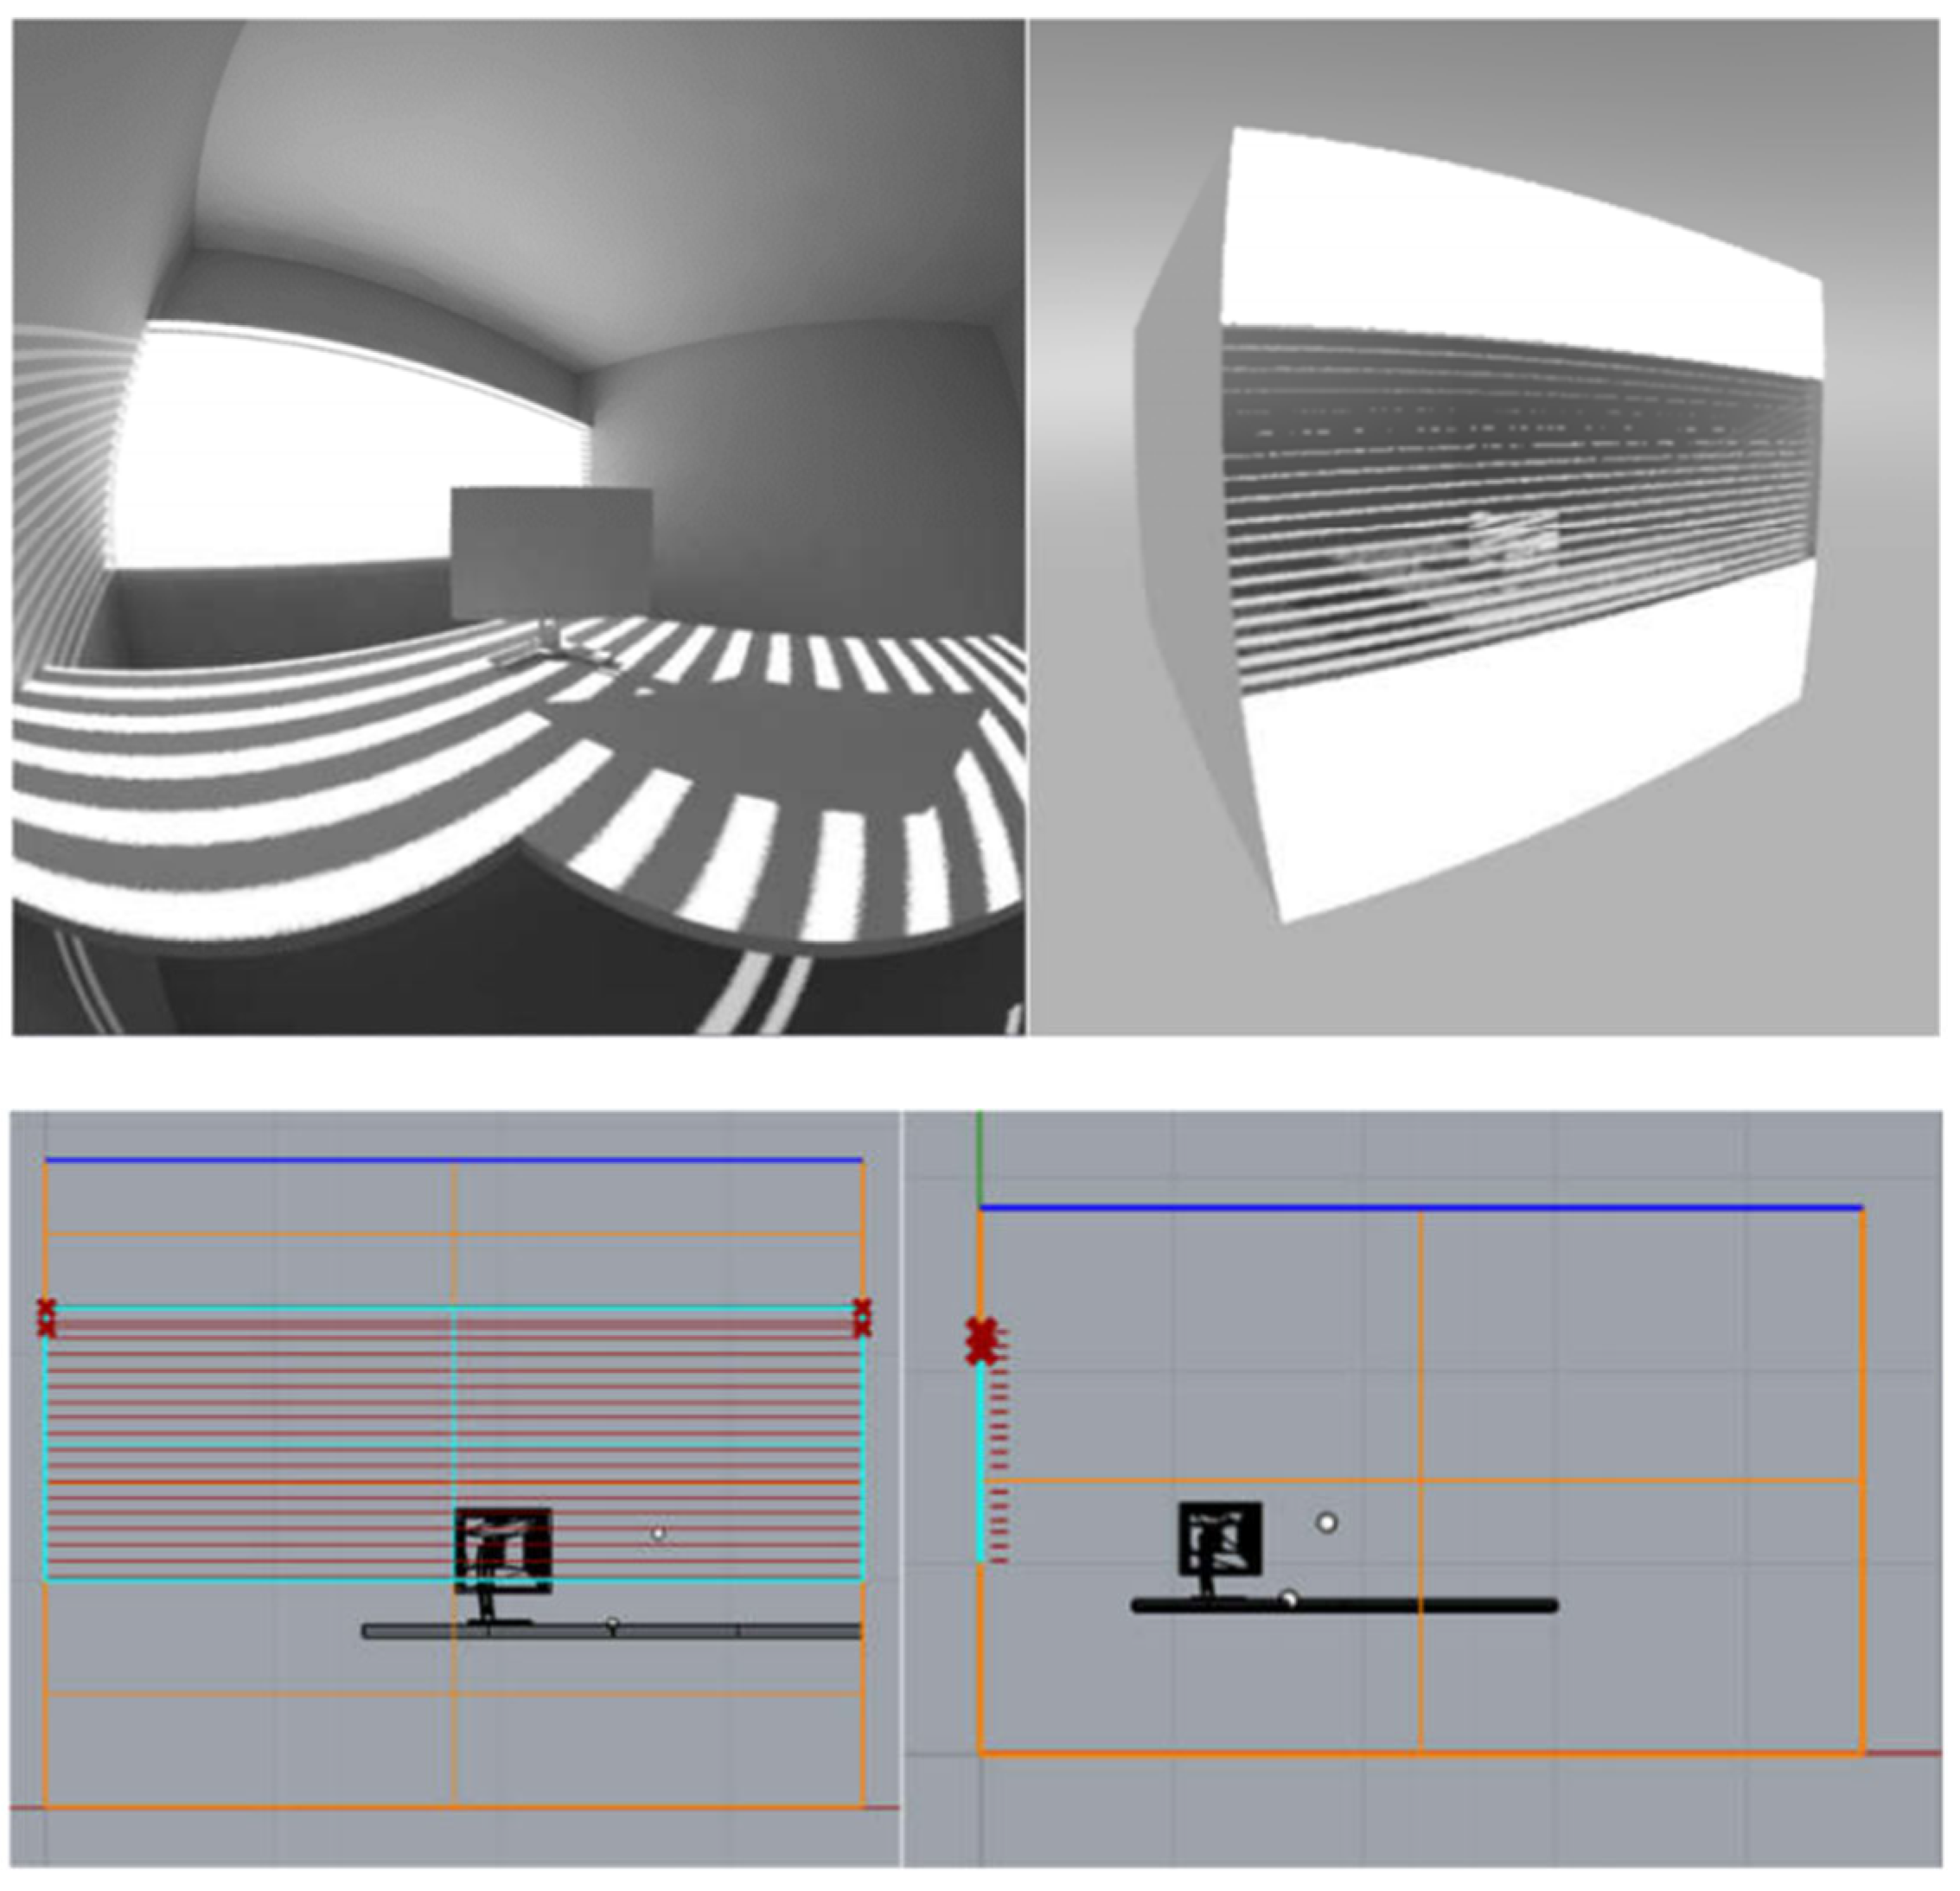
Case 2 was conducted at Freiburg, Germany. The window of the room faced east and its layout is shown in Figure 7. The occupant was 1.6 m close to the window, facing it at an angle of 45° with the normal direction of the window. The specific parameter settings are listed in Table 5.

5.3. Results and Discussion

The annual simulation results of the six performance indices in Cases 1 and 2 are shown in box charts, which can show the overall results of various performance indices under different control strategies, as shown in Figure 8. The conclusions are summarized as follows:
  • Because of the direct control effect of index-based operation logic, the control strategies generally have a relatively good effect according to the control objectives. For example, in the control strategy focusing on energy saving (Strategy 2), the heat gain through windows in winter is much higher than that of other control strategies, but in the comfort level (DGP, RTA*, etc.), the performance is poor. A control strategy that focuses on comfort has the opposite effect. However, in Strategy 4, the heat gain through the windows in summer was higher than that in Strategy 1. This is because the lighting consumption in Strategy 4 is lower than that in Strategy 1, which leads to the total energy in Strategy 4 being lower than that in Strategy 1. This phenomenon can be observed from the time dimension.
  • However, in some situations, the indices exceed the constraint conditions. For example, RTA* exceeded the threshold in Strategy 3, which aimed to achieve comprehensive thermal and visual comfort. This shows that in some cases, regardless of the state of shading, requirements of radiant thermal comfort cannot be met. This phenomenon can be further analyzed from the time dimension.
  • Compared with other control strategies, Strategy 2 has more outliers in the results of performance indices related to comfort, such as DGP, RTA*, PMV* and illuminance on the work plane. The illuminance on the work plane is also related to the lighting energy consumption, which is a performance index related to comfort and energy savings simultaneously. This shows that a strategy that considers only energy savings will result in more frequent uncomfortable situations.
  • The thermal comfort under strategy 6 is quite similar to strategy 5, while strategy 6 only consider lighting comfort and lighting energy saving, and strategy 5 only consider thermal comfort and HVAC energy saving. Therefore, when taking in to account lighting comfort and lighting energy saving, thermal comfort indices can not be considered in the control strategy.
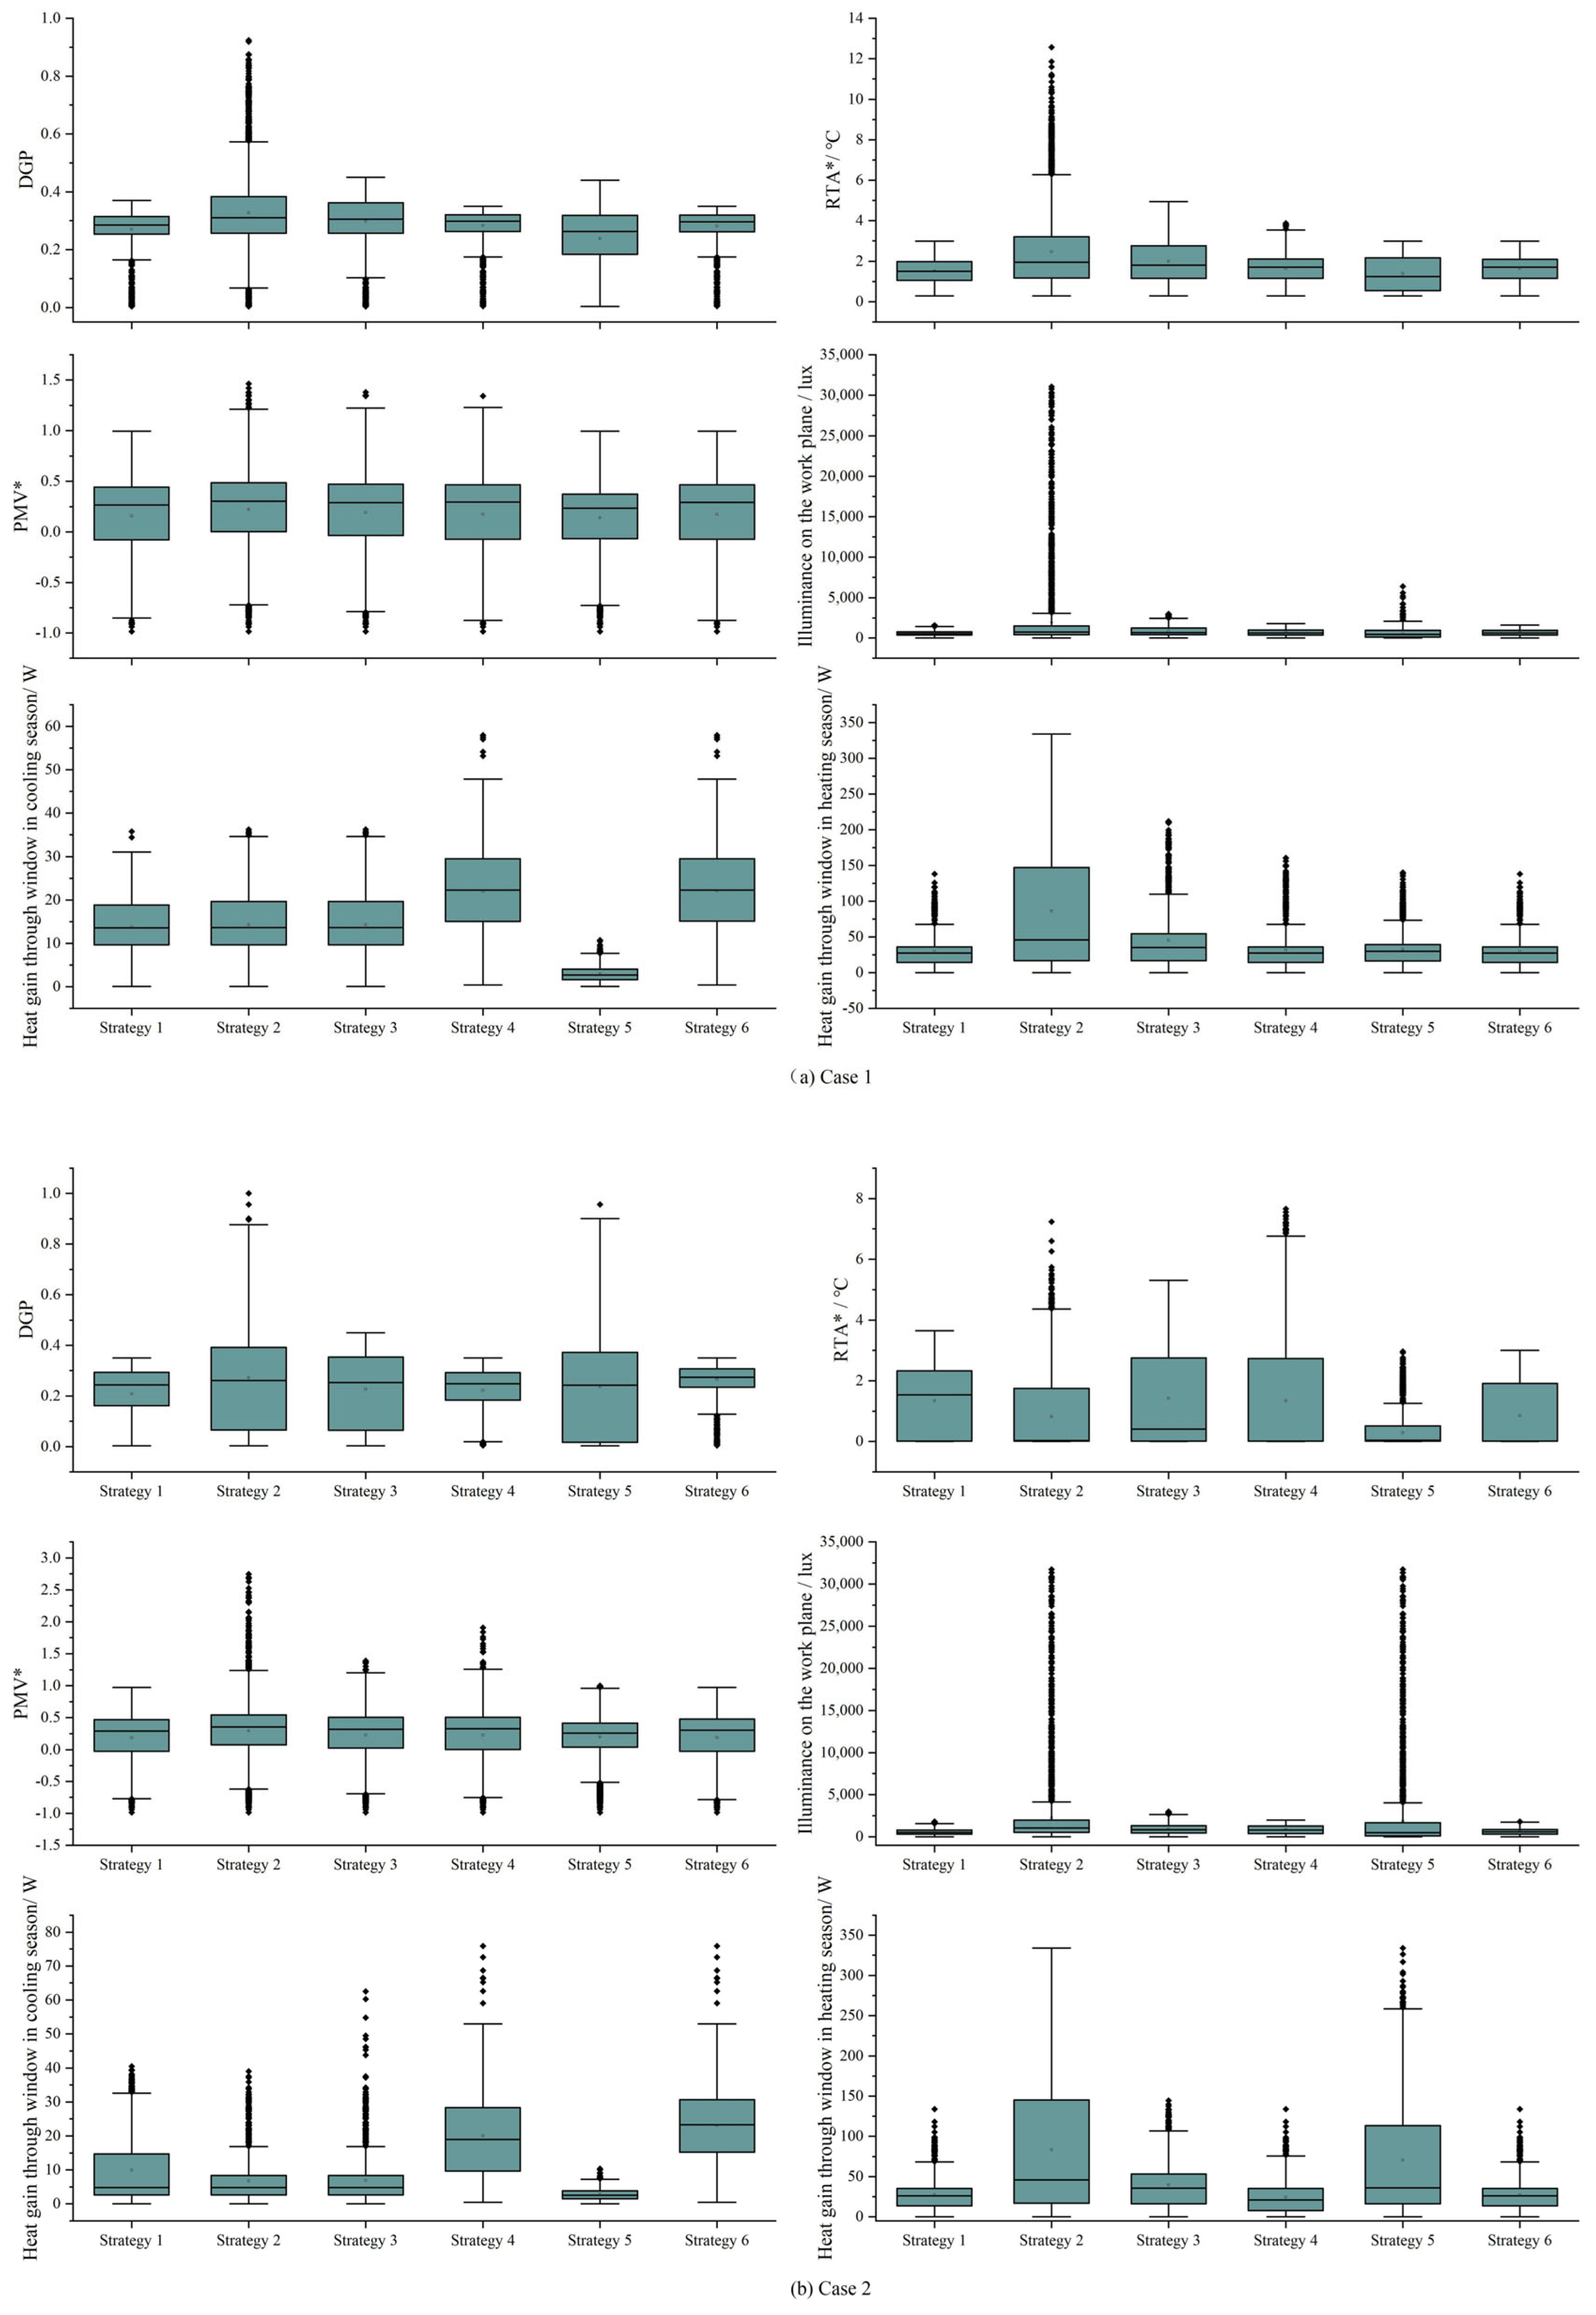
Figure 8. Box chart of six indices in case 1 (a) and case 2 (b).
Buildings 12 02043 g008
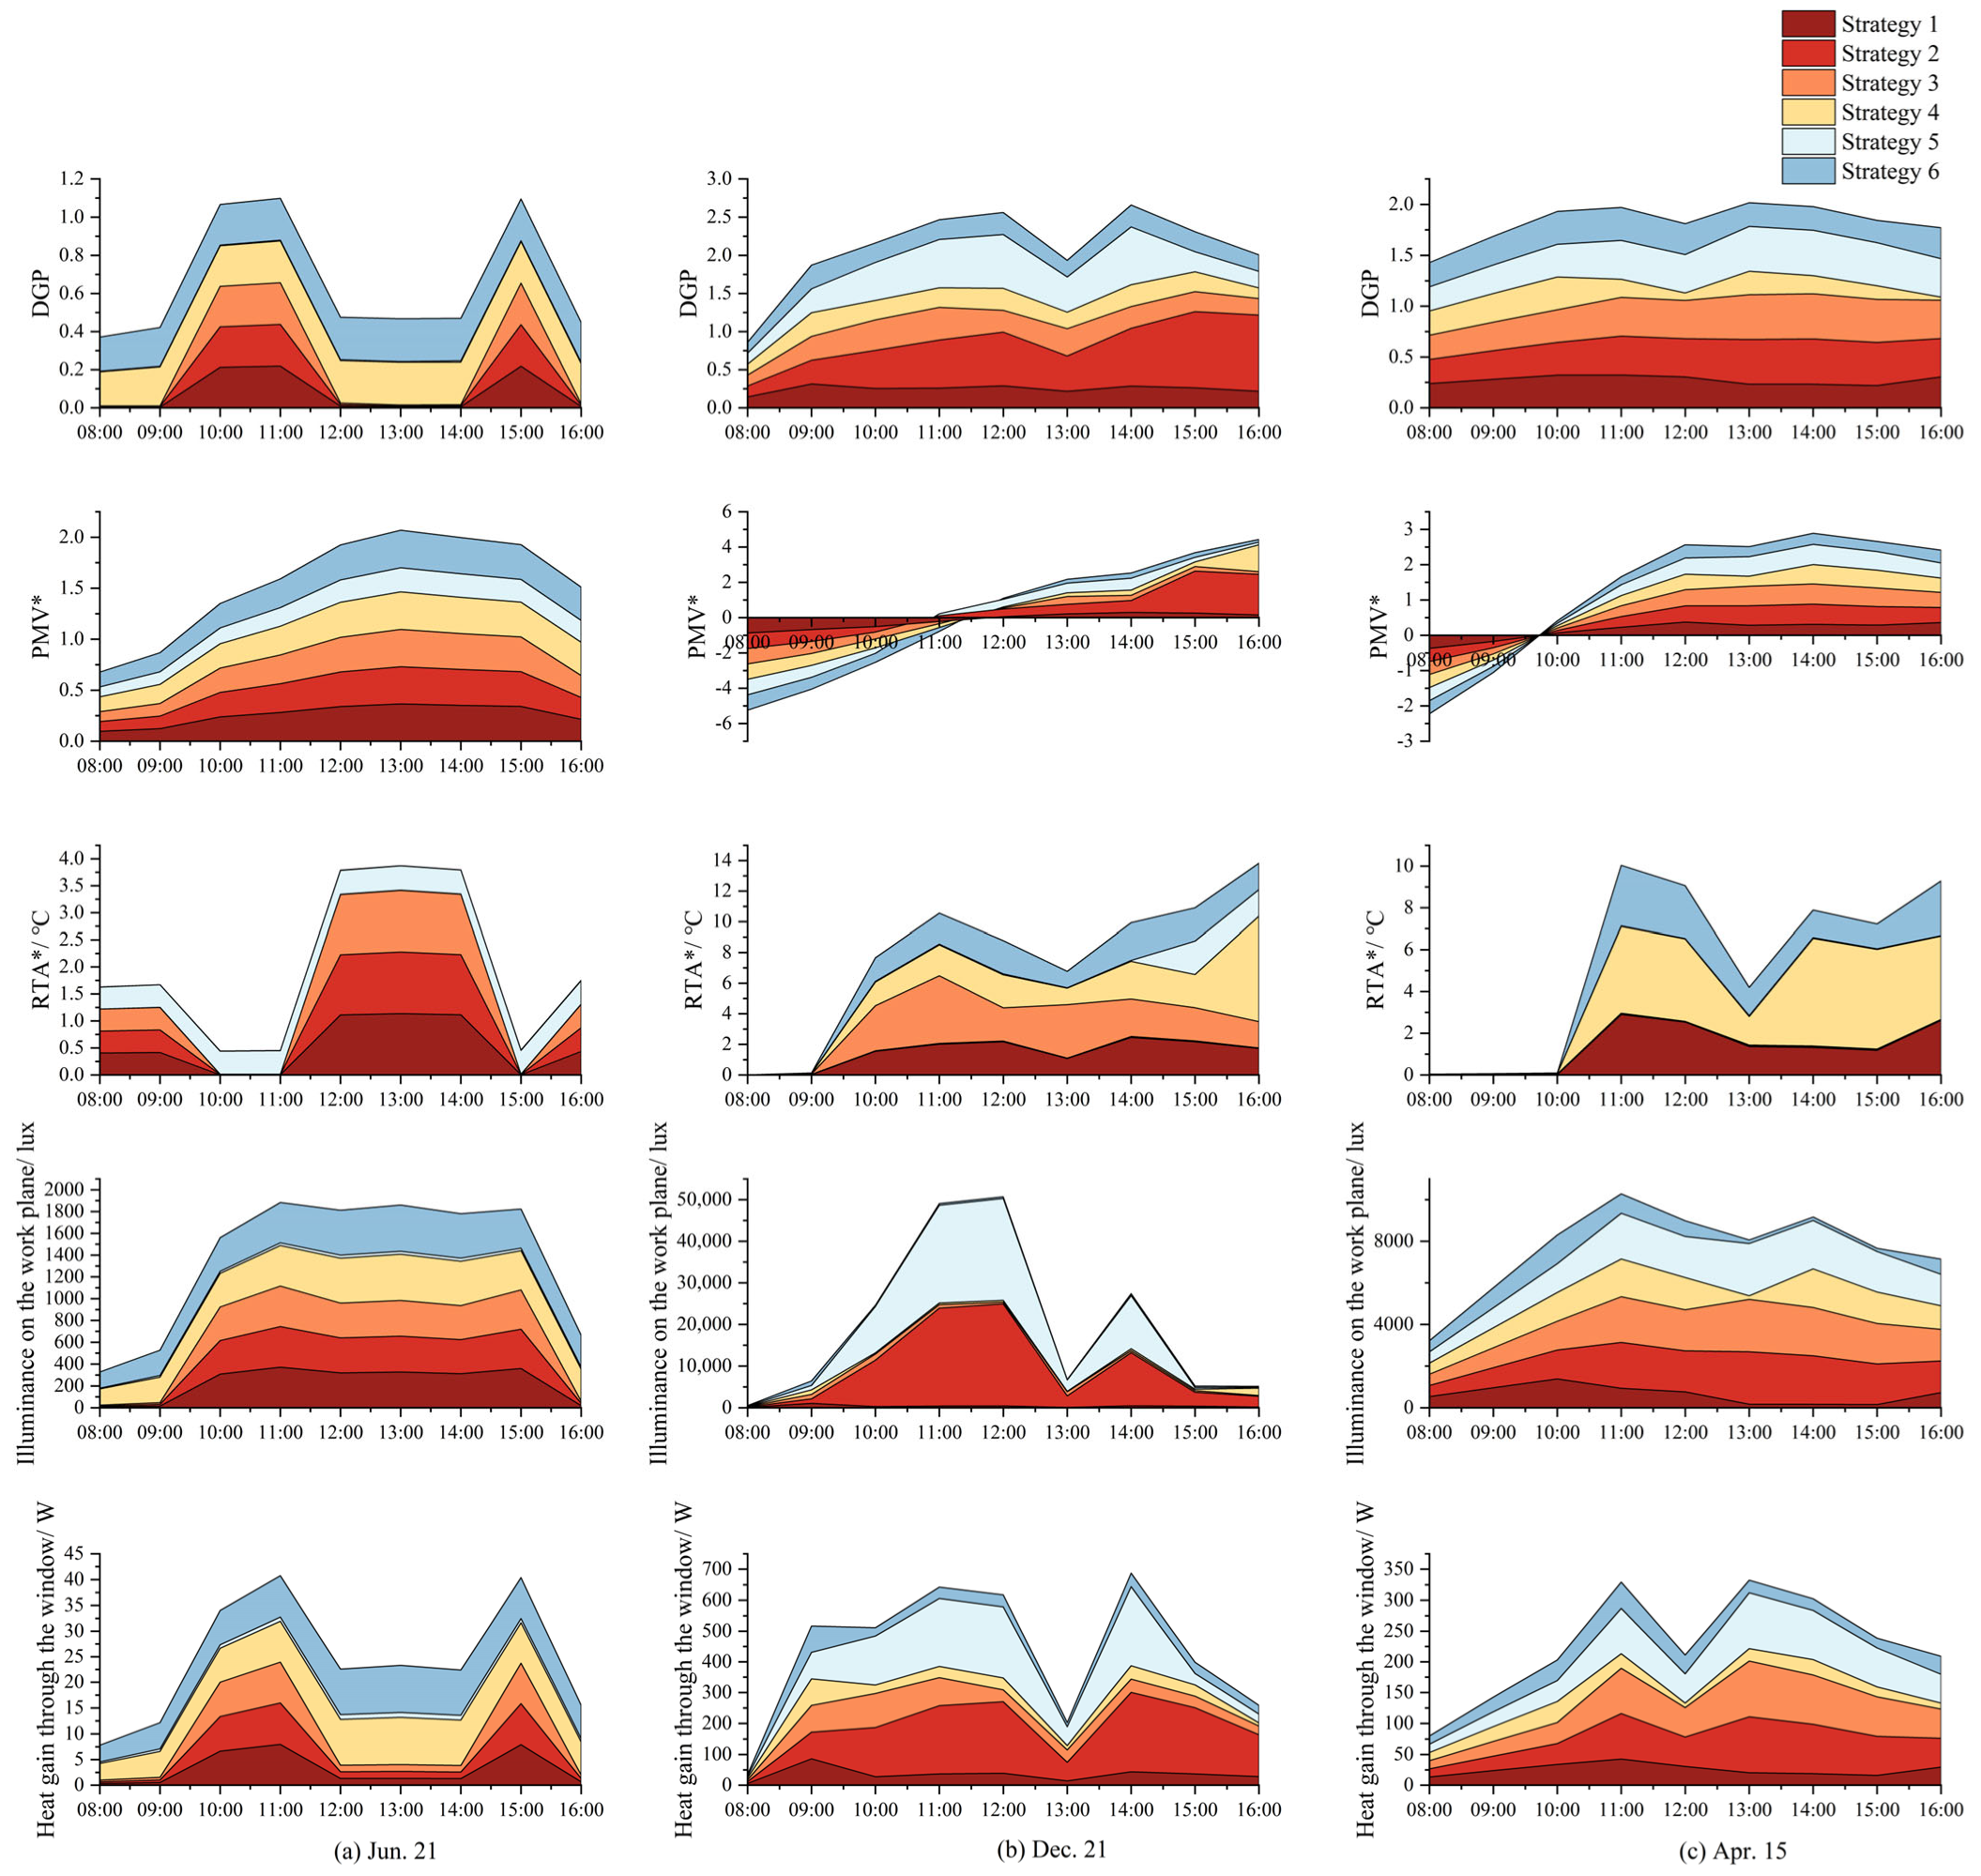
The accumulation chart presents the results of various performance indices under different control strategies in the time dimension. In this study, three typical days were selected for the cooling (summer), heating (winter) and transition seasons, as shown in Figure 9 and Figure 10. From them,
  • Seasonal variations in solar radiation exist because of dynamic changes in the solar altitude and azimuth angles, which are also reflected in the variation trends of the performance indices. Each performance index exhibits a different trend on different days. In addition, from the time dimension, all types of index-based control strategies generally have relatively good effects according to their objectives.
  • Compared with the other control strategies, the variation trends of the performance indices of Strategy 2 are different. Strategy 4, that is, sacrificing part of the comfort to achieve better energy savings, is similar to other control strategies that significantly consider comfort only. Combined with the box chart results, this further indicates that a control strategy solely considering energy savings may not be necessary, and a moderate sacrifice of comfort may not cause excessive aversion. This conclusion needs to be proven through more in-depth subjective and objective tests.
  • Combined with the analysis of the box charts, the accumulation charts show that RTA* exceeded the threshold under Strategy 3 on a typical winter day, which mirrors the problem of the strategy found through the box charts. However, in the same period, the DGP performed well under Strategy 3. This further reflects the contradiction between visual comfort and thermal comfort, which involves seasonal changes. Further analysis shows that if we want to achieve comprehensive thermal comfort, relying on a single BECS may not be able to resolve this contradiction, and coupling control with other BECSs is needed, such as the coupling of an air conditioning system and shading system.
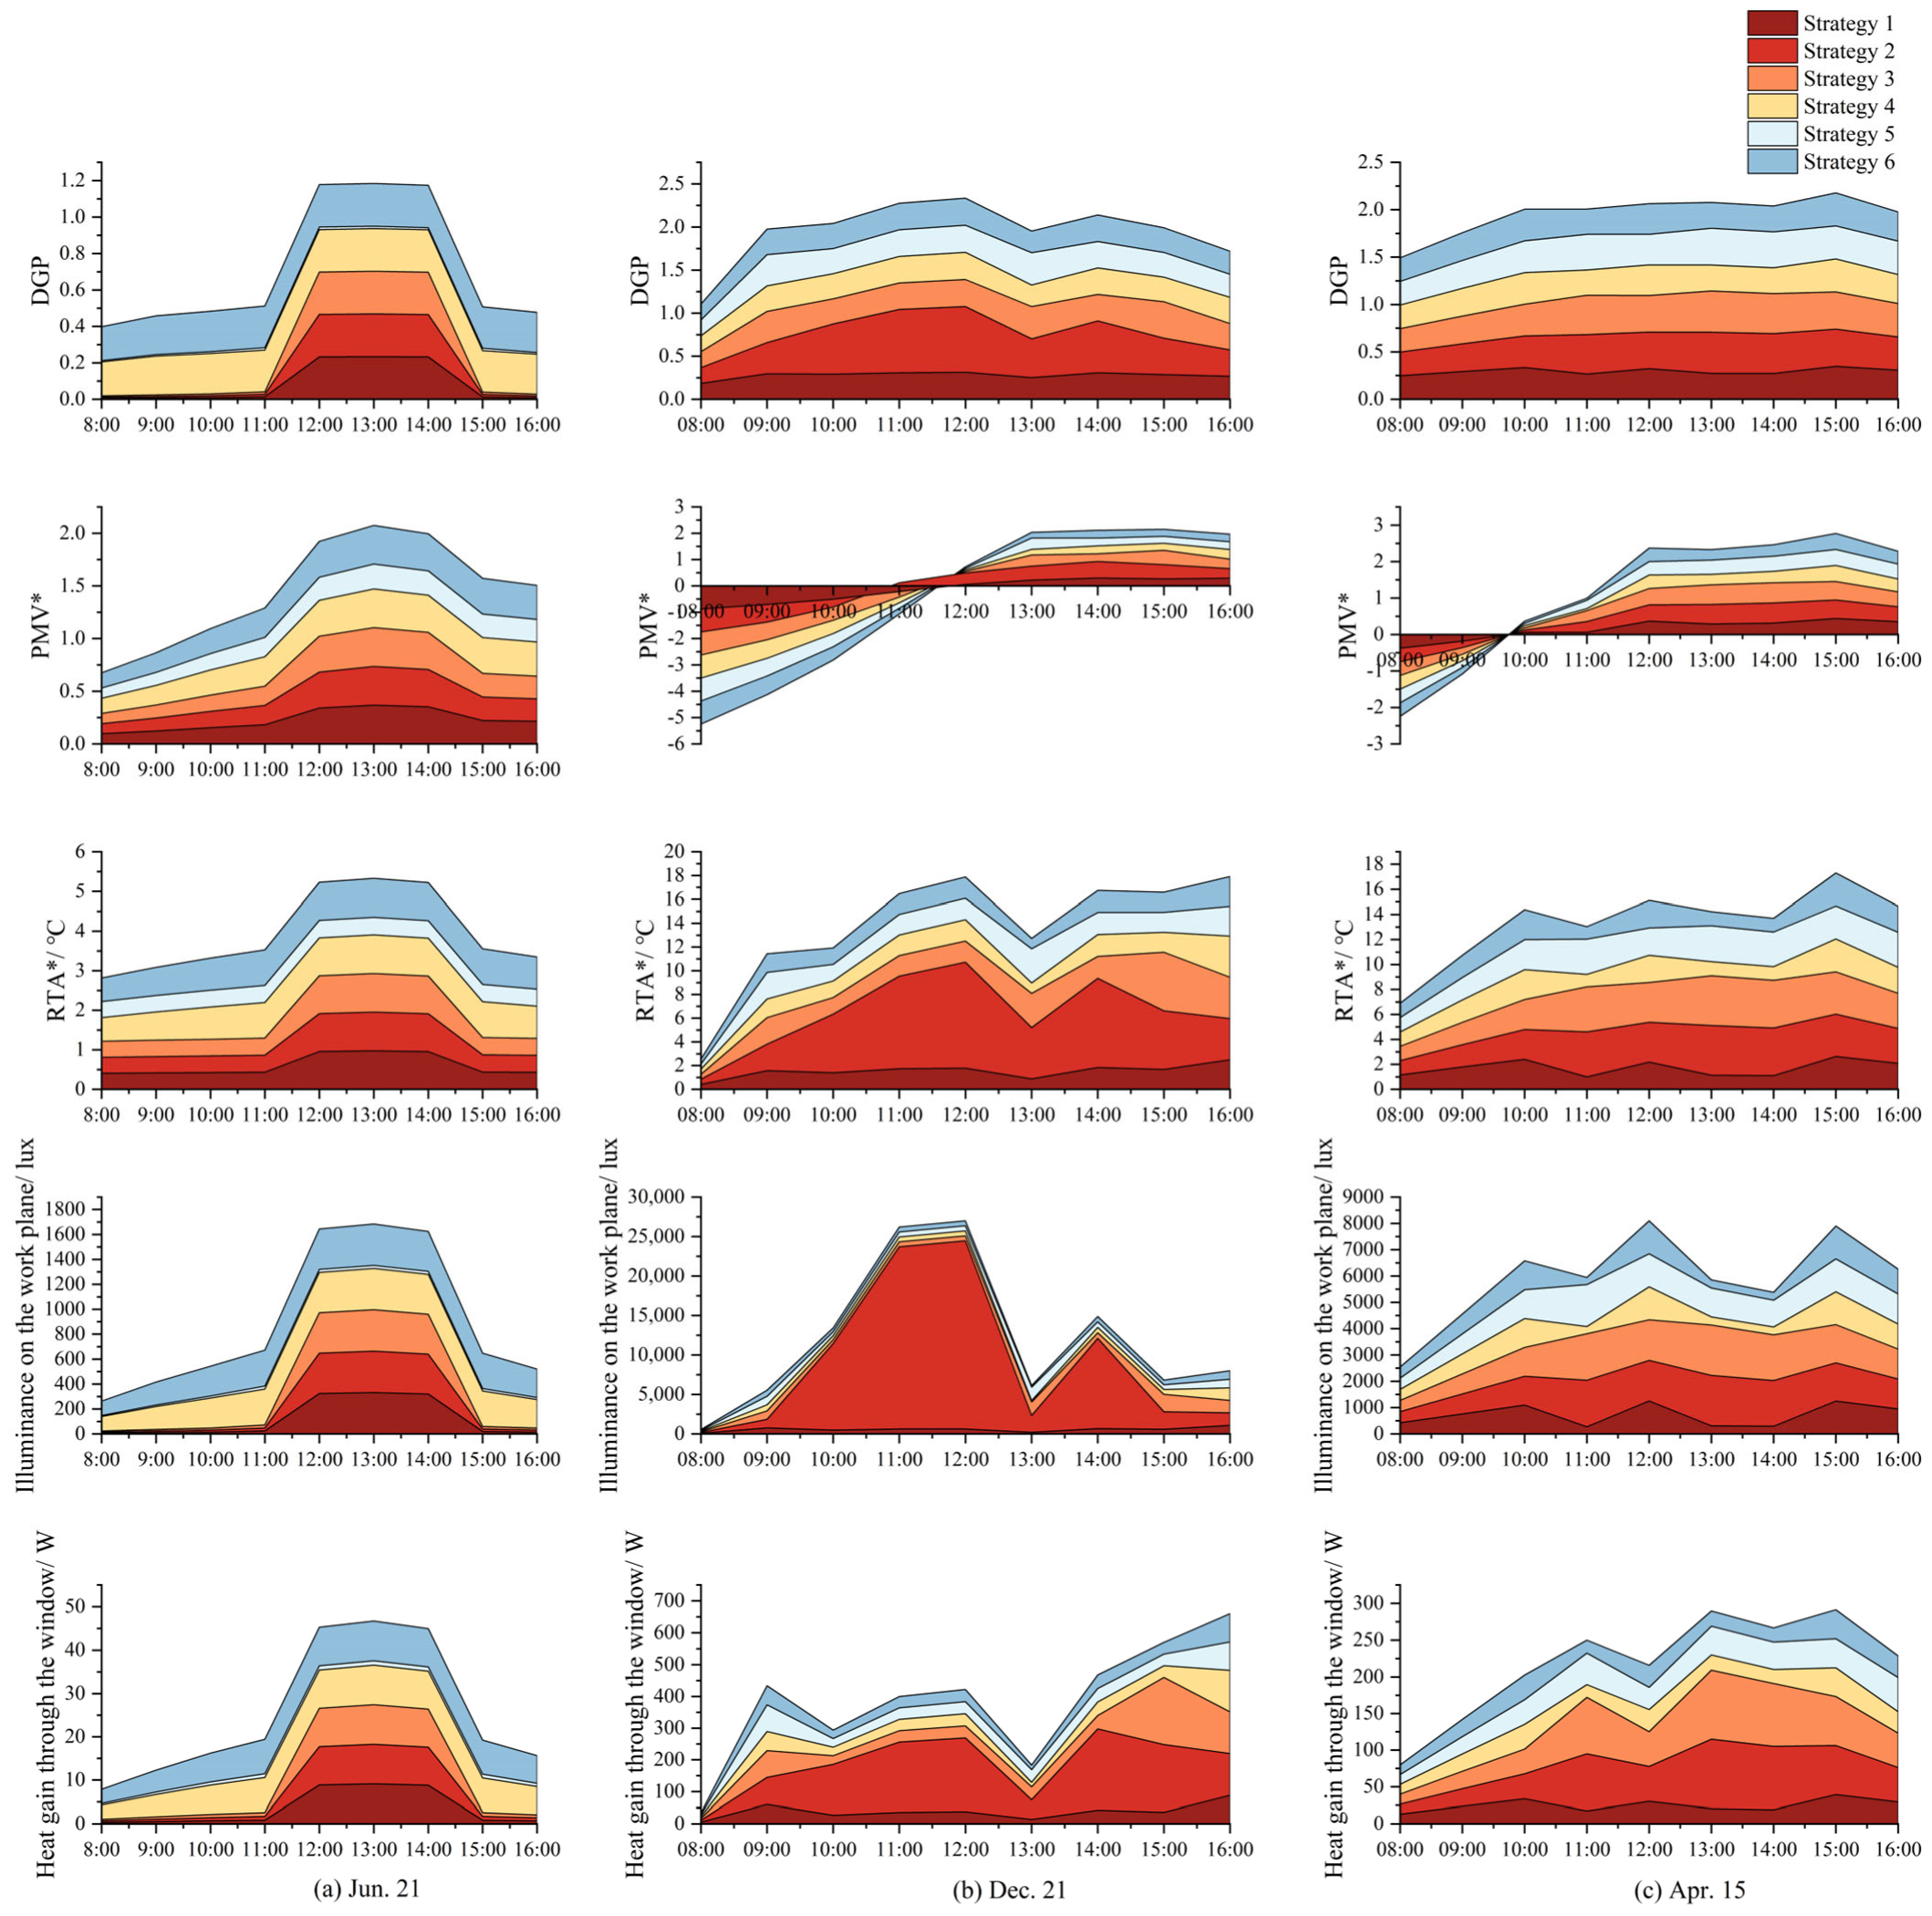
Figure 9. Index accumulation chart of three typical days in case 1.
Buildings 12 02043 g009
Figure 10. Index accumulation chart of three typical days in case 2.
Buildings 12 02043 g010
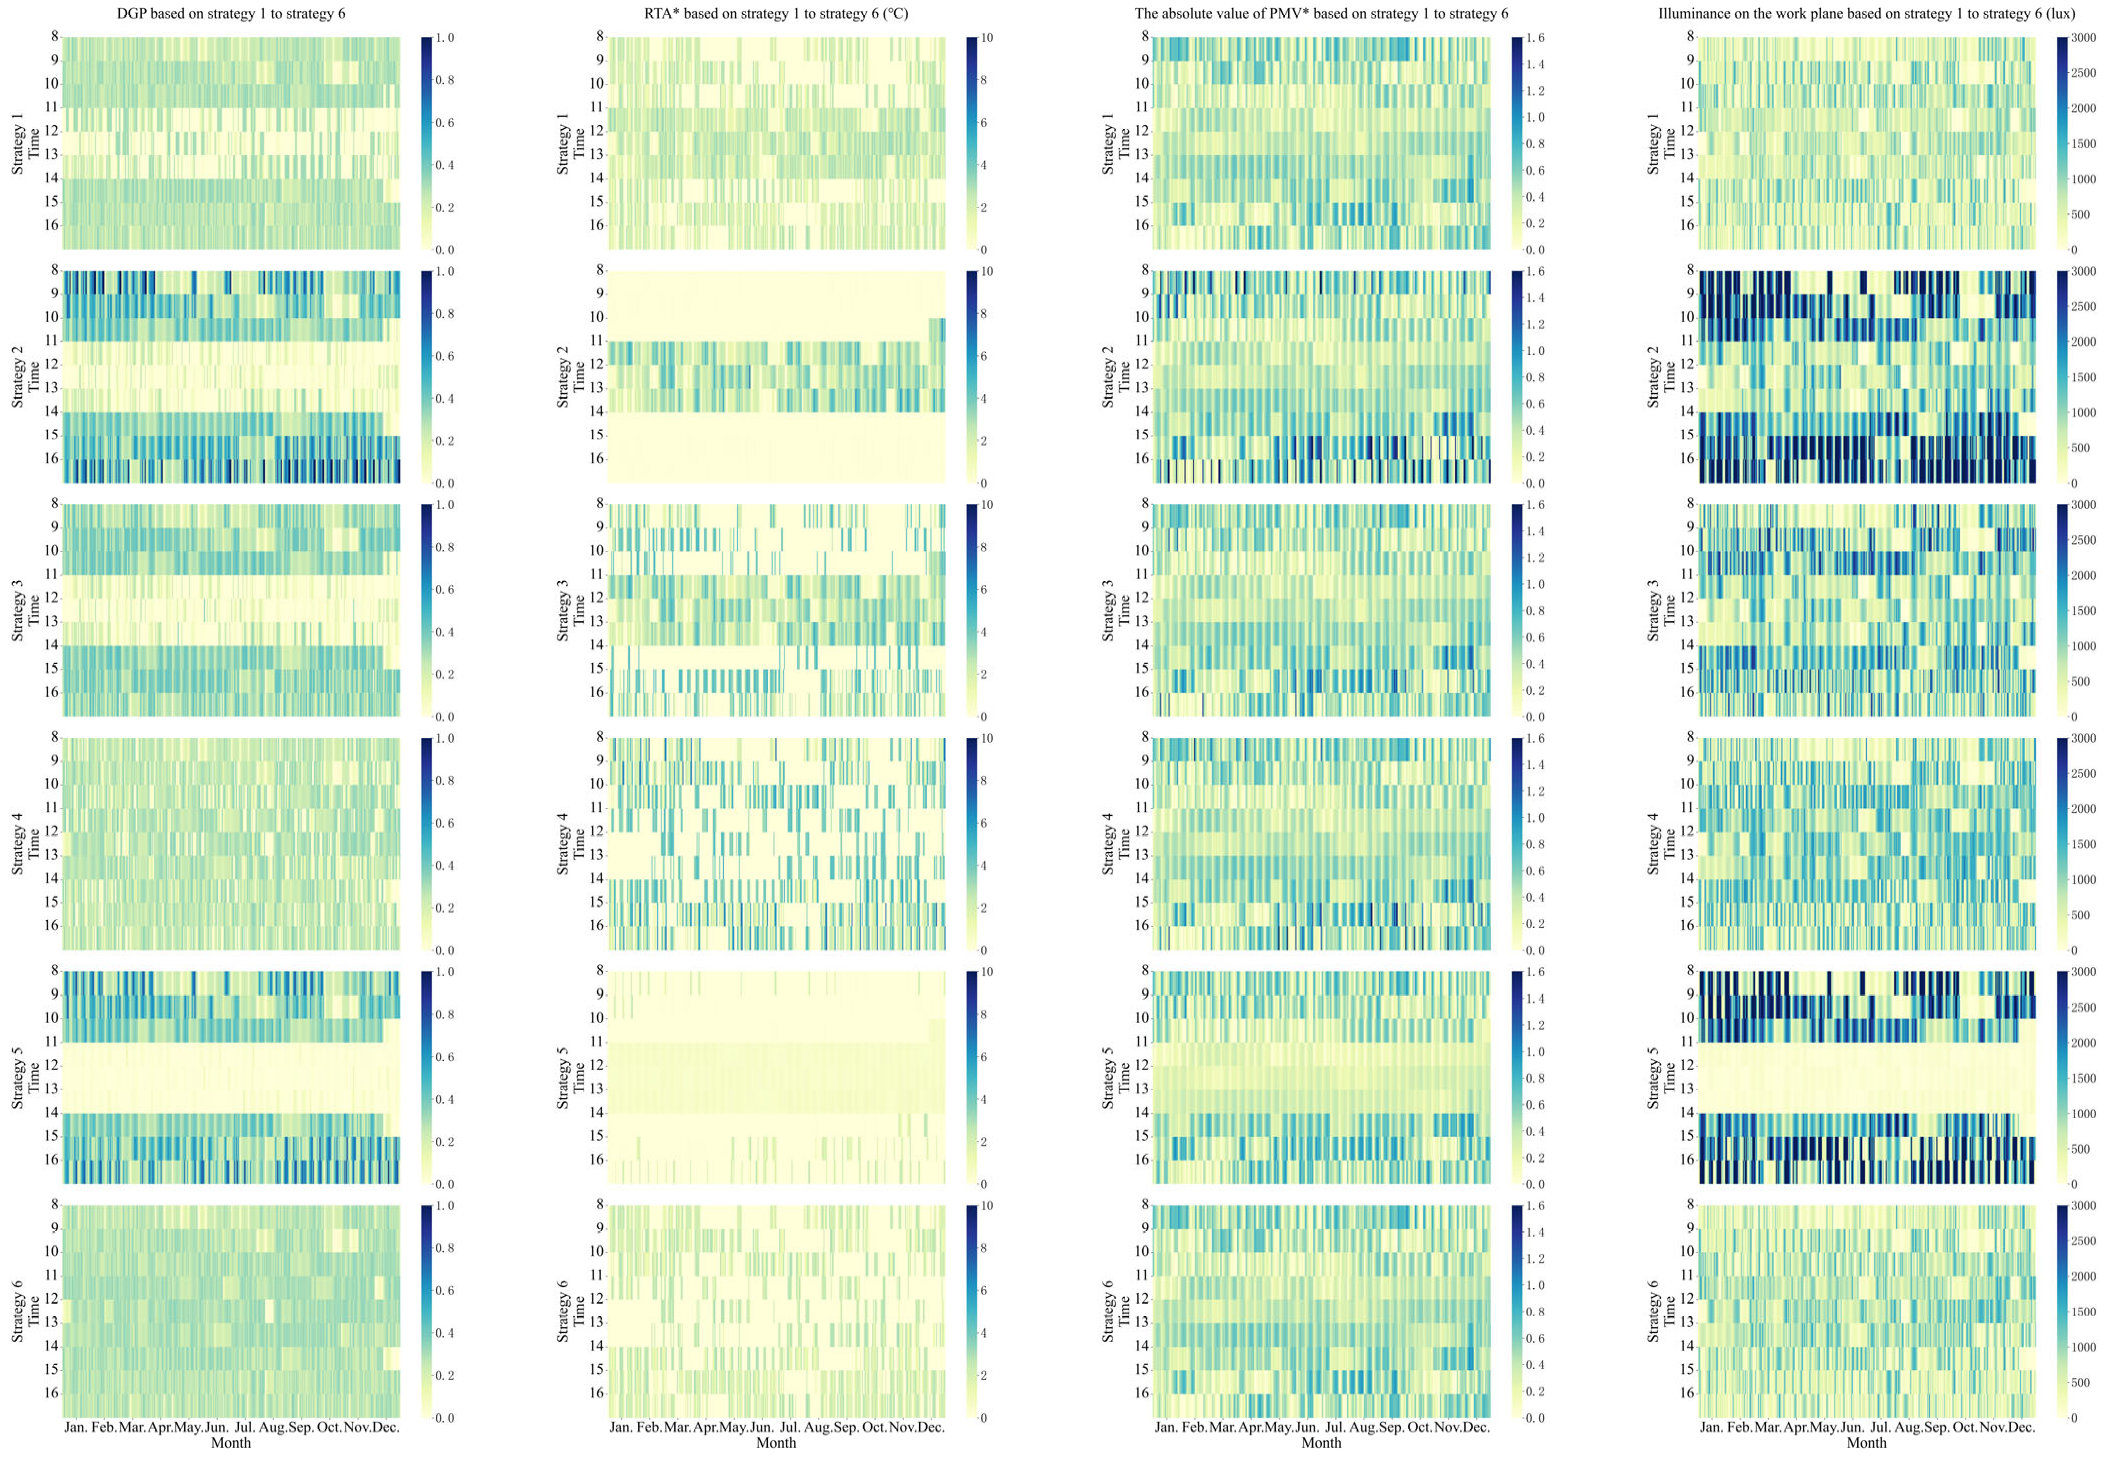
Figure 11 and Figure 12 show the overall performance of each performance index for the entire year under the different control strategies. The summary and analysis are as follows.
  • Overall, index−based control strategies have clear directional effects according to their different objectives.
  • Internal and external shading forms were adopted in these two cases. Combined with the directional effects, the index−based control strategy can be considered insensitive to changes in boundary conditions in different cases. The control effect is not affected by personalized factors such as the layout of the target room or the form of the shading system. Control system configurations in engineering applications can reduce implementation costs.
  • Simultaneously, the contradiction between comfort and energy savings, as well as that between visual comfort and radiant thermal comfort, can be reflected in box charts, accumulation charts and heat maps. Considering the entire year, a control strategy that examines overall thermal and visual comfort cannot achieve better results. Further analysis can conclude that different control objectives exist, even if they are contradictory. They can be included in the consideration of the personalized preferences and needs of the target room in order to determine the focus of the objectives, and then achieve the control objectives to the maximum extent.
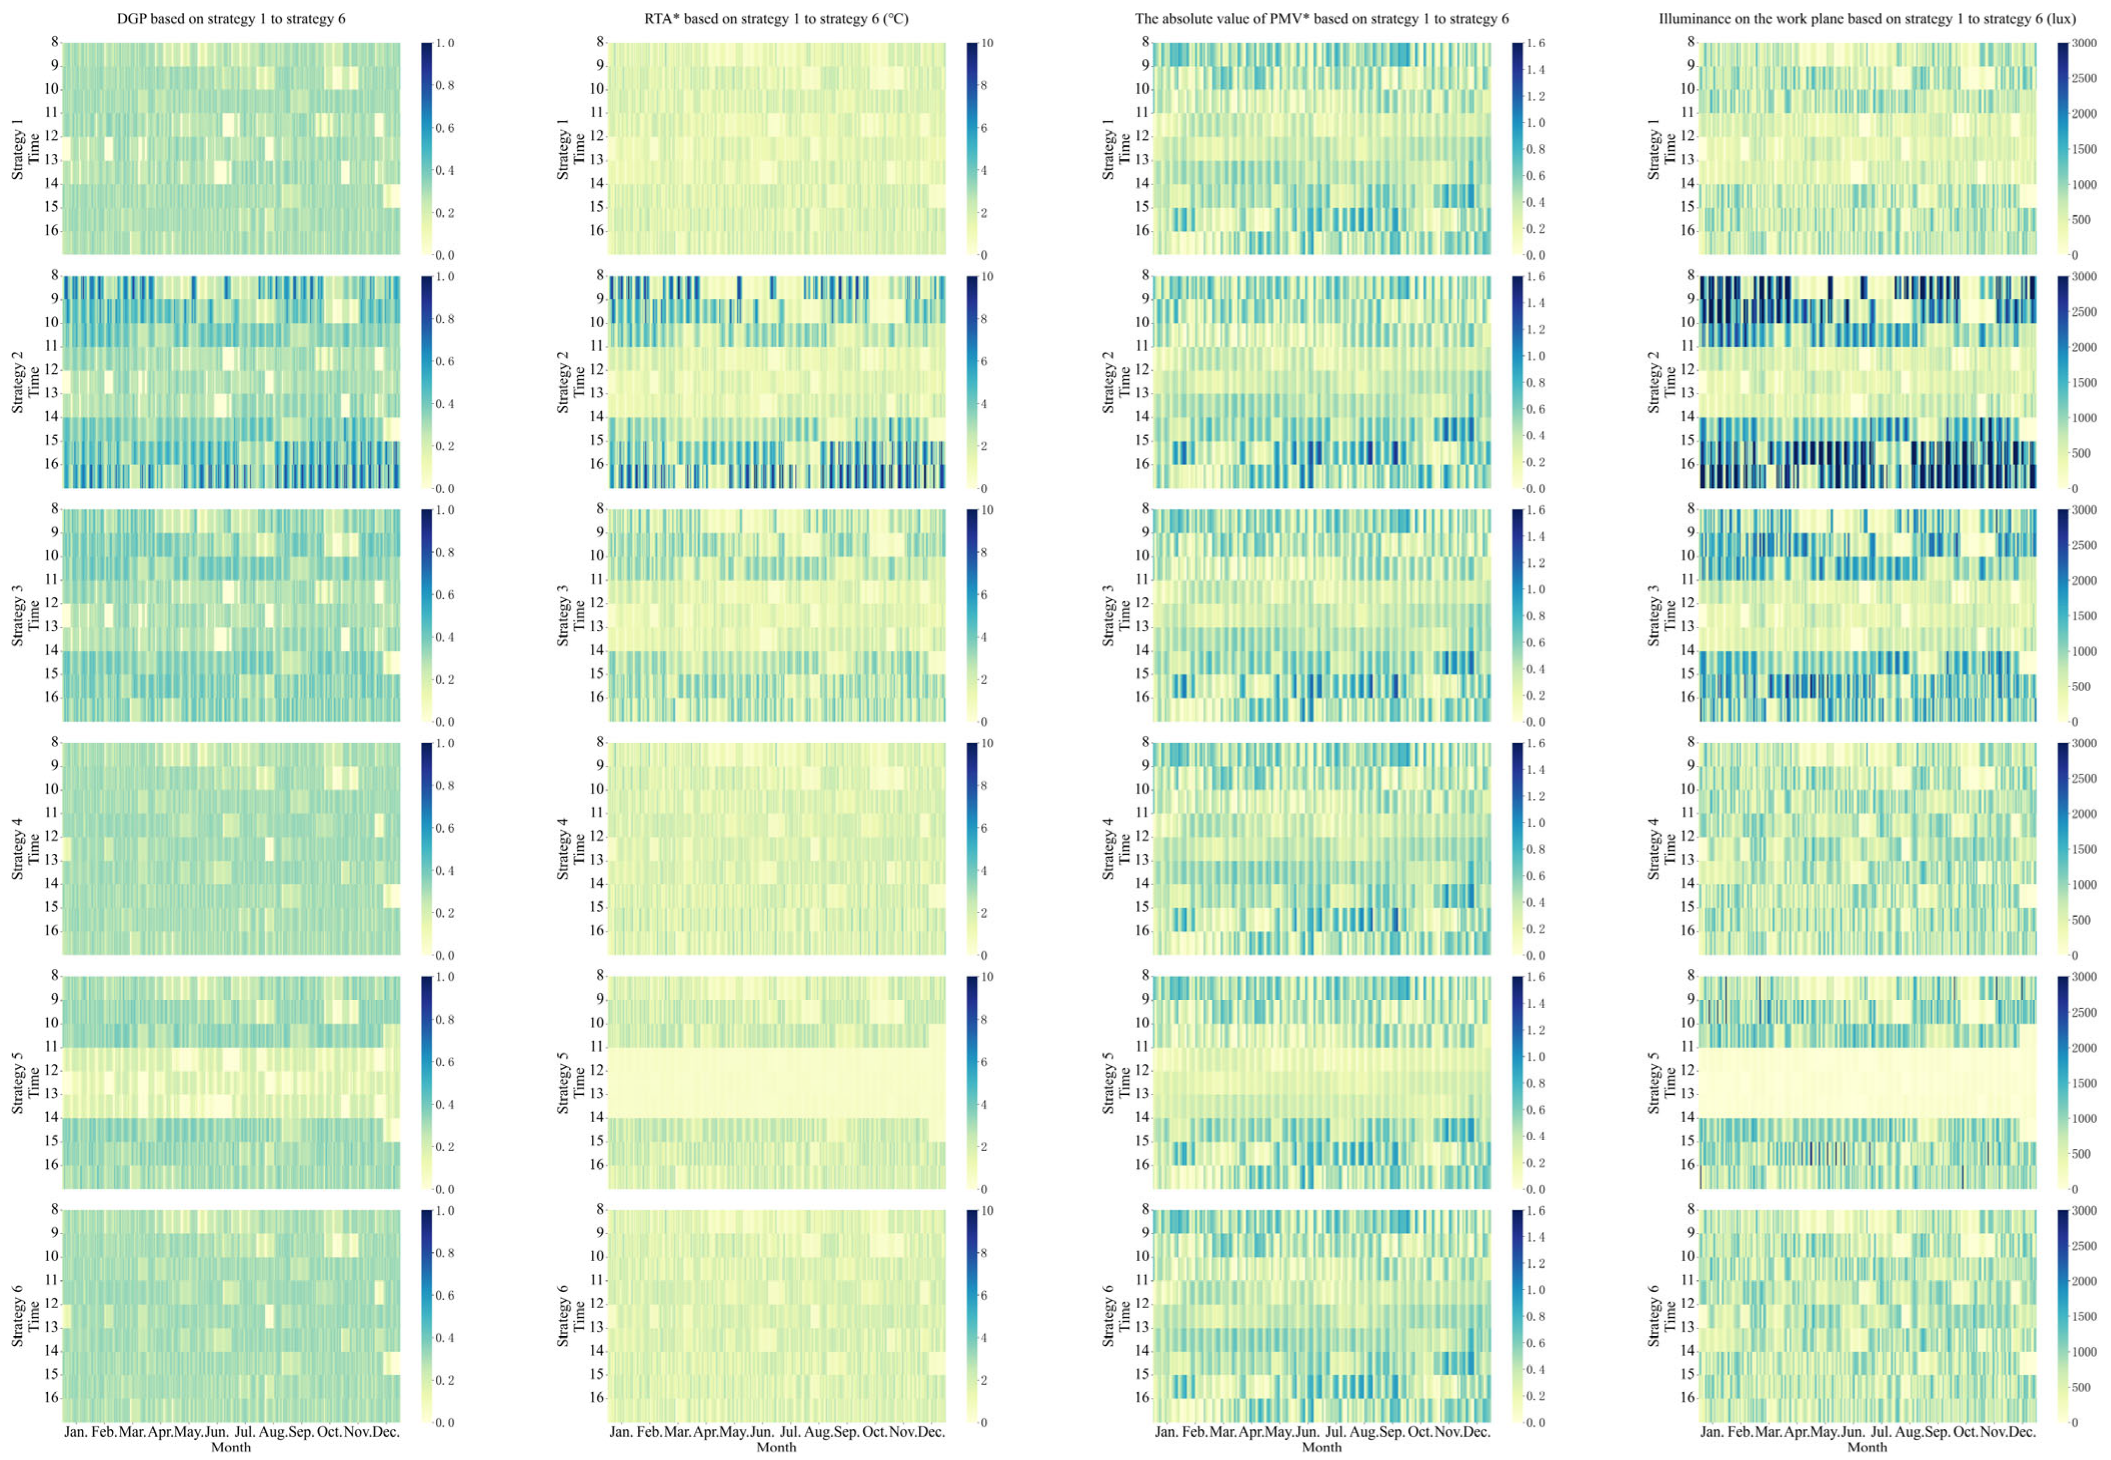
Figure 11. Heat map of annual variation of indices in case 1.
Buildings 12 02043 g011
Figure 12. Heat map of annual variation of indices in case 2.
Buildings 12 02043 g012

5.4. Computational Complexity Analysis of the Index-Based Operation of Shading

Through the discussion, we know that index-based shading operation relies on dynamic simulation of light and thermal environment in building. With the development of high-performance computing, the fast dynamic simulation of environment can be realized in a wider range of hardware configurations, but with the increase of the number of BECS and target building, the problem of computing power still cannot be ignored in practical engineering applications. This will be one of the most important challenges for index-based operation logic. Therefore, it is necessary to analyze and discuss its computational complexity. In this paper, this part is performed based on the results.
Algorithm complexity is a measure of the resources required by an algorithm, including space and time. Time complexity refers to the time required by an algorithm execution. It is related to factors such as data size and so on. Typical time complexity includes:
  • O (1) constant complexity, running time independent of input size;
  • O (n) linear complexity, with the input size increases, the operation time increases linearly;
  • O (n2) square complexity, with the input size increases, the operation time increases by the power of two;
  • O (2n) exponential complexity, with the input size increases, the computation time increases exponentially, etc. [42]
In this study, the time complexity of different performance indices is compared and analyzed under the same computing power configuration. According to the calculation principle of the five shading performance indices selected, the corresponding algorithm complexity types can be obtained and the input scale can be sorted out, as shown in the following Table 6.
Except the ray tracing method used to calculate the illuminance and DGP, the computational complexity of each performance index increases linearly. Except for the calculation of DGP, the input scale of each performance index is 1. The reverse ray tracing method is adopted in Radiance. The complexity of the algorithm is reduced from square to linear. This greatly improves the possibility of large-scale simulation of indoor illuminance. Based on the Radiance using reverse ray tracing algorithm, Daysim achieves fast calculation of indoor illuminance throughout the year. Similarly, the algorithm complexity and input size of PMV*, RTA* and solar radiation heat calculation are small, and the algorithm can be transplanted to the common terminal controller for real-time calculation. However, the input scale of DGP is 105, which is difficult to apply in practical engineering applications. This brings difficulties to the practical engineering application of index-based operation. On the one hand, the solution can be carried out from the hardware dimension; that is, the improvement of relevant chip computing power. On the other hand, it can be carried out from the simplified (equivalent) calculation dimension of DGP. At present, relevant research and progress have been made. For example, Wienold et al. [43] adopt vertical illuminance at eye level to simplify the calculation of DGP. Tzempelikos et al. [44] put forward the equivalent window illuminance on this basis. The equivalent window illuminance has a linear relationship with the horizontal illuminance of the occupant’s eye. This can be simulated more easily. Xie et al. [21] used real-time solar irradiance measurements and the sun position as the input to predict the glare condition. Although the relevant equivalent calculation method still faces the problem of application scope, it can reflect the visual comfort and replace glare index to a certain extent. In the case of index-based operation, it may be combined with the path of hardware computing power improvement to form a simulation computing methodology that can realize the balance between computational complexity and equivalent effect.
At present, the work in this paper has not progressed to the stage of equivalent calculation for performance indices with high algorithmic complexity, so the algorithm complexity problem mentioned in this section cannot be avoided. It is believed that the follow-up can be combined with the thought of the equivalent calculation research. This may make up for the problem that the complex DGP simulation leads to the failure of the calculation time to meet the engineering application.

6. Conclusions

This study discusses the operational logic of a BECS. First, through the discussion of the input parameters of the control strategy, two types of typical operation logic, parameter-based logic, and index-based logic, are summarized and analyzed. Consequently, because the preferences and requirements of occupants are not generated by the direct perception of environmental parameters, parameter-based operational logic may have limitations. Index-based operation logic, advanced from parameter-based operation logic, can effectively avoid this problem. However, the existing index-based operational logic of various BECSs uses a single performance index. Taking shading as an example, a change in its state dynamically affects the light and thermal environments. A single performance index can neither comprehensively control the indoor environment nor comprehensively evaluate the control effect.
Therefore, this study considers the shading system as representative of the BECS. It was conducted from the two dimensions of light and thermal environment, and energy saving and indoor comfort. DGP was used to characterize visual comfort. The illuminance of the work plane was used to characterize the lighting energy consumption. PMV* and RTA* were proposed to characterize radiant thermal comfort. The solar radiant heat gain was used to characterize the air conditioning energy consumption. The PMV* and RTA* proposed in this study were obtained based on the Gennusa model, considering the influence of solar radiation on the PMV and RTA.
Furthermore, for different control objectives, six typical control strategies based on index-based operation logic were implemented and quantitatively analyzed. The simulation method was used to discuss and analyze the control effect for two cases with different shading forms and room layouts. The results are as follows:
  • The index-based control strategy has good directionality and its operational performance is not sensitive to changes in the boundary conditions of different cases, such as the layout or form of shading.
  • The strategy that considers only energy savings will result in more frequent uncomfortable situations. Therefore, the indices in the operation logic should not only relate to energy consumption, but also relate to comfort. The control effect of sacrificing part of the comfort to achieve better energy savings is similar to other control strategies that consider comfort only. Therefore, a control strategy solely considering energy savings may not be necessary, and a moderate sacrifice of comfort may not cause excessive aversion.
  • In the operation logic of shading, when the indices are including lighting comfort and lighting energy saving, indices related to thermal comfort can not be take into account, because the strategy can already meets the need of thermal comfort.
  • The contradiction between visual comfort and thermal comfort exists. If we want to achieve comprehensive comfort, relying on a single BECS may not be able to resolve this contradiction, and coupling control with other BECSs is needed.
This study also has limitations.
  • The comfort thresholds of PMV* and RTA* may change after solar radiation is considered. However, this was not investigated in this study. Further research is planned in the future.
  • In the control strategies, the number satisfying the constraints is currently used to select the system state in the first step. Using the degree of satisfaction of the constraints may be a better way to select the process. However, because each performance index has different dimensions, it is necessary to determine the weight of each index before selection. The authors believe that the weights should be determined by considering the individualized environment preference of occupants in the target room, which needs to be discussed in detail from the perspective of occupant behavior and thermal comfort research. In this case, we plan to conduct follow-up research on an independent topic.
  • Finally, through this study, the contradictions between energy saving and indoor comfort, as well as visual comfort and thermal comfort, are drawn. This might be a key issue in exploring the intelligent operation of BECSs and can be combined with the issue of individualized environment preference to process further in-depth research.

Author Contributions

Conceptualization, Z.L. and B.H.; methodology, H.Z.; software, X.L.; validation, X.L.; formal analysis, H.Z. and X.L.; investigation, X.L.; resources, H.Z.; data curation, H.Z. and Z.L.; writing—original draft preparation, X.L.; writing—review and editing, B.H.; visualization, X.L.; supervision, Z.L.; project administration, Z.L.; funding acquisition, H.Z. All authors have read and agreed to the published version of the manuscript.

Funding

This study was supported by the “National Natural Science Foundation of China (Grant No. 52108088)” and “China Postdoctoral Science Foundation (Grant No. 2021M692449)”.

Data Availability Statement

Not applicable.

Conflicts of Interest

The authors declare no conflict of interest.

References

  1. Li, C.; Zhu, H.; Lian, X.; Liu, Y.; Li, X.; Feng, Y. Study of “time-lag” of occupant behavior occurrences for establishing an occupant-centric building control system. Build. Environ. 2022, 216, 109005. [Google Scholar] [CrossRef]
  2. Yu, H.; Ma, C.; Liu, Z. An energy-saving control model and strategy based on divided areas for intelligent building. In Proceedings of the 2015 International Conference on Computational Science and Engineering, Reykjavík, Iceland, 21–23 October 2015; pp. 504–509. [Google Scholar]
  3. Sun, B.; Luh, P.B.; Jia, Q.-S.; Jiang, Z.; Wang, F.; Song, C. Building Energy Management: Integrated Control of Active and Passive Heating, Cooling, Lighting, Shading, and Ventilation Systems. IEEE Trans. Autom. Sci. Eng. 2012, 10, 588–602. [Google Scholar] [CrossRef]
  4. Du, Y.; Zandi, H.; Kotevska, O.; Kurte, K.; Munk, J.; Amasyali, K.; Mckee, E.; Li, F. Intelligent multi-zone residential HVAC control strategy based on deep reinforcement learning. Appl. Energy 2020, 281, 116117. [Google Scholar] [CrossRef]
  5. Yuan, X.; Pan, Y.; Yang, J.; Wang, W.; Huang, Z. Study on the application of reinforcement learning in the operation optimization of HVAC system. Build. Simul. 2020, 14, 75–87. [Google Scholar] [CrossRef]
  6. Sorgato, M.; Melo, A.; Lamberts, R. The effect of window opening ventilation control on residential building energy consumption. Energy Build. 2016, 133, 1–13. [Google Scholar] [CrossRef]
  7. Dussault, J.-M.; Sourbron, M.; Gosselin, L. Reduced energy consumption and enhanced comfort with smart windows: Comparison between quasi-optimal, predictive and rule-based control strategies. Energy Build. 2016, 127, 680–691. [Google Scholar] [CrossRef]
  8. Görgülü, S.; Ekren, N. Energy saving in lighting system with fuzzy logic controller which uses light-pipe and dimmable ballast. Energy Build. 2013, 61, 172–176. [Google Scholar] [CrossRef]
  9. Grygierek, K.; Sarna, I. Impact of Passive Cooling on Thermal Comfort in a Single-Family Building for Current and Future Climate Conditions. Energies 2020, 13, 5332. [Google Scholar] [CrossRef]
  10. Lee, D.; Ooka, R.; Ikeda, S.; Choi, W.; Kwak, Y. Model predictive control of building energy systems with thermal energy storage in response to occupancy variations and time-variant electricity prices. Energy Build. 2020, 225, 110291. [Google Scholar] [CrossRef]
  11. Park, J.Y.; Dougherty, T.; Fritz, H.; Nagy, Z. LightLearn: An adaptive and occupant centered controller for lighting based on reinforcement learning. Build. Environ. 2019, 147, 397–414. [Google Scholar] [CrossRef]
  12. Carletti, C.; Sciurpi, F.; Pierangioli, L.; Asdrubali, F.; Pisello, A.L.; Bianchi, F.; Sambuco, S.; Guattari, C. Thermal and lighting effects of an external venetian blind: Experimental analysis in a full scale test room. Build. Environ. 2016, 106, 45–56. [Google Scholar] [CrossRef]
  13. Yun, G.; Yoon, K.C.; Kim, K.S. The influence of shading control strategies on the visual comfort and energy demand of office buildings. Energy Build. 2014, 84, 70–85. [Google Scholar] [CrossRef]
  14. Atzeri, A.M.; Gasparella, A.; Cappelletti, F.; Tzempelikos, A. Comfort and energy performance analysis of different glazing systems coupled with three shading control strategies. Sci. Technol. Built Environ. 2018, 24, 545–558. [Google Scholar] [CrossRef]
  15. Skarning, G.C.J.; Hviid, C.A.; Svendsen, S. The effect of dynamic solar shading on energy, daylighting and thermal comfort in a nearly zero-energy loft room in Rome and Copenhagen. Energy Build. 2017, 135, 302–311. [Google Scholar] [CrossRef] [Green Version]
  16. Dussault, J.-M.; Gosselin, L. Office buildings with electrochromic windows: A sensitivity analysis of design parameters on energy performance, and thermal and visual comfort. Energy Build. 2017, 153, 50–62. [Google Scholar] [CrossRef]
  17. Kunwar, N.; Cetin, K.S.; Passe, U.; Zhou, X.; Li, Y. Full-scale experimental testing of integrated dynamically-operated roller shades and lighting in perimeter office spaces. Sol. Energy 2019, 186, 17–28. [Google Scholar] [CrossRef]
  18. Tzempelikos, A.; Shen, H. Comparative control strategies for roller shades with respect to daylighting and energy performance. Build. Environ. 2013, 67, 179–192. [Google Scholar] [CrossRef]
  19. Peng, Y.; Nagy, Z.; Schlüter, A. Temperature-preference learning with neural networks for occupant-centric building indoor climate controls. Build. Environ. 2019, 154, 296–308. [Google Scholar] [CrossRef]
  20. Reinhart, C.; Voss, K. Monitoring manual control of electric lighting and blinds. Light. Res. Technol. 2003, 35, 243–258. [Google Scholar] [CrossRef] [Green Version]
  21. Xie, J.; Sawyer, A.O. Simulation-assisted data-driven method for glare control with automated shading systems in office buildings. Build. Environ. 2021, 196, 107801. [Google Scholar] [CrossRef]
  22. Grobman, Y.J.; Capeluto, I.G.; Austern, G. External shading in buildings: Comparative analysis of daylighting performance in static and kinetic operation scenarios. Arch. Sci. Rev. 2016, 60, 126–136. [Google Scholar] [CrossRef]
  23. Gao, P.X.; Keshav, S. SPOT: A smart personalized office thermal control system. In Proceedings of the Fourth International Conference on Future Energy Systems, Berkeley, CA, USA, 21–24 May 2013; pp. 237–246. [Google Scholar] [CrossRef]
  24. Castilla, M.; Álvarez, J.D.; Berenguel, M.; Rodríguez, F.; Guzmán, J.L.; Pérez, M. A comparison of thermal comfort predictive control strategies. Energy Build. 2011, 43, 2737–2746. [Google Scholar] [CrossRef]
  25. Sharma, L.; Rakshit, D. Visual Comfort Based Algorithmic Control for Roller Shade and Assessment of Potential Energy Savings; Springer: Singapore, 2018. [Google Scholar]
  26. Wienold, J.; Christoffersen, J. Evaluation methods and development of a new glare prediction model for daylight environments with the use of CCD cameras. Energy Build. 2006, 38, 743–757. [Google Scholar] [CrossRef]
  27. Nabil, A.; Mardaljevic, J. Useful daylight illuminances: A replacement for daylight factors. Energy Build. 2006, 38, 905–913. [Google Scholar] [CrossRef]
  28. Howell, W.C.; Kennedy, P.A. Field Validation of the Fanger Thermal Comfort Model. Hum. Factors J. Hum. Factors Ergon. Soc. 1979, 21, 229–239. [Google Scholar] [CrossRef]
  29. Fanger, O.P. Thermal comfort: Analysis and applications in environmental engineering. Therm. Comf. Anal. Appl. Environ. Eng. 1972, 92, 244. [Google Scholar]
  30. Wienold, J. Dynamic daylight glare evaluation. Proc. Build. Simul. 2009, 11, 944–951. [Google Scholar]
  31. Chauvel, P.; Collins, B.J.; Dogniaux, R.; Longmore, J. Glare from windows: Current views of the problem. Light. Res. Technol. 1982, 14, 31–46. [Google Scholar] [CrossRef]
  32. American Society of Heating, Refrigerating and Air-Conditioning Engineers. Thermal Environmental Conditions for Human Occupancy; American Society of Heating, Refrigerating and Air-Conditioning Engineers: Atlanta, GA, USA, 2014. [Google Scholar]
  33. Suk, J.; Schiler, M. Investigation of Evalglare software, daylight glare probability and high dynamic range imaging for daylight glare analysis. Light. Res. Technol. 2013, 45, 450–463. [Google Scholar] [CrossRef]
  34. Pesenti, M.; Masera, G.; Fiorito, F. Shaping an Origami Shading Device through Visual and Thermal Simulations. Energy Procedia 2015, 78, 346–351. [Google Scholar] [CrossRef] [Green Version]
  35. Lavin, C.; Fiorito, F. Optimization of an External Perforated Screen for Improved Daylighting and Thermal Performance of an Office Space. Procedia Eng. 2017, 180, 571–581. [Google Scholar] [CrossRef]
  36. GB50033-2013; Standard for Daylighting Design of Buildings. China Architecture & Building Press: Beijing, China, 2013.
  37. La Gennusa, M.; Nucara, A.; Rizzo, G.; Scaccianoce, G. The calculation of the mean radiant temperature of a subject exposed to the solar radiation—A generalised algorithm. Build. Environ. 2005, 40, 367–375. [Google Scholar] [CrossRef]
  38. La Gennusa, M.; Nucara, A.; Pietrafesa, M.; Rizzo, G. A model for managing and evaluating solar radiation for indoor thermal comfort. Sol. Energy 2007, 81, 594–606. [Google Scholar] [CrossRef]
  39. ASHRAE. ASHRAE Handbook; ASHRAE: Atlanta, GA, USA, 2009. [Google Scholar]
  40. Energyplus. Engineering Reference. Available online: https://energyplus.net/assets/nrel_custom/pdfs/pdfs_v22.2.0/EngineeringReference.pdf (accessed on 28 September 2022).
  41. Wienold, J.; Christoffersen, J. Towards a New Daylight Glare Rating; Lux Europa: Berlin, Germany, 2005; pp. 157–161. [Google Scholar]
  42. Agenis-Nevers, M.; Bokde, N.D.; Yaseen, Z.M.; Shende, M.K. An empirical estimation for time and memory algorithm complexities: Newly developed R package. Multimedia Tools Appl. 2020, 80, 2997–3015. [Google Scholar] [CrossRef]
  43. Wienold, J. Dynamic simulation of blind control strategies for visual comfort and energy balance analysis. In Building Simulation; IBPSA: Beijing, China, 2007; pp. 1197–1204. [Google Scholar]
  44. Shen, H.; Tzempelikos, A. Daylight-linked synchronized shading operation using simplified model-based control. Energy Build. 2017, 145, 200–212. [Google Scholar] [CrossRef]
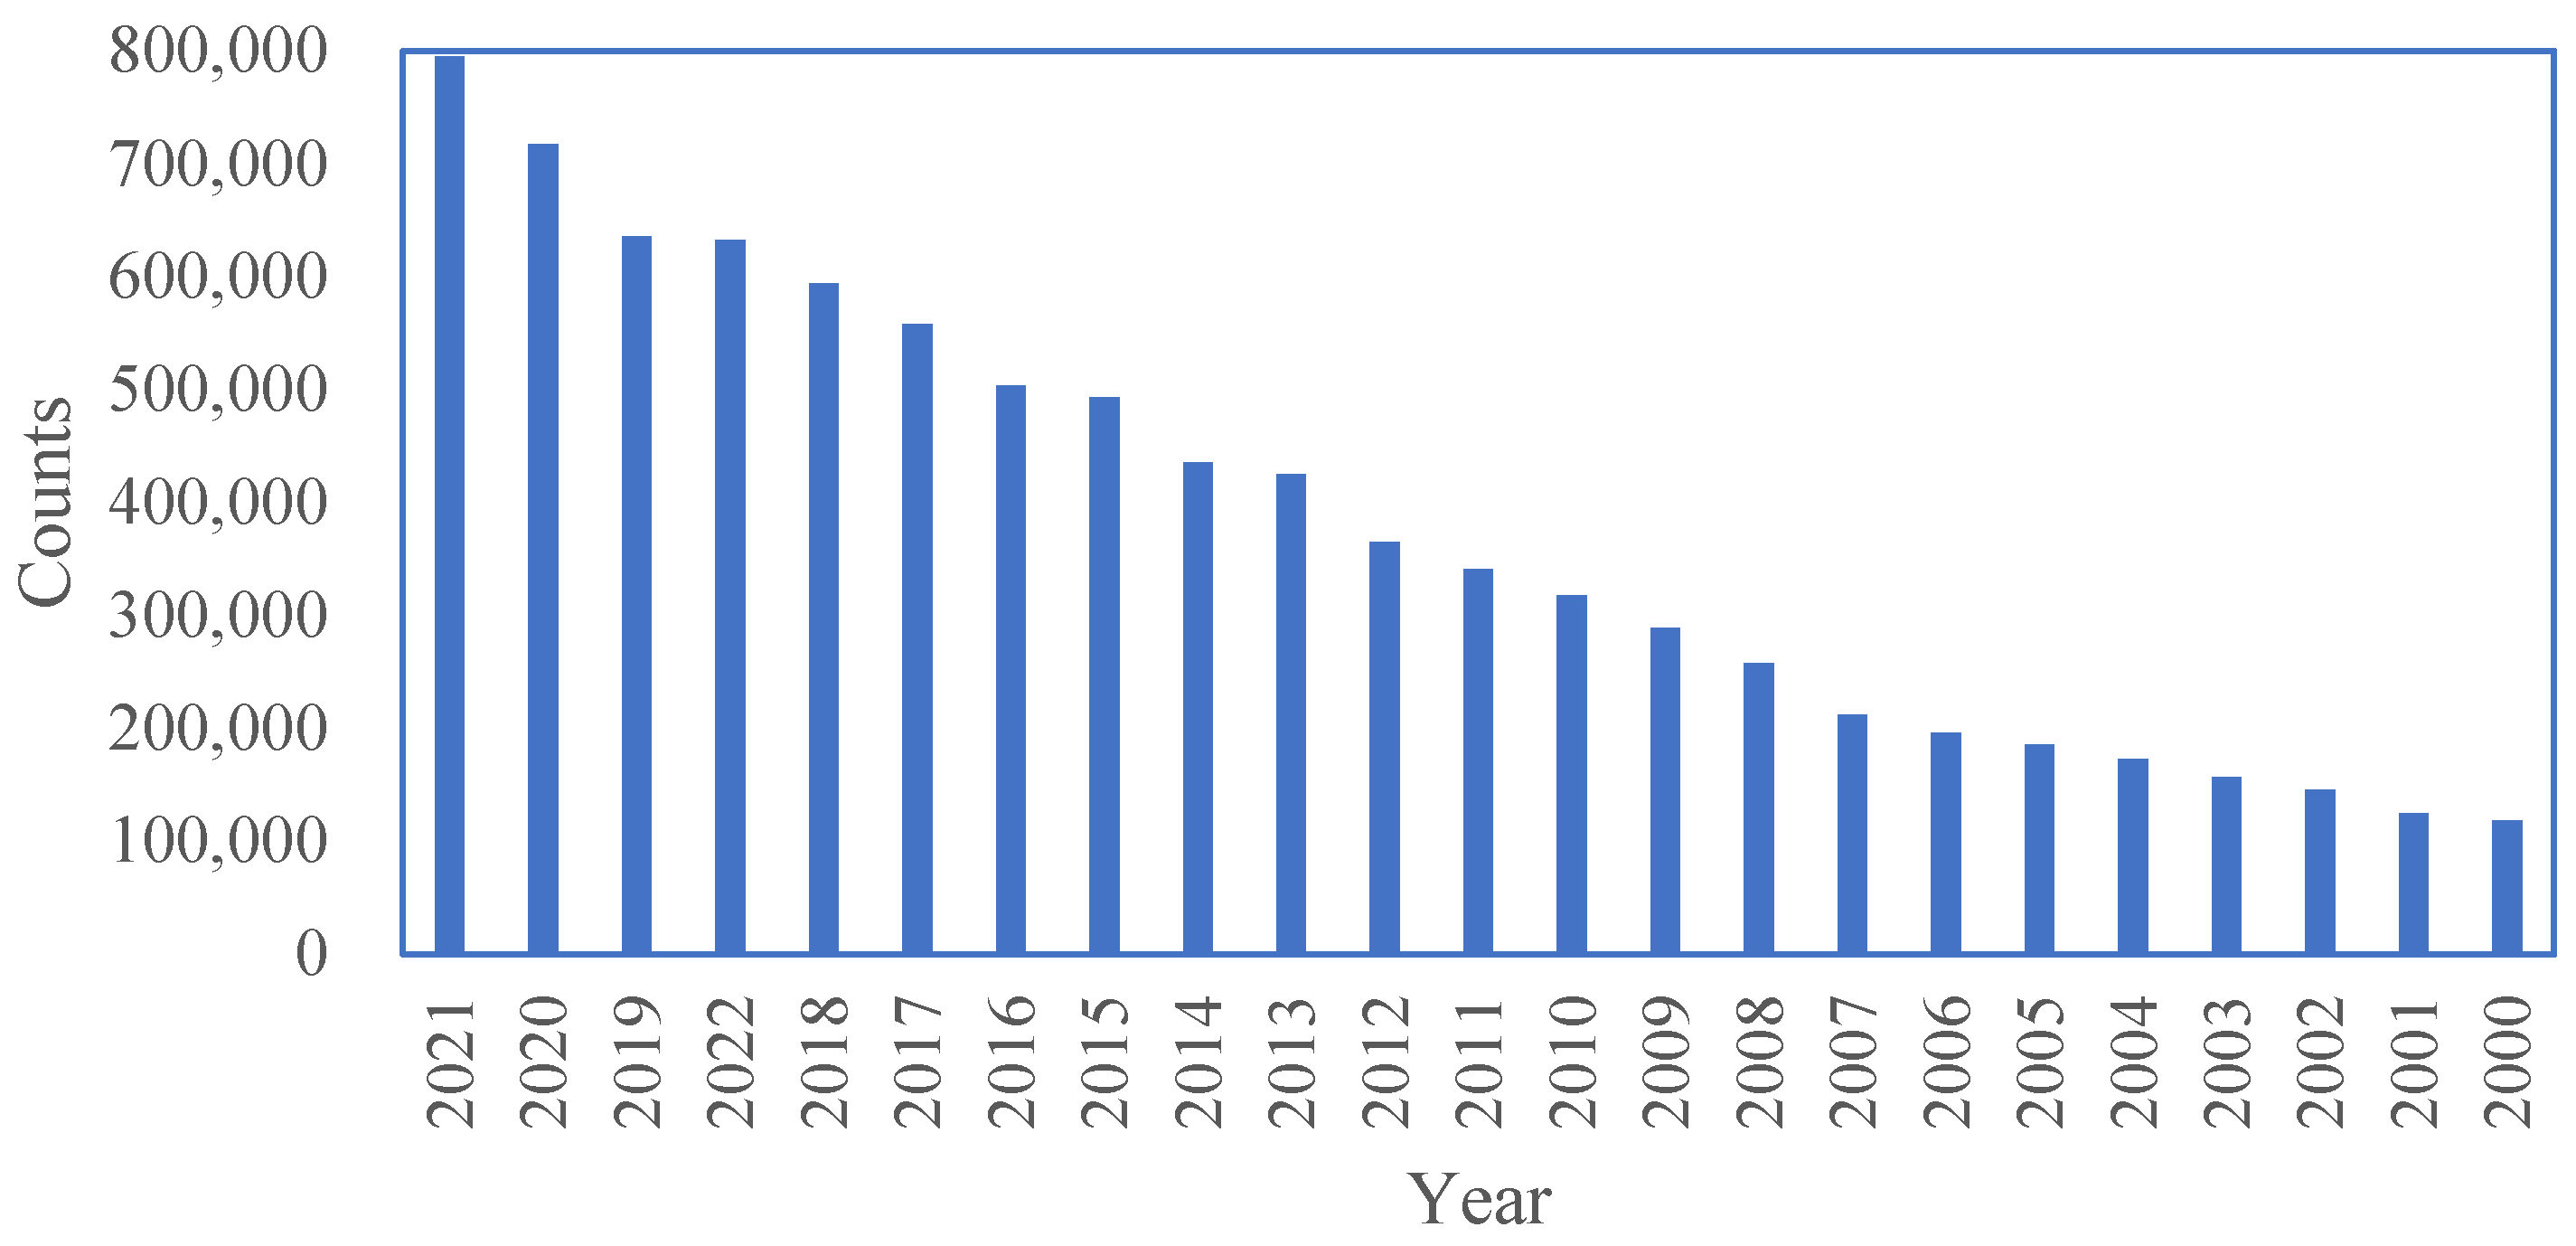
Figure 1. Retrieval result counts (from the Web of Science) based on the keywords (((TI = (building*)) AND TI = (environment*)) AND TI = (control* OR operate*)) OR TS = (health* OR comfortable* OR energy saving OR energy consumption).
Buildings 12 02043 g001
Figure 2. Flowchart of this study.
Buildings 12 02043 g002
Figure 3. Relationship between parameters, indices and the occupant’s needs.
Buildings 12 02043 g003
Figure 4. Performance indices of a shading operation.
Buildings 12 02043 g004
Figure 5. Six typical index−based control strategies.
Buildings 12 02043 g005
Figure 6. Layout of case 1 room.
Buildings 12 02043 g006
Figure 7. Layout of case 2 room.
Buildings 12 02043 g007
Table 1. Summary of existing operation logic.
YearLocationBuilding TypeDevice TypeInput ParametersEvaluation IndicesRef.Control Type
2016BrazilResidenceWindows, HVACInternal temperature, whether the room is occupiedHours of comfort in naturally ventilated rooms, energy consumption of HVAC system[6]1
2016CanadaOfficeWindows, HVACRBC1: Illuminance on the work plane, whether the room is occupied, internal temperatureThermal discomfort index, energy consumption and peak loads[7]1
RBC2: Illuminance on the work plane, whether the room is occupied, internal temperature1
GA: Overall energy consumption, illuminance on the work plane, internal temperature1, 2
MPC: The cost (including electricity and discomfort costs of the building zone)2
2013TurkeyFaculty buildingLightingThe work plane illuminance, whether there is a motion in the roomThe error level of control, energy saving[8]1
2020PolandResidenceFansInternal temperature, the number of thermal discomfort hours, heating demandThe number of thermal discomfort hours, heating demand, ACH[9]1, 2
WindowsInternal temperature, the number of thermal discomfort hours, heating demand, if the residents are in the building1, 2
2020JapanOfficeHVACOperating cost, zone temperature, mass flow rates of pumpZone temperature, electricity consumption, operating cost, pump operation[10]1, 2
2019USAOfficelightingWhether the room is occupied, switch position, indoor light levels, period of dayThe total energy use, light-utilization ratio, unmet comfort hours, light–comfort ratio, the daily relative change of each value[11]1
2016ItalyResidenceShadingExternal air temperature, illuminance, window orientation, hour of the day, period of the yearExternal, internal and mean radiant temperature, glass internal surface temperature, external and internal illuminance[12]1
2020-ResidenceHVACEnergy consumption cost, comfort violation costEnergy consumption cost, temperature violation[4]1, 2
2019ChinaOfficeHVACEnergy consumption, indoor temperatureOperating costs, energy consumption, percentage of non-comfortable time[5]1, 2
2014KoreaOfficeShadingVertical illuminance at eye levelEnergy consumption[13]1
2018ItalyOfficeShadingWorking plane illuminanceThe fraction of the occupation time with acceptable comfort conditions in a given position, The fraction of space simultaneously within comfort range in a given moment, energy demand[14]1
The position of the sun1
The position of the sun, working plane illuminance1
2017Italy, DenmarkResidenceShadingOutdoor air temperature, total diffuse and direct solar irradiation on the windowSpace-heating demand, operative temperatures exceeding the upper comfort limit, the percentage of daylight hours with at least 300 lx in 75% of the space[15]1
2017United States, CanadaOfficeWindowsRBC1/2: If the building zone is in cooling mode, if it is occupancy period, daylight illuminance on the work plane, glareEnergy consumption, peak energy demand, UDI, PPD[16]1
RBC3/4/5/6: vertical solar radiation, glare1
RBC7/8: zone temperature, glare1
2019USAOfficeShading, lightingExternal irradiation, vertical illuminance, work plane illuminanceEnergy savings, DGPs, UDI[17]1
External irradiation, work plane illuminance1
2013USAOfficeShadingIncident beam radiationDaylight autonomy, UDI, fraction of time when work plane illuminance within the recommended value, annual lighting, heating and cooling energy demand, site energy consumption and total annual source energy consumption per unit floor area[18]1
Transmitted illuminance1
The solar position, transmitted illuminance1
The solar position, transmitted illuminance, heat gains1
2019SingaporeOfficeHVACTime of day, outdoor temperature, indoor temperature, CO2 concentrationEnergy savings, occupant intervention frequency[19]1
2003GermanyOfficeShadingThe illuminance onto the SSW façadeManual manipulation rate[20]1
2021USAOfficeShading, lightingWhether glare occurThe proportion of “glare, and the shading blocks glare successfully” and “glare, but the shading does not block glare successfully,” energy saving[21]2
2016IsraelOfficeShadingAUDIsAUDIs[22]2
2013CanadaOfficeHVACPPV, Energy costAverage absolute PPV, average daily energy consumption, average discomfort[23]2
2011SpainOfficeHVACPMV, indoor temperature, fan-coil velocityPMV, energy consumption, mean number of changes in actuator’s state (on/off) per hour, the percentage of time the actuator is used[24]1, 2
2018IndiaOfficeShadingDGPDGP, energy consumption[25]1, 2
Table 2. Current mainstream evaluation indices for various BECS.
Evaluation IndicesEquation of DefinitionInput ParametersThe Meaning of the Indices
Daylight Glare Probability (DGP) [26] D G P = 5.87 × 10 5 E v + 9.18 × 10 2 log 10 1 + i = 1 n L s , i 1.6 ω s , i E v 1.87 P i 2 + 0.16 Vertical eye illuminance, luminance of source, solid angle of source, position indexThe possibility of subjects experiencing glare over a period of time
Useful Daylight Illuminance (UDI) [27]The percentage of the time during which the natural illuminance on the working face is in the range of 100–2000 lx during the yearIlluminanceThe usefulness of daylight
Predicted Percentage of Dissatisfied (PPD) [28] P P D = 100 95 e 0.03353 P M V 4 0.2179 P M V 2 PMVProportion of subjects who felt heat uncomfortable
AUDIs [22]The percentage of the time during which the natural illuminance on the working face is in the range of 300–1000 lx during the yearIlluminanceThe usefulness of daylight
PPV [23] P P V ( x ) = P M V ( x ) + p e r s o n a l ( x ) p e r s o n a l ( x ) = a T x + b x = { t a , t ¯ r , v a r , p a , M , I c l } Metabolic rate, effective mechanical power, air temperature, mean radiant temperature, clothing surface temperature, clothing surface area factor, water vapor partial pressure, convective heat transfer coefficientPersonalized thermal comfort of occupants
PMV [29] P M V = 0.303 0.036 M + 0.028 L L = f M , t a , p a , θ m r t , I c l , v a = M W 0.0014 M 34 t a 0.0173 M 5.867 p a 0.35 × 5.733 0.007 ( M W ) p a 0.42 × ( M W 58.15 ) 3.96 × 10 8 f c l t c l + 273 4 θ m r t + 273 4 f c l h c t c l t a Metabolic rate, effective mechanical power, air temperature, mean radiant temperature, clothing surface temperature, clothing surface area factor, water vapor partial pressure, convective heat transfer coefficientAverage thermal comfort of occupants
eDGPs [30] e D G P s = 5.87 × 10 5 × E v + 0.0918 × log 10 [ 1 + i = 1 n ( L s , i 2 × ω s , i E v 1.87 × P i 2 ) ] + 0.16 Vertical eye illuminance, luminance of source, solid angle of source, position indexThe possibility of subjects experiencing glare over a period of time. The second part is gained based on the calculation of simplified image
Table 3. Threshold of DGP [33].
Threshold of DGPGlare Feeling
DGP < 0.35Imperceptible glare
0.35 < DGP < 0.4Perceptible glare
0.4 < DGP < 0.45Disturbing glare
DGP > 0.45Intolerable glare
Table 4. Summary of room parameters in case 1.
Room size3.5 m × 5.54 m × 2.8 m
Window–wall ratio0.4959
The windowTransmittance 0.5
SHGC 0.35
The wallReflectance 0.5
The ceilingReflectance 0.7
The floorReflectance 0.2
Exterior venetian blindSlat reflectance 0.7
Slat width 0.09 m
Slat separation 0.07 m
The gear of shading (According to shading area)0%/20%/40%/60%/80%/100%
Table 5. Summary of room parameters in case 2.
Room size3.62 m × 6 m × 2.85 m
Window–wall ratio0.421
The windowTransmittance 0.5
SHGC 0.41
The wallReflectance 0.6
The ceilingReflectance 0.75
The floorReflectance 0.2
Exterior venetian blindSlat reflectance 0.52
Slat width 0.1 m
Slat separation 0.08 m
FurnitureReflectance 0.6
The gear of shading (According to shading area)0%/20%/40%/60%/80%/100%
Table 6. Computational complexity of shading control indices.
Indices for ShadingAlgorithm ComplexityInput Size
DGPRay tracing method O(n2)
Reverse ray tracing method O(n)
105
Illuminance of work planeRay tracing method O(n2)
Reverse ray tracing method O(n)
1
PMV*O(n)1
RTA*O(n)1
Solar radiation heat gainO(n)1
Publisher’s Note: MDPI stays neutral with regard to jurisdictional claims in published maps and institutional affiliations.