Abstract
Thin sandstone is a widely used building material; however, its compressive behavior is not well understood. Four groups of cylinders were manufactured in a factory to investigate the uniaxial compressive behavior of red sandstone. Uniaxial compression tests were performed to determine the compressive behavior and failure mode of the specimens. The geometry of the stress–strain diagram varied among the four groups. The critical strain generally increased with a decrease in the height of the cylinder, whereas the compressive strength exhibited an inverse trend. The experimental diagrams were normalized with the peak stress and corresponding critical strain to represent the stress–strain diagram of each group of cylinders. A formula consisting of two parabolas was employed for regression to obtain a representative mathematical expression of the diagram. The correlations between porosity, compressive strength, and elastic modulus were evaluated based on empirical expressions. Normalized strength was employed to evaluate the size effect on the diameter and length–diameter ratio (L/D) of the cylinder; the latter provided a better prediction of the experimental results than the former. A new expression in terms of L/D was proposed based on the regression analysis of the experimental results. This study is beneficial for the engineering application of sandstone as a construction material.
1. Introduction
As a common construction material, sandstone has been widely used in building structures [1,2,3], monuments [4], building facades [5,6], and ornamentation [7,8]. Natural stones, such as sandstone, have been cut into various geometries for structural usage [9,10]. The unexpected failure of structural stones is primarily due to the degradation of the load-bearing capacity [11]. This has become the primary limitation of sandstone as a building material, particularly for load bearing. Because of the varied geological locations of sandstones, loading tests are an efficient approach to determine their mechanical properties. The uniaxial compressive strength (UCS) of sandstone is an important mechanical property with regard to buildings [12,13]. Experimental studies have demonstrated that UCS primarily varies according to the mineralogy and microstructure of the material. The elastic modulus and UCS are fundamental mechanical properties of rocks. Rock-specific models [14] have been developed based on the Bayesian framework for model assessment to obtain the magnitude of the modulus ratio in the expression of Deere’s proportionality rule [15]. The UCS of sandstone is affected by the grain size, mineralogy, and porosity [16]. Garrido et al. [17] employed point load and rebound hardness to predict the uniaxial compressive strength. Based on indentation tests, the correlation between the UCS and elastic modulus was determined, and the proposed expressions were capable of estimating the UCS of sandstone [18]. The compressive strength of sandstone under triaxial loading conditions is larger than that under uniaxial loading [19]. A low-cost method was developed to prepare synthetic sandstone with mechanical properties identical to those of natural sandstone [20]. Reproducible sandstones with controlled properties provide opportunities to study the effects of the petrophysical characteristics on the mechanical behavior. Over the entire service life of sandstone, bioweathering affects its UCS [21]. The effects of chemical degradation on the mechanical behavior appear when sandstone is exposed to acid rain [22,23]. In these studies, the failure of the stone claddings was caused by mechanical strength degradation.
Standard uniaxial loading tests are widely used to determine the UCS of stone materials. Fracture damage is the dominant failure mode of brittle materials, such as natural stones. A complete stress–strain diagram consisting of loading stages was developed by Eberhardt et al. [24]. The experimental results of Peng et al. [25] indicated that the burial depth of granite is correlated with the magnitude of the UCS. The magnitude of the UCS generally increases with depth [26]. Uniaxial compressive tests conducted by Liu et al. [27] showed that the direction of the vein in the marble was closely correlated with the UCS. The magnitude of the UCS in the horizontal vein was approximately twice that in the vertical vein. Huang and Lu [28] conducted a series of compression tests on granitic buildings. The compressive strength varied with the specimen dimensions. Based on the experimental results, a reduction factor representing the porosity of sandstone was used to predict the UCS [29]. The statistical analysis results indicated that the regression formula provided an idealized prediction. Petrography-based models have been used to predict the uniaxial compressive strength of sandstone [30]. Petrographic parameters, such as packing density, concavo-convex-type grain contact, and quartz content, were applied to the empirical expression of the compressive strength. An imperialist competitive algorithm with an artificial neural network was used to predict the UCS of sandstone [31]. The reliability of the proposed model was demonstrated in terms of the correlation coefficient. An artificial neural network approach was used to develop an empirical expression of the UCS for building stones [32]. Mechanical parameters such as ultrasonic pulse velocity, Schmidt hammer hardness, and Shore hardness were considered in the expression. To estimate the UCS of a rock, Wang and Aladejare [33] developed a method that can select the most appropriate mode for a specific rock site. Artificial techniques such as machine learning have been employed to estimate the compressive strength of brittle materials [34].
The UCS is an important parameter in the load-bearing computation of thin sandstone components in buildings; however, limited experimental studies have been published in the literature. To obtain a reliable sandstone UCS model, four groups of sandstone were quarried with various dimensions. Uniaxial compressive tests were performed using a fatigue machine. The damage behavior and compressive strength were determined based on the failure mode and stress–strain diagrams. A representative stress–strain diagram was regressed based on the experimental results. The correlations among the porosity, elastic modulus, and UCS were analyzed. The size effect was elaborated according to the experimental data in this study and the literature. This study is beneficial for the engineering application of sandstone in buildings as a construction material.
2. Specimens and Methodology
2.1. Sandstone Specimens
The mineral and chemical compositions of sandstone are determined by the deposition conditions and the origin of the deposited material. Three primary minerals, namely quartz, plagioclase, and feldspar, constituted more than 70% of the sandstone used in this study. Red sandstone was quarried from Zigong, Sichuan, China (Figure 1a). The mineral composition of the sandstone is presented in Table 1, where the primary minerals are quartz, plagioclase, and calcite. This differed from the composition of the sandstones drilled from Yao, Shanxi, China [35], although both are called red sandstones. A scanning electron microscopy (SEM) photomicrograph is shown in Figure 1b. The grain size of the minerals ranged from 0.002 to 0.33 mm, which is identical to that of the sandstone described in Huang and Xia [36]. As shown in Table 2 the density and porosity varied with location and burial depth. The porosity percentage was lower than that of any sandstone previously described in the literature. These differences resulted in variations in the mechanical properties of the sandstones. The chemical composition is listed in Table 3, where the primary chemical contents of the sandstone are O and Si.

Figure 1.
Red sandstone.

Table 1.
Mineral composition of red sandstone.
Table 2.
Porosity and density of sandstone.
Table 3.
Percentages of chemical composition.
There are several standard experimental methods for determining the compressive strength of brittle materials such as sandstone. Standard dimensions and loading protocols are required to obtain a reliable strength value for the material being tested. A stone cylinder is the typical specimen geometry, whereas the dimensions of the cylinder vary according to the code provisions of different countries. For example, in the European code [42], the suggested dimensions are length (L) = 70 mm and diameter (D) = 70 mm, whereas they are L = 100 mm and D = 50 mm in the Chinese code [43]. These standard dimensions are reasonable for the strength evaluation of large-dimension stone used in building structures. However, owing to the size effect on compressive strength [44], the experimental strength may not be applicable to thin stone elements, such as building cladding, flooring, and tiles. Therefore, four groups of sandstone cylinders were fabricated with different L and D values (Table 4). The L/D ratio was determined to be 0.5, except for that of the standard cylinder. The sandstone cylinders were manufactured by a well-known stone-product company. They were cut from the same source stone and ground to the dimensions listed in Table 4. The shape deviation was closely correlated with the UCS [45]. Accordingly, the flatness tolerance at the two ends was 0.01 mm, which was in agreement with the code provisions in ASTM [46,47] and the International Society for Rock Mechanics Method (ISRM) [48]. The complete set of specimens is illustrated in Figure 2.
Table 4.
Geometry and number of specimens.
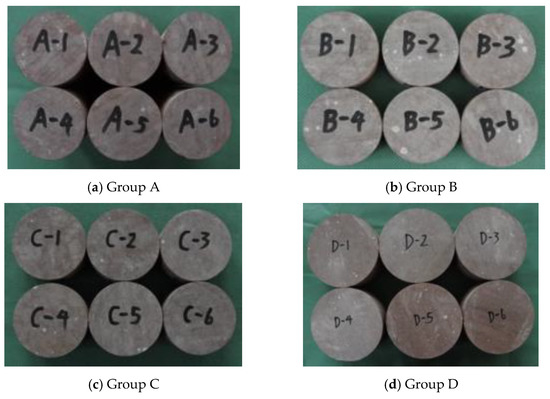
Figure 2.
Test specimens.
2.2. Test Method
Because of the limitations of loading facilities for uniaxial compressive tests, post-peak stress–strain diagrams of brittle materials are difficult to obtain experimentally. To solve this issue, Hudson and Crouch [49] developed a circumferential control method to conveniently obtain the post-peak branch of the diagram. Okubo and Nishimatsu [50] developed a linear combination of the force and displacement control methods. This method is widely used in uniaxial compressive tests of brittle materials [51]. The lateral deformation is measured using a pantograph attached to a central ring surrounding the cylinder [39]. The configuration of these tests is complicated, and only experienced researchers can successfully complete them [52]. Owing to the rapid development of testing facilities, the MTS-793 fatigue-testing machine is now able to obtain the post-peak branch of stress–strain diagrams without the complex configuration mentioned above.
In this study, an MTS-793 fatigue-testing machine with a peak loading capacity of 2500 kN was employed in the uniaxial compression tests (Figure 3). Displacement control was allowed at a cyclic loading rate of 0.01–20 Hz. The compressive strength and damage behavior of natural stone are affected by the control mode during the loading process [53]. Experimental studies have proven that the mechanical behavior closely correlates with the loading rate [54,55]. To obtain complete stress–strain diagrams, particularly the post-peak branch, the fatigue machine was operated with a displacement-control mode at a rate of 0.001 mm/s and an MTS system data acquisition frequency of 50 Hz. Thus, the crack initiation and development process could be induced, and the damage behavior of the sandstone could be fully demonstrated. The specimens were placed in an oven for drying for 48 h at a temperature of 60 ± 2 °C before being placed on the platform of the fatigue machine. The presence of frictional force on the ends of the cylinder influences the stress–strain diagram and peak load [56]. Accordingly, to reduce the negative effect of the frictional force, two layers of lubricant, namely Teflon and grease, were placed at the two ends of the cylinder. Prior to applying the predefined stable loading rate, a preload of 4.5 kN was applied to the cylinder in advance such that close contact between the platens and the two ends of the cylinder was achieved.
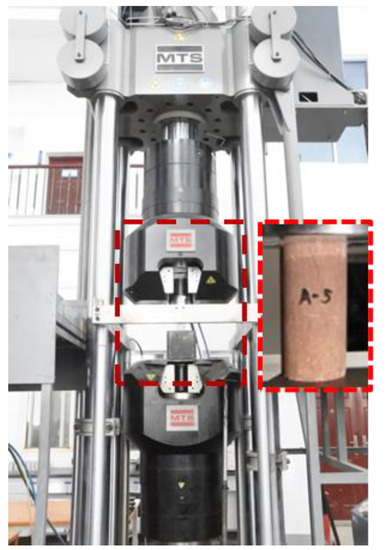
Figure 3.
Fatigue machine and cylinder.
3. Results and Discussion
3.1. Failure Mode
Brittle tensile fracture is the dominant failure mode in brittle materials under uniaxial compressive loading [57,58]. The fracture progress of each specimen was carefully monitored throughout the loading process. For group A sandstone, hairline cracks appeared at a loading ratio (applied load divided by the corresponding peak load) of 90%. Small fragments close to the top end were generated, which fell off the cylinder. Subsequently, vertical cracks appeared and propagated from the ends to the middle of the specimen, accompanied by a slight noise at a loading ratio of approximately 95%. At the peak load, a sudden fracture failure appeared when visible cracks ran across the specimen vertically, accompanied by a loud noise. Columnar vertical fracture [59] was the representative failure pattern, and no cones were generated in the cylinders of the four groups (Figure 4a,e,f,g). Meanwhile, diagonal fracture failure (Figure 4b–d) was observed in the sandstone cylinder owing to its different mineral contents [60].
For the group B sandstone, visible hairline cracks appeared at the ends of the cylinder at a loading ratio of 75%. The propagation of the cracks from the ends to the middle of the cylinder was observed, accompanied by a slight noise up to a loading ratio of 95%. Increasing the load led to the circumferential detachment of the small fragments until the complete failure of the specimen (Figure 4e). For the thin sandstone of group C, the fracture behavior was different from those of groups A and D, but identical to that of group B. Hairline cracks appeared at the ends of the cylinder at a loading ratio of 50%. Crack propagation mainly developed at a loading ratio of 85–90%, accompanied by the detachment of small fragments. Circumferential detachment and sudden fracture failure occurred at the end of the test (Figure 4f). For the group D sandstone, hairline cracks appeared at a loading ratio of 85%. The crack propagation behavior was identical to that of groups B and C. At the end of the test, the detachment of the fragments (Figure 4g) was larger and more apparent than those in groups B and C.
The axial splitting that appeared in the cylinders was caused by the interaction of the specimen with the loading platen and friction at the ends of the specimen [61]. For the thin specimens, the end effects could easily penetrate the height of the specimen. Consequently, more cylindrical shells were progressively created, such that the detachment of the fragment occurred. The detachment of the cylindrical thin shells was caused by the internal axial and radial pressures of the specimen. This damage mode frequently appeared in the thin specimens (e.g., L/D = 0.5), such as those of groups B–D (Figure 4h–j). An identical failure pattern (Figure 4) was observed in thin sandstones with L/D ≤ 0.5 [61].
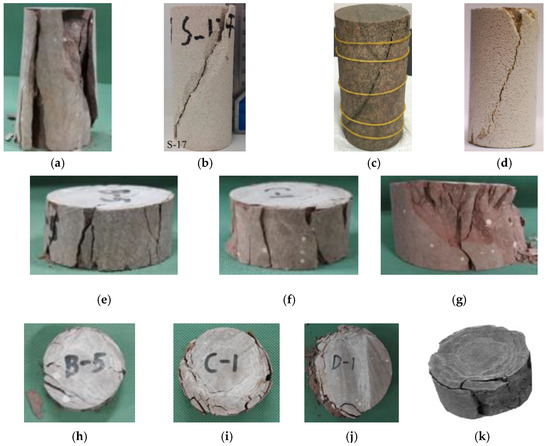
Figure 4.
Failure patterns of sandstone. (a) Group A. (b) Vaneghi et al. [60]. (c) Li et al. [35]. (d) Wasantha et al. [62]. (e) Group B. (f) Group C. (g) Group D. (h) Cylindrical fracture of group B. (i) Cylindrical fracture of group C. (j) Cylindrical fracture of group D. (k) Fakhimi and Hemami [61].
3.2. Stress–Strain Diagram
3.2.1. Experimental Diagram
Stress–strain diagrams characterize the mechanical properties of various materials. The experimental stress–strain diagrams are shown in Figure 5a–d, wherein the post-peak strain-softening branch was successfully obtained [63]. For cylinders with standard dimensions (group A, Figure 5a), the experimental strength was 70.0 82.0 N/mm2. The profiles of each diagram converged, indicating that stable experimental results were obtained. The peak stress and strain were larger for the cylinders of groups B and D than those of group A (Figure 5b,c), whereas the profiles of the diagrams were more scattered than those of group A. For the largest thin cylinder (group D), the strain-softening branch was the least apparent among the four groups of cylinders (Figure 5d). The mean stress–strain diagrams of all the specimens are shown in Figure 5e. Generally, the peak stress and strain increased with decreasing cylinder height (L). This is a characteristic of the size effect of brittle materials [44]. This property was demonstrated in the uniaxial compressive tests of sandstone conducted by Fakhimi and Hemami [61] and will be elaborated in detail in below. The stress–strain diagram for a sandstone cylinder with standard dimensions (group A) is shown in Figure 5f, along with those from the literature. None of these diagrams follow the same trend because of the variable mineral content. The diagram of the standard cylinders in Li et al. [35] followed the same path as the prismatic specimens in Ludovico-Marques et al. [39] until failure at 85.6 N/mm2. A similar trend was demonstrated in the diagrams of Wasantha et al. [62] and in the present study.
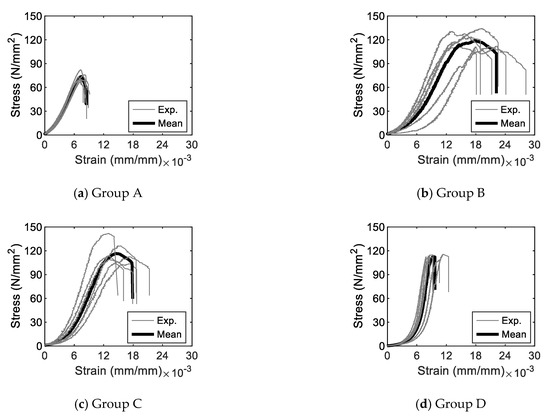
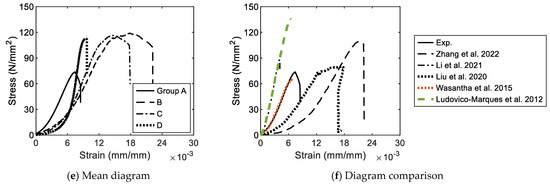
Figure 5.
Stress–strain diagrams.
3.2.2. Evolution of Diagram
The progressive failure of sandstone is demonstrated in stress–strain diagrams through five stages with specific threshold values (e.g., Figure 6). These were determined using the procedures suggested by Martin and Chandler [64], Hoek and Martin [57], and Vasconcelos et al. [51]. The crack closure threshold fcc corresponds to the closing of most microcracks in the cylinder under uniaxial loading. The axial stiffness increased nonlinearly. The crack initiation threshold fci corresponds to the appearance of new microcracks. The propagation of cracks extended parallel to the applied load. The crack damage threshold fcd corresponds to unstable crack growth. The correlation between the crack length and stress disappeared, whereas the crack growth velocity increased [65]. Consequently, crack propagation continued unstably until peak stress, fucs, and then developed abruptly until complete failure at the post-peak branch of the diagram. The loading stage between the crack initiation and crack damage thresholds is frequently employed to compute the elastic modulus of the material of interest.
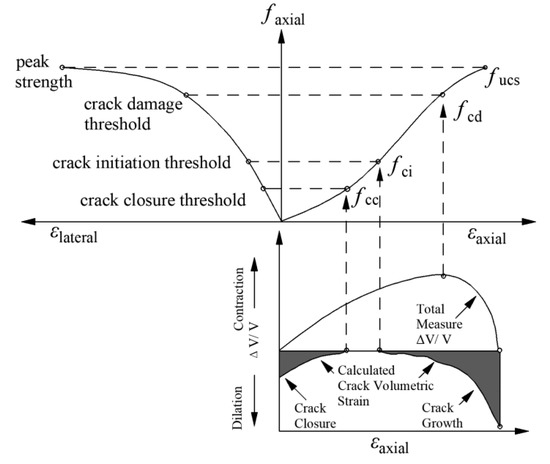
Figure 6.
Progressive failure of brittle material (adapted from [28]).
The threshold stress for each stage was determined, as shown in Figure 7. The crack closure stress was the smallest for cylinders with standard dimensions in group A (Figure 7a). However, it was almost identical for groups B, C, and D. Similar trends were observed for the other three threshold stresses (Figure 7b–d). The magnitude of the mean threshold strain was smallest for the cylinders in group A (Figure 7a). For the cylinders in groups B, C, and D, the magnitude of the mean threshold strain generally increased with increasing cylinder diameter (Figure 7b–d). The threshold stresses of cylinders with standard dimensions are shown in Figure 7e. The experimental threshold stresses of group A were approximately in agreement with those reported by Cai et al. [52], whereas they were smaller than those reported by Li et al. [35] in the magnitude of both the stress and the strain. This was because of the varying mineral contents of the sandstone.
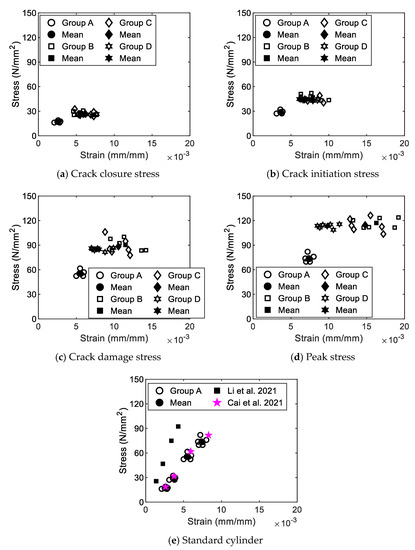
Figure 7.
Threshold stresses.
3.2.3. Diagram Regression
In fact, the specific geometry of the stress–strain diagram of each cylinder is not demonstrated by the mean diagram in Figure 5e. The magnitude of the strain corresponding to the peak stress in each diagram was not the same among the experimental diagrams of the cylinders belonging to the same group. To solve this issue, for cylinders from the same group, the stress–strain diagrams were normalized by the peak stress and the corresponding strain. Thus, representative diagrams for the cylinders were acquired that can be conveniently compared with each other in accordance with their geometries [28]. The normalized diagrams are shown in Figure 8a–d, where the diagrams converge more than those without normalization (Figure 8a–d), particularly for the specimens of groups A, C, and D (Figure 8a,c,d).
To obtain a representative diagram for the specimens of each group, the normalized diagrams were regressed using MATLAB [66]. The resulting diagram consisted of two expressions divided by the crack damage stress (Equation (1)). The vertical drop-down portion after the complete failure of each specimen was not considered, because it does not demonstrate any meaningful mechanical properties of the material. The parameters and errors of the regression diagrams are listed in Table 5 and Table 6. The regressed diagrams of the specimens of groups A, B, and C (whose geometries were all distinguished from that of group D) somewhat converged with each other (Figure 8e). The post-peak portion was negligible because the corresponding experimental diagrams were very short. The normalized diagrams for the specimens with standard dimensions (D = 50 mm, L = 100 mm) are shown in Figure 8f. Except for the diagrams from Liu et al. [67] and Zhang et al. [68], the other diagrams converged with each other, indicating that the stress evaluations were identical.
where f is the compressive stress, fucs is the peak compressive stress, ε is the compressive strain, and εucs is the strain corresponding to the peak stress fucs.
Table 5.
Parameters of the regressed diagrams.
Table 6.
Errors of the regressed diagrams.
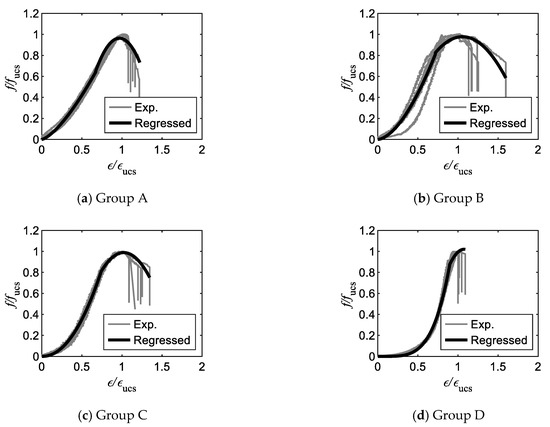
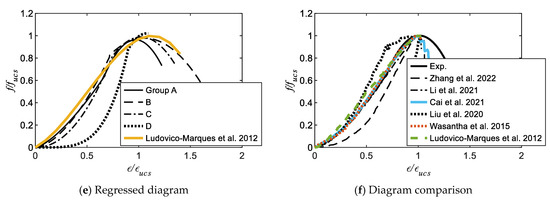
Figure 8.
Diagram regression.
Based on the experimental results, a cubic polynomial expression was employed to represent the pre-peak behavior of the sandstone [39]:
Equation (2) appears more compact than Equation (1). The resulting normalized stress–strain diagram is shown in Figure 8e. Equation (2) provided a reasonable prediction of the cylinders of group B, particularly in the post-peak region, and a worse prediction of those of group D. The error appeared in the two portions before and after the crack damage threshold, indicating the suitability of dividing the regressed stress–strain diagrams into two portions (Equation (1)).
3.3. Compressive Strength and Porosity
The experimental strengths of all the cylinders are shown in Figure 9. The mean strength of the cylinders with L/D = 0.5 was identical for groups B, C, and D. The standard deviations of the four groups of cylinders were 4.5, 6.1, 8.3, and 2.7 N/mm2, indicating the stability of the experimental data. For the cylinders with standard dimensions (group A), the experimental compressive strength was lower than those of the fine- and coarse-grained sandstone [69], which were as large as 158.97 N/mm2 and 131.70 N/mm2, respectively. The physical uniaxial compressive test is an immediate experimental approach; however, it is expensive in terms of time and labor. An empirical prediction expression with acceptable reliability is necessary, particularly for on-site engineers. Predictors such as porosity, Schmidt hammer rebound number, P wave velocity, and point load strength index are frequently employed in expression regression [70]. Among these, porosity is the simplest parameter and is elaborated herein.
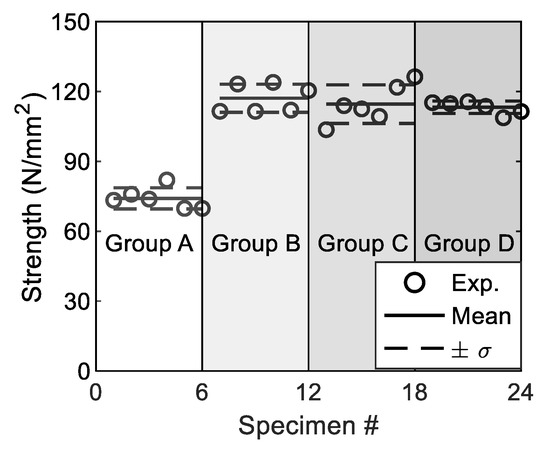
Figure 9.
Compressive strength (note: σ denotes the standard deviation).
As a porous material, the compressive strength of sandstone correlates significantly with its porosity. In practice, sandstone is generally assumed to be elastic and is more likely to be a poroelastic medium. Porosity is accordingly determined as a variable to statistically develop empirical expressions [71]. The empirical expressions for the UCS of sandstone are listed in Table 7, where the linear, exponential, and logarithmic modes are employed in the regressions. Using the porosity of sandstone in the current study (2.38%), the predicted UCS was computed, as shown in Figure 10. The experimental strengths of sandstone with standard dimensions (group A) are plotted in Figure 10. None of these empirical expressions achieved an accurate prediction of the UCS of sandstone. The predicted strengths computed using the expressions in Qi et al. [16], Sabatakakis et al. [72], and Palchik [73] were closer to the experimental strengths than the other expressions in Table 7. Except for the expression in Yasar et al. [74], the magnitude of the UCS generally decreased with increasing porosity, which is in agreement with the trend summarized by Mishra and Basu [38]. The expression in Plumb [75] provided the least reliable prediction, which was higher than those of the other expressions. The porosity ratios of the sandstones in Baud et al. [76] and Shi et al. [77] were higher than those in the current study. The magnitude of the UCS generally decreases with porosity; this trend is apparent for sandstones, as reported by Baud et al. [76]. For the specimens with non-standard dimensions in groups B, C, and D, the corresponding UCS values were close to those provided by the expressions of Tugrul [78], Kilic and Teymen [79], and Mishra and Basu [38].
Table 7.
Empirical expressions for UCS prediction based on porosity.
Table 7.
Empirical expressions for UCS prediction based on porosity.
| References | Expression | R2 | # Samples |
|---|---|---|---|
| Qi et al., 2022 [16] | fucs = 110.5 exp(−0.08 n) | 0.72 | 17 sandstone samples |
| Farrokhrouz and Asef, 2017 [29] | fucs = −3.03 n + 107.1 | 0.28 | 299 sandstone samples |
| Mishra and Basu, 2013 [38] | fucs = −55.7 ln(n) + 172.1 | 0.88 | 20 sandstone samples |
| Ludovico-Marques et al., 2012 [39] | fucs = 206.7 exp(−0.129 n) | — | 13 sandstone samples |
| Yasar et al., 2010 [74] | fucs = −2.27 n2 + 33.88 n − 16.30 | 0.96 | 11 sandstone samples |
| Kılıç and Teymen, 2008 [79] | fucs = 147.16 exp(−0.0835 n) | 0.93 | 19 rock types, including sandstone |
| Sabatakakis et al., 2008 [72] | fucs = 123.0 exp(−0.12 n) | 0.63 | 95 sandstone samples |
| Tugrul, 2004 [78] | fucs = 195.0 exp(−0.21 n) | 0.79 | 16 different sedimentary rocks, including sandstone |
| Chatterjee and Mukhopadhyay, 2002 [80] | fucs = 64.23 exp(−0.085 n) | 0.92 | 22 samples, including sandstone |
| Palchik, 1999 [73] | fucs = 74.4 exp(−0.04 n) | 0.78 | 16 samples of soft brittle porous sandstone |
| Plumb, 1994 [75] | fucs = 357 (1 − 0.028 n)2 | — | 784 sedimentary rocks, mainly sandstone and shale |
Note: ‘—’ denotes no data available; the porosity n is in %.
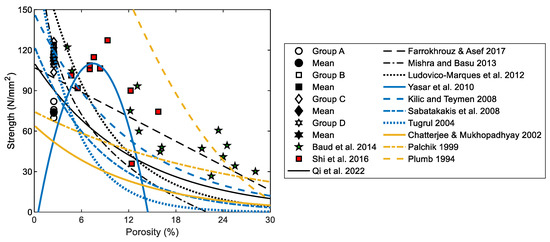
Figure 10.
Compressive strength predictions.
3.4. Elastic Modulus and Porosity
The elastic modulus is an important parameter for computing the load-bearing capacity of structural components made of building stones. As suggested in ASTM D7012-14 [46], the elastic moduli of the cylinders were computed in accordance with the third stage of the stress–strain diagram (Figure 6). The mean experimental elastic moduli of the four specimen groups were 14.5, 11.9, 14.9, and 43.6 N/mm2 (Figure 11). These results differed from the experimental results of Mousavi et al. [18], Chatterjee et al. [81], and Rice-Birchall et al. [20]. The porosity ratio is supposedly one of the factors that causes variation in the modulus. Empirical expressions were developed to represent the correlations between the elastic modulus and porosity of stone materials (Table 8). These expressions are plotted in Figure 12, along with the experimental results of the current study and those in the literature. The porosity ratios of sandstone in Chatterjee et al. [81] are close to those of the standard cylinder (group A) in the current study. The resulting magnitude was identical when the porosity ratio was the same, that is, 2.48%. In contrast, the porosity ratios obtained by Bedford et al. [82], Mousave et al. [18], and Wong et al. [83] were larger. The elastic modulus of the sandstones reported by Bedford et al. [82] was the smallest with the largest porosity ratio. For the empirical expressions in Table 8, only the expression provided by Salah et al. [84] was developed based on the experimental results for sandstone. The remaining expressions were based on other rock materials. However, the expression of Salah et al. [84] provided the least accurate prediction of the modulus for the sandstone in the current study, whereas it was relatively close to the experimental data reported by Wong et al. [83]. For the cylinders of groups A, B, and C, the expressions suggested by Lashkaripour [85] and Leite and Ferland [86] achieved reasonable predictions compared to the other expressions. However, for the cylinders of group D, the expressions suggested by Armaghani et al. [31] provided a reasonable prediction. Extensive experimental studies are required to obtain a reliable expression for predicting the elastic modulus of sandstone. Note that the expressions of the elastic moduli of the rock materials other than sandstone (e.g., gypsum, artificial rock, and even claystone and mudstone) listed in Table 8 are only for comparison. The expressions for other rocks than the sandstone cannot simply be applied to describe the elastic modulus of the sandstone in this study.
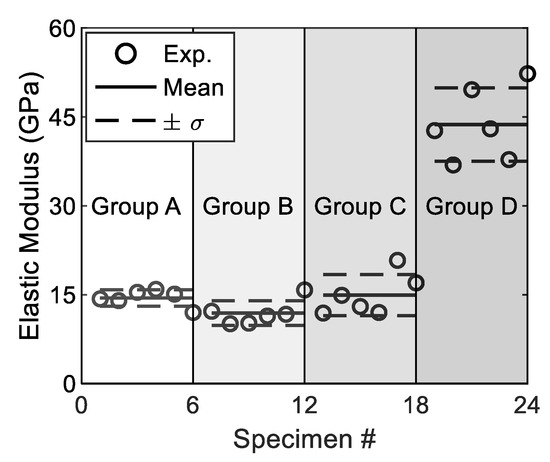
Figure 11.
Elastic moduli (note: σ denotes standard deviation).
Table 8.
Empirical expressions for elastic modulus prediction.
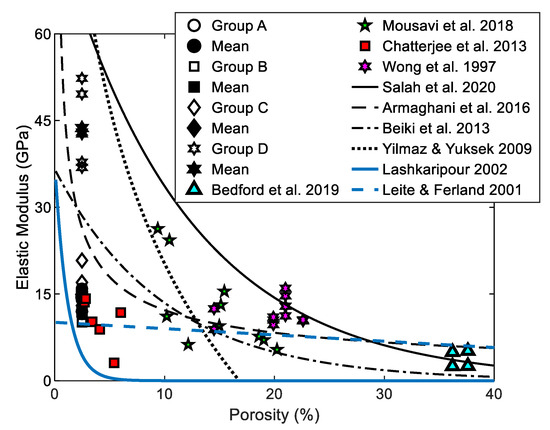
Figure 12.
Elastic modulus and prediction.
3.5. Compressive Strength and Elastic Modulus
The correlation between compressive strength (UCS, fucs) and elastic modulus (E) is well recognized in the civil engineering community. The ratio of E to UCS is an engineering parameter for the structural design of buildings and underground constructions [39,89]. Based on the experimental data, empirical expressions representing the correlation between UCS and E were developed through direct regression analysis. However, the quantification of the correlation between these two parameters was challenging because of the insufficient experimental results [71]. The suggested expressions (e.g., Somnze et al. [90]) provide an alternative for practicing engineers and researchers in academic and engineering fields. The experimental data and regressed expressions are shown in Figure 13 and Table 9. For the cylinders in the current study, there was no clear trend between E and UCS. For standard cylinders in a group, the corresponding magnitudes of UCS and E were close to the experimental values reported by Heidari et al. [91], Malik and Rashid [92], Cai et al. [52], and Qi et al. [16]. Some of the experimental data in Hawkins and McConnell [93] and Zhang et al. [68] were close to those of groups B and C. Most of the experimental data were enveloped by the expressions provided by Farrokhrouz and Asef [29] and Bradford et al. [94]. The expression suggested by Chatterjee and Mukhopdahyay [80] provided the worst prediction of all the experimental data. The expressions suggested by Sabatakakis et al. [72] and Bell and Lindsay [41] were close to the experimental data of group D. Although the main rock samples in Lacy [95] were not sandstone, the suggested expression generally provided a lower limit of the UCS, whereas the expression of Farrokhrouz and Asef [29] generally provided an upper limit. The magnitude of the UCS generally increases with the elastic modulus, as reported by Mousavi et al. [18], Hawkins and McConnell [93], Heidari et al. [91], and Chatterjee et al. [81]. Most of the experimental data range from 8.0 to 20 GPa in modulus and from 40 to 100 N/mm2 in UCS.
Table 9.
Correlations between UCS and elastic modulus.
Table 9.
Correlations between UCS and elastic modulus.
| References | Expression | Units | R2 | # Sample |
|---|---|---|---|---|
| Farrokhrouz snd Asef, 2017 [29] | fucs = 5.49 E0.423/φ0.546 | fucs in MPa, E in GPa, φ is the porosity ratio | 0.8272 | 299 samples of sandstone |
| Sabatakakis et al. 2008 [72] | fucs = E/303 | fucs and E in MPa | 0.65 | 36 samples of sandstone |
| Chatterjee and Mukhopdahyay, 2002 [80] | fucs = (E − 0.17)/0.73 | fucs in MPa, E in GPa | 0.93 | 8 samples, including sandstone |
| Bell and Lindsay, 1999 [41] | fucs = (E − 5.6)/0.358 | fucs in MPa, E in GPa | — | 27 samples of sandstone |
| Bradford et al., 1998 [94] | fucs= 2.28 + 4.1089 E | E in GPa | — | Sandstone sample |
| Lacy, 1997 [95] | fucs = 0.2787 E2 + 2.4582 E | fucs in kpsi and E in Mpsi | 0.84 | 36 samples of weakly consolidated rocks |
Note: 1.0 MPa = 1.0 N/mm2, 1.0 GPa = 1 × 10³ Mpa.
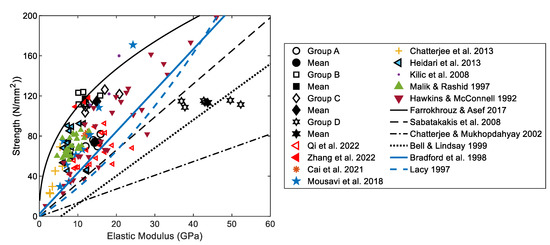
Figure 13.
UCS and elastic modulus.
4. Size Effect
4.1. Size Effect on Diameter
The experimental results for sandstone demonstrated that the compressive strength of the smaller specimens was higher than that of the larger specimens, although the geometry of the specimens was identical. This phenomenon is known as the size effect [44,96,97]. Pioneering work on this topic dates back a century, when Gonnermann [98] investigated the UCS of concrete cylinders with an L/D of 2.0. Optimized dimensions for the cylinder, namely 6 × 12 in., were determined to obtain consistent results in the compressive tests. Several microscopic mechanisms trigger the compression fracture of quasi-brittle materials such as concrete [99,100] and sandstone. The appearance of microcracks can be explained by considering the mechanisms, whereas global compression failure cannot [101]. Theoretical and experimental studies were reported by Bažant and Planas [102] and Van Mier [103], respectively. These have become the foundation of the size effect theory. For rock materials, experimental studies have been conducted by Hoek and Brown [104] to understand the correlated size effect. Size effect models have been developed based on experimental and analytical investigations.
The naturally existing microcracks in a material are important for its mechanical strength [105]. For specimens with identical geometry but different sizes, the larger specimens have a higher probability of failure because they contain more flaws than the smaller specimens. The resulting size law is described by the following statistical model:
where is the strength of the representative specimen, is the material strength, Vr is the volume of one element in the specimen, and V is the volume of the specimen. A general expression is provided in logarithmic form as follows:
where m is the material constant. When m =1, Equation (4) yields Equation (3). For cylinders with the same geometry and L/D ratio, the V/Vr ratio can be substituted by the ratio of the corresponding diameters. Hoek and Brown [106] provided an expression representing the correlation of the crack damage stress (fcd) between a sample with an arbitrary diameter and a sample with a diameter of 50 mm (fc50), given by
Yoshinaka et al. [107] found that the magnitude of the UCS (fc50) is determined by the rock type. Accordingly, the parameter k was used to indicate the rock types, given by
where k = 0.1–0.3 for rocks with fc50 = 25–250 N/mm2.
Inspired by Griffith’s fracture theory [108], Bažant [97] first developed the size effect law using fracture energy to quantify crack growth and propagation. It is suitable for representing the size effect of brittle materials, such as concrete and rock, and is given by
where d0 is the maximum aggregate size of the concrete and the maximum grain size of the rock material; d is the characteristic sample size; ft is the strength of a sample with negligible size, which can be expressed in terms of the intrinsic strength, namely, the strength of the maximum grain (though it is almost impossible to experimentally obtain this parameter); is the nominal strength of the material; and B and λ are the dimensionless material constants.
In accordance with multifractality theory [109], Carpinteri et al. [107] proposed a multifractal scaling law [110], given by
where fc is the strength of a sample with infinite size and can be represented by the intrinsic strength of a large sample with an infinite diameter, and l is a material constant in units of length. In Equation (8), the magnitude of increases with decreasing d. This trend is demonstrated in Equations (4) and (7).
Suppose that the fracture surfaces of brittle materials, such as concrete and rock, exhibit fractal properties. Accordingly, the concept of fractals is employed, and the expression of the size effect law in Equation (7) is modified as follows [111]:
where df is the fractal dimension and σ0 is the strength of a sample with negligible size. If the materials have nonfractal properties, df = 1 and σ0 = Bft. Equation (9) is then changed to Equation (7). The experimental results of Hawkins [112] and Darlington and Ranjith [113] demonstrated that the size effect model developed by Hoek and Brown [104] did not closely correspond to small specimens. Accordingly, Masoumi et al. [114] proposed a unified size effect law based on uniaxial compression and point-load tests of other sandstone sedimentary rock types in Hawkins [112], which is given by
Specifically, Equation (10) combines Equations (7) and (9). Therefore, the ascending branch of Equation (9) and the descending branch of Equation (7) are employed to represent the size effect.
To demonstrate the effect of the diameter on the compressive strength of sandstone, the normalized strength was employed. This is represented by the experimental strength of the cylinders with variable diameters divided by that of cylinders with a standard diameter (50 mm). The experimental data and expressions for the size effect laws are shown in Figure 14. The expression suggested by Hoek and Brown [106] accurately predicted the strength of group A. Kong et al. [69] approximately predicted the strength of sandstone. Their expression was actually formed from the bottom and top boundaries of the expressions of Yoshinaka et al. [107]. Using the sandstone parameters from Masoumi et al. [114] and Hawkins [112], the expressions of the unified size effect law are plotted in Figure 14. The experimental strength of the current study was underestimated by Masoumi et al. [114] and Hawkins [112] using the parameters of Hollington sandstone. However, it was overestimated by Hawkins [112] using the parameters of Pilton sandstone. The experimental strength of sandstone in Masoumi et al. [114] was close to that of Hawkins [112] using the parameters of Pennant sandstone. It should be noted that L/D = 0.5 for the thin sandstone in the current study (groups B, C, and D). This may have resulted in the misprediction of strength using the size effect laws, as demonstrated in Figure 14. Consequently, the size effect on L/D should be considered.
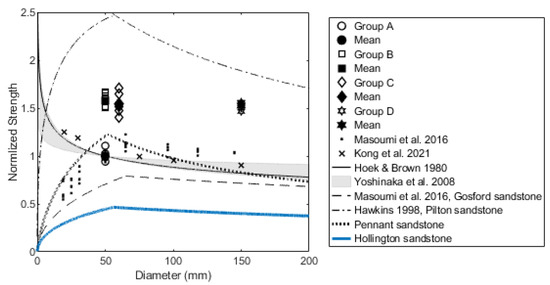
Figure 14.
Size effect on diameter.
4.2. Size Effect on Length/Diameter Ratio (L/D)
To obtain a constant UCS of a rock material, the ratio of L/D is specified in the ASTM and ISRM standards [47,48], with respective values of 2.0, −2.5, and 2.5–3.0. Experimental studies on rock materials have indicated that the magnitude of the UCS closely correlates to the L/D ratio [49,115]. Based on the power of the external load and internal energy loss rate [116], the effects of the internal friction angle (φ), cohesion (c), and shear failure surface on the rock strength are expressed as follows:
The parameters in Equation (11) should be obtained from specific experimental and analytical studies on the rocks of interest. Considering the mechanical properties of sandstone in [116] (Table 10), the theoretical expressions of the UCS with varied L/D ratios were computed and are shown in Figure 15. Similarly to the size effect on the diameter, the UCS was normalized by the mean UCS of the standard cylinder (fifth column of Table 10). The UCS at L/D = 2.0 was actually the bottom limit for the variable L/D. Using only the parameters of batch 5, namely the medium-coarse sandstone, the UCS of the sandstone of group A was relatively well predicted, whereas the sandstones with L/D = 0.5 were not. When computing the UCS using Equation (11), a negative UCS appeared when the L/D ratio was less than the limit value, as listed in Table 10. This proved that Equation (11) worked well when L/D > the limit values.
Table 10.
Mechanical properties of sandstone (after [116]).

Figure 15.
Normalized strength with theoretical expression.
Empirical expressions are developed based on extensive experimental results. Obert and Duvall [117] provided a linear expression for L/D, given by
where fc1 is the UCS of the rock with L/D = 1.0. The fc value was obtained for cylinders with 1/3 < L/D < 2.0. ASTM C170 [47] suggested a formula to convert the UCS (fn) of cylinders with non-standard dimensions (L/D < 2.0) into that of the standard, that is, L/D = 2.0, given by
An identical expression was proposed by Kahraman and Alber [118] to convert UCS values into those of cylinders with L/D = 2.0:
Tuncay and Hasancebi [119] proposed an empirical expression for cylinders with L/D < 2.5 based on experimental results, given by
The experimental data and empirical expressions are presented in Figure 16. The linear expression of Tuncay and Hasancebi [119] worked relatively well at L/D > 0.5, whereas the error increased at L/D < 0.5. The experimental data of the current study and John [120] generally followed the profiles suggested by ASTM C170 [47] and Kahraman and Alber [118]. These were more accurate than those of Obert and Duvall [117]. The experimental data were regressed using an expression identical to that of Equations (12)–(14), given by
The resulting parameters of the regressed expression are listed in Table 11. The regression profile of the expression is plotted in Figure 16. It can be seen that the regressed expression agreed better with the experimental data than the other expressions mentioned above.
Table 11.
Parameters of the regressed expression.
Table 11.
Parameters of the regressed expression.
| a | b | RSS | R2 |
|---|---|---|---|
| 0.835 | 0.361 | 0.142 | 0.936 |
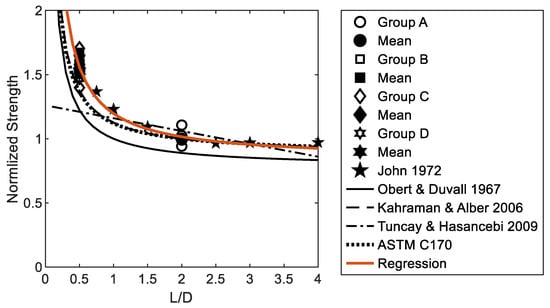
Figure 16.
Normalized strength with empirical expressions.
5. Conclusions
Four groups of cylinders were manufactured in a factory to investigate the uniaxial compressive behavior of red sandstone. Uniaxial compression tests were performed to determine the compressive behavior and failure mode of the specimens. The conclusions were as follows:
- (1)
- A columnar vertical fracture was the dominant failure pattern. The stress–strain diagrams of group A converged more than those of the other groups, demonstrating stable mechanical behavior in the standard specimen. The geometry of the diagrams varied among the four groups. The critical strain generally increased with a decrease in the height of the cylinder, whereas the compressive strength exhibited an inverse trend.
- (2)
- The magnitudes of the crack closure stresses of the thin cylinders in groups B, C, and D were identical. A similar trend was observed for the crack initiation stress, crack damage stress, and peak stress. To obtain a representative stress–strain diagram for each group of cylinders, the experimental diagrams were normalized with the peak stress and corresponding critical strain. The normalized stress–strain diagram demonstrated the specific loading behavior of each group of cylinders. To obtain a representative mathematical expression of the diagram, a formula consisting of two parabolas divided by the crack initiation stress was employed for regression.
- (3)
- The correlations between porosity, UCS, and elastic modulus were evaluated based on empirical expressions. The expressions suggested by Lashkaripour [85] and Leite and Ferland [86] provided a reasonably accurate prediction of the UCS of thin cylinders with respect to porosity. However, none of the expressions in the literature achieved a good prediction of the elastic modulus.
- (4)
- The normalized strength was employed to evaluate the size effect on the diameter and L/D ratio of the cylinders. The UCS of group A with standard dimensions was correctly predicted using the expression suggested by Hoek and Brown [106]. However, for thin cylinders, none of the expressions in the literature provided a good prediction. A new expression in terms of L/D was proposed based on the regression analysis of the experimental results.
Future works will be focused on the effects of moisture, weathering, and temperature on the compressive behavior of sandstone.
Author Contributions
B.H., Conceptualization, Methodology, Writing—Original draft, Investigation, Formal analysis. Y.X., Data curation, Investigation. G.Z., Conceptualization, Reviewing. All authors have read and agreed to the published version of the manuscript.
Funding
China National Science and Technology Major Project (grant #2018YFC0705701) and the China National Science Foundation (grant #51608381).
Data Availability Statement
Data on this study are available from the first author on proper request.
Acknowledgments
Xiaofeng Ma carried out the experimental works.
Conflicts of Interest
The authors declare no conflict of interest.
References
- John, M. The Influence of Length to Diameter Ratio on Rock Properties in Uniaxial Compression: A Contribution to Standardization in Rock Mechanics Testing; Report South African CSIR No ME1083/5; Council for Scientific and Industrial Research: Pretoria, South Africa, 1972. [Google Scholar]
- Baeza, J.R.; Compán, V.; Castillo, G.; Cámara, M.; Pachón, P. Determining static elastic modulus of weak sandstone in Andalusian historical constructions from non-destructive tests: San Cristóbal’s stone. J. Build. Eng. 2022, 57, 104864. [Google Scholar]
- Bellopede, R.; Zichella, L.; Marini, P. Stone roofing in the Aosta Valley, Italy: Technical properties and durability of traditional Lithotypes. J. Build. Eng. 2021, 35, 102068. [Google Scholar]
- Laila, L.R.; Gurupatham, B.G.A.; Roy, K.; Lim, J.B.P. Effect of super absorbent polymer on microstructural and mechanical properties of concrete blends using granite pulver. Struct. Concr. 2021, 22 (Suppl. S1), E898–E915. [Google Scholar]
- Hatır, M.E.; Ince, I.; Korkanç, M. Intelligent detection of deterioration in cultural stone heritage. J. Build. Eng. 2021, 44, 102690. [Google Scholar]
- Ferreira, C.; Dias, I.S.; Silva, A.; de Brito, J.; Flores-Colen, I. Criteria for selection of cladding systems based on their maintainability. J. Build. Eng. 2021, 39, 102260. [Google Scholar]
- Baek, J.-W.; Kang, S.-M.; Park, H.-G. Direct shear test and cyclic loading test for seismic capacity of dimension stone panel cladding with dowel pin connection. J. Build. Eng. 2021, 38, 102205. [Google Scholar]
- López, A.; Pozo-Antonio, J.; Moreno, A.; Rivas, T.; Pereira, D.; Ramil, A. Femtosecond laser texturing as a tool to increase the hydrophobicity of ornamental stone: The influence of lithology and texture. J. Build. Eng. 2022, 51, 104176. [Google Scholar]
- Pozo-Antonio, J.S.; Dionísio, A.; Vázquez, C. Effects of staining agents on an ornamental granite. J. Build. Eng. 2021, 44, 102700. [Google Scholar]
- Giaretton, M.; Dizhur, D.; da Porto, F.; Ingham, J. Constituent material properties of New Zealand unreinforced stone masonry buildings. J. Build. Eng. 2015, 4, 75–85. [Google Scholar]
- Zhang, Y.; Ta, X.; Qin, S. Effect of heat treatment on physico-mechanical behaviour of a natural building stone: Laizhou dolomite marble. J. Build. Eng. 2022, 47, 103885. [Google Scholar]
- Mousavi, S.H.; Silva, A.; de Brito, J.; Ekhlassi, A.; Hosseini, S.B. Influence of Design on the Service Life of Indirectly Fastened Natural Stone Cladding. J. Perform. Constr. Facil. 2019, 33, 04019021. [Google Scholar]
- Pimienta, L.; Fortin, J.; Guéguen, Y. Investigation of elastic weakening in limestone and sandstone samples from moisture adsorption. Geophys. J. Int. 2014, 199, 335–347. [Google Scholar]
- Elert, K.; Baños, E.G.; Velasco, A.I.; Bel-Anzué, P. Traditional roofing with sandstone slabs: Implications for the safeguarding of vernacular architecture. J. Build. Eng. 2021, 33, 101857. [Google Scholar]
- Feng, X.; Jimenez, R. Bayesian prediction of elastic modulus of intact rocks using their uniaxial compressive strength. Eng. Geol. 2014, 173, 32–40. [Google Scholar]
- Deere, D.U. Rock Mechanics in Engineering Practice; Wiley & Sons: London, UK, 1968. [Google Scholar]
- Qi, Y.; Ju, Y.; Yu, K.; Meng, S.; Qiao, P. The effect of grain size, porosity and mineralogy on the compressive strength of tight sandstones: A case study from the eastern Ordos Basin, China. J. Pet. Sci. Eng. 2022, 208, 109461. [Google Scholar]
- Garrido, M.E.; Petnga, F.B.; Martínez-Ibáñez, V.; Serón, J.B.; Hidalgo-Signes, C.; Tomás, R. Predicting the Uniaxial Compressive Strength of a Limestone Exposed to High Temperatures by Point Load and Leeb Rebound Hardness Testing. Rock Mech. Rock Eng. 2022, 55, 1–17. [Google Scholar]
- Mousavi, E.; Cheshomi, A.; Ashtari, M. Estimating elasticity modulus and uniaxial compressive strength of sandstone using indentation test. J. Pet. Sci. Eng. 2018, 169, 157–166. [Google Scholar]
- Lu, J.; Yin, G.; Zhang, D.; Gao, H.; Li, C.; Li, M. True triaxial strength and failure characteristics of cubic coal and sandstone under different loading paths. Int. J. Rock Mech. Min. Sci. 2020, 135, 104439. [Google Scholar]
- Rice-Birchall, E.; Faulkner, D.R.; Bedford, J.D. The manufacture, mechanical properties, and microstructural analysis of synthetic quartz-cemented sandstones. Int. J. Rock Mech. Min. Sci. 2021, 146, 104869. [Google Scholar]
- Potysz, A.; Bartz, W. Bioweathering of minerals and dissolution assessment by experimental simulations—Implications for sandstone rocks: A review. Constr. Build. Mater. 2022, 316, 125862. [Google Scholar]
- Wang, W.; Liu, T.G.; Shao, J.F. Effects of Acid Solution on the Mechanical Behavior of Sandstone. J. Mater. Civ. Eng. 2016, 28, 04015089. [Google Scholar]
- Pires, V.; Rosa, L.G.; Amaral, P.M.; Dionísio, A.; Simão, J.A.R. Experimental Studies of the Effect of SO2 on the Mechanical Properties of Selected Cladding Natural Stones. J. Mater. Civ. Eng. 2022, 34, 04022084. [Google Scholar]
- Eberhardt, E.; Stead, D.; Stimpson, B. Quantifying progressive pre-peak brittle fracture damage in rock during uniaxial compression. Int. J. Rock Mech. Min. Sci. 1999, 36, 361–380. [Google Scholar]
- Peng, K.; Liu, Z.; Zou, Q.; Zhang, Z.; Zhou, J. Static and Dynamic Mechanical Properties of Granite from Various Burial Depths. Rock Mech. Rock Eng. 2019, 52, 3545–3566. [Google Scholar]
- Lanaro, F.; Sato, T.; Nakama, S. Depth Variability of Compressive Strength Test Results of Toki Granite from Shobasama and Mizunami Construction Sites, Japan. Rock Mech. Rock Eng. 2009, 42, 611–629. [Google Scholar]
- Liu, J.-b.; Zhang, Z.-j.; Li, B. Microscopic & macroscopic characterizations of Beijing marble as a building material for UNESCO heritage sites: New insights into physico-mechanical property estimation and weathering resistance. Constr. Build. Mater. 2019, 225, 510–525. [Google Scholar]
- Huang, B.; Lu, W. Experimental investigation of the uniaxial compressive behavior of thin building granite. Constr. Build. Mater. 2021, 267, 120967. [Google Scholar]
- Farrokhrouz, M.; Asef, M.R. Experimental investigation for predicting compressive strength of sandstone. J. Nat. Gas Sci. Eng. 2017, 43, 222–229. [Google Scholar]
- Zorlu, K.; Gokceoglu, C.; Ocakoglu, F.; Nefeslioglu, H.A.; Acikalin, S. Prediction of uniaxial compressive strength of sandstones using petrography-based models. Eng. Geol. 2008, 96, 141–158. [Google Scholar]
- Armaghani, D.J.; Amin, M.F.M.; Yagiz, S.; Faradonbeh, R.S.; Abdullah, R.A. Prediction of the uniaxial compressive strength of sandstone using various modeling techniques. Int. J. Rock Mech. Min. Sci. 2016, 85, 174–186. [Google Scholar]
- Yurdakul, M.; Akdas, H. Modeling uniaxial compressive strength of building stones using non-destructive test results as neural networks input parameters. Constr. Build. Mater. 2013, 47, 1010–1019. [Google Scholar]
- Wang, Y.; Aladejare, A.E. Selection of site-specific regression model for characterization of uniaxial compressive strength of rock. Int. J. Rock Mech. Min. Sci. 2015, 75, 73–81. [Google Scholar]
- Çalışkan, A.; Demirhan, S.; Tekin, R. Comparison of different machine learning methods for estimating compressive strength of mortars. Constr. Build. Mater. 2022, 335, 127490. [Google Scholar]
- Li, S.; Wu, Y.; Huo, R.; Song, Z.; Fujii, Y.; Shen, Y. Mechanical Properties of Acid-corroded Sandstone Under Uniaxial Compression. Rock Mech. Rock Eng. 2021, 54, 289–302. [Google Scholar]
- Huang, S.; Xia, K. Effect of heat-treatment on the dynamic compressive strength of Longyou sandstone. Eng. Geol. 2015, 191, 1–7. [Google Scholar]
- Liu, B.; Sun, Y.; Wang, J.; Zhang, G. Characteristic Analysis of Crack Initiation and Crack Damage Stress of Sandstone and Mudstone under Low-Temperature Condition. J. Cold Reg. Eng. 2020, 34, 04020020. [Google Scholar]
- Mishra, D.A.; Basu, A. Estimation of uniaxial compressive strength of rock materials by index tests using regression analysis and fuzzy inference system. Eng. Geol. 2013, 160, 54–68. [Google Scholar]
- Ludovico-Marques, M.; Chastre, C.; Vasconcelos, G. Modelling the compressive mechanical behaviour of granite and sandstone historical building stones. Constr. Build. Mater. 2012, 28, 372–381. [Google Scholar]
- Shakoor, A.; Barefield, E.H. Relationship between Unconfined Compressive Strength and Degree of Saturation for Selected Sandstones. Environ. Eng. Geosci. 2009, 15, 29–40. [Google Scholar]
- Bell, F.G.; Lindsay, P. The petrographic and geomechanical properties of some sandstones from the Newspaper Member of the Natal Group near Durban, South Africa. Eng. Geol. 1999, 53, 57–81. [Google Scholar]
- BS EN 1926:2006; Natural Stone Test Methods—Determination of Uniaxial Compressive Strength. European Committee for Standardization: Brussels, Belgium, 2006.
- GB/T 50266-2013; CEC, Standard for Tests Method of Engineering Rock Masses. China Plan Press: Beijing, China, 2013.
- Bieniawski, Z.T. The effect of specimen size on compressive strength of coal. Int. J. Rock Mech. Min. Sci. Geomech. Abstr. 1968, 5, 325–335. [Google Scholar]
- Cvitanović, N.Š.; Nikolić, M.; Ibrahimbegović, A. Influence of specimen shape deviations on uniaxial compressive strength of limestone and similar rocks. Int. J. Rock Mech. Min. Sci. 2015, 80, 357–372. [Google Scholar]
- ASTM D7012-14e1; Standard Test Methods for Compressive Strength and Elastic Moduli of Intact Rock Core Specimens under Varying States of Stress and Temperatures. ASTM International: West Conshohocken, PA, USA, 2014.
- ASTM C170/C170M-17; Standard Test Method for Compressive Strength of Dimension Stone. ASTM International: West Conshohocken, PA, USA, 2017.
- Fairhurst, C.E.; Hudson, J.A. Draft ISRM suggested method for the complete stress-strain curve for intact rock in uniaxial compression. Int. J. Rock Mech. Min. Sci. 1999, 36, 279–289. [Google Scholar]
- Hudson, J.A.; Crouch, S.L.; Fairhurst, C. Soft, stiff and servo-controlled testing machines: A review with reference to rock failure. Eng. Geol. 1972, 6, 155–189. [Google Scholar]
- Okubo, S.; Nishimatsu, Y. Uniaxial compression testing using a linear combination of stress and strain as the control variable. Int. J. Rock Mech. Min. Sci. Geomech. Abstr. 1985, 22, 323–330. [Google Scholar]
- Vasconcelos, G.; Lourenço, P.B.; Alves, C.A.S.; Pamplona, J. Compressive Behavior of Granite: Experimental Approach. J. Mater. Civ. Eng. 2009, 21, 502–511. [Google Scholar]
- Cai, M.; Hou, P.Y.; Zhang, X.W.; Feng, X.T. Post-peak Stress–Strain curves of brittle hard rocks under axial-strain-controlled loading. Int. J. Rock Mech. Min. Sci. 2021, 147, 104921. [Google Scholar]
- Wong, L.N.Y.; Meng, F.; Guo, T.; Shi, X. The Role of Load Control Modes in Determination of Mechanical Properties of Granite. Rock Mech. Rock Eng. 2020, 53, 539–552. [Google Scholar]
- Ray, S.K.; Sarkar, M.; Singh, T.N. Effect of cyclic loading and strain rate on the mechanical behaviour of sandstone. Int. J. Rock Mech. Min. Sci. 1999, 36, 543–549. [Google Scholar]
- Song, Z.; Konietzky, H.; Wu, Y.; Du, K.; Cai, X. Mechanical behaviour of medium-grained sandstones exposed to differential cyclic loading with distinct loading and unloading rates. J. Rock Mech. Geotech. Eng. 2022, in press. [Google Scholar] [CrossRef]
- Tschegg, E.K.; Elser, M.; Stanzl-Tschegg, S.E. Biaxial fracture tests on concrete—Development and experience. Cem. Concr. Compos. 1995, 17, 57–75. [Google Scholar]
- Hoek, E.; Martin, C.D. Fracture initiation and propagation in intact rock—A review. J. Rock Mech. Geotech. Eng. 2014, 6, 287–300. [Google Scholar]
- Basu, A.; Mishra, D.A.; Roychowdhury, K. Rock failure modes under uniaxial compression, Brazilian, and point load tests. Bull. Eng. Geol. Environ. 2013, 72, 457–475. [Google Scholar]
- ASTM C39/C39M-14; Standard Test Method for Compressive Strength of Cylindrical Concrete Specimens. ASTM International: West Conshohocken, PA, USA, 2014.
- Vaneghi, R.G.; Thoeni, K.; Dyskin, A.V.; Sharifzadeh, M.; Sarmadivaleh, M. Strength and Damage Response of Sandstone and Granodiorite under Different Loading Conditions of Multistage Uniaxial Cyclic Compression. Int. J. Geomech. 2020, 20, 04020159. [Google Scholar]
- Fakhimi, A.; Hemami, B. Axial splitting of rocks under uniaxial compression. Int. J. Rock Mech. Min. Sci. 2015, 79, 124–134. [Google Scholar]
- Wasantha, P.L.P.; Ranjith, P.G.; Zhao, J.; Shao, S.S.; Permata, G. Strain Rate Effect on the Mechanical Behaviour of Sandstones with Different Grain Sizes. Rock Mech. Rock Eng. 2015, 48, 1883–1895. [Google Scholar]
- Jansen, D.C.; Shah, S.P. Effect of Length on Compressive Strain Softening of Concrete. J. Eng. Mech. 1997, 123, 25–35. [Google Scholar]
- Martin, C.D.; Chandler, N.A. The progressive fracture of Lac du Bonnet granite. Int. J. Rock Mech. Min. Sci. Geomech. Abstr. 1994, 31, 643–659. [Google Scholar]
- Bieniawski, Z.T. Mechanism of brittle fracture of rock: Part I—Theory of the fracture process. Int. J. Rock Mech. Min. Sci. Geomech. Abstr. 1967, 4, 395–406. [Google Scholar]
- MathWorks. Matlab (2012a); The MathWorks, Inc.: Natick, MA, USA, 2012. [Google Scholar]
- Liu, Z.; Yao, Q.; Kong, B.; Yin, J. Macro-micro mechanical properties of building sandstone under different thermal damage conditions and thermal stability evaluation using acoustic emission technology. Constr. Build. Mater. 2020, 246, 118485. [Google Scholar]
- Zhang, H.; Lu, K.; Zhang, W.; Li, D.; Yang, G. Quantification and acoustic emission characteristics of sandstone damage evolution under dry–wet cycles. J. Build. Eng. 2022, 48, 103996. [Google Scholar]
- Kong, F.; Xue, Y.; Qiu, D.; Gong, H.; Ning, Z. Effect of grain size or anisotropy on the correlation between uniaxial compressive strength and Schmidt hammer test for building stones. Constr. Build. Mater. 2021, 299, 123941. [Google Scholar]
- Plumb, R.A. Influence of composition and texture on failure properties of clastic rocks. In Proceedings of the Europec SPE/ISRM Rock Mechanics in Petroleum Engineering Conference, Delft, The Netherlands, 29–31 August 1994. [Google Scholar]
- Kılıç, A.; Teymen, A. Determination of mechanical properties of rocks using simple methods. Bull. Eng. Geol. Environ. 2008, 67, 237. [Google Scholar]
- Chatterjee, R.; Mukhopadhyay, M. Petrophysical and geomechanical properties of rocks from the oilfields of the Krishna-Godavari and Cauvery Basins, India. Bull. Eng. Geol. Environ. 2002, 61, 169–178. [Google Scholar]
- Ghasemi, E.; Kalhori, H.; Bagherpour, R.; Yagiz, S. Model tree approach for predicting uniaxial compressive strength and Young’s modulus of carbonate rocks. Bull. Eng. Geol. Environ. 2018, 77, 331–343. [Google Scholar]
- Palchik, V. Influence of Porosity and Elastic Modulus on Uniaxial Compressive Strength in Soft Brittle Porous Sandstones. Rock Mech. Rock Eng. 1999, 32, 303–309. [Google Scholar]
- Wang, Y.; Aladejare, A.E. Bayesian characterization of correlation between uniaxial compressive strength and Young’s modulus of rock. Int. J. Rock Mech. Min. Sci. 2016, 85, 10–19. [Google Scholar]
- Baud, P.; Wong, T.-f.; Zhu, W. Effects of porosity and crack density on the compressive strength of rocks. Int. J. Rock Mech. Min. Sci. 2014, 67, 202–211. [Google Scholar]
- Sabatakakis, N.; Koukis, G.; Tsiambaos, G.; Papanakli, S. Index properties and strength variation controlled by microstructure for sedimentary rocks. Eng. Geol. 2008, 97, 80–90. [Google Scholar]
- Yaşar, E.; Ranjith, P.G.; Perera, M.S.A. Physico-mechanical behaviour of southeastern Melbourne sedimentary rocks. Int. J. Rock Mech. Min. Sci. 2010, 47, 481–487. [Google Scholar]
- Tuǧrul, A. The effect of weathering on pore geometry and compressive strength of selected rock types from Turkey. Eng. Geol. 2004, 75, 215–227. [Google Scholar]
- Shi, X.; Cai, W.; Meng, Y.; Li, G.; Wen, K.; Zhang, Y. Weakening laws of rock uniaxial compressive strength with consideration of water content and rock porosity. Arab. J. Geosci. 2016, 9, 369. [Google Scholar]
- Chatterjee, R.; Manoharan, K.; Mukhopadhyay, M. Petrophysical and mechanical properties of cretaceous sedimentary rocks of Cauvery basin, Eastern continental Margin of India. J. Indian Geophys. Union 2013, 17, 349–359. [Google Scholar]
- Bedford, J.D.; Faulkner, D.R.; Wheeler, J.; Leclère, H. High-Resolution Mapping of Yield Curve Shape and Evolution for High-Porosity Sandstone. J. Geophys. Res. Solid Earth 2019, 124, 5450–5468. [Google Scholar]
- Wong, T.-F.; David, C.; Zhu, W. The transition from brittle faulting to cataclastic flow in porous sandstones: Mechanical deformation. J. Geophys. Res. Solid Earth 1997, 102, 3009–3025. [Google Scholar]
- Salah, M.K.; Alqudah, M.; Monzer, A.J.; David, C. Petrophysical and acoustic characteristics of Jurassic and Cretaceous rocks from Central Lebanon. Carbonates Evaporites 2020, 35, 12. [Google Scholar]
- Lashkaripour, G.R. Predicting mechanical properties of mudrock from index parameters. Bull. Eng. Geol. Environ. 2002, 61, 73–77. [Google Scholar]
- Leite, M.H.; Ferland, F. Determination of unconfined compressive strength and Young’s modulus of porous materials by indentation tests. Eng. Geol. 2001, 59, 267–280. [Google Scholar]
- Beiki, M.; Majdi, A.; Givshad, A.D. Application of genetic programming to predict the uniaxial compressive strength and elastic modulus of carbonate rocks. Int. J. Rock Mech. Min. Sci. 2013, 63, 159–169. [Google Scholar]
- Yilmaz, I.; Yuksek, G. Prediction of the strength and elasticity modulus of gypsum using multiple regression, ANN, and ANFIS models. Int. J. Rock Mech. Min. Sci. 2009, 46, 803–810. [Google Scholar]
- Hoek, E.; Diederichs, M.S. Empirical estimation of rock mass modulus. Int. J. Rock Mech. Min. Sci. 2006, 43, 203–215. [Google Scholar]
- Sonmez, H.; Tuncay, E.; Gokceoglu, C. Models to predict the uniaxial compressive strength and the Modulus of elasticity for Ankara Agglomerate. Int. J. Rock Mech. Min. Sci. 2004, 41, 717–729. [Google Scholar]
- Heidari, M.; Momeni, A.A.; Rafiei, B.; Khodabakhsh, S.; Torabi-Kaveh, M. Relationship Between Petrographic Characteristics and the Engineering Properties of Jurassic Sandstones, Hamedan, Iran. Rock Mech. Rock Eng. 2013, 46, 1091–1101. [Google Scholar]
- Malik, M.H.; Rashid, S. Correlation of some engineering geological properties of the Murree formation at lower Topa (Murree district), Pakistan. Geol. Bull. Univ. Peshawar 1997, 30, 69–81. [Google Scholar]
- Hawkins, A.B.; McConnell, B.J. Sensitivity of sandstone strength and deformability to changes in moisture content. Q. J. Eng. Geol. Hydrogeol. 1992, 25, 115–130. [Google Scholar]
- Bradford, I.D.R.; Fuller, J.; Thompson, P.J.; Walsgrove, T.R. Benefits of Assessing the Solids Production Risk in a North Sea Reservoir using Elastoplastic Modelling. In Proceedings of the SPE/ISRM Rock Mechanics in Petroleum Engineering, Trondheim, Norway, 8–10 July 1998. [Google Scholar]
- Lacy, L.L. Dynamic Rock Mechanics Testing for Optimized Fracture Designs. In Proceedings of the SPE Annual Technical Conference and Exhibition, San Antonio, TX, USA, 5–8 October 1997. [Google Scholar]
- Pratt, H.R.; Black, A.D.; Brown, W.S.; Brace, W.F. The effect of speciment size on the mechanical properties of unjointed diorite. Int. J. Rock Mech. Min. Sci. Geomech. Abstr. 1972, 9, 513–516. [Google Scholar]
- Bažant, Z.P. Size Effect in Blunt Fracture: Concrete, Rock, Metal. J. Eng. Mech. 1984, 110, 518–535. [Google Scholar]
- Gonnermann, H.F. Effect of size and shape of test specimen on compressive strength of concrete. Proc. ASTM 1925, 25, 237–250. [Google Scholar]
- De la Fuente, A.; Aguado, A.; Molins, C.; Armengou, J. Innovations on components and testing for precast panels to be used in reinforced earth retaining walls. Constr. Build. Mater. 2011, 25, 2198–2205. [Google Scholar]
- Naeimi, N.; Moustafa, M.A. Compressive behavior and stress–strain relationships of confined and unconfined UHPC. Constr. Build. Mater. 2021, 272, 121844. [Google Scholar]
- Muciaccia, G.; Rosati, G.; di Luzio, G. Compressive failure and size effect in plain concrete cylindrical specimens. Constr. Build. Mater. 2017, 137, 185–194. [Google Scholar]
- Bažant, Z.P.; Planas, J. Fracture and Size Effect in Concrete and Other Quasibrittle Materials; CRC Press: London, UK, 1998. [Google Scholar]
- Mier, J.G.M. Fracture Processes of Concrete; CRC Press: Boca Raton, FL, USA, 1996. [Google Scholar]
- Hoek, E.; Brown, E.T. Practical estimates of rock mass strength. Int. J. Rock Mech. Min. Sci. 1997, 34, 1165–1186. [Google Scholar]
- Weibull, W. A statistical distribution of function of wide applicability. J. Appl. Mech. 1951, 18, 03112318. [Google Scholar]
- Hoek, E.; Brown, E.T. Underground Excavation in Rock; IMM: London, UK, 1980. [Google Scholar]
- Yoshinaka, R.; Osada, M.; Park, H.; Sasaki, T.; Sasaki, K. Practical determination of mechanical design parameters of intact rock considering scale effect. Eng. Geol. 2008, 96, 173–186. [Google Scholar]
- Griffith, A.A. The theory of rupture. In Proceedings of the 1st International Congress of Applied Mechanics, Delft, The Netherlands, 22–26 April 1924; pp. 55–63. [Google Scholar]
- Mandelbort, B.B. The Fractal Geometry of Nature; Freeman: San Francisco, CA, USA, 1982. [Google Scholar]
- Carpinteri, A.; Chiaia, B.; Ferro, G. Size effects on nominal tensile strength of concrete structures: Multifractality of material ligaments and dimensional transition from order to disorder. Mater. Struct. 1995, 28, 311. [Google Scholar]
- Bažant, Z.P. Scaling of quasibrittle fracture: Hypotheses of invasive and lacunar fractality, their critique and Weibull connection. Int. J. Fract. 1997, 83, 41. [Google Scholar]
- Hawkins, A.B. Aspects of rock strength. Bull. Eng. Geol. Environ. 1998, 57, 17–30. [Google Scholar]
- Darlington, W.J.; Ranjith, P.G.; Choi, S.K. The Effect of Specimen Size on Strength and Other Properties in Laboratory Testing of Rock and Rock-Like Cementitious Brittle Materials. Rock Mech. Rock Eng. 2011, 44, 513. [Google Scholar]
- Masoumi, H.; Saydam, S.; Hagan, P.C. Unified Size-Effect Law for Intact Rock. Int. J. Geomech. 2016, 16, 04015059. [Google Scholar]
- Mogi, K. The influence of the dimensions of specimens on the rock fracture strength of rocks. Bull. Earthq. Res. Inst. Tokyo Univ. 1962, 40, 175–185. [Google Scholar]
- Chen, J.; Yang, R.; Kang, Y. Influence of the Rock Length-to-Diameter Ratio and Failure Modes on Uniaxial Compression Strength. Geotech. Geol. Eng. 2020, 38, 2551–2557. [Google Scholar]
- Obert, L.; Duvall, W.I. Rock Mechanics and the Design of Structures in Rock; Wiley: London, UK, 1967. [Google Scholar]
- Kahraman, S.; Alber, M. Estimating unconfined compressive strength and elastic modulus of a fault breccia mixture of weak blocks and strong matrix. Int. J. Rock Mech. Min. Sci. 2006, 43, 1277–1287. [Google Scholar]
- Tuncay, E.; Hasancebi, N. The effect of length to diameter ratio of test specimens on the uniaxial compressive strength of rock. Bull. Eng. Geol. Environ. 2009, 68, 491. [Google Scholar]
Publisher’s Note: MDPI stays neutral with regard to jurisdictional claims in published maps and institutional affiliations. |
© 2022 by the authors. Licensee MDPI, Basel, Switzerland. This article is an open access article distributed under the terms and conditions of the Creative Commons Attribution (CC BY) license (https://creativecommons.org/licenses/by/4.0/).