1. Introduction
With the advent of the era of big data, increasingly rich data lays a solid foundation for urban research, indicating that multi-source data has become a trend in urban research [
1]. The property of manipulating large-scale data to conduct quantitative data analysis has surprisingly paved the way for research in urban development decision-making. Using big data to analyze visitors’ behavior with respect to spatial data has drawn attention to academic research on visitor perception. Big data sources such as Sina Weibo (one of the most important social media in China), drone aerial photography, Baidu (one of the most important search engines in China) POI, and tourist travel notes from different social media effectively make up for the shortage of traditional research data, providing new insights and techniques for tourism spatial research. On the other hand, some researchers pointed out that big data must be normalized and standardized during the process of defining jargon and classification, which helps to strip the data of the background context and story contained in it [
2,
3]. Thus, research institutes tend to use “small data” and “thick data” in quantitative research to interpret meaningful findings in small samples [
4,
5,
6]. The small data obtained from in-depth interviews with tourists, tourist cognitive maps [
7] and portable recorders [
8] allows researchers to deeply discuss visitor perceptions of tourist attractions. For example, the visitor cognitive maps could reflect people’s overall spatial impression of a tourist attraction.
The majority of the research finds that the cognitive component is the antecedent of the emotional component in tourists’ perception [
9,
10,
11]. Situational cognition theory concludes that cognition is an interactive status in the process of interaction between individuals and the environment [
12,
13], and visitor perception is a process based on the association between visitor and destination [
14,
15]. Contrasting spatial “cognition” with spatial “imagery”, Tao Wei proposed that spatial “imagery” refers to geospatial awareness results while spatial “cognition” emphasizes the formation process of spatial imagery [
16]. The interaction between visitors and tourist destinations not only occurs during the trip but also exists on a longer timeline. Trip preparations such as searching online, collecting social media information, looking through official tourism introductions or memorizing the travel process, organizing photos, and writing travel notes after trips constantly contribute to reconstructing the image perception of the tourist destination so as to form an integral individual memory. In addition, during the process, tourists’ cognition of the destinations develops, which reflects the process of tourists converting external information about the attraction into their internal consideration [
17].
The current challenges in tourist spatial cognition research through big data, regardless of whether “thick data” or “small data”, are listed as follows:
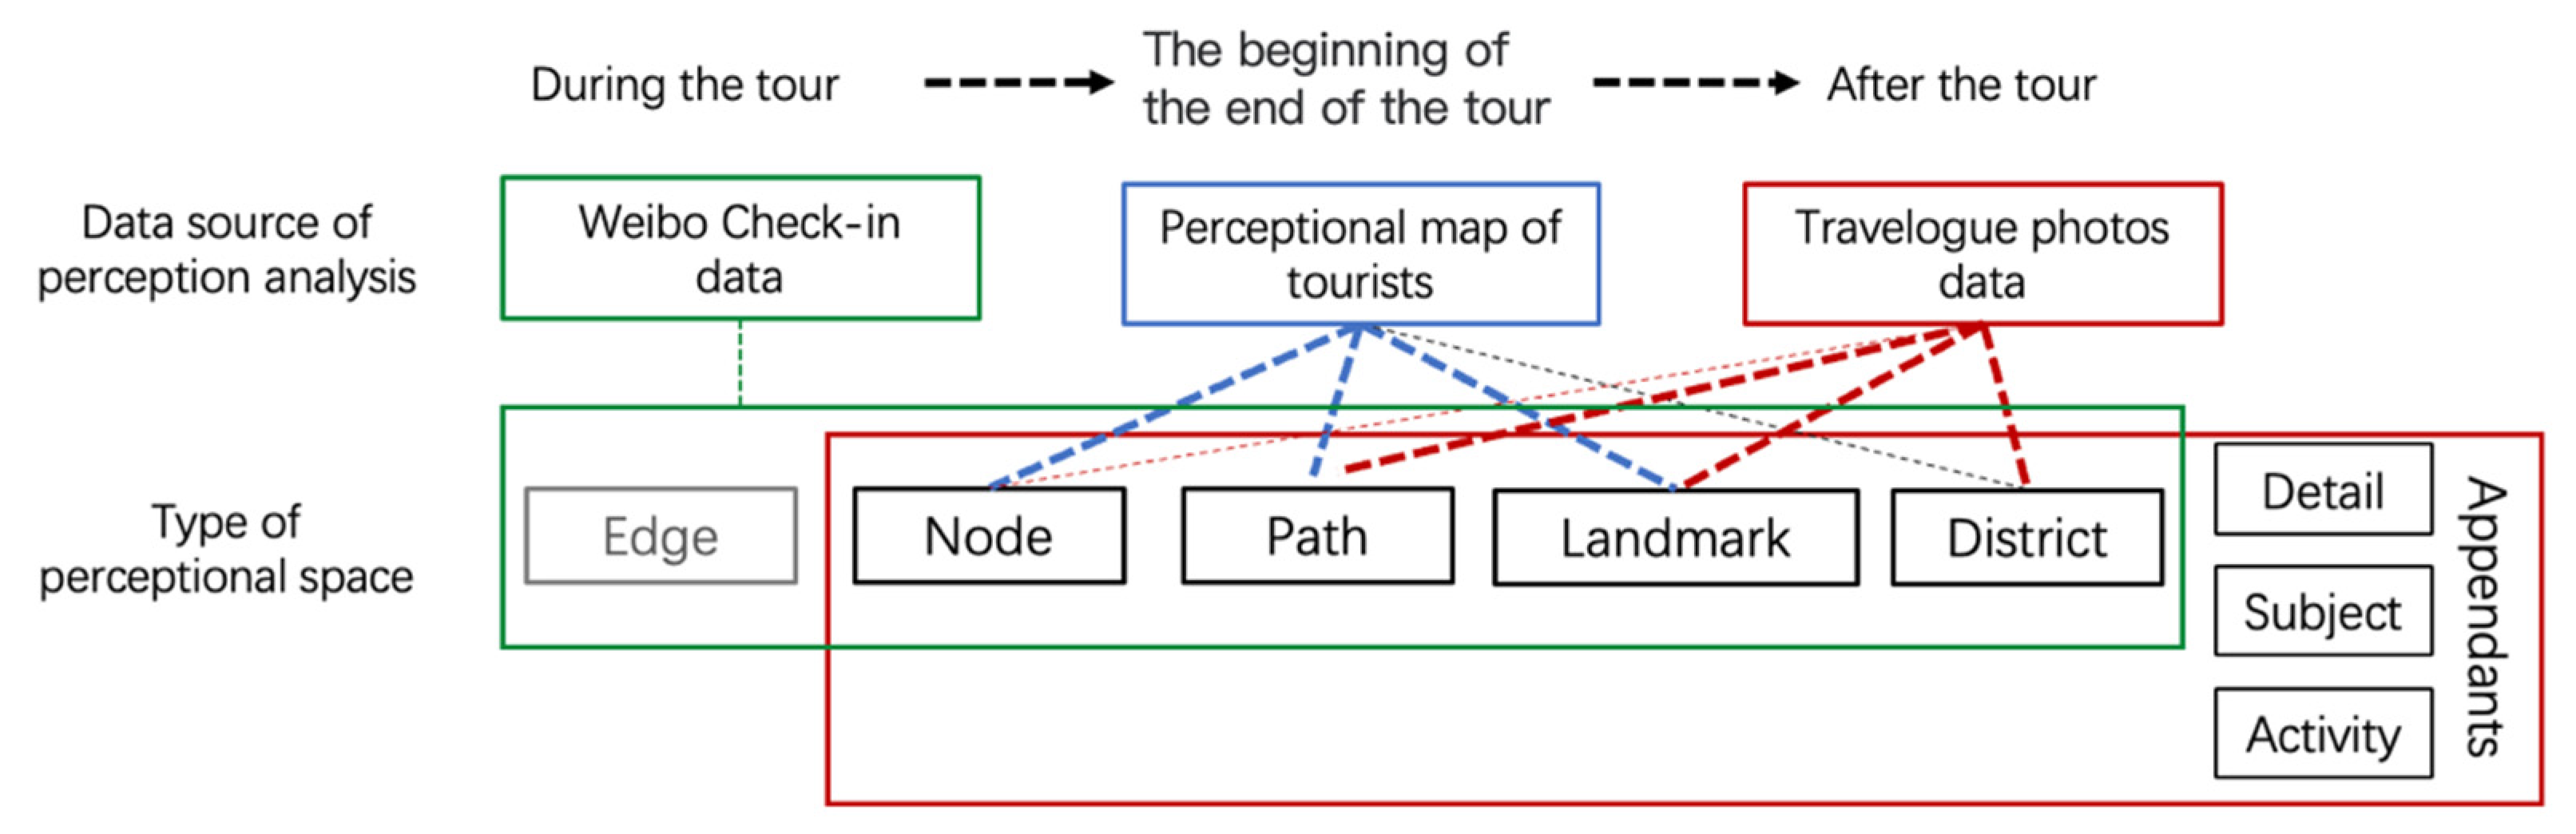
The time fragmentation of tourist recognition. The data sources analyzed are based on a specific time fragment and can partially reflect the incomplete development of the cognitive process while losing the long-term information that entails the global details. For example, Weibo check-in data reflects tourists’ initial attention to the destination on-site; tourist cognitive maps come from tourists who are still in the tourist destination or have finished their trip (at the exit of the tourist destination), while the travel notes of the tourism website are records of travel experience after leaving the tourist destination.
The spatial segmentation of tourist perception. Researchers use data mining techniques in big data sources such as tourist interviews and social media to analyze tourist spatial cognition of attraction as an approach to identify high-frequency tourism spaces recognized by tourists to represent the spatial recognition of tourism destinations [
16]. However, the cognitive spaces are independent from each other, causing the fragmentation of the image of the tourist destination.
Data from a single source lose the generality of representing other types of data, thus leading to a biased result. In particular, the younger generations dominate the usage of social media, and the spatial positioning of mobile phones is not accurate with a maximin deviation of 30 m. The aforementioned instances demonstrate that a small amount of tourist interview data cannot represent the overall tourist views.
Tourists’ perception of a historical town is more complex compared with other tourist destinations whose main attraction is a single resource because historical towns are the result of long-term settlement of human beings under the specific natural environment, historical period, and cultural background. The space of historical towns preserves the historical traces of life and modes of production in different time periods which represents traditional cultural heritage and cultural continuity. China started to develop historical towns in 1980s, and Zhouzhuang became the very first historical town [
18]. The tranquil, graceful environment and the earthy lifestyle of the local people deeply attracted the tourists who came there, and it brought huge profits to Zhouzhuang [
19]. After realizing tourism industry was a lucrative one, multiple historical towns started to open their gates to welcome in tourists, and the ancient town hence became popular all over the country or even the world. With the rise of tourism in historical towns, tourists have become an important component in historical towns’ development. The development of tourism has gradually integrated into the everyday living and production space of the historical town, some of which even completely transformed into tourism spaces. Although tourists brought wealth with them, they indeed brought threats to the ancient towns as well, at least in the historical and cultural aspects. The drastic change happened within decades; the old spaces are not ready to serve the new users which are tourists. Local people would never be willing to live in their old houses themselves but move out and rent their houses to merchants; some of them just became merchants [
20]. The historical towns are “over-commercialized” [
19], their purposes are almost serving the customers, and the aftermath of that purpose is the homogenization of the space and environment of historical towns. The importance of tourism development in historical towns will not be denied, but their historical and cultural protection is also vital, and, fortunately, the significance of protection in raising awareness of the historical legacy is priceless. Thus, to balance the protection of historical towns and tourism development, the challenge is to accurately identify tourists’ spatial perception of historical towns. This is an imperative task [
21] that has great research significance.
However, the attraction of historical towns for tourists lies in their cultural deposits and historical relics. Interpreting the attraction of the ancient town space is not only limited to understanding the number of tourists and the characteristics that attract them, but should also include analysis of the formation and change of tourists’ perception which can then further determine whether the tourism can continue. This research takes Fengjing Ancient Town in Shanghai as an example, attempts to analyze the characteristics of the space system and special elements of the ancient town under the perception of tourists, and explores how tourists’ perception of the ancient town developed from shallow space perception to the depth spatial memory and spread it on the internet. Then, suggestions about developing the ancient town will be provided according to the result. This study focuses on tourists’ spatial perception, meaning the tourists’ emotion is not the main object of analysis.
2. Research Methodology
To achieve the research goals and answer the research questions, this study adopts the method of selecting a representative case for empirical research. This study chooses a typical ancient historical and cultural town in China, Shanghai Fengjing Ancient Town, as a study site. Based on the Fengjing Ancient Town, studies are conducted for three phases of travel (during travel, at the end of the travel, and after the travel) to explore tourists’ spatial cognition. In terms of data collection and analysis, this study selected tourists’ Sina Weibo check-in data while visiting the ancient town, the memory map made by tourists at the end the tour, and the tourist photos and online travel blogs posted by tourists after the visits as data source. Meanwhile, comparing these data and data obtained from on-site study, systematic statistical analysis, GIS spatial analysis, and other analyses are conducted to investigate the tourists’ spatial cognition comprehensively.
2.1. Site Analysis
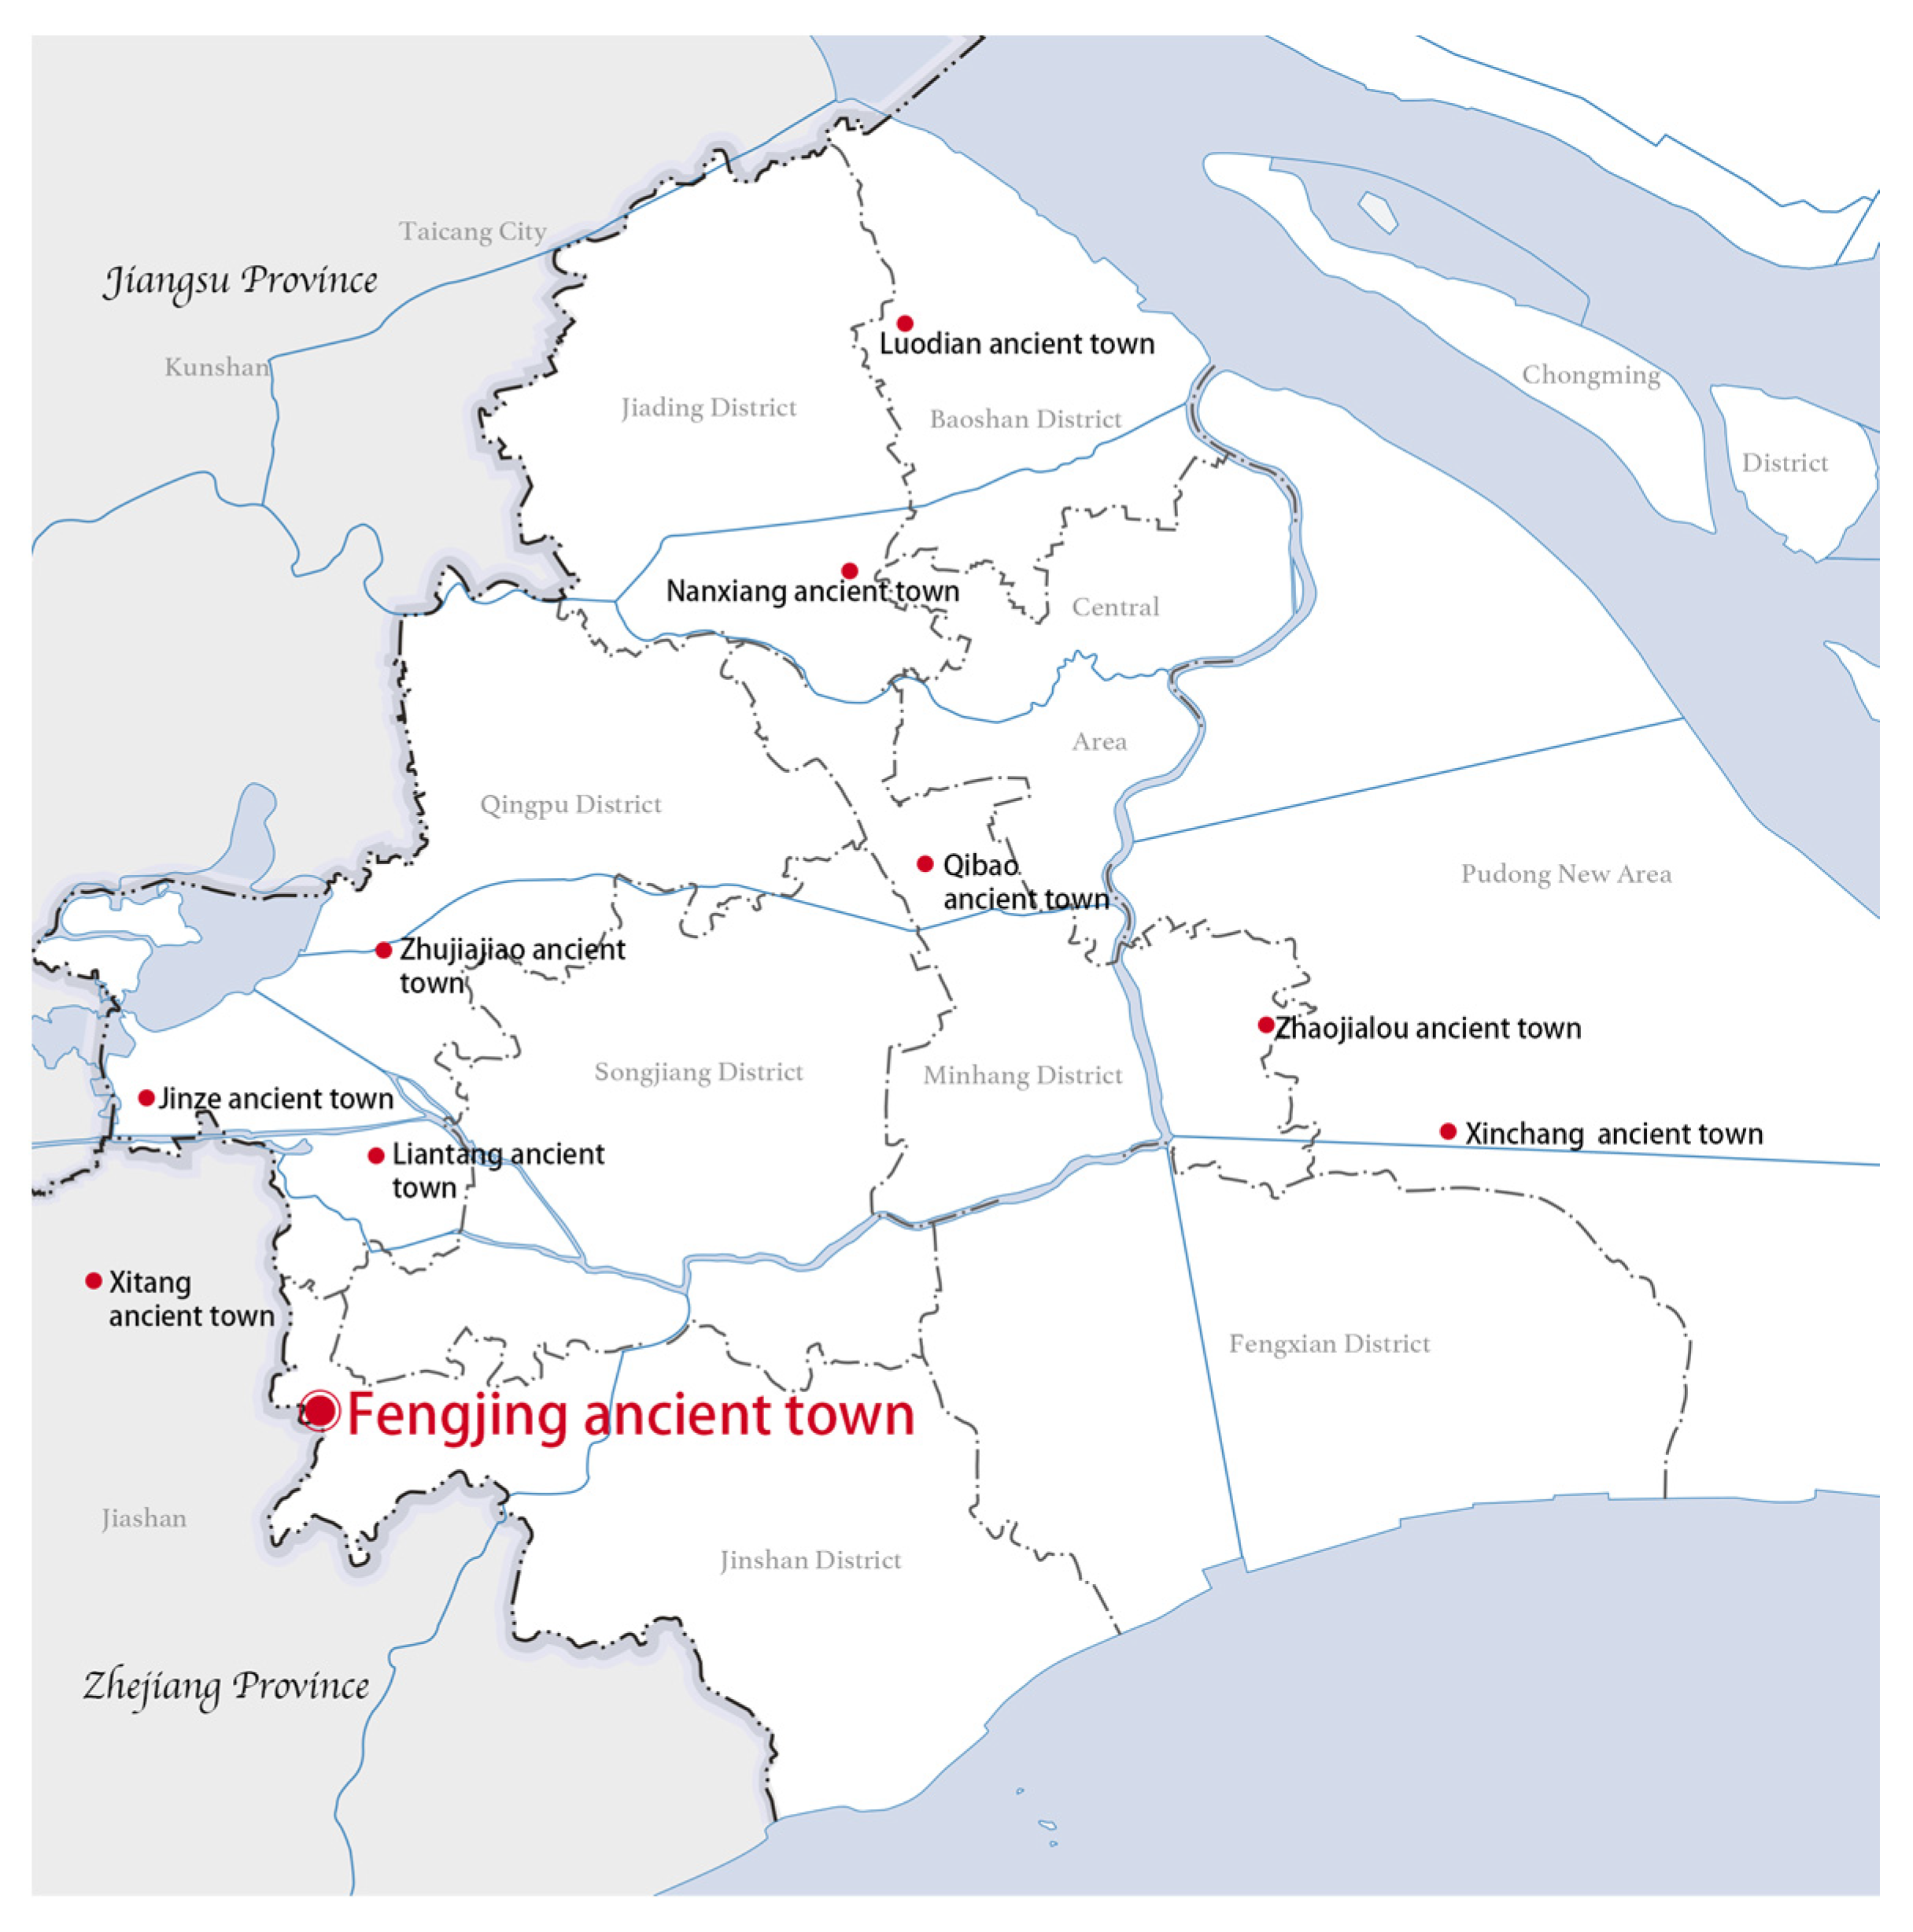
Fengjing Ancient Town is located in the southwest corner of Shanghai, in Fengjing Town, Jinshan District and has a long history. During the Tang and Song dynasties, the northern part of Fengjing Ancient Town belonged to Fengjing Town, Huating County, and the south belonged to Fengxian Town, Jiaxing County. Until the founding of the People’s Republic of China, Fengjing Ancient Town belonged to both Jiangsu and Zhejiang provinces. In March 1951, the southern part of Fengjing Ancient Town was integrated into Jiangshu Province. Then, in 1958, the Fengjing Ancient Town became a part of Shanghai (
Figure 1).
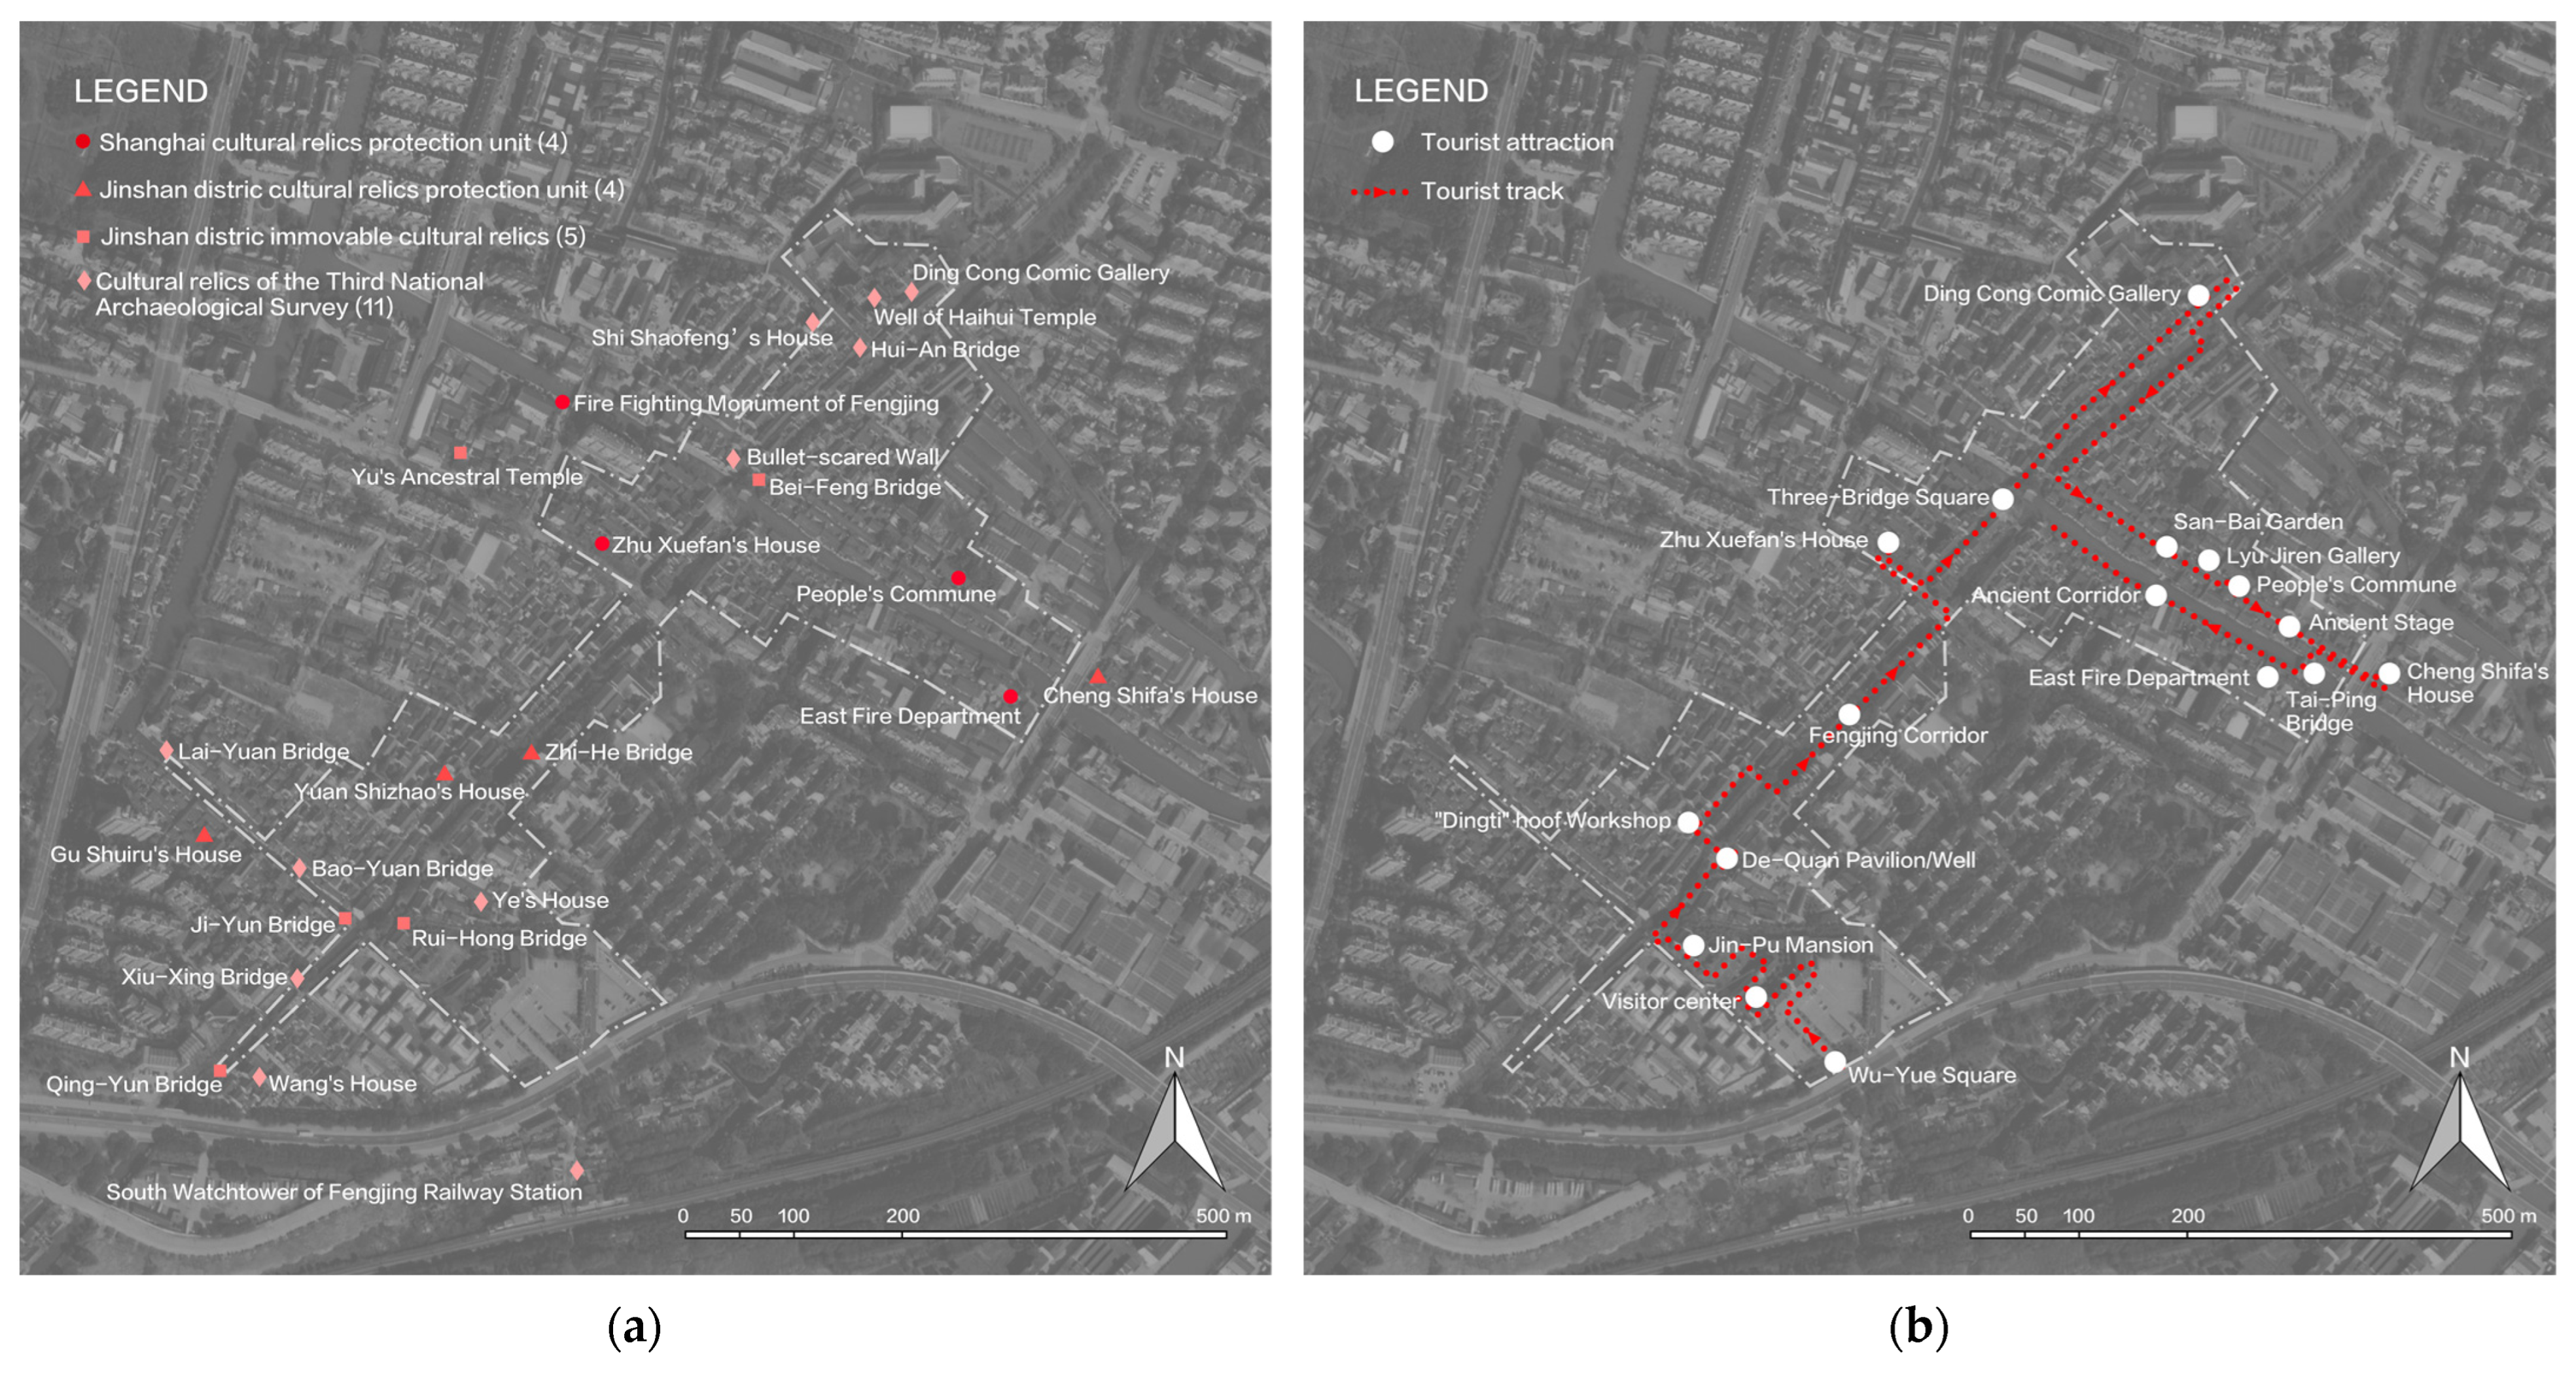
According to the “Fengjing Town Historical and Cultural Town Protection Plan (2016–2040)”, the protection area of Fengjing Ancient Town is 104.1 hectares, and the core protection area with relatively concentrated historical buildings, well-preserved spatial layout, and distinctive features [
22] is 31.24 hectares. Therefore, the research takes the core protection area of Fengjing Ancient Town as a case study (
Figure 2), and the reasons for selecting Fengjing Ancient Town are as follows:
Fengjing Ancient Town retains the distinctive characteristics of Chinese Jiangnan ancient town with many bridges and rivers, and Fengjing Ancient Town is known to be “three steps, two bridges, and ten alleys at a glance”. The spatial pattern of the ancient town is well preserved, with traditional commercial and residential neighborhood buildings in the traditional style of Jiangnan in the late Qing Dynasty. In 2005, the Fengjing Ancient Town was selected in the second batch of national “Chinese historical and cultural towns” while in 2012 it was selected as one of the “Top Ten Ancient Towns in the Yangtze River Delta”.
Fengjing Ancient Town has unique geographical characteristics compared with other ancient towns in the Jiangnan area, and the most significant feature is that the town shows different characteristics in its southern and northern areas. Since Song Dynasty (960–1279), Fengjing Ancient Town has been divided into north and south areas by a river. Until 1951 it was merged and managed by Jiangsu, and in 1958 it was incorporated into Shanghai. The long-term division between the north and south has formed the unique dual-core layout. The architectural style and geographical culture differ in the north and south as well.
Protective development has been applied to revive Fengjing Ancient Town in the past few years; in 2007, the transformation started at the core area, and then in 2011 applied to the entire town. In the past ten years, tourism has developed rapidly, leading to high tourist satisfaction. Fengjing Ancient Town was selected as one of the “Eight Sceneries of Shanghai” in 2009 and was later rated as the “2014 Most Valuable Cultural Heritage Tourism Destination in China” and “2020 China National Tourism Annual Selected Featured Ancient Town Tourism Destination” [
23,
24].
To conclude, this research regards Fengjing Ancient Town as a proper case to study tourists’ spatial cognition among other historical ancient towns.
2.2. Data Sources and Data Analysis
The data sources of visitor cognition research can be roughly divided into three categories. First is big data including mobile phone signaling [
25,
26,
27,
28,
29], Point of Interest (POI) [
13,
30,
31,
32,
33], night scene lighting, and User Generated Content (UGC) website (social media, travel notes etc.) [
34,
35,
36,
37,
38,
39,
40,
41,
42,
43,
44,
45,
46,
47,
48,
49,
50,
51,
52,
53,
54,
55,
56]; second is small data such as questionnaires, tourist interviews [
7,
57,
58,
59,
60,
61], cognitive maps [
11,
14], on-site tourist experiments and observations [
62]. Third is archival data such as official websites of tourist destinations, local chronicles, existing research literature, etc. which are generally used as important supplements to the basic information of the research object [
63]. In terms of specific data analysis methods, the GIS spatial analysis, text content analysis, and behavioral map analysis are common visitor perception research methods which can be used to analyze tourist spatial structure, tourist preferences, spatial imagery perception, etc. (
Table 1).
The positioning data of mobile phone signaling and lighting night scene is not precise enough to reflect small scale tourist attraction inside villages and towns, so it is mainly used in analysis of tourism spatial flow or spatial structure on a relatively larger scale. Social media records visitors’ perceptions of tourist destinations, and the transmission of cognitive information in social media can simultaneously affect other visitors [
64,
65]. These tourists have a preliminary understanding of the tourist destination based on the information posted on social platforms. The guidance of that information further affects tourists’ behaviors during the trip, for example, the selection of tour routes and check-in at popular viewpoints.
Based on the background study, this research analyzes the spatial perception of tourists in Fengjing Ancient Town from three time dimensions: during travel, at the end of the travel, and after travel through data acquisition, processing, and analysis. Comparative analysis with data from on-site observation was conducted to obtain a clearer picture of the process of visitor perception.
The first tourist cognition dimension is the initial spatial consciousness of the tourist destination during the travel process. This research selects the check-in data in Sina Weibo within the boundary coordinates of the Fengjing Ancient Town area from 2010 to 2020, with a total of 10,618 entries, including user ID, user address, check-in location, date, time, text, etc. Through data statistics, spatial analysis and text content analysis, the preliminary results from the spatial cognition of tourists in Fengjing Ancient Town is acquired.
The second dimension is the place memory of the attraction at the end of the trip. In August 2020 and May 2021, the research team conducted two interviews with tourists who had just finished their trip to Fengjing Ancient Town. Tourists were asked to draw the spatial locations of sights, roads, rivers, landmarks, etc. they visited based on their memory, and marked the names of those places. A total of 11 valid maps were yielded from the interviews. Afterward, key element classification, statistics and spatial analysis were applied to those data based on Kevin Lynch’s spatial element analysis method.
The third dimension of tourists’ spatial cognition is after the trip. It is defined as the imagery perception which can be demonstrated by visitors’ memories and expressions of tourist destinations through travel notes. The research used “Fengjing Ancient Town” as the keyword to search for travel notes and photos on two travel websites “Ctrip.com” and “Mafengwo”. Excluding travel notes from tourists who have not been to Fengjing Ancient Town and travel notes that do not contain photos, 2032 photos of Fengjing Ancient Town in 74 travel notes from 2010–2021 on Ctrip were downloaded, while 1313 photos from 55 travel notes were found on Mafengwo.com from 2016–2021; thus, a total of 3345 travel photos of Fengjing Ancient Town were obtained. The research carried out a GIS analysis of the main content and spatial location of the photos.
Our research team visited to Fengjing Ancient Town three times from August 2020 to January 2022 to conduct on-site research and obtain aerial photography to record the tourist activities and density of tourists in Fengjing ancient town. The planning document of Fengjing Ancient Town [
22] was used as supplementary data for the above three-dimensional tourism spatial cognitive analysis.
2.3. Data Preprocessing
- (1)
Sina Weibo check-in data preprocessing: the abnormal data of Weibo accounts from the Weibo check-in data is deleted, the data of residents and staff in Ancient Town, the data of more than 15 posts with the same ID, the ID with 5–15 posts, and the data that reflects their daily life and work. A total of 8346 pieces of remaining data are considered effective for analysis.
- (2)
Travel photo data preprocessing: First, the photos that only contain humans or pets are removed while retaining the photos of animals, plants, architectural details, food, and people in the background of scenic spots, resulting in 3175 photos. Then, the location of the photo is determined based on Baidu map coordinates. There are 2812 photos that can be labeled, whereas the other 363 photos include food, architectural details, animals, plants, maps and signs without scene information that are hard to determine the location from. The paper analyzes 2812 photos that contain geographic location for tourist perception and maps the coordinates of the photo to the coordinates of the real buildings. For instance, if the main content of the photo is Fengjing Three-bridge square, the coordinates of this photo should be set in the center of Three-bridge Square.
3. A Case Study of Tourists’ Cognition in Fengjing Ancient Town
3.1. The Distribution of Tourists in Fengjing Ancient Town Based on Ariel Photo
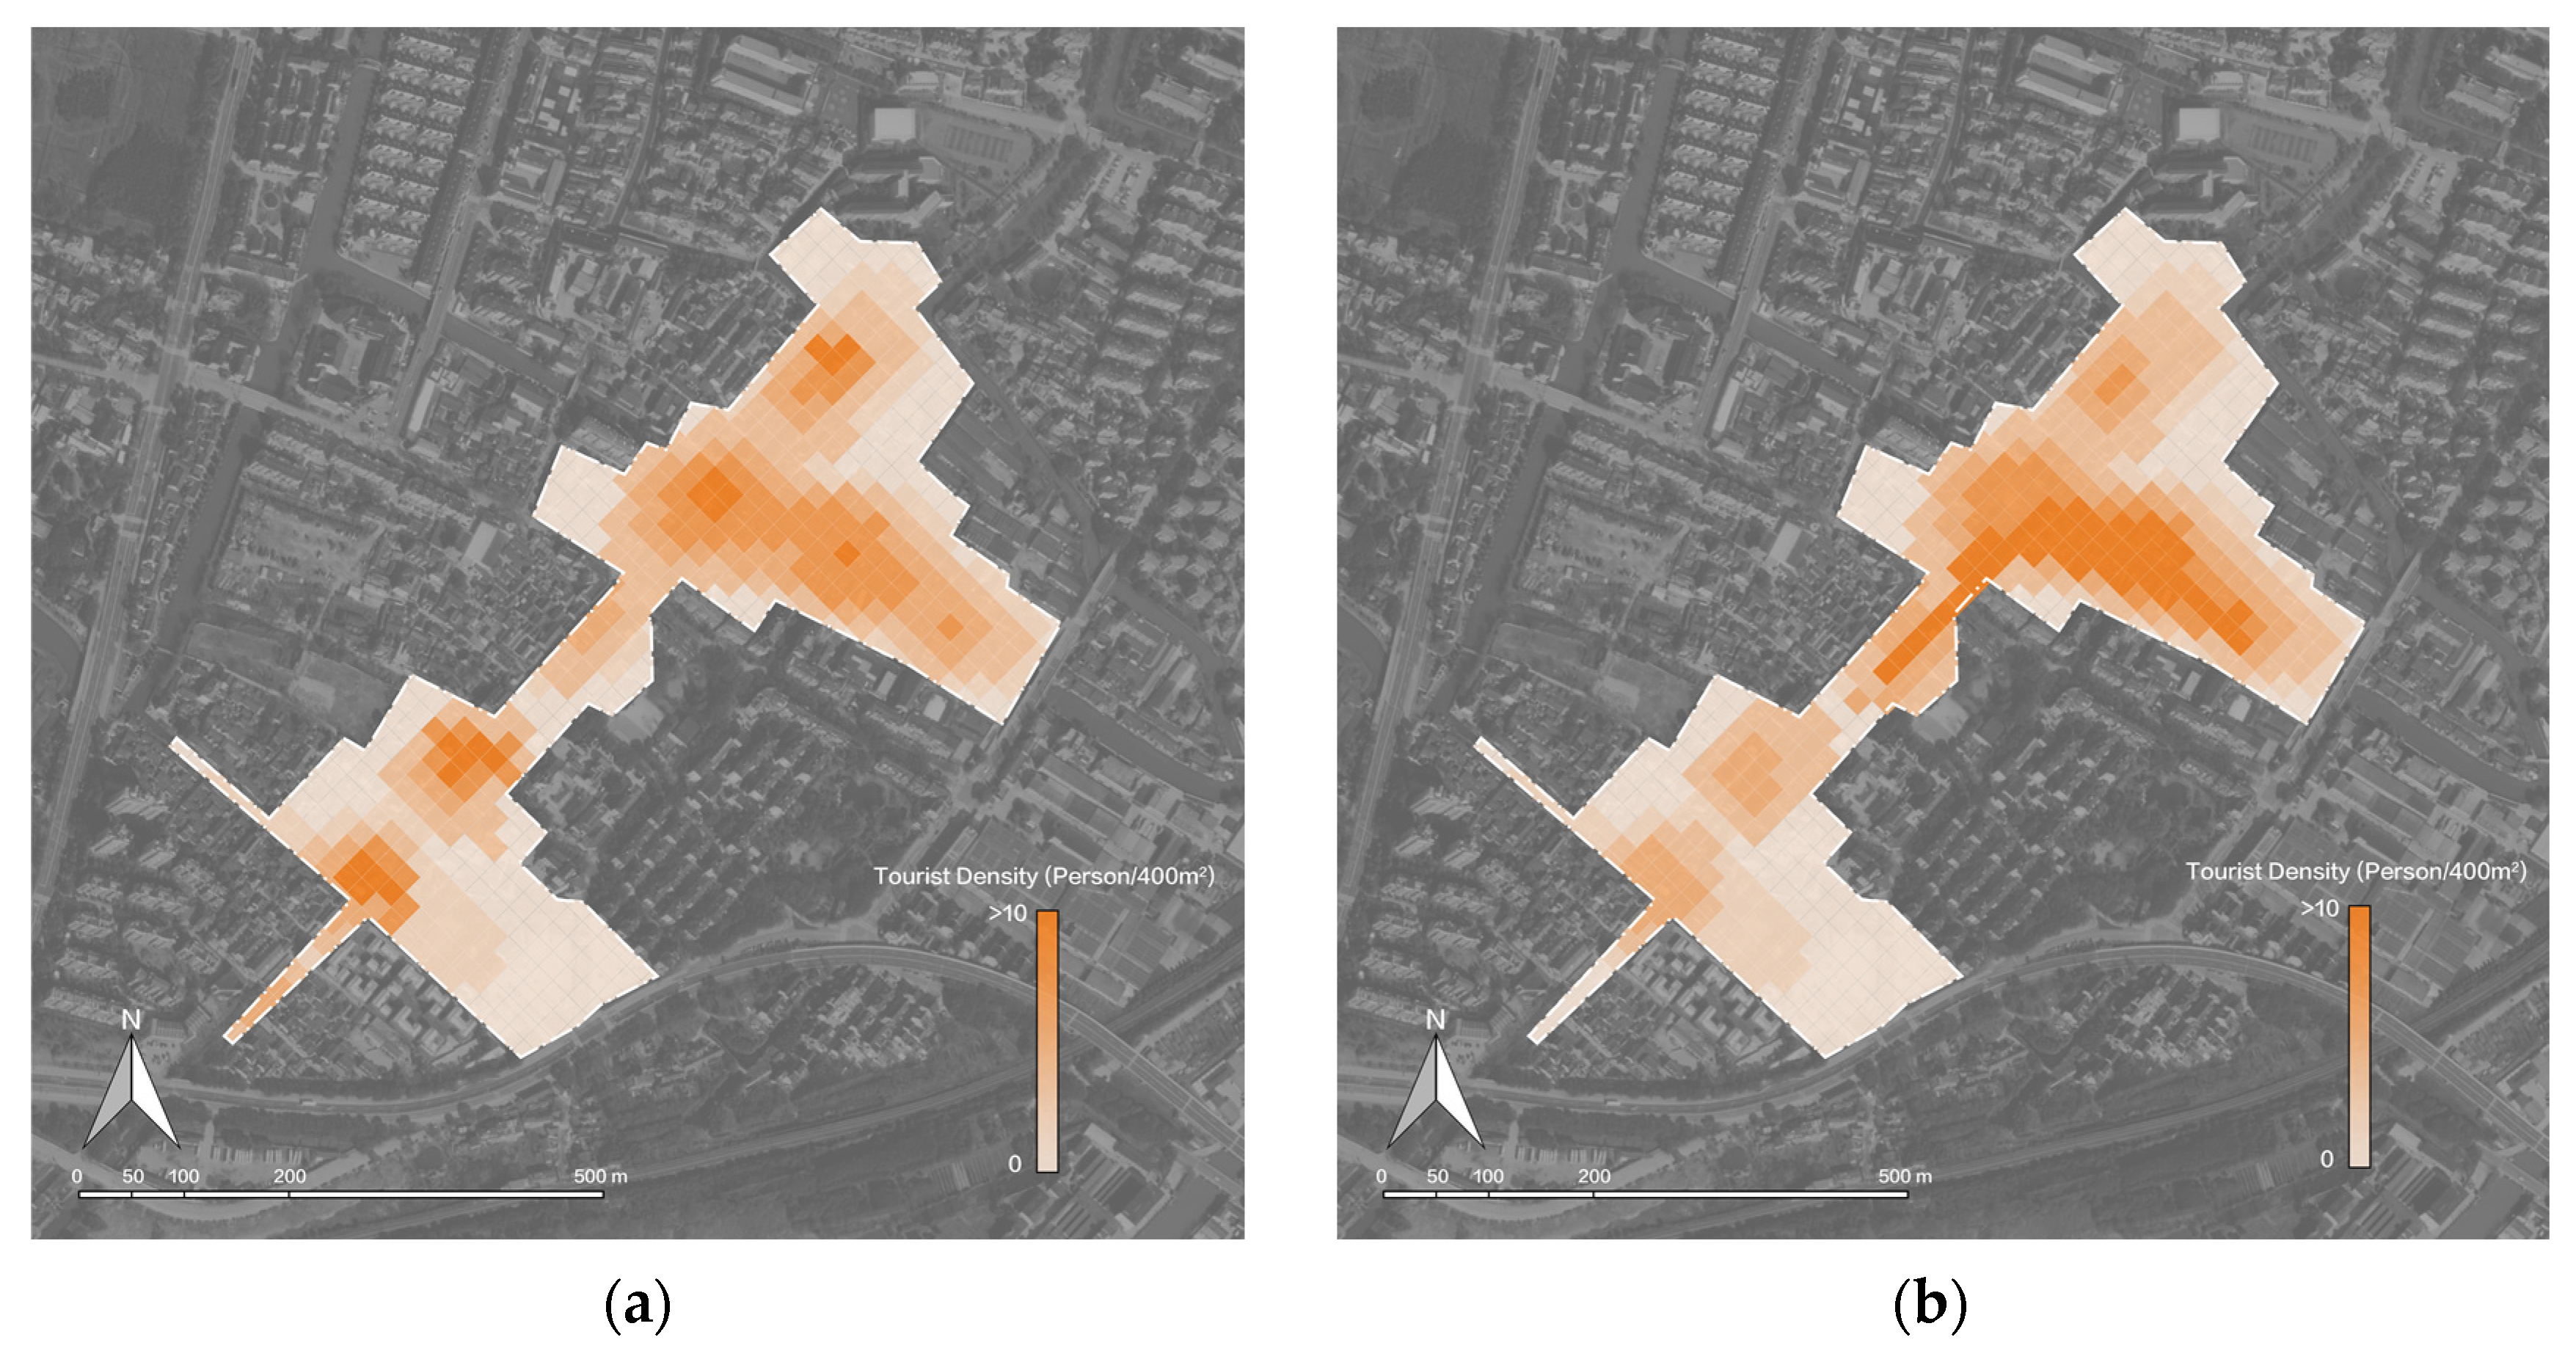
To collect data on the real-time distribution of visitors, our research team visited Fengjing Ancient Town three times on 29 August 2020, 22 May 2021, and 15 January 2022, and obtained aerial photos from 10:00 to 11:00, 12:30 to 13:00 and 15:00 to 16:00 separately. According to the data in aerial photos, the distribution density of visitors is drawn in
Figure 3. The research found that there are some differences in the spatial distribution density of visitors in the morning and afternoon, and the density of people is mainly related to the distribution of scenic spots and commercial activities. For example, at noon, during lunchtime, the density of tourists in the Corridor of Shengchan Street and the northern part of Fengxi Corridor increased significantly (
Figure 3b), which is directly related to the distribution of catering options in the ancient town
3.2. Time Distribution of Tourists Based on Sina Weibo Check-In Data
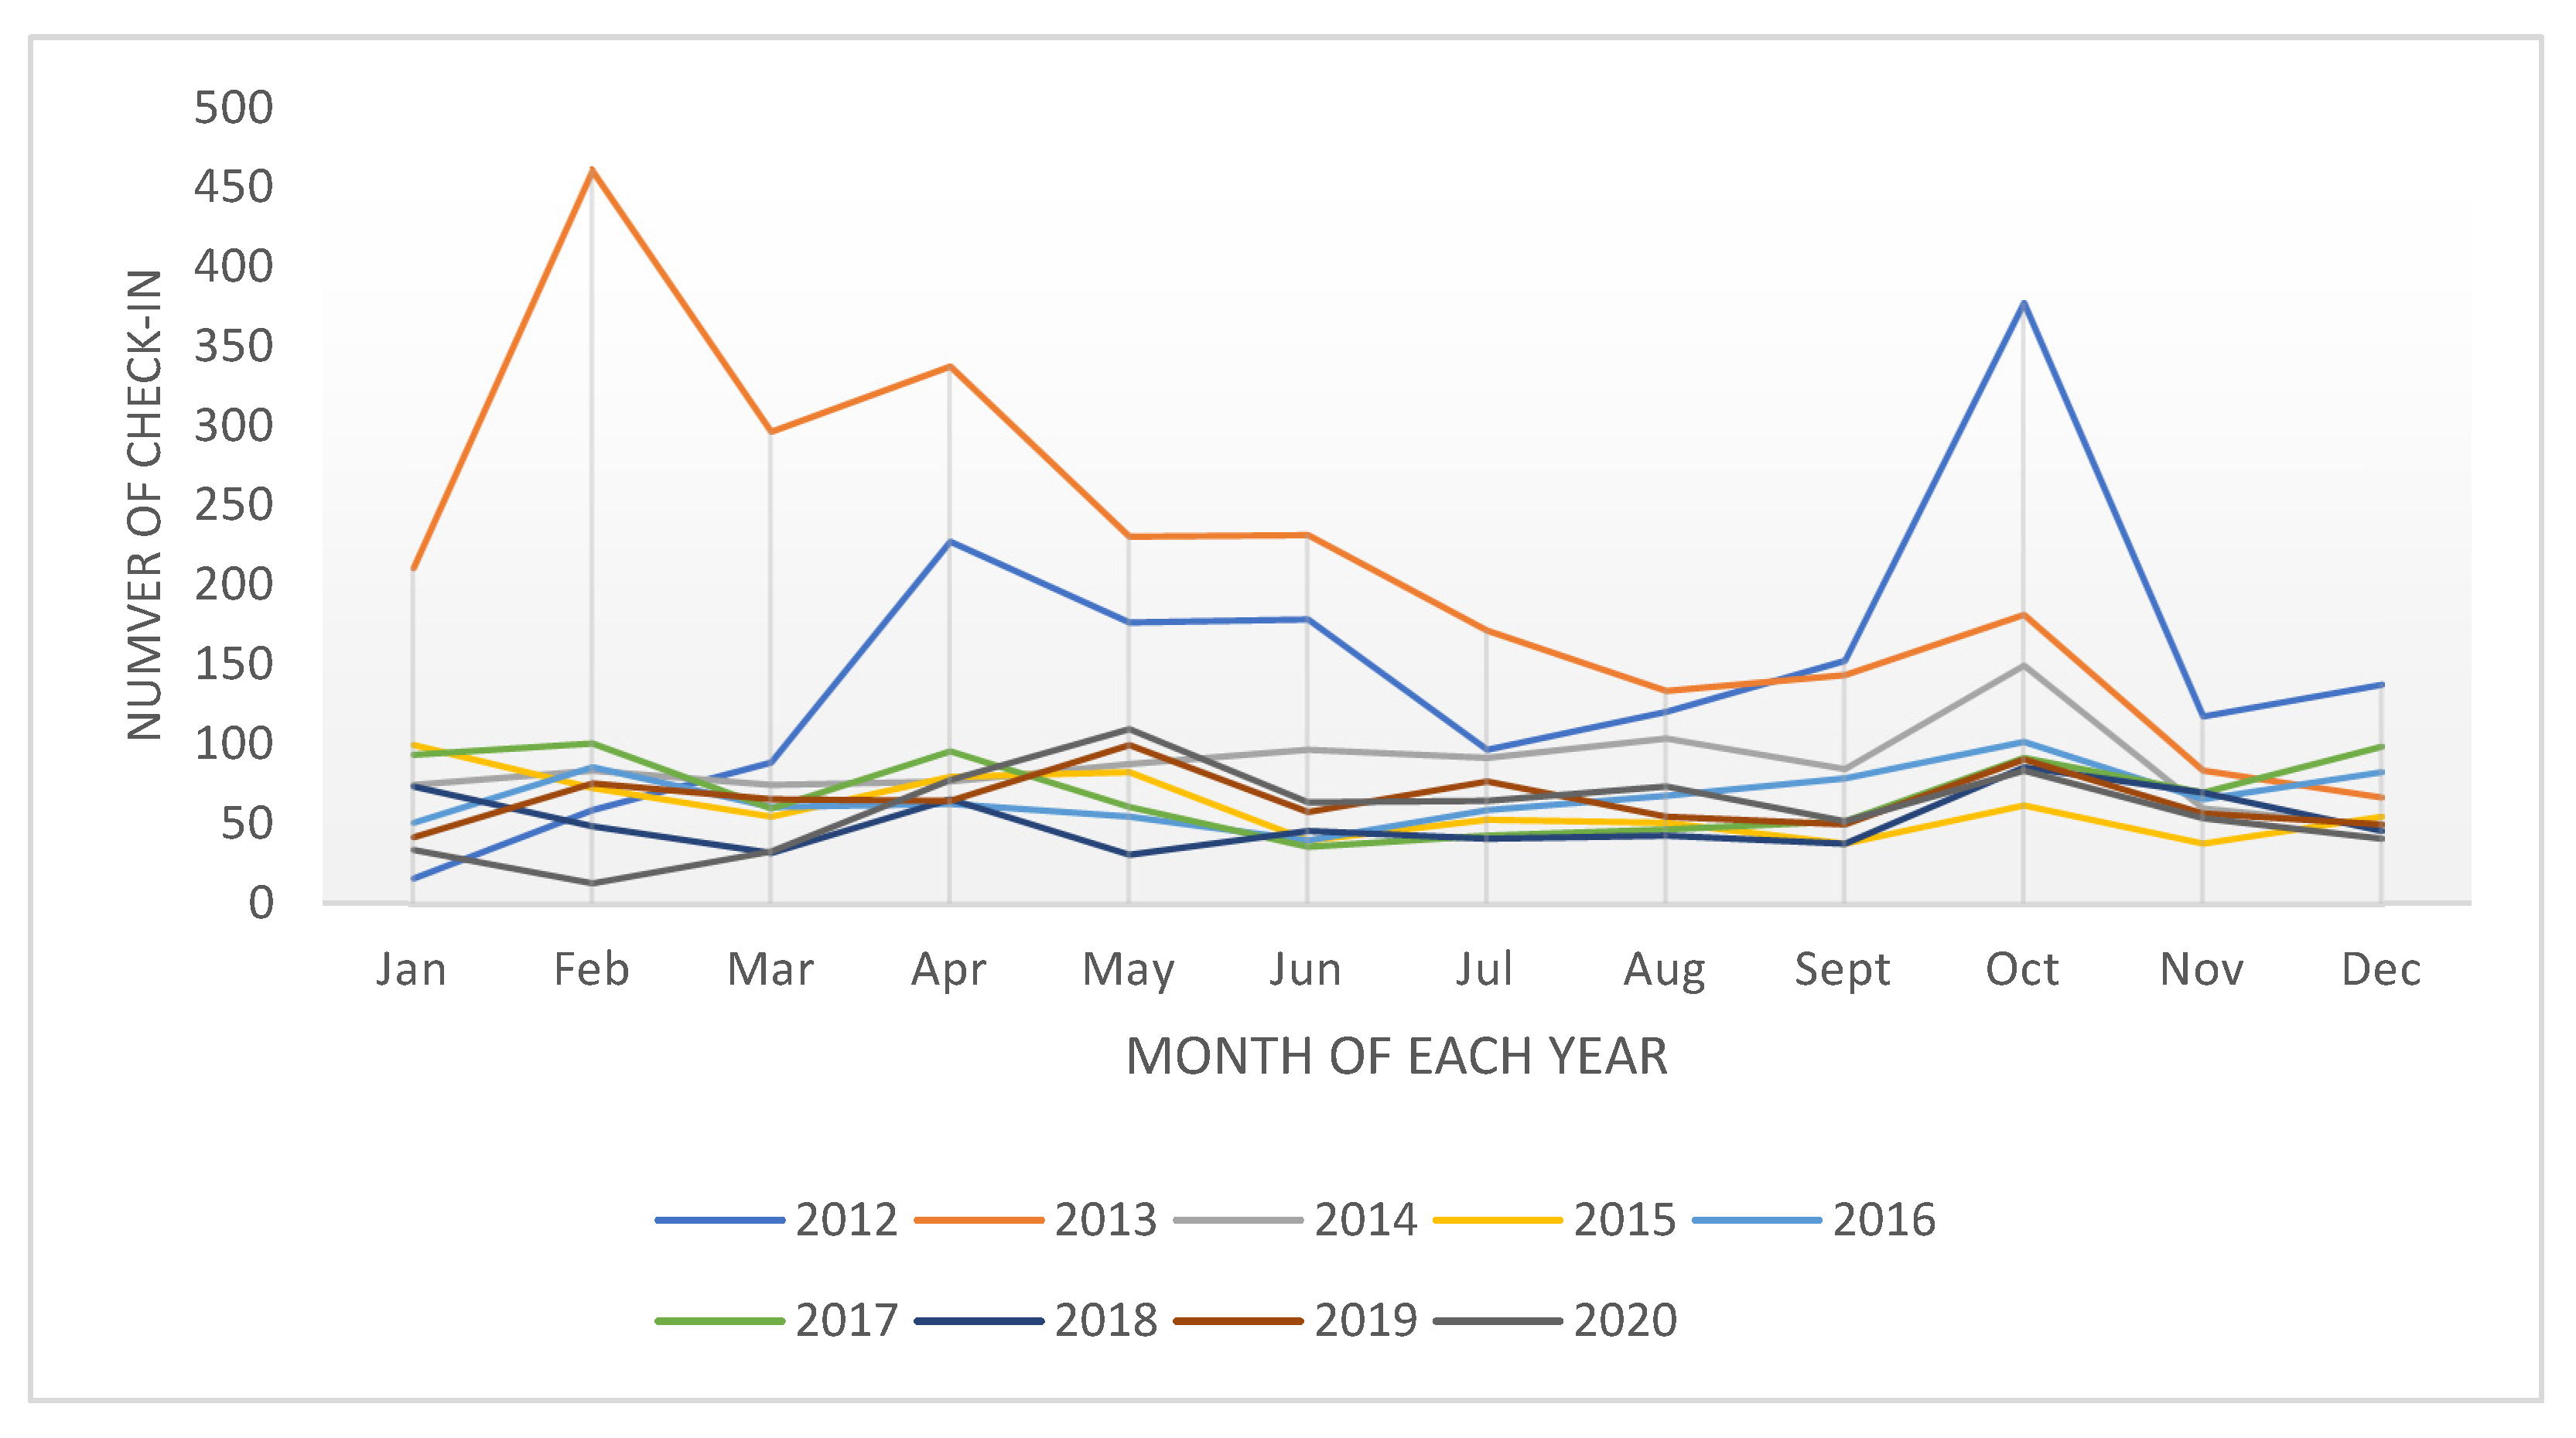
In the process of sorting Weibo check-in data from 2012 to 2020, different classifications were used based on year, month, day, and hour. The time period with the most tourist is from April 2012 to October 2013 (
Figure 4), with February 2013 being the peak. This is because the government of the town implemented a tourism development and promotion policy in 2011 and the town was rated as one of the top ten ancient towns in the Yangtze River Delta in 2012.
From 2012 to 2020, the average number of Weibo check-ins in Fengjing Ancient Town was 77 per month, of which the three months with the largest number of check-ins is 106 in April, 89 in May, and 123 in October. In October, the National holiday was the peak time for travel. Compared with the average number of daily check-ins (2.5), the average number of daily check-ins during the 7-day Chinese National holiday is 9.8. In 2012, this number reached 30.
According to
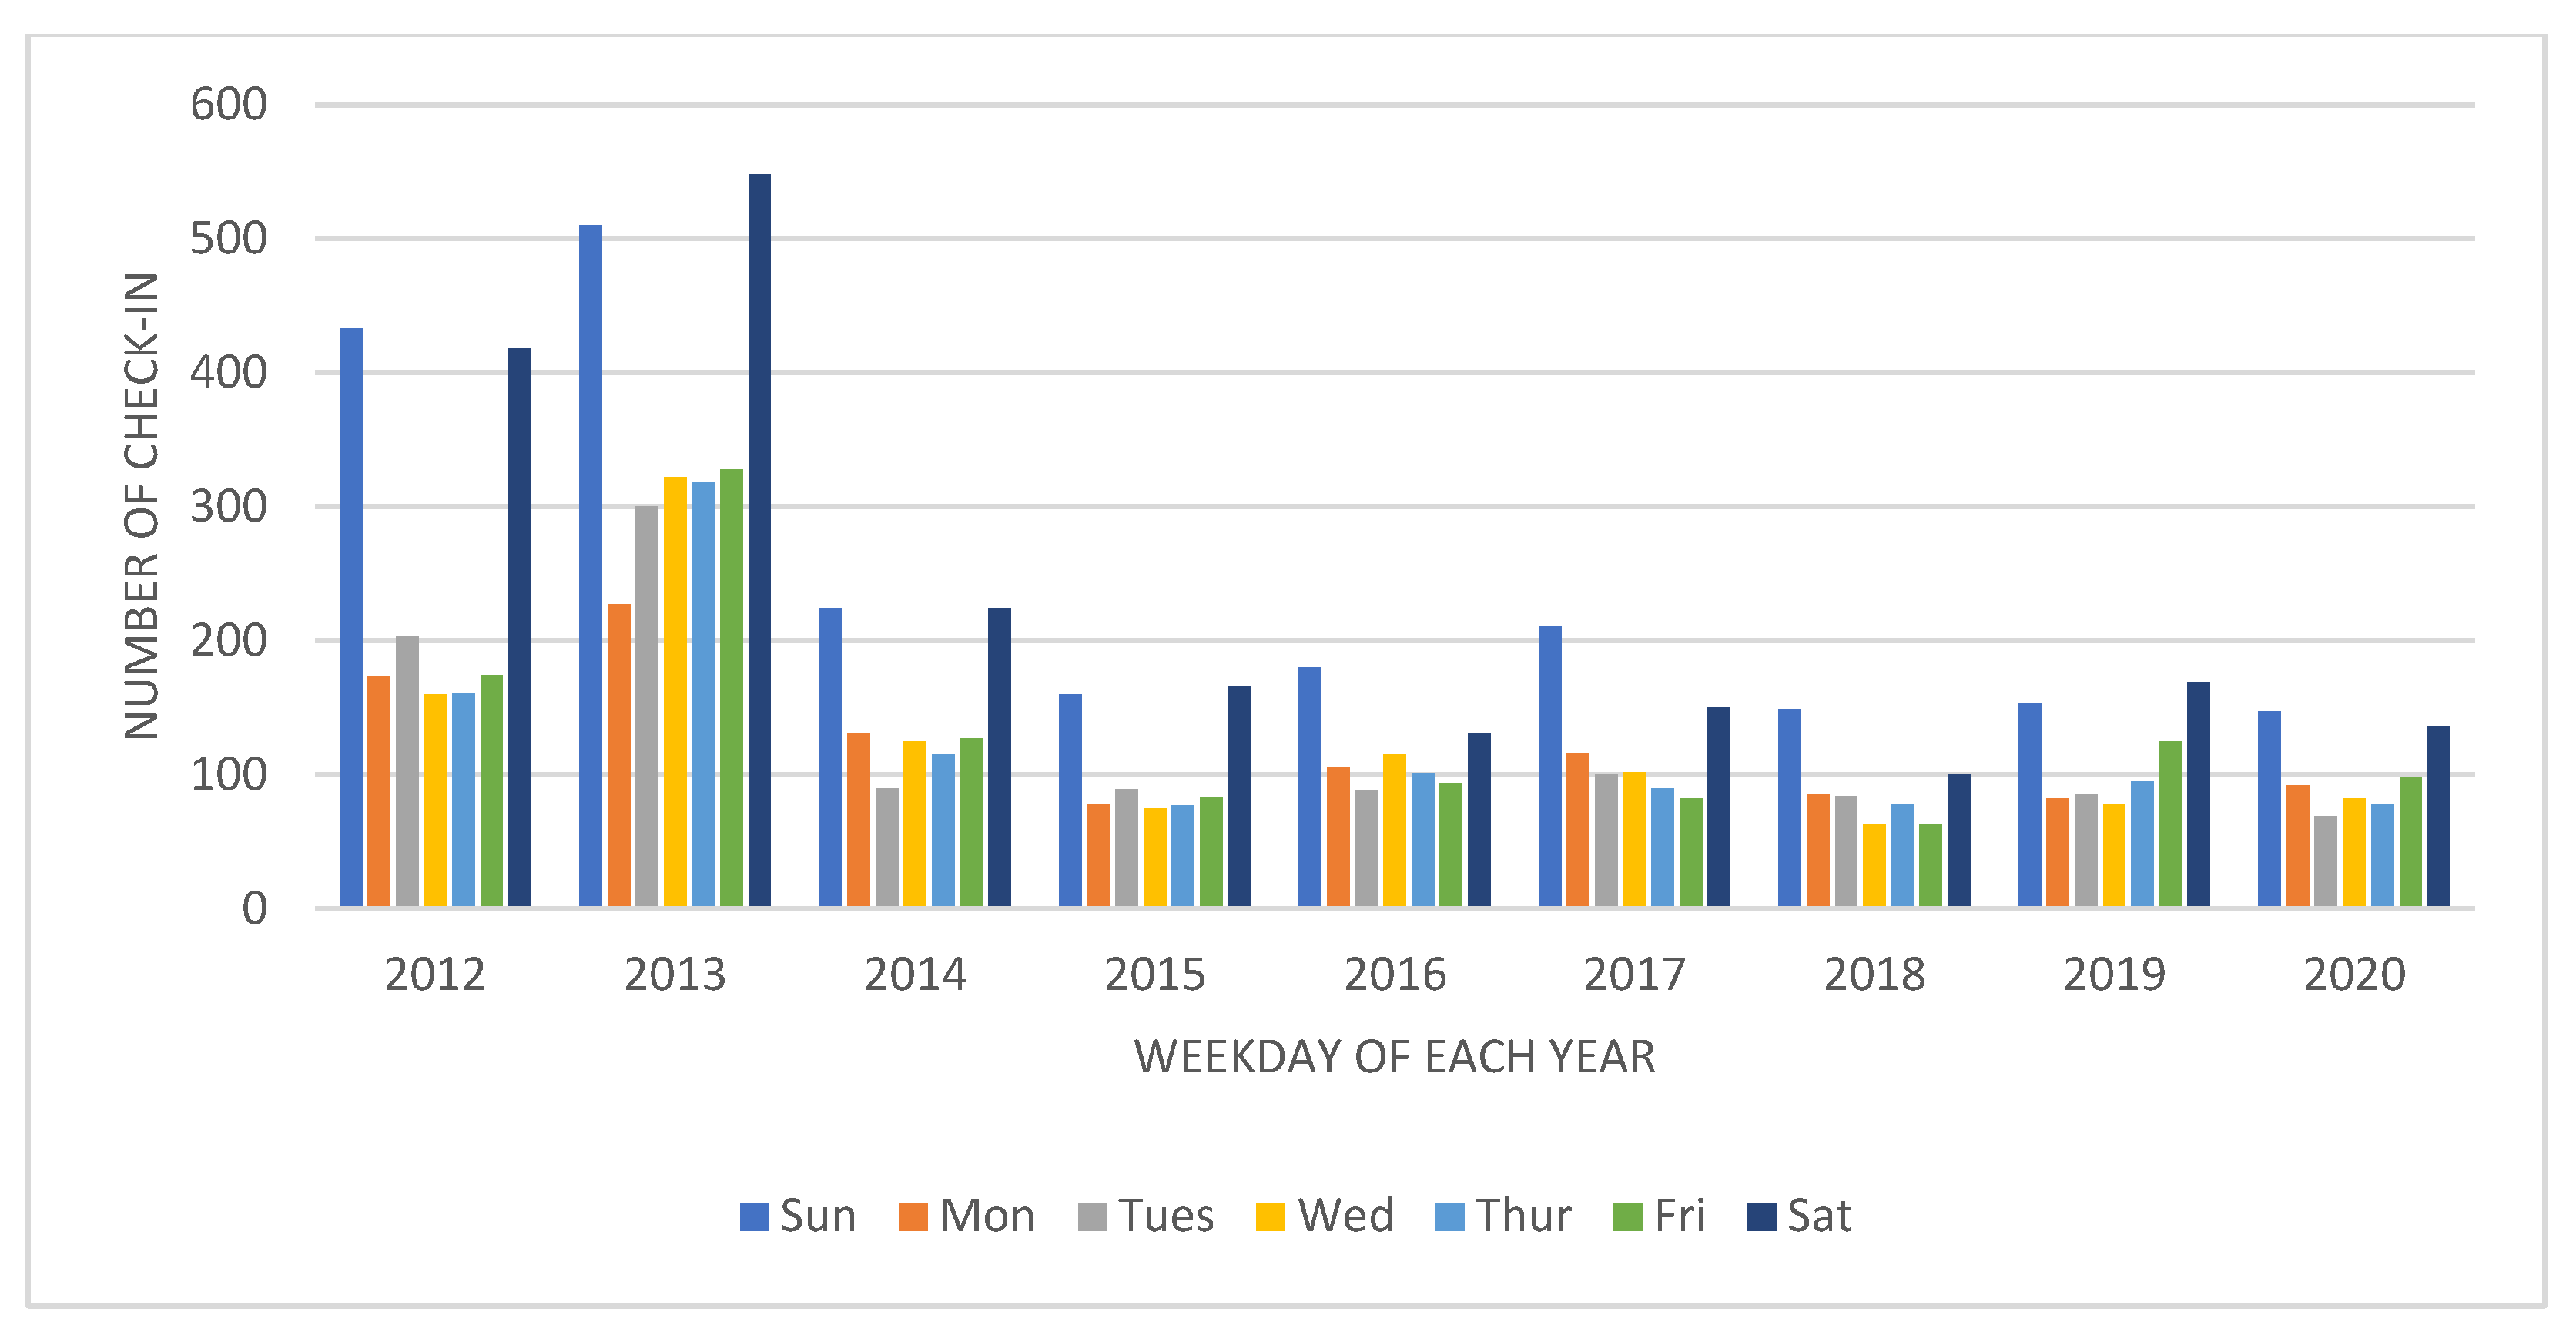
Figure 5, the number of check-ins on weekends is obviously higher than that of working days, and few differences were detected from Monday to Friday. Combined with the location data sources, we found that most tourists are from Shanghai (71.1%), and the other tourists traveling during weekends are mainly from Jiangsu, Zhejiang and Anhui (12.8%).
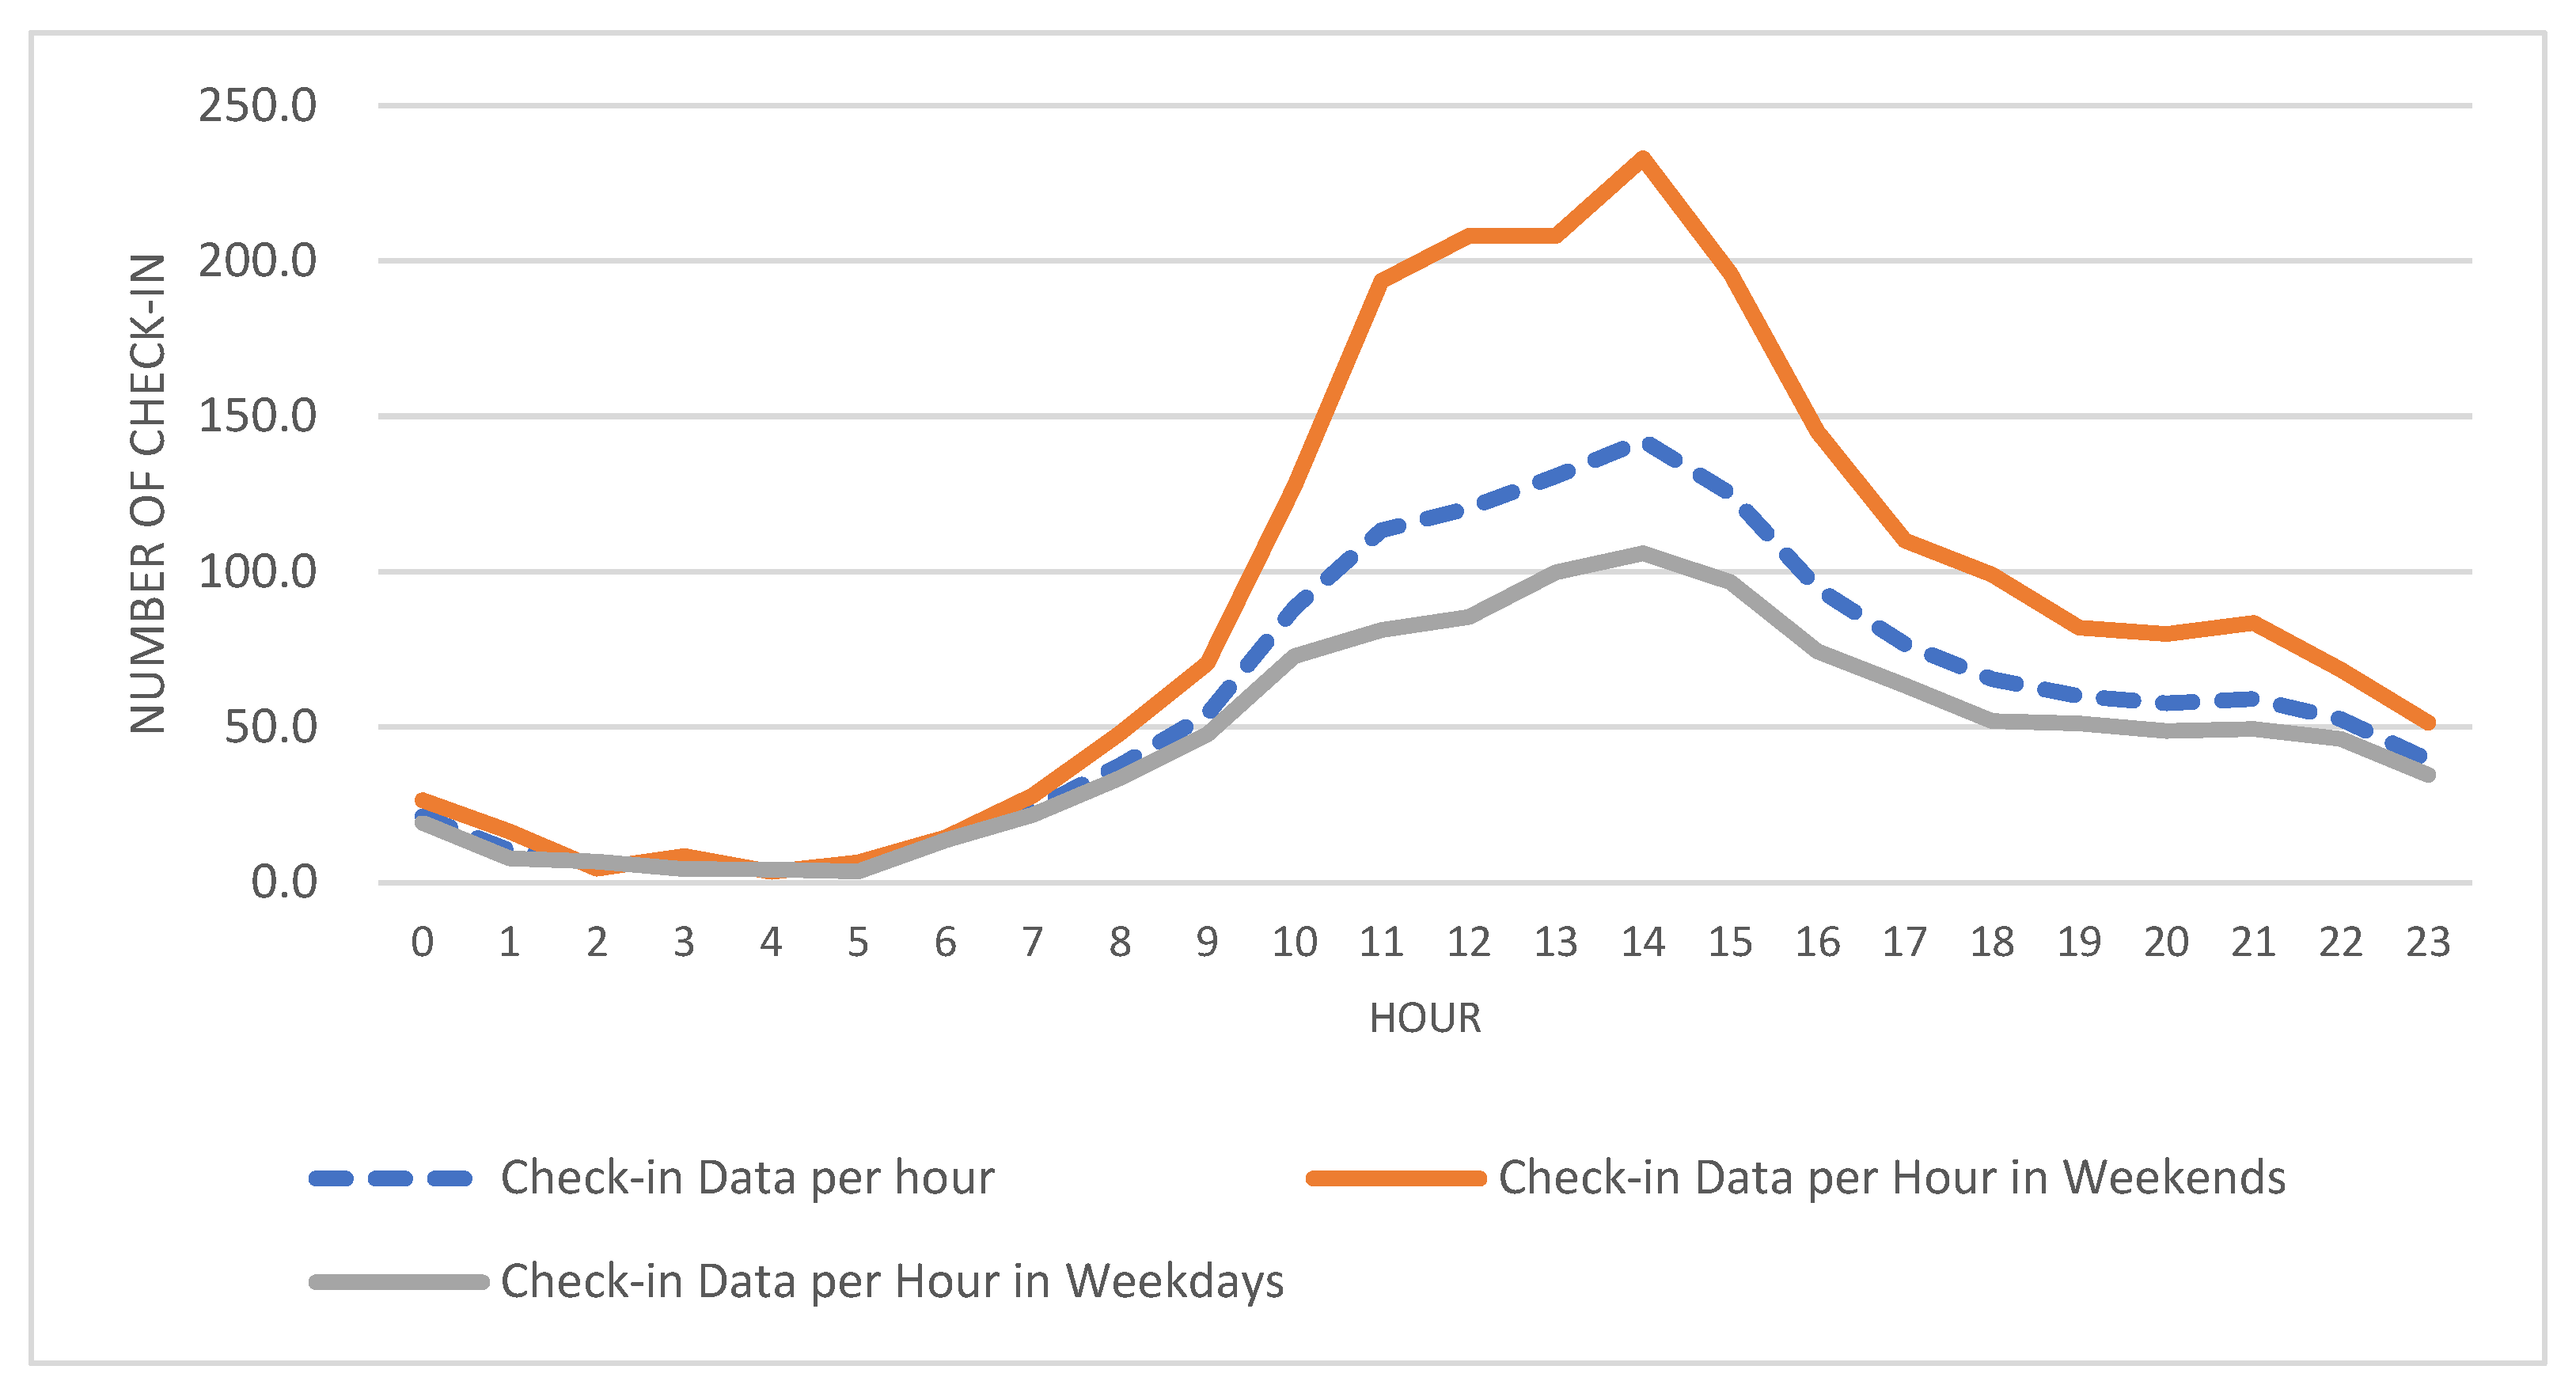
We calculate the average number of check-ins and compare it with the data for weekdays and weekends. It is found that the time slot which exceeds the average number of check-ins (77) is between 9:30 and 18:30 with peaks between 11:00 and 15:00 (
Figure 6). The number of daytime check-ins (9:00–21:00) increased significantly on weekends, but nighttime data changed slightly: most tourists from Shanghai and its surrounding areas traveling on weekends do not stay in Fengjing, while tourists who stay in Fengjing have no obvious preference for either weekends or weekdays.
3.3. Spatial Consciousness Analysis of Tourists Based on Weibo Check-In Data
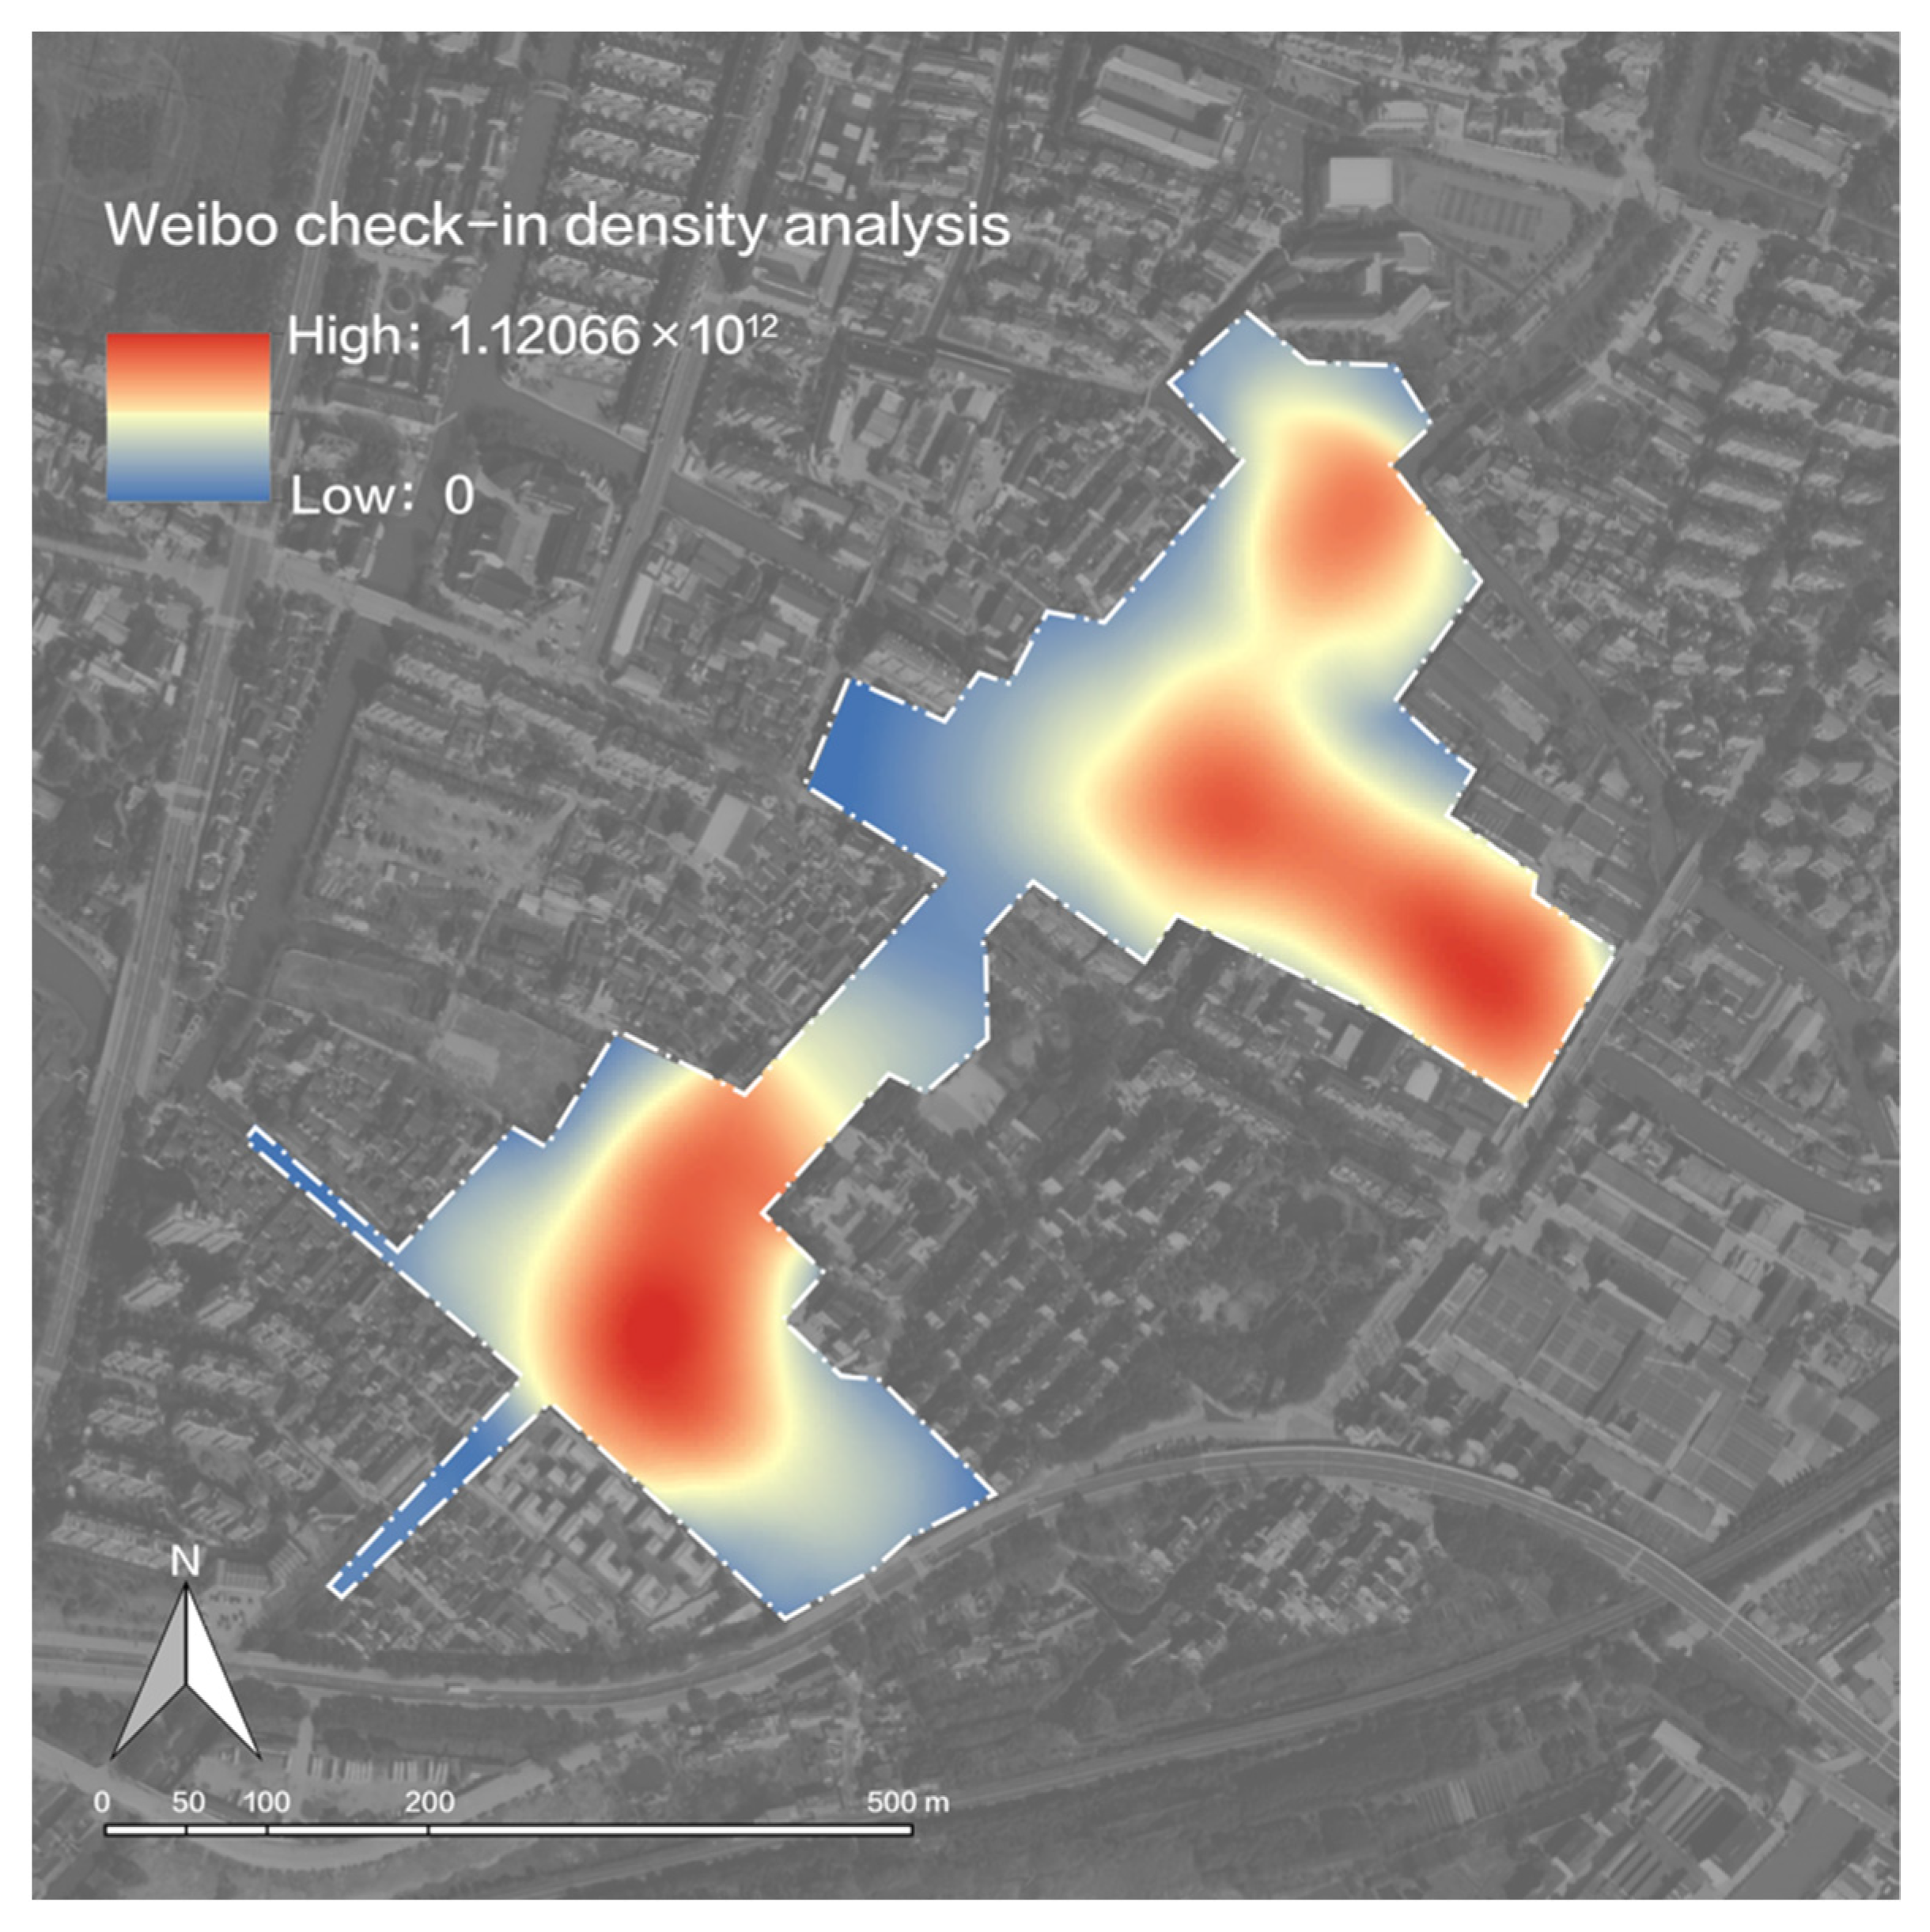
Through the spatial Kernel density analysis by ArcGIS, it can be seen that the spatial distribution of the coordinates of tourists’ check-in collected from Sina Weibo reflected a concentrated multi-center pattern (
Figure 7). The main center is composed of three tourist sites: Wuyue Square and Zhuang Yuan Fang, Zhi-He Bridge and Love Square, Wu-Yue dividing marker and Wu-Yue dividing river. The second center is from Three-bridge Square along Shengchan Street to Peace Street, surrounded by tourist attractions such as Zhu Xuefan’s House and Sanqiaoli Guest House. The third center is Shiwang Temple and Dingcong Gallery that extends south along Beidajie Street to Three-bridge Square. The accuracy of Weibo check-in coordinates is not precise enough. For example, the check-in coordinate of Love Square, Wedding Square, South Yangtze Wedding Custom Hall, and Zhi-He Bridge are all on the same coordinate point. Therefore, there are only a few check-in points in the entire ancient town. The inaccurate coordinates could only reflect a few important gathering points, but they cannot support a more in-depth analysis of tourists’ spatial preferences.
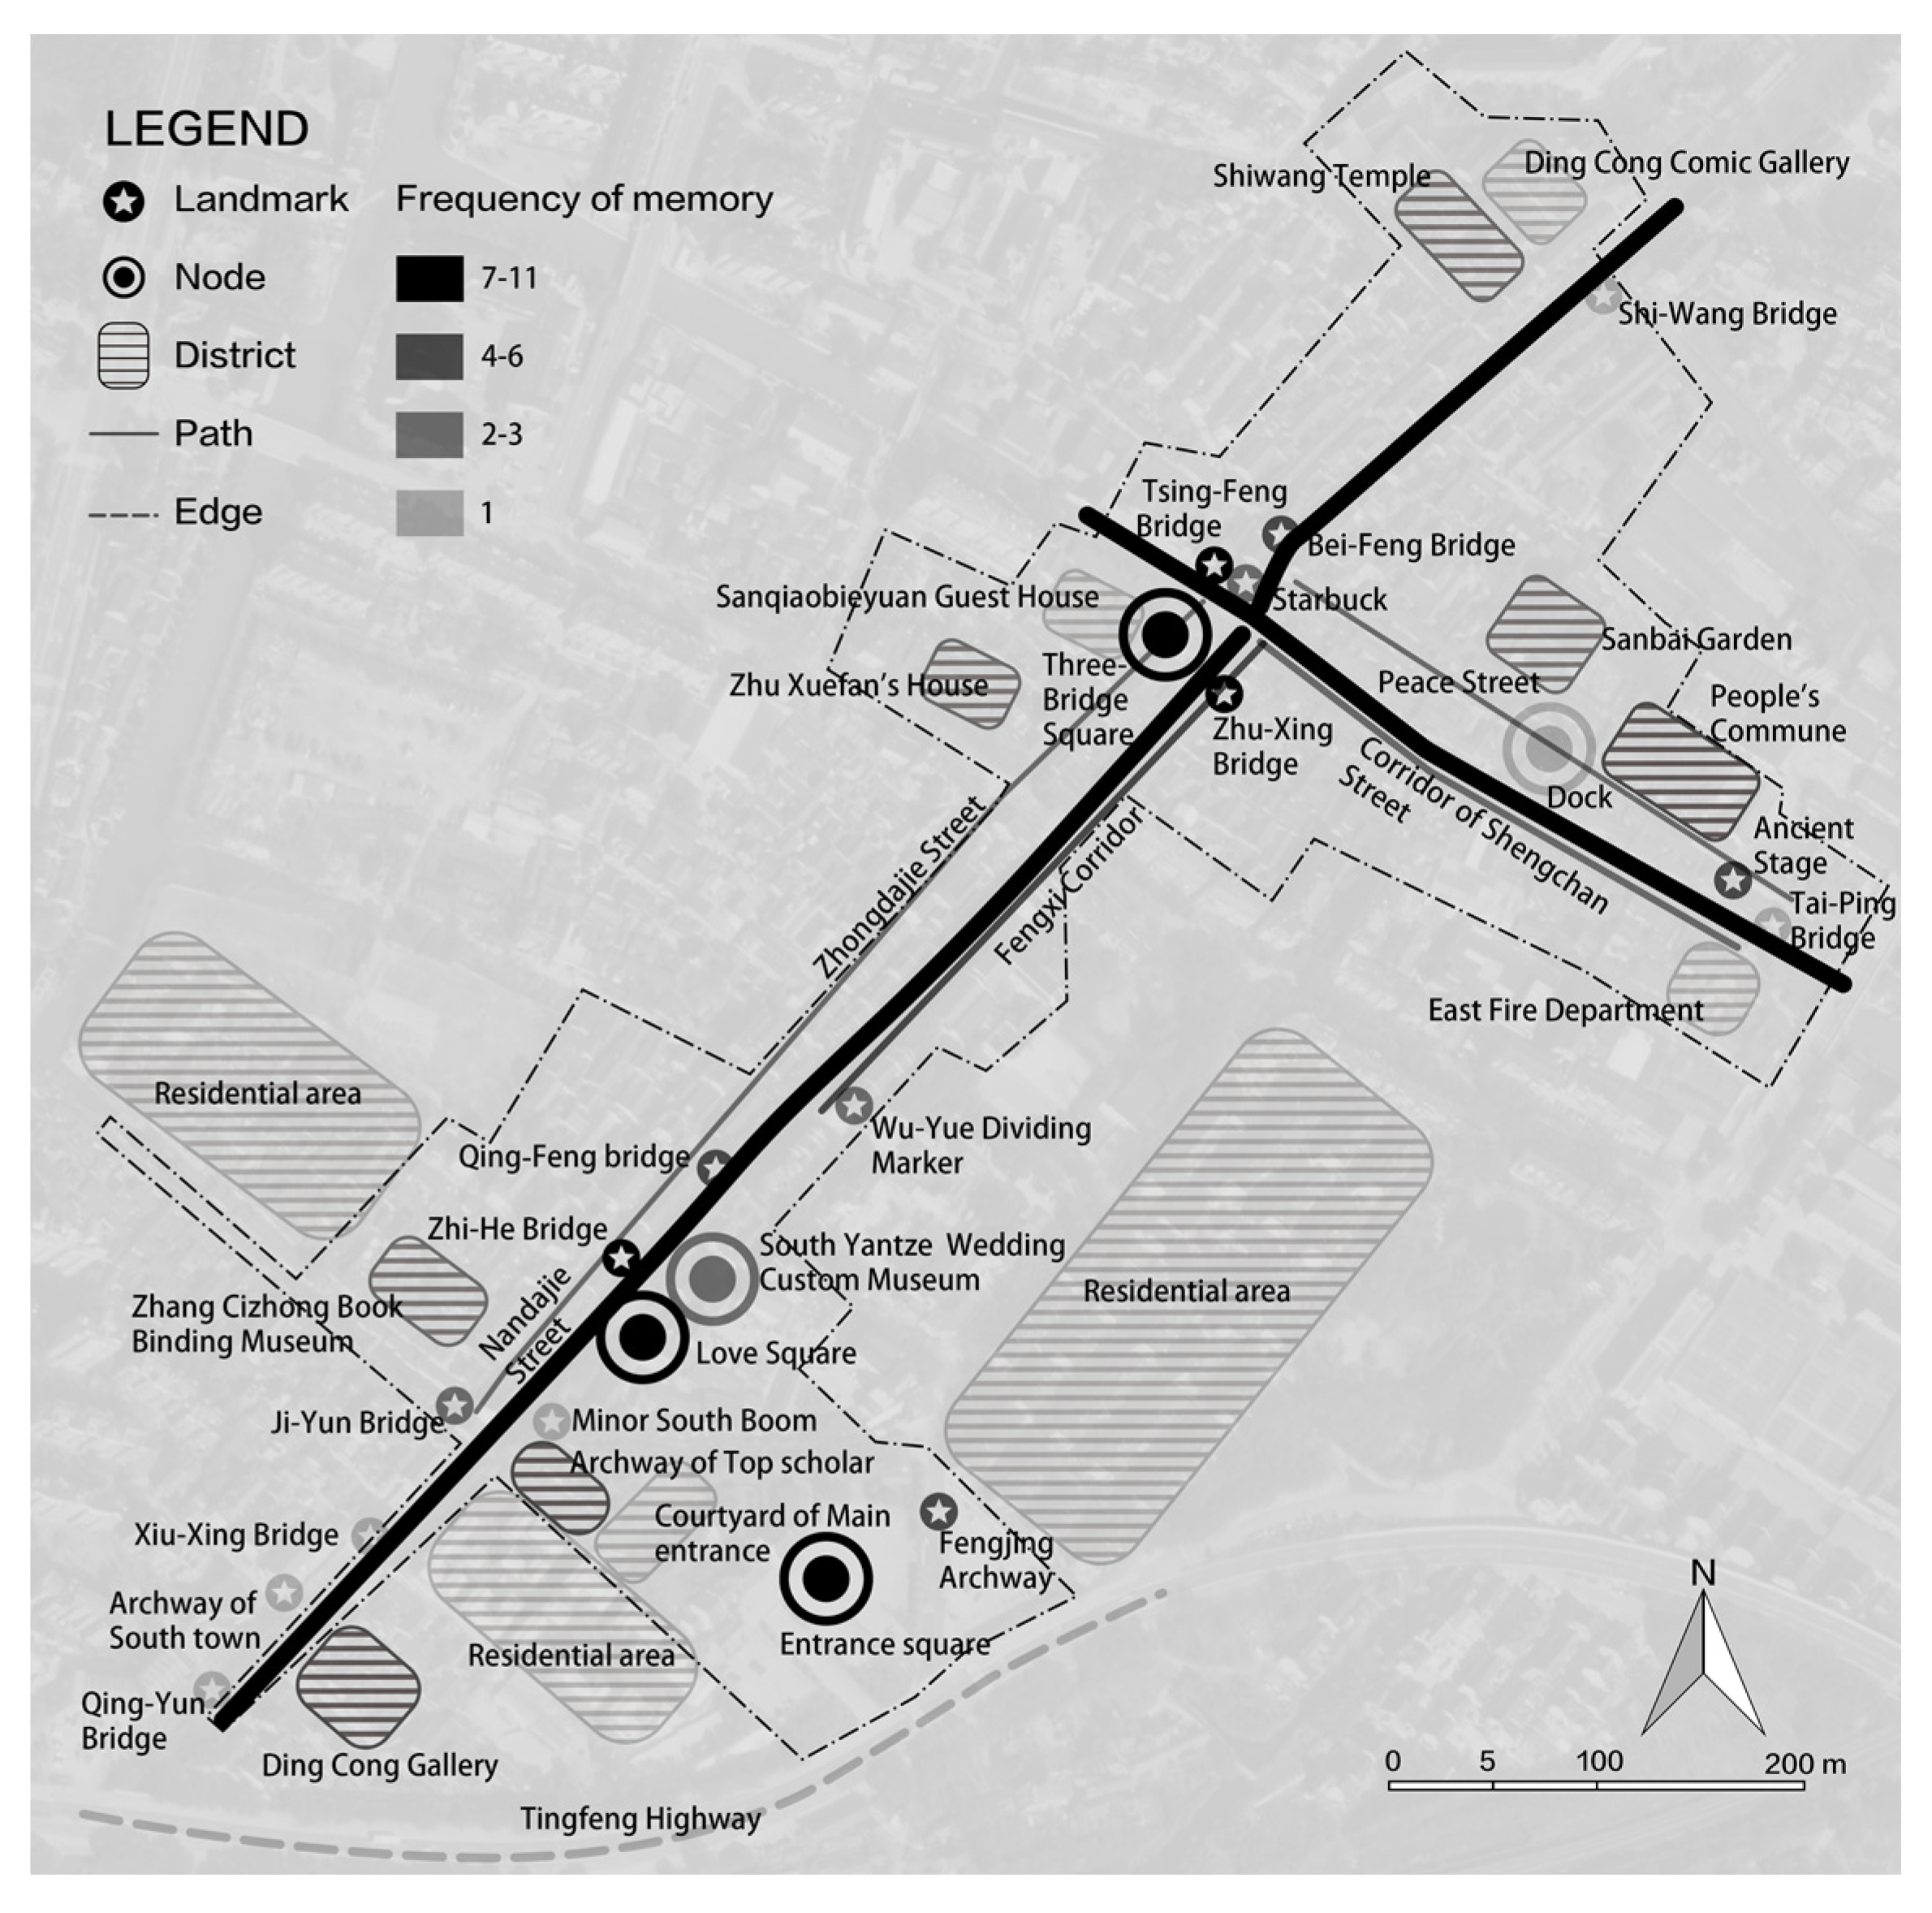
3.4. Spatial Memory Analysis of Tourists Based on Cognitive Memory Map
In the study, we conducted the extraction, statistics, and reproduction of spatial elements from 11 cognitive memory maps drawn by tourists. Through tourist interviews, the research found that there is a strong personal preference for the spatial elements that appear only once on the tourist cognitive map, which can be regarded as contingency and randomness. Therefore, only the spatial elements that are mentioned by two or more tourists will be selected in this research.
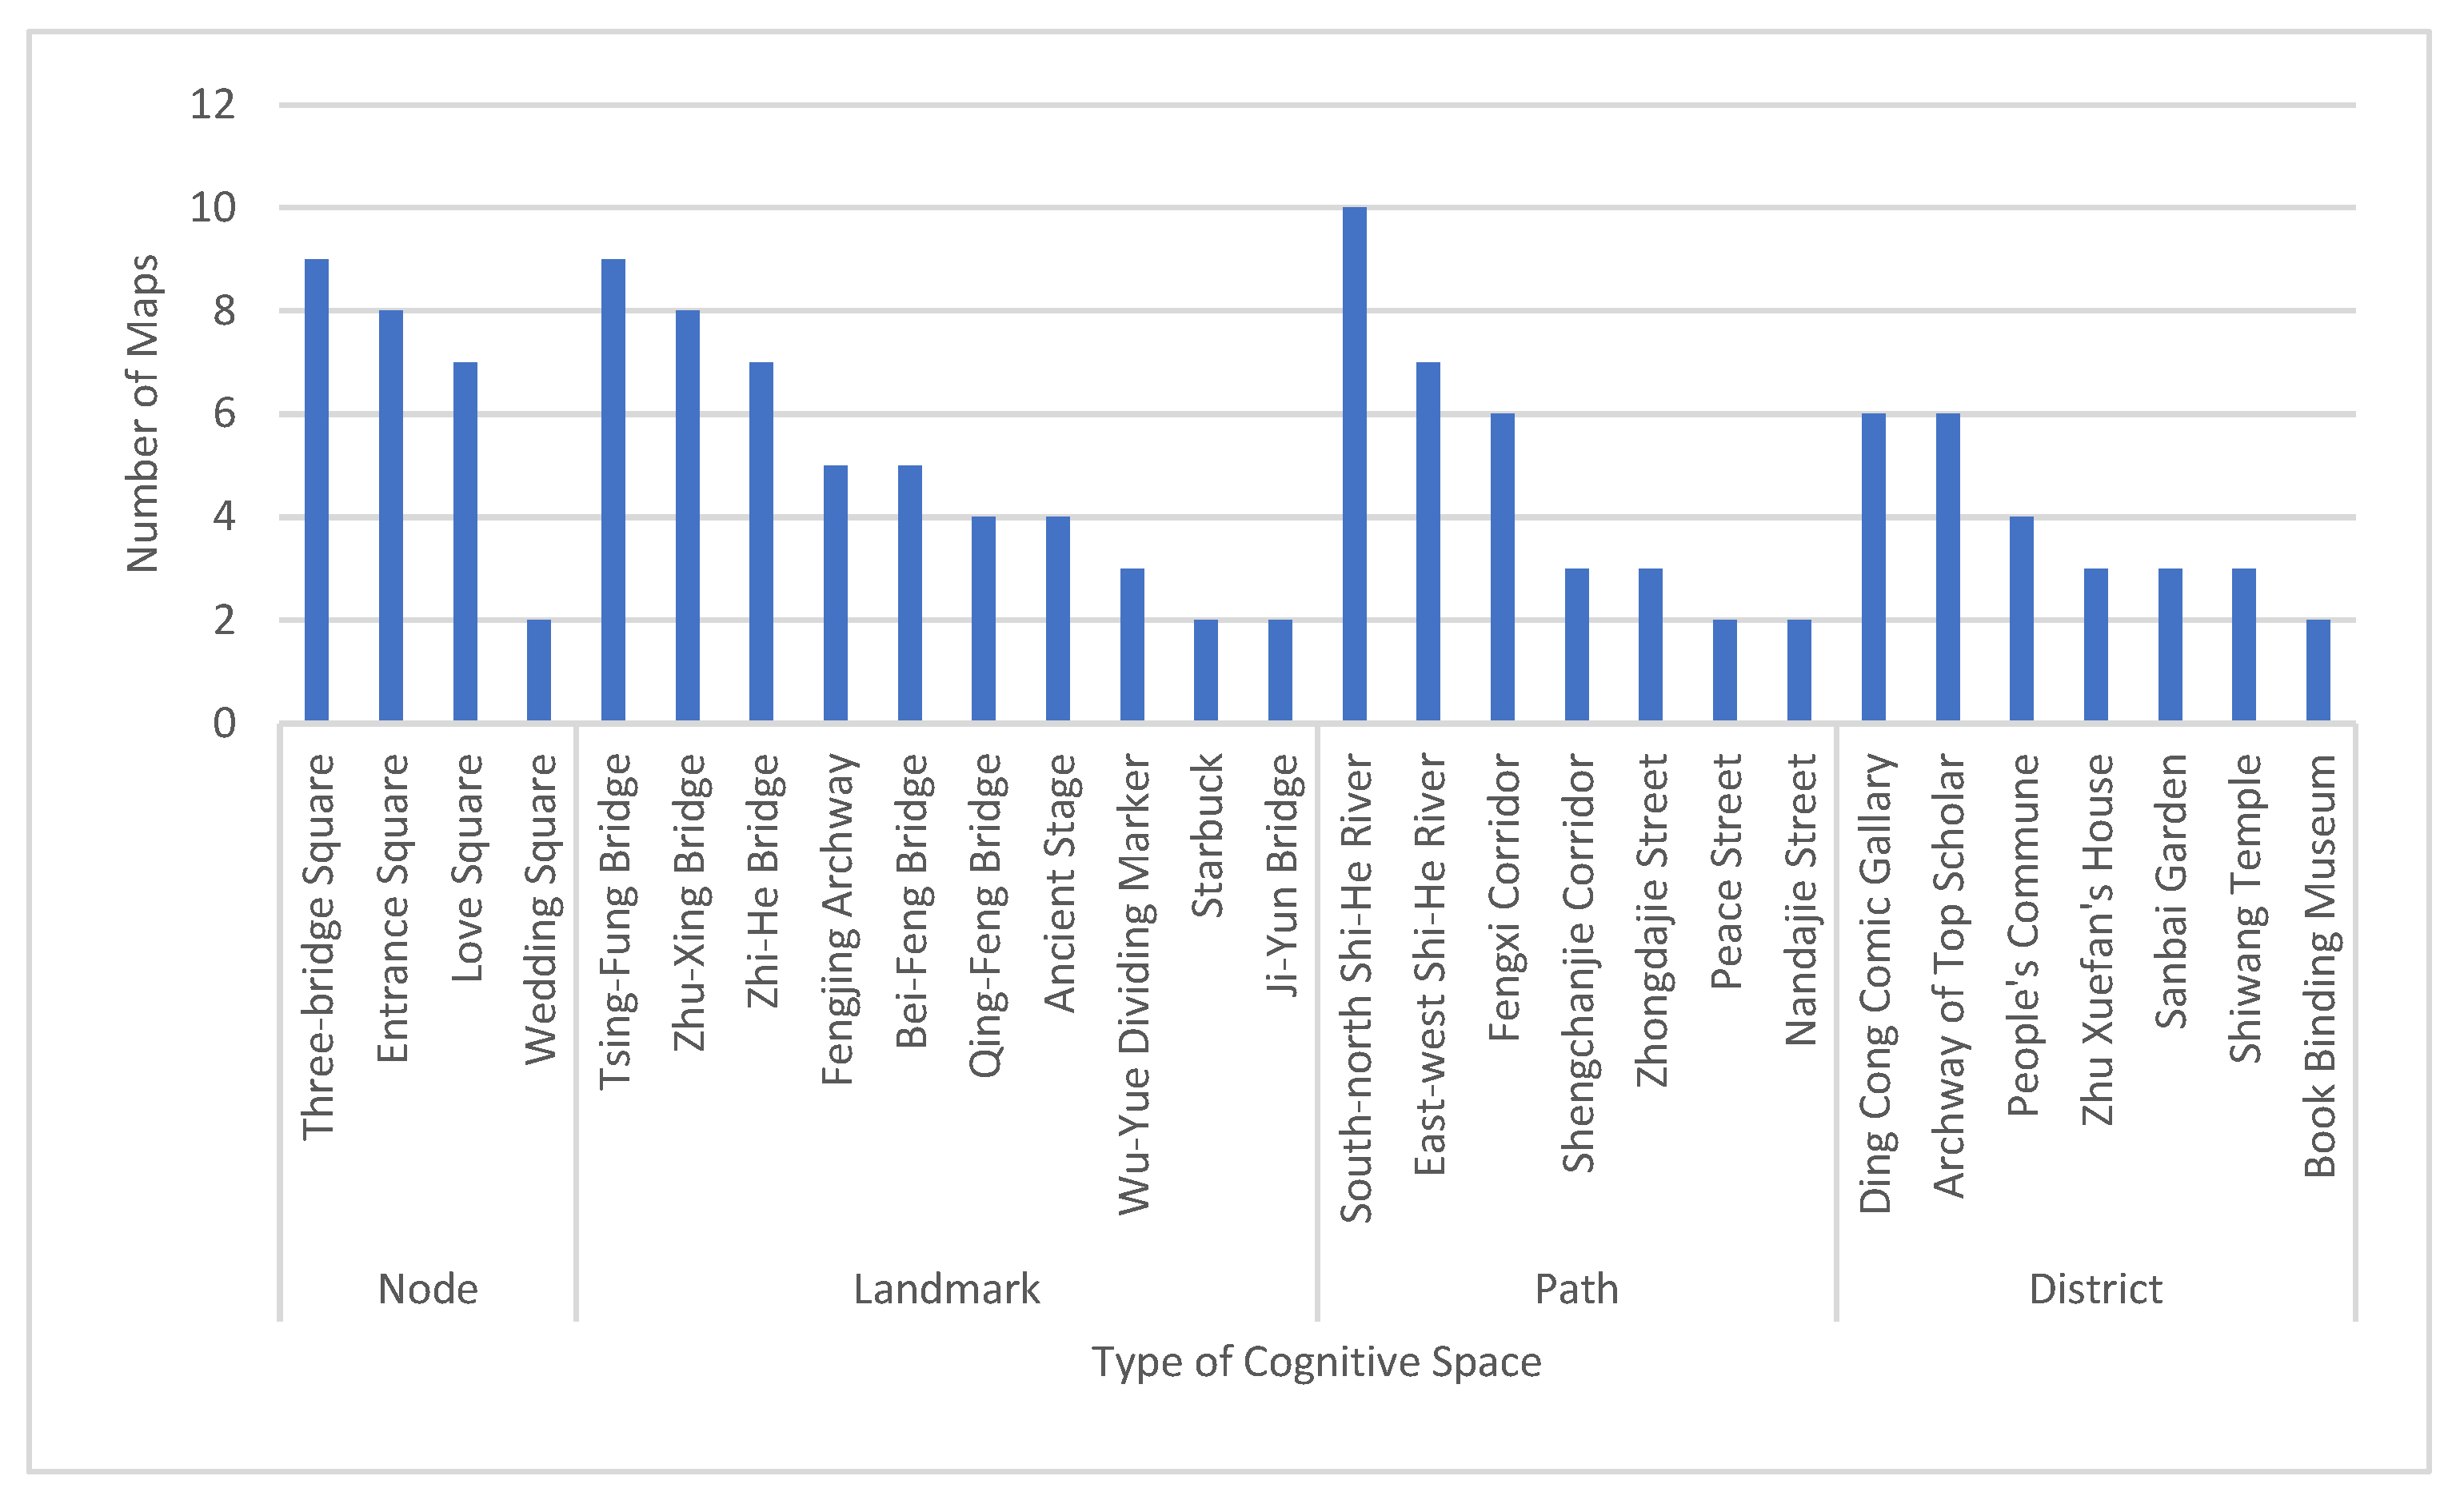
According to Kevin Lynch’s five elements of space imagery (
Table 2) and the frequency of occurrence in the memory map (how many times it occurs in tourists’ memory maps), all the spaces in Fengjing Ancient Town were divided into four categories (
Figure 8): high-frequency cognitive space (7–10 times), mid-frequency cognitive space (4–6 times), low-frequency cognitive space (2–3 times) and random (1 time). Subsequently, the memory space distribution map was made (
Figure 9).
It is found that the node spaces (squares in the town) are the high-frequency cognition space in the town. Due to Love Square and Wedding Square being directly adjacent to each other, most of the visitors just marked one point on their memory maps. Most mid-frequency cognition spaces are the landmarks and spatial points such as various ancient bridges in Fengjing Town. Whether the landmark point is close to the node space (squares) or not has a greater impact on the perception of visitors, while historical and cultural monuments have no obvious effect. Of all the nine ancient bridges in Fengjing Town, only three of them were recognized by tourists, while Tshing-Fung Bridge and Zhu-Xing Bridge with the highest memory frequency are not historical relics. In addition, it was also found that the most historical and cultural features of Fengjing, the Wu-Yue dividing maker and Wu-Yue dividing river, were not remembered by tourists. Three tourists marked the location of Wu-Yue dividing maker mistakenly at the location of Wu-Yue dividing river, and the Wu-Yue dividing river is completely unmarked by tourists. For the path space in the town, rivers can be more recognizable than the streets, and the spatial location labeling is basically accurate.
Most of the recognized scenic spots are on the main tour line on a relatively large scale (
Figure 9); other small scenic spots and scenic spots that deviate from the main tour line such as the Ding Cong Comic Gallery, Zhu Fanxue’s house, and East Fire Department are rarely remembered.
Tourists can memorize the names of the node spaces accurately, but most of them cannot remember the names of bridges, rivers, and roads. Among all the bridges, Zhi-He Bridge was only marked once, since the name and historical allusions of Zhi-He Bridge fit the theme of the adjacent Love Square, Wedding Square, and Wedding Hall.
3.5. Analysis of Tourism Spatial Cognition Based on Online Travel Photos
Our research classified 2812 travel photos based on Kevin Lynch’s five categories of urban space elements: Node, Path, Landmark, District and Edge, and added three categories of “Details” of buildings and structures, “Objects” and “Activity” as a supplement. Since there is no Edge category in the photos referring to the main content of those photos, 7 categories and 19 subcategories were formed (
Table 3). It found that compared with Weibo tourists’ check-in points, the types and spatial distribution of travel photos are more concentrated in distinctive spaces, while compared with the cognitive memory maps, the contents of photos are more diverse.
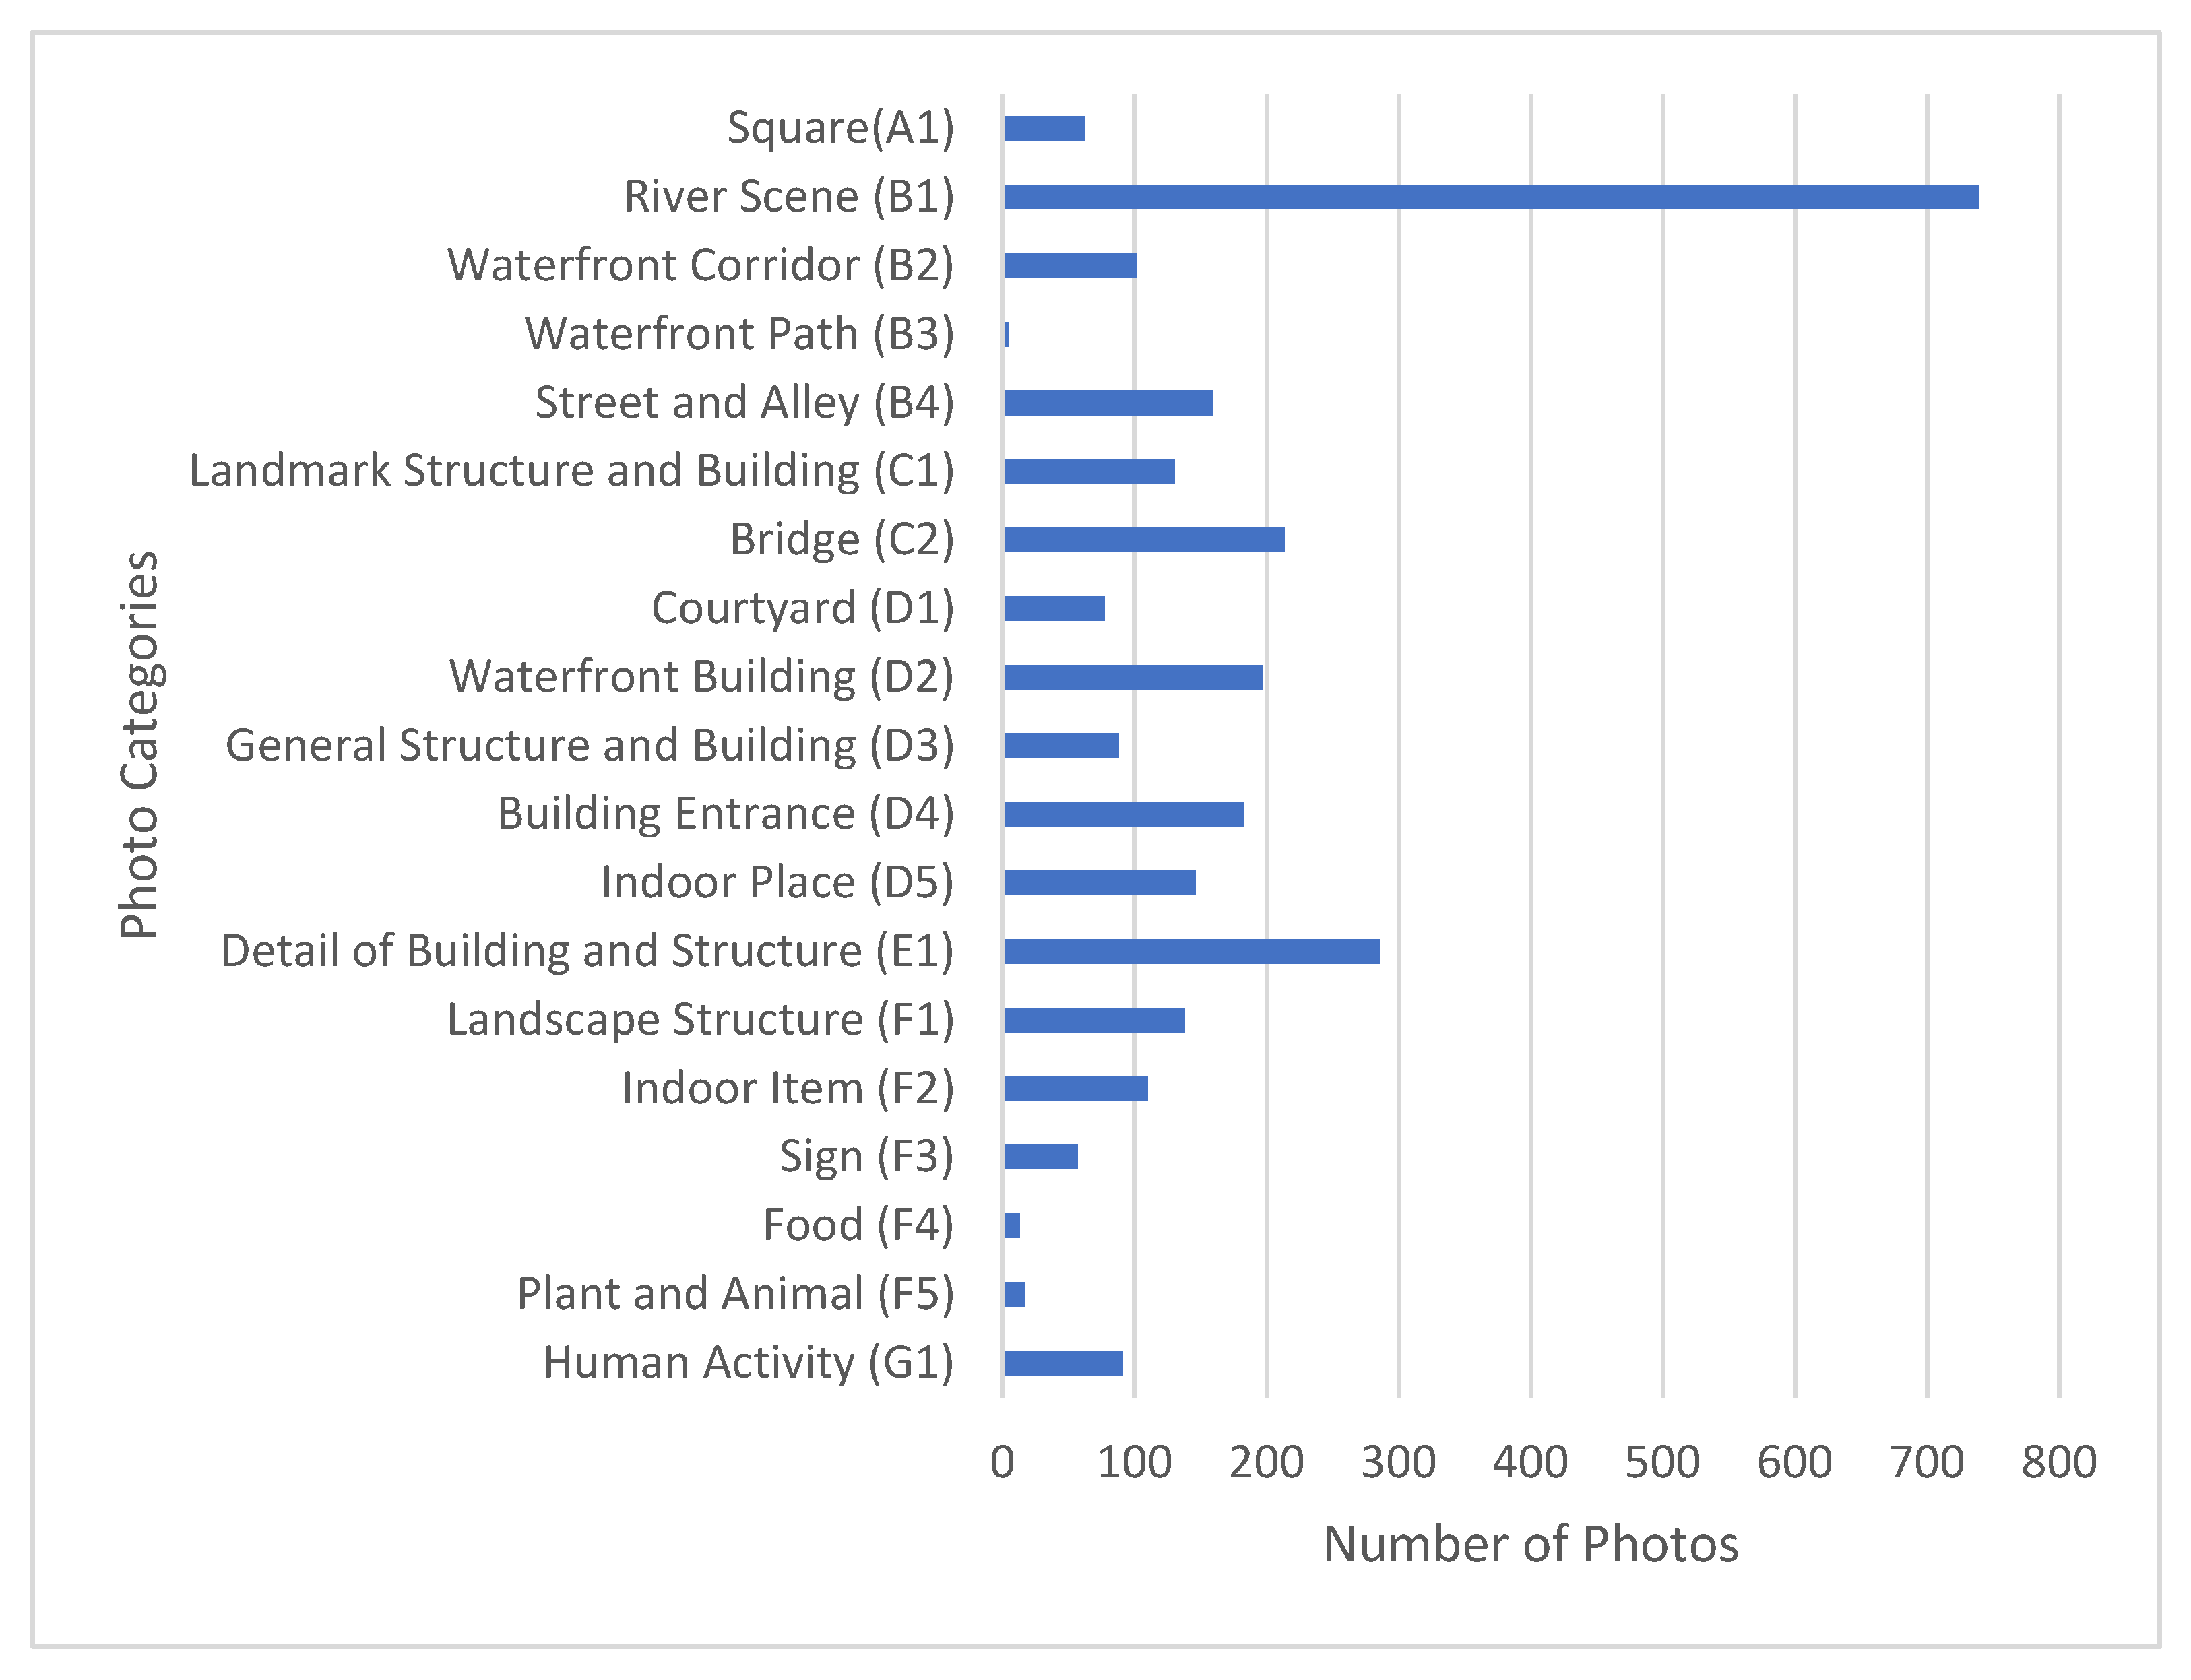
3.5.1. Analysis of Spatial Cognition Types Based on Photo Content
Figure 10 shows, for the content of travel photos, the category of Path attracts the most attention, among which river views photos are the majority (26.3%), followed by photos of buildings or architectural structures (10.2%) such as the distinctive horse head wall, ridge line of Zhongdajie Street, the brick and stone carvings in Fengxi Corridor, the balconies and fences of waterfront buildings, as well as the antique doors, windows, and lanterns, etc. The third category is various bridges (7.6%). Other photos include the entrance to the building representing the image of the town and several streets and alleys on the main route of Fengjing. The focus of tourists’ photography corresponds with the landscape characteristics of Fengjing Jiangnan Ancient Town: various rivers, numerous bridges, and densely covered alleys.
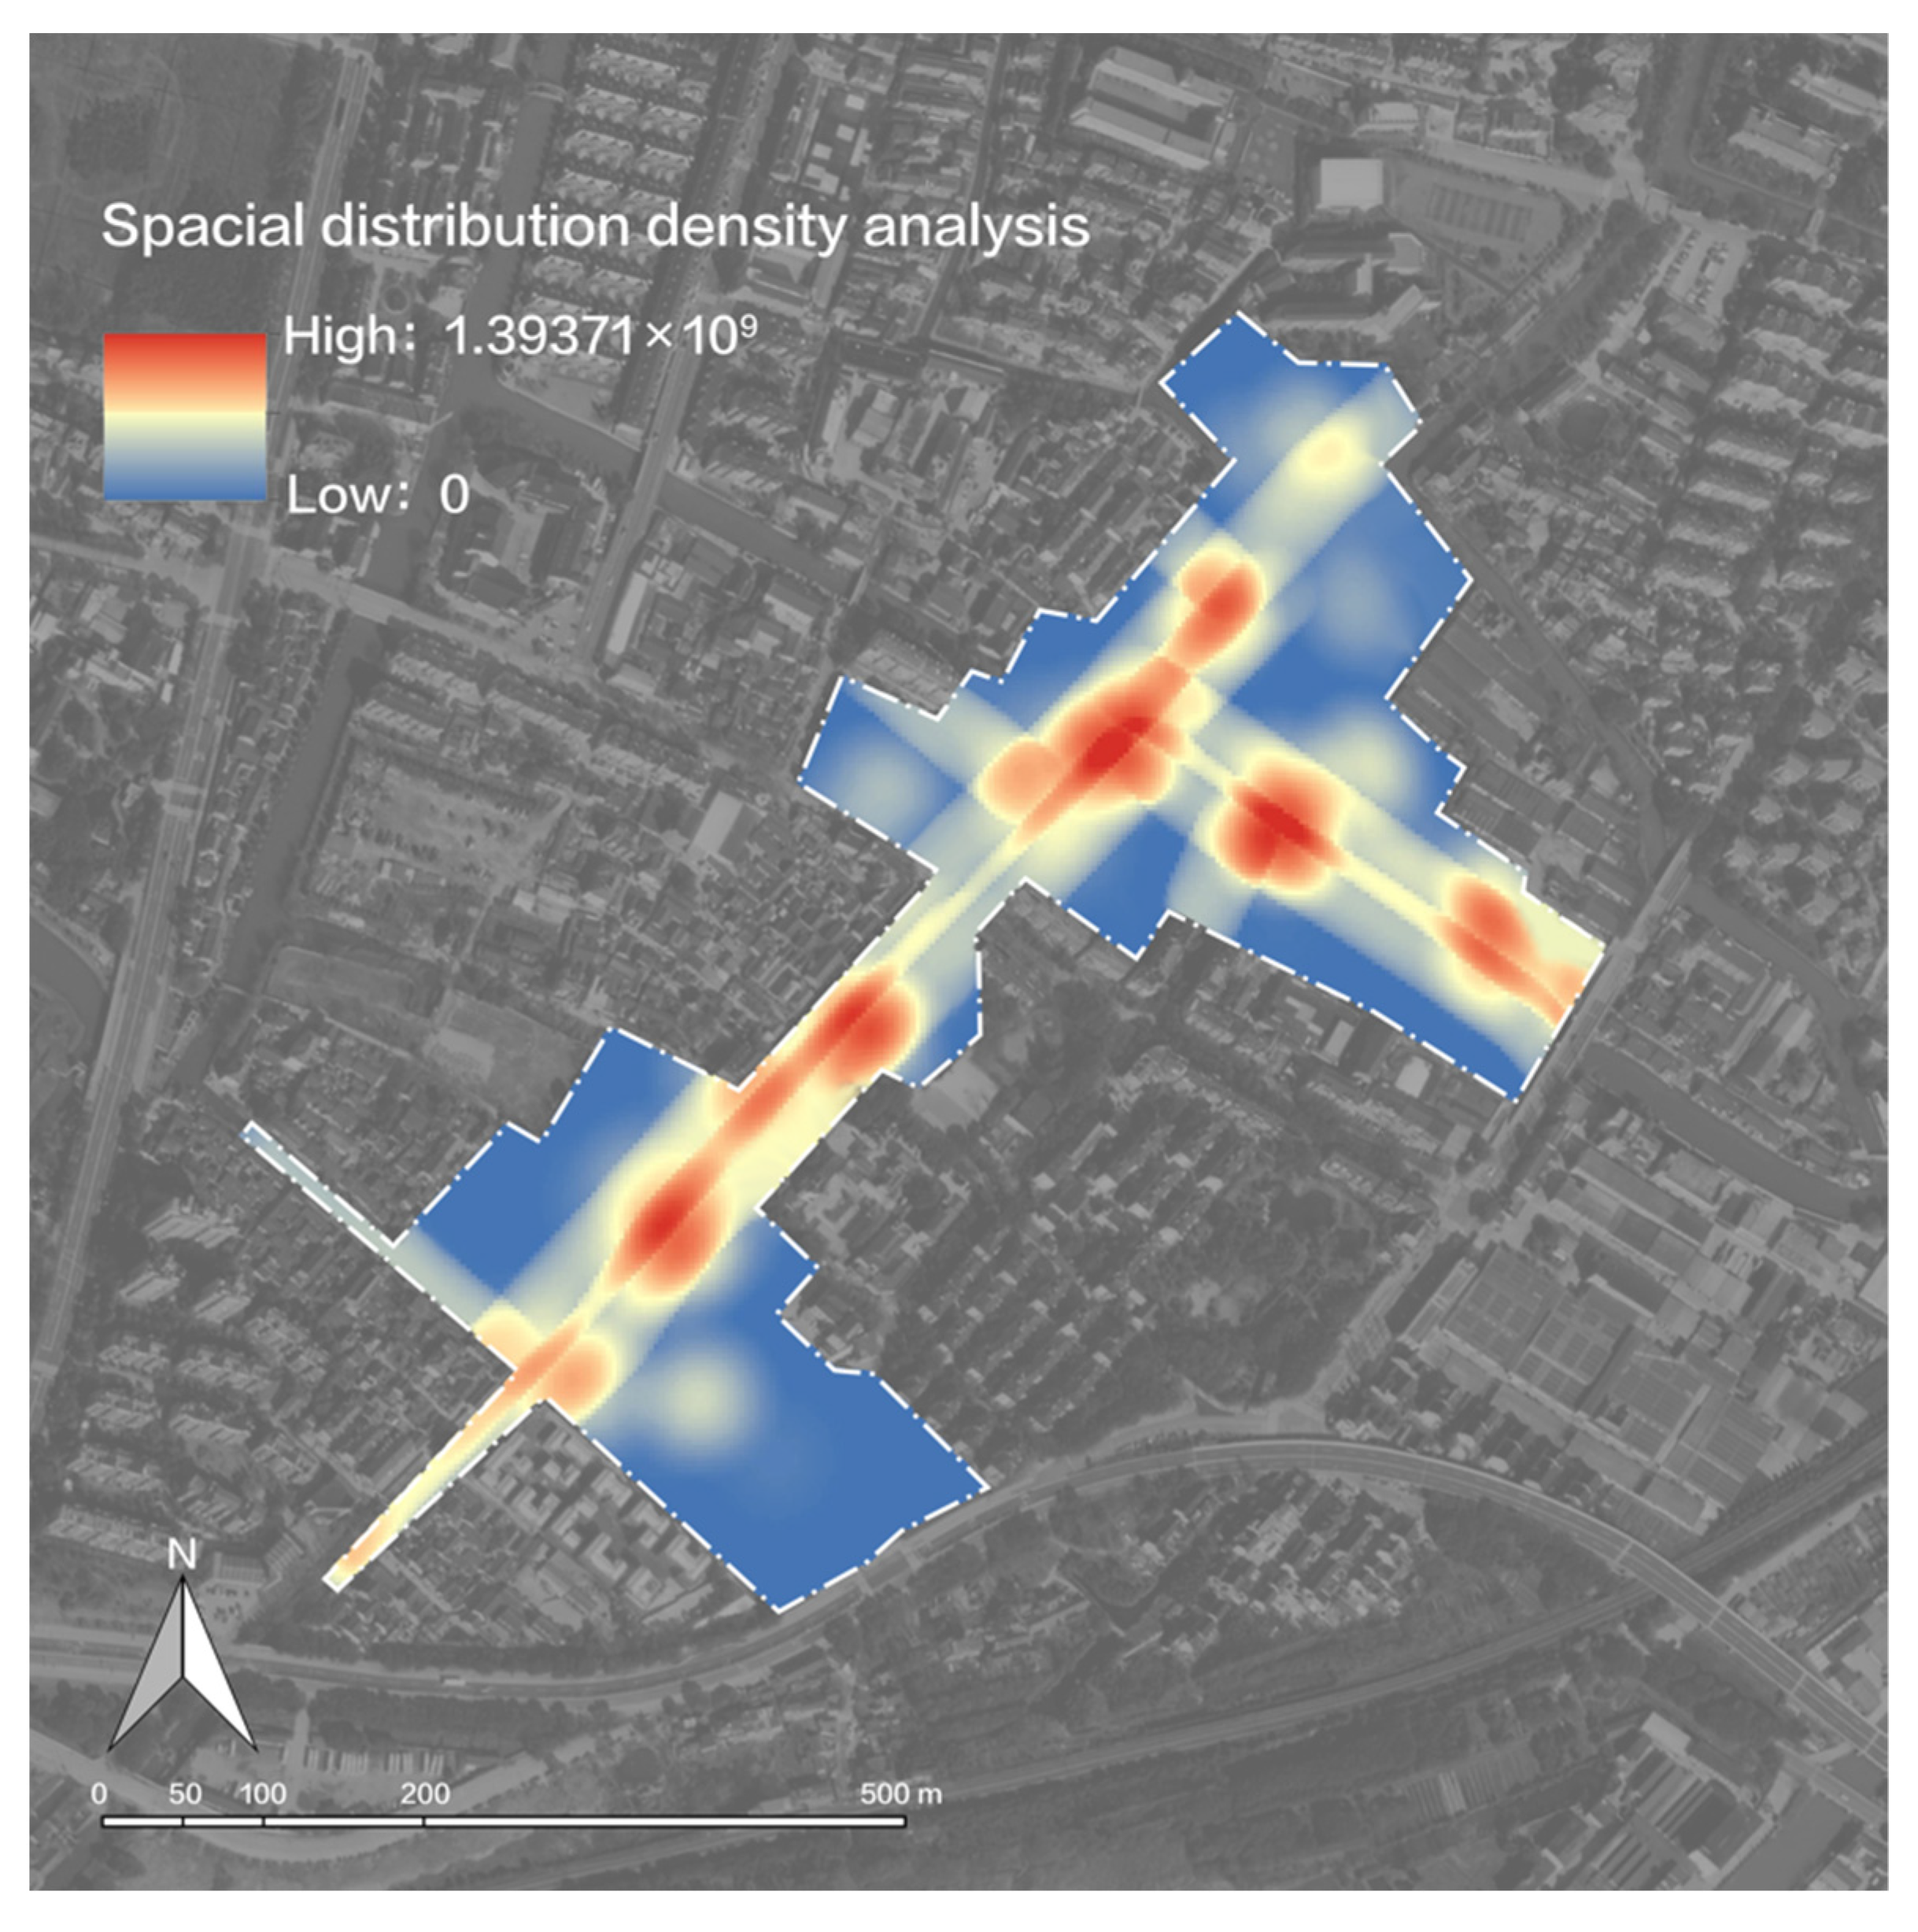
3.5.2. Kernel Density Analysis of Photos’ Spatial Distribution
Through the Kernel density analysis of the spatial distribution of tourists’ photos (
Figure 11), tourists’ perception of Fengjing Ancient Town reflects two aspects. The first aspect is waterfront preference. The distribution density of photographs shows an L-shape along the river. The second aspect is an aggregation of locations that can reflect the characteristics of the ancient town. Tourists prefer to take pictures at important nodes and landmarks including squares, bridges, and waterfront corridors.
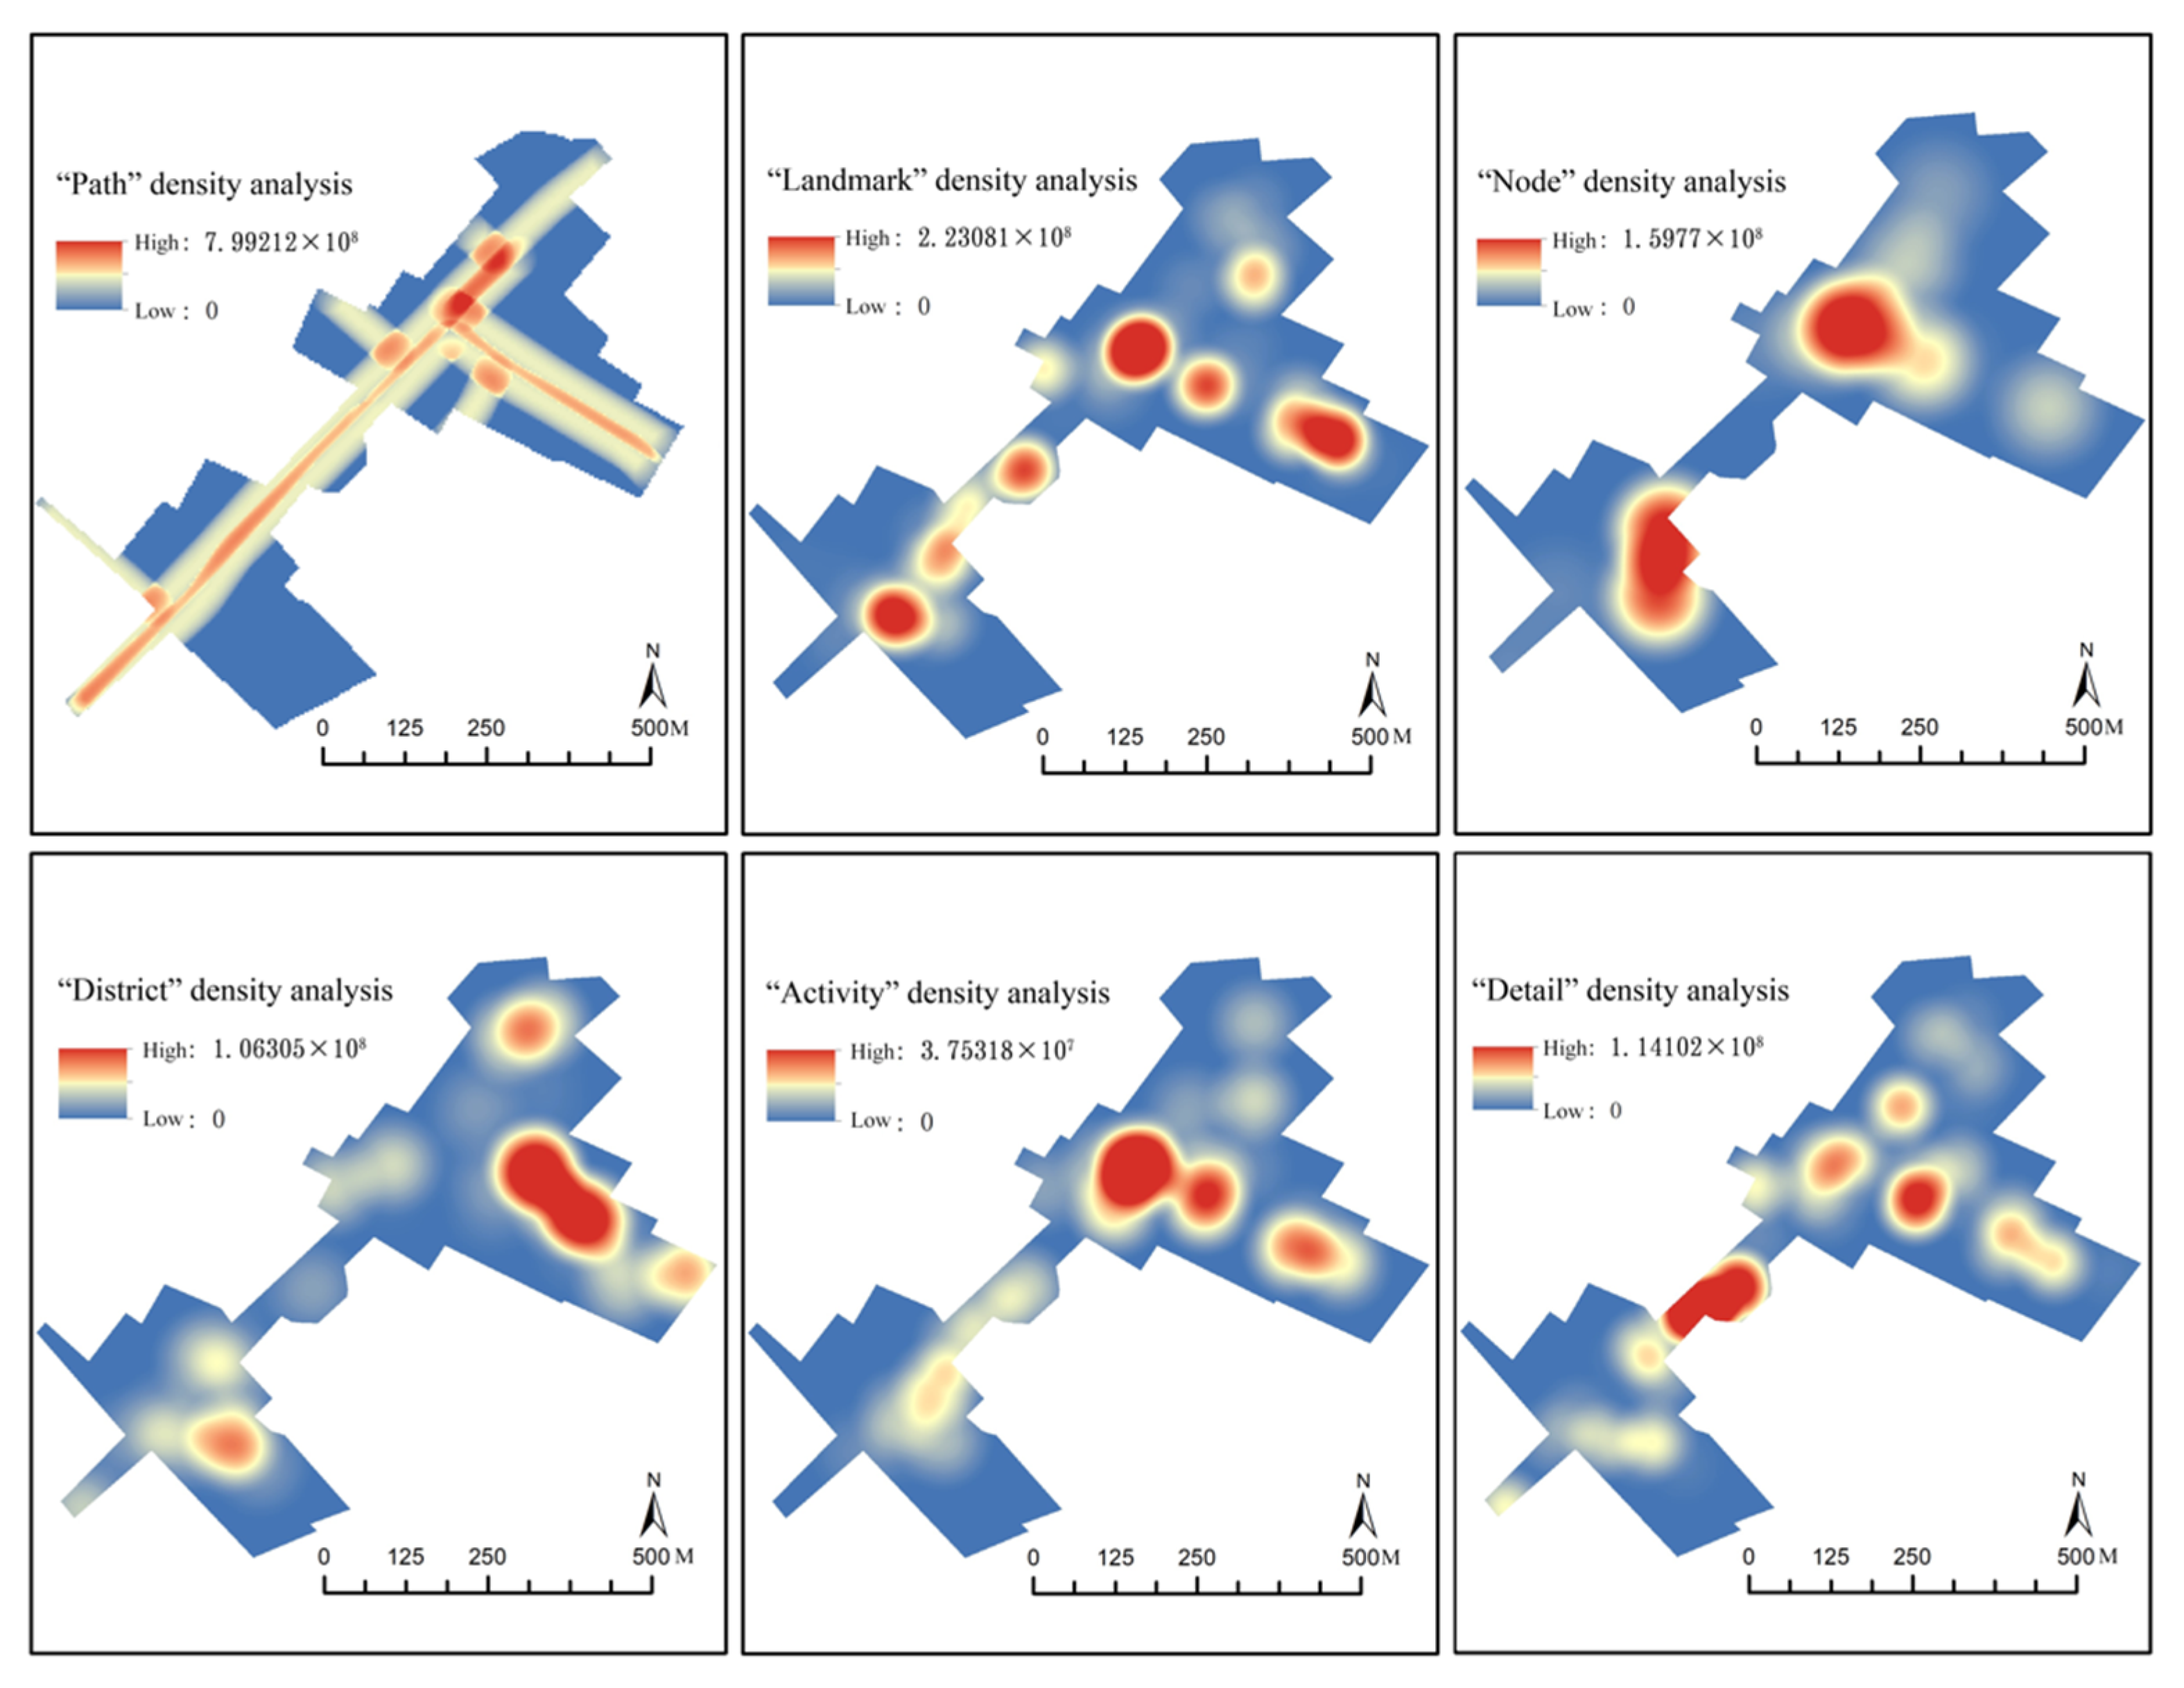
Using GIS to analyze the Kernel density of seven categories of photo spaces in
Table 3, it was found that the spatial distribution of “object” elements was related to the “district” elements, especially indoor places such as exhibition halls which has little effect on the interpretation of visitors’ spatial cognition; follow-up research will not take this category into account. Spatial distribution differences of the other six categories remain relatively large (
Figure 12). According to the six geospatial analyses of different space categories, it can be learned that:
- (1)
The spatial distribution of the photos in the Path category presents a T-shape along rivers. From the photos, it is found that rivers attract more attention than roads, especially the river near nodes and corridors which has the highest density distribution of photographs. Some tourists also stop at the intersections of bridges, roads, and rivers to take photos, while other roads and rivers are less attractive for tourists.
- (2)
Compared with other categories, the spatial distribution of photos in the Landmark category is uniform. Its overall distribution characteristic is similar to that of the Path category, but the L-shaped distribution is more prominent than in the Path category due to the north area being located far from the main tour line attracting less attention. Bridges are the most important symbolic spaces in Fengjing Ancient Town.
- (3)
Photos in the Node category have the highest concentration, mainly found in the three major squares, Three-bridge Square, Love Square, and Wedding Square, while other small node spaces are rarely mentioned.
- (4)
Photos in the District category follow the distribution of scenic spots in Fengjing Ancient Town, but a significant difference was shown in the attention levels to the different scenic spots. Sanbai Garden, the People’s Commune Site obtained the highest amount of attention, followed by the town’s main entrance courtyard and Ding Cong Comic Gallery; others, such as Shiwang Temple, Zhu Xuefan’s former residence, Wedding Hall, Ding Cong Memorial hall and other exhibition venues, received significantly reduced amount of attention.
- (5)
The spatial distribution of the Activity category is roughly similar to the Nodes category, while some of the photos in the Activity category were taken in waterfront corridors such as Shengchan Street. Activity photos rarely recorded tourism activities that occurred in various scenic spots such as Sanbai Garden, People’s Commune, Shiwang Temple, etc.
- (6)
The Detail category mainly records the details of buildings and architectural structures. This study focuses on the photos in the Detail category that can be located in Fengjing Town. The exterior photos in this category are mainly architectural components such as wall heads, balconies, doors, and windows, etc. which are mostly distributed along Zhongdajie Street. The interior details mainly focus on the interior decoration of ancient buildings, most of which are in Sanbai Gardens. The spatial distribution of the Detail category and Activity category shows an opposite result.
3.6. Research Results of Tourists’ Spatial Cognition in Fengjing Ancient Town
According to the travel process, the spatial distribution of Weibo check-in data expresses the tourists’ initial spatial cognition of the ancient town. The distribution is relatively scattered, covering a variety of space types, and does not clearly reflect the tourists’ preference for space.
At the end of the tour, the spatial layout of visitors’ cognitive space is mainly distributed along the river. Tourists have deep memories of the river guiding the main route, the people-gathering nodes and the landmarks with strong visual appeal, but the historical attractions of the ancient town which are not on the main tour line (such as the Wu-Yue dividing river, Wu-Yue dividing marker, and Shiwang Temple) are more likely to be forgotten. The visitor memory maps are directly connected with the activity track and activity content, so the study indicates that the tourist’s spatial memory is a place memory that associates the space with the activities occurring inside. Finally, the photos that are posted on the travel website are the tourists’ spatial expressions from organizing travel photos and memorizing the travel process after trips. Sharing photos and recommending travel destinations to others reflect people’s identification of the tourist attractions, and also their image perception. Based on travel photos, tourists prefer the category of “Path”, “Landmark”, and “Detail” that could reflect the spatial characteristics of the Jiangnan water town such as rivers, bridges, waterfront buildings, alleys, walls, cornices, etc.
Taking spatial cognition in three time dimensions into consideration, the spaces in the categories of Path and Landmark are two types that are the most well remembered and recognized. Spaces in the District category are preferred by tourists because of their diverse landscapes, but their locations are difficult to remember. Although the square (in the Node category) easily leaves an impression on tourists, the overall space is weakened in travel notes. In contrast, tourists prefer landscape structure as well as the details of some buildings and structures in the Node category. Therefore, the space with strong spatial sequence and dense activities is more impressive, and whether it is visually attractive is the most important feature that affects photo selection (
Figure 13).
Spatial cognitive boundaries are often spatial elements such as rivers that block cross-strait traffic or expressways. The space cognitive map shows that tourists have limited knowledge of the boundaries of Fengjing Ancient Town. However, the distribution of travel photos reveals that the travel range of tourists is roughly the same, at the core protected area of the ancient town, indicating that expressways and viaducts at the boundary of the core protected area limit the scope of tourist activities. As a result, several tourist spots on the edge of the core area, such as Cheng Shifa’s Ancestral House and the former site of Fengjing Railway Station, have often been neglected.
Tourists’ activity participation is one of the most important factors affecting tourists’ spatial cognition. Comparing tourists’ memory maps, travel photos, and the distribution map of historical sites around the core area of Fengjing Ancient Town, all of the historically protected buildings without tourism development are not recognized by tourists, such as Cheng Shifa’s Ancestral House, Ye’s Houses, as well as various historical relics such as the Fire Fighting Monument of Fengjing, Bullet-scarred Wall, the South Watchtower of Fengjing Railway Station, etc. Tourist attractions with low tourist participation do not possess the emotional resonance for tourists, such as the East Fire Department, Old Postal Sites, Art galleries, art galleries, etc., which are rarely transformed into a spatial memory since most of the visitors just take photos of the entrance to the building without diving into the interior content.
In addition, whether from Weibo check-in data, tourist intention maps, or travel photos, tourists’ cognition of Fengjing Ancient Town is fragmented. Although some spaces leave impressions on tourists’ minds, the spatial relationship between spaces is unclear. Thus, the overall spatial cognition of Fengjing Ancient Town has not been formed.
4. Discussion
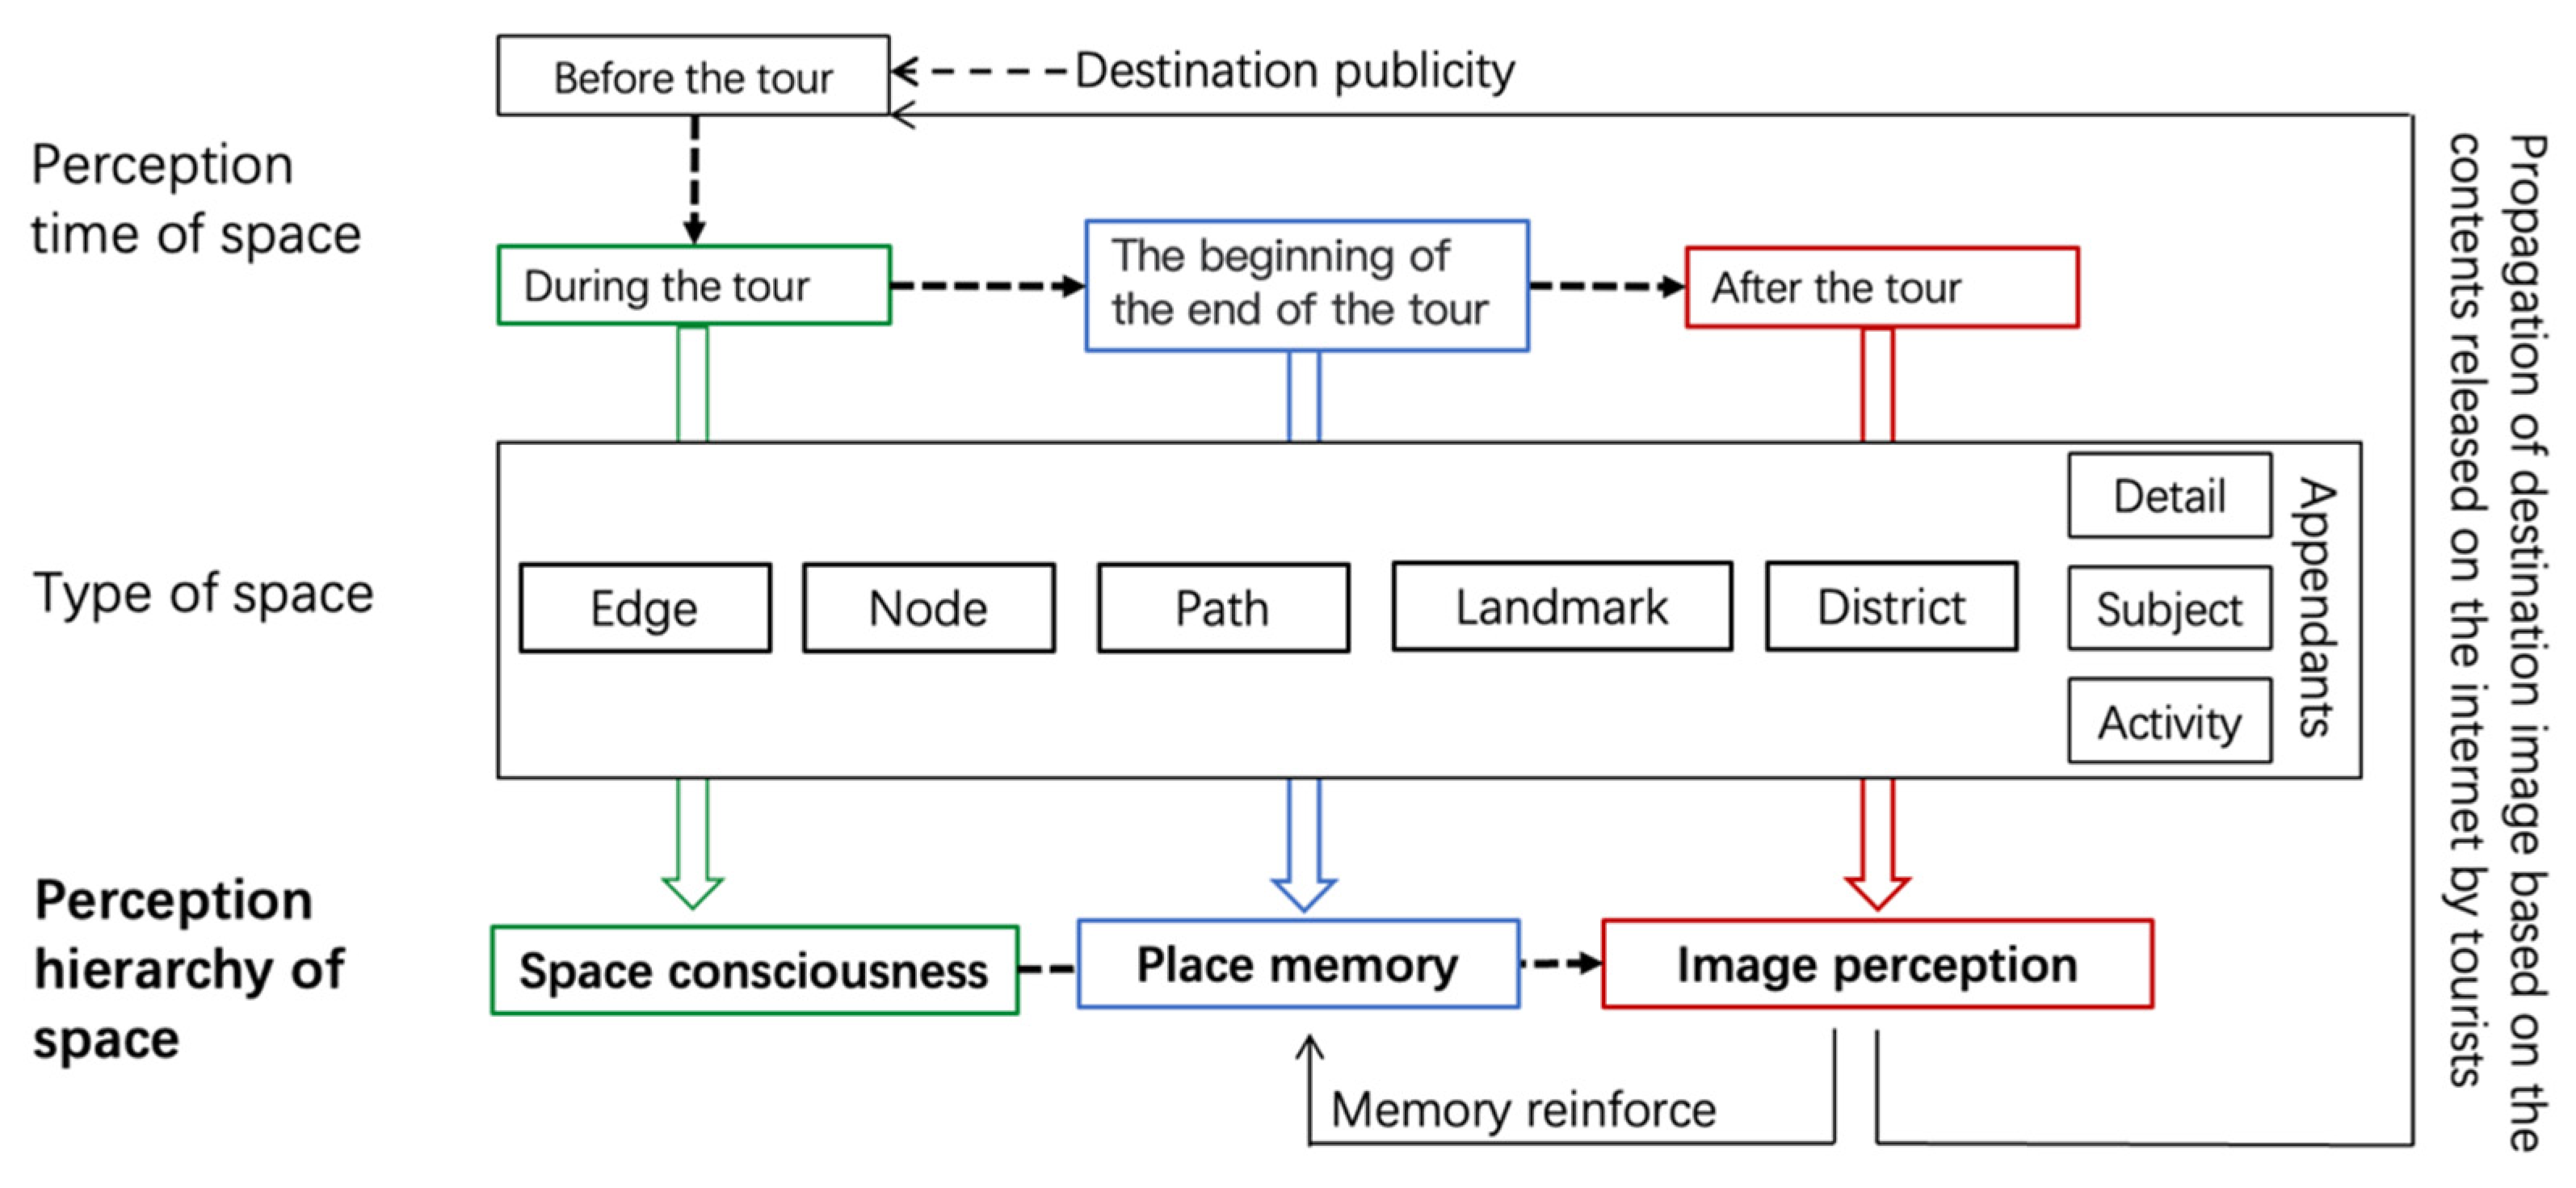
Tourists’ spatial cognition of tourist destinations develops progressively over time, from initial spatial consciousness to place memory, and then to imagery perception (
Figure 14). The initial spatial consciousness is derived not only from the first on-site impression of a tourist destination, but is also influenced by tourism promotion by Destination Management Organization (DMO) and online travel notes from User Generated Content (UGC). At this stage, the spatial distribution of consciousness is relatively random and uniform. Then, at the end of the trip, tourists’ place memory mainly depends on two points. The first point is the sequence of the spatial system. It is easier for tourists to remember the space that is more sequential and has more overlaps with the main tour line. The second is the tourist activities that take place in the space, such as following the crowds out of plazas, celebrations in the central plaza, disembarking at the pier, dining and resting in the waterfront corridor, etc. The combination of activities and space forms the visitor’s memory of the place, so it is difficult to form the visitor’s place memory by simply walking around. Finally, through organizing photos, recalling the travel process, and writing travel notes, tourists form a systematic image perception of the tourist destination, which includes various types of tourism spaces as well as landscape details, tourist activities, flora, and fauna that reflect the characteristics of the ancient town. Then, the image perception will spread through the online travel notes, which affects the preliminary cognition of potential visitors.
Space is the most important object of tourist perception. Historical culture, traditional conventions, and travel activities must use space as the carrier to be recognized, memorized, and perceived by the tourist. Fengjing Ancient Town preserves the main channel called “Shi-He River” which crosses many bridges, near Jiangnan style architectures row upon row; thus, rivers, bridges, and buildings appear in the travel photos, establishing a logo image of the ancient town. However, monuments and rivers serving as the boundaries of Wu and Yue from a historical perspective were not perceived by the tourists, surprisingly. Monuments and rivers are spatially separated, and both are hidden in the bustling commercial space of Fengjing Town, which makes the image and memory of monuments and rivers indistinct. There is no clear guidance on how to approach the boundary rivers on the map. Only 27.3% of the tourists can mark the location of the monuments, and none of them are correct. In tourism development, such landmarks need to be supplemented with a clear spatial definition and their visual appeal should be highlighted.
Besides the spatial carrier, the history and culture need to be marked by text and names. Researchers find that neither maps on the internet, for example, Baidu Map, nor the tourist map in the ancient town have clearly marked the names of rivers, thus only Zhi-He bridge is memorized by tourists because the origin of the name is from historical incidents; in addition, considering the existence of many canals, the correspondence between the wedding square and the wedding exhibition hall is limited and weak. Other rivers and bridges, including the “Shi-He River” which is the main river that runs through the ancient town, the bridges frequently appearing in memory maps and travel photos, Tshing-Fung Bridge and Taiping Bridge, are not memoizable for the tourists.
Tourists’ spatial memory and spatial perception can be consciously guided through the organization of tourism activities, including well-designed tourism routes and participatory activities. A tour route with clear guidelines and a strong sequence of activities will play a key role in tourists’ spatial cognition, connecting its otherwise fragmented nature. For example, the Water Town Wedding Ceremony—the celebration event of Fengjing Ancient Town—connects the Shiwang Temple on the north side, the ancient stage on the east side, and the Love Square and wedding square on the south side through boat cruises and parades. In addition, folk activities at the Wedding Ceremony allow tourists to participate in various wedding customs in depth and help visitors to perceive the whole Fengjing town space better. However, this tourist activity is held once a year, so the proportion of participating visitors is small. Fengjing Ancient Town still needs regular tourism activities to guide visitors’ travel routes and to improve tourists’ participation so as to establish a more systematic ancient town image.
5. Conclusions
According to this research, tourism space is the most important carrier of tourists’ spatial cognition and imagery perception. At the same time, tourists’ cognition and perception of tourism space changes with the travel process. Tourists’ cognition of space evolves from the even and random spatial recognitions of tourism space into a spatial memory affected by the layout and activity of tourism space, and finally forms the imagery perception that can reflect the preferences of tourists. In this process, organized tourism space planning, reasonable tourism activities and programs aligning with the space function and name as well as clear travel guidelines can strengthen the tourists’ spatial cognition, improve tourists’ travel experience, and finally establish a complete and unique image of the tourist destination.
This research finds that using data, whether big or small, from a single source to analyze tourists’ spatial cognition and preferences may lead to inaccurate results. Insufficient data is also a shortcoming of this study. The low accuracy coordinate of Weibo check-in data makes it difficult to support an in-depth analysis of tourists’ spatial preferences. Compared with Weibo check-in data and travel photos, the sample size of spatial memory map research is relatively small. Most of the photos from online travel notes are shared by the young generation, most of which reflect the visual image of the destination but lack activity experience and emotional expression. Subsequent research will conduct an in-depth content analysis of Weibo check-in texts, travel notes texts, and tourist questionnaire interview texts to achieve a complete and in-depth analysis of tourists’ spatial cognition as well as emotions based on space and activities.
Author Contributions
Author Contributions: Conceptualization, L.W., J.D. and M.G.; methodology, L.W. and J.D.; software, M.C., Y.S. and X.T.; validation, J.D. and M.G.; formal analysis, L.W. and M.G.; investigation, L.W. and J.D.; resources, L.W. and M.G.; data curation, J.D., L.W. and X.T.; writing—original draft preparation, L.W. and J.D.; writing—review and editing, M.G., L.W. and X.T.; visualization, J.D., M.C., Y.S. and X.T.; supervision, L.W. and M.G.; project administration, L.W.; funding acquisition, L.W. All authors have read and agreed to the published version of the manuscript.
Funding
This research was funded by Shanghai Planning Office of Philosophy and Social Science, grant number 2019BCK001.
Data Availability Statement
Not applicable.
Conflicts of Interest
The authors declare no conflict of interest.
References
- Long, Y.; Wu, K.; Wang, J.; Liu, X. Big Models: A novel paradigm for urban and regional studies. Urban Plan. Forum 2014, 6, 52–60. [Google Scholar]
- Fernandez, J.; Song, Y.; Padua, M.; Liu, P. A Framework for Urban Parks: Using Social Media Data to Assess Bryant Park, New York. Landsc. J. 2022, 41, 15–29. [Google Scholar] [CrossRef]
- Li, C.; Wen, T. Thick Data: A Research Review. Libr. Work. Coll. Univ. 2022, 42, 8–14+28. [Google Scholar]
- Bornakke, T.; Due, B.L. Big-Thick Blending: A method for mixing analytical insights from big and thick data sources. Big Data Soc. 2018, 5, 2053951718765026. [Google Scholar] [CrossRef]
- Zheng, R.; Tang, X.; Wang, Y. Research on renewal path of urban old community park supported by thick data: A case study of Shanghai Songjiang Rene Garden. J. Anhui Agric. Univ. 2020, 47, 986–995. [Google Scholar] [CrossRef]
- Zhang, X.; Mao, M.; Xing, X.; Gao, S.; Zhang, P.; Jiang, D. “Thick data + Big data” Activate the public life of old communities: A case study of Beijing Duck Bridge community. Beijing Plan. Rev. 2018, 32, 4–10. [Google Scholar]
- Meng, Y.; Deng, S.; Li, Y. Tourism image research of Yuelu Mountain scenic spot based on cognitive map. Areal Res. Dev. 2018, 37, 118–122+146. [Google Scholar]
- Xu, X.; Xu, C.; Gao, J. Using VEP method to understand tourists’ perception on ancient water towns in Southern Yangtze River: A case study of Shanghai Fengjing ancient town. Areal Res. Dev. 2017, 36, 121–126. [Google Scholar]
- Beerli, A.; Martin, J.D. Factors influencing destination image. Ann. Tour. Res. 2004, 31, 657–681. [Google Scholar] [CrossRef]
- Li, Y.; Chen, X.; Liu, P.; Huang, G. Research on image percetion of heritage tourist destinations from the three-dimensional perspective of “cognition-emotion-integrity”: Taking Xiangjiang ancient town group as an example. Hum. Geogr. 2021, 36, 167–176. [Google Scholar] [CrossRef]
- Pi, R.; Zheng, P. A research on Shaolin Temple’s tourism cognitive image, affective image and overall image-Based on web text. J. Arid. Land Resour. Environ. 2017, 31, 201–207. [Google Scholar] [CrossRef]
- Li, M.; Ding, R.; Zhang, Y.; Liu, W.; He, H.; Liu, H. From cognitive sciences to learning sciences: The past, the present and the future. Tsinghua J. Educ. 2018, 39, 29–39. [Google Scholar] [CrossRef]
- Shen, X.; Ge, M.; Wang, Q.; Padua, M.G.; Chen, D. Restoring, Remaking and Greening Freshwater Ecosystems: A Review of Projects in China. Ecol. Restor. 2022, 40, 172–178. [Google Scholar] [CrossRef]
- Rasoolimanesh, S.M.; Seyfi, S.; Hall, C.M.; Hatamifar, P. Understanding memorable tourism experiences and behavioural intentions of heritage tourists. J. Destin. Mark. Manag. 2021, 21, 100621. [Google Scholar] [CrossRef]
- Shi, D.; Zhang, B.; Yi, B. How is tourist destination perception formed? Exploratory research based on text mining. Tour. Trib. 2022, 37, 68–82. [Google Scholar] [CrossRef]
- Tao, W.; Ren, J. Progress in Domestic Research on Spatial Cognition in Human Geography. J. South China Norm. Univ. (Nat. Sci. Ed.) 2020, 52, 1–10. [Google Scholar]
- Decrop, A.; Snelders, D. A grounded typology of vacation decision-making. Tour. Manag. 2005, 26, 121–132. [Google Scholar] [CrossRef]
- Zhang, D.; Qiu, F. A Summary of Ancient Town Tourism Studies at Home and Abroad. Tour. Trib. 2011, 26, 86–92. [Google Scholar]
- Xiong, X.; Zhang, S.; Zhou, J. The Problem and Strategies of the Canal Towns’ Tourism in Jiangnan: The research of the tourism in Zhouzhuang, Tongli, Luzhi. Urban Plan. Forum 2002, 6, 61–63+80. [Google Scholar]
- Ruan, Y.; Yuan, F. The Characteristics, Values and the Preservation Planning of the Towns in Jiangnan Water Region. Urban Plan. Forum 2008, 51, 52–59. [Google Scholar]
- Wang, L.; Li, H. Research into the negative perception of inbound tourists on the tourism destination image in China. World Reg. Stud. 2019, 28, 189–199. [Google Scholar]
- Shanghai Municipal Government. Reply of Shanghai Municipal People’s Government on the Approval of “Fengjing Historic and Cultural Town Protection Plan (2016–2040)”. (Shanghai Government [2017] 42). Available online: http://new.tzxm.gov.cn/zckd/fzgh/201910/t20191030_1262080.shtml (accessed on 30 October 2019).
- The Jinshan Newspaper. “Fengjing Ancient Town Was Selected as the Most Valuable Destination Scenic Spot”. In 2014, in the “2014 Promotion Activity of China’s Most Valuable Cultural (Heritage) Tourism Destination” Organized by China Cultural Heritage Conservation Foundation and other Organizations, Shanghai Fengjing Ancient Town was Selected as the “Most Valuable Destination Scenic Spot” as the only Scenic Spot in Shanghai. Available online: https://epaper.file.routeryun.com/jsb/2015-01-08/6097cd94a03d477fe3d0ad159e1a39b5.pdf (accessed on 8 January 2015).
- The Jinshan Newspaper. “Fengjing Ancient Town Selected in China National Tourism Annual List”, Fengjing Ancient Town was Selected in 2020 China National Tourism Annual List of the Annual Selected Characteristic Ancient Town Tourist Destination. Available online: http://www.jsbao.com/Article/index?aid=4230773 (accessed on 1 January 2021).
- Kovacs, Z.; Vida, G.; Elekes, A.; Kovalcsik, T. Combining Social Media and Mobile Positioning Data in the Analysis of Tourist Flows: A Case Study from Szeged, Hungary. Sustainability 2021, 13, 2926. [Google Scholar] [CrossRef]
- He, S.; Li, C.; Xiao, Y.; Liu, Q. Examining neighborhood effects on residents’ daily activities in central Shanghai, China: Integrating “big data” and “thick data”. Environ. Plan. B Urban Anal. City Sci. 2022, 49, 239980832210783. [Google Scholar] [CrossRef]
- Wang, B.; Chen, X.; Shi, C. Analysis of recreational spatial features of Wuhan City based on multi-source data. Chin. Landsc. Archit. 2021, 37, 49–54. [Google Scholar] [CrossRef]
- Gu, Q.; Zhang, H.; Chen, M.; Xie, Y. Hierarchical network structures and regional differentiations of tourist source destinations of Nanjing based on cellular signaling data. Sci. Geogr. Sin. 2019, 39, 1739–1748. [Google Scholar] [CrossRef]
- Sowkhya, B.; Amaduzzi, S.; Raawal, D. Visualization and analysis of cellular & twitter data using qgis. Int. Arch. Photogramm. Remote Sens. Spatial Inf. Sci. 2018, XLII-4/W8, 199–209. [Google Scholar] [CrossRef]
- Liu, C.; Sun, C.; Fan, F. Lhasa tourist spatial structure analysis based on multi-source data. Geospat. Inf. 2020, 18, 25–30+26. [Google Scholar]
- Jiang, X.; Zhang, X.; Qian, X.; Lin, Q.; Wang, X. Research on “Authenticity” perceptual evaluation and renewal strategy of Canal historical and cultural blocks(towns) based on multi-source data. Mod. Urban Res. 2021, 36, 20–27+37. [Google Scholar]
- Cheng, P.; Han, J.; Wu, J.; Guo, M. Spatial characteristics and spatial-temporal evolution of urban leisure tourism based on multi-source data: A case study of Nanchang. J. Guilin Univ. Technol. 2021, 41, 362–369. [Google Scholar]
- Xu, M.; Wang, C. Research on the evaluation system of historical and cultural block renewal based on multi-source data: Taking the historical and cultural block of Guangdong. Urban Dev. Stud. 2019, 26, 74–83. [Google Scholar]
- Yu, J.; Egger, R. Color and engagement in touristic Instagram pictures: A machine learning approach. Ann. Tour. Res. 2021, 89, 103204. [Google Scholar] [CrossRef]
- Paolanti, M.; Mancini, A.; Frontoni, E.; Felicetti, A.; Marinelli, L.; Marcheggiani, E.; Pierdicca, R. Tourism destination management using sentiment analysis and geo-location information: A deep learning approach. Inf. Technol. Tour. 2021, 23, 241–264. [Google Scholar] [CrossRef]
- Arkema, K.K.; Fisher, D.M.; Wyatt, K.; Wood, S.A.; Payne, H.J. Advancing Sustainable Development and Protected Area Management with Social Media-Based Tourism Data. Sustainability 2021, 13, 2427. [Google Scholar] [CrossRef]
- Arefieva, V.; Egger, R.; Yu, J. A machine learning approach to cluster destination image on Instagram. Tour. Manag. 2021, 85, 104318. [Google Scholar] [CrossRef]
- Mor, M.; Fisher-Gewirtzman, D.; Yosifof, R.; Dalyot, S. 3D Visibility Analysis for Evaluating the Attractiveness of Tourism Routes Computed from Social Media Photos. ISPRS Int. J. Geo-Inf. 2021, 10, 275. [Google Scholar] [CrossRef]
- Agusti, D.P.I. The clustering of city images on Instagram: A comparison between projected and perceived images. J. Destin. Mark. Manag. 2021, 20, 100608. [Google Scholar] [CrossRef]
- Ding, K.Y.; Yang, M.; Luo, S.X. Mountain Landscape Preferences of Millennials Based on Social Media Data: A Case Study on Western Sichuan. Land-Basel 2021, 10, 1246. [Google Scholar] [CrossRef]
- Qiu, T.; Che, S.; Li, Y.; Wang, L. Exploration on attraction for tourists of different agricultural landscape resources—Based on content analysis of agricultural tourism photos. J. Shanghai Jiaotong Univ. (Agric. Sci.) 2015, 33, 68–75. [Google Scholar]
- Wang, C.; Tang, C.; Qiao, H.; Zhang, W.; Xing, L. Spatial structure characteristics of rural tourism flow based on digital footprint: Taking Huzhou city in Zhejiang province for example. Econ. Geogr. 2020, 40, 225–233+240. [Google Scholar] [CrossRef]
- Yan, S. Agglomeration and diffusion path of tourist flow incite the city based on multi-source data. Mod. Urban Res. 2021, 36, 106–113. [Google Scholar]
- Guo, T.; Guo, B.; Zhang, J.; Yu, Z.; Zhou, X. Crowd Travel: Leveraging heterogeneous crowdsourced data for scenic spot profiling. J. Zhejiang Univ. (Eng. Sci.) 2017, 51, 663–668. [Google Scholar]
- Gu, J.; Wang, Y.; Liu, G.; Tian, Z. Tourism image mining based on user generated big data: Taking Chongqing as an example. Mod. Urban Res. 2019, 34, 117–125. [Google Scholar]
- Shen, Y.; Wang, Y.; Xu, X.; Feng, X. A study on destination image of Shanghai from the perspective of cultural memory. Libr. Trib. 2020, 40, 59–65. [Google Scholar]
- Lu, L.; Li, J.; Yang, X.; Chen, H.; Chang, J. Research on network structure of urban tourist flow based on UGC text mining: A case study in Xi’an city. Areal Res. Dev. 2022, 41, 98–103. [Google Scholar]
- Shi, P.; Ming, Q.; Han, J.; Luo, D. Research on non-utilitarian experience of mountain tourism grounded theory analysis on online travel notes of Yulong snow mountain in Yunnan. Hum. Geogr. 2021, 36, 164–174. [Google Scholar] [CrossRef]
- Ma, X.; Zhang, Z. Research on network structure of tourism flow in western Sichuan: Based on comparative analysis of individual travel notes and tourist team routes. Areal Res. Dev. 2021, 40, 126–131. [Google Scholar]
- Li, Q.; Qu, L. The network structure and influencing factors of the tourist flow within the city: The case of Shanghai. World Reg. Stud. 2021, 30, 114–124. [Google Scholar]
- Liang, B.; Pan, Z. An analysis of scenic areas preference and the co-occurrence phenomenon based on online information: A case of Shanghai historic district. Tour. Trib. 2015, 30, 80–90. [Google Scholar]
- Sun, Q.; Zhang, Y.; Zhao, P.; Wu, M. Travel movement pattern extraction based on social media data. Acta Sci. Nat. Univ. Pekin. 2021, 57, 885–893. [Google Scholar] [CrossRef]
- Liang, C.; Li, R. Tourism destination image perception analysis based on the Latent Dirichlet Allocation model and dominant semantic dimensions: A case of the Old Town of Lijiang. Prog. Geogr. 2020, 39, 614–626. [Google Scholar] [CrossRef]
- Meng, Y.; Deng, J.; Xu, J. Study on the differences between projection image and tourist perception image of tourist destination: Case of Shiniuzhai scenic spot, Pingjiang. J. Cent. South Univ. For. Technol. (Soc. Sci.) 2018, 12, 67–73. [Google Scholar] [CrossRef]
- Deng, N.; Liu, Y.; Niu, Y.; Ji, W. Different perceptions of Beijing’s destination images from tourists:An analysis of Flickr photos based on deep learning method. Resour. Sci. 2019, 41, 416–429. [Google Scholar]
- Li, Y.; Guo, J.; Chen, Y. A new approach for tourists’ visual behavior patterns and perception evaluation based on multi-source data. J. Geo-Inf. Sci. 2022, 24, 2004–2020. [Google Scholar]
- Bhuiyan, M.A.H.; Darda, M.A.; Hasan, M.R. Tourist perception and satisfaction on safari tourism at Bangabandhu Sheikh Mujib Safari Park in Bangladesh. Int. J. Geoheritage Park. 2021, 9, 430–440. [Google Scholar] [CrossRef]
- Zhang, L.; Yang, K.; Liu, B.; Liu, S. A study on the regional characteristics perception of ancient towns in the south of the Yangtze River based on different perspectives of tourists and residents: A case study of Tongli Ancient Town. Chin. Landsc. Archit. 2019, 35, 10–16. [Google Scholar]
- Xu, Y.; Li, J. Effects of urban built environment on tourists’ emotional experience and behavioral intention: A case study in Xi’an city. Areal Res. Dev. 2022, 41, 107–112. [Google Scholar]
- Yang, R.; Qian, Y. A study on spatial collective memory of vernacular villages in Beijing suburbs under the influence of tourism: Cases study of Cuandixia Village, Gubeikou Village, Lingshui Village and Liuliqu Village. Mod. Urban Res. 2019, 10, 49–57+74. [Google Scholar]
- Liu, Y.; Zhou, Y.; Guo, Z.; Tong, X.; Cui, J. Study on collective memory of the historic urban landscape of Lhasa based on city image. Urban Dev. Stud. 2018, 25, 77–87. [Google Scholar]
- Ruiz, C.; Delgado, N.; Garcia-Bello, M.A.; Hernandez-Fernaud, E. Exploring crowding in tourist settings: The importance of physical characteristics in visitor satisfaction. J. Destin. Mark. Manag. 2021, 20, 100619. [Google Scholar] [CrossRef]
- Wang, L.; Liu, X.; Che, S. Study on the spatial structure of Shanghai urban agriculture tourism. J. Shanghai Jiaotong Univ. (Agric. Sci.) 2013, 31, 12–18. [Google Scholar]
- Leung, D.; Law, R.; van Hoof, H.; Buhalis, D. Social Media in Tourism and Hospitality: A Literature Review. J. Travel Tour. Mark. 2013, 30, 3–22. [Google Scholar] [CrossRef]
- Hays, S.; Page, S.J.; Buhalis, D. Social media as a destination marketing tool: Its use by national tourism organisations. Curr. Issues Tour. 2013, 16, 211–239. [Google Scholar] [CrossRef]
Figure 1.
Geographical location of Fengjing Ancient Town (source: authors).
Figure 1.
Geographical location of Fengjing Ancient Town (source: authors).
Figure 2.
(a) The scope of the core protection area and the spatial distribution of cultural relics in Fengjing Ancient Town (source: authors); (b) The tourist attractions and tourist routes of Fengjing Ancient Town (source: authors).
Figure 2.
(a) The scope of the core protection area and the spatial distribution of cultural relics in Fengjing Ancient Town (source: authors); (b) The tourist attractions and tourist routes of Fengjing Ancient Town (source: authors).
Figure 3.
Diagram of the distribution density of visitors in Fengjing Ancient Town (source: authors); (a) 10:00–11:00, 15:00–16:00; (b) 12:30–13:30.
Figure 3.
Diagram of the distribution density of visitors in Fengjing Ancient Town (source: authors); (a) 10:00–11:00, 15:00–16:00; (b) 12:30–13:30.
Figure 4.
The changes of Fengjing Ancient Town’s Sina Weibo check-in data during the 2012 to 2020 period (source: authors).
Figure 4.
The changes of Fengjing Ancient Town’s Sina Weibo check-in data during the 2012 to 2020 period (source: authors).
Figure 5.
The weekly distribution of Fengjing Ancient Town Sina Weibo average daily check-in data during the 2012 to 2020 period (source: authors).
Figure 5.
The weekly distribution of Fengjing Ancient Town Sina Weibo average daily check-in data during the 2012 to 2020 period (source: authors).
Figure 6.
The weekday and weekend distribution of Fengjing Ancient Town Sina Weibo check-in data during the 2012 to 2020 period (source: authors).
Figure 6.
The weekday and weekend distribution of Fengjing Ancient Town Sina Weibo check-in data during the 2012 to 2020 period (source: authors).
Figure 7.
The Kernel density analysis of the distribution of Sina Weibo check-in data (source: authors).
Figure 7.
The Kernel density analysis of the distribution of Sina Weibo check-in data (source: authors).
Figure 8.
The frequency statistics of 9 cognitive space categories (source: authors).
Figure 8.
The frequency statistics of 9 cognitive space categories (source: authors).
Figure 9.
The spatial distribution and frequency of tourists’ cognitive space in Fengjing Ancient Town (source: authors).
Figure 9.
The spatial distribution and frequency of tourists’ cognitive space in Fengjing Ancient Town (source: authors).
Figure 10.
The categories and frequency statistics of the contents of travel photos (source: authors).
Figure 10.
The categories and frequency statistics of the contents of travel photos (source: authors).
Figure 11.
The Kernel density analysis of the distribution of space in travel photos (source: authors).
Figure 11.
The Kernel density analysis of the distribution of space in travel photos (source: authors).
Figure 12.
The Kernel density analysis of the distribution of categorized space in travel photos (source: authors).
Figure 12.
The Kernel density analysis of the distribution of categorized space in travel photos (source: authors).
Figure 13.
Spatial cognitive preference of tourists in Fengjing Ancient Town (source: authors).
Figure 13.
Spatial cognitive preference of tourists in Fengjing Ancient Town (source: authors).
Figure 14.
The framework of tourists’ multi-level spatial cognition (source: authors).
Figure 14.
The framework of tourists’ multi-level spatial cognition (source: authors).
Table 1.
Research method and object of tourist cognition (source: authors).
Table 1.
Research method and object of tourist cognition (source: authors).
| Data Sources | Research Method | Research Object |
|---|
| Mobile positioning data such as mobile phone signaling | GIS spatial analysis (Kernel density, spatial clustering, etc.), correlation analysis | Reginal and urban spatial structure of tourism flow |
| Network map data such as POI | GIS spatial analysis (Kernel density, spatial clustering, etc.), correlation analysis | Urban Tourism Spatial Structure |
| Night scene lighting data | GIS Spatial Analysis (Kernel Density) | Urban Tourism Spatial Structure |
| UGC website (including social media, travel notes, etc.) | Texts | Text content analysis (semantic mining, word frequency, clustering, co-occurrence, social network analysis, etc.), GIS spatial analysis, grounded theory coding | Tourist preference, landscape imagery, spatial structure of tourism flow |
| Photo | Photo content analysis (including image recognition, photo index, image clustering, etc.), GIS spatial analysis | Tourist preference, landscape imagery, image perception of tourist destination |
| Questionnaires and interviews for tourists and residents | Statistical analysis, text content analysis, cognitive map | Tourist preference, landscape imagery, image perception of tourist destination |
| Visitor Experiment (VEP) | Tourism behavior map, photo content analysis | Tourist preference, landscape imagery, image perception of tourist destination |
Table 2.
The categories of Fengjing Ancient Town tourists’ cognitive space based on the tourist memory map (source: authors).
Table 2.
The categories of Fengjing Ancient Town tourists’ cognitive space based on the tourist memory map (source: authors).
| The Type of Cognitive Space | Tourists’ Cognitive Space with the Time of Occurrence |
|---|
| Node | Three-bridge Square (9), Entrance Square (8), Love Square (7), Wedding Square (2) |
| landmark | Tshing-Fung Bridge (9), Zhu-Xing Bridge (8), Zhi-He Bridge (7), Entrance Archway (5), Bei-Fung Bridge (5), Qing-Feng Bridge (5), Ancient Stage (4), Wu-Yue dividing marker (3), Ji-Yun Bridge (2), Starbuck (2) |
| Path (including streets and rivers) | North-south Shi-He River (11), East-west Shi-He River (7), Fengxi Corridor (6), Corridor of Shengchan Street (3), Zhongdajie street (3), Peace Street (2), Nandajie street (2) |
| District (attractions) | Ding Cong Comic Gallery (6), Archway of Top scholar (6), People’s commune (4), Zhu Fanxue’s house (3), Sanbai Garden (3), Shiwang Temple (3), Book decoration hall (2) |
| Edges | None |
Table 3.
Online travel photo content classification and analysis (source: authors).
Table 3.
Online travel photo content classification and analysis (source: authors).
| Photo Categories | Photo Details | Photo Numbers | Percentage |
|---|
| Node/A | Square/A1 | Entrance square, gathering square and memorial square | 62 | 2.2% |
| Path/B | River Scene/B1 | Water body is the main content of the photos, including cruise ships, fishing boats, etc. | 739 | 26.3% |
| Waterfront Corridor/B2 | Including the waterfront corridor of retail buildings, which has transportation, catering, and recreational functions | 101 | 3.6% |
| Waterfront Path/B3 | Waterfront and pedestrian streets | 4 | 0.1% |
| Street and Alley/B4 | Including the streets with retails on both sides and the narrow alleys between the old houses | 159 | 5.7% |
| Landmark/C | Landmark Structure and Building/C1 | Including unique and representative archway and buildings | 130 | 4.6% |
| Bridge/C2 | Bridges with good landscape value | 214 | 7.6% |
| Place/D | Courtyard/D1 | Including courtyard attractions and courtyards of residential buildings | 77 | 2.7% |
| Waterfront Building/D2 | Waterfront buildings and their water reflections are the main content of photos | 197 | 7.0% |
| General Structure and Building/D3 | Buildings and structures without the status of landmarks | 88 | 3.1% |
| Building Entrance/D4 | Including the entrance space of buildings and related place | 183 | 6.5% |
| Indoor Place/D5 | All indoor spaces | 146 | 5.2% |
| Detail/E | Detail of Building and Structure/E1 | The details of the buildings such as doors, windows, roofs, waterfront platforms, etc. | 286 | 10.2% |
| Object/F | Landscape Structure/F1 | Including landscape objects and sculptures without the status of landmarks | 138 | 4.9% |
| Indoor Item/F2 | All indoor items | 110 | 3.9% |
| Sign/F3 | All signs | 57 | 2.0% |
| Food/F4 | All foods | 13 | 0.5% |
| Plant/and Animal F5 | Plants and animals are the main content of photos | 17 | 0.6% |
| Activity/G | Human Activity/G1 | Including various human activities such as festivals, catering, artisan, interaction, etc. | 91 | 3.2% |
| In total | | 2812 | 100.0% |
| Publisher’s Note: MDPI stays neutral with regard to jurisdictional claims in published maps and institutional affiliations. |
© 2022 by the authors. Licensee MDPI, Basel, Switzerland. This article is an open access article distributed under the terms and conditions of the Creative Commons Attribution (CC BY) license (https://creativecommons.org/licenses/by/4.0/).


