Article

Experimental Study on Mechanical Properties of Half-Grouted Sleeve Connections with Grouted Defects

1
BIM Engineering Center of Anhui Province, Anhui Jianzhu University, Hefei 230601, China
2
Anhui Province Key Laboratory of Green Building and Assembly Construction, Anhui Institute of Building Research & Design, Hefei 230031, China
3
Taihu County Key Project Construction Department, Anqing 246400, China
4
Anhui Jinggong Green Construction Group Co., Ltd., Hefei 230601, China
5
China Construction First Group the Fifth Construction Co., Ltd., Beijing 100020, China
*
Author to whom correspondence should be addressed.
Buildings 2022, 12(11), 1807; https://doi.org/10.3390/buildings12111807
Submission received: 26 September 2022 / Revised: 13 October 2022 / Accepted: 24 October 2022 / Published: 28 October 2022

Abstract

:
Prefabricated concrete structures are driving the development of green buildings, and the connection between prefabricated components is the main factor affecting the safety performance of these structures. Grouted sleeve technology can effectively improve the safety performance of precast component connections. In the process of grouting operation, the grouted sleeves are affected by the construction environment and often have various defects. In this work, to study the influence of defects on the mechanical properties of half-grouted steel sleeve connections, 33 specimens (10 groups of defective specimens (three in each group) and 1 standard group) were prepared and subjected to uniaxial tensile tests. The failure modes, load–displacement curves, stress distribution, and other mechanical properties of the specimens were studied. Sleeves with different defects were simulated, and the simulation results were compared with the experimental results. The experimental results showed that the failure modes are rebar fracture and rebar pull-out. In the strengthening stage, the specimens exhibited a large slip. The critical length for failure mode transition was 2.5 d (defect length). The middle defects and uniform defects had the most unfavorable effect on the ultimate bearing capacity of the specimens. The stress transfer was blocked in specimens with end and middle defects. The numerical simulation results were consistent with the experimental results, thus verifying the accuracy and feasibility of the simulation method for practical applications.

1. Introduction

The construction of infrastructure in China has entered a critical period characterized by reduced emissions and energy savings. The transformation of the construction industry, which is a large carbon emitter, is imminent. Scholars study ways to reduce energy consumption and achieve green emission reduction [1,2,3]. Compared with conventional cast-in-place concrete structures, prefabricated concrete structures have considerable advantages such as environmental protection, energy savings, and reduced emissions [4,5,6,7]. To ensure the safety of a prefabricated concrete structure, the overall performance of precast component nodes is important. The grouted sleeve connection technology is one of the main forms of rebar connection between components [8]. Grouted sleeves mainly come in two forms: full-grouted sleeves (Figure 1a) and half-grouted sleeves (Figure 1b). Compared with a full-grouted sleeve, a half-grouted sleeve connection has a shorter connection length and higher construction efficiency. The half-grouted sleeve is mechanically connected by threads at one end and is grouted at the other end [9,10]. The connection performance of grouted sleeves is important for structural safety. Extensive research has been conducted on the grouting connection technology of grouted sleeves.
Depending on the environment, grouted sleeves are used with safety and cost considerations. Different grouted sleeves have been designed, and their performance has been studied by considering the inner cavity structure of the sleeve, the diameter of the rebar, the anchorage length, and the grouting material. Ling et al. [11] proposed two new types of grouted sleeves made of standard-size steel tubes: welded bar sleeve and tapered head sleeve. The binding effect of the sleeve and the influence of the sleeve geometry on the bonding performance were studied. The load carrying capacity of the joint was found to be related to the anchorage length of the rebar. Gao et al. [12] welded ribs on the inner wall of grouted sleeves. The effects of parameters, such as the cavity, anchorage length, and grouting strength, on the mechanical properties of the grouted sleeve were compared by conducting a uniaxial tensile experiment. The results showed that the rib spacing influences the failure mode of the joints. The grout strength significantly affects the tensile strength of the joints. Hosseini et al. [13] designed a grouted spiral connection and showed that the spiral diameter provides more dominant binding effect than the spiral pitch distance in increasing the bond strength. The spiral connections require a larger anchorage length than the grouted steel pipe because the constraints provided by the spiral are much lower than those provided by steel pipe. Henin et al. [14] used a non-proprietary bar to prepare a splice sleeve and considered the cost and efficiency. After adjusting the anchorage length of the rebar, the joint strength could meet the specification requirements. Currently, most grouted sleeves are expensive because of the complex manufacturing process and high-strength materials used. Designing a new type of sleeve requires analyzing the influences of the inner cavity structure, anchorage length, and rebar size on its performance. Moreover, evident advantages, such as low cost, ease of production, and high strength, are desired.
Affected by the construction environment, grouted sleeves contain grouting defects. The grouting end rebars are contaminated (Figure 2a), the anchorage length is insufficient (Figure 2b), and there is grout leakage (Figure 2c). Han et al. [15] studied the influence of grouting material strength on the sleeve bond strength. The results showed the existence of a relative slip between the rebar and the grouting material in the strengthening stage, and the relationship between the grouting material strength and bond strength was explained. Wang et al. [16] considered the influence of three loading modes and different anchorage lengths on sleeve performance. The joint stiffness reduced significantly under cyclic loading. The energy dissipation capacity of specimens decreased with the anchorage length. The bonding stress distribution in the sleeve was significantly affected by the anchorage length. Chen et al. [17] studied the mechanical properties of the rebar in half-grouted sleeve connections with a high water-to-binder ratio. Studies have shown that a high water-to-binder ratio leads to bond failure and increases the damage depth of the grouting end. An analytical model considering the influence of the water-to-binder ratio was established. Zheng et al. [18] studied the influence of the grouting material content on the mechanical properties and deformation of grouted sleeve connections under static conditions. Repeated tension and compression experiments were conducted under high-stress and large-deformation conditions to study the seismic performance of the connections. The experimental results showed that the failure modes include rebar fracture and rebar pull-out, which mainly depend on the relative magnitude of the bond bearing capacity between the rebar and the grouting material and the tensile bearing capacity of the rebar. The bond bearing capacity is mainly affected by the grout content.
In previous studies, the defect types and sleeve types analyzed were different, and the grouting operation was a concealed project. Studies on the types of grouting defects have not been sufficiently comprehensive. Hence, in this work, to ensure the safety and reliability of the connection technology of half-grouted sleeves, 33 half-grouted sleeves (a standard group and 10 groups of defective specimens, with 3 in each group) were designed for possible defects in actual engineering. Uniaxial tensile experiments and numerical simulations were conducted on the specimens. The influence of grouting defects on the performance of half-grouted sleeves were analyzed by comparing the failure modes, ultimate load, and load–slip curves.

2. Materials and Methods

2.1. Materials

(1)
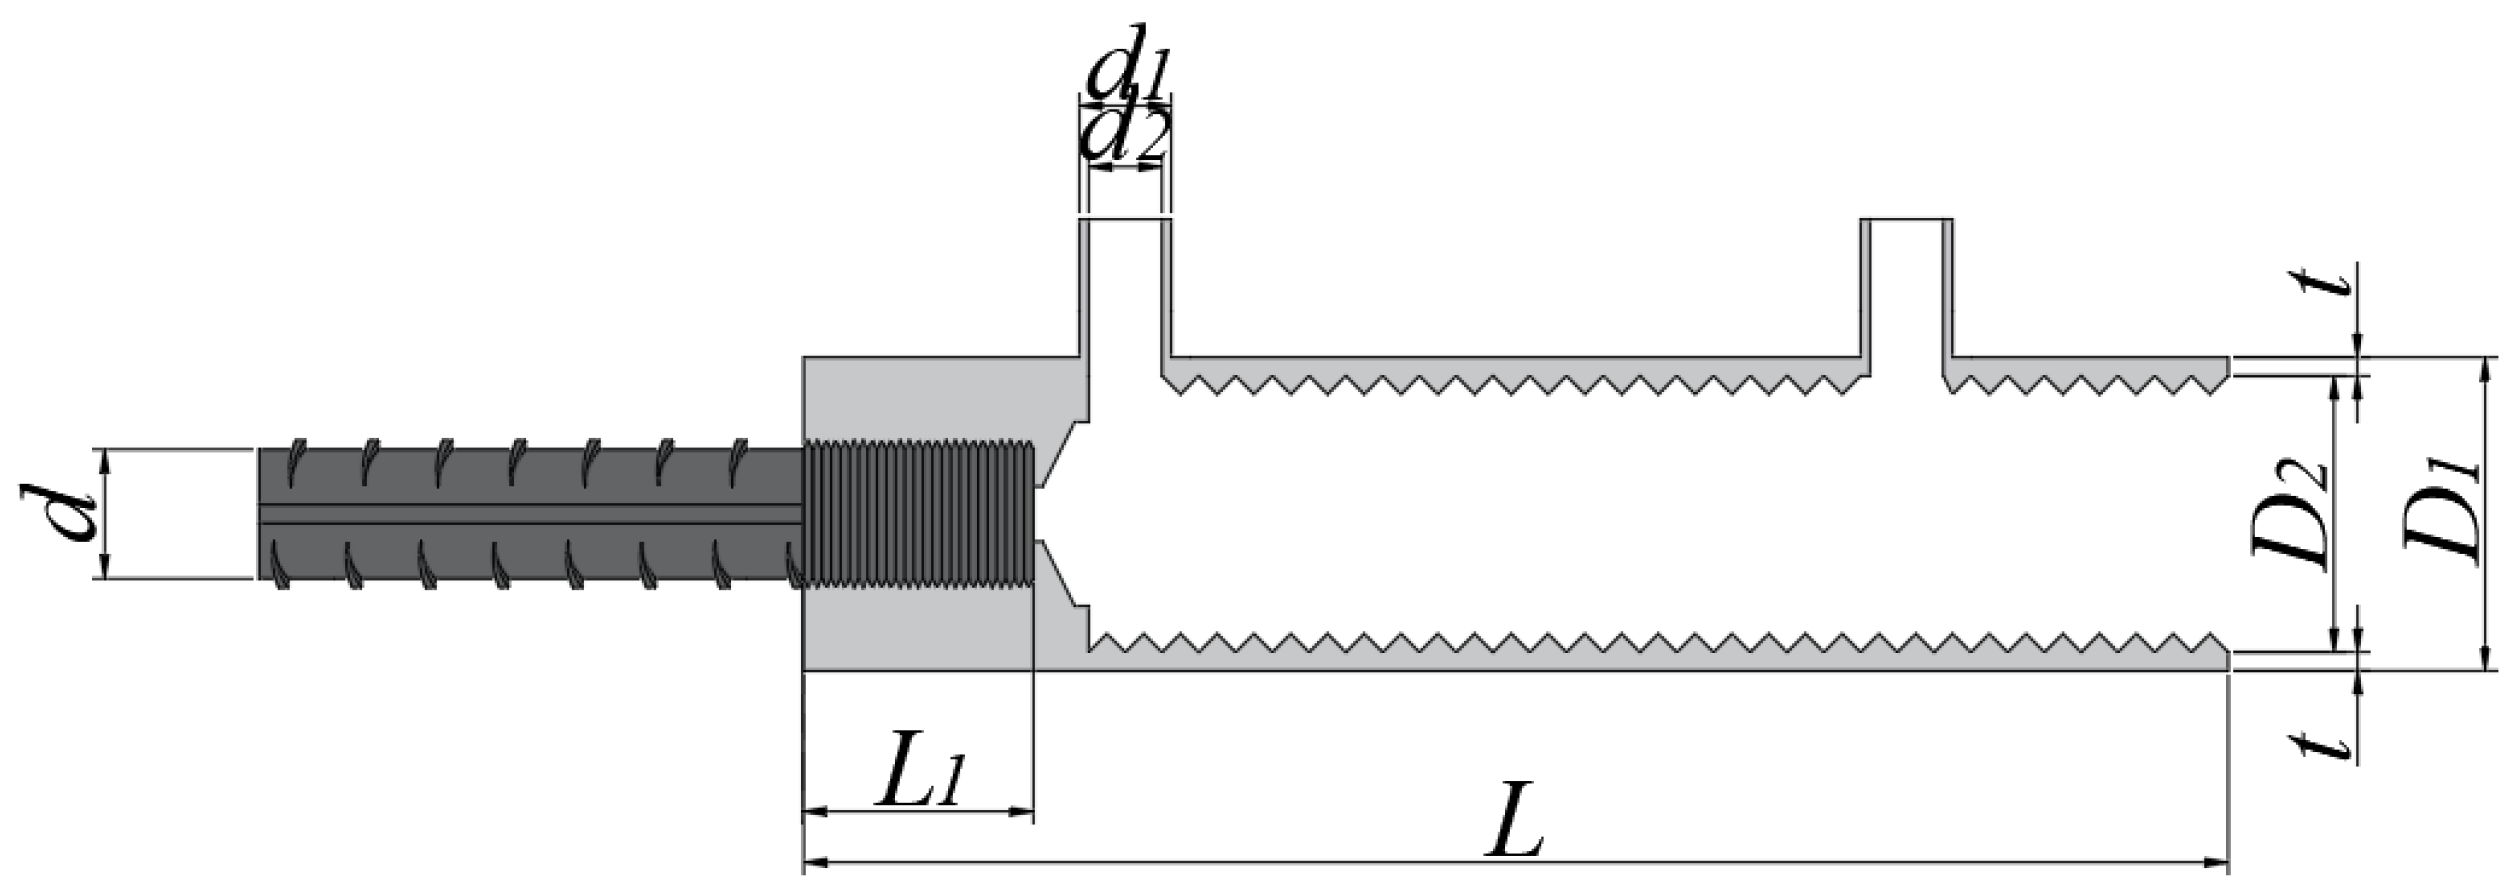
Grouted sleeve: High-quality-carbon structural-steel half-grouted sleeve was used in this study, as shown in Figure 3. Table 1 presents the material performance parameters. Table 2 presents the sleeve type and detailed dimensions.
(2)
Grouting material: The grouting material is a type of cement-based dry mixing material composed of high-strength cement, various polymer additives, and high-strength fine aggregate. It has the advantages of high fluidity, micro-expansion, early strength, high strength, and nonshrinkage attributable to the connection between prefabricated components. The water/binder grout ratio was 0.14. The fluidity test of the grouting material conforms to the relevant provisions made in JG/T 408-2019 [19], as shown in Figure 4. According to the specification, the initial fluidity should not be less than 300 mm, and the 30 min fluidity should not be less than 260 mm. Table 3 and Table 4 list the measured data.
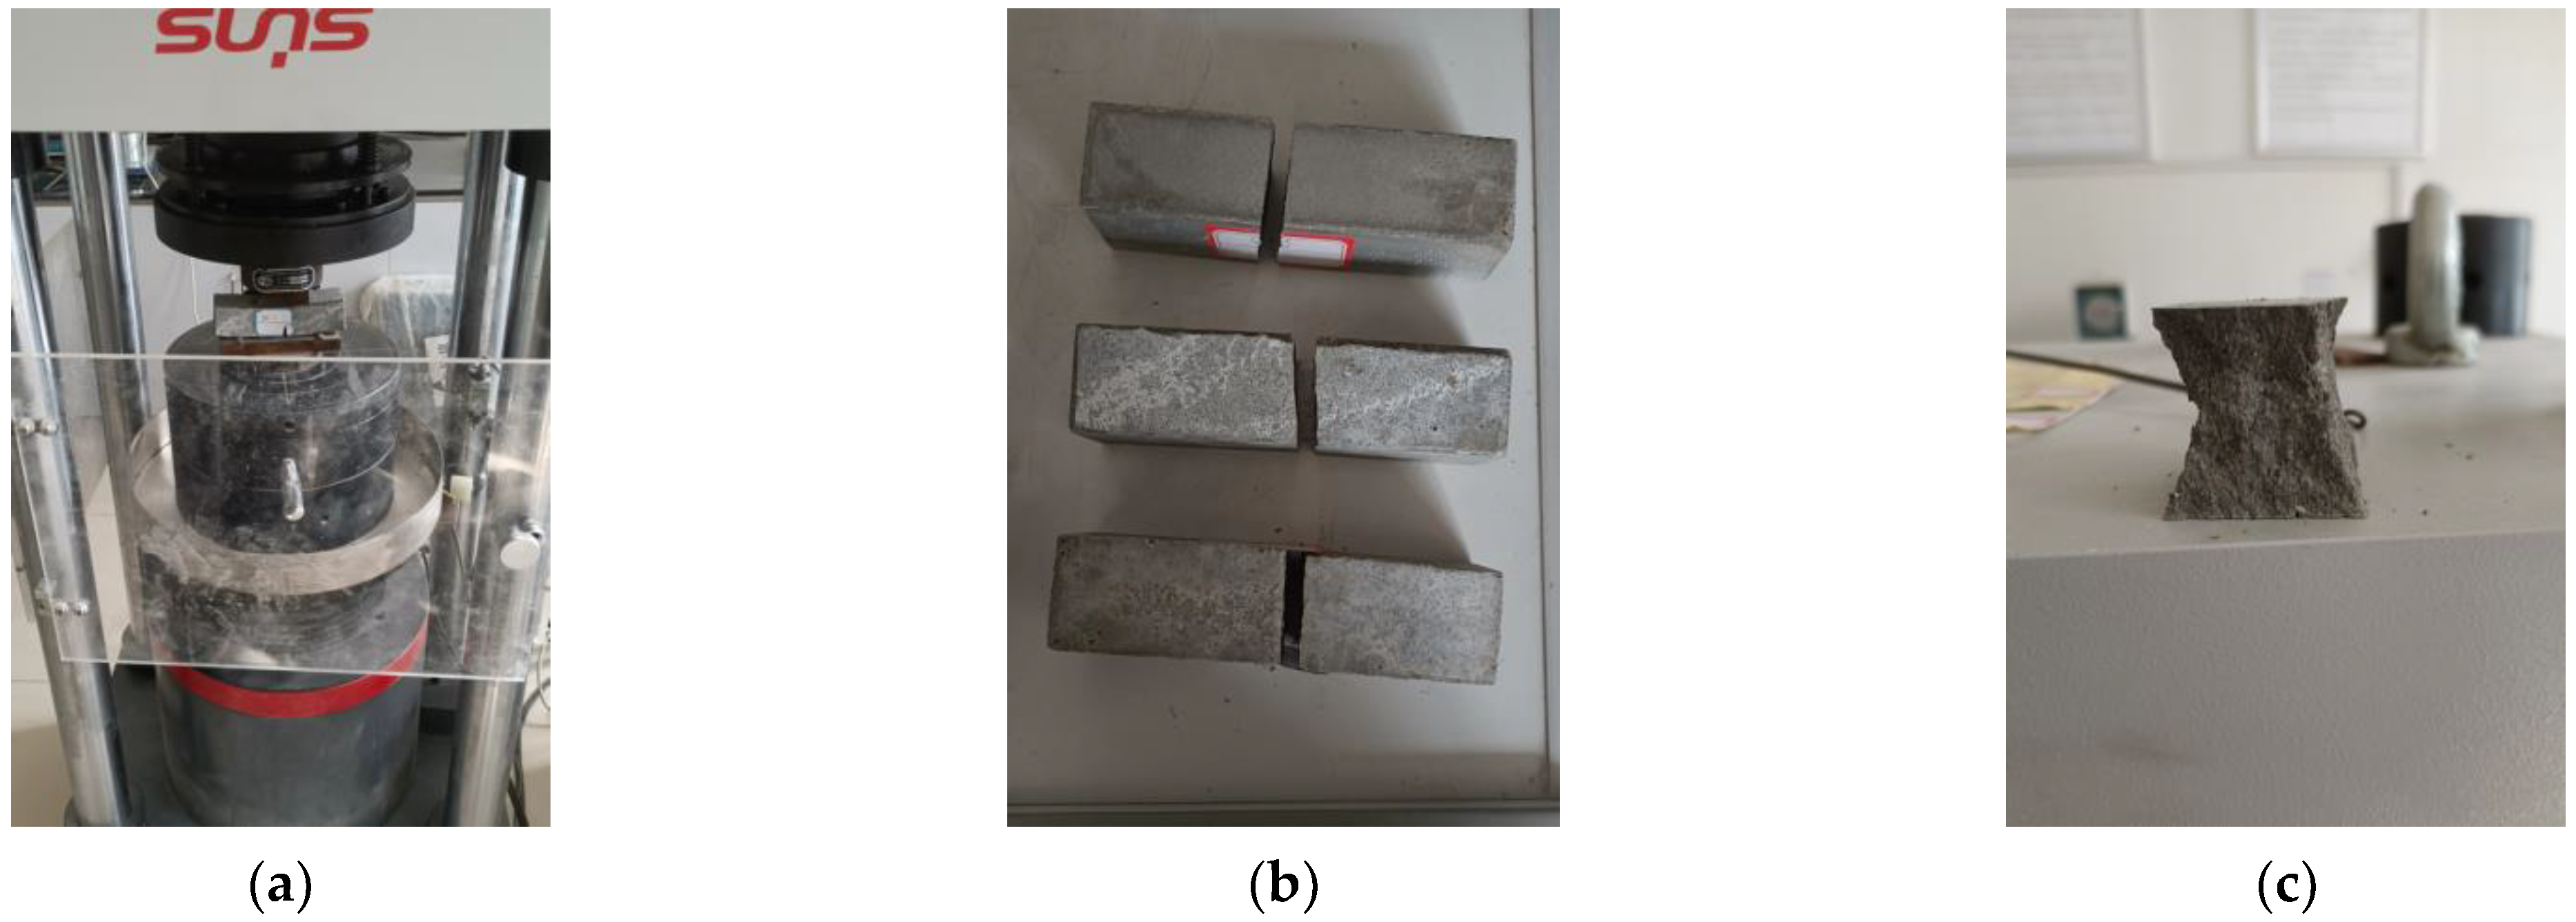
Test blocks were prepared to verify the compressive and flexural strengths of the grouting material. The machine used in the test is shown in Figure 5. The testing machine can carry out compressive strength tests and flexural strength tests. According to the requirements of GB/T 17671-2021 [20], the dimensions of the test blocks were 40 mm × 40 mm × 160 mm, with each group containing three blocks. The grouting material strength test was performed after curing under 20 °C and 93% relative humidity. The test blocks were subjected to compressive strength tests for 1, 3, and 28 day(s) and flexural strength tests for 28 days, as shown in Figure 5. Table 5 and Table 6 present the recorded data. The average flexural strength was 18.4 MPa, and the average compressive strengths on 1, 3, and 28 days were 40.3, 78.1, and 91.8 MPa, respectively, which met the specification requirements.
(3)
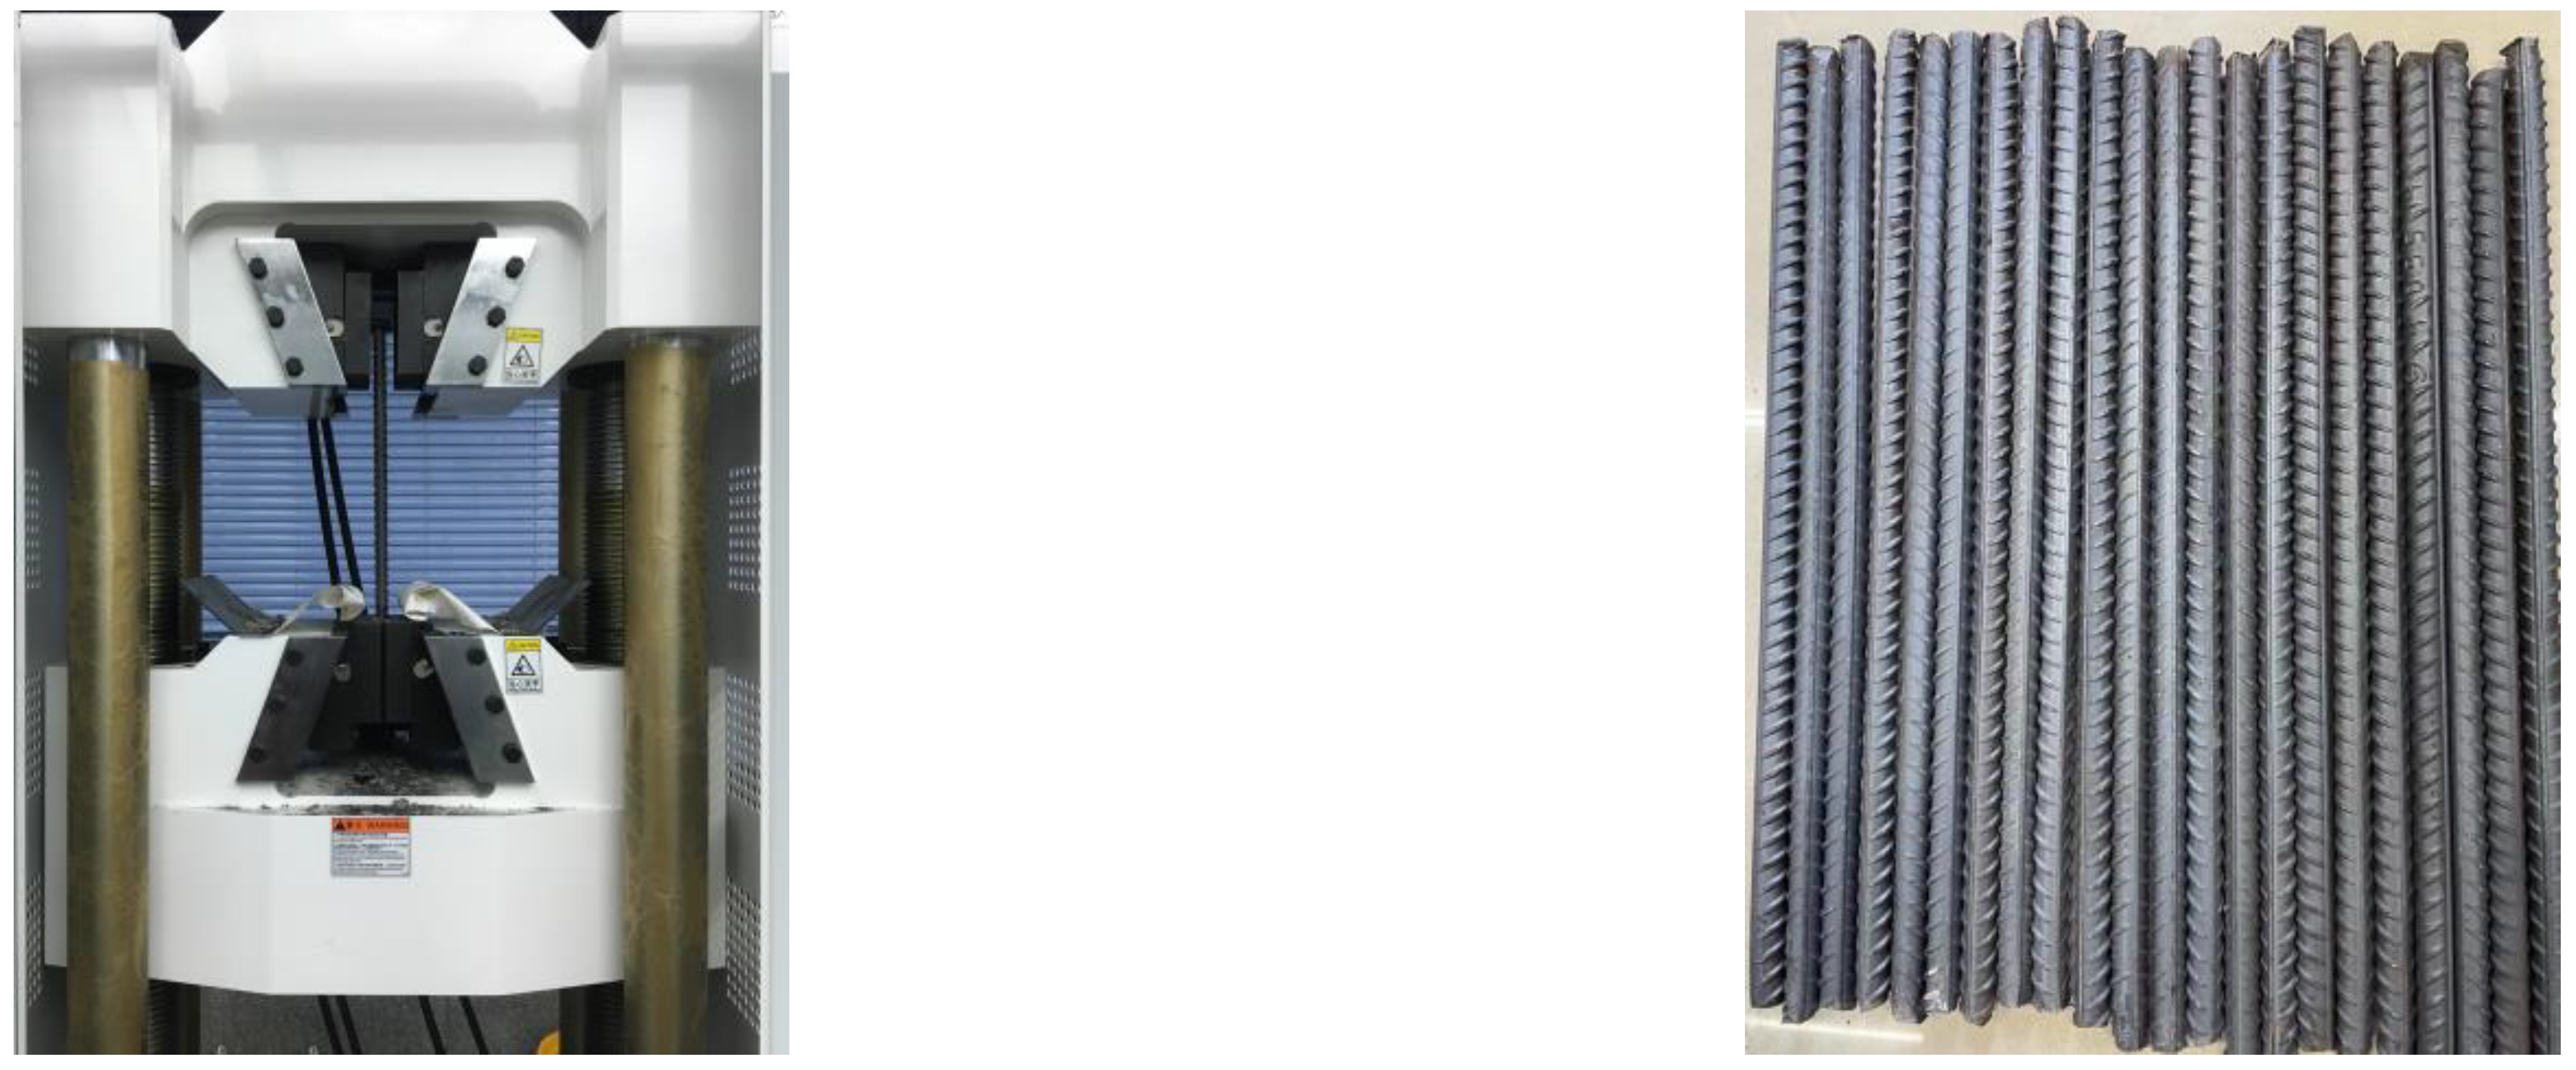
Rebar: HRB400-grade rebar with an external diameter of Φ14 mm was selected, which was fabricated at Masteel Group in Hefei, China. In accordance with GB/T228.1-2010 [21], a test was conducted on the material properties, as shown in Figure 6, including the yield strength and ultimate strength. The test results were consistent with the standard, as shown in Table 7.

2.2. Specimen Preparation

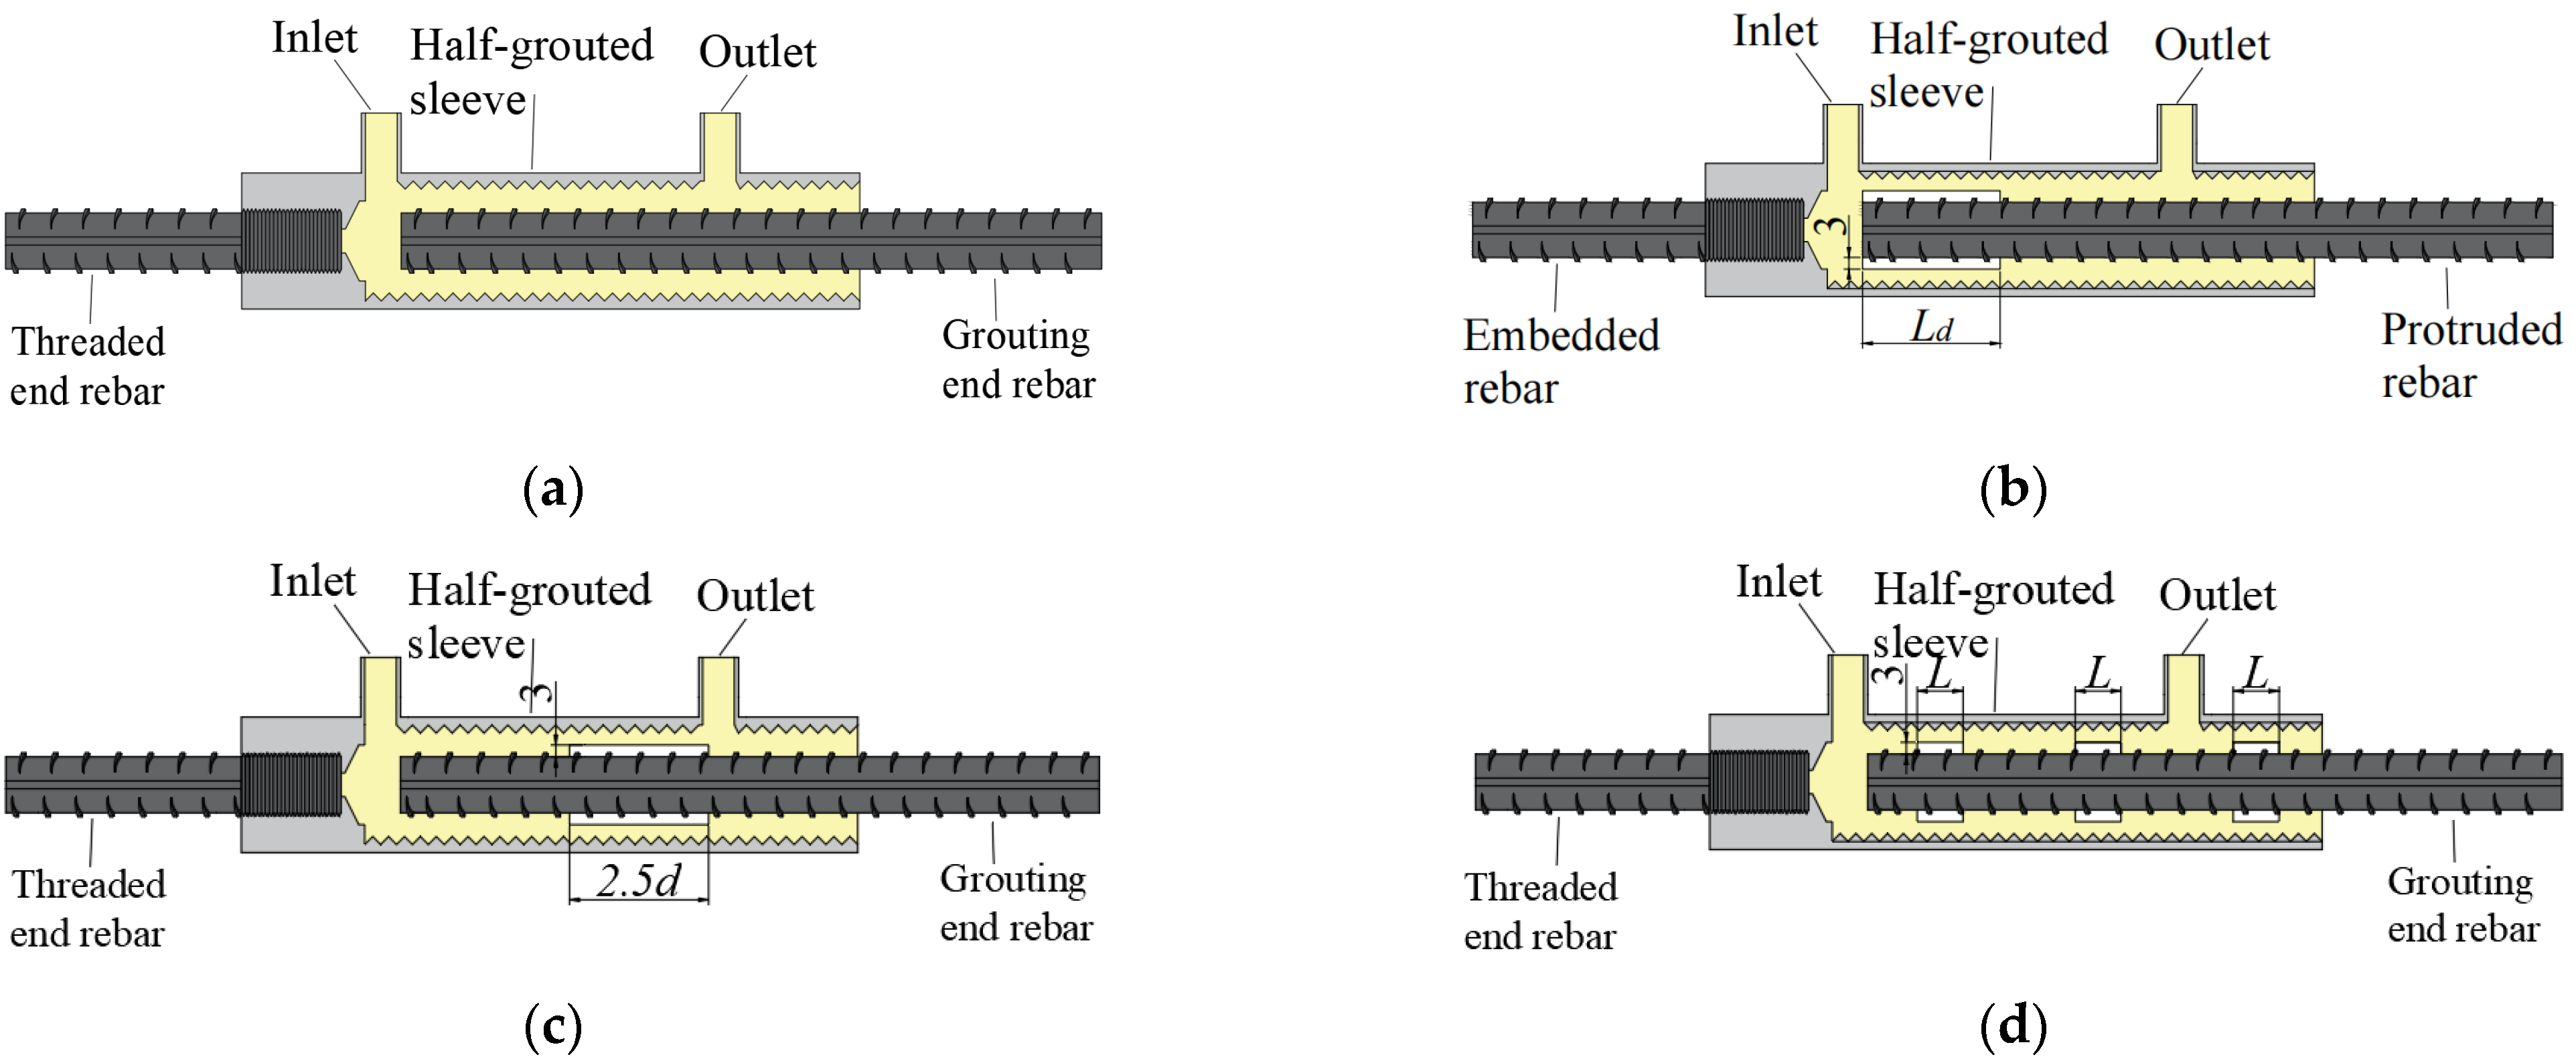
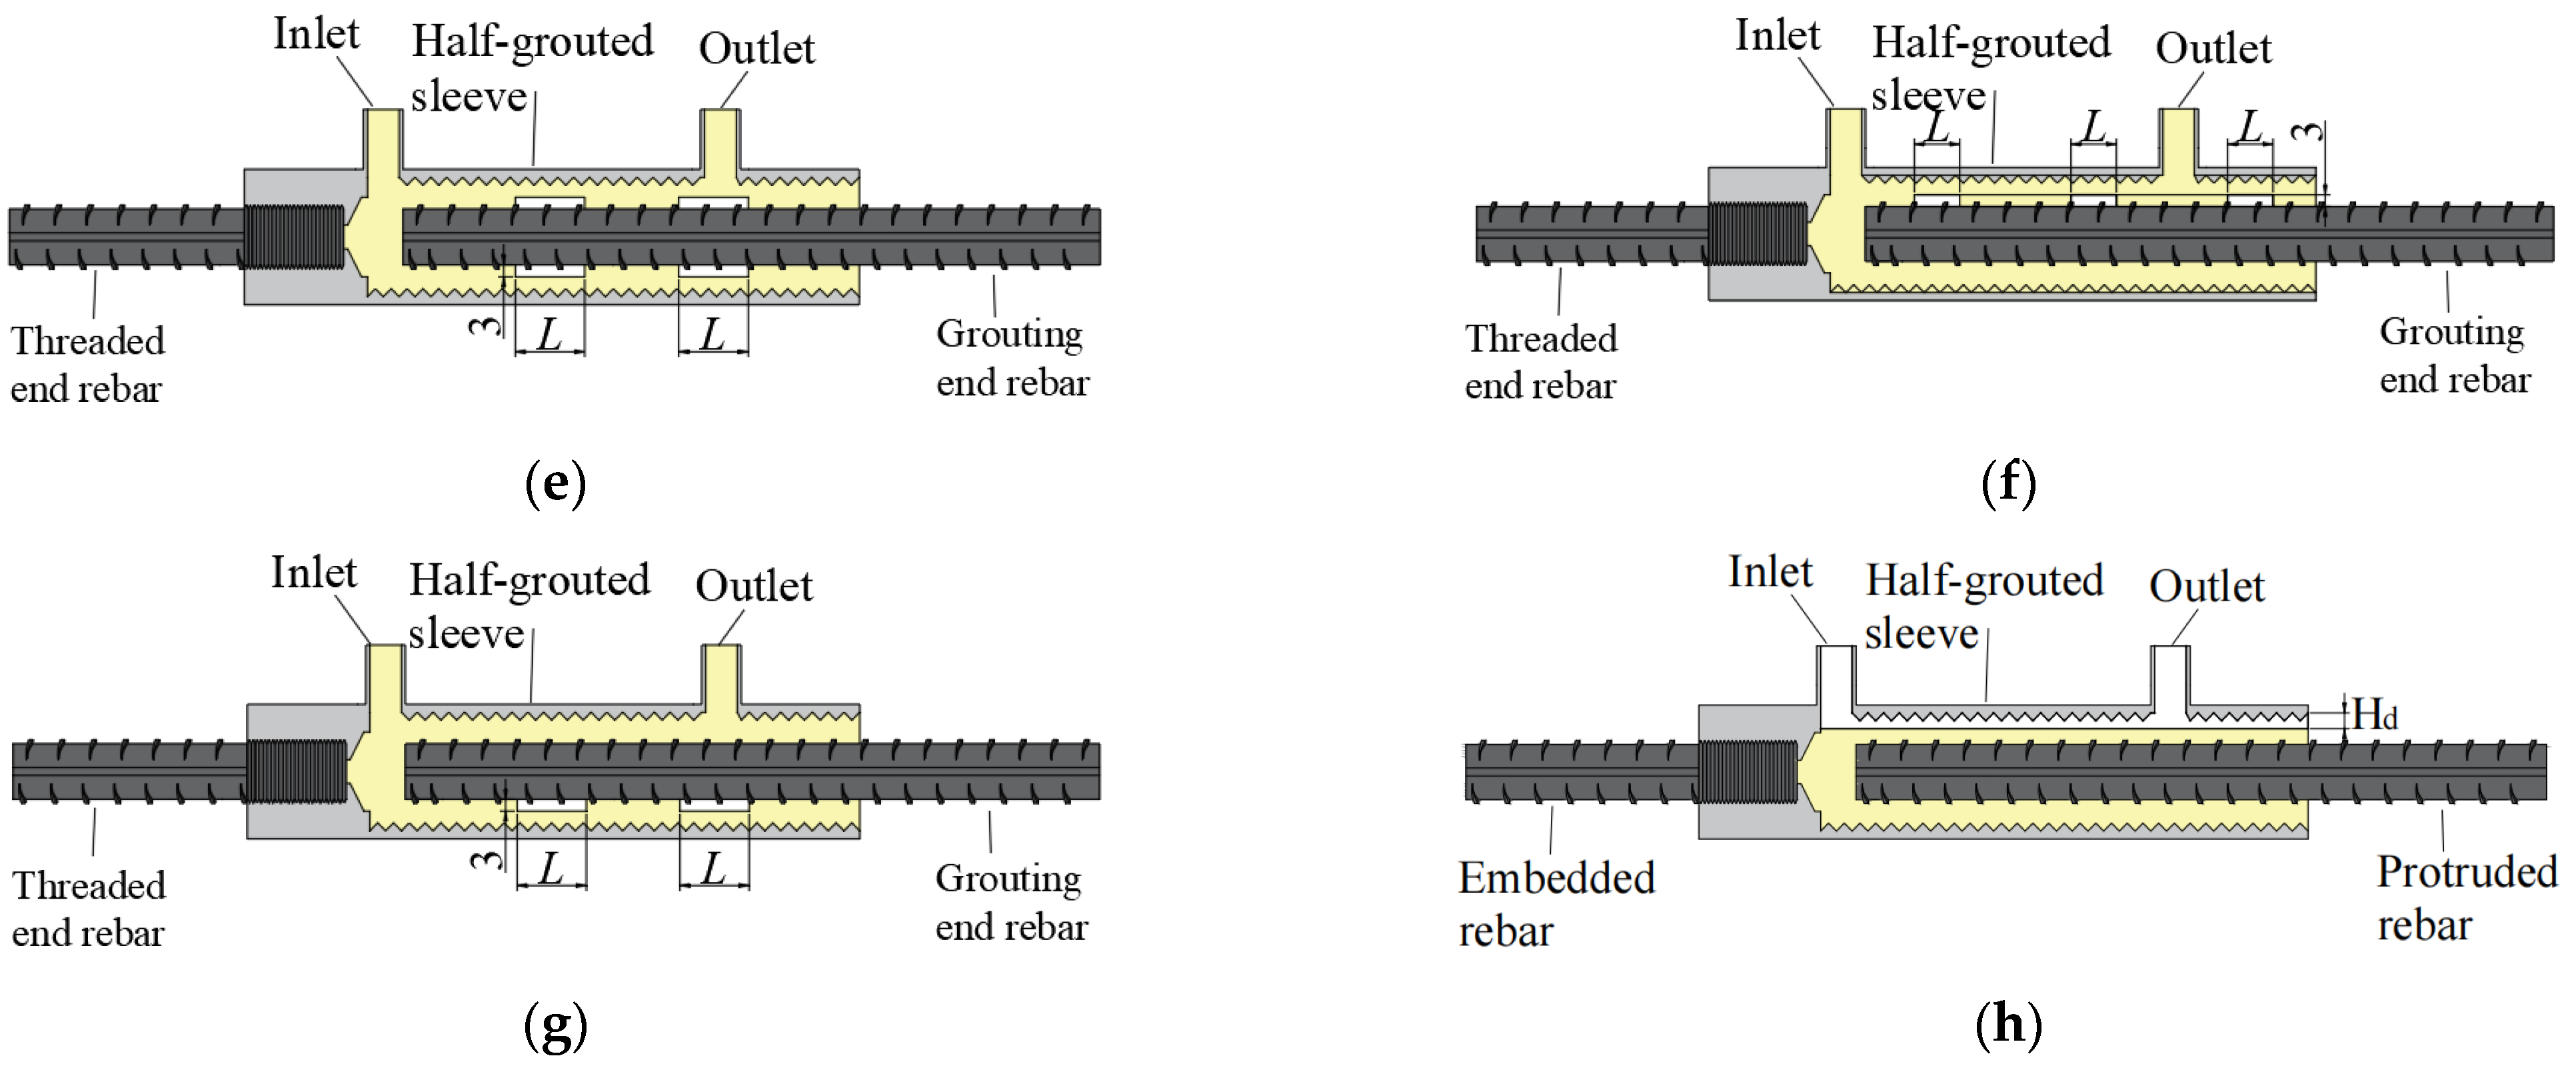
According to the code, combined with the actual situation of a real project, eleven groups of specimens (a standard group and 10 groups of defective specimens) were prepared, with three specimens in each group. Figure 7 shows the internal defect setup of the specimens. The defects were wrapped with foam tape (Table 8). The details are as follows:
(1)
Standard group: Full grouting without defects;
(2)
End defects: Three groups with thicknesses of 2 d, 2.5 d, and 3 d, and the defect thickness was 3 mm;
(3)
Middle defect 2.5 d: Defect thickness was 3 mm;
(4)
Uniformly distributed defect 2.5 d: 2.5 d was the total length of the defect, divided into three or two parts;
(5)
Horizontal grouting defect: In the horizontal grouting specimens, 2 mm thick no-void zone was set, and the other was 4 mm.
Figure 7 shows the internal defect setup of the specimens.
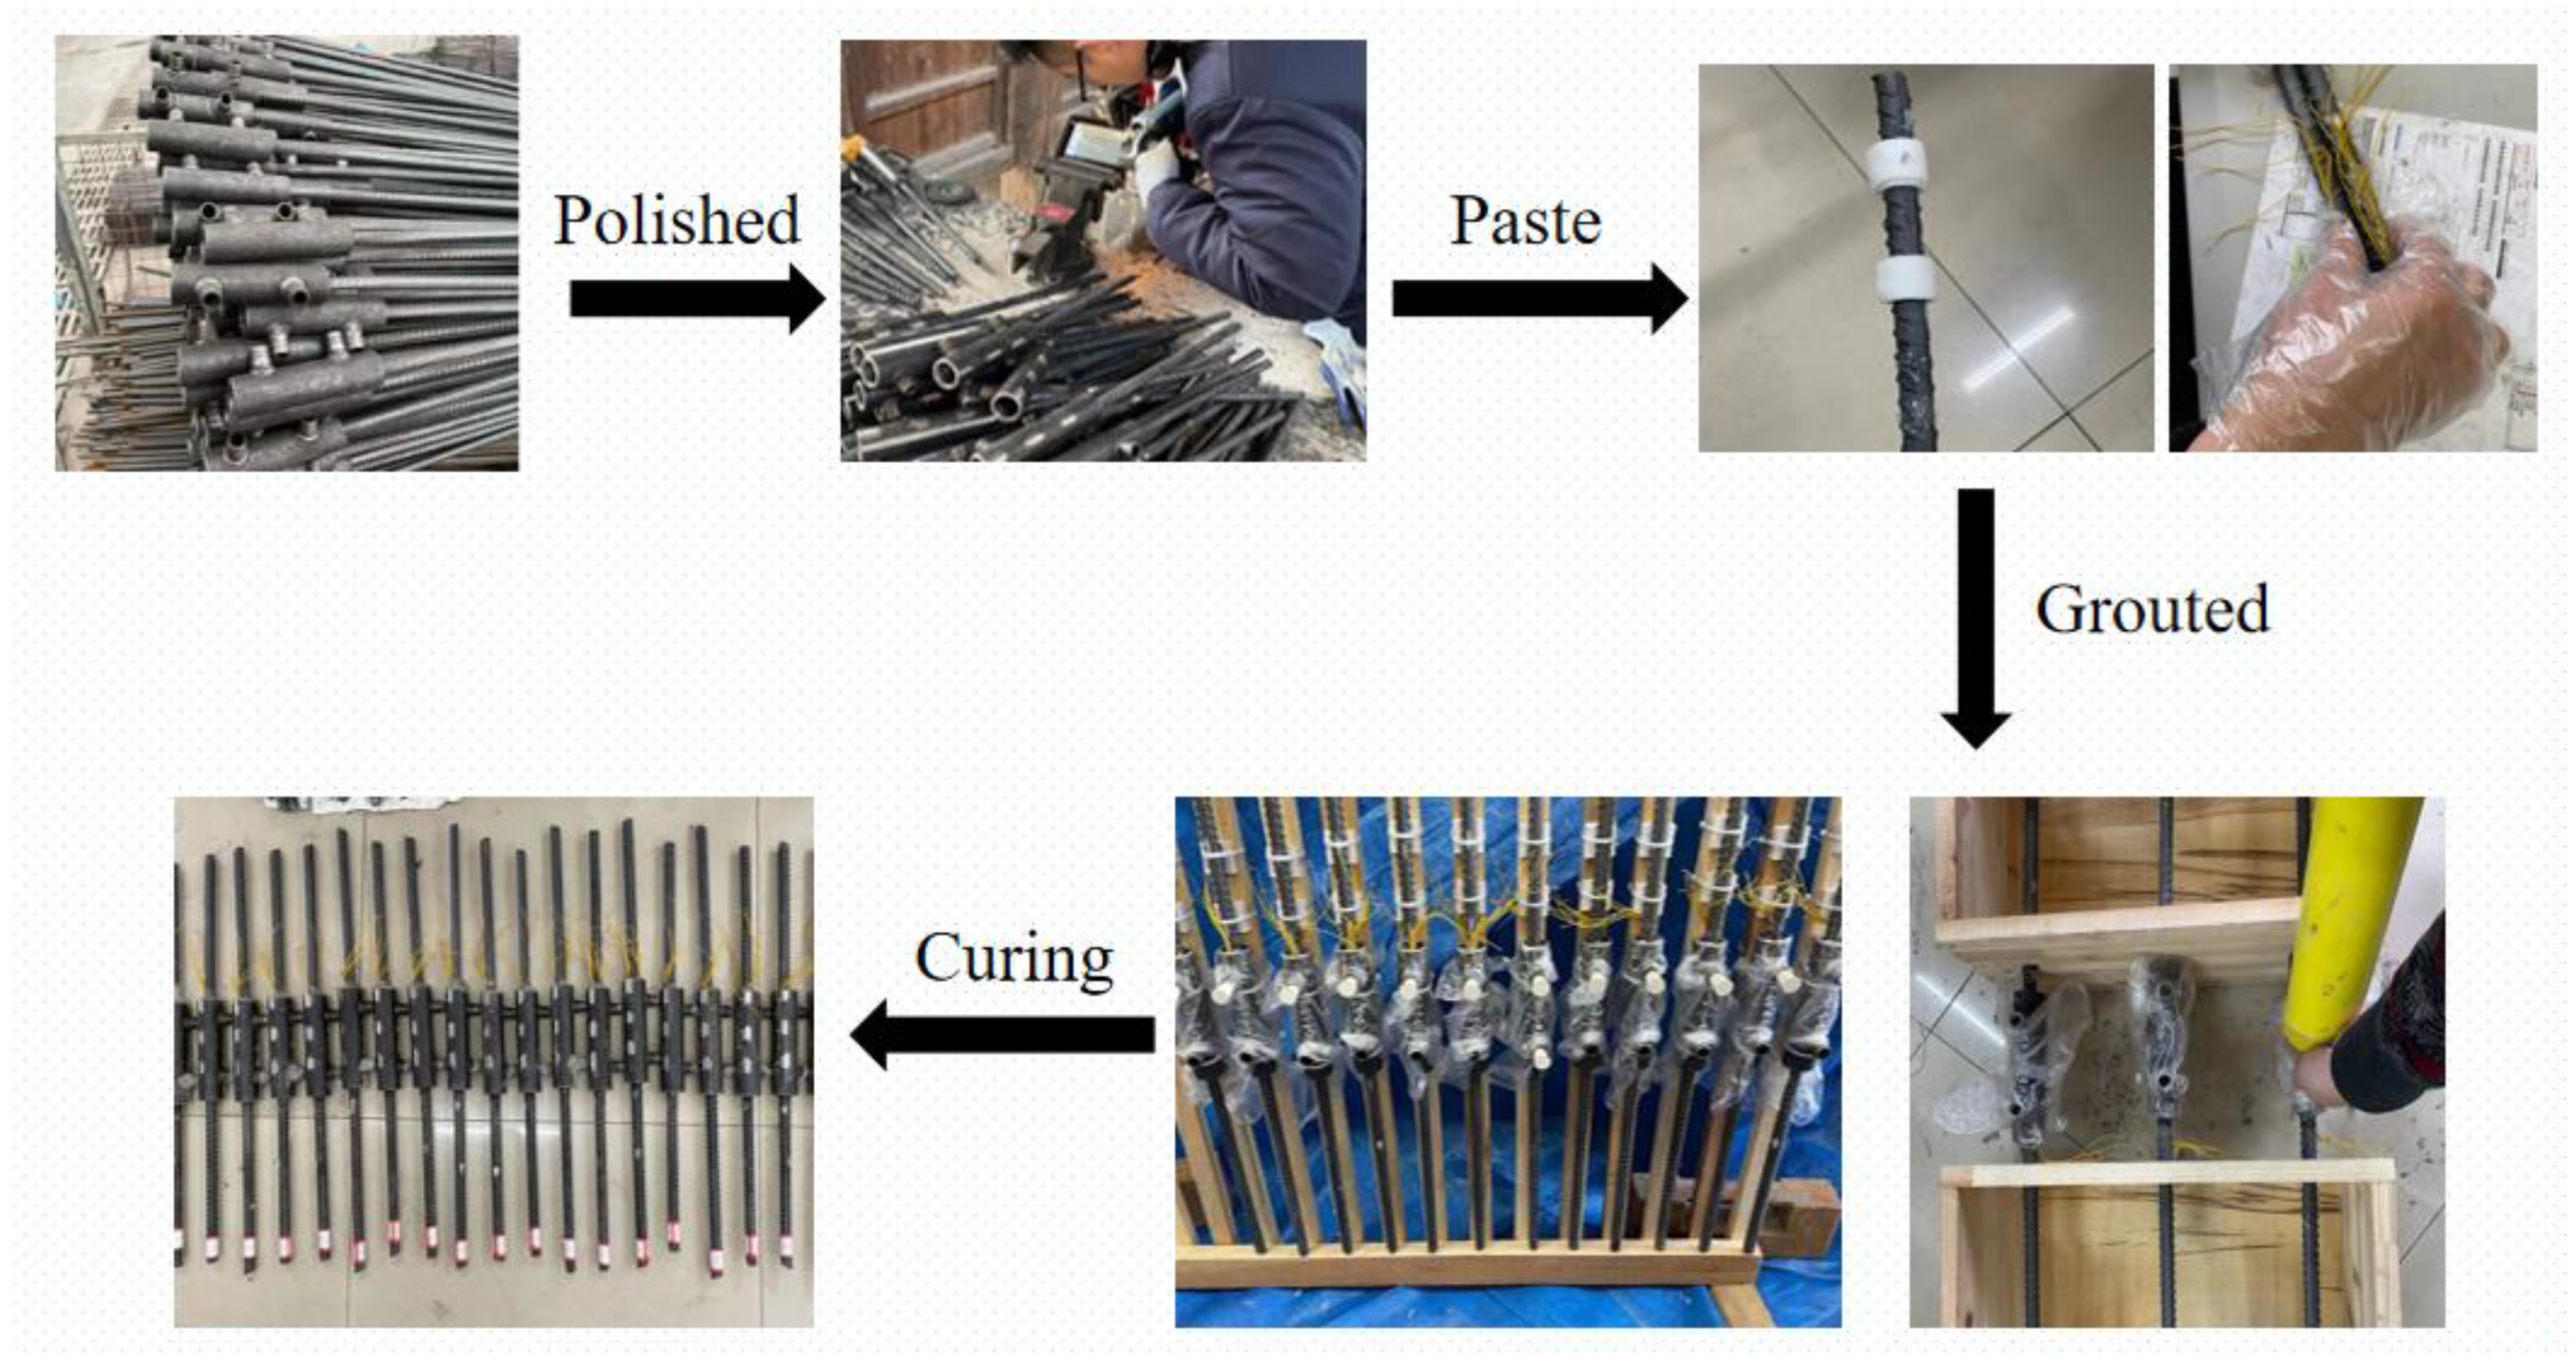
The specimen preparation process included rebar thread processing, defect fabrication, arrangement of strain measurement points, and grouting, as shown in Figure 8. All the specimens were fixed vertically on a special wooden frame with ties after processing. According to JGJ355-2015 [22], the anchorage length of the rebar at the grouting end is 120 mm, which should not be less than 8 d. The water-to-cement ratio was strictly controlled between 0.13 and 0.14. After grouting, it was cured for 28 days under standard curing conditions.

2.3. Loading Plan

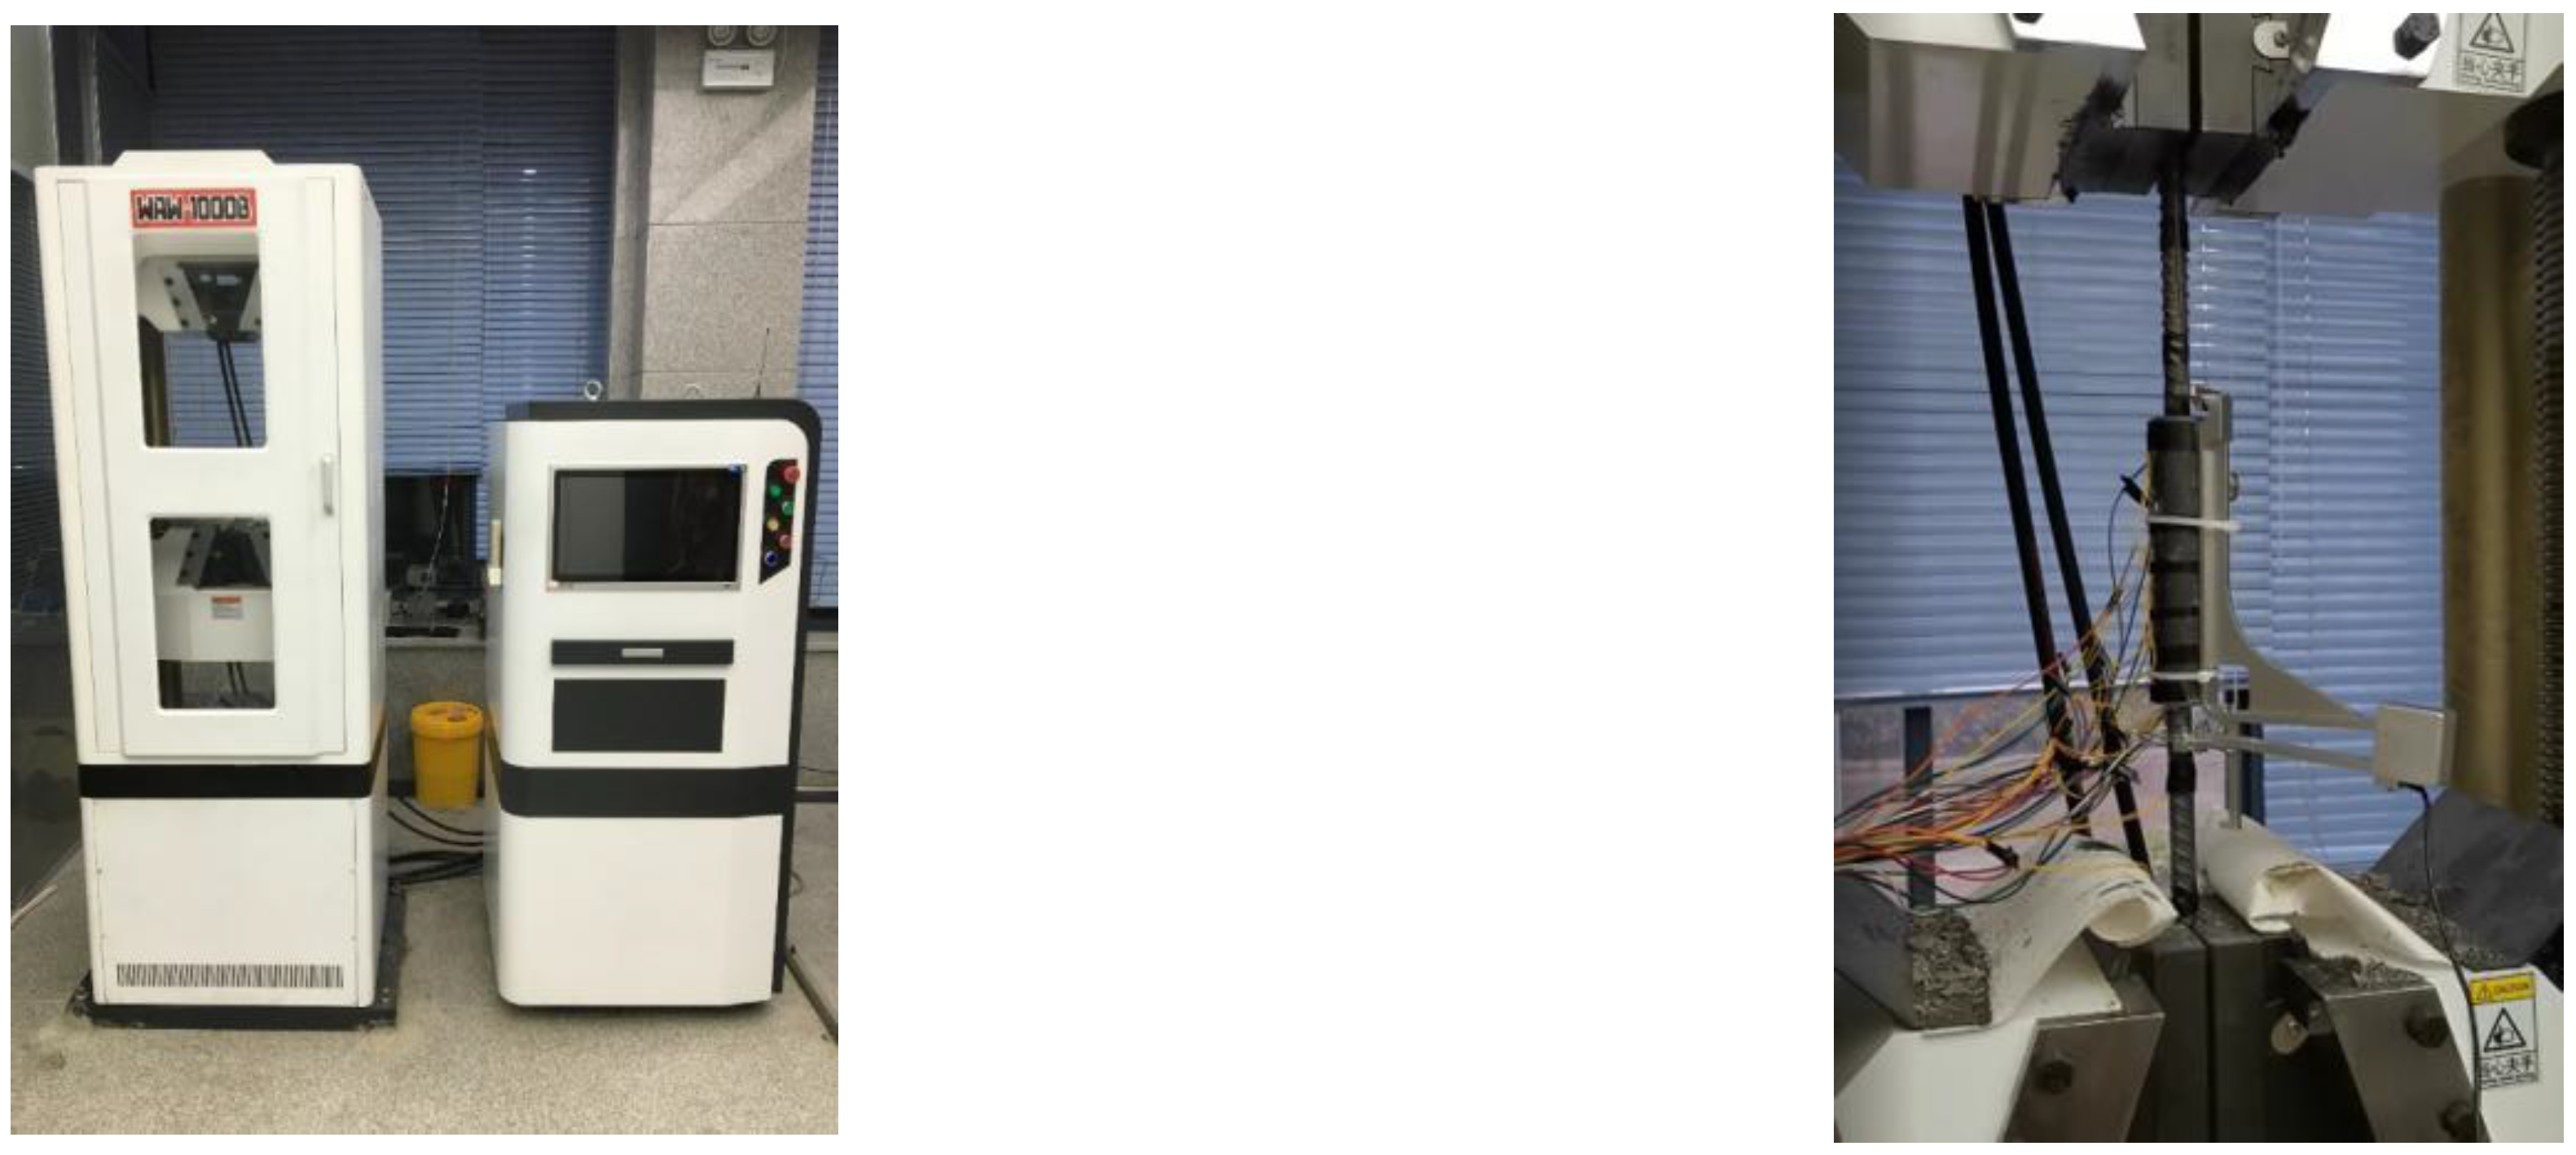
As shown in Figure 9, the WA−1000B electronic hydraulic universal machine was adopted, produced at Nanhua Co., Ltd., Cangzhou, China. The machine has upper and lower clamps that clamp the rebar at both ends of the sleeve. The loading method was unidirectional stretching. Specimens were loaded by displacement control until to damage. The loading rate was 5 mm/min.

2.4. Arrangement of Measuring Points

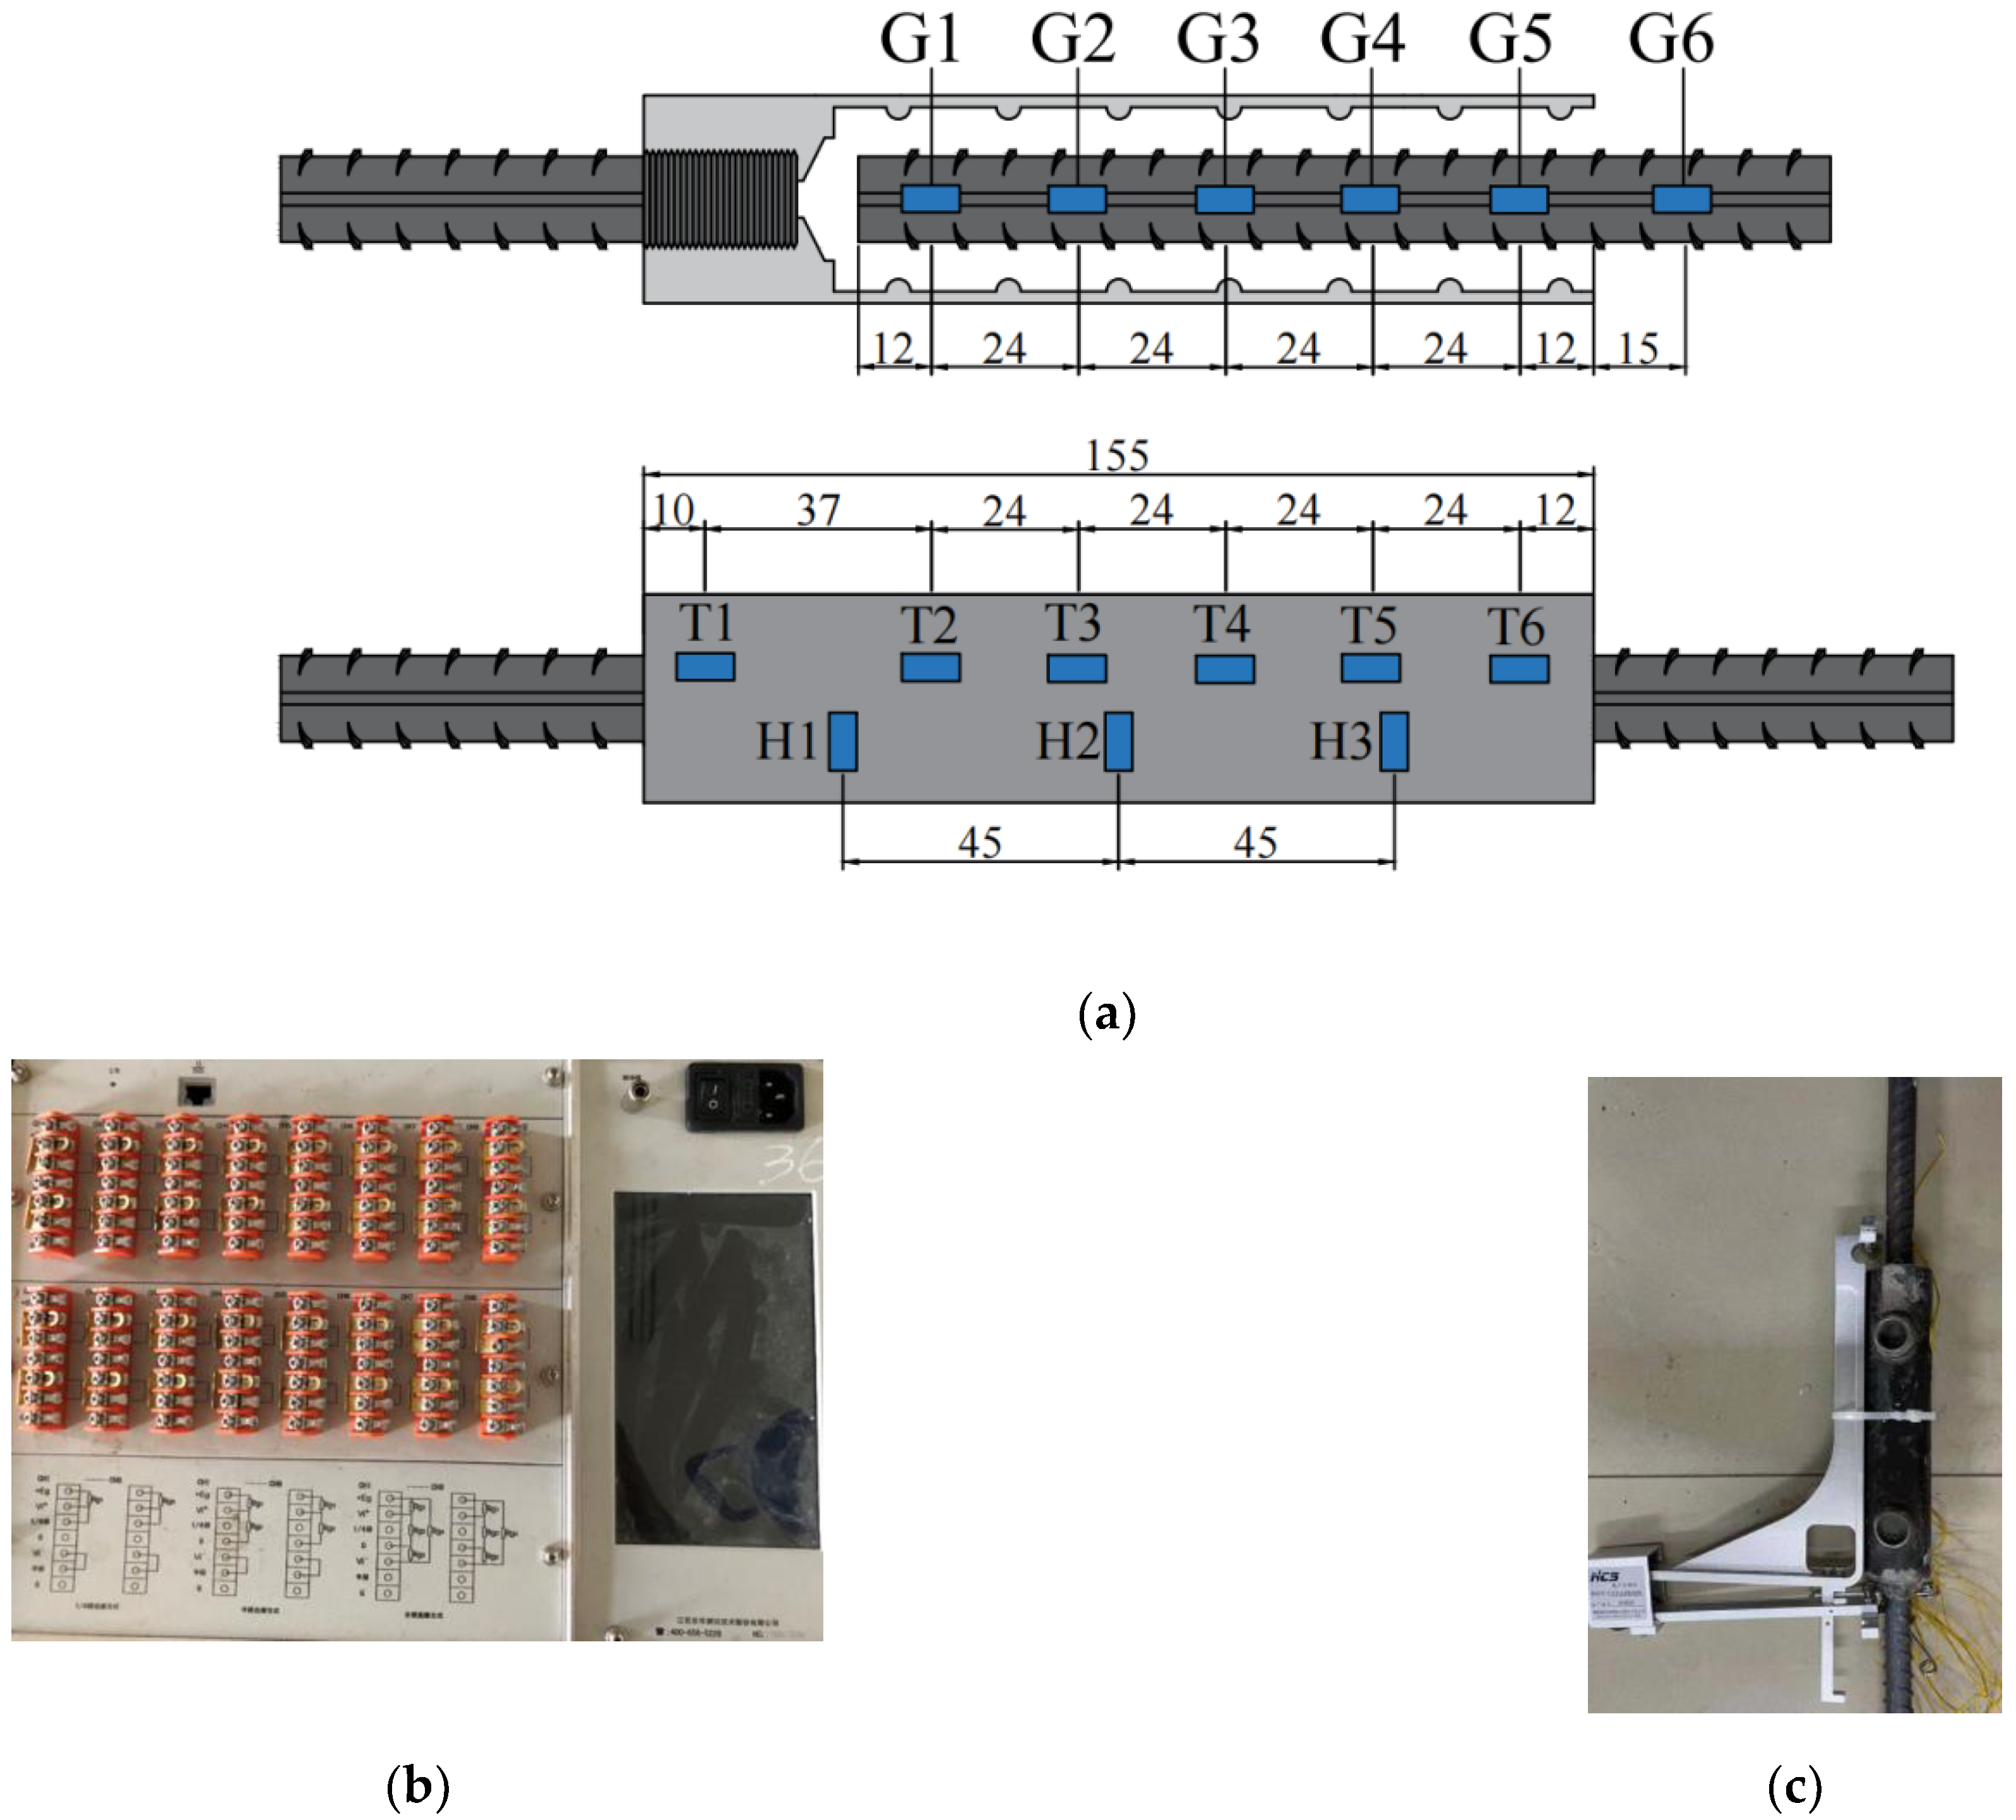
The load and displacement were automatically recorded by the universal testing machine. Six strain gauges (G1–G6) were installed on the rebar at the grouting end. Six axial strain gauges (T1–T6) and three circumferential strain gauges (H1–H3) were installed along the sleeve. The strain data were collected by the data acquisition system (Figure 10b). The slip was monitored using a YYU200/25 extensometer with a range of 25 mm and a distance of 200 mm. The extensometer was directly tied to the sleeve, and the anchor rebar was clamped by a distance spring at the other end, as shown in Figure 10c.

3. Results and Analysis

The failure modes were either rebar fracture (Figure 11a) or rebar pull-out (Figure 11b). The failure form of the specimen depended on the relative magnitude of the bond strength and rebar strength between the rebar and the grouting material. In the specimens with rebar fracture failure, the fracture section of the rebar was necked, and the grouting material was conically detached at the grouting end.
Table 9 lists the main parameters and failure modes of each specimen. The specimens, namely GT14-BM, GT14-DB-2d, GT14-SP-2mm, and GT14-SP-4mm, all suffered rebar fracture failure. None of the specimens underwent significant changes before the rebars yielded. After the rebar yielded, the grouting material developed cracks along the rebar surface toward the inner wall of the sleeve. The grouting material peeled off in a conical shape. With increasing load, the rebar underwent necking and finally fractured. The fracture location was random: either at the anchored end or threaded end. GT14-DB-2.5d, GT14-DB-3d, GT14-ZB-2.5d, GT14-JB-2-2.5d, GT14-JB-3-2.5d, GT14-DC-2-2.5d, and GT14-DC-3-2.5d specimens all suffered rebar pull-out failure. Specimens did not exhibit any significant changes before the rebar yielded. After the rebar yielded, the grouting material cracks developed along the surface of the rebar toward the inner wall of the sleeve. The grouting material peeled off in a conical shape. With increasing load, the test was stopped when the load–displacement curve dropped significantly. The rebar at the anchored end of the specimen pulled out for a distance (Figure 11b).

3.1. Load–Displacement Curves

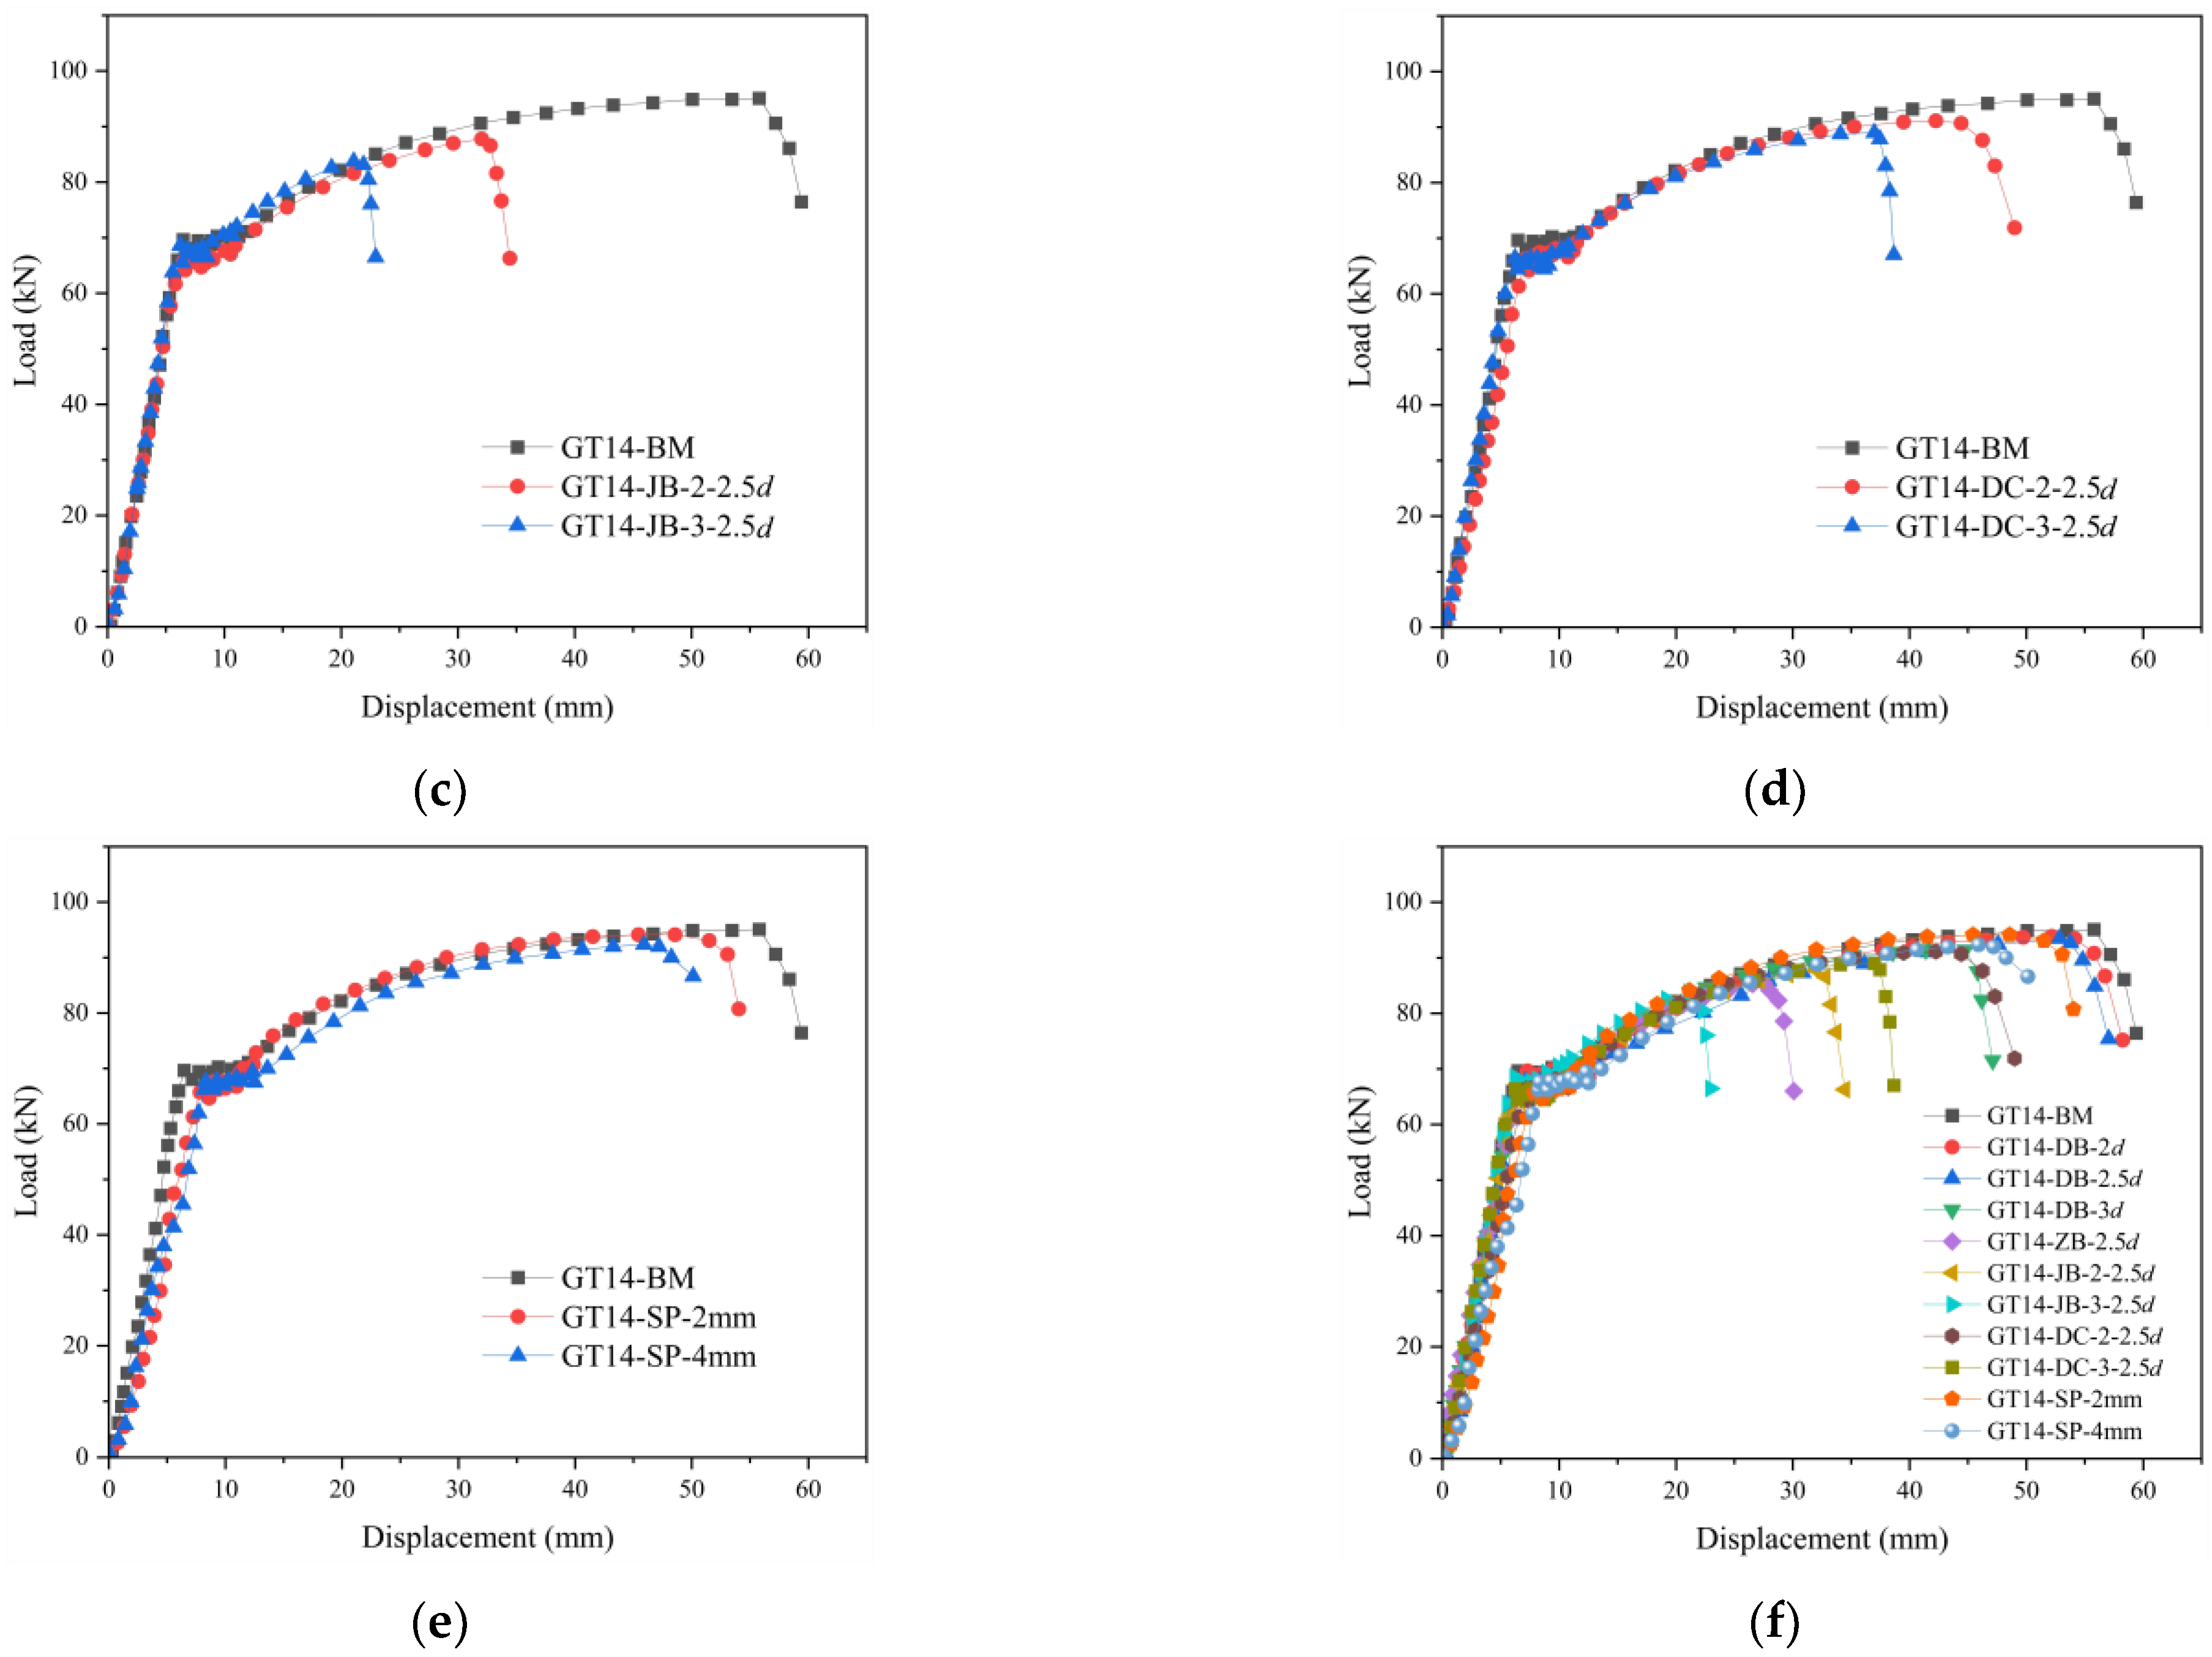
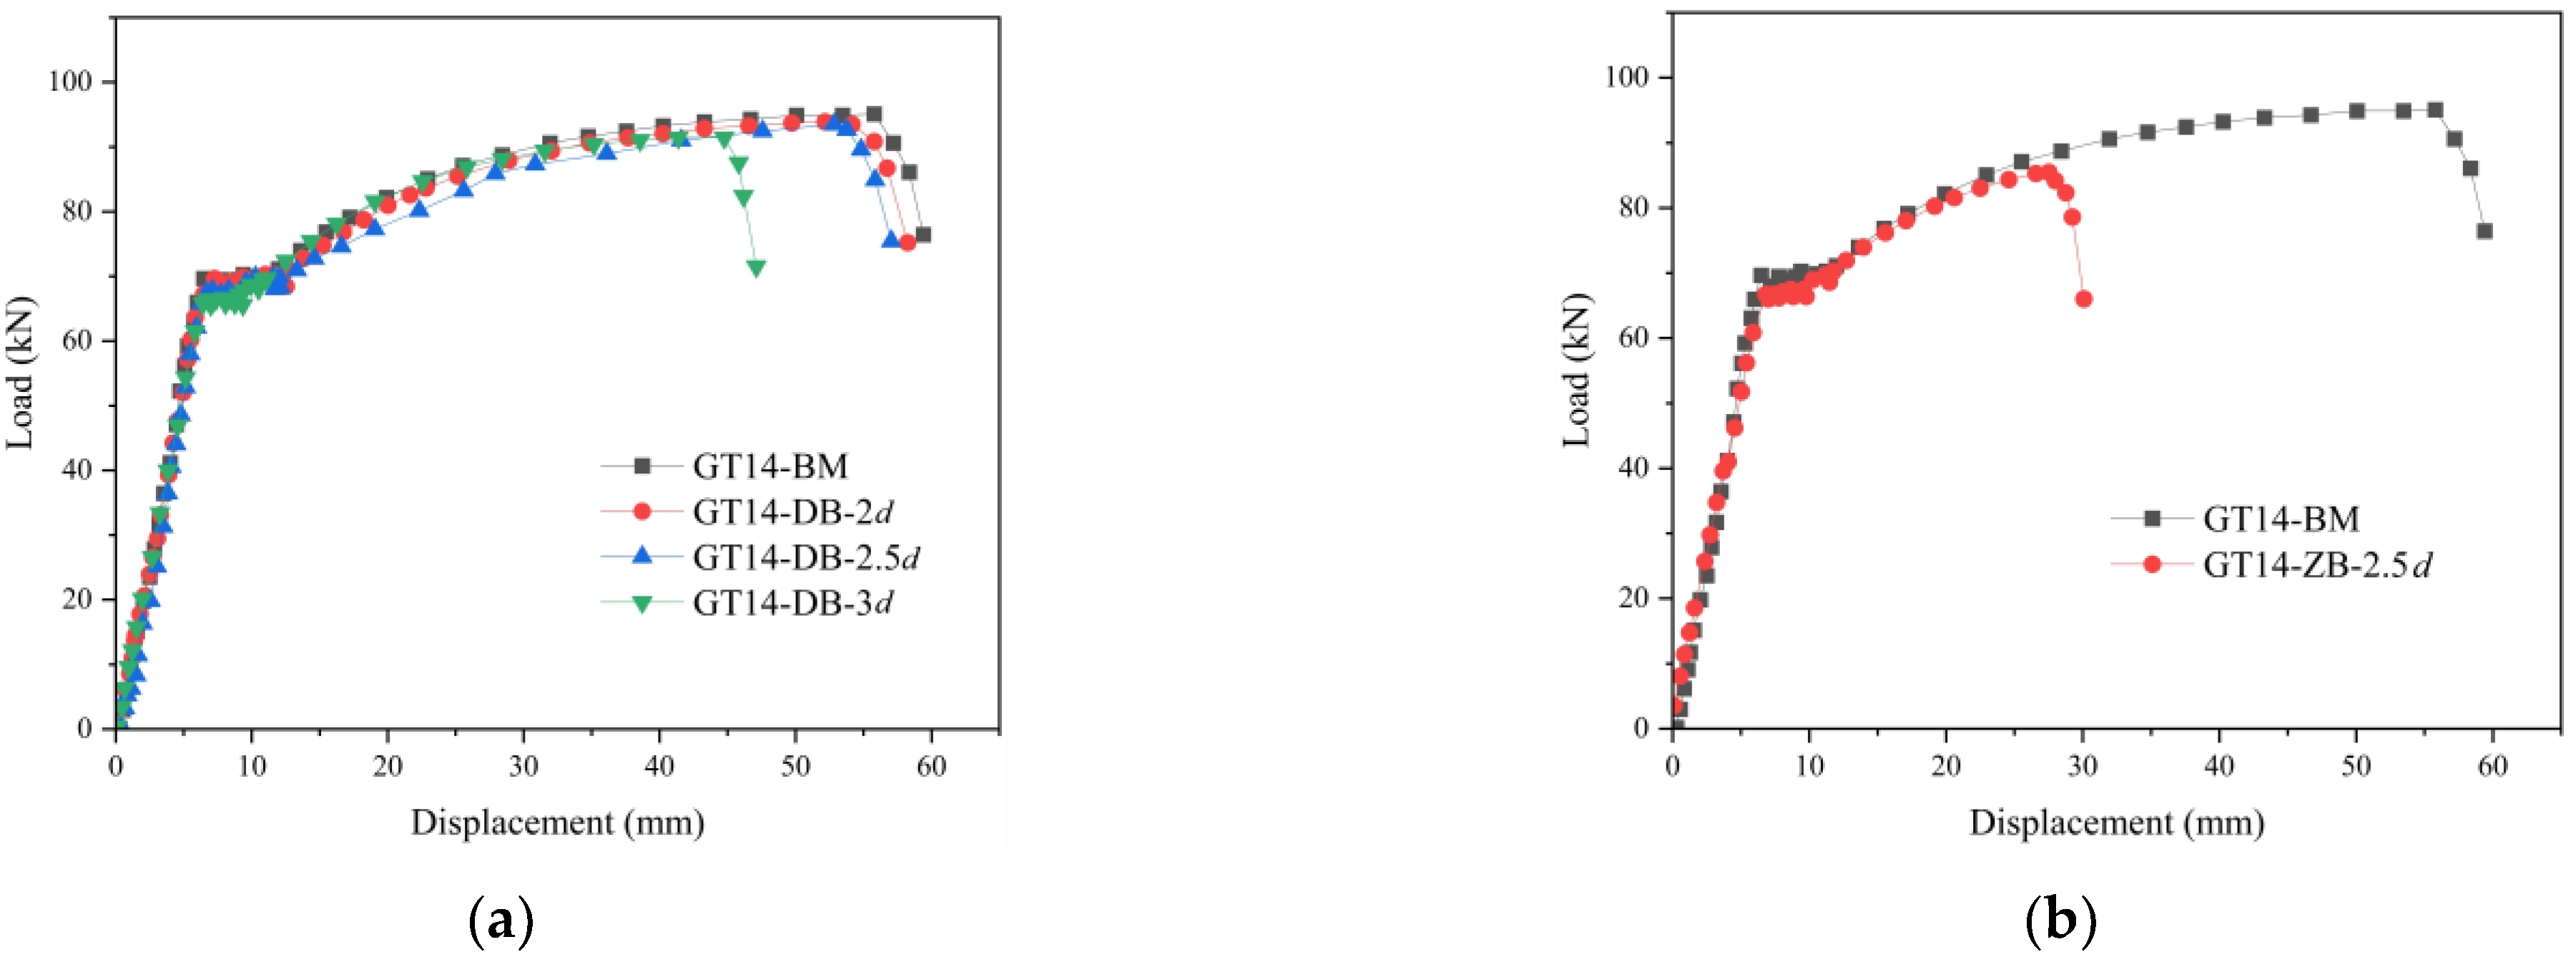
Figure 12 shows the average load–displacement curves of each group of specimens. The load is tensile, and the displacement is the perpendicular distance between the reaction beams of the experimental machine and the loading (Figure 6). As shown, the load–displacement curves of the specimens are similar. The curves show elastic, yielding, strengthening, and failure stages. In the elastic stage, the load P changes linearly with the displacement δ [23,24,25,26]. The specimen then enters the yielding stage; the load remains unchanged, but the deformation increases rapidly. In the strengthening stage, the overall deformation of the specimen increases significantly. With increasing displacement, the specimen is destroyed following a gradual increase in the load.
The load–displacement curves of the GT14-DB specimens (Figure 12a) are similar to those of GT14-BM in the elastic, yielding, and strengthening stages. The average yield load of GT14-BM is 55.10 kN, and the ultimate load is 94.41 kN. When the defect lengths are 2 d and 2.5 d, the average ultimate loads of the specimens are 93.63 kN and 93.10 kN, respectively, and the average ultimate displacements are 53.49 mm and 52.66 mm, which are slightly lower than those of the standard group specimens. When the defect length is 3 d, the average ultimate load is 90.79 kN, which is approximately 3.8% lower than those of the standard group specimens; the average ultimate displacement is 44.53 mm, which is approximately 19.2% less than those of the standard group specimens. When the length of the defect at the end of the rebar is greater than 2.5 d, the overall ductility of the specimen deteriorates rapidly.
Before yielding, the curve trend of the GT14-ZB specimens is approximately the same as the standard group specimens (Figure 12b). The average limit load of GT14-ZB-2.5d is 84.23 kN, which is approximately 10.8% lower than those of the standard group specimens. The average limit displacement is 26.57 mm, which is approximately 51.78% lower than those of the standard group specimens. This shows that the middle defect had a greater influence on the specimens than the end defect of the rebar. When the defect was located in the middle, the bond stress between the rebar and the grouting material was broken at the middle. The grouting material can be divided into two parts to transfer the bond stress to the rebar separately. The two parts of the grout could not reach the ultimate bond stress simultaneously. This makes the middle defect more detrimental to the specimen than the end defect.
In the GT14-JB group specimens (Figure 12c), the average limit load of GT14-JB-2-2.5d is 87.52 kN, which is approximately 7.3% lower than those of the standard group specimens; the average limit displacement is 28.08 mm, which is approximately 49.0% lower than those of the standard group specimens. The average limit load of GT14-JB-3-2.5d is 83.89 kN, which is approximately 11.1% lower than those of the standard group specimens; the average limit displacement is 21.36 mm, which is approximately 61.2% lower than those of the standard group specimens. Similar to the middle defect specimens, the grouting material can be divided into multiple parts, which affected the bond stress transfer between the grouting material and the rebar. The bearing capacity of the specimens decreased with the increase in the number of defects. The impact on the specimen was more unfavorable when the number of uniform defects was greater than 2.
In the GT14-DC group specimens (Figure 12d), the average limit load of GT14-DC-2-2.5d specimens is 90.74 kN, which is approximately 3.9% lower than those of the standard group specimens; the average limit displacement is 41.64 mm, which is approximately 24.4% lower than those of the standard group specimens. The average limit load of GT14-DC-3-2.5d specimens is 89.99 kN, which is approximately 4.7% lower than those of the standard group specimens; the average limit displacement is 36.97 mm, which is approximately 32.9% lower than those of the standard group specimens. The grouting material of the GT14-DC group of specimens could not be completely divided into multiple parts by the defects, and the rebar was still half connected to the grouting material in the defective section; therefore, the effect of the defects on the specimens was less than those of the uniform defects. The bearing capacity of the specimen gradually decreased with increasing number of defects.
In the GT14-SP group specimens (Figure 12e), the average limit load of GT14-SP-2mm specimens is 94.10 kN, which is approximately 0.3% lower than those of the standard group specimens; the average limit displacement is 48.38 mm, which is approximately 12.2% lower than those of the standard group specimens. The average limit load of GT14-SP-4mm specimen is 91.44 kN, which is approximately 3.1% lower than those of the standard group specimens; the average limit displacement is 44.73 mm, which is approximately 18.8% lower than those of the standard group specimens. The bearing capacity of specimens decreased with the increase of the height of horizontal defects. Because the height of the horizontal defects of the specimens are not large, the grout material could still restrain the rebar. The failure form of the specimens were rebar fracture.
Figure 12f shows a comparison of the load–displacement curves between the different groups of specimens. All the defects influence the bearing capacity of the specimen, with the distributed defects being more detrimental to the specimen than the concentrated defects. In the horizontal defect specimens, the grout material could still restrain the rebar, and the bearing capacity decreased slightly.

3.2. Load–Slip Curves

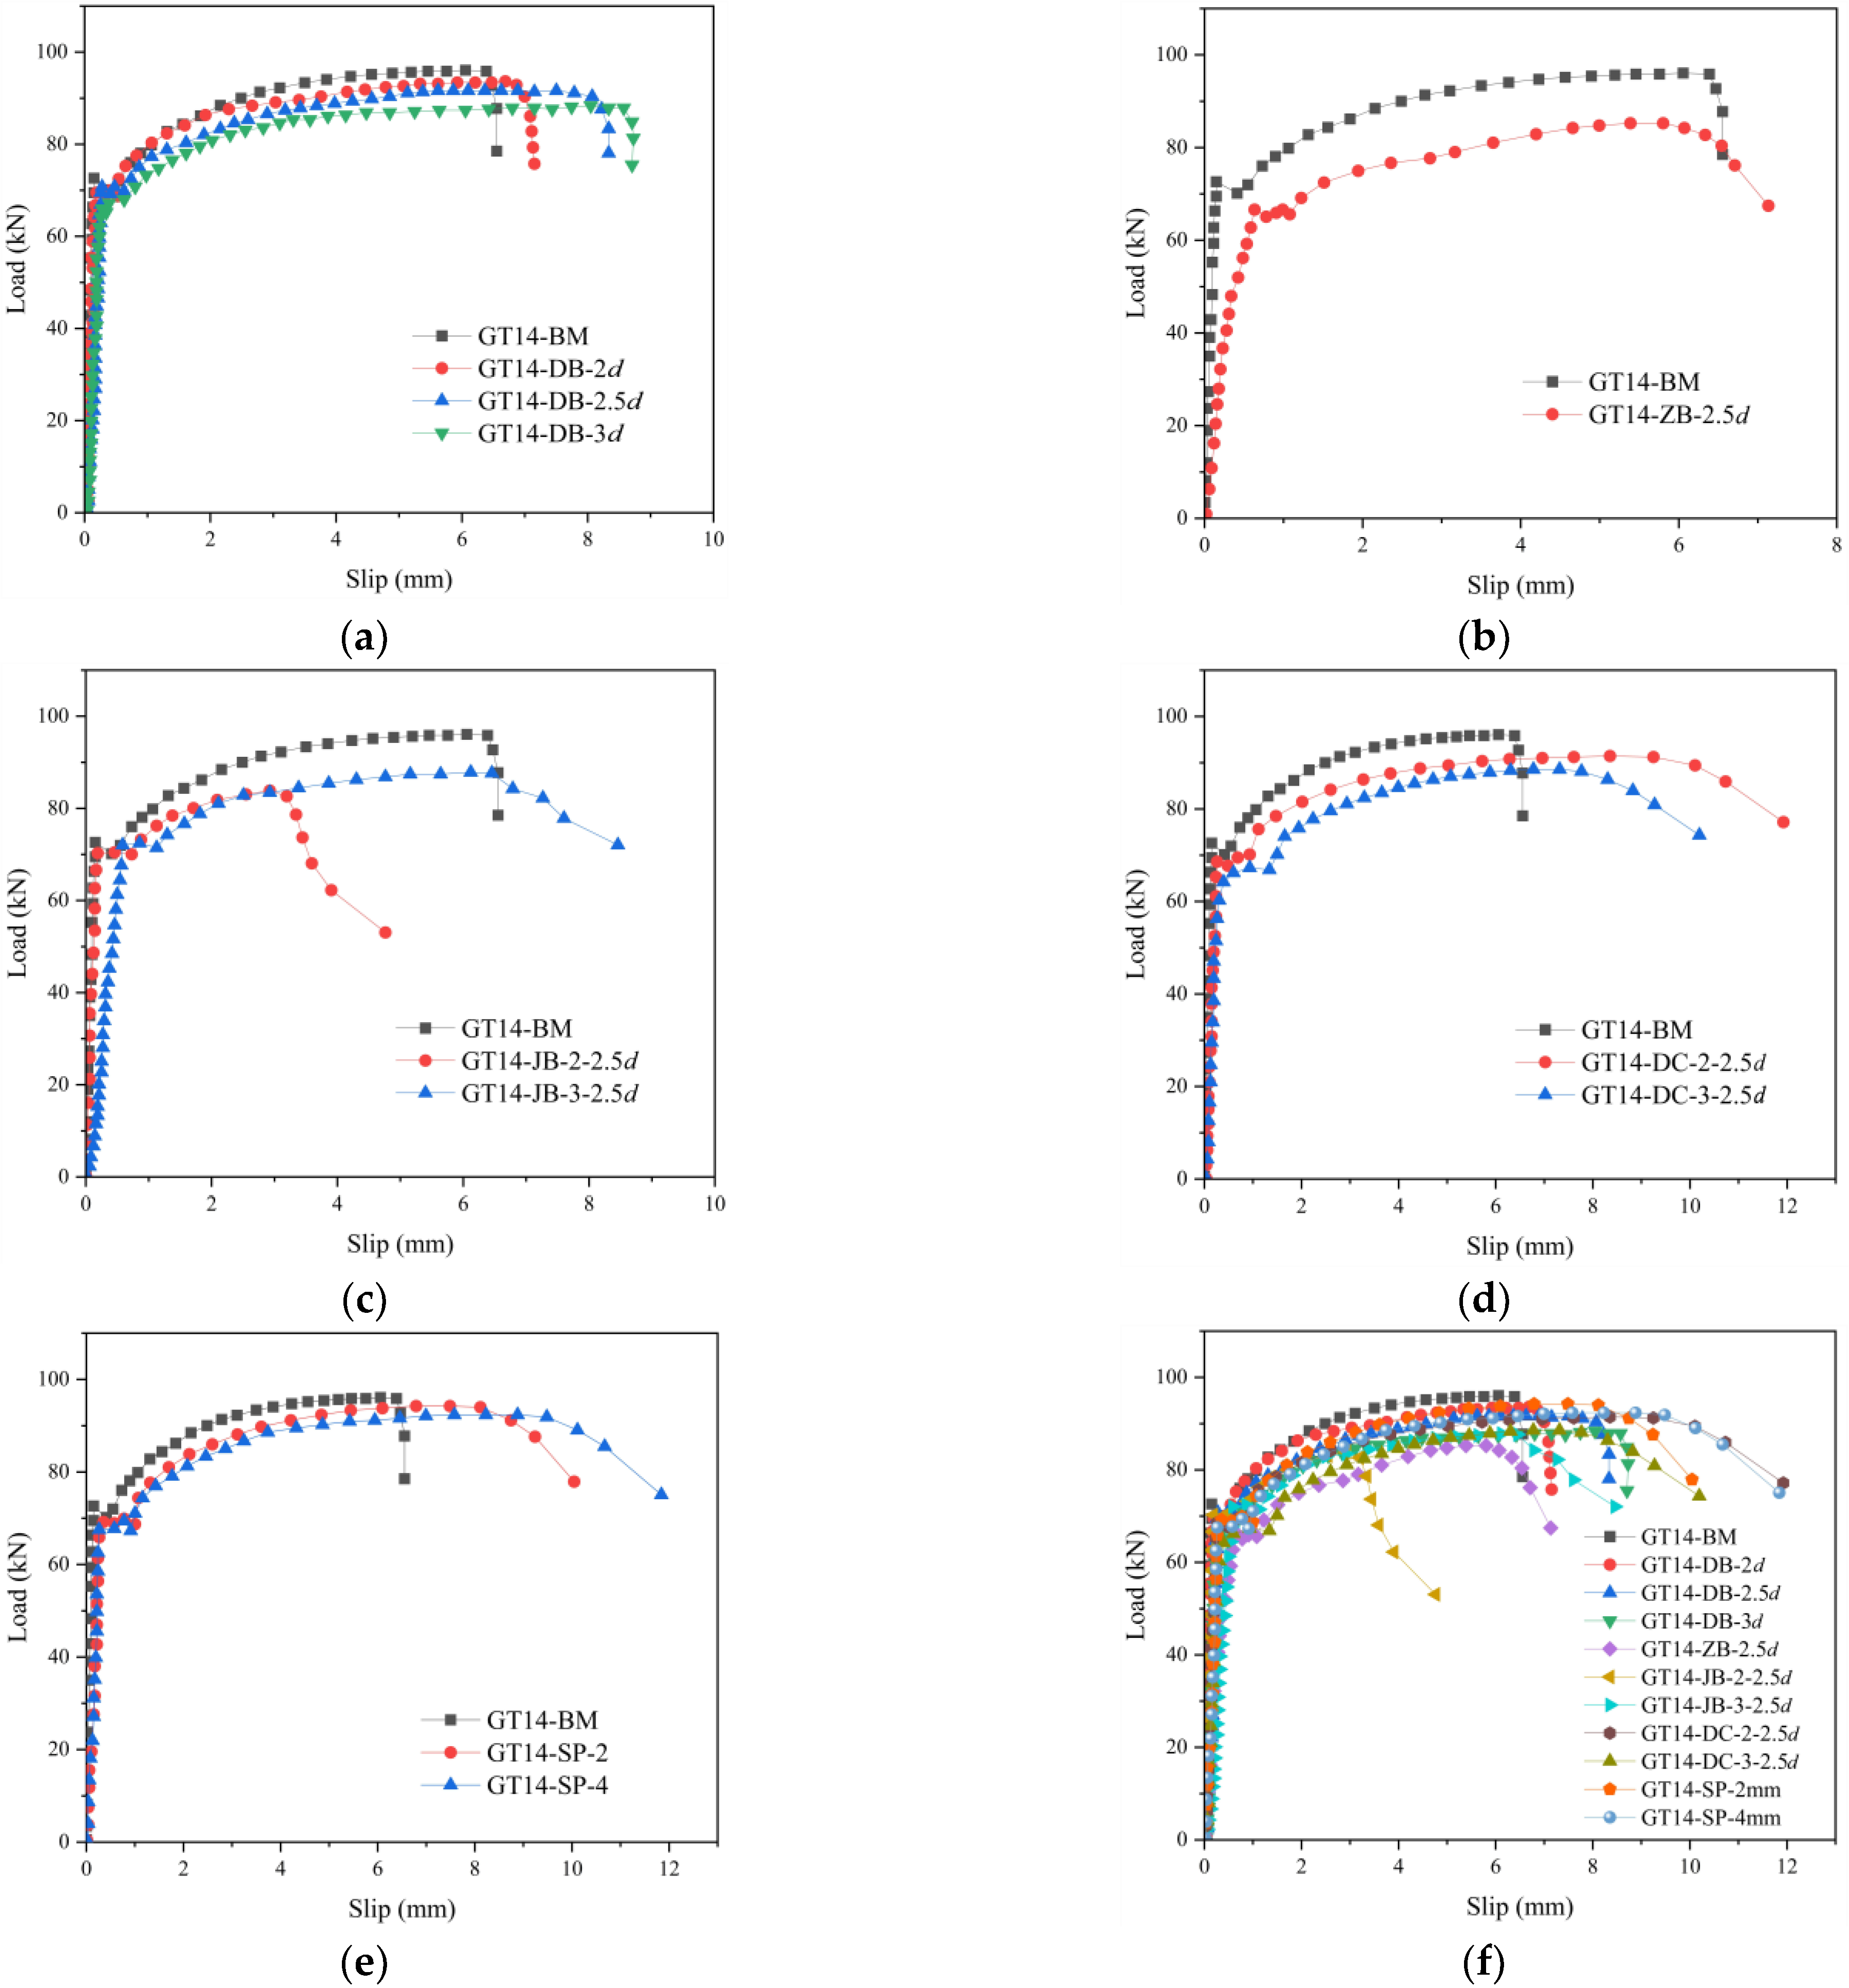
Figure 13 presents the average load–slip curve of each half-grouted sleeve specimen. The slip is the relative displacement between the sleeve and the rebar at the anchored end (Figure 9). The trend curve is similar to the load–displacement curve. Before yielding, the rigidity of the specimen was high. The curves show a linear variation, and the slip values are lower than 1 mm. After yielding, the load increases gradually, and the slip increases quickly. When the load reaches the ultimate load, the small slip makes the bearing capacity decline significantly [27,28].
Figure 13f shows a comparison of the average load–slip curves between all the groups of specimens. The eigenvalues of all the defective specimens were lower than those of the standard group specimens. The defects in the GT14-JB-3-2.5d and GT14-ZB-2.5d specimens caused the connection to fail rapidly after the specimens entered the strengthening phase, and the rebar pulled out prematurely. The slip of the standard group was lower than those of the other specimens.

3.3. Load–Stress Curves

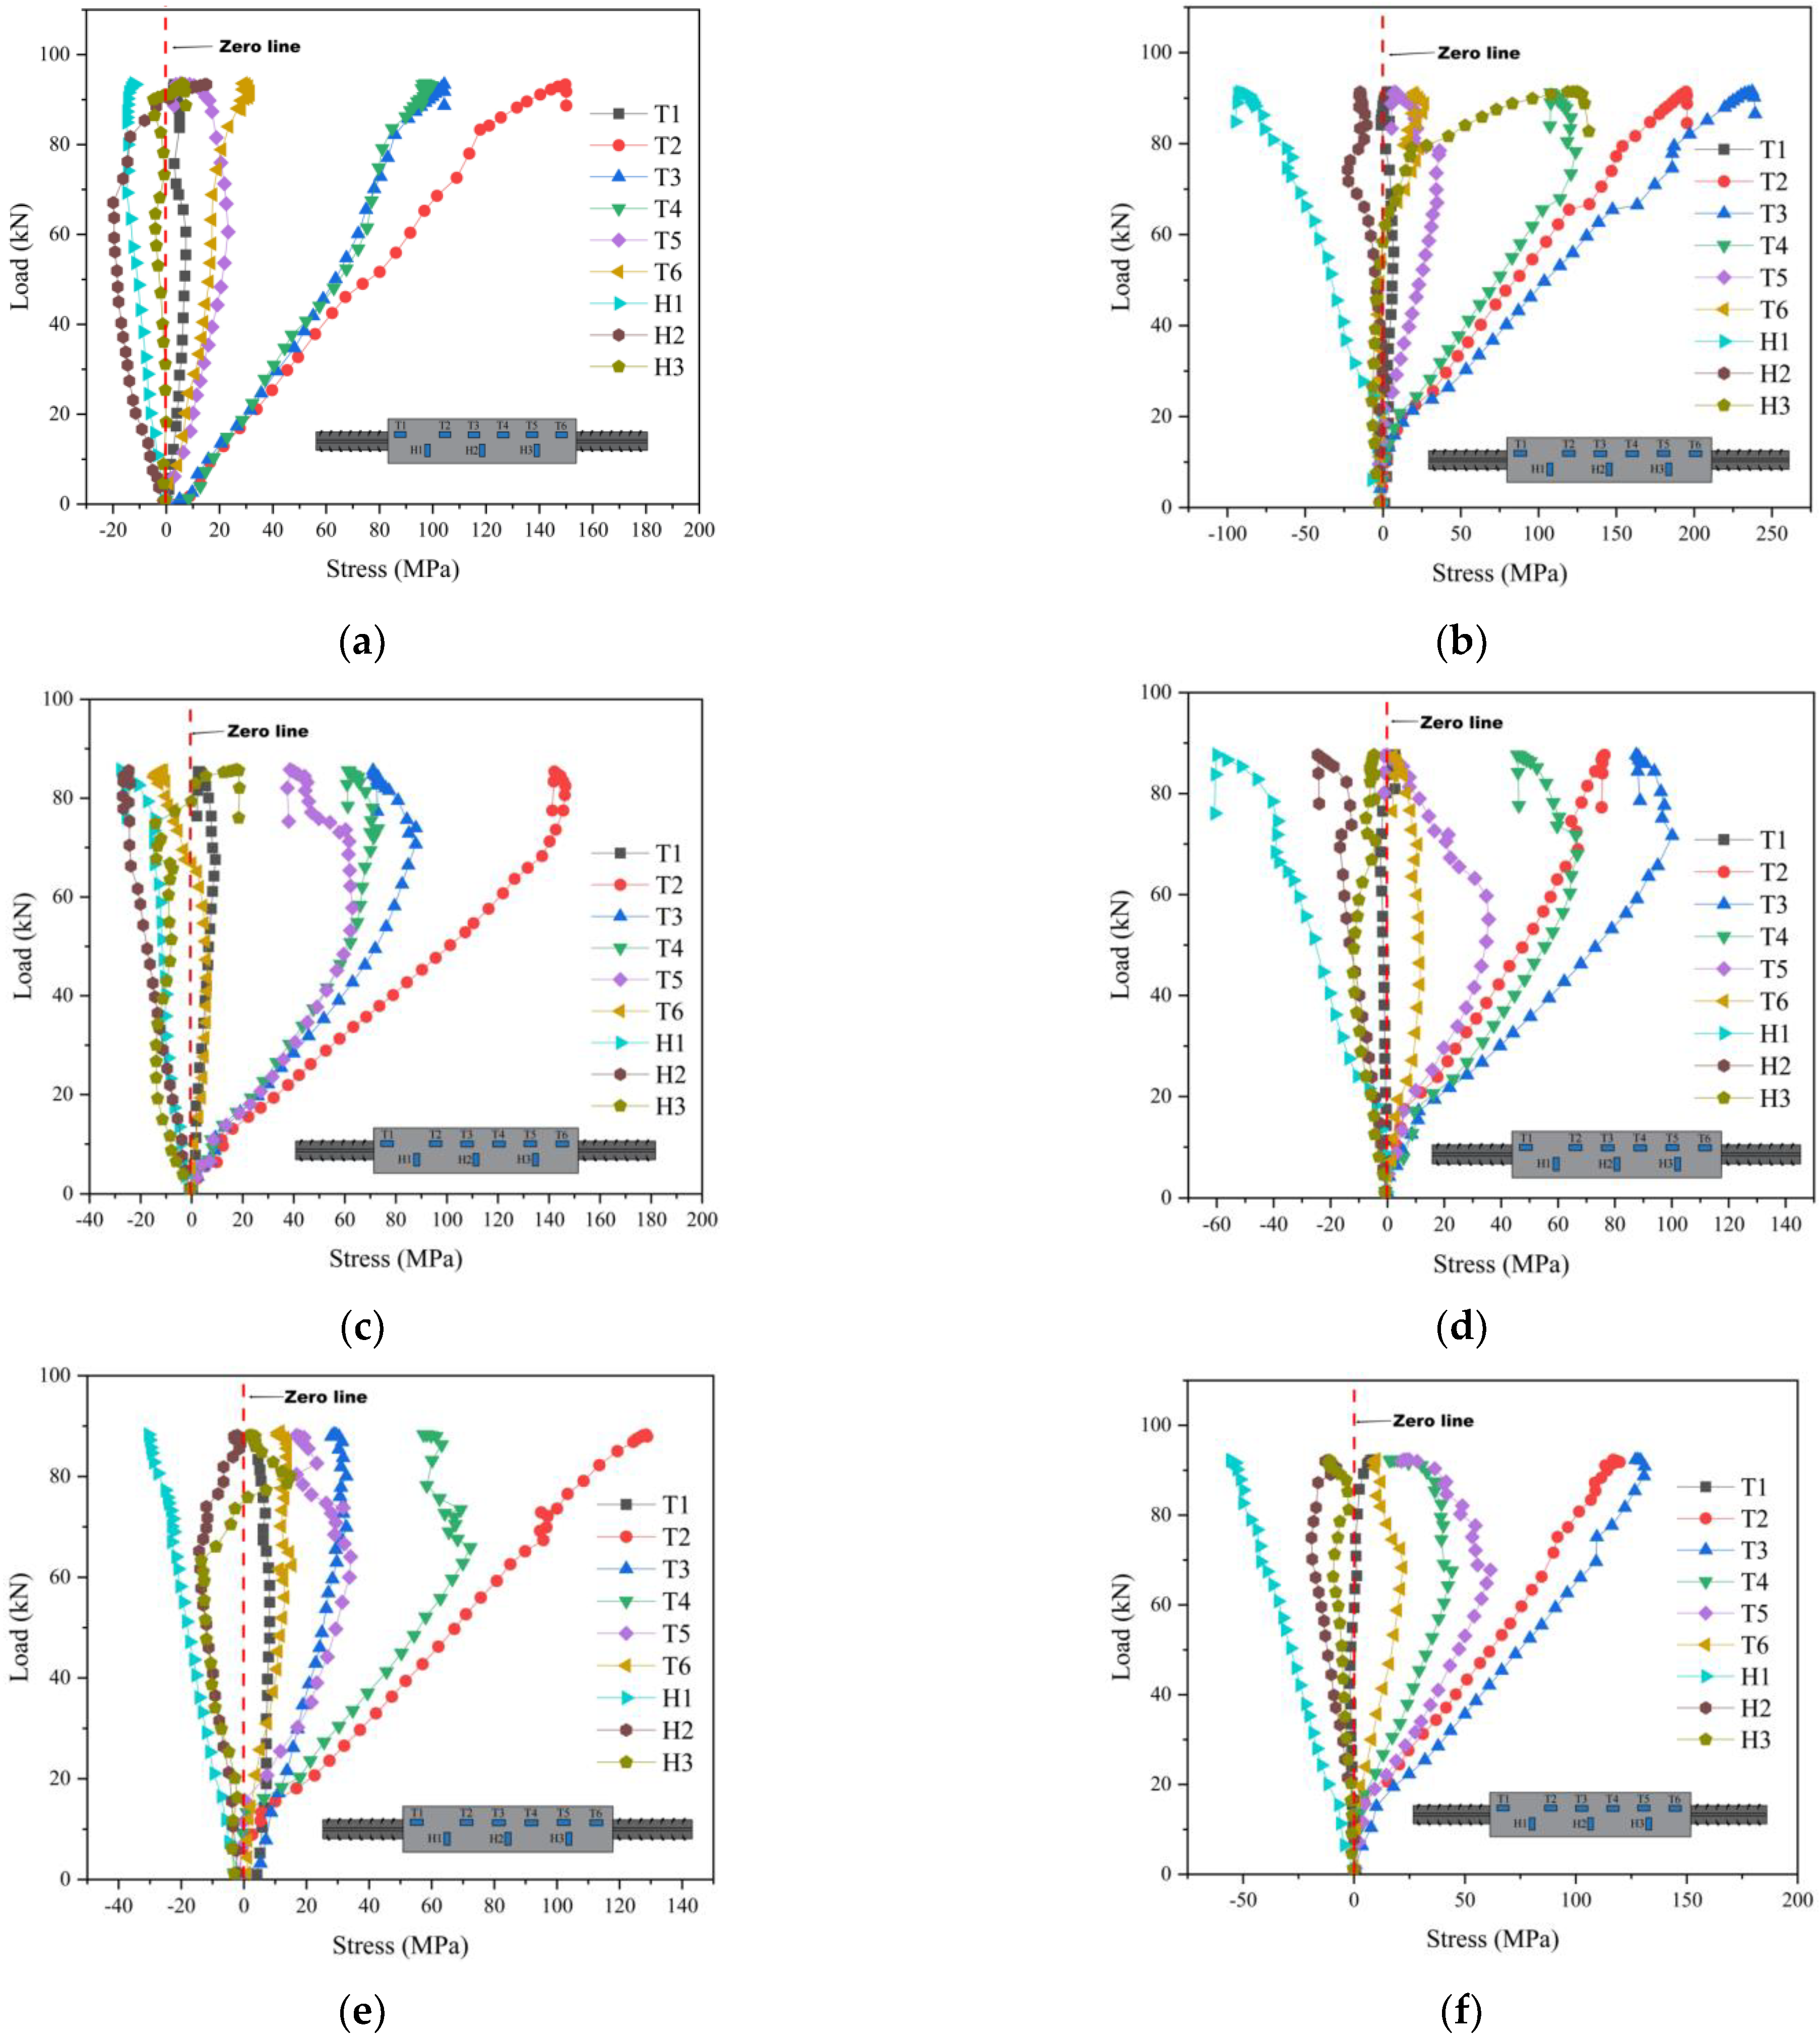
Figure 14 shows the typical load–stress curves. On the sleeve surface, the axial stress was tensile, and the circumferential stress was mainly compressive. The longitudinal extension of the sleeve under a tensile load causes Poisson’s effect. The axial and circumferential stresses increased linearly in the early stage. With increasing load, cracks appeared around the contact surface between the grout material and the rebar, causing the grouting material to expand. The grouting material was restrained by the sleeve. The stress state of the sleeve surface was determined by the stretching of the sleeve and the expansion of the grouting material [29,30]. As shown in Figure 13, the axial stresses are minimum at T1 and maximum at T2 and T3. Because the cross-sectional area of the sleeve reduced between T1 and T2, the maximum axial tensile stress and the maximum circumferential compressive stress in the sleeve were 240.18 MPa and 96.38 MPa, respectively. The stresses were lower than the yield stress of the sleeve. This indicates that the sleeve met the strength requirements.

3.4. Stress Distribution Curves

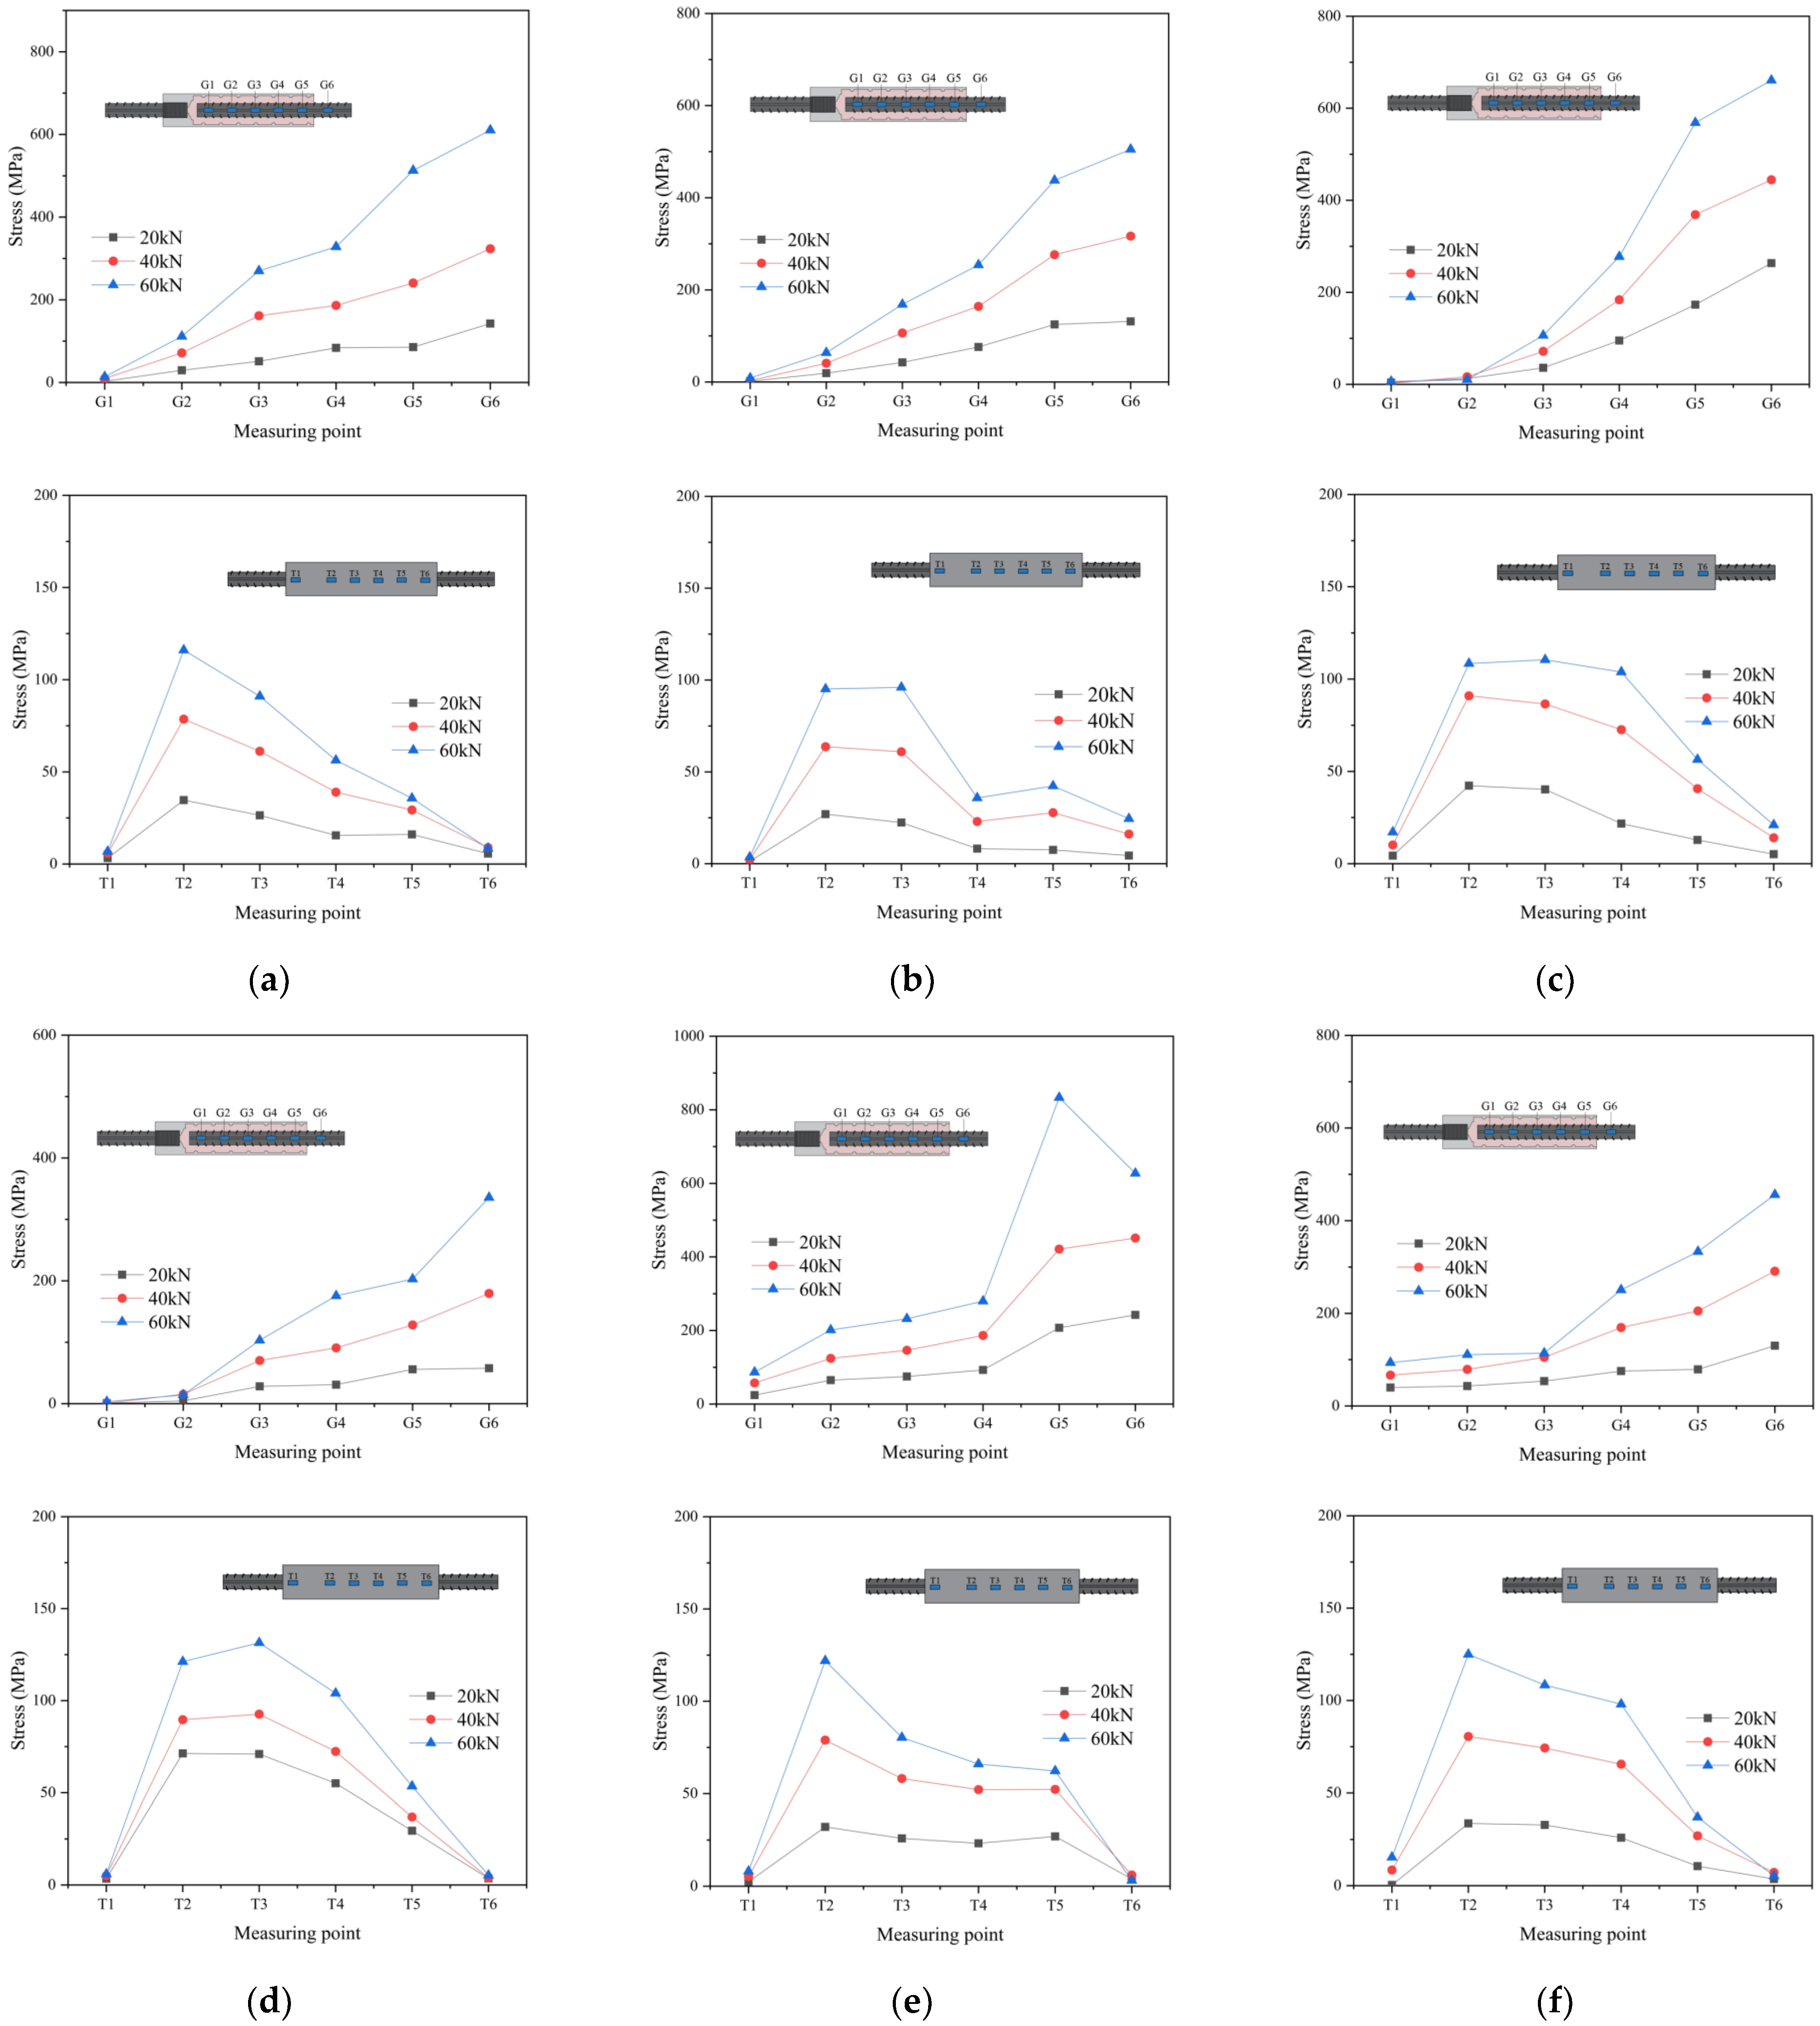
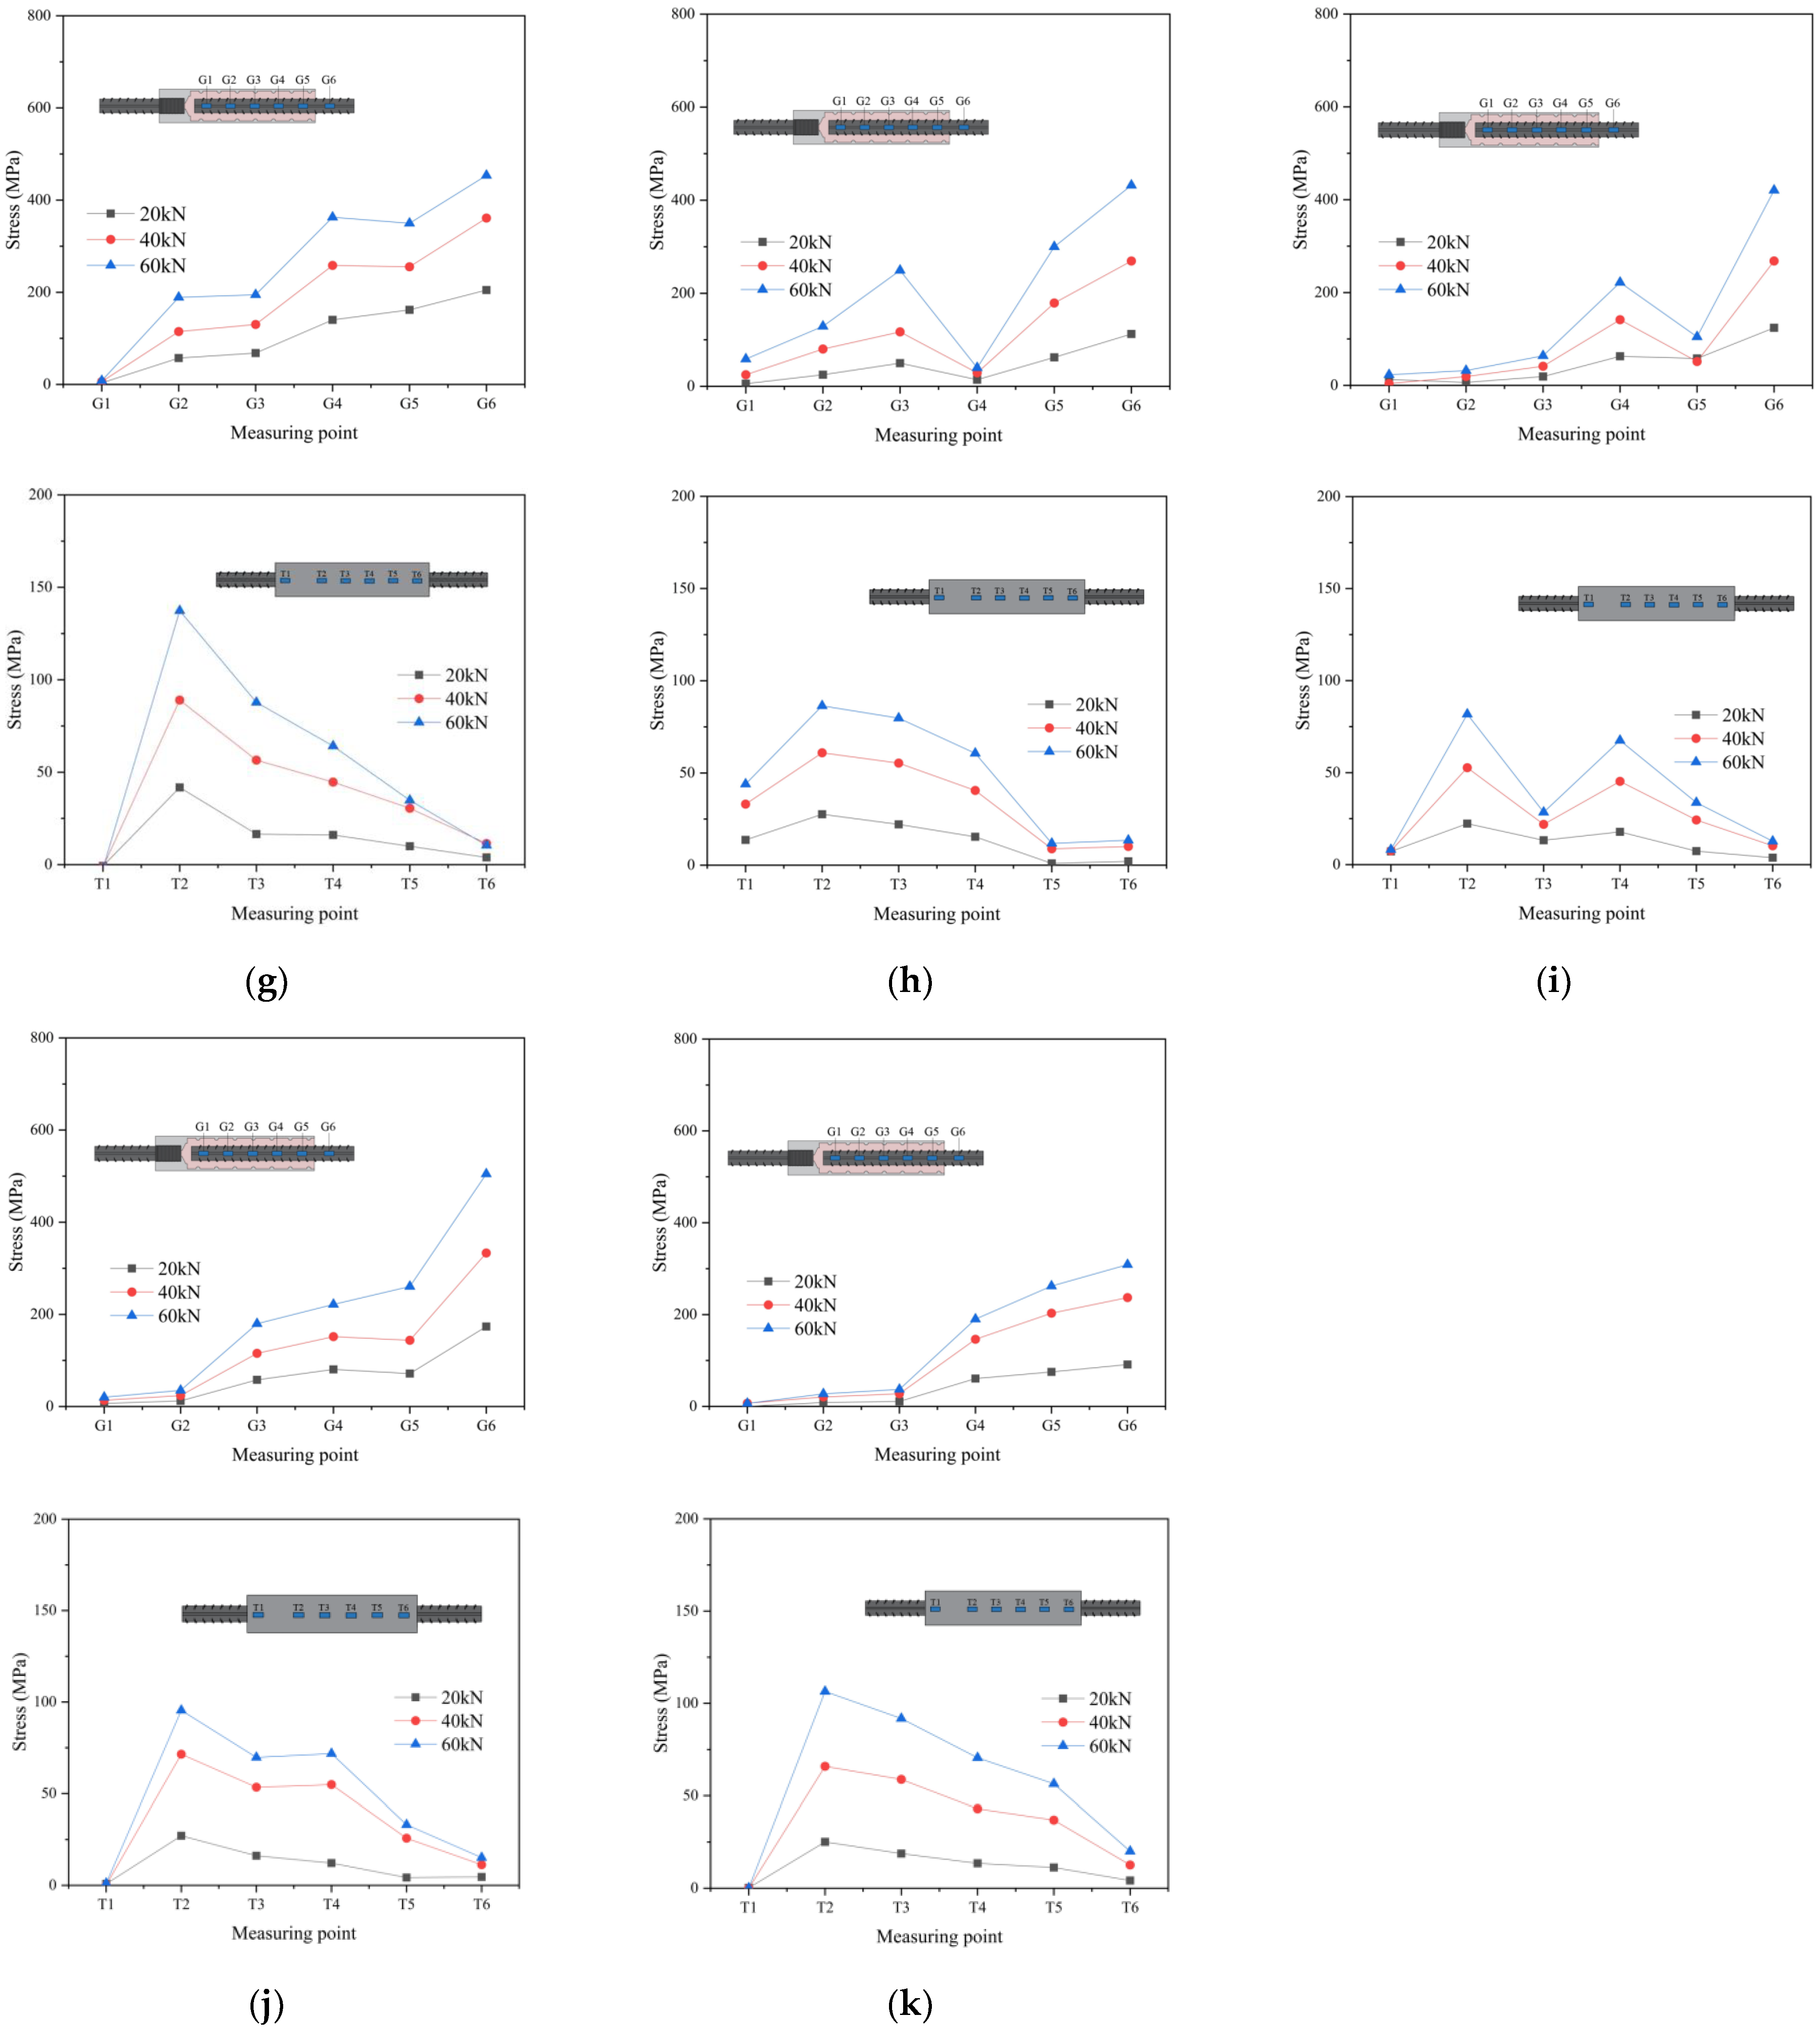
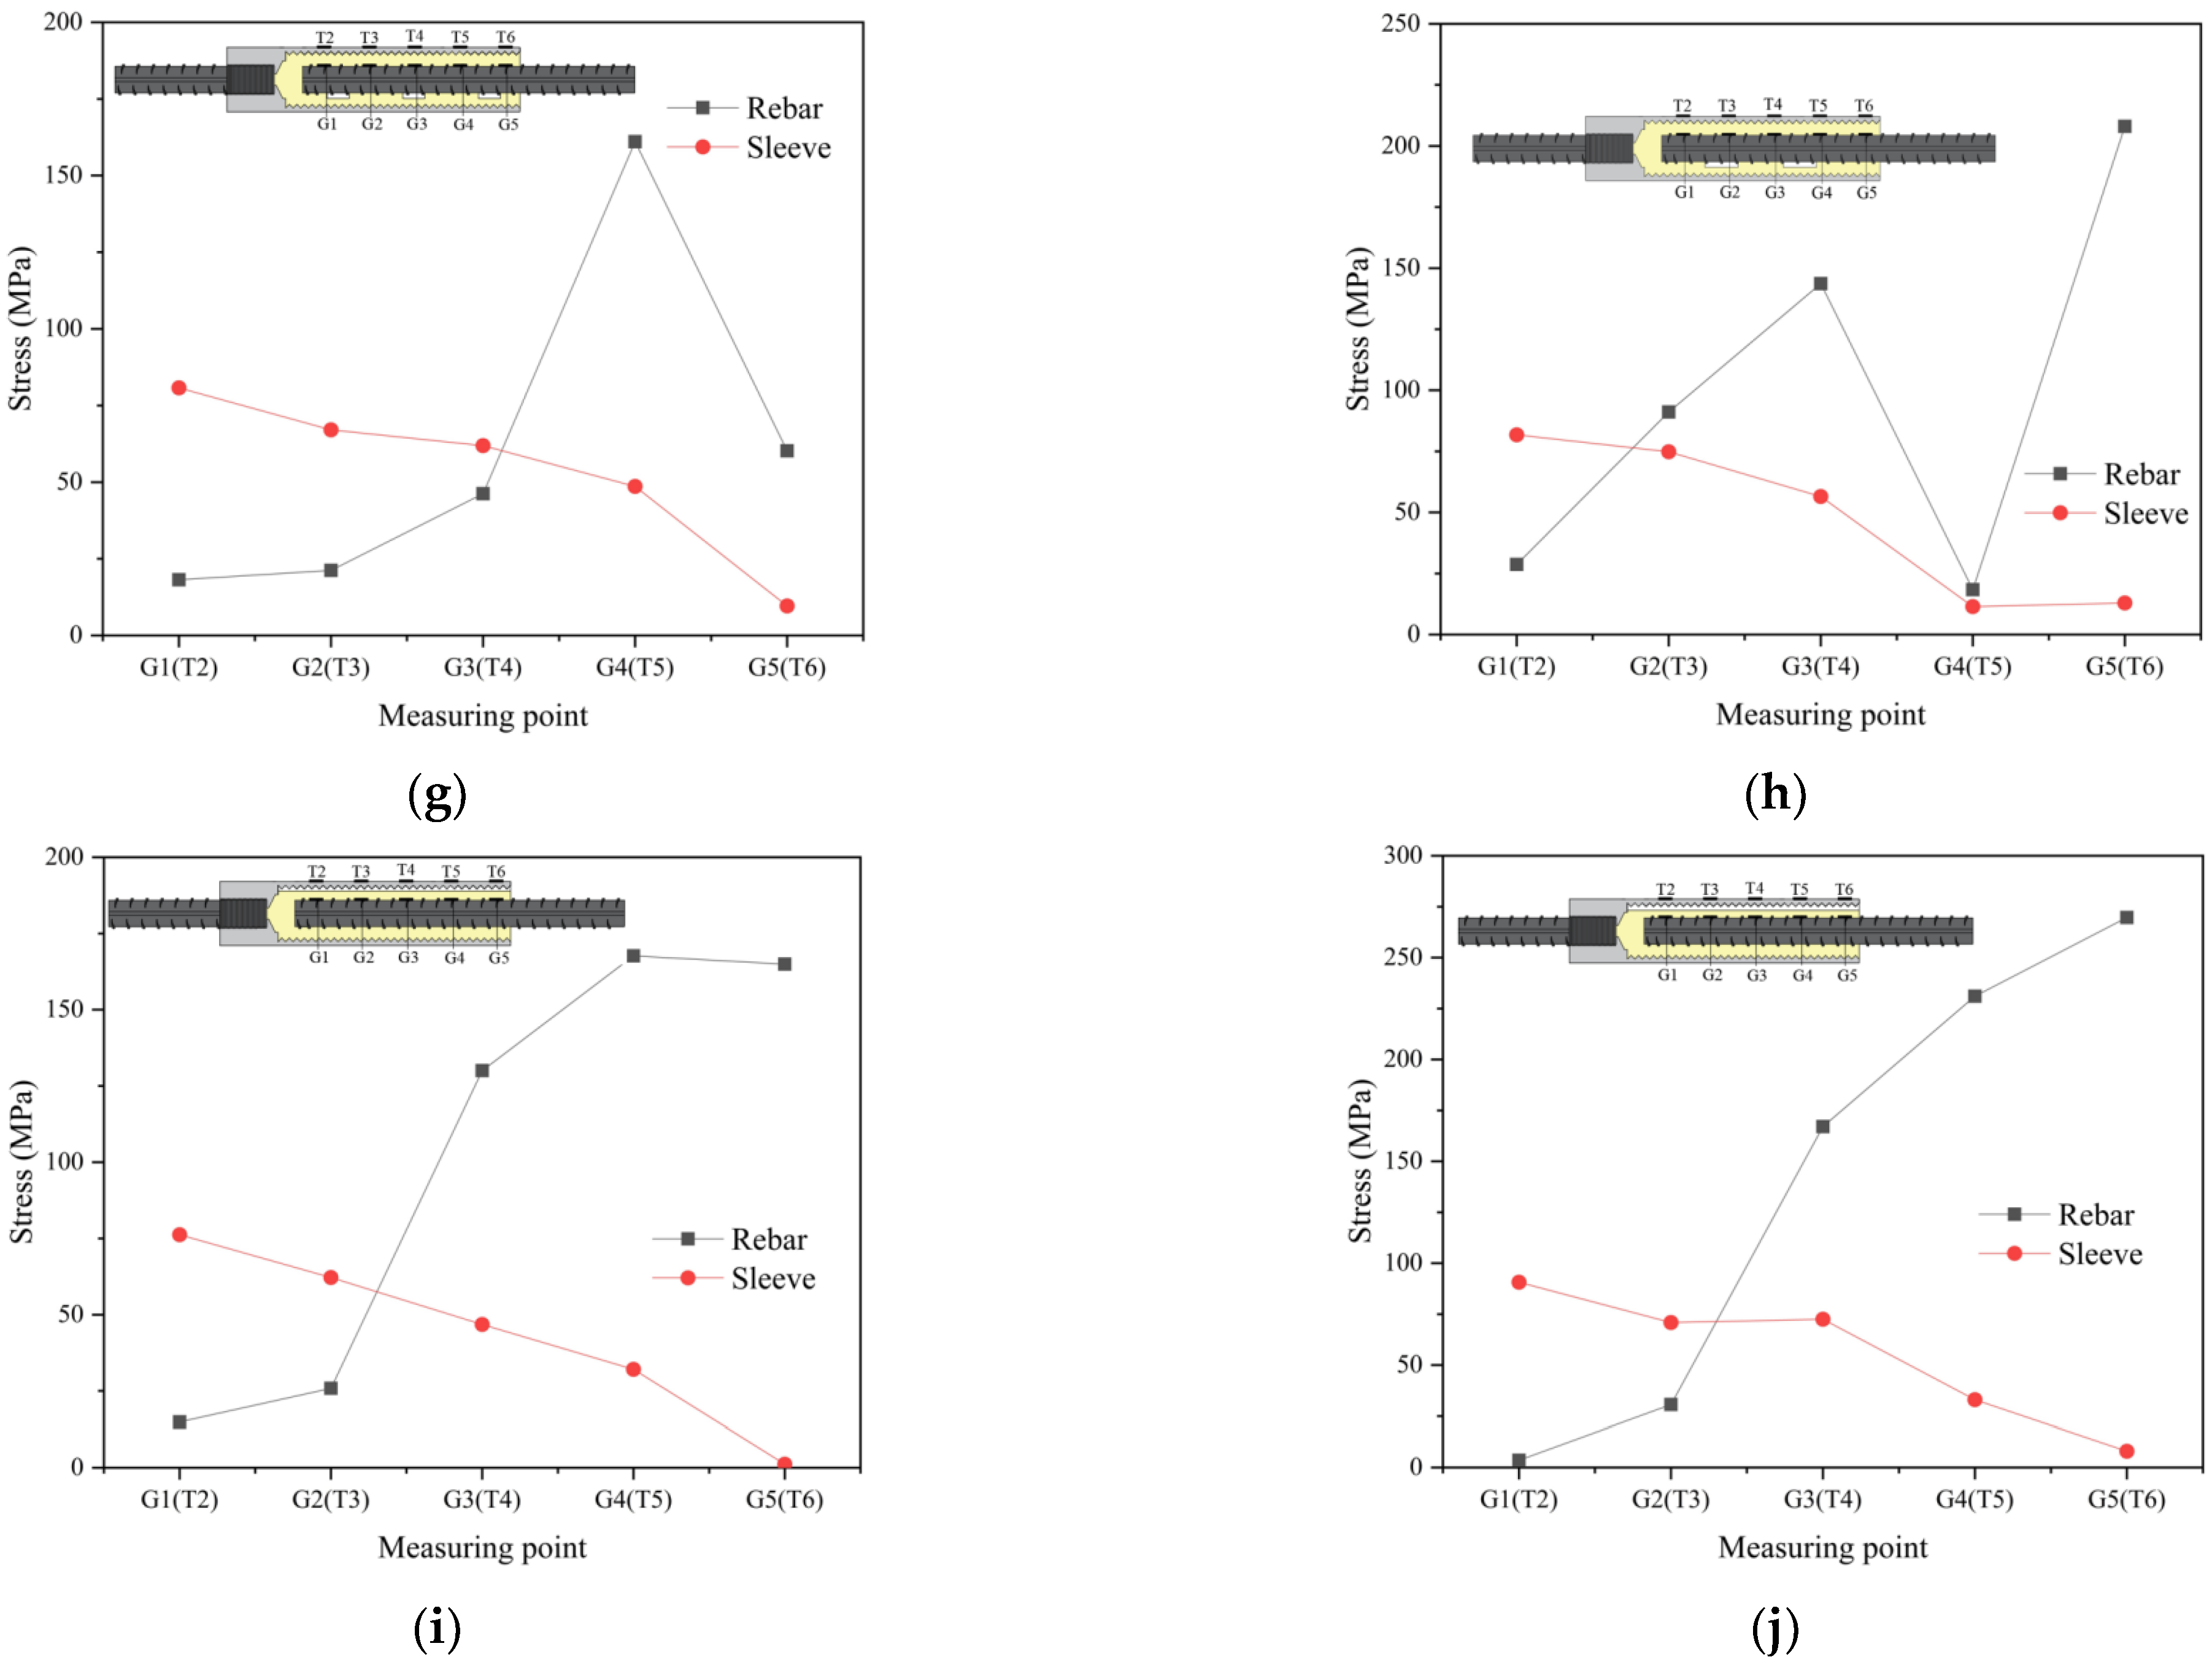
Figure 15 shows the stress distribution curves of the rebar and sleeve at different positions when the load reaches 20, 40, and 60 kN.
Under the same load, the rebar stress increases from the threaded end to the grouting end. The stresses at each position of the rebar increase with the load. When the load reaches 60 kN, the maximum stress at G1 is 92 MPa, which is still lower than the yield stress. The rebar stress near the grouting end is close to the yield stress. The rebar stress distribution curves of the GT14-DB-2d, GT14-DB-2.5d, GT14-DB-3d, GT14-ZB-2.5d, GT14-JB-2-2.5d, and GT14-JB-3-2.5d specimens are smooth, indicating a uniform rebar distribution at the defect of the specimen. The stress values of GT14-DC-2-2.5d and GT14-DC-3-2.5d specimens decrease sharply at G4 and G5, indicating that unilateral defects would make the stress unevenly distributed at the defect positions. The stress distribution curves of the GT14-SP-2mm and GT14-SP-4mm specimens show that the stress distribution is unaffected by the defect height.
The sleeve stress was minimum because T1 was on the side of the rebar threaded end, where the sleeve section area was large. Except for T1, the stress on the sleeve decreased from the threaded end to the grouting end. The stress at each position increased with the load. The GT14-DB-2d, GT14-DB-2.5d, and GT14-DB-3d specimens exhibited the maximum stress at G3. The stresses of the GT14-DC-2-2.5d and GT14-DC-3-2.5d specimens dropped sharply at T5 and T3. The stress distributions of the specimens with uniform and horizontal defects were largely the same as those of the standard group, and the defects had little effect on the stress distribution.

3.5. Stress Transfer Analysis

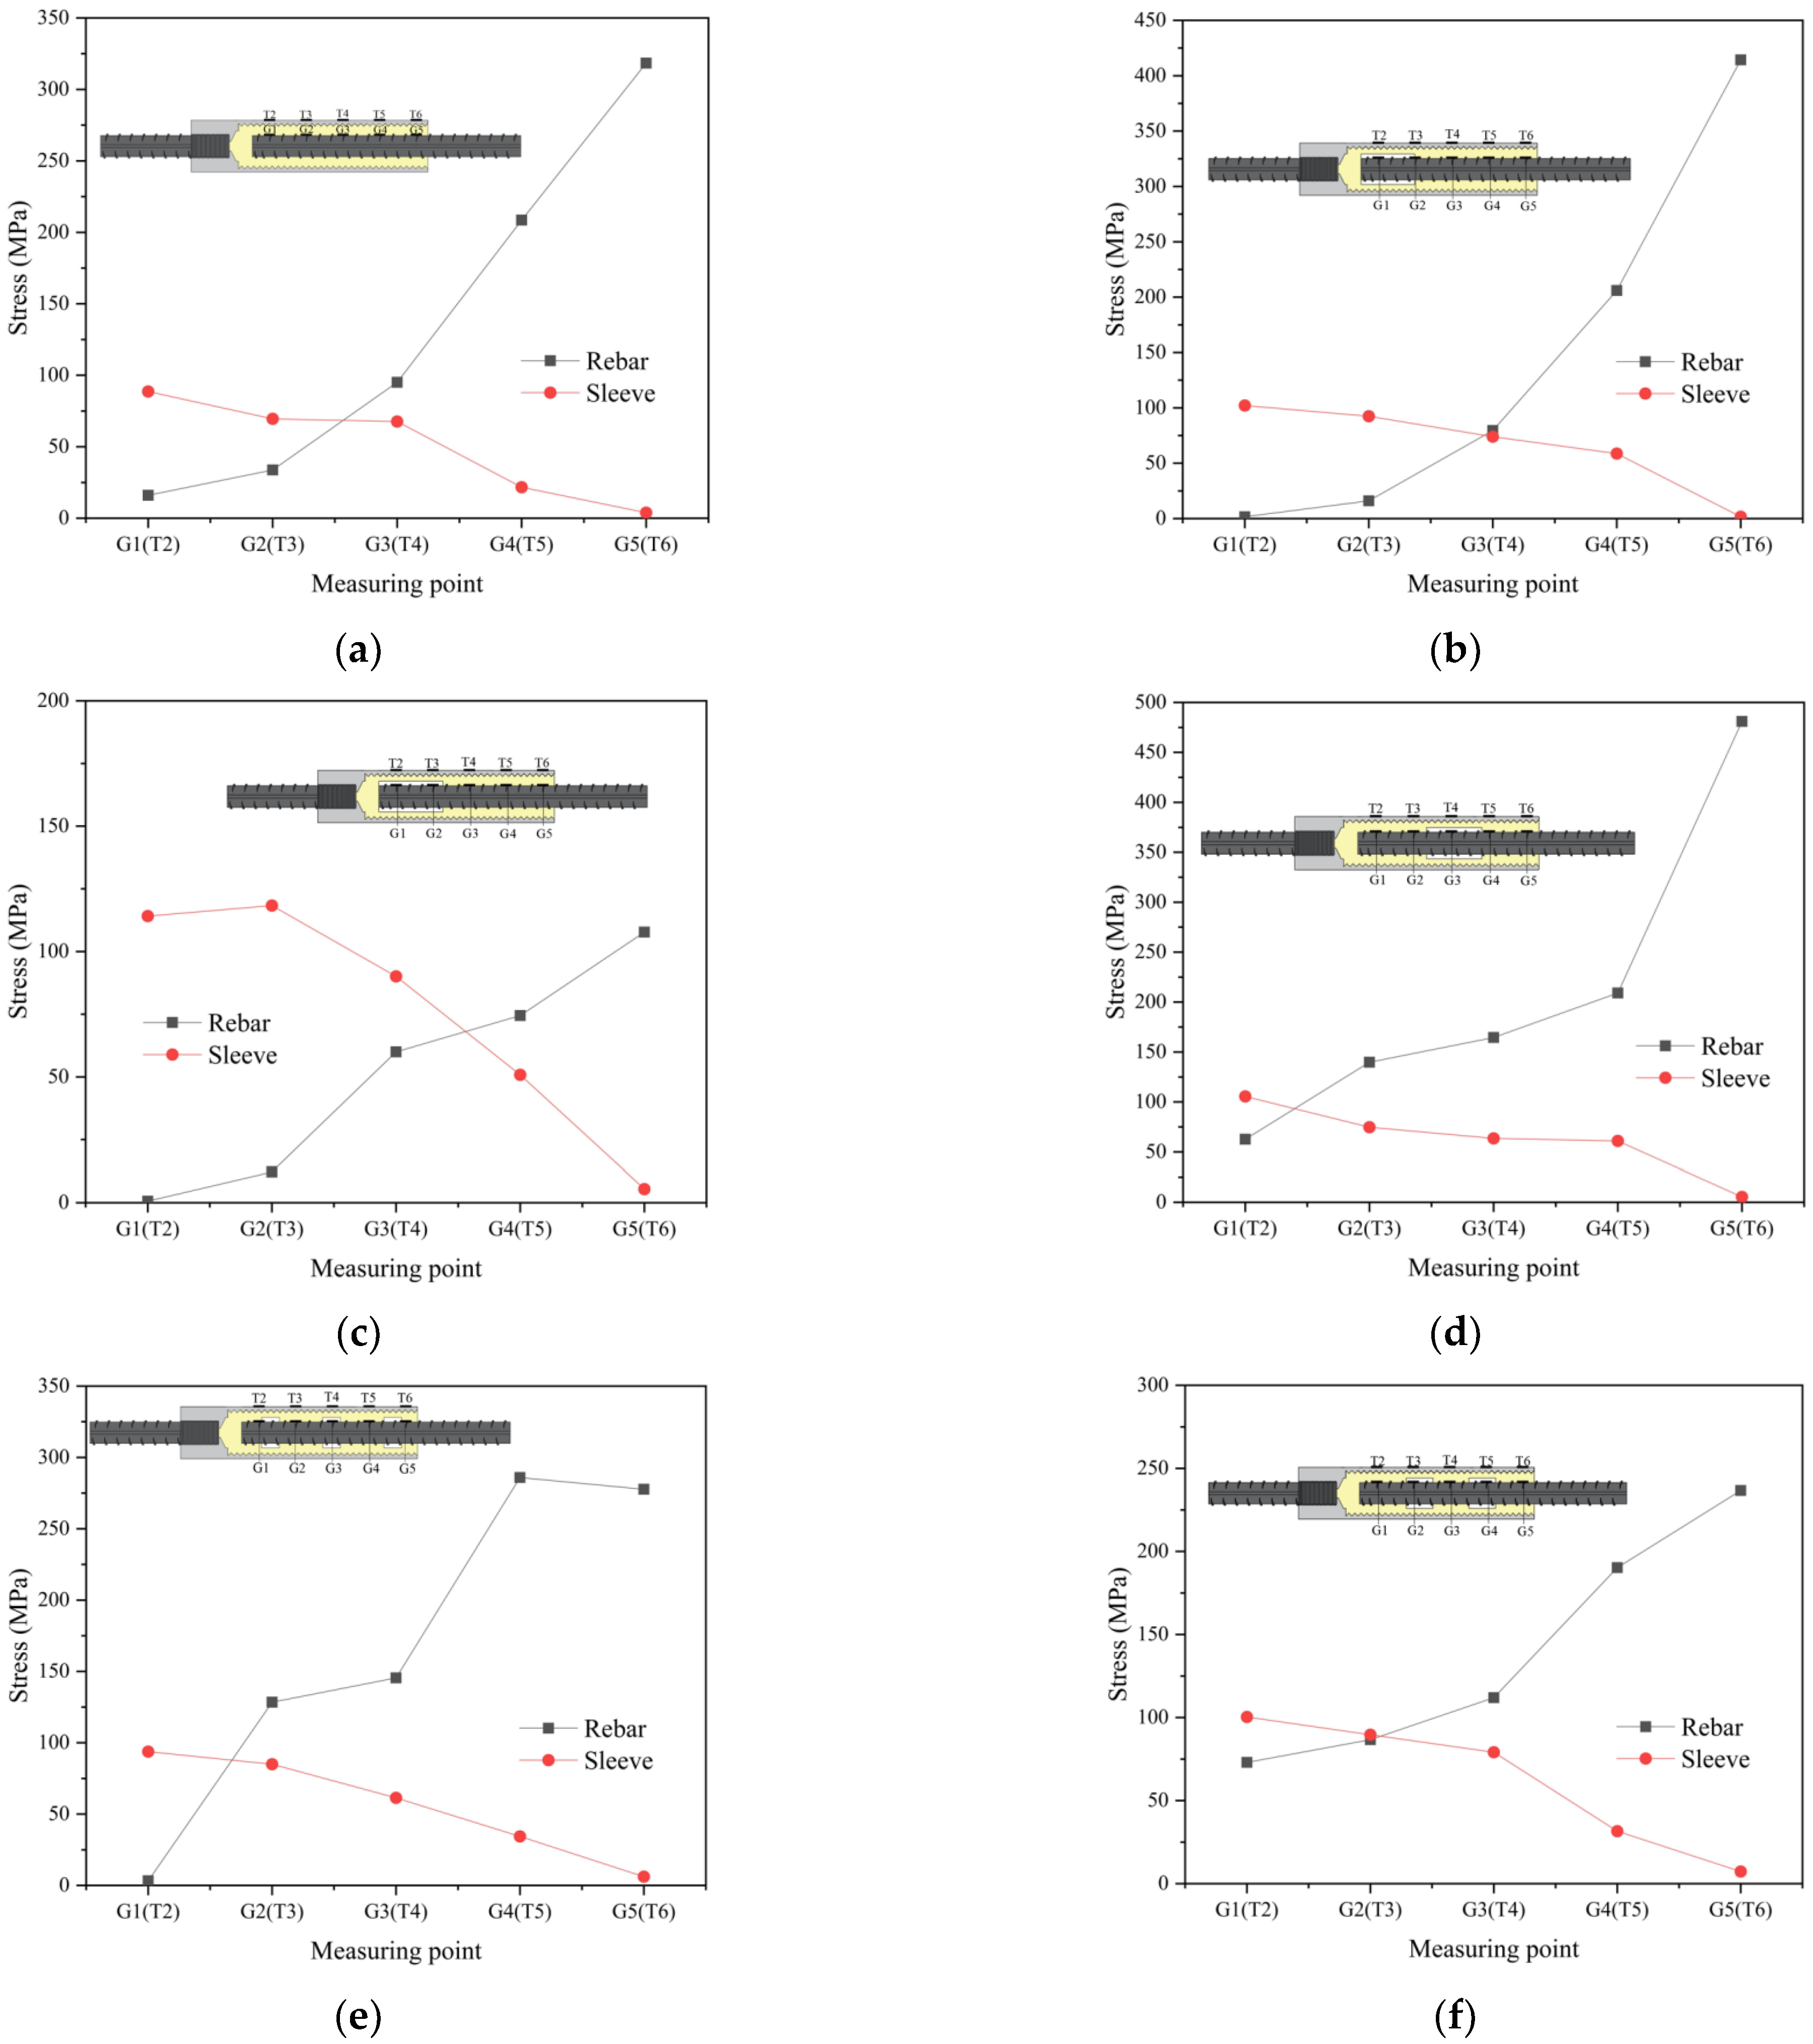
The cohesive force between the rebar and the grouting material comprises the frictional force, chemical adhesive force, and mechanical bite force. The frictional force is mainly determined by the roughness of the contact surface and the pressure exerted by the expansion of the grouting material on the rebar. The surface of the grouting material has a chemical adhesive force. The mechanical bite force plays a key role, mainly provided by the transverse rib. The stress distribution at the grouting end of the specimen under a load of 45 kN was selected to study the stress transfer law between the rebar and the sleeve, as shown in Figure 16. The position of the rebar strain gauges (G1–G5) corresponds to that of the sleeve strain gauges (T2–T6).
The rebar stress of the GT14-BM specimen showed a decreasing trend from G5 to G1. On the contrary, the sleeve stress showed an increasing trend from T6 to T2. Because of the high strength and expansibility of the grouting material, the sleeve had a constraint on the grouting material. Therefore, during uniaxial tension, the grouting material can be used as a good medium to transfer the stress of the rebar to the sleeve. The stress distribution curves show that the specimen is subjected to load by the rebar and sleeve. Near the threaded end, the load is mainly borne by the sleeve. In terms of the stress transfer path, the rebar at the grouting end transfers the load to the threaded end through the grout material and the sleeve.
The stress transfer path in the defective specimen was the same as that in the standard group specimen. The GT14-DB-2.5d, GT14-DB-3d, and GT14-ZB-2.5d specimens showed blocked stress transfer at the defects. Taking the stress distribution curve of the GT14-ZB-2.5d specimen as an example, the stresses of the G1–G5 specimens were 59.8, 153.5, 168.7, 203.4, and 490.5 MPa, respectively. The stresses of the T2–T6 specimens were 115.2, 80.6, 70.2, 63.1, and 9.5 MPa. The stress of G2–G4 on the rebar was similar, and the stress of T3–T5 on the sleeve was also similar. Because there was no bond between the rebar and the grouting material at the central 2.5 d defect, the stress on the rebar is not transferred to the sleeve, thus making the stress of the rebar and sleeve more uniform at the defect. As shown in Figure 15h,j, the lower side of the GT14-DC-3-2.5d and GT14-DC-2-2.5d specimens is the defect side, and the upper side is the dense side. The stress of the GT14-DC-3-2.5d specimen changed suddenly at G4–G5, and the stress of the GT14-DC-2-2.5d specimen changed suddenly at G3–G5. There was no cohesive force between the rebar and the grouting material in the defect side, and the stress of the rebar changed slightly at the defect side. The stress on the dense side of the rebar decreased continuously, resulting in an uneven stress on both sides of the rebar. The eccentric tension of the specimen resulted in a sudden decrease in the stress of the rebar and sleeve at the dense side of the grouting end of the specimen. Because the GT14-JB-3-2.5d and GT14-JB-2-2.5d specimens had no bonding force between the rebar and the grouting material at the defect side, the stress of the rebar was largely the same, and there was no obstruction to the stress transfer. The stress transfer trends of the GT14-SP-2mm and GT14-SP-4mm specimens were consistent with that of the standard group.

4. Finite Element Analysis

The finite element analysis software Abaqus2020 was used for the numerical simulation analysis of the half-grouted sleeve specimens. The load–displacement curves were compared to verify the reliability of the experimental and simulation results.

4.1. Material Constitutive Relationship

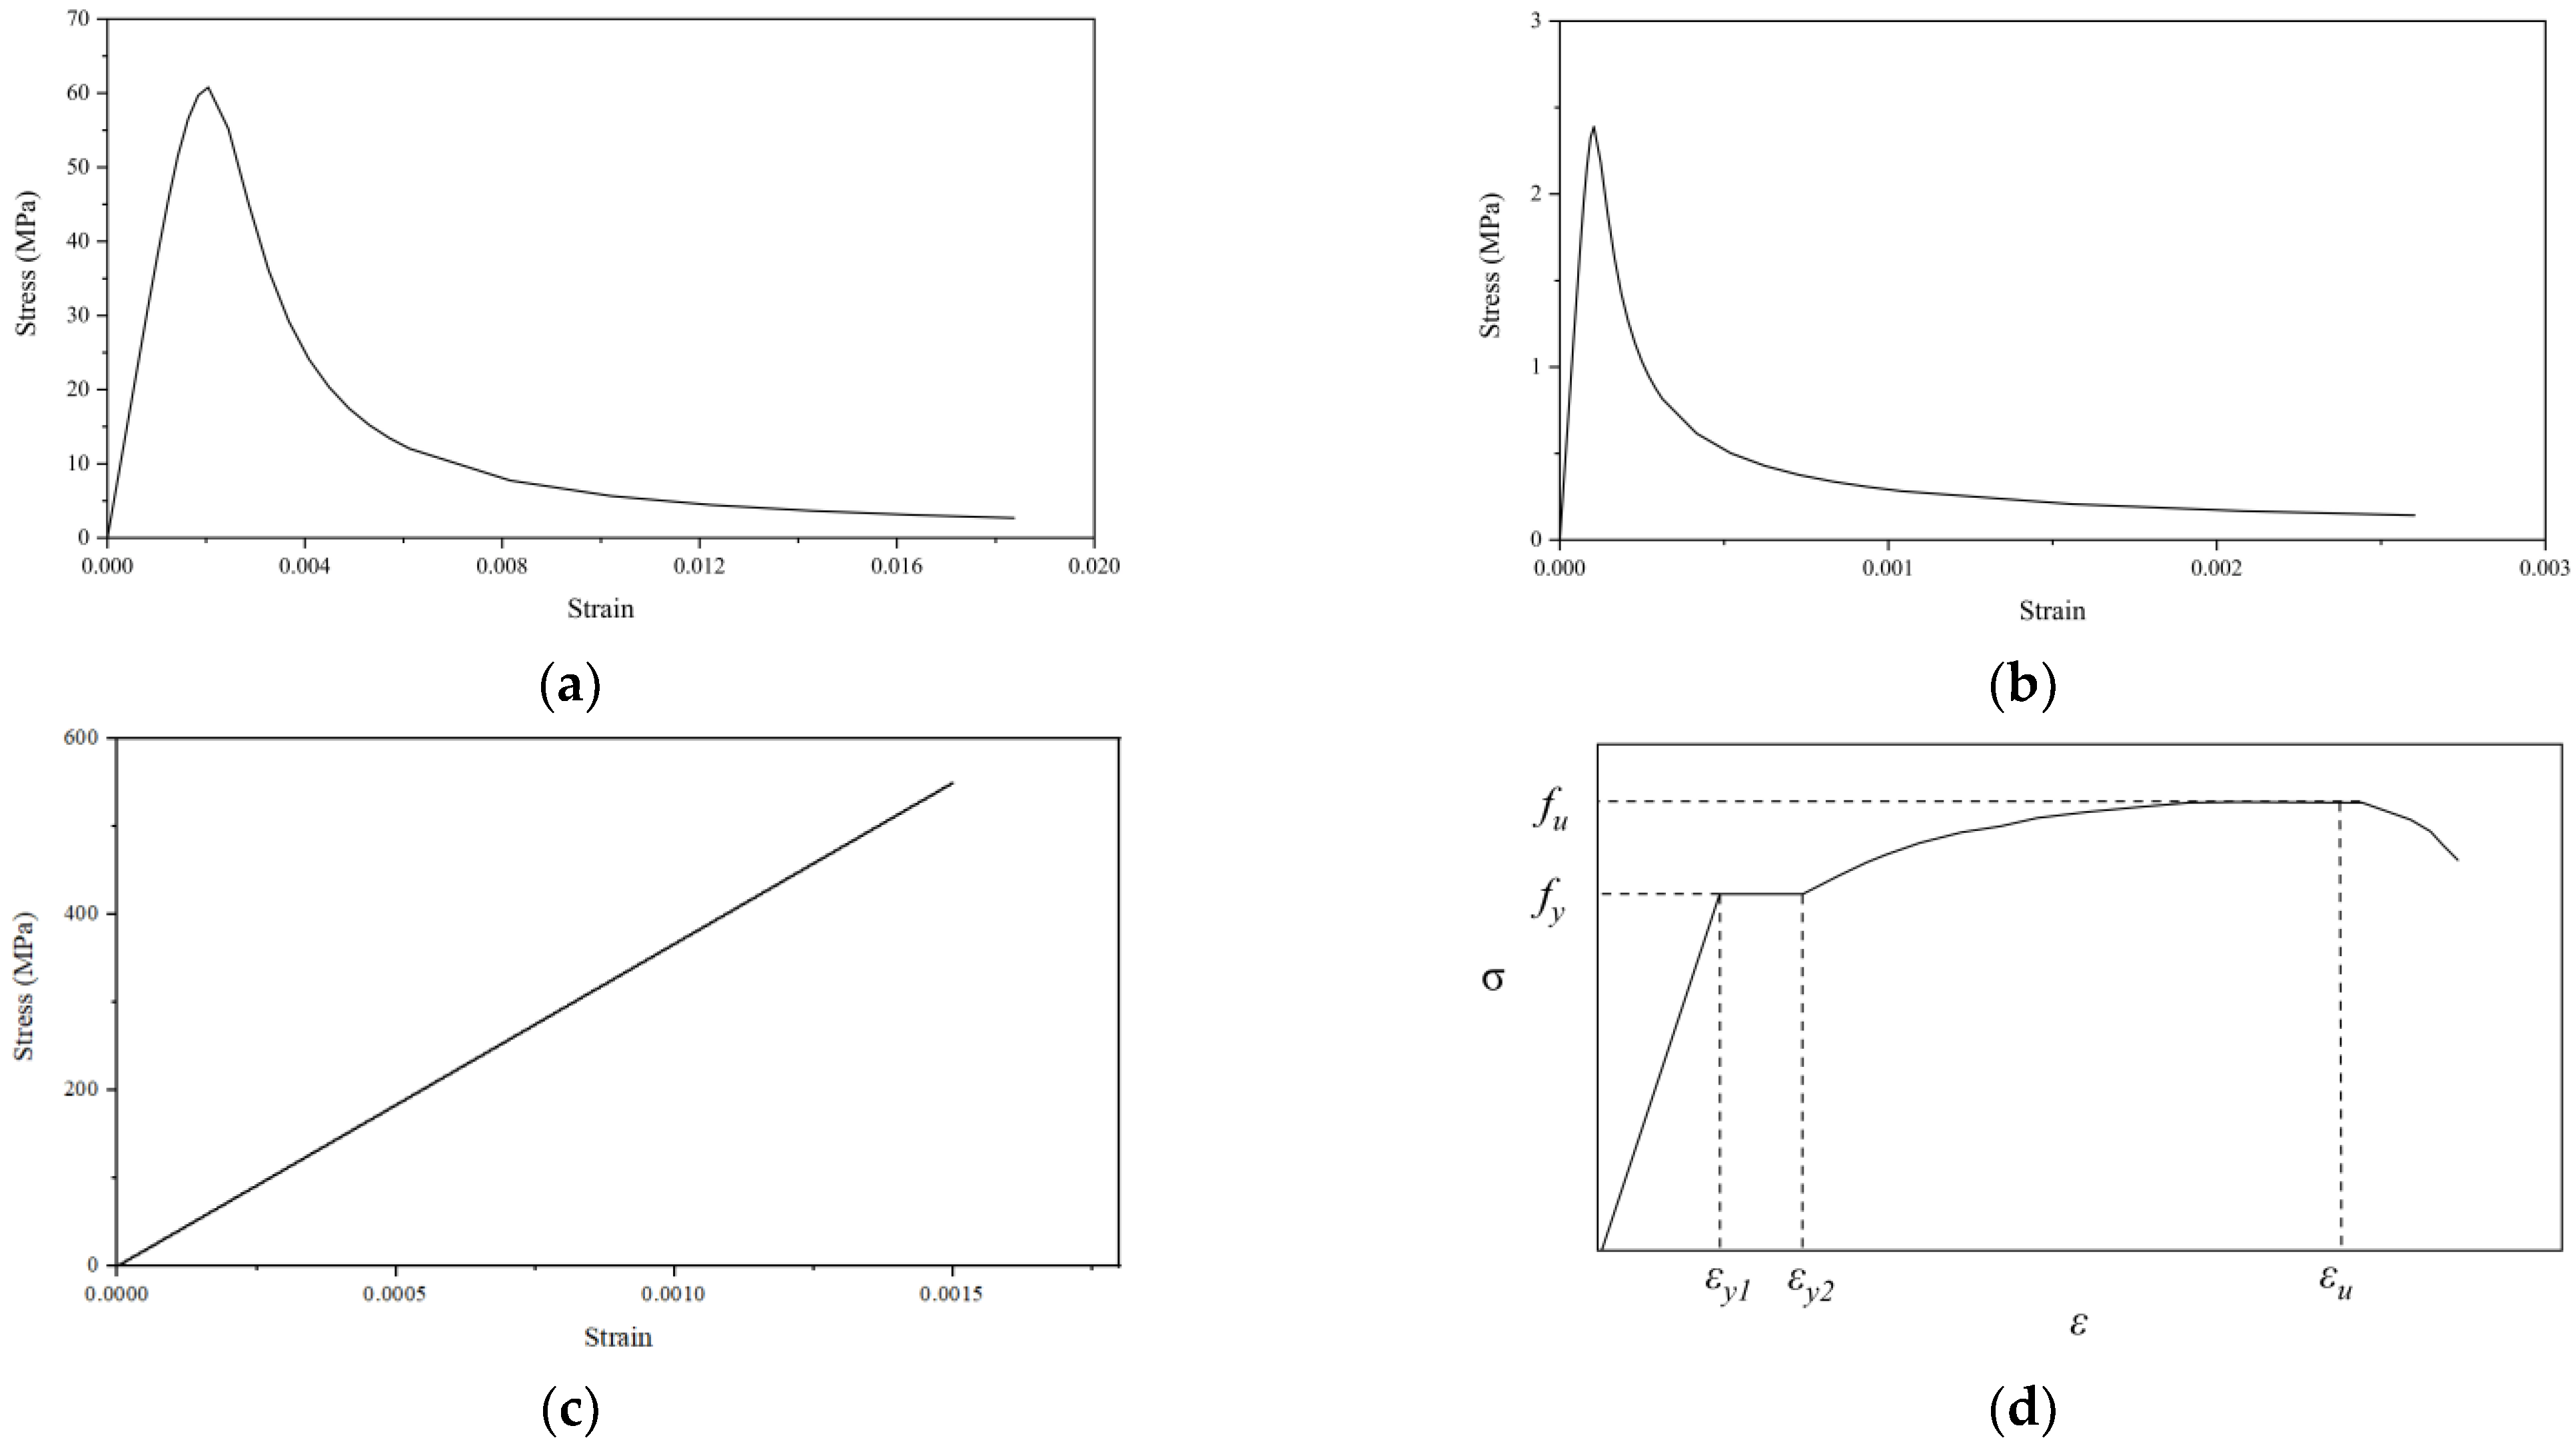
There is no unified constitutive model for the stress–strain relationship of a grouting material. Its material properties are similar to those of high-strength concrete. Therefore, the constitutive relationship of the grouting material is typically selected based on the high-strength concrete [31]. The concrete plastic damage model selected for this simulation is based on the stress–strain curve under uniaxial tension and uniaxial compression conditions optimized by GB50010-2010 [32]. Figure 17a,b shows the constitutive relationship. The ideal elastic model was adopted for the sleeve. Figure 17c shows the stress–strain curve. Figure 17d shows the elastic-plastic constitutive model of the rebar; the eigenvalues in the figure were measured through material tests. Table 10 presents the material properties.

4.2. Model Building

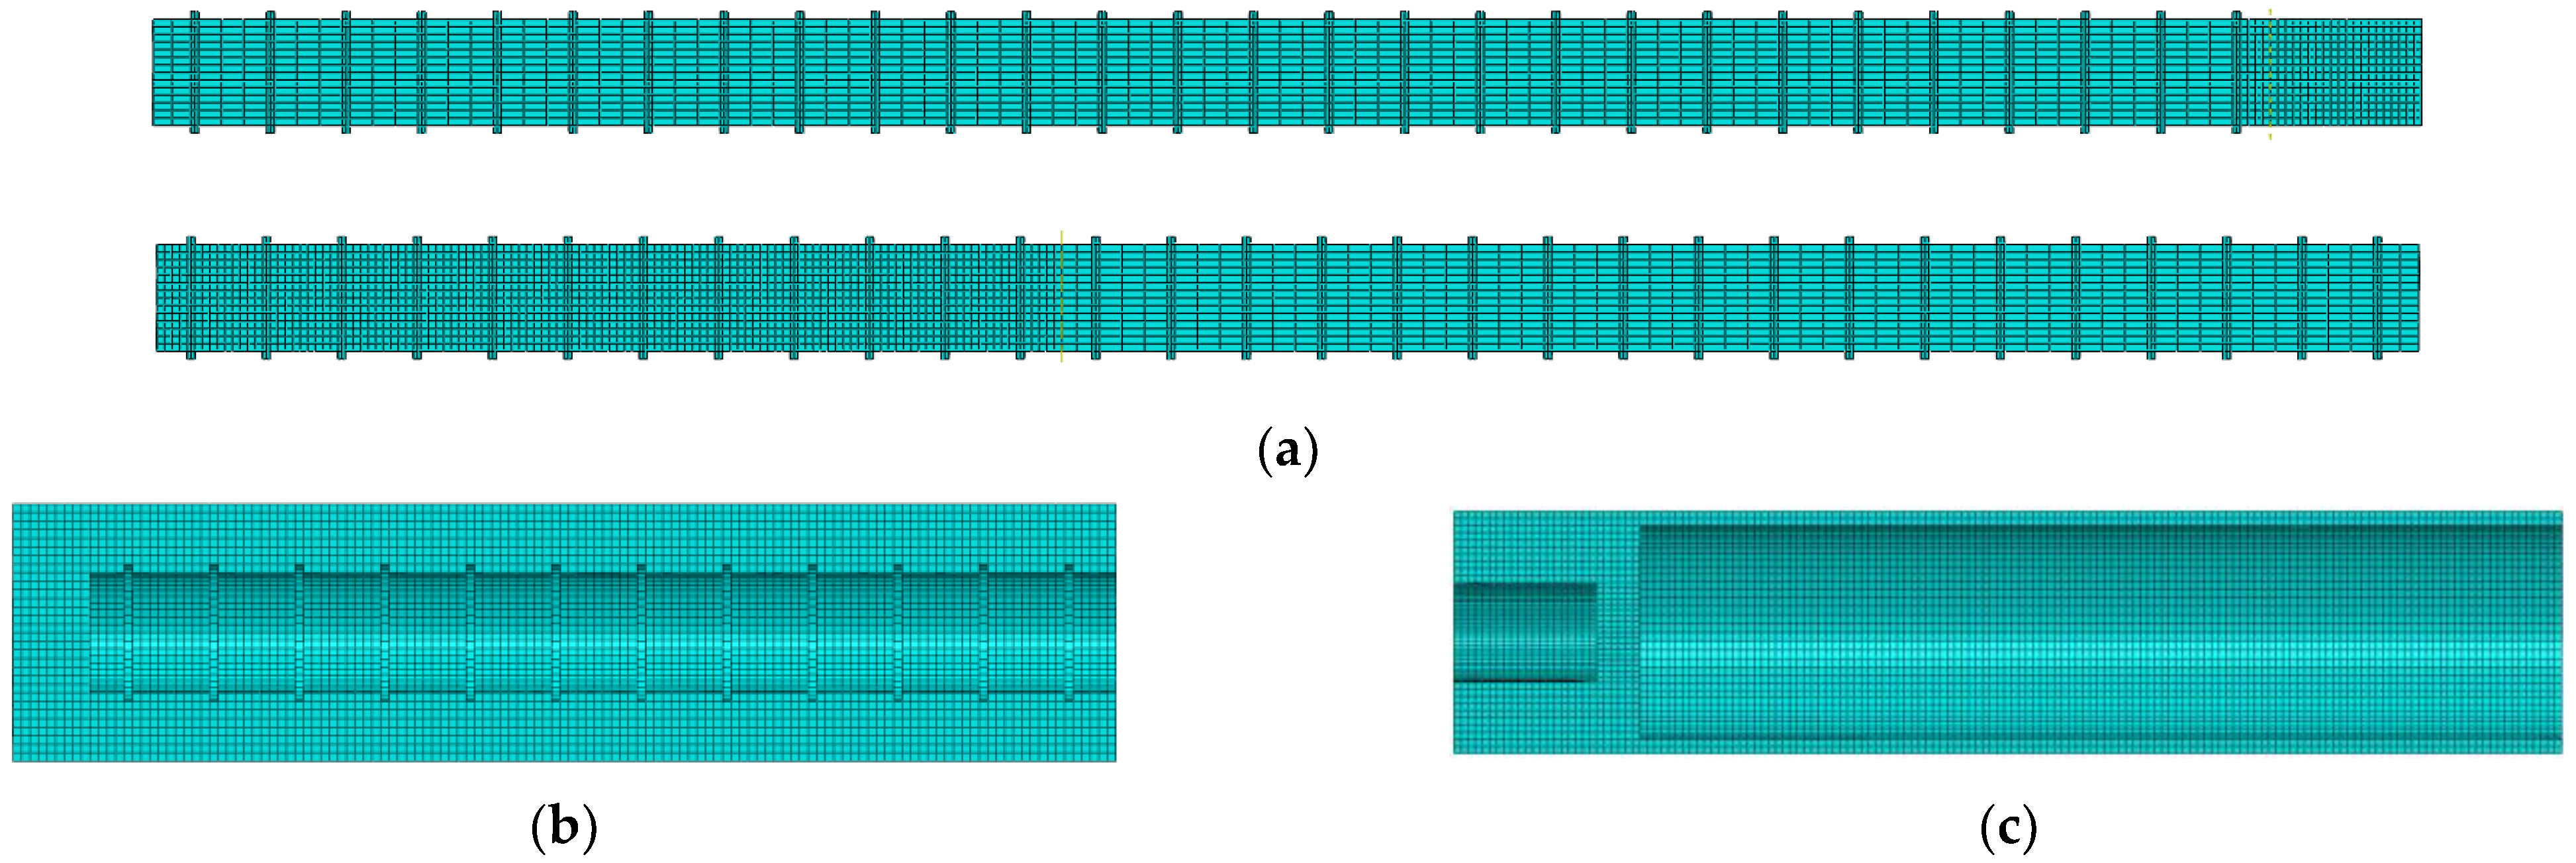
To simplify the calculation model, a semistructure was established considering symmetry. In the model, the C3D8R element was selected for the rebar, grouting material, and sleeve. The grouting material, sleeve, and the parts of the rebar in contact with them were divided into a mesh size of 1 mm. The rest of the rebar had a mesh size of 2 mm, as shown in Figure 18. The grouting material and the rebar at the threaded end were set to be bound with the sleeve. The friction between the grouting material, sleeve, and rebar at the anchor end was set with a friction coefficient of 0.6. To simulate the constraint of the specimen during axial tension, boundary conditions were set as follows: (1) The translational degrees of freedom in the stretching direction and the rotational degrees of freedom in the other two directions of all nodes at the cross section were restricted. (2) The translational and rotational degrees of freedom of all the joints in the x, y, and z directions at the end of the threaded rebar were restricted. (3) The reference point was set at the end of the rebar at the grouting end. The coupling constraints between all the nodes at the end of the grouting rebar and reference points were established [33,34].

4.3. Numerical Calculation Result

4.3.1. Model Verification

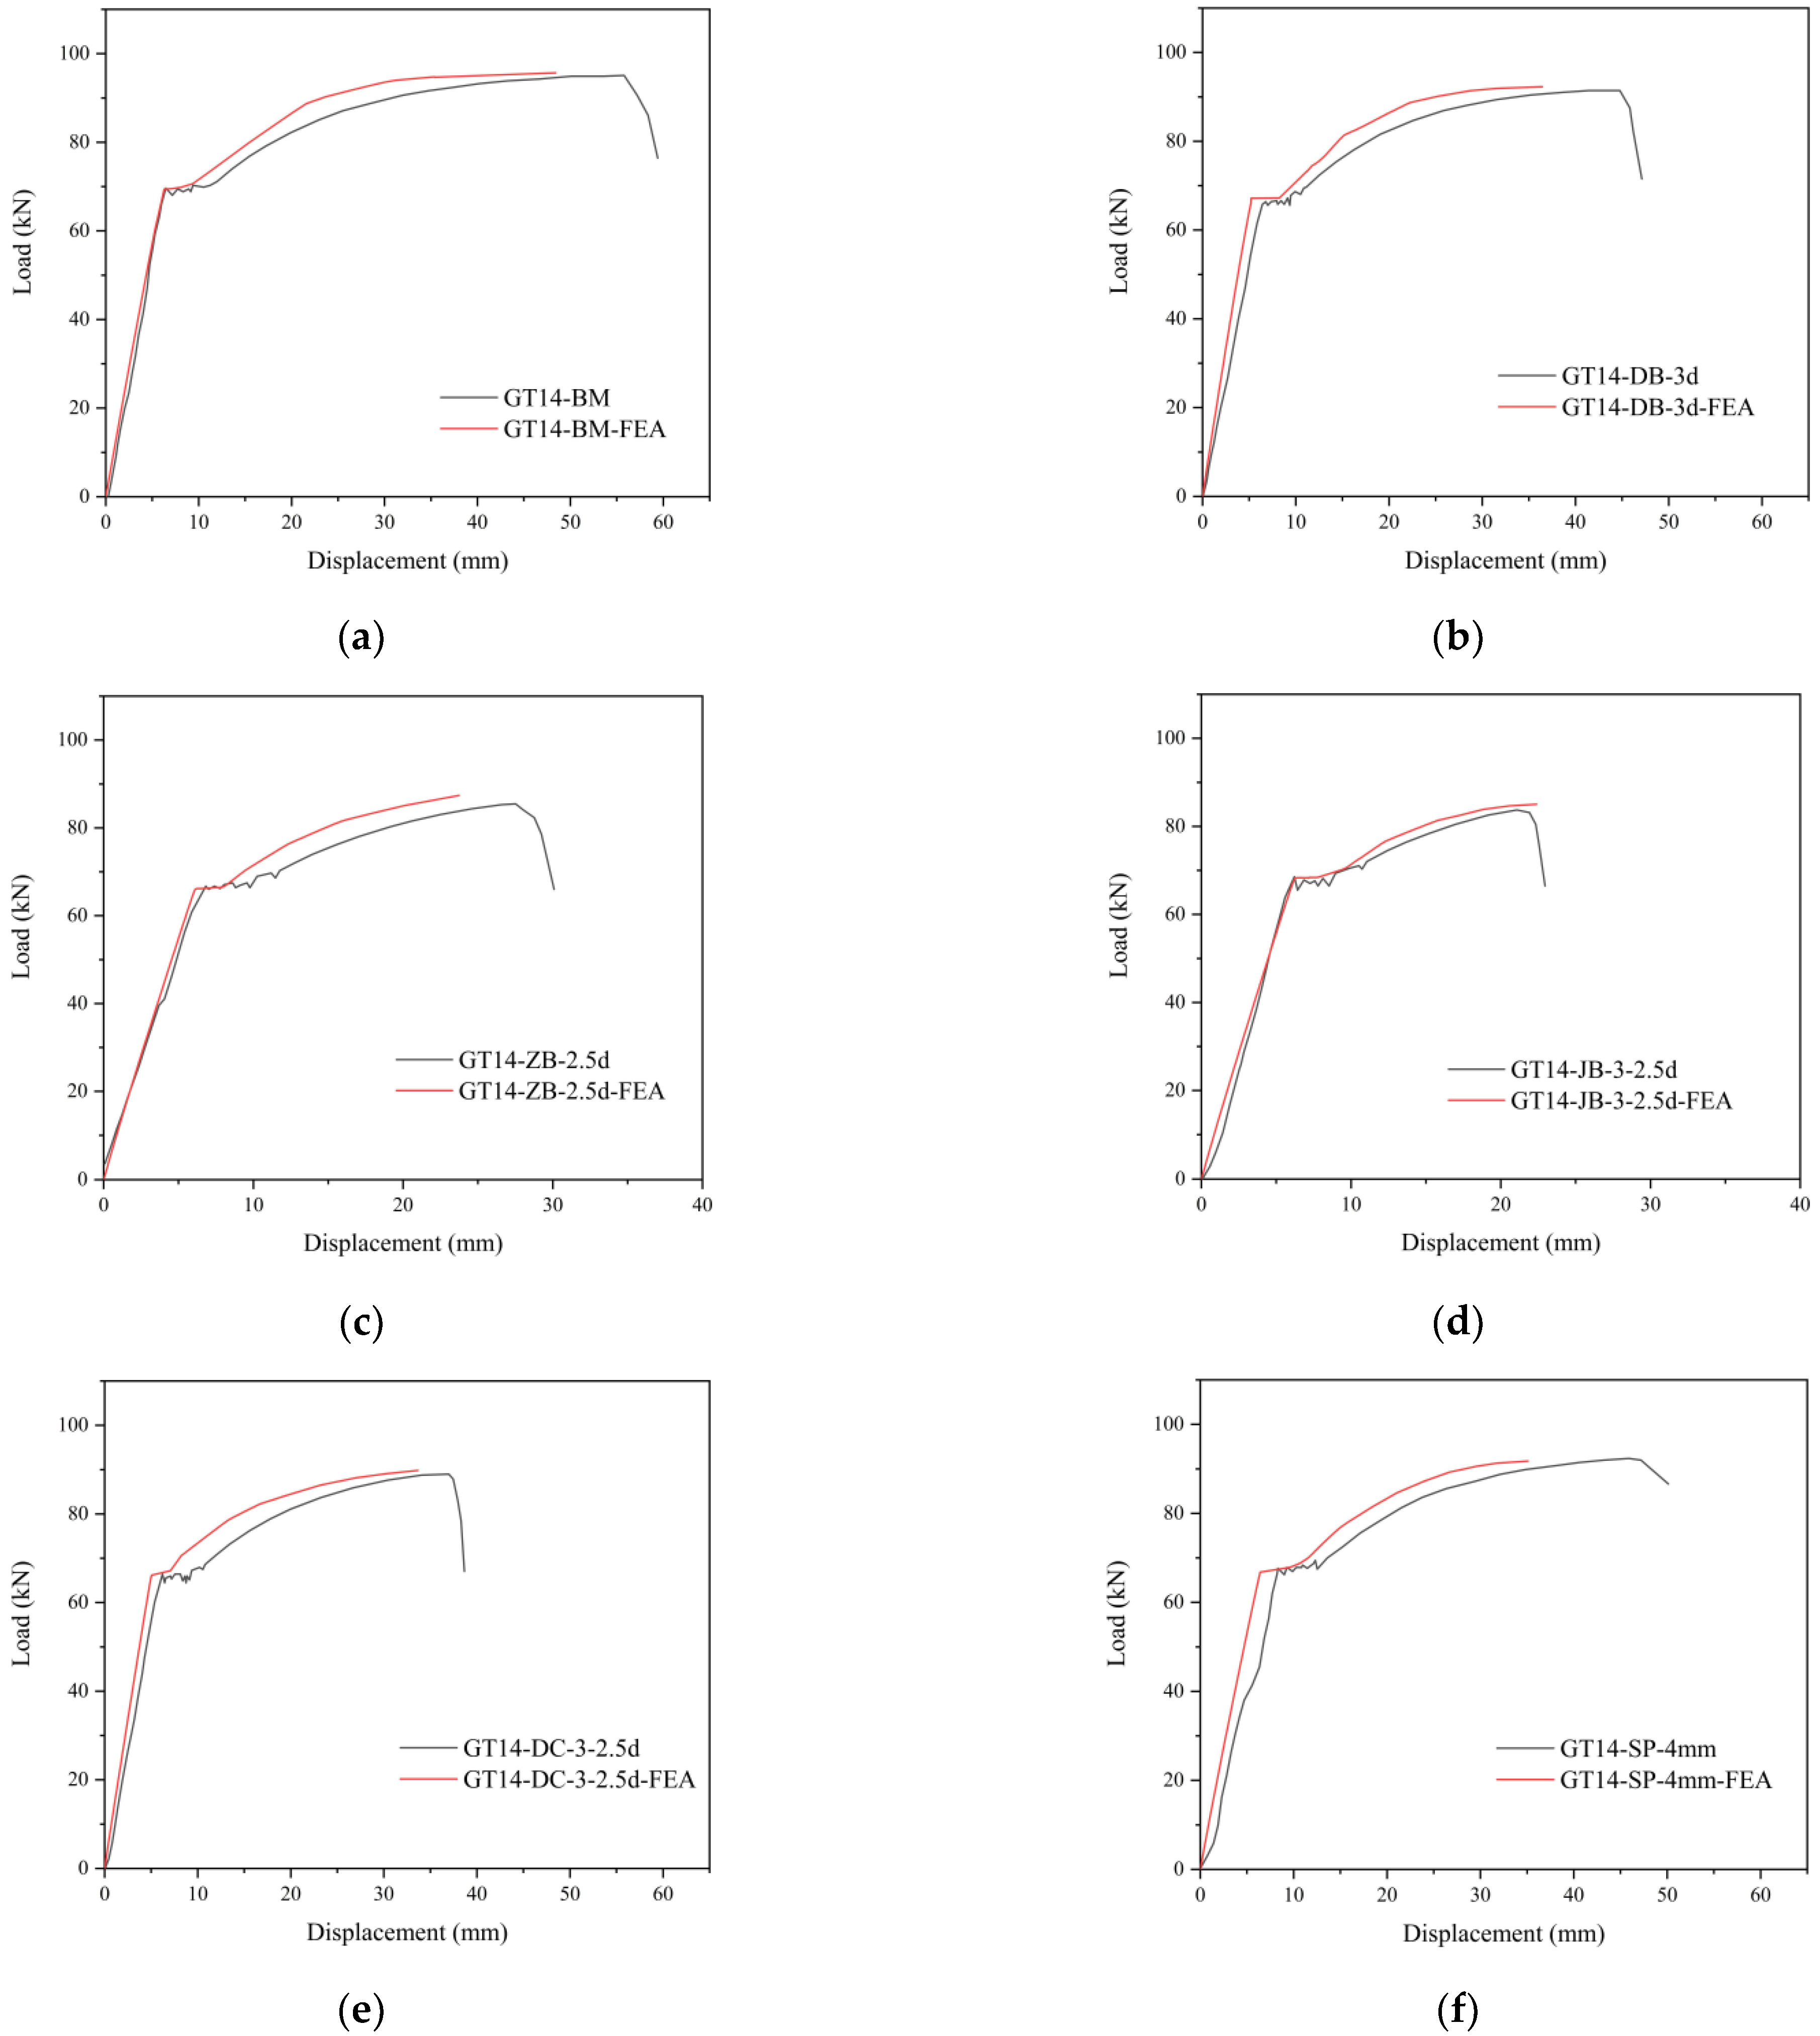
Figure 19 shows a comparison of the load–displacement curves between the experimental and simulation results. The simulation curve has a trend similar to the experimental curve. The simulated yield and ultimate loads are slightly higher than the experimental results. This is because in the experimental process, the cone wedge effect of the rebars made the grouting material to exhibit split cracks, and the grouting material slipped with the rebars, thereby reducing the stiffness of the specimen. However, the slip between the grouting end rebar and the grouting material was not fully considered in the simulation. Table 11 presents a comparison of the yield and ultimate loads between the experimental and simulation results. The errors in the eigenvalues between the test and simulation results are less than 5%. The numerical simulation and experimental results are consistent, thus verifying the accuracy of the model and the rationality of the key parameter settings.

4.3.2. Damage State

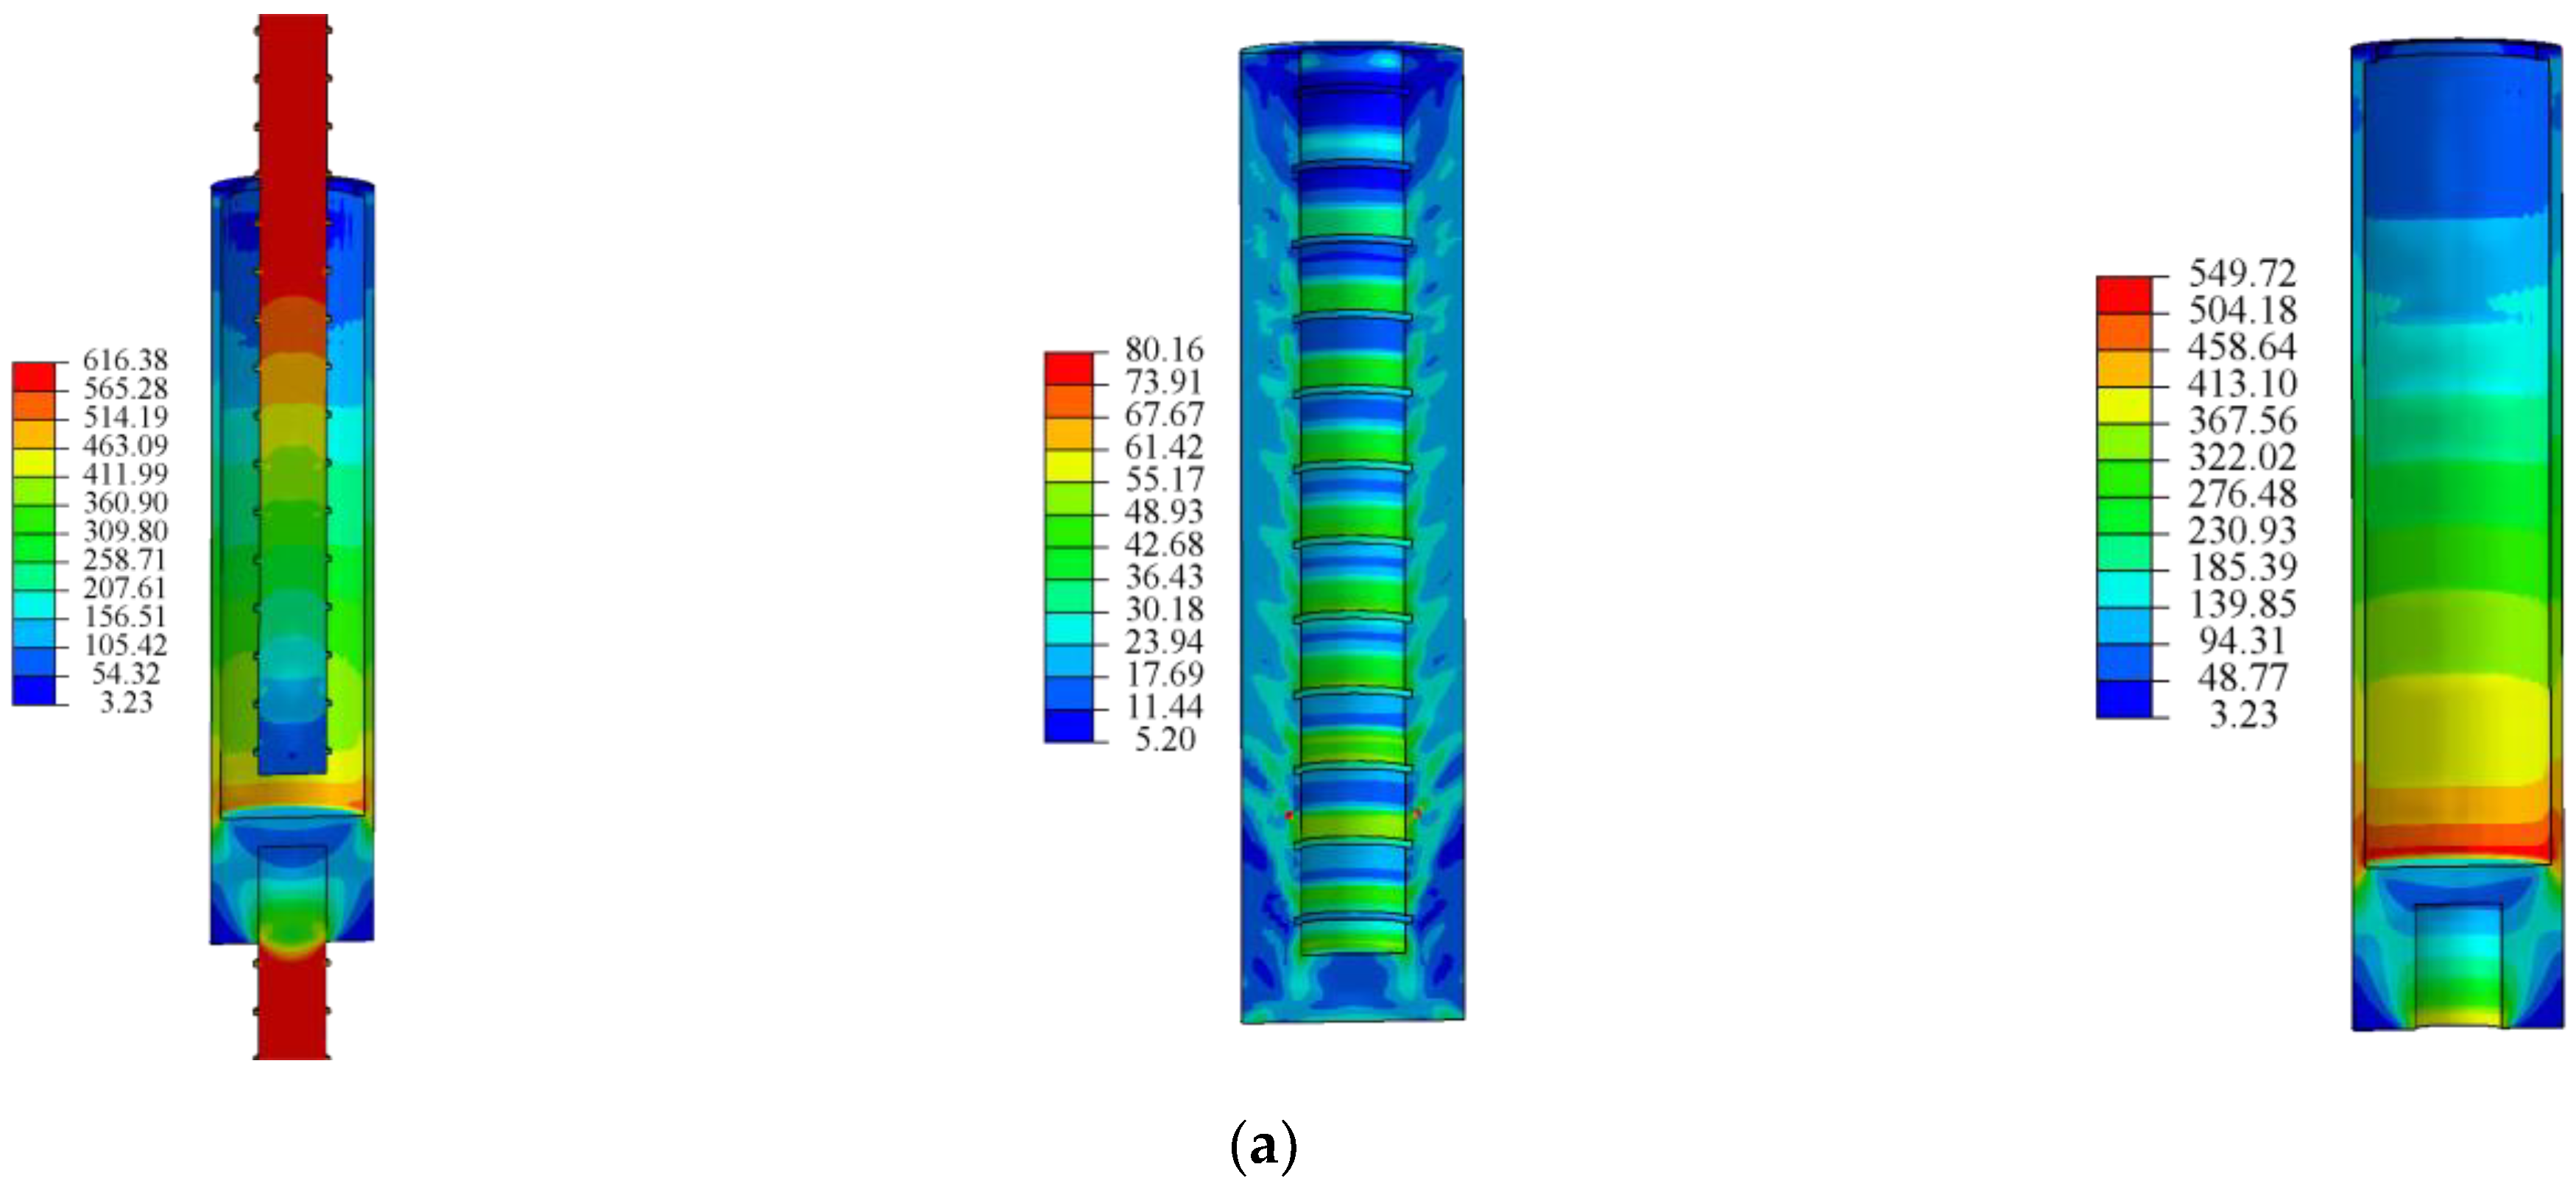
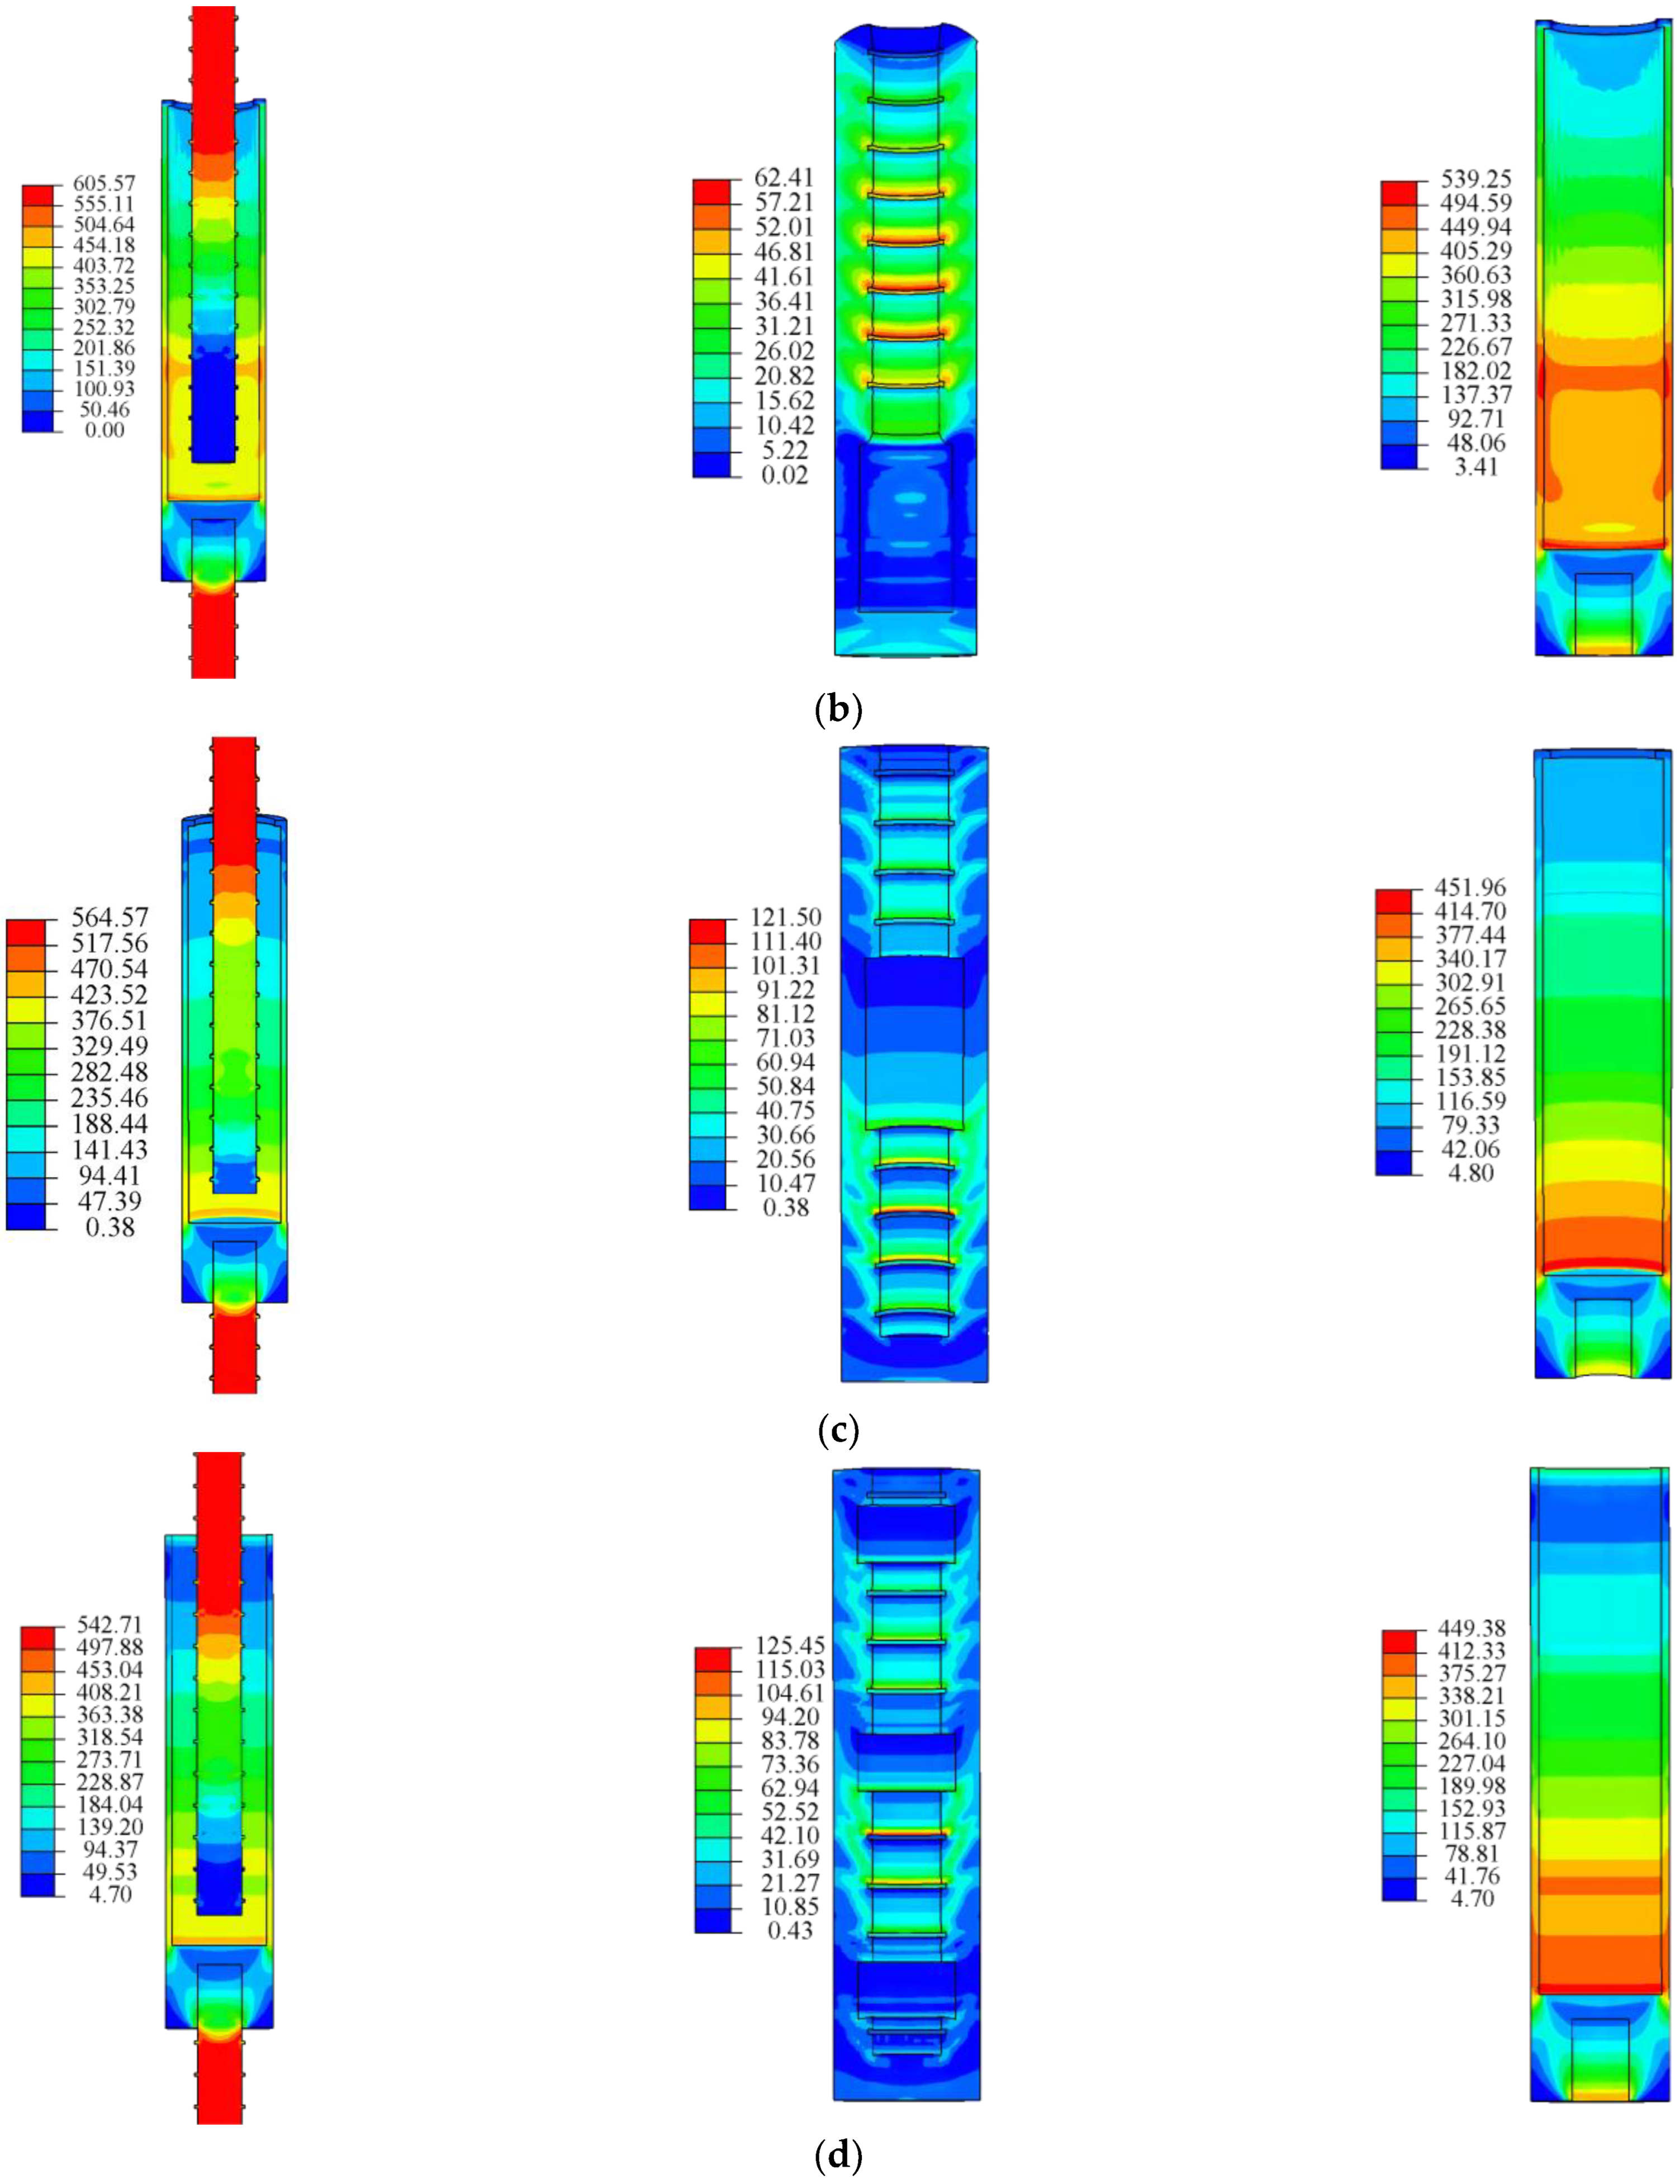
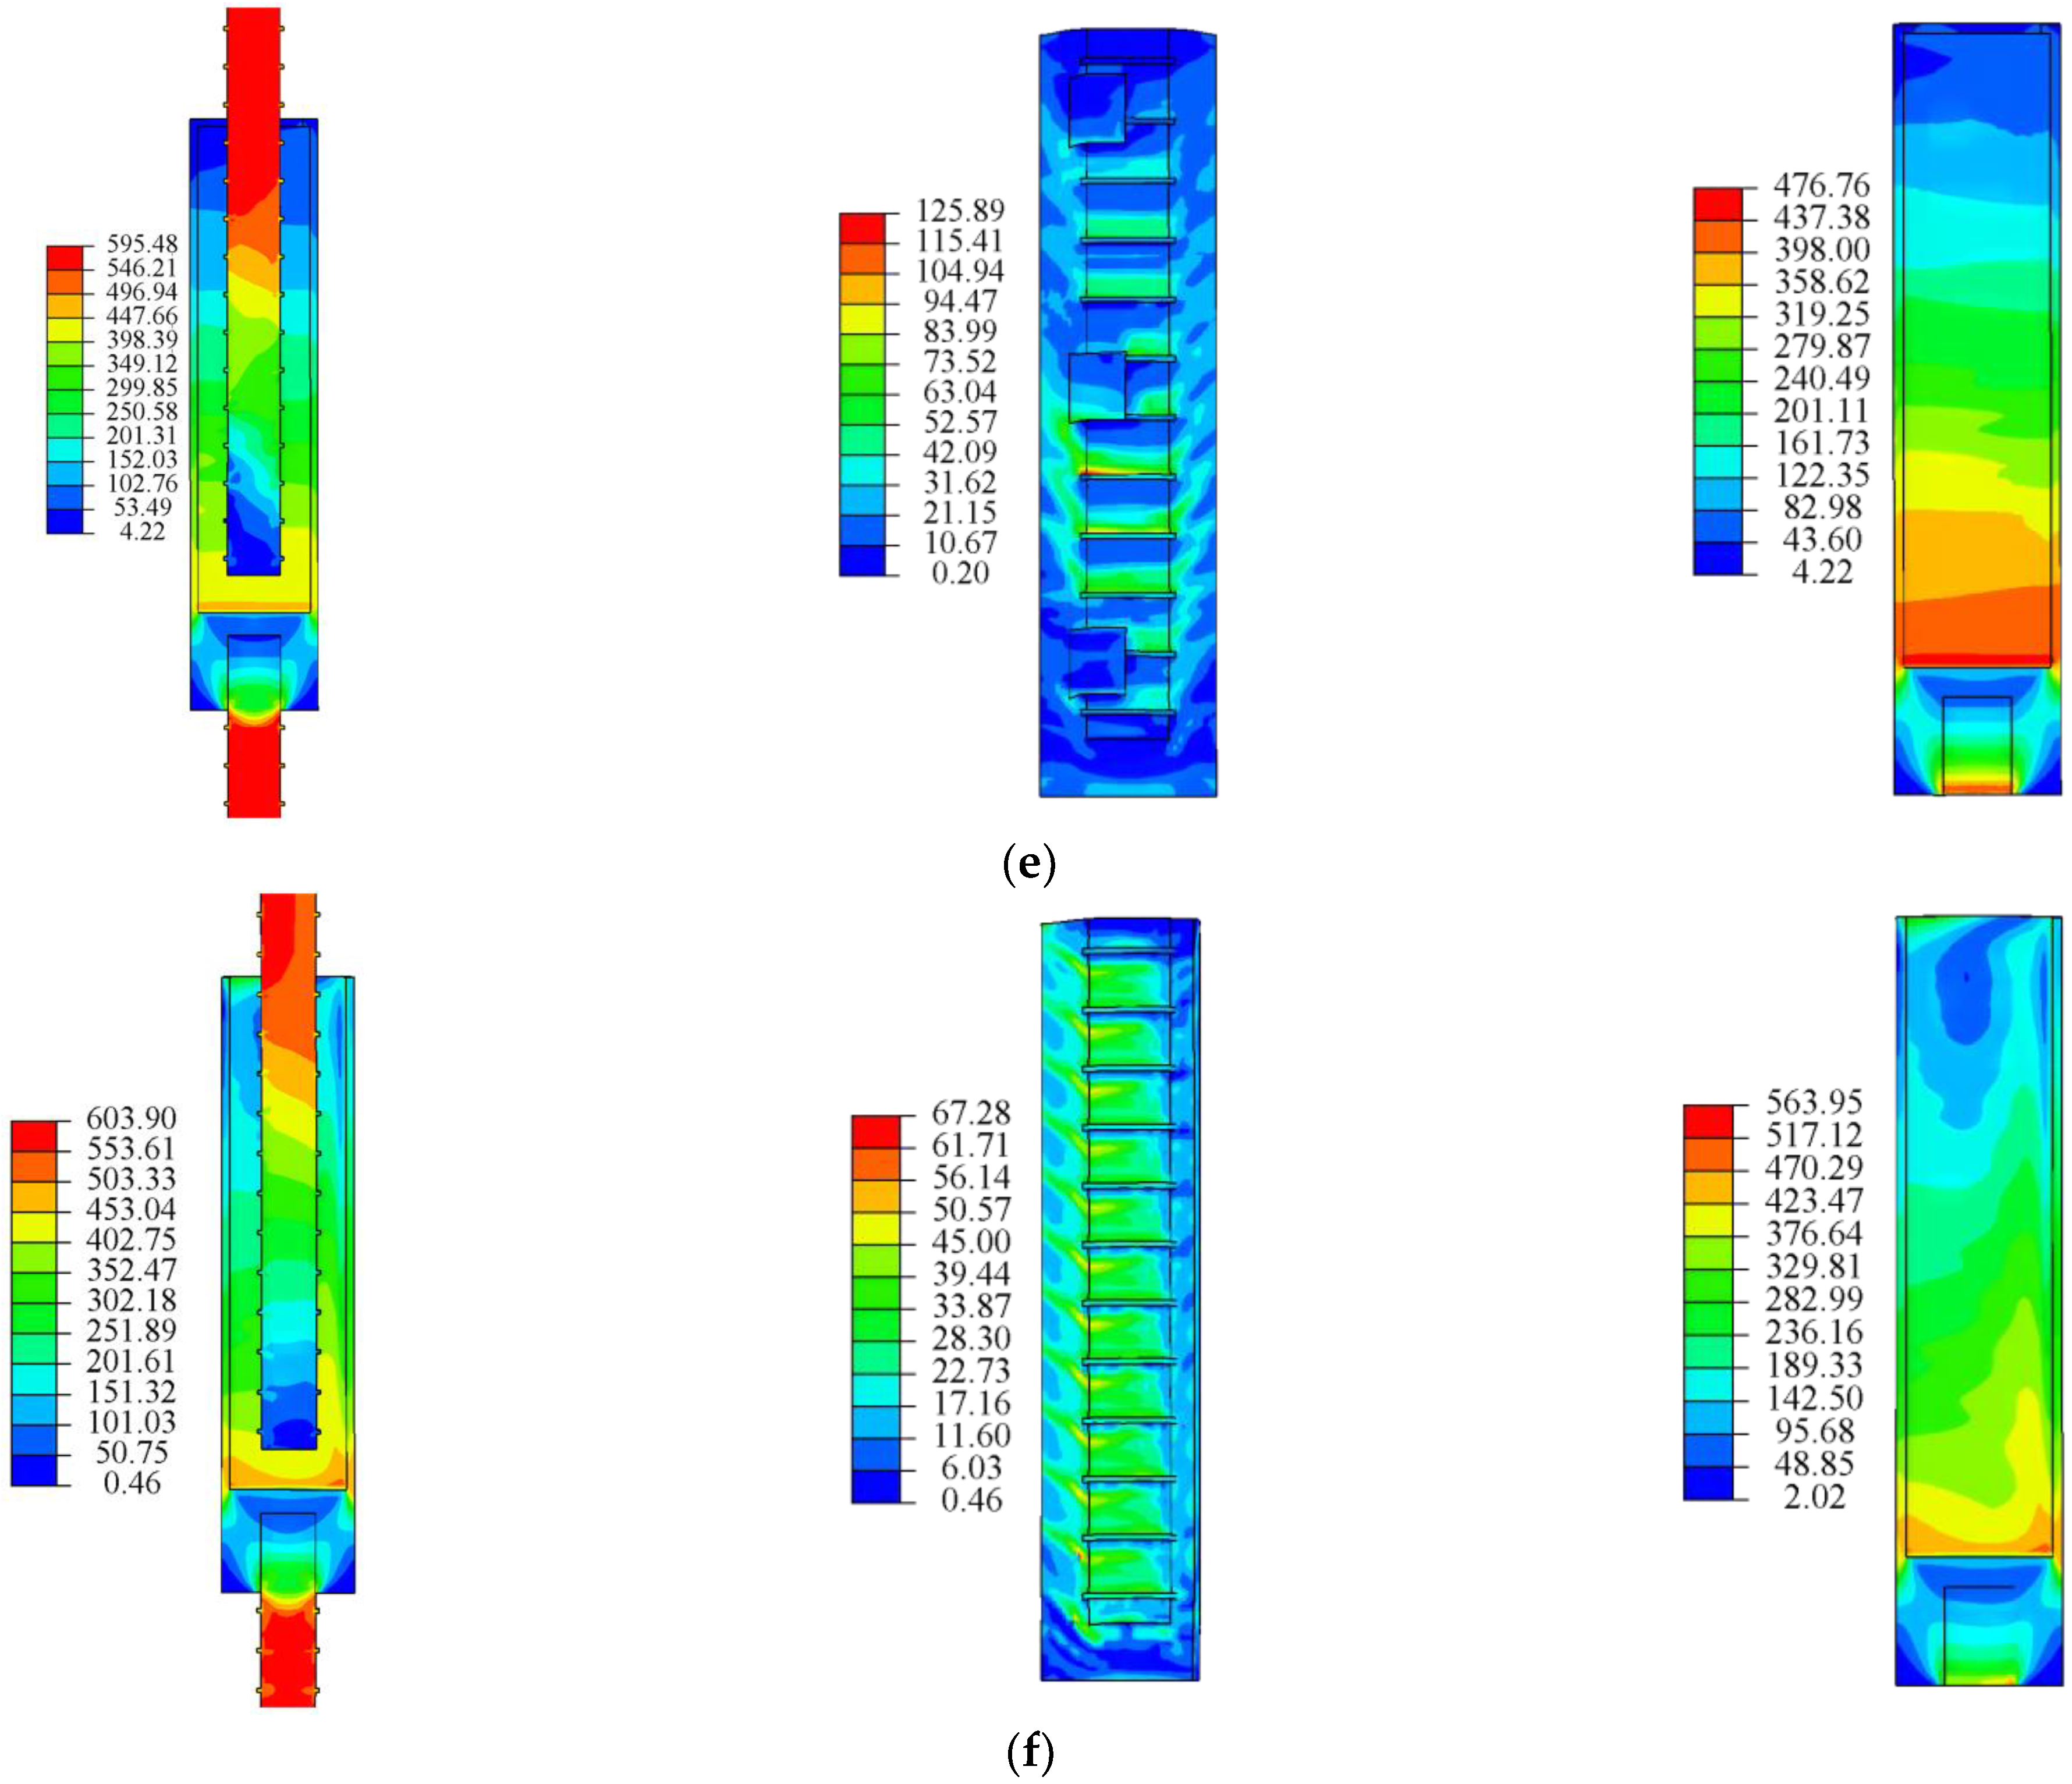
Figure 20a shows the von Mises stress distribution nephograms of the grouting end rebar, grouting material, and sleeve of the GT14-BM specimen. The maximum stress of the grouting end rebar in GT14-BM is 616 MPa. The rebar stress increases gradually from the threaded end to the grouting end. The stress distribution of the grouting material is uniform, and the maximum stress is 87 MPa. The maximum stress of the sleeve is 550 MPa. The stress of the sleeve decreases from the threaded end to the grouting end. Because of space restriction, only the stress nephograms of representative specimens are presented herein. Figure 20b–f shows the stress cloud diagrams of the grouting end rebar, grouting material, and sleeve when the ultimate load is reached in the GT14-DB-2.5d, GT14-ZB-2.5d, GT14-JB-3-2.5d, GT14-DC-3-2.5d, and GT14-SP-4mm specimens. The overall stress distribution trend of the GT14-DB-2.5d specimen is similar to that of the standard group. Since there was no bond between the rebar and the grouting material at the defect, their stresses changed only slightly. The overall stress of the grouting material was uniform. At the transverse rib of the rebar, the stress of the grouting material was high. Compared with the standard group, the sleeve exhibited a higher stress in the defect area. As shown in Figure 20c,d, the stress distributions of the rebar and sleeve of the GT14-ZB-2.5d and GT14-JB-3-2.5d specimens are largely the same as that of the standard group. The change in the stress of the rebar at defect was small. The stress nephogram of the grouting material shows that the grouting material can be divided into multiple stress sections. Figure 20e shows that the stress distribution of the GT14-DC-3-2.5d specimen is not uniform, and the stress on the defective side of the grouting material is higher than that on the non-defective side. Figure 20f shows the stress nephogram of the GT14-SP-4mm specimen. The stress on the defective side is greater than that on the non-defective side. The results showed that the stress distribution of the specimen in the finite element simulation was consistent with the experiment.
5. Conclusions

This study examined the mechanical properties of eleven groups of half-grouted sleeve joints with different grouting defects. The main conclusions drawn from the test results and analysis are as follows:
(1)
The failure modes of the half-grouted sleeve specimens included rebar fracture and rebar pull-out, which occurred after the yielding of the rebars. The specimens experienced elastic, yield, strengthening, and failure stages in the tensile process, similar to that exhibited by a single rebar.
(2)
For the end defect of the rebar, the critical defect length of the two failure modes was 2.5 d. The ultimate bearing capacity of the specimens was affected by the defects, among which the middle and uniform defects had the greatest influence. The ultimate bearing capacity of the specimens with two defects was reduced by more than 10% compared with the standard group. Distributed defects are more hazardous than concentrated defects. The horizontal defects had little effect on the bearing capacity when the defect height was small.
(3)
The rebar stress in the grouting section increased from the threaded end to the grouting end, which was opposite to the trend in the sleeve stress. For the middle defect and end defect specimens, the stress transfer at the defects was blocked. Asymmetric defects lead to sudden changes in stress transfer.
(4)
The finite element analysis results showed that the ultimate load and stress distribution of the specimen were consistent with the experimental results, and the error was within 5%. An effective analytical model is established for the grouted sleeve connection in the future.

Author Contributions

Conceptualization, D.C., Y.S. and S.D.; methodology, D.C. and S.D.; software, Z.W. and Y.B.; formal analysis, D.C., Z.W. and S.D.; writing—original draft preparation, Z.W., S.D. and Y.B.; writing—review and editing, D.C., Y.S. and T.X. All authors have read and agreed to the published version of the manuscript.

Funding

The research is partially funded by Mechanical Properties Research of FRP Connectors in Fabricated Concrete Sandwich Insulation Wall Panels after Fire (KJ2021A0608), Natural Science Foundation of Anhui Province (19080885ME173), and Science and Technology Project of Anhui Province Housing and Urban-Rural Construction (2020–YF47).

Institutional Review Board Statement

Not applicable.

Informed Consent Statement

Not applicable.

Data Availability Statement

The data presented in this study are available on request from the corresponding author.

Conflicts of Interest

The authors declare no conflict of interest.

References

  1. Liew, K.M.; Sojobi, A.O.; Zhang, L.W. Green concrete: Prospects and challenges. Constr. Build. Mater. 2017, 156, 1063–1095. [Google Scholar] [CrossRef]
  2. Sebaibi, N.; Boutouil, M. Reducing energy consumption of prefabricated building elements and lowering the environmental impactof concrete. Eng. Struct. 2020, 213, 110594. [Google Scholar] [CrossRef]
  3. Zaid, O.; Hashmi, S.R.Z.; Aslam, F.; Abedin, Z.U.; Ullah, A. Experimental study on the properties improvement of hybrid graphene oxide fiber-reinforced composite concrete. Diam. Relat. Mater. 2022, 124, 108883. [Google Scholar] [CrossRef]
  4. Kirschke, P.; Sietko, D. The function and potential of innovative reinforced concrete prefabrication technologies in achieving residential construction goals in Germany and Poland. Buildings 2021, 11, 533. [Google Scholar] [CrossRef]
  5. Aghasizadeh, S.; Tabadkani, A.; Hajirasouli, A.; Banihashemi, S. Environmental and economic performance of prefabricated construction: A review. Environ. Impact Assess. Rev. 2022, 97, 106897. [Google Scholar] [CrossRef]
  6. Chang, Y.; Li, X.D.; Masanet, E.; Zhang, L.; Huang, Z.; Ries, R. Unlocking the green opportunity for prefabricated buildings and construction in China. Resour. Conserv. Recycl. 2018, 139, 259–261. [Google Scholar] [CrossRef]
  7. Wang, S.; Wang, Y.; Sheng, D.; Wang, Y. Study on New prefabricated reinforced concrete structure technology based on fault-tolerant design. Buildings 2022, 12, 814. [Google Scholar] [CrossRef]
  8. Li, F.; Abruzzese, D.; Milani, G.; Li, S. Influence of internal defects of semi grouted sleeve connections on the seismic performance of precast monolithic concrete columns. J. Build. Eng. 2022, 49, 104009. [Google Scholar] [CrossRef]
  9. Seo, S.Y.; Nam, B.R.; Kim, S.K. Tensile strength of the grout-filled head-splice-sleeve. Constr. Build. Mater. 2016, 124, 155–166. [Google Scholar] [CrossRef]
  10. Al-Jelawy, H.M. Experimental and numerical investigations on monotonic tensile behavior of grouted sleeve couplers with different splicing configurations. Eng. Struct. 2022, 265, 114434. [Google Scholar] [CrossRef]
  11. Ling, J.H.; Rahman, A.B.A.; Ibrahim, I.S.; Hamid, Z.A. Tensile capacity of grouted splice sleeves. Eng. Struct. 2016, 111, 285–296. [Google Scholar] [CrossRef]
  12. Gao, Q.; Zhao, W.J. Experimental study on factors influencing the connection performance of grouted welded sleeves under uniaxial tensile loads. J. Build. Eng. 2021, 43, 103033. [Google Scholar] [CrossRef]
  13. Hosseini, S.J.A.; Rahman, A.B.A.; Osman, M.H.; Saim, A.; Adnan, A. Bond behavior of spirally confined splice of deformed bars in grout. Constr. Build. Mater. 2015, 80, 180–194. [Google Scholar] [CrossRef]
  14. Henin, E.; Morcous, G. Non-proprietary bar splice sleeve for precast concrete construction. Eng. Struct. 2015, 83, 154–162. [Google Scholar] [CrossRef]
  15. Han, R.; Li, S.; Sun, W. Effect of grouting material strength on bond strength of sleeve and acoustic emission characterization of bond failure damage process. Constr. Build. Mater. 2022, 324, 126503. [Google Scholar] [CrossRef]
  16. Wang, Z.W.; Chen, J.W.; Ju, S.L.; Liu, Z.Y. Experimental study on effrct of loading mode and anchorage length on connection behavior of grouting sleeve for rebars splicing. Ind. Constr. 2021, 51, 118–125. [Google Scholar] [CrossRef]
  17. Chen, J.; Wang, Z.; Liu, Z.; Ju, S. Experimental investigation of mechanical behaviour of rebar in steel half-grouted sleeve connections with defects in water/binder ratio. Structures 2020, 26, 487–500. [Google Scholar] [CrossRef]
  18. Zheng, G.; Kuang, Z.; Xiao, J.; Pan, Z. Mechanical performance for defective and repaired grouted sleeve connections under uniaxial and cyclic loadings. Constr. Build. Mater. 2020, 233, 117233. [Google Scholar] [CrossRef]
  19. JG/T 408-2019; Cementitious Grout for Sleeve of Rebar Splicing. Ministry of Housing and Urban-Rural Development: Beijing, China, 2019.
  20. GB/T 17671-2021; Test Method of Cement Mortar Strength. State Administration for Market Regulation: Beijing, China, 2021.
  21. GB/T228.1-2010; Metallic Materials-Tensile Testing-Part 1: Method of Test at Room Temperature. National Standardization Committee: Beijing, China, 2010.
  22. JGJ 355-2015; Technical Specification for Grout Sleeve Splicing of Rebars. Ministry of Housing and Urban-Rural Development: Beijing, China, 2015.
  23. Xu, F.; Wang, K.; Wang, S.G.; Li, W.W.; Liu, W.Q.; Du, D.S. Experimental bond behavior of deformed rebars in half-grouted sleeve connections with insufficient grouting defect. Constr. Build. Mater. 2018, 185, 264–274. [Google Scholar] [CrossRef]
  24. Tullini, N.; Minghini, F. Grouted sleeve connections used in precast reinforced concrete construction—Experimental investigation of a column-to-column joint. Eng. Struct. 2016, 127, 784–803. [Google Scholar] [CrossRef]
  25. Chen, X.; Miao, Q.S.; Yang, C.T.; Xia, D.D.; Liu, Q.M.; Xie, L.L. Experimental study on tensile performance of defect detectable and repairable half grouted sleeve connection. Eng. Mech. 2020, 37, 199–207. [Google Scholar] [CrossRef]
  26. Sayadi, A.A.; Rahman, A.; Jumaat, M.; Alengaram, U.J.; Ahmad, S. The relationship between interlocking mechanism and bond strength in elastic and inelastic segment of splice sleeve. Constr. Build. Mater. 2014, 55, 227–237. [Google Scholar] [CrossRef]
  27. Guo, H.; Zhang, J.; Wang, C. Experimental study on influence of connection defects on joint strength of half-grouted sleeve splicing of rebar. Adv. Civ. Eng. 2020, 2020, 5389861. [Google Scholar] [CrossRef]
  28. Xu, T.; Li, Q.; Zhao, R.; Ding, J.; Zhan, Y. On the early-age bond-slip behavior of an eccentric bar embedded in a grouted sleeve—ScienceDirect. Eng. Struct. 2019, 190, 160–170. [Google Scholar] [CrossRef]
  29. Yuan, H.; Zhu, Z.G.; Naito, C.J.; Yi, W.J. Tensile behavior of half grouted sleeve connections: Experimental study and analytical modeling. Constr. Build. Mater. 2017, 152, 96–104. [Google Scholar] [CrossRef]
  30. Harajli, M.H. Bond stress-slip model for steel bars in unconfined or steel, FRC, or FRP confined concrete under cyclic loading. J. Struct. Eng. 2009, 135, 509–518. [Google Scholar] [CrossRef]
  31. Kuang, Z.; Zheng, G. Computational and experimental mechanical modelling of a composite grouted splice sleeve connector system. Materials 2018, 11, 306. [Google Scholar] [CrossRef] [Green Version]
  32. GB 50010-2010; Code for Design of Concrete Structures. Ministry of Housing and Urban-Rural Development: Beijing, China, 2015.
  33. Hawileh, R.A.; Naser, M.Z.; Abdalla, J.A. Finite element simulation of reinforced concrete beams externally strengthened with short-length CFRP plates. Compos. Part B Eng. 2013, 45, 1722–1730. [Google Scholar] [CrossRef]
  34. Al-Jelawy, H.M.; Mackie, K.R. Three-Dimensional Fiber-Based Models of Precast and Cast-in-Place Reinforced Concrete Columns. J. Struct. Eng. 2022, 148, 04021287. [Google Scholar] [CrossRef]
Figure 1. Grouted sleeves. (a) Full-grouted sleeve. (b) Half-grouted sleeve.
Buildings 12 01807 g001
Figure 2. Types of partial defects in a grouted sleeve. (a) Foreign bodies bonded to rebars. (b) Insufficient anchorage length of rebar. (c) Untimely grouting closure.
Buildings 12 01807 g002
Figure 3. Axial profile of half-grouted sleeve.
Buildings 12 01807 g003
Figure 4. Fluidity test.
Buildings 12 01807 g004
Figure 5. Grout properties test. (a) Testing machine. (b) Flexural test damage pattern. (c) Compression test damage pattern.
Buildings 12 01807 g005
Figure 6. Test on rebar properties.
Buildings 12 01807 g006
Figure 7. Details of the specimens. (a) GT14-BM. (b) GT14-DB. (c) GT14-ZB-2.5d. (d) GT14-JB-3-2.5d. (e) GT14-JB-2-2.5d. (f) GT14-DC-3-2.5d. (g) GT14-DC-2-2.5d. (h) GT14-SP.
Buildings 12 01807 g007aBuildings 12 01807 g007b
Figure 8. Production process of specimen.
Buildings 12 01807 g008
Figure 9. Experimental equipment.
Buildings 12 01807 g009
Figure 10. Measurement information. (a) Position of strain measuring point. (b) Automatic data acquisition system. (c) Extensometer arrangement.
Buildings 12 01807 g010
Figure 11. Failure modes. (a) Rebar fracture failure. (b) Rebar pull-out failure.
Buildings 12 01807 g011
Figure 12. Load–displacement curves. (a) GT14-BM + GT14-DB. (b) GT14-BM + GT14-ZB. (c) GT14-BM + GT14-JB. (d) GT14-BM + GT14-DC. (e) GT14-BM + GT14-SP. (f) Comparison between curves.
Buildings 12 01807 g012aBuildings 12 01807 g012b
Figure 13. Load–slip curves. (a) GT14-BM + GT14-DB. (b) GT14-BM + GT14-ZB. (c) GT14-BM + GT14-JB. (d) GT14-BM + GT14-DC. (e) GT14-BM + GT14-SP. (f) Comparison between curves.
Buildings 12 01807 g013
Figure 14. Load–stress curves. (a) GT14-BM-2. (b) GT14-DB-3d-2. (c) GT14-ZB-2.5d-1. (d) GT14-JB-3-2.5d-1. (e) GT14-DC-3-2.5d-2. (f) GT14-SP-4mm-1.
Buildings 12 01807 g014
Figure 15. Stress distribution curves. (a) GT14-BM. (b) GT14-DB-2d. (c) GT14-DB-2.5d. (d) GT14-DB-3d. (e) GT14-ZB-2.5d. (f) GT14-JB-2-2.5d. (g) GT14-JB-3-2.5d. (h) GT14-DC-2-2.5d. (i) GT14-DC-3-2.5d. (j) GT14-SP-2mm. (k) GT14-SP-4mm.
Buildings 12 01807 g015aBuildings 12 01807 g015b
Figure 16. Stress distribution diagram under a load of 45 kN. (a) GT14-BM. (b) GT14-DB-2.5d. (c) GT14-DB-3d. (d) GT14-ZB-2.5d. (e) GT14-JB-3-2.5d. (f) GT14-JB-2-2.5d. (g) GT14-DC-3-2.5d. (h) GT14-DC-2-2.5d. (i) GT14-SP-2mm. (j) GT14-SP-4mm.
Buildings 12 01807 g016aBuildings 12 01807 g016b
Figure 17. Stress–strain curves of materials. (a) Uniaxial compressive strength of concrete. (b) Uniaxial tensile strength of concrete. (c) Grouting sleeve. (d) Rebar.
Buildings 12 01807 g017
Figure 18. Mesh subdivision. (a) Rebar. (b) Grouting material. (c) Sleeve.
Buildings 12 01807 g018
Figure 19. Load–displacement curves. (a) GT14-BM. (b) GT14-DB-3d. (c) GT14-ZB-2.5d. (d) GT14-JB-3-2.5d. (e) GT14-DC-3-2.5d. (f) GT14-SP-4mm.
Buildings 12 01807 g019
Figure 20. Stress nephograms. (a) GT14-BM. (b) GT14-DB-2.5d. (c) GT14-ZB-2.5d. (d) GT14-JB-3-2.5d. (e) GT14-DC-3-2.5d. (f) GT14-SP-4mm.
Buildings 12 01807 g020aBuildings 12 01807 g020bBuildings 12 01807 g020c
Table 1. Material properties of sleeve.
ParameterPerformance Indicators
Tensile strength/MPa≥600
Yield strength/MPa≥355
Elongation after fracture≥16%
Table 2. Half-grouted sleeve parameters.
Serial NumberLL1D1D2dd1d2t
GT JB414/141552534301416142
Table 3. Fluidity of initial grouting material (unit: mm).
NumberLargest DiameterVertical DiameterAverage
1360345353
2356352354
3370349360
Table 4. Fluidity of grouting material in 30 min (unit: mm).
NumberLargest DiameterVertical DiameterAverage
1320299310
2316292304
3308302305
Table 5. Results of grouting material flexural strength test.
Curing AgeSpecimensCompressive Strength/MPaAverage/MPa
28 days28d-118.318.4
28d-217.8
28d-319.2
Table 6. Results of grouting material compressive strength test.
Curing AgeSpecimensCompressive Strength/MPaAverage/MPa
1 day1d-139.540.3
1d-237.9
1d-343.4
3 days3d-173.378.1
3d-278.3
3d-382.7
28 days28d-188.291.8
28d-293.9
28d-393.4
Table 7. HRB400 rebar material properties.
SpecimensRebar Diameter/mmYield Strength/MPaTensile Strength/MPa
114416612
214427602
314417607
Average14420607
Standard/400540
Table 8. Presents the design parameters of the above 11 groups of specimens.
Defect TypesSpecimen’s NumberDefect ParametersNumber
/GT14-BM-1/2/3The grout was full and flawless3
End defectsGT14-DB-3d-1/2/3The rebar end was set with 3 d defect, and the thickness was 3 mm3
GT14-DB-2.5d-1/2/3The rebar end was set with 2.5 d defect, and the thickness was 3 mm3
GT14-DB-2d-1/2/3The rebar end was set with 2 d defect, and the thickness was 3 mm3
Uniform defectsGT14-JB-3-2.5d-1/2/3The rebar is set up with three sections of evenly distributed defects, the total length of 2.5 d3
GT14-JB-2-2.5d-1/2/3The rebar is set up with two sections of evenly distributed defects, the total length of 2.5 d3
Middle defectsGT14-ZB-2.5d-1/2/3A 2.5 d defect is set in the middle of the rebar with a thickness of 3 mm3
Unilateral defectsGT14-DC-3-2.5d-1/2/3The rebar is set up with three sections of uniform defects on one side, total length of 2.5 d3
GT14-DC-2-2.5d-1/2/3The rebar is set up with two sections of uniform defects on one side, total length of 2.5 d3
Horizontal defectsGT14-SP-2mm-1/2/3Horizontal grouting creates a cavity of 2 mm in height in the sleeve3
GT14-SP-4mm-1/2/3Horizontal grouting creates a cavity of 4 mm in height in the sleeve3
Table 9. Characteristic points and failure modes of the specimens.
Specimen CodePy/kNδy/mmfy/MPaPu/kNδu/mmfu/MPa P ¯ y/kN δ ¯ y/mm f ¯ y/MPa P ¯ u/kN δ ¯ u/mm f ¯ u/MPa Failure Modes
GT14-BM-169.676.45452.5895.1055.78618.0969.076.31448.8594.4155.10613.63A
GT14-BM-268.586.23445.7093.8655.27610.04A
GT14-BM-368.976.26448.2794.2854.24612.77A
GT14-DB-2d-168.566.84445.6093.7854.02609.5268.716.93446.5593.6353.49608.52A
GT14-DB-2d-269.677.27452.8193.8753.16610.10A
GT14-DB-2d-367.896.68441.2593.2353.28605.94A
GT14-DB-2.5d-167.436.80438.2693.4751.82607.5067.346.94437.6793.1052.66605.08B
GT14-DB-2.5d-267.247.36437.0292.8453.32603.41B
GT14-DB-2.5d-367.356.67437.7492.9852.84604.32B
GT14-DB-3d-166.416.43431.6391.4344.26594.2465.966.68428.7290.7944.53590.10B
GT14-DB-3d-265.846.77427.9290.6944.37589.43B
GT14-DB-3d-365.646.85426.6290.2644.96586.64B
GT14-ZB-2.5d-168.587.32445.7385.4727.52555.5166.886.81438.0284.2326.57555.18B
GT14-ZB-2.5d-265.436.82425.2686.2125.86560.32B
GT14-ZB-2.5d-366.636.29443.0684.5826.33549.72B
GT14-JB-3-2.5d-165.716.21427.0883.7420.23544.2666.676.52433.3283.8921.36545.26B
GT14-JB-3-2.5d-267.897.26441.2584.2621.36547.64B
GT14-JB-3-2.5d-366.416.09431.6383.6822.48543.87B
GT14-JB-2-2.5d-167.835.55440.8687.7624.17570.3965.236.30424.5787.5228.08568.81B
GT14-JB-2-2.5d-264.496.52419.1588.2129.81573.31B
GT14-JB-2-2.5d-363.656.83413.6986.5830.26562.72B
GT14-DC-2-2.5d-166.407.15431.5691.1542.25592.4267.337.38437.6390.7441.64589.78B
GT14-DC-2-2.5d-268.247.53443.5290.6240.86588.98B
GT14-DC-2-2.5d-367.367.47437.8090.4641.81587.94B
GT14-DC-3-2.5d-166.418.51431.6388.9835.58578.3266.517.50432.2689.9936.97584.93B
GT14-DC-3-2.5d-265.687.54426.8890.4338.36587.74B
GT14-DC-3-2.5d-367.436.44438.2690.5836.98588.72B
GT14-SP-2mm-165.718.31427.0894.1450.10611.8666.328.05431.0694.1048.38611.62A
GT14-SP-2mm-266.447.83431.8293.6546.47608.67A
GT14-SP-2mm-366.828.02434.2994.5248.56614.33A
GT14-SP-4mm-167.678.31439.8292.3644.06600.2965.698.09435.6491.4444.73594.33A
GT14-SP-4mm-264.148.33442.8790.5444.23588.46A
GT14-SP-4mm-365.277.64424.2291.4345.90594.24A
Note: Py is the yield load, δy is the yield displacement, fy is the yield stress, Pu is the ultimate load, δu is the ultimate displacement, fu is the ultimate stress, P ¯ y is the average yield load, δ ¯ y is the average yield displacement, f ¯ y is the average yield stress, P ¯ u is the average ultimate load, δ ¯ u is the average ultimate displacement, f ¯ u is the average ultimate stress, A denotes rebar fracture failure, and B denotes rebar pull-out failure.
Table 10. Material properties.
MaterialCompressive Strength/MPaUltimate Strength/MPaDensity/kg·m−3Elastic Modulus/GPaPoisson’s Ratio
Grouting material88.1/2500380.2
Sleeve//73002100.3
Rebar/62078502000.3
Table 11. Comparison between experimental and simulated eigenvalues.
SpecimenYield Load (kN)Error Rate (%)Ultimate Load (kN)Error Rate (%)
ExperimentFEAExperimentFEA
GT14-BM69.0769.400.4894.4195.671.33
GT14-DB-2d68.7169.481.1293.6395.001.46
GT14-DB-2.5d67.3467.060.4293.1094.471.47
GT14-DB-3d65.9667.181.8590.7992.301.66
GT14-ZB-2.5d66.8866.191.0384.2387.403.76
GT14-JB-3-2.5d66.6768.332.4983.8985.441.85
GT14-JB-2-2.5d65.2368.124.4387.5289.221.94
GT14-DC-3-2.5d66.5166.230.4288.9889.430.51
GT14-DC-2-2.5d67.3366.571.1390.7491.340.66
GT14-SP-2mm66.3267.071.1394.1093.021.14
GT14-SP-4mm65.6966.781.6691.4491.770.36
Publisher’s Note: MDPI stays neutral with regard to jurisdictional claims in published maps and institutional affiliations.