
Analysis of the Effect of Mainshock-Aftershock Sequences on the Fragility of RC Bridge Columns


Abstract
1. Introduction
2. Basic Theory of Analysis
2.1. Damage Model and Damage Index
2.2. Incremental Damage Evaluation Index
2.3. Fragility Analysis Theory
3. Numerical Model and Selection of Ground Motion
3.1. Numerical Simulation of Bridge Column
3.2. Determination of Basic Parameters of Damage Model
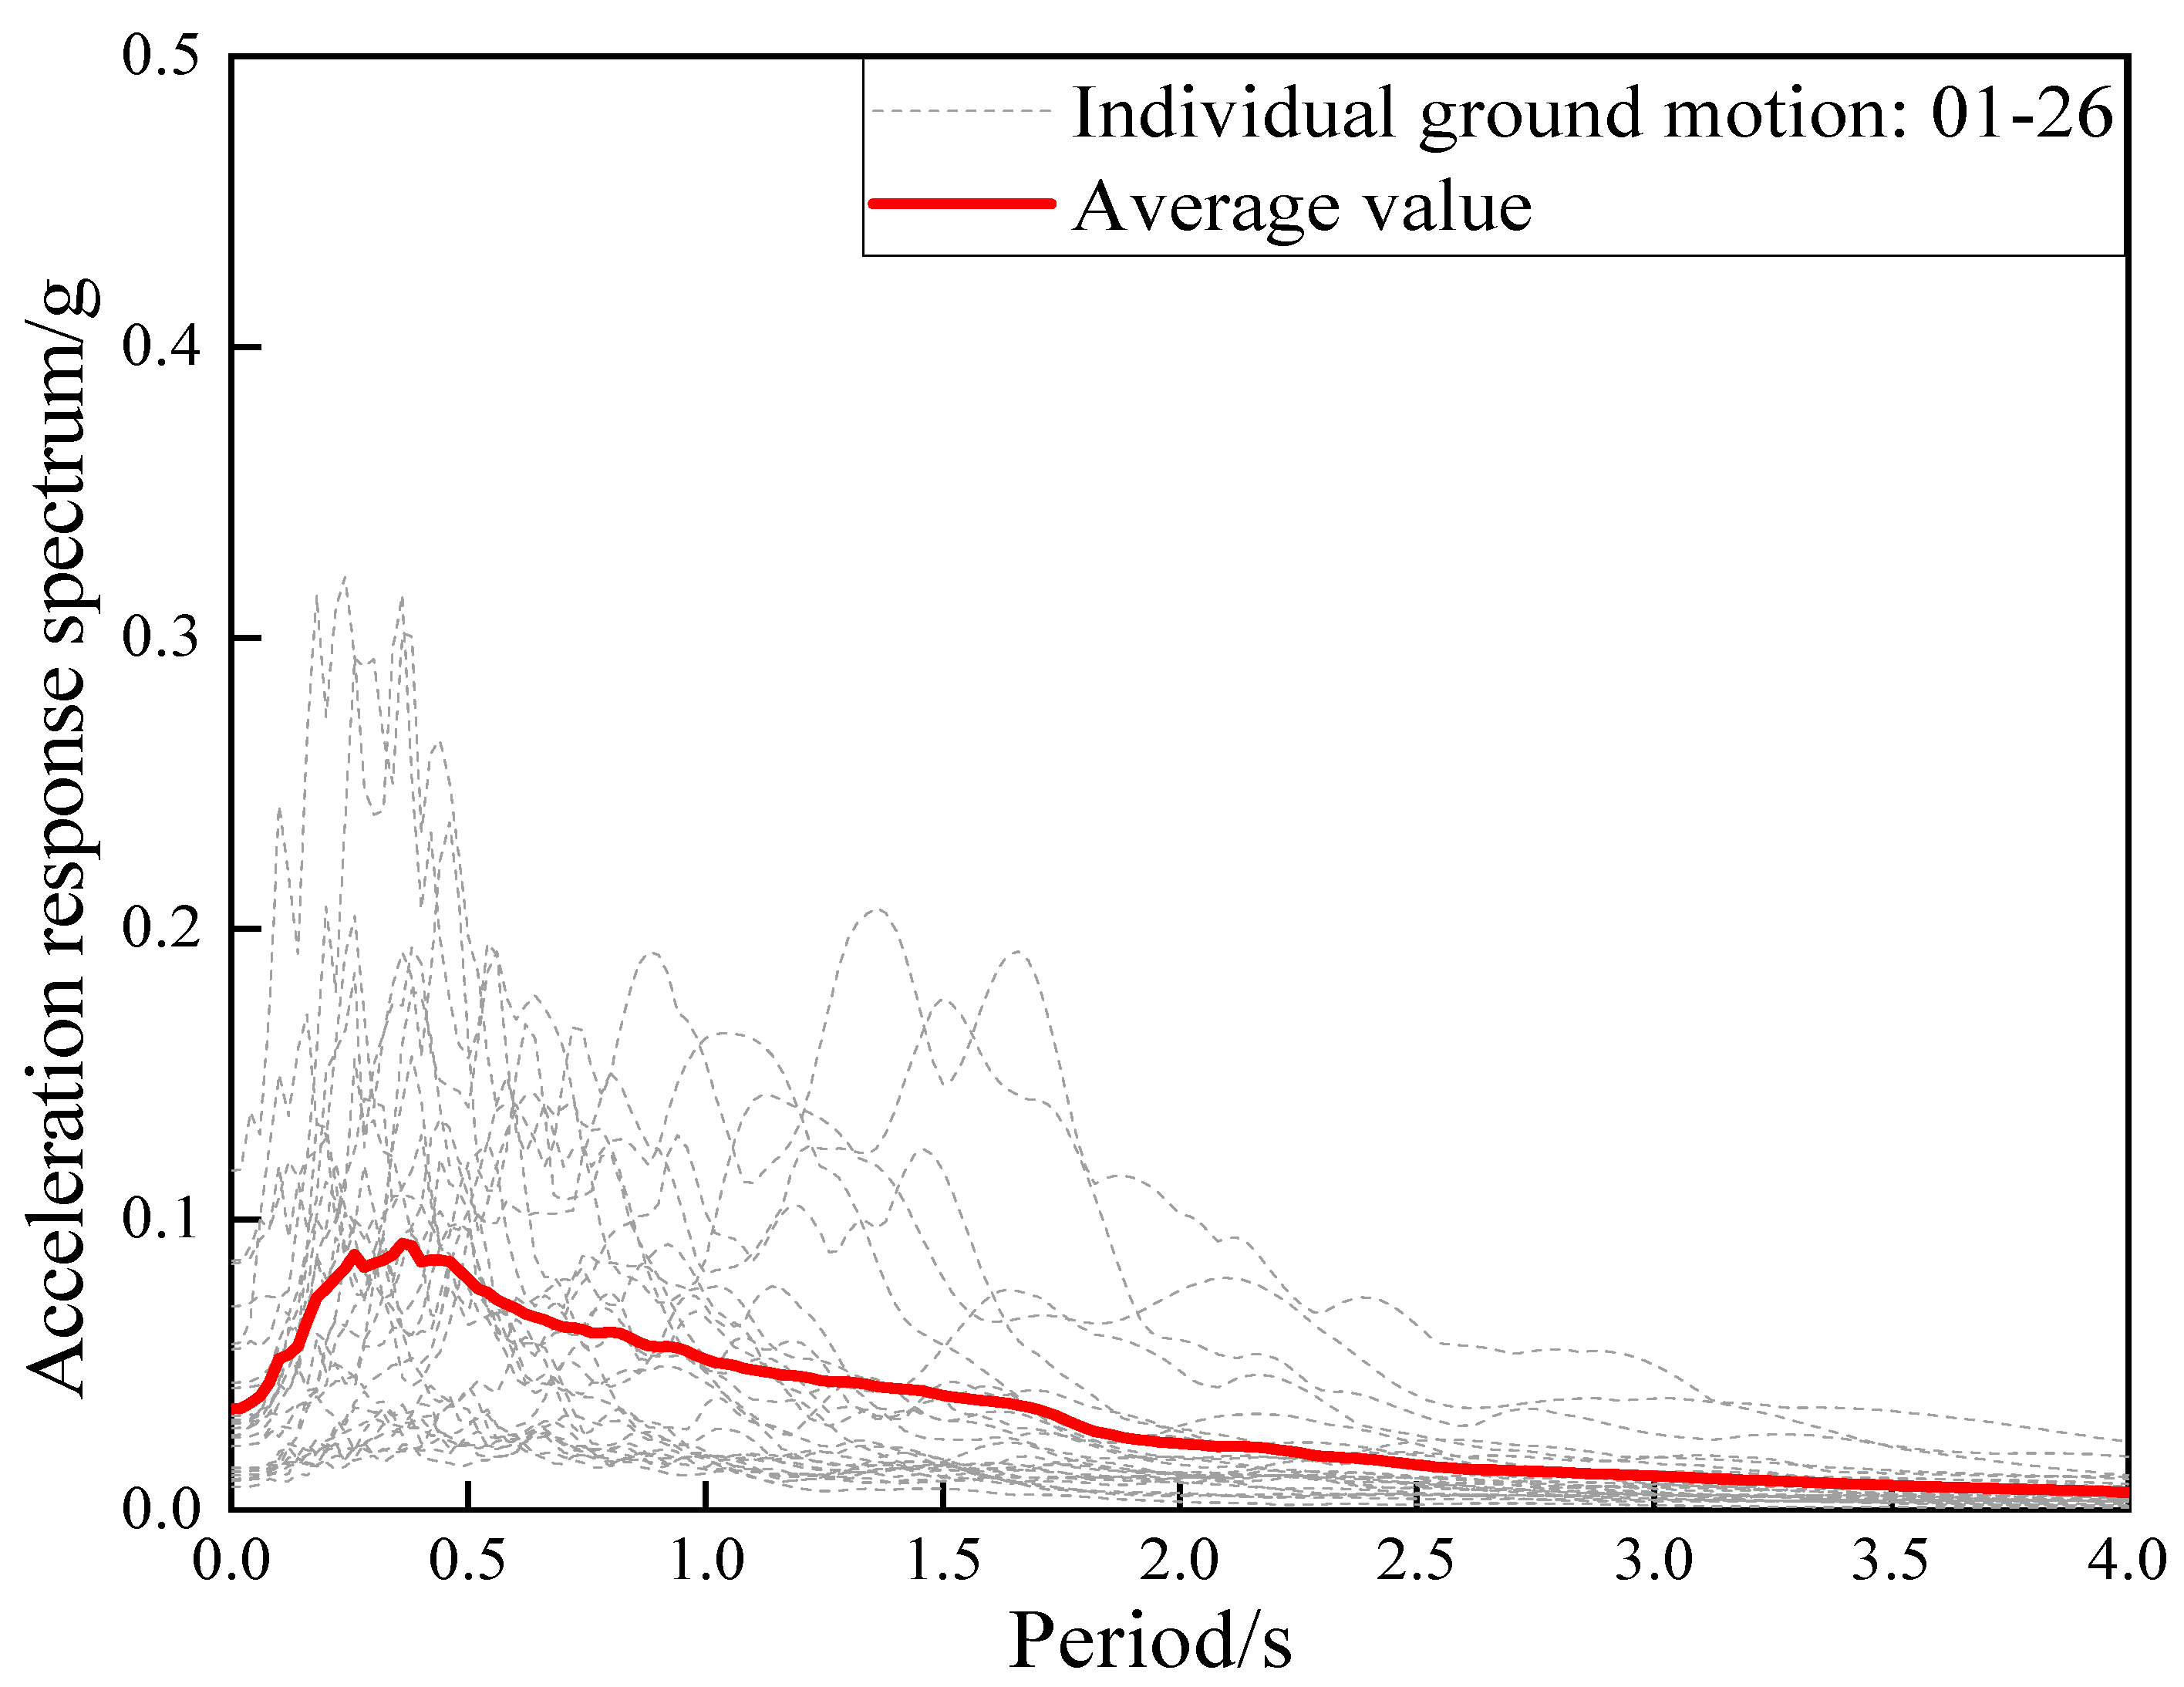
3.3. Selection and Synthesis of Seismic Waves
4. Damage Analysis of RC Column under MS-AS
4.1. Effect of Axial Compression Ratio on Damage of RC Column
4.2. Effect of Shear-Span Ratio on Damage of RC Column
4.3. Effect of Aftershock on Column with Different Damage Degree
5. Fragility Analysis of RC Column under MS-AS
5.1. Effect of Axial Compression Ratio on Fragility of RC Column
5.2. Effect of Shear-Span Ratio on Fragility of RC Column
6. Conclusions
- The seismic demand of the column under the action of the MS-AS sequences is greater than MS. This demand increases with the increase of axial compression ratio and decreases with the increase of reinforcement ratio. When the column is in a slight or no damage state, the effect of aftershock can be basically ignored.
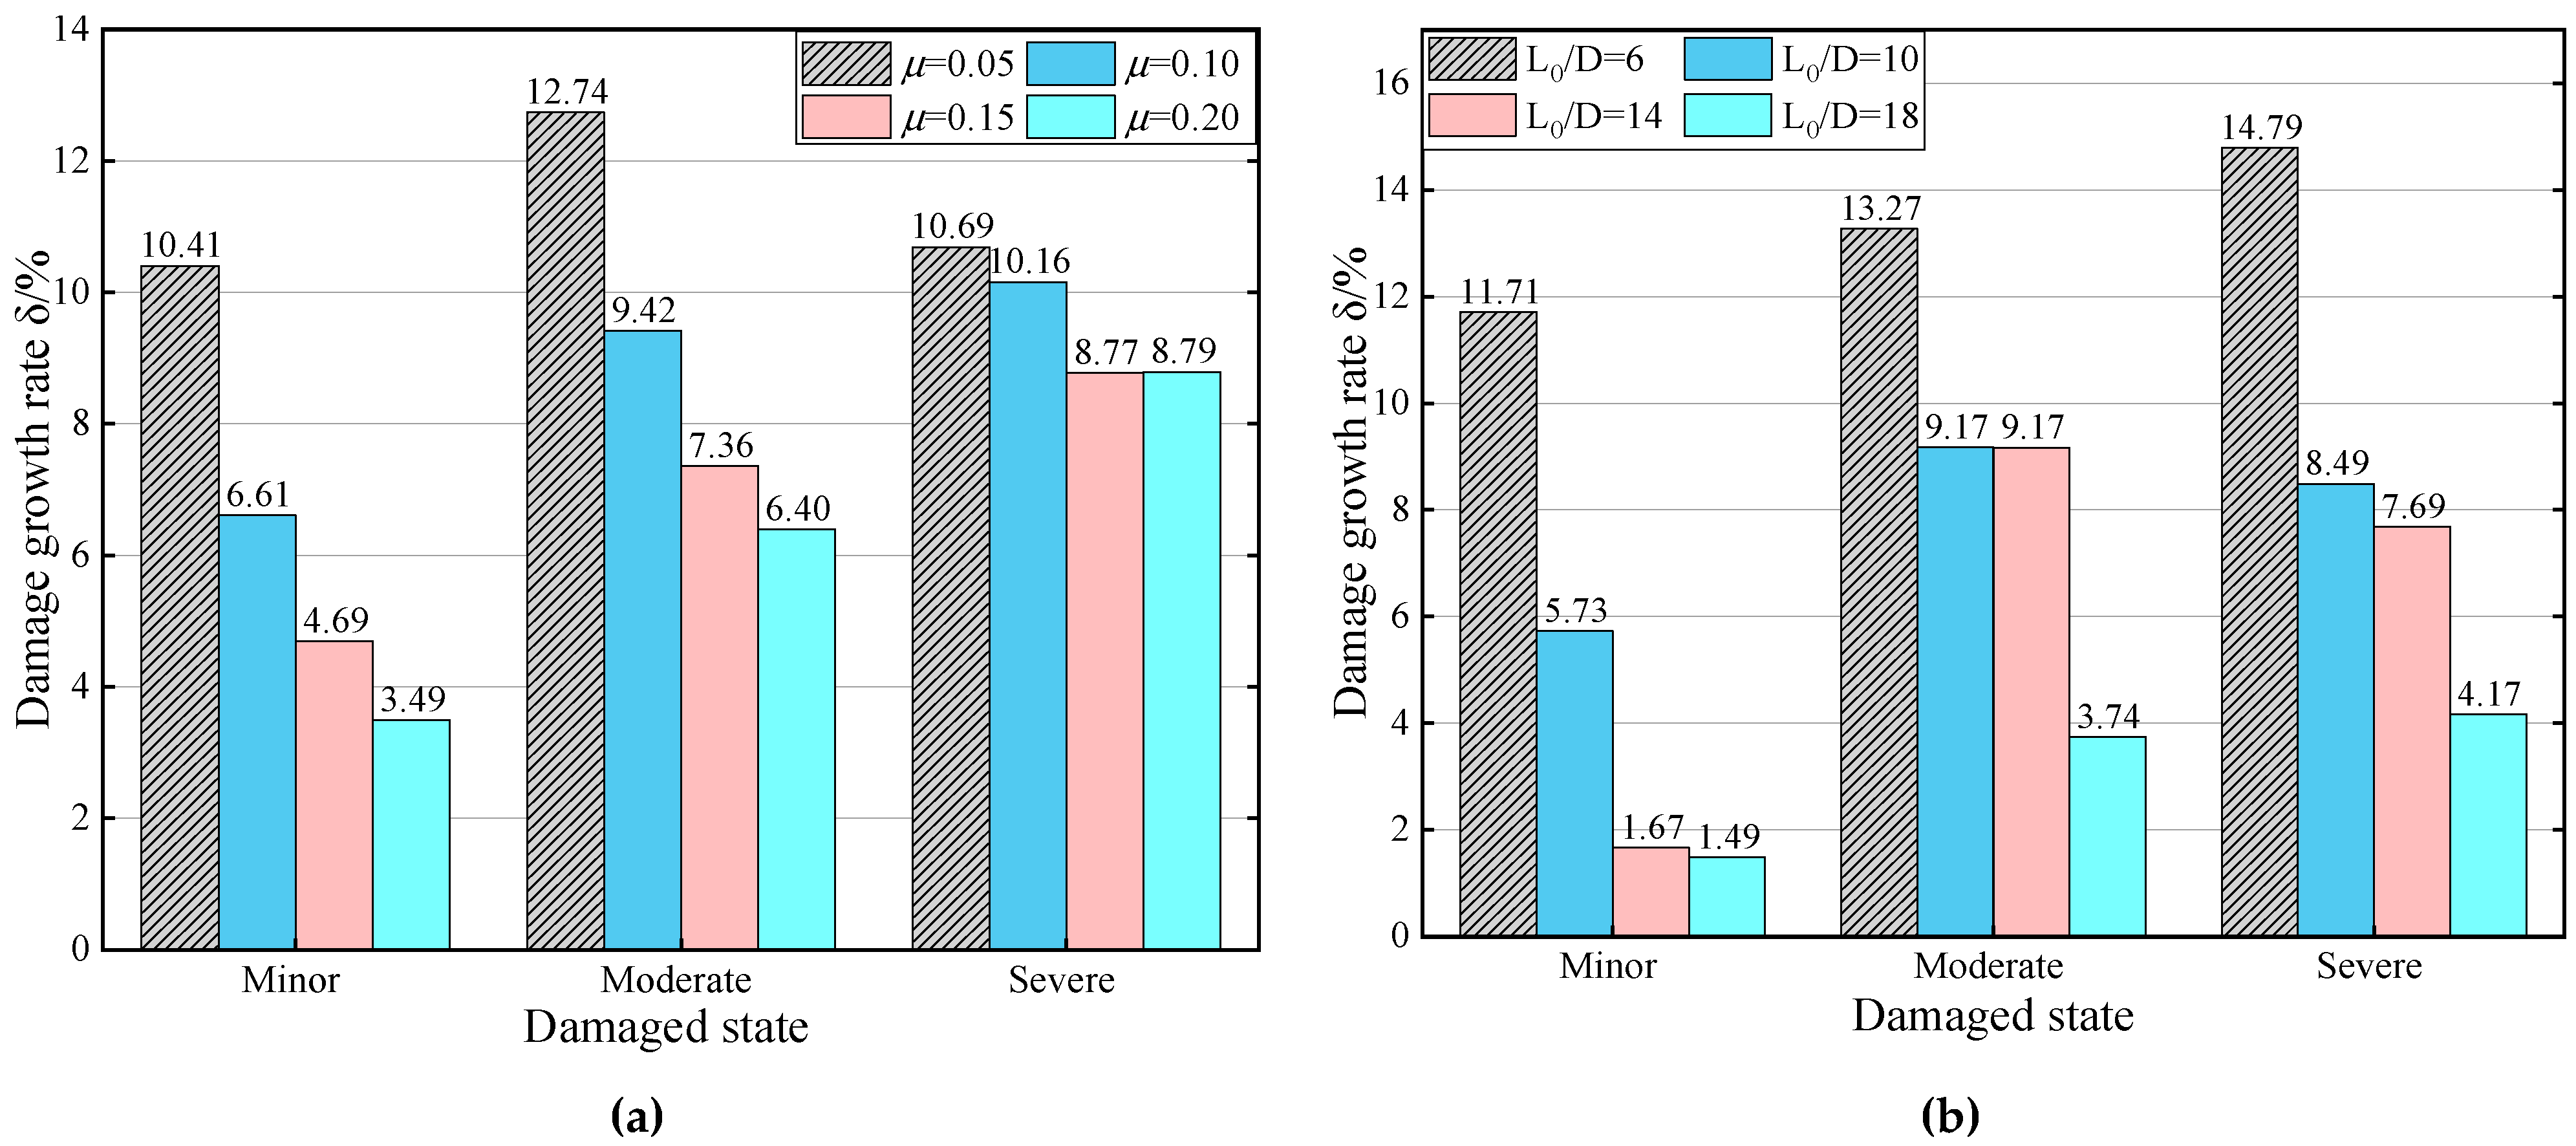
- The additional damage caused by AS can be comprehensively considered in the design according to different magnitudes. When the seismic level is 7 degree, the maximum increase rate of additional damage is about 7% of MS. When the seismic level is 8 degree, the maximum increase rate of additional damage is about 13% of MS. When the seismic level is 9 degree, the maximum growth rate of additional damage is about 15% of MS.
- The additional damage caused by AS gradually decreases with the increase of axial compression ratio in different damage states. When the column is slightly damaged, the influence of aftershocks can be ignored. When the column is in a medium damaged state, the growth rate of additional damage is up to 12.7%. When the column is in a severely damaged state, the growth rate of the additional damage can be conservatively estimated to be 11% of the MS.
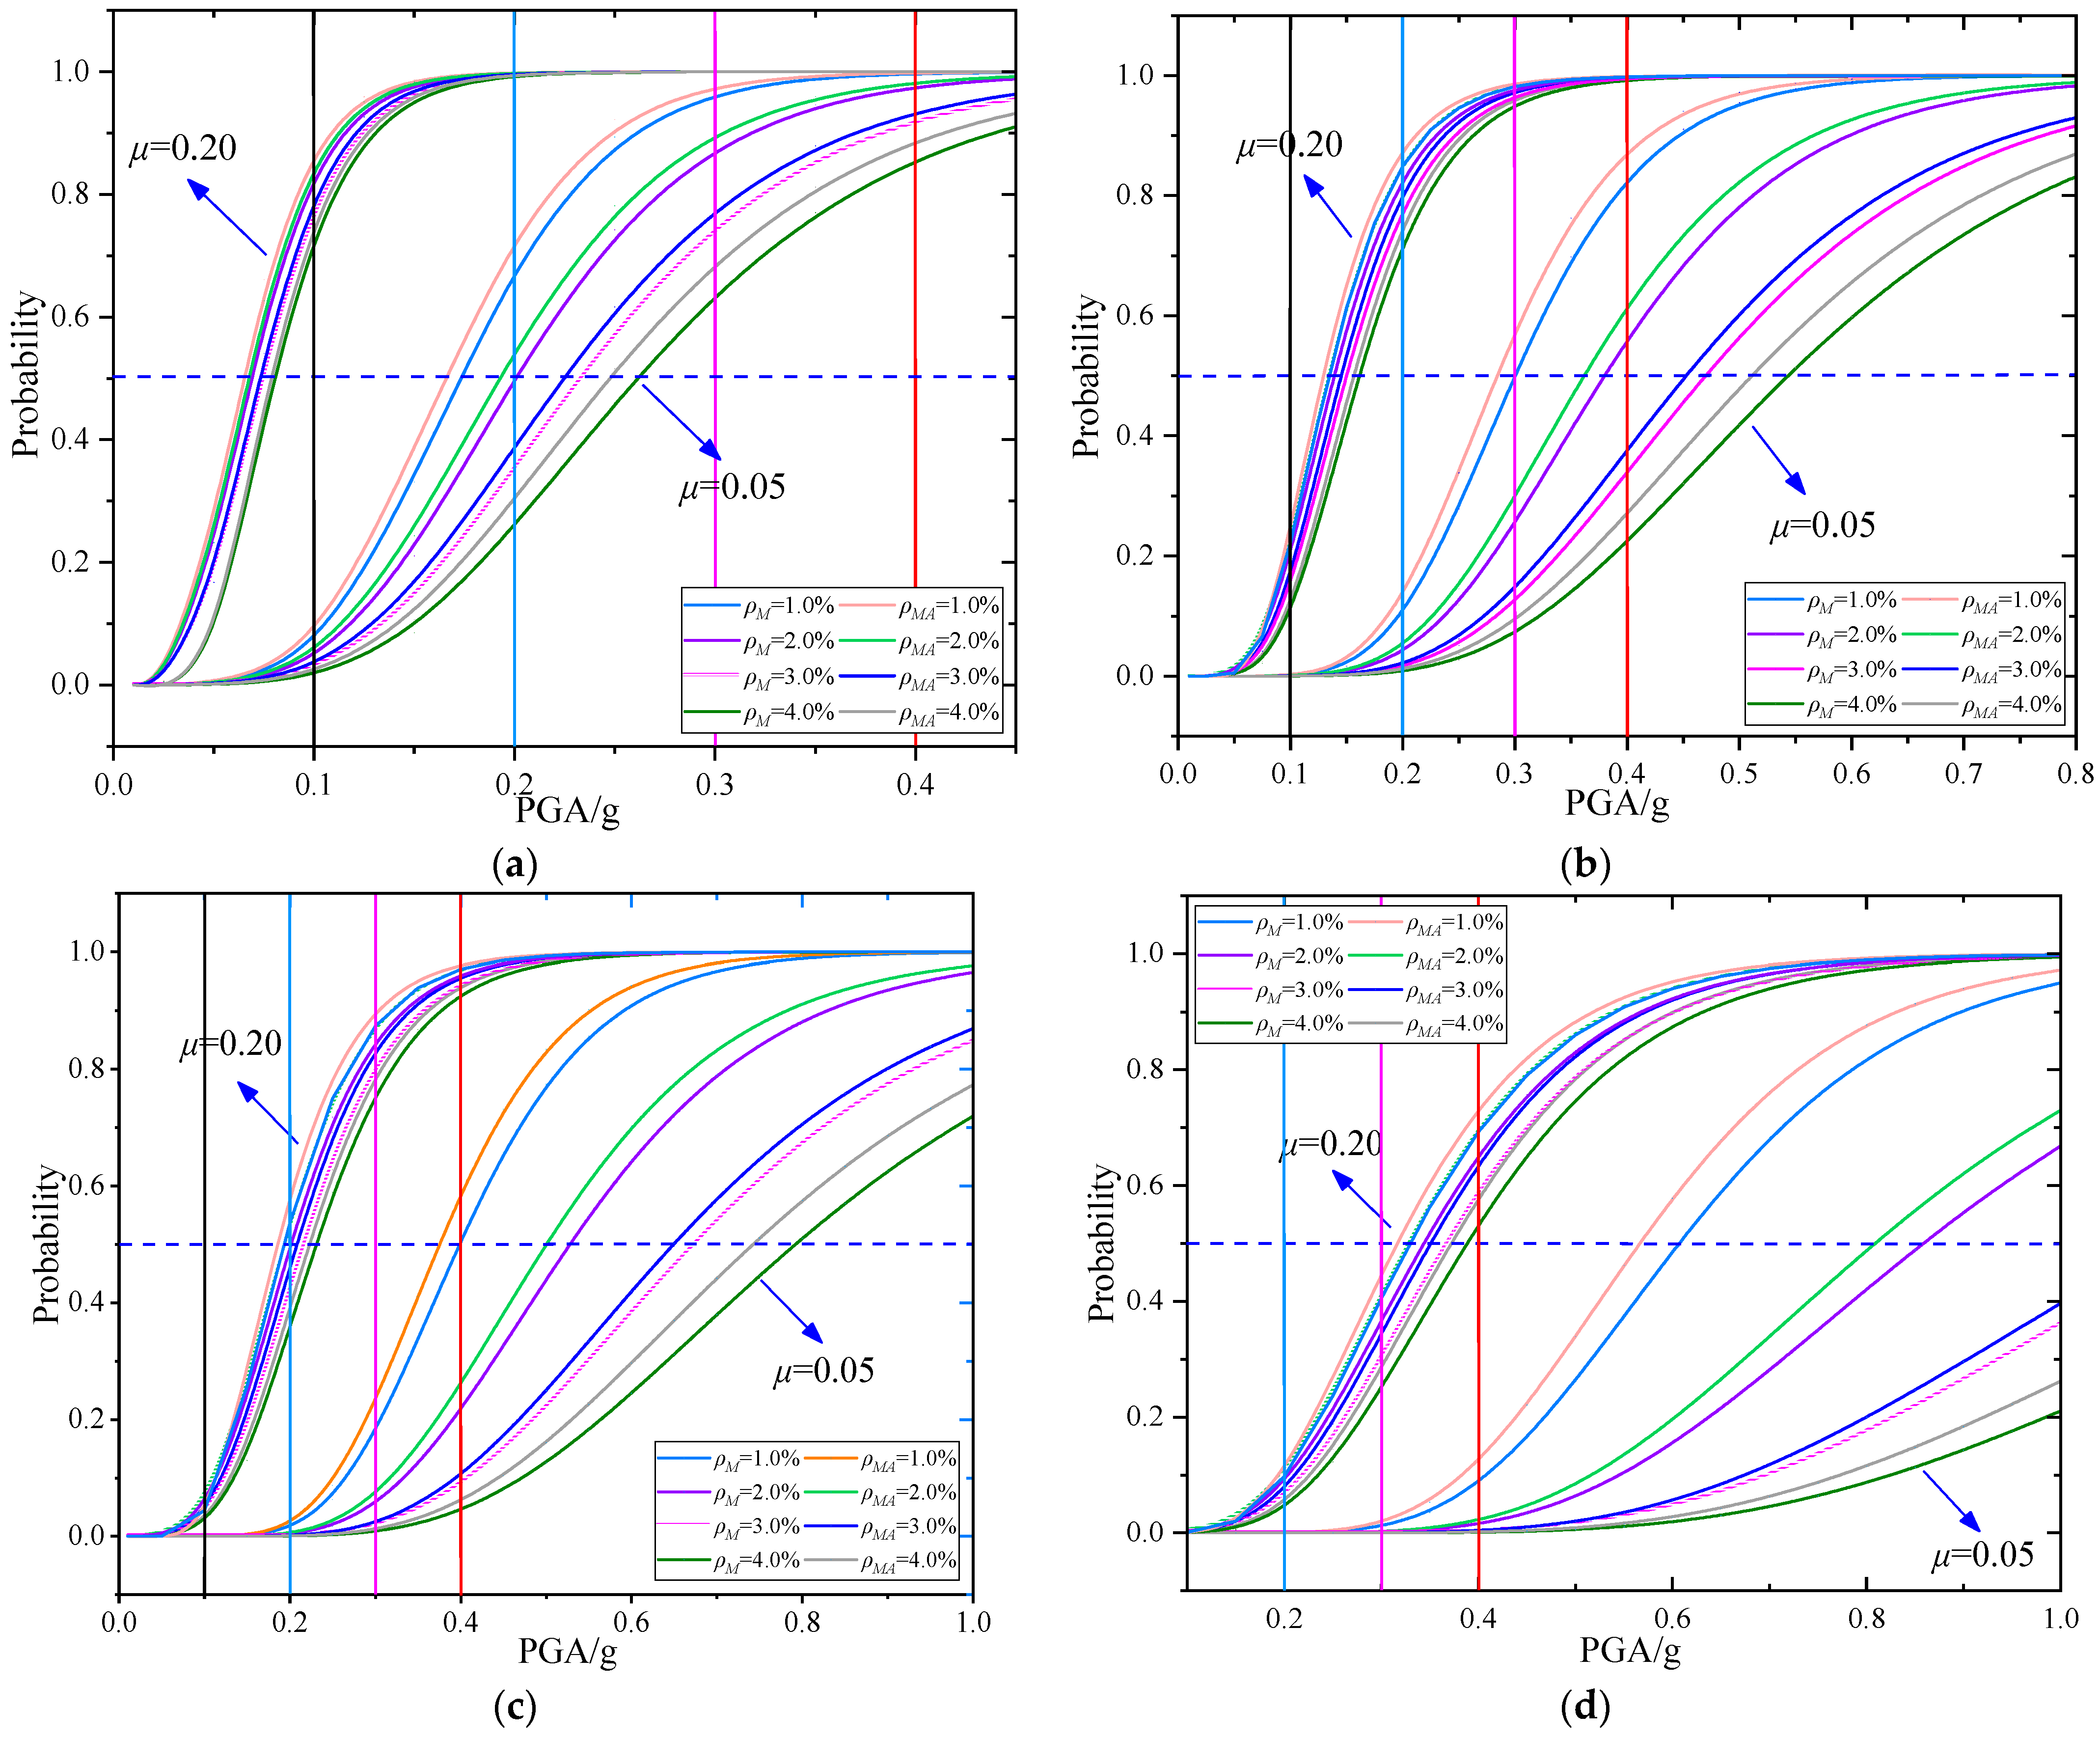
- The fragility of bridge piers in different damage states under the action of MS-AS is greater than that of MS. Increasing the reinforcement ratio can significantly reduce the damage probability of columns in different damage states when μ ≤ 0.1. However, the performance of reducing the fragility of columns by increasing the reinforcement ratio gradually decreases with the increase of the axial compression ratio. The effect of aftershock on the exceeding probability is lower in columns with small axial compression ratio.
Author Contributions
Funding
Data Availability Statement
Acknowledgments
Conflicts of Interest
References
- Ogata, Y. Statistical models for earthquake occurrences and residual analysis for point processes. J. Am. Stat. Assoc. 1988, 83, 9–27. [Google Scholar] [CrossRef]
- Kam, W.Y.; Pampanin, S.; Elwood, K. Seismic performance of reinforced concrete buildings in the 22 February Christchurch (Lyttleton) earthquake. Bull. New Zealand Soc. Earthq. Eng. 2011, 44, 239–277. [Google Scholar] [CrossRef]
- Priestley, M.J.N. The Whittier Narrows, California earthquake of October 1, 1987–damage to the I-5/I-605 separator. Earthq Spectra 1988, 4, 389–405. [Google Scholar] [CrossRef]
- Atzori, S.; Tolomei, C.; Antonioli, A.; Boncori, J.P.M.; Bannister, S.; Trasatti, E.; Pasquali, P.; Salvi, S. The 2010–2011 Canterbury, New Zealand, seismic sequence: Multiple source analysis from InSAR data and modeling. J. Geophys. Res. 2012, 117, B08305. [Google Scholar] [CrossRef]
- Kazama, M.; Noda, T. Damage statistics (Summary of the 2011 off the Pacific Coast of Tohoku Earthquake damage). Soils Found 2012, 52, 780–792. [Google Scholar] [CrossRef]
- Galadini, F.; Falcucci, E.; Gori, S.; Kayen, R.E.; Lingwall, B.; Pizzi, A.; Di Domenica, A.; Zimmaro, P.; Stewart, J.P.; Lanzo, G.; et al. Chapter 2: Seismic source and surface rupture. In Engineering Reconnaissance Following the 2016 Central Italy Earthquakes, 2nd ed.; Zimmaro, P., Stewart, J.P., Eds.; No. GEER-0500; Geotechnical Extreme Events Reconnaissance Association: Hurricane, Sandy, 2017; pp. 33–50. [Google Scholar]
- Ji, D.; Wen, W.; Zhai, C.; Katsanos, E. Maximum inelastic displacement of mainshock-damaged structures under succeeding aftershock. Soil Dyn. Earthq. Eng. 2020, 136, 106248. [Google Scholar] [CrossRef]
- Wen, W.; Ji, D.; Zhai, C. Ground motion rotation for mainshock-aftershock sequences: Necessary or not? Soil Dyn. Earthq. Eng. 2020, 130, 105976. [Google Scholar] [CrossRef]
- Amiri, S.; Bojórquez, E. Residual displacement ratios of structures under mainshock-aftershock sequences. Soil Dyn. Earthq. Eng. 2019, 121, 179–193. [Google Scholar] [CrossRef]
- Shokrabadi, M.; Burton, H.V.; Stewart, J.P. Impact of sequential ground motion pairing on mainshock-aftershock structural response and collapse performance assessment. J. Struct. Eng. 2018, 144, 04018177. [Google Scholar] [CrossRef]
- Shokrabadi, M.; Burton, H.V. Risk-based assessment of aftershock and mainshock-aftershock seismic performance of reinforced concrete frames. Struct. Saf. 2018, 73, 64–74. [Google Scholar] [CrossRef]
- Zhang, L.; Goda, K.; Luca, F.D.; De Risi, R. Mainshock-aftershock state-dependent fragility curves: A case of wood-frame houses in British Columbia, Canada. Earthq. Eng. Struct. Dyn. 2020, 49, 884–903. [Google Scholar] [CrossRef]
- Hosseinpour, F.; Abdelnaby, A.E. Fragility curves for RC frames under multiple earthquakes. Soil Dyn. Earthq. Eng. 2017, 98, 222–234. [Google Scholar] [CrossRef]
- Chen, X.; Xiang, N.; Guan, Z.; Li, J. Seismic vulnerability assessment of tall pier bridges under mainshock-aftershock-like earthquake sequences using vector-valued intensity measure. Eng. Struct. 2022, 253, 113732. [Google Scholar] [CrossRef]
- Hashemi, S.V.; Pouraminian, M.; Sadeghi, A. Equipped with Seismic Fragility Curve Development of Frames with BRB’s Equipped with Smart Materials subjected to Mainshock-Aftershock Ground Motion. J. Struct. Constr. Eng. 2021, 8, 76–95. [Google Scholar] [CrossRef]
- Massumi, A.; Sadeghi, K.; Ghojoghi, O. Effect of Aftershock Characteristics on the Fragility Curve of Post-Mainshock RC Frames. Res. Sq. 2021, 1–24. [Google Scholar] [CrossRef]
- Irfan, Z.; Abdullah, A.; Afifuddin, M. Development of fragility curve based on incremental dynamic analysis curve using ground motion Aceh earthquake. In Proceedings of the E3S Web of Conferences, EDP Sciences, Bandung, Indonesia, 11–12 October 2022; Volume 340, p. 02001. [Google Scholar] [CrossRef]
- Movaghati, S.; Abdelnaby, A. Advancements in fragility analysis using numerical calibration methods for a horizontally curved RC bridge. Eng. Struct. 2016, 125, 236–243. [Google Scholar] [CrossRef]
- Lombardi, L.; Luca, F.D. Derivation of fragility curves at design stage through linear time-history analysis. Eng. Struct. 2020, 219, 110900. [Google Scholar] [CrossRef]
- Forcellini, D. Analytical fragility curves of shallow-founded structures subjected to Soil-Structure Interaction (SSI) effects. Soil Dyn. Earthq. Eng. 2020, 141, 106487. [Google Scholar] [CrossRef]
- Dong, Y.; Frangopol, D.M.; Saydam, D. Sustainability of highway bridge networks under seismic hazard. J. Earthq. Eng. 2014, 18, 41–66. [Google Scholar] [CrossRef]
- Pang, Y.; Wang, X. Cloud-IDA-MSA Conversion of Fragility Curves for Efficient and High-Fidelity Resilience Assessment. J. Struct. Eng. 2021, 147, 04021049. [Google Scholar] [CrossRef]
- Bao, X.; Jin, L.; Liu, J.; Xu, L. Framework for the mainshock-aftershock fragility analysis of containment structures incorporating the effect of mainshock-damaged states. Soil Dyn. Earthq. Eng. 2021, 153, 107072. [Google Scholar] [CrossRef]
- Nazari, N.; De Lindt, J.W.; Li, Y. Effect of mainshock-aftershock sequences on wood frame building damage fragilities. ASCE J. Perform. Constr. Facil. 2015, 29, 04014036. [Google Scholar] [CrossRef]
- Jalayer, F.; Ebrahimian, H. Seismic risk assessment considering cumulative damage due to aftershocks. Earthq. Eng. Struct. Dyn. 2017, 46, 369–389. [Google Scholar] [CrossRef]
- Han, R.; Li, Y.; Van de Lindt, J. Assessment of seismic performance of buildings with incorporation of aftershocks. J. Perform. Constr. Facil. 2015, 29, 04014088. [Google Scholar] [CrossRef]
- Rosti, A.; Del Gaudio, C.; Rota, M.; Ricci, P.; Di Ludovico, M.; Penna, A.; Verderame, G.M. Empirical fragility curves for Italian residential RC buildings. Bull. Earthq. Eng. 2021, 19, 3165–3183. [Google Scholar] [CrossRef]
- Wen, W.; Zhai, C.; Ji, D.; Li, S.; Xie, L. Framework for the vulnerability assessment of structure under mainshock-aftershock sequences. Soil Dyn. Earthq. Eng. 2017, 101, 41–52. [Google Scholar] [CrossRef]
- Park, Y.J.; Ang, A.H.; Wen, Y.K. Seismic damage analysis of reinforced concrete buildings. J. Struct. Eng. 1985, 111, 740–757. [Google Scholar] [CrossRef]
- Kunnath SEl-Bahy, A.; Taylor, A.; Stone, W. Cumulative Seismic Damage of Reinforced Concrete Bridge Piers, NIST Interagency/Internal Report (NISTIR); National Institute of Standards and Technology: Gaithersburg, MD, USA, 1997. [CrossRef]
- Hose, Y.D.; Seible, F. Performance Evaluation Database for Concrete Bridge Components and Systems under Simulated Seismic Loads; Pacific Earthquake Engineering Research Center: Berkeley, CA, USA, 2000; Volume 16, pp. 413–442. [Google Scholar] [CrossRef]
- Yu, X.; Lu, D.; Xiao, H. Incremental damage spectrum of mainshock-aftershock sequence type ground motions. Eng. Mech. 2017, 34, 47–53. [Google Scholar]
- Cavalieri, F.; Correia, A.A.; Crowley, H.; Pinho, R. Seismic fragility analysis of URM buildings founded on piles: Influence of dynamic soil–structure interaction models. Bull. Earthq. Eng. 2020, 18, 4127–4156. [Google Scholar] [CrossRef]
- He, X.; Lu, Z. Seismic fragility assessment of a super tall building with hybrid control strategy using IDA method. Soil Dyn. Earthq. Eng. 2019, 123, 14. [Google Scholar] [CrossRef]
- Mackie, K.R.; Stojadinovi, C.B. R-factor parameterized bridge damage fragility curves. J. Bridge Eng. 2007, 12, 500–510. [Google Scholar] [CrossRef]
- Federal Emergency Management Agency. HAZUS99 Use’s Manual; Federal Emergency Management Agency: Washington, DC, USA, 1999.
- Kent, D.C. Inelastic Behavior of Reinforced Concrete Members with Cyclic Loading; University of Canterburry: Christchurch, New Zealand, 1969. [Google Scholar] [CrossRef]
- Dhakal, R.; Maekawa, K. Modeling for Post-yield Buckled of Reinforcement. J. Struct. Eng. 2002, 128, 1139–1147. [Google Scholar] [CrossRef]
- Utsu, T. A statistical study on the occurrence of aftershocks. Geophys. Mag. 1961, 30, 521–605. [Google Scholar]
- Han, R. Performance-Based Engineering for Evaluation and Retrofitting Non-Ductile Reinforced Concrete Buildings Incorporating Aftershock Hazard. Michigan Technological University. 2015. Available online: https://www.researchgate.net/publication/304089902 (accessed on 1 September 2015).
- Mackie, K.R.; Stojadinović, B. Performance-based seismic bridge design for damage and loss limit states. Earthq. Eng. Struct. Dyn. 2007, 36, 1953–1971. [Google Scholar] [CrossRef]
- Padgett, J.E.; Nielson, B.G.; DesRoches, R. Selection of optimal intensity measures in probabilistic seismic demand models of highway bridge portfolios. Earthq. Eng. Struct. Dyn. 2008, 37, 711–725. [Google Scholar] [CrossRef]
- Yuan, W.; Wang, Z.; Pang, Y.; Zhong, J. Seismic fragility analysis of a continuous girder bridge subject to an earthquake mainshock-aftershock sequence. J. Harbin Eng. Univ. 2016, 37, 1671–1676. [Google Scholar]


| Damage Level | Damage Characteristics | Damage Index |
|---|---|---|
| Basically intact | Microcracks appear | 0~0.1 |
| Minor damage | Locally through micro cracks appear and the longitudinal bars yield | 0.1~0.25 |
| Medium damage | The cracks developed significantly and the concrete protective layer began to fall off | 0.25~0.4 |
| Serious injury | The crack widens sharply, and the partial concrete protective layer falls off | 0.4~0.8 |
| Completely destroyed | Stirrup fracture or longitudinal reinforcement Buckling fracture, the core area concrete is crushed | ≥0.8 |
| Category | d (mm) | fy (Mpa) | fu (Mpa) | εsh | εsu | Es (Mpa) | Esh (Mpa) | ρ (%) |
|---|---|---|---|---|---|---|---|---|
| Longitudinal | 28 | 400 | 540 | 0.04 | 0.15 | 200,000 | 4000 | 1.0~4.0 |
| Stirrup | 16 | 335 | 455 | 0.04 | 0.15 | 200,000 | 4000 | 1.5 |
| c (mm) | fcc (Mpa) | fcu (Mpa) | εcc | εcu | Ec (Mpa) | \ | \ | |
| Confined concrete | 45 | 26.80 | 21.44 | 0.0014 | 0.004 | 32500 | \ | \ |
| Cover concrete | 1510 | 41.90 | 33.52 | 0.0053 | 0.022 | 32500 | \ | \ |
| Longitudinal Reinforcement Ratio | |||||||
|---|---|---|---|---|---|---|---|
| μ | 1.0% | 1.5% | 2.0% | 2.5% | 3.0% | 3.5% | 4.0% |
| 0.05 | 0.51 | 0.49 | 0.48 | 0.47 | 0.45 | 0.44 | 0.43 |
| 0.10 | 0.72 | 0.70 | 0.68 | 0.66 | 0.64 | 0.62 | 0.61 |
| 0.15 | 0.91 | 0.87 | 0.84 | 0.82 | 0.79 | 0.77 | 0.75 |
| 0.20 | 1.06 | 1.02 | 0.99 | 0.95 | 0.93 | 0.90 | 0.87 |
| Axial Load Ratio | ||||
|---|---|---|---|---|
| PGA (g) | 0.05 | 0.10 | 0.15 | 0.20 |
| 0.10 | 6.24 | 2.87 | 3.88 | 3.49 |
| 0.15 | 6.01 | 5.19 | 4.73 | 5.41 |
| 0.20 | 6.46 | 7.85 | 7.36 | 7.84 |
| 0.25 | 10.41 | 9.42 | 8.77 | 8.79 |
| 0.30 | 12.74 | 10.16 | 8.41 | 6.55 |
| 0.35 | 12.09 | 9.69 | 8.40 | 5.65 |
| 0.40 | 11.76 | 8.42 | 5.45 | 4.35 |
| Seismic Acceleration | ||||||||
|---|---|---|---|---|---|---|---|---|
| Period | 0.1 g | 0.15 g | 0.20 g | 0.25 g | 0.30 g | 0.35 g | 0.40 g | |
| 6 | 0.31 | 2.13 | 3.23 | 2.22 | 7.84 | 11.71 | 13.27 | 14.79 |
| 10 | 0.68 | 2.17 | 3.54 | 5.73 | 9.17 | 8.25 | 8.49 | 8.17 |
| 14 | 1.14 | 1.18 | 1.67 | 9.17 | 5.84 | 6.73 | 7.69 | 5.84 |
| 16 | 1.69 | 1.49 | 3.74 | 3.53 | 4.17 | 1.92 | 2.50 | 2.79 |
| μ | ρ | MS | MS-AS | ||||
|---|---|---|---|---|---|---|---|
| a | Ln(b) | a | Ln(b) | ||||
| 0.05 | 1.0% | 1.645 | 0.600 | 0.875 | 1.679 | 0.733 | 0.885 |
| 1.5% | 1.513 | 0.203 | 0.871 | 1.542 | 0.318 | 0.882 | |
| 2.0% | 1.423 | -0.053 | 0.895 | 1.441 | 0.084 | 0.904 | |
| 2.5% | 1.343 | -0.254 | 0.892 | 1.346 | -0.198 | 0.901 | |
| 3.0% | 1.300 | -0.402 | 0.889 | 1.298 | -0.354 | 0.899 | |
| 3.5% | 1.273 | -0.523 | 0.884 | 1.266 | -0.480 | 0.900 | |
| 4.0% | 1.246 | -0.625 | 0.879 | 1.256 | -0.541 | 0.907 | |
| 0.10 | 1.0% | 1.558 | 1.116 | 0.844 | 1.602 | 1.256 | 0.856 |
| 1.5% | 1.534 | 1.031 | 0.864 | 1.565 | 1.146 | 0.874 | |
| 2.0% | 1.507 | 0.904 | 0.868 | 1.541 | 1.022 | 0.880 | |
| 2.5% | 1.457 | 0.711 | 0.868 | 1.491 | 0.826 | 0.881 | |
| 3.0% | 1.399 | 0.536 | 0.865 | 1.424 | 0.631 | 0.875 | |
| 3.5% | 1.343 | 0.386 | 0.861 | 1.372 | 0.484 | 0.878 | |
| 4.0% | 1.278 | 0.225 | 0.866 | 1.305 | 0.318 | 0.886 | |
| 0.15 | 1.0% | 1.382 | 1.181 | 0.784 | 1.399 | 1.263 | 0.801 |
| 1.5% | 1.401 | 1.149 | 0.815 | 1.431 | 1.257 | 0.833 | |
| 2.0% | 1.415 | 1.111 | 0.845 | 1.442 | 1.212 | 0.860 | |
| 2.5% | 1.395 | 1.047 | 0.854 | 1.425 | 1.148 | 0.866 | |
| 3.0% | 1.393 | 0.999 | 0.866 | 1.423 | 1.096 | 0.877 | |
| 3.5% | 1.387 | 0.924 | 0.868 | 1.415 | 1.020 | 0.881 | |
| 4.0% | 1.368 | 0.831 | 0.869 | 1.400 | 0.934 | 0.882 | |
| 0.20 | 1.0% | 1.297 | 1.217 | 0.765 | 1.300 | 1.272 | 0.774 |
| 1.5% | 1.288 | 1.190 | 0.778 | 1.300 | 1.258 | 0.792 | |
| 2.0% | 1.283 | 1.150 | 0.791 | 1.301 | 1.229 | 0.810 | |
| 2.5% | 1.286 | 1.106 | 0.812 | 1.303 | 1.184 | 0.834 | |
| 3.0% | 1.296 | 1.078 | 0.833 | 1.317 | 1.160 | 0.852 | |
| 3.5% | 1.306 | 1.048 | 0.847 | 1.330 | 1.133 | 0.863 | |
| 4.0% | 1.324 | 1.031 | 0.859 | 1.341 | 1.106 | 0.871 | |
| Earthquake Type | a | Ln(b) | ||
|---|---|---|---|---|
| 6 | MS | 1.519 | 0.277 | 0.850 |
| MS-AS | 1.590 | 0.473 | 0.869 | |
| 10 | MS | 1.507 | 0.904 | 0.868 |
| MS-AS | 1.541 | 1.022 | 0.880 | |
| 14 | MS | 1.277 | 0.746 | 0.748 |
| MS-AS | 1.302 | 0.842 | 0.764 | |
| 18 | MS | 1.164 | 0.748 | 0.683 |
| MS-AS | 1.170 | 0.789 | 0.689 |
Publisher’s Note: MDPI stays neutral with regard to jurisdictional claims in published maps and institutional affiliations. |
© 2022 by the authors. Licensee MDPI, Basel, Switzerland. This article is an open access article distributed under the terms and conditions of the Creative Commons Attribution (CC BY) license (https://creativecommons.org/licenses/by/4.0/).
Share and Cite
Wang, T.; Han, Q.; Wen, J.; Wang, L. Analysis of the Effect of Mainshock-Aftershock Sequences on the Fragility of RC Bridge Columns. Buildings 2022, 12, 1681. https://doi.org/10.3390/buildings12101681
Wang T, Han Q, Wen J, Wang L. Analysis of the Effect of Mainshock-Aftershock Sequences on the Fragility of RC Bridge Columns. Buildings. 2022; 12(10):1681. https://doi.org/10.3390/buildings12101681
Chicago/Turabian StyleWang, Tongxing, Qiang Han, Jianian Wen, and Lihui Wang. 2022. "Analysis of the Effect of Mainshock-Aftershock Sequences on the Fragility of RC Bridge Columns" Buildings 12, no. 10: 1681. https://doi.org/10.3390/buildings12101681
APA StyleWang, T., Han, Q., Wen, J., & Wang, L. (2022). Analysis of the Effect of Mainshock-Aftershock Sequences on the Fragility of RC Bridge Columns. Buildings, 12(10), 1681. https://doi.org/10.3390/buildings12101681