1. Introduction
Construction disputes are the manifestation of the opposition of interests, values or objectives [
1]. Conflicts and their consequential disputes in construction management are important because they may affect projects’ duration, cost, and profitability. On the one hand, the time and expenses spent on resolution and supporting the arguments increase the project quality, but on the other hand, the higher the dispute occurrence, the higher the overrun in time and cost, and even project failure. Resolving disputes, which are known as a major hindrance against the successful execution of projects [
2], is a tedious, complex, and costly process that ‘cause[s] long-term damage to the commercial relationship between the parties’ [
3]. More recent worldwide attention has focused on categorizing the fundamental aspects of conflicts, claims, and disputes, as well as their growing frequency, whereas disputes are almost predictable [
2]. Managers who hesitate to predict and take a precautionary attitude towards disputes are most likely to suffer from the undesirable consequences of inevitable disputes. ‘Unless disputes are resolved promptly, they tend to drag on, escalate, and ultimately require litigation proceedings for resolution’ [
4]. Thobakgale et al. (2014) enumerate some indirect costs that disputes pose to a project; namely, stress, fatigue, loss of future work, the cost of strained business relationships among the various parties, and tarnished reputation [
3].
According to Love et al. (2002), the expenses related to dispute resolution in projects can be divided into two main categories, namely direct and indirect costs. They accounted for fees and costs paid to lawyers, paralegals, accountants, and claims consultants, amongst direct costs related to dispute resolution. Salaries and the associated overhead of in-house lawyers, company managers, and other employees involved in processing the dispute comprise the indirect costs [
5]. They also considered long-term indirect costs, such as lost productivity, loss of future opportunity, reduced profit, and damaged reputation [
6]. Love et al. (2010) estimated that dispute costs burdened by both sides of the dispute ranged from 0.5% to 5% of the project’s contract value. Litigation expenses could amount at 5% of the contract value, while the indirect costs could be as high as 30% of a contract’s value [
5]. Hence, considering the total 2019 construction starts in Australia is estimated at AUD 33.3 billion [
7], a remarkable amount of AUD 11.7 billion might be spent on dispute resolutions only in one year. In 2017, the global average dispute values reached USD 43.4 million, and the average length of disputes was prolonged to an average of about 14.8 months [
8]. Therefore, it is essential to track the principal causes of conflicts and disputes, classify them, and develop a prediction algorithm reflecting the local industry’s circumstances and culture. The current situation of dispute in Australia is summarized in
Table 1.
This study aims to analyze recent disputes raised in New South Wales (NSW), Australia, in order to categorize them and to model future trends through probability and frequency review. In this vein, this study focuses on disputes in NSW Australia from 2002 to 2021, which are departmentalized into five-year groups of 2002–2006, 2007–2010, 2011–2014, 2015–2019, and 2020–2021. The core questions investigated in this study are:
In most recent studies, dispute frequencies have been measured in different ways, such as statistical analysis or questionnaire surveys, which mainly focused on the root causes and methods for dispute resolution. For this study, an in-depth quantitative model was used to explore and analyze the inter-relationships between the causes which could be hidden contributory (hidden dimension) causes to provoke disputes. This thorough analysis armed with classifying and interpreting trial verdicts can help researchers to discover dispute triggers that need to be prevented. In addition to that, a careful study of hundreds of cases resulted in in-detail diagrams representing the most dispute-prone areas as well as the typical mindset of stakeholders.
The next section provides an overview of the previous studies in the field of claim management and dispute categorization. Then, the methodology applied to answer the research questions is described and finally findings are presented.
2. Literature Review and Previous Studies
The most available research on construction disputes focuses on resolving disputes rather than avoiding conflict and preventing disputes [
2]. A large and growing body of literature has investigated extensive lists or hierarchies of potential causes. These lists barely shed any light on how these causes are associated with a dispute. To understand the hidden causes and their relationship, Tanriverdi et al. (2021) proposed a causal map analysis to understand dispute emergence patterns [
9]. Tayeh et al. (2022) used the descriptive-analytical approach as well as a questionnaire for dispute resolution in Gaza Strip construction projects. A case study investigated types of bias, motives for bias, and bias-minimizing in an attempt to optimize construction project dispute resolution procedures [
10]. Fitriyanti and Adly (2022) and El-Sewafy et al. (2022) focused on the proactive approach of dispute boards in construction projects [
11,
12].
Addressing the most significant causes of rework that have not been discussed in the contract terms contained in New Zealand construction projects, Asadi et al. (2022) found ‘general conditions’ as the most crucial factor. They suggested the development of specific contractual clauses to prevent disputes [
13]. Abdul Nabi and El-adaway (2022) found payment holds and delays, lack of collaboration between project trades, delays in project completion, and poor communication between project participants as the most common causes of modular construction disputes in the US [
14]. Faraji et al. (2021) proposed a dispute breakdown structure (DBS) based on expert judgment for petroleum industry projects [
15].
There are many theorizing efforts on discovering and categorizing dispute causes around the world. Researchers tried to find and rank the main factors from different points of view. Kumaraswamy (1997) classified dispute causes into two major groups of root causes and proximate causes. According to Kumaraswamy (1997), there are 11 root causes: unfair risk allocation, unclear risk allocation, unrealistic targets (by client), uncontrollable external events, adversarial (industry) culture, unrealistic tender pricing, inappropriate contract type, lack of competence of project participants, lack of professionalism of project participants, client’s lack of information or decisiveness, and unrealistic information expectations. In addition to the root causes, Kumaraswamy classified 18 causes into the proximate category [
16].
Bagherian-Marandi et al. (2021) employed a two-layered fuzzy logic model to predict court decisions aiming at lessening the number of future disputes [
17]. Naji et al. (2020) proposed a basic step-by-step guidance framework and the associated dispute hybrid model formulating the likelihood of disputes [
2]. Regarding dispute likelihood estimation, Diekmann and Girard (1995) used a logistic regression model to identify projects with a high likelihood of contract disputes. They created a potential dispute index [
18]. To systematically find the casual hierarchical order of disputes, Pang and Cheung (2014) implemented a Fuzzy Fault Tree that showed dispute presidency and consequences graphically. Their framework assumed five layers of top event, category, factors group, factors, and artifacts [
19].
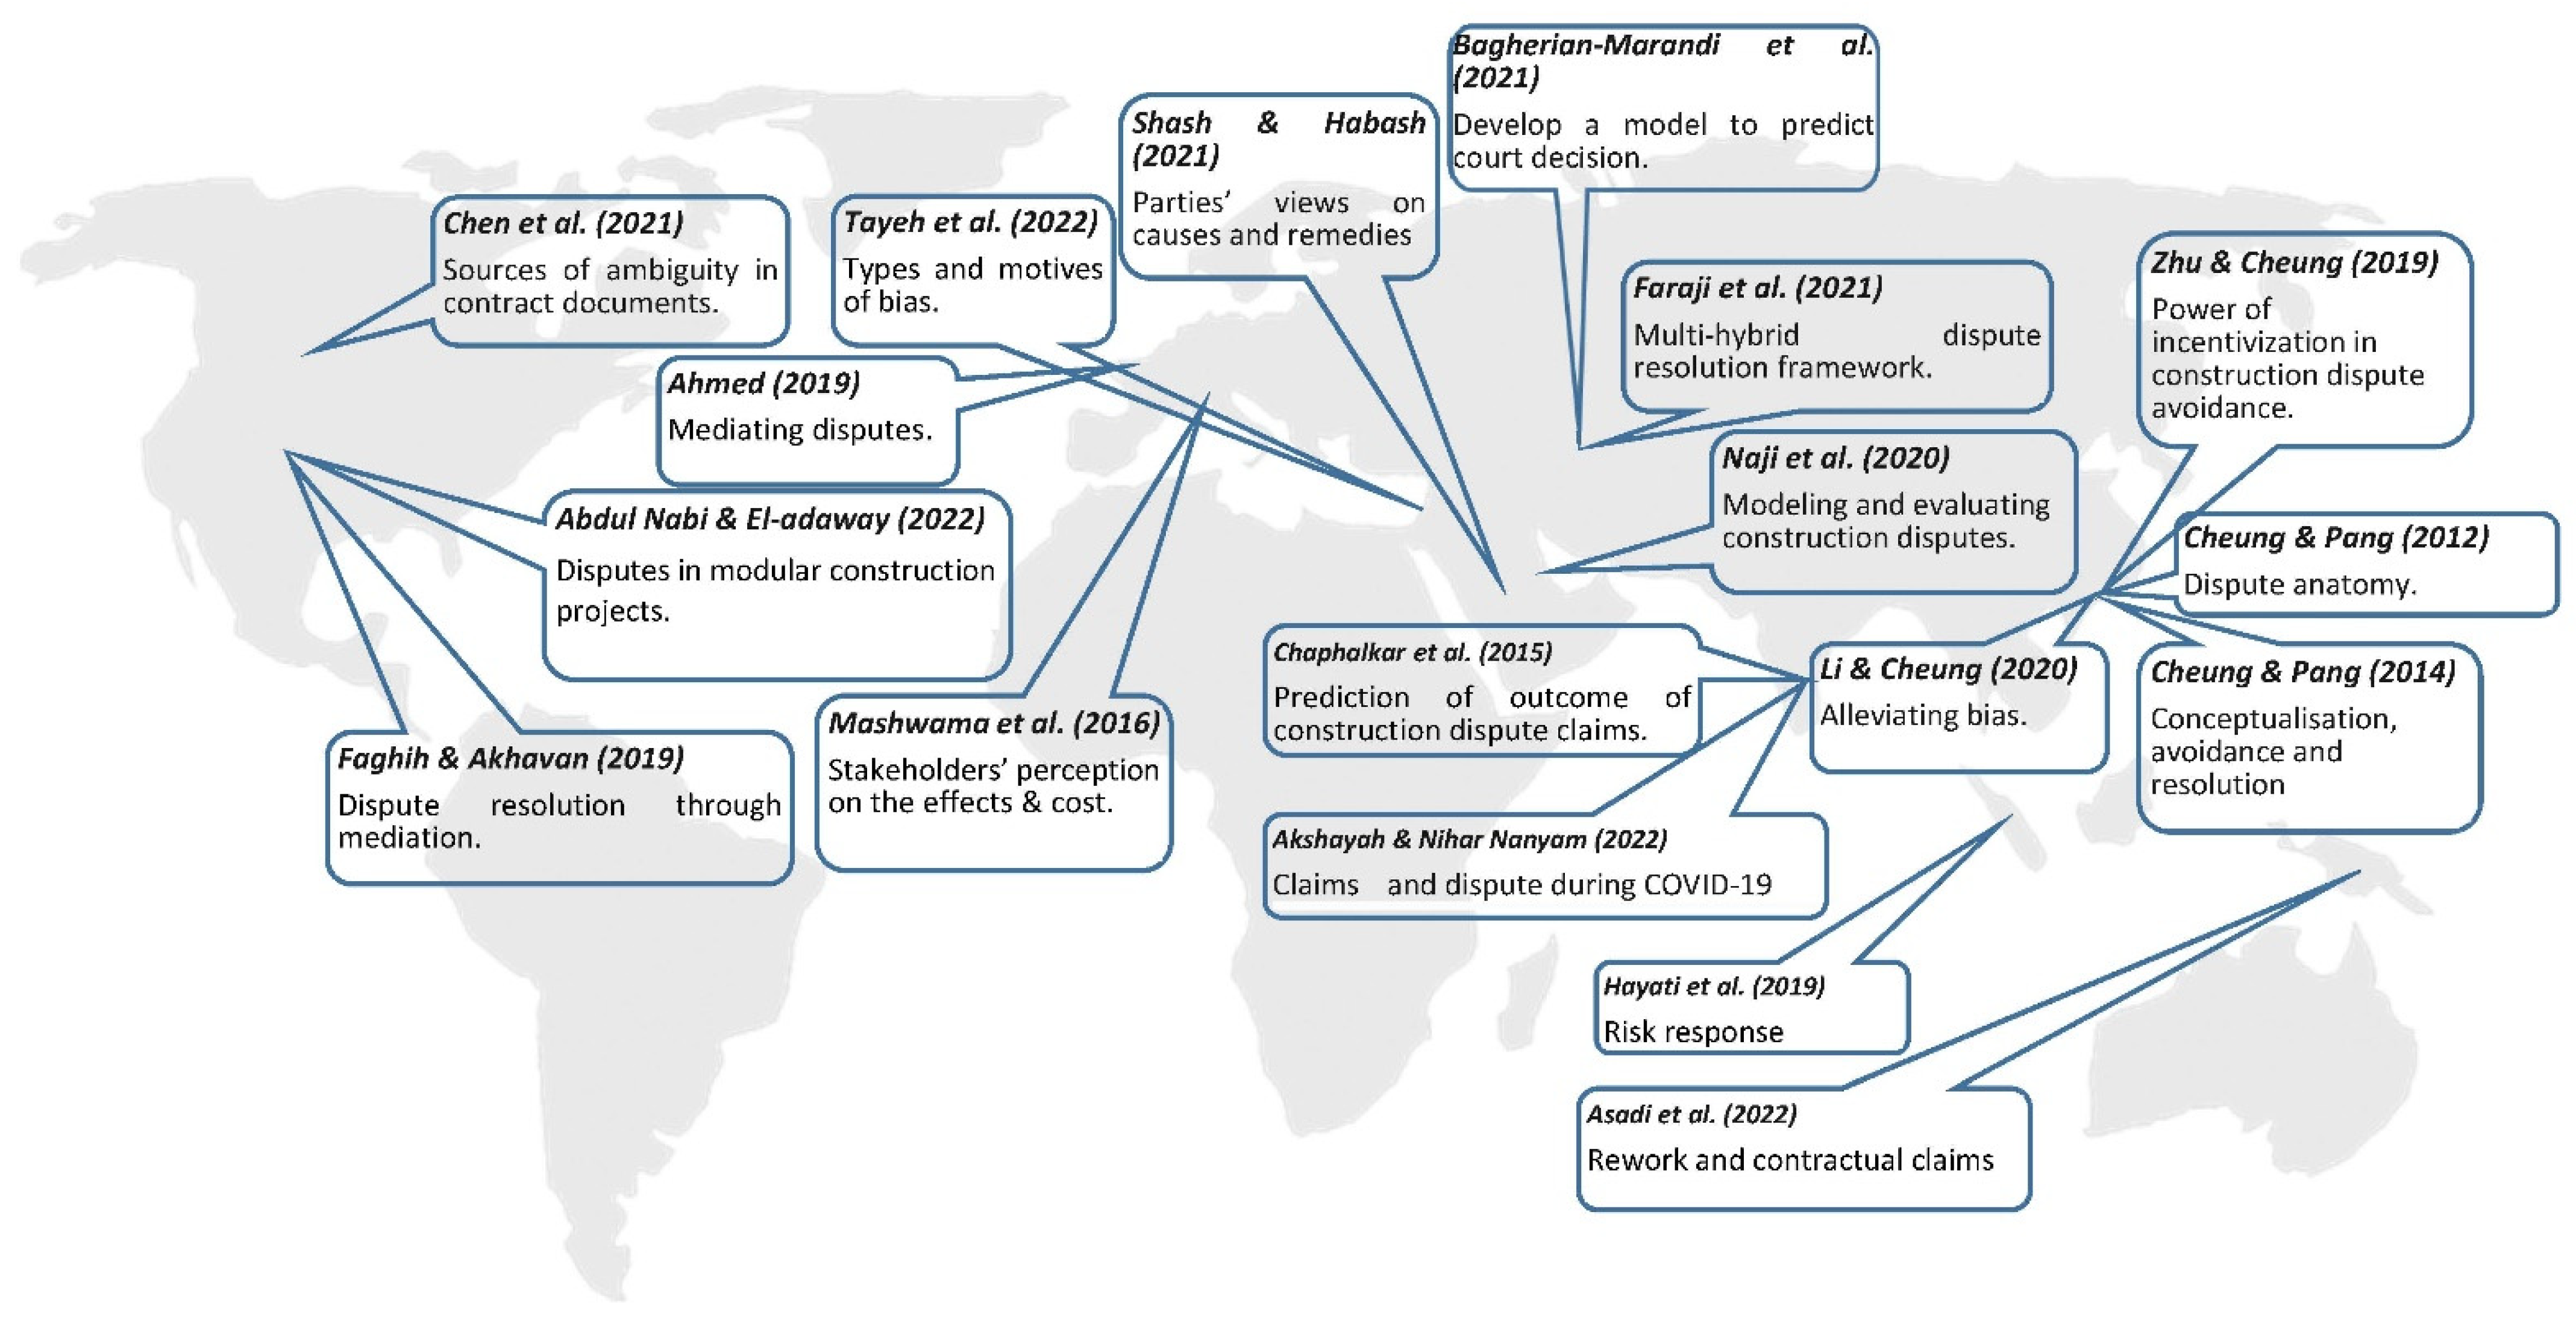
Figure 1 shows the most recent studies on construction disputes, and
Table 2 summarizes previous studies on identifying dispute factors and their categories in the construction industry.
2.1. Dispute versus Conflict
In order to devise an effective strategy for resolving disputes, the first step is narrowing down the definition of dispute because the use of interchangeable notions confuses project managers. Generally, a disagreement on legal duties or rights is defined as a dispute. A conflict arises when there are some friction between parties.
A conflict is provoked when different parties see the same situation differently [
2]. Fenn et al. (1990) stated that conflict exists wherever there is an incompatibility of interests, and therefore it is pandemic. Conflict can be managed, possibly to the extent of preventing a dispute resulting from the conflict [
33]. Unavoidable conflicts in construction projects result from complex situations due to the different complexity degrees among the project stakeholders and the differences in views as well as construction industry complications [
2]. In other words, construction dispute is the incompatibility of people’s interests, needs or goals [
1]. It is necessary to know which one is more fundamental to derive the dispute. Burton (1990) suggests a dispute can turn into a conflict, but a conflict barely develops into a dispute without intervention [
34]. While a variety of definitions have been suggested, this paper uses the PMBOK definition, stating that ‘contested changes and potential constructive changes are those requested changes where the buyer and seller cannot reach an agreement on compensation for the change or cannot agree that a change has occurred’. These contested changes are called claims. When they cannot be resolved, they become disputes and finally are appealed [
35].
Kumaraswamy (1997) supposes a claim as an intermediate stage between conflict and dispute. On the other hand, he believes that a conflict can lead to a claim or a dispute, but a claim only can lead to a dispute [
16]. Thus, recognizing conflicts prone to becoming a dispute is the final and most crucial step of conflict recognition. According to Burton (1990) [
34], a dispute is a short-term disagreement that can result in the disputants reaching some resolution; it involves negotiable issues. Conflict, in contrast, is long-term concerning deeply rooted issues that are seen as non-negotiable [
36]. Thus, the essence of being negotiable or non-negotiable is one of the most critical distinctions between a conflict and a dispute.
To recognize if the parties are in dispute, one should define the disagreement as negotiable. Therefore, being settled and deep-seated, long-term and non-negotiable interests are the characteristics of a conflict that resists the resolution (more extensive changes desired). On the contrary, a dispute is relatively easier to resolve and emerges in the short-term [
37]. Although dispute causes vary from one project to another, this paper has tried to present a systematic approach towards construction projects in NSW.
2.2. Bias in Dispute Resolution
Diekmann and Girard state ’people hold the key to avoiding contract disputes’[
18]. Cheung and Li (2019) considered four potential biases: preconception, self-affirmation, optimism, and interest-oriented in construction dispute resolution. They proved that bias is real in construction dispute resolution and early detection is crucial [
32]. Cheung and Pang (2014) categorized construction disputes into two main categories: speculative and contractual [
1]. Cheong and Ki (2022) assumed ownership, loss aversion, status quo bias, and strategic bargaining habit as four sources of the Endowment Effect (EE). They described EE disputes as when people need more to relinquish elements that they own than they desire to pay for the equivalent [
38]. With regards to preconception bias, Tayeh et al. (2022) found the most frequent motives for bias are ‘social status and mediation’ and ‘taking legal policies or positions for economic considerations’ by the arbitrator. They also suggested ‘allowing adequate time and effort in making decisions’ and ‘being rational and considering long-term benefit’ as the best approaches taken by the arbitrator to minimize bias [
10]. Cheong and Ki (2022) consider psychological bias/reactive devaluation (RD) as the inclination towards demoting negotiating counterparts’ value of offers. They enumerate reluctance to change, doubts about the counterpart’s ability, overconfidence, biased information processing and mistrust towards the counterpart as RD disputes [
38].
2.3. Triggers of Disputes
Investigating the dispute triggers is essential for success in fulfilling construction project targets [
2]. Cheung and Pang (2014) classified construction dispute factors as risk and uncertainty, collaborative conflict, ambiguity, deficiency, inconsistency, defectiveness, opportunistic behavior, and affective conflict [
1].
A detailed quantitative analysis of cases, dispute frequencies, causes and effect analysis as well as the resultant loop cause diagrams, could reveal the dispute triggers. The major categories which are the most frequent/probable grounds of dispute extracted from literature and to be investigated are as follows:
2.3.1. Finance, Cost, Payment and Reimbursement
Wang et al. (2005) ranked disputes on payment as the most common in international projects in China [
39]. Another type of dispute that is categorized under finance is cost-related ones. The term cost includes the cost of damages, defects, replacement, variations, lump-sum contract, etc. Ilter (2012) ranked payment the second in Turkey’s construction [
20]. Unrealistic tender pricing may arise disagreement between parties as clients are inclined to use traditional delivery methods in Australia [
40]. A competitive tendering process in which competitors try to win by the lowest price sounds the best for the client, but the lowest price does not necessarily result in the best value.
Not having a profound view and experience to evaluate interactions between project phases, materials, workforce, equipment, etc., may lead to an unrealistic price which is fraught with the possibility of disputes. Sabet et al. (2018) considered estimating errors, the unclear scope of work and potential change orders as the leading causes of tender disputes [
41]. Ilter (2012) found that payment disputes correlate positively with variations, inadequate technical specifications, unclear contractual terms, late employer instructions, and poor communication. Ilter sees this type of dispute mostly related to the employer or their consultants’ activity in design (preparation of the contract and technical documents) and construction phase [
20].
2.3.2. Time and Progress Disputes
Ilter (2012) ranked the disputes on time extension as the most frequent dispute category in Turkish construction [
20]. Wang et al. (2005) rated it as the third factor alongside the quality of work in international projects in China [
39]. Ilter stated ‘project duration and firm size are the other factors that show a positive correlation with time extension disputes’ [
20]. In this matter, Levin (1998) categorized significant causes as follows:
Restricted site access;
Late submittal reviews/approvals;
Uncertain or continually changing performance requirements;
Lack of necessary materials and/or equipment or test/meet the project’s performance requirements and lack of timely responses as owner-caused delays and slow labor production;
Defective equipment/materials;
Imprecise activity durations, or weak schedule practices as contractor-caused delays [
42].
Iyer et al. (2008) categorized delay-related disputes as handing over of site, release of mobilization advance, late receipt/checking of drawings, accidents, temporary stoppage, rework, and extra work [
43].
2.3.3. Quality and Defective Work Disputes
According to Levin (1998), two main features of a defective specification claim are (a) contractor is entitled to receive equitable adjustments for the cost incurred from the inception of the claim, and (b) the equitable adjustment that needs to include any and all increased costs that lead to defective specification claims [
42]. As mentioned before, Love et al. (2010) showed defective works as one of the two most significant dispute causes [
5]. Wang et al. (2005) ranked the quality of work factor as the third factor in international projects in China alongside the extension of time [
39], while Ilter (2012) classified the quality of work as the third rank of frequent categories in Turkey. Ilter found quality disputes are primarily associated with variations, inadequate technical specifications, the contractor’s technical capabilities, and poor communication [
20]. Illankoon et al. (2019) reported poorly managed construction process leading to shortage of resources and quality issues, the fifth rank of the significant causes of disputes in Sri Lanka [
44].
2.3.4. Organizational Deficiencies
Several apparent and inapparent leading causes of disputes are related to organization and organizational structures. Firms’ management practices significantly affect the probability of disputes. Documentation methods, consultancy services, policies, and procedures are some organizational practices that frequently cause disputes [
5].
2.3.5. Contract-Originated Disputes
Associated with the complex structure of the construction industry and the involvement of many people with different backgrounds, the probability of misconception of contractual language is high, especially in small contracts. For instance, in a 1983 court case in in the state of Victoria, a straightforward case of refusing to pay by the owner, was decided. The owner claimed the painting of his premises was sub-standard and not complete, whereas the contractor took it as completed. The implication of the terms ‘good’ and ‘completion’ was the basis for misunderstanding the quality of work. Apparently, from the contractor’s point of view, the owner’s expectation was beyond the standard, but the district court judge stated ‘the meaning of the terms of a contractual document is to be determined by what a reasonable person would have understood them to mean. That, normally, requires consideration of the text and the surrounding circumstances known to the parties and the purpose and object of the transaction […] In some joint judgments, the High Court has adopted an approach to statutory interpretation which requires attention to the broader context of the words in issue in the first instance, not only after some “ambiguity” has been identified’ [
45].
Chan et al. (2021) developed a framework based on a detailed analysis of Supreme Court cases to assess sources of ambiguity in construction contracts in Canada. They found 104 unique sources of ambiguity with ‘incomplete contract documents’ and ‘redundant information’ being the primary reasons [
46]. Concerning disputes in Australia’s construction industry, scope changes, erroneous documentation, ambiguous contract conditions [
5], contractual commitments, and the ambiguous language of the contract are the key contributors. A 2019 case before to the New South Wales Court of Appeal revealed that the New South Wales Supreme Court erred in finding that the common intention of the parties was not reflected in terms of the contract [
47]. Thus, the ambiguity of the contract might lead even an expert lawyer to misunderstand.
Imperfect contracts and unrealistic performance expectations are amongst the top causes which Diekmann et al. [
18] recognized. Similar causes have been addressed by Mitropoulos and Howell (2001) [
48] and Love et al. (2010) [
5]. Lack of information (which can lead to misunderstanding and consecutive disagreements) provokes almost all conflicts. On the other hand, if each party provides enough information, most disputes can be prevented because not knowing each party’s rights might cause disputes on construction projects. Precise and credible information is presumed that groups involved in construction directly affect their attitudes and behavior. Yates (2002) stated ambiguities, errors or omissions in the contract documentation, which come to light, necessitating clarification of the client/design team’s requirements and leading to adjustments [
49]. According to our analysis of cases, contract ambiguity has led to more than seven percent of contract-related cases in NSW (see
Table 3). In a 2012 dispute in NSW, setting aside a notice to produce was the primary claim leading to the dispute [
47]. Such a minor procedure in a small contract is avoidable because it does not impose any additional cost or human resources if the firm assigns duties to a proper person to perform it on time.
2.3.6. Scope and Variation Disputes
A study published by the Australian Contractors Association categorized ’change to scope’ as one of four main factors of disputes in the construction industry [
50]. Love et al. (2010) explained two primary causes of disputes: defective work and scope changes [
5]. Wang et al. (2005) ranked the variations as the second most frequent factor in international projects in China [
39]. Scope disputes cannot be separated from time, cost, and especially contract ambiguity disputes—our analysis showed that a minority of 2% of cases were linked to only scope-related disputes in NSW (
Table 3).
2.3.7. Cultural, Behavioral, and Communicational Traits
Some human mental and emotional aspects, such as personality, cultural background, social interaction, professional background, ambition [
16,
45], bossy attitude, frustration, and discontent are evaluated as primary causes of disputes. These factors are hard to quantify because of their qualitative nature. Hohns (1979) assumed construction as an art rather than a science [
21]. In addition to the personal characteristics of human beings, there are some other factors related to communication and commerce which should be taken into account. Ilter (2012) considered poor communication between parties as a factor in arising disputes. Ilter expressed ‘not surprisingly, poor communications between the project stakeholders also contribute to the escalation of payment disputes’ [
20]. Keeping parties and stakeholders integrated within the project could mitigate disputes because the more knowledge about the project situation, the less incommodity sense. However, keeping parties adequately informed is always neglected because of its time-consuming and costly nature.
2.3.8. Production of Documents
Design documents, drawings, and specifications comprise what is coined as document-related disputes. Let it not be unsaid that there are some disputes amongst implied joint venture or consortium documentation cases. Still, a substantial majority of document-related disputes arose from technical documents. The most frequent disputes in this group are related to parties’ opportunism behavior. Goffman (1970) says: ‘Opportunistic behavior involves making false or empty, that is, self-disbelieved, threats and promises in the expectation that individual advantage will thereby be realized’ [
51].
3. Methodology
To replicate human reasoning, a cognitive mapping/mind map is a method for distinguishing, investigating, clarifying, and making sense of complex problems [
52]. Eden et al. developed an interactive tool that sets a theoretical foundation for anticipating events and issues [
9,
53]. Based on this idea, causal maps were created that show impression as nodes and causal relationships as arrows [
9,
54,
55]. The conceptual model for causal predictive analysis in this research, a non-parametric multivariate method of Partial Least Square Structural Equation Modeling (PLS-SEM), adopts statistical methodologies meant to estimate a network of causal relationships [
56]. This method is used to predict and explore complex models ’with relaxed expectations on data’ [
57]. This method does not need any presumption regarding the data distribution [
58] rendering it a useful tool in social science [
59] to analyze quantitative data [
58] and analyze the relationships simultaneously [
60]. PLS-SEM is a reliable means ‘to resolve multifaceted procedure of associations and causal relationships that are otherwise hard to uncover’ [
58]. It is believed that PLS models produce more accurate estimates than models constructed upon covariance structure analysis (CVA) using maximum likelihood estimation (MLE), because PLS evaluates structural equation model path coefficients [
61,
62]. According to Hair et al. (2014), this method is suitable for non-normal data, small sample sizes, and formatively measured constructs [
63]. Thus, PLS is selected as the preferred option for this research. With regards to detecting mediation effects, according to Ramli et al. (2018), PLS-SEM analysis produces less inconsistent results than regression analysis [
60]. Collected and screened data feed the Smart PLS-.4© software package developed by SmartPLS GmbH to analyze the relationship between causes and disputes. According to Hair et al. (2014), three steps were followed [
63], namely model specification, outer model evaluation and inner model evaluation. Since there are few commonalities rules to classify disputes [
2], the basic steps to pursue the underlying causes and find the foremost reasons is planned as follows:
Discipline-based analysis: managerial level in organization or professional fields and how to deal with disputes between disciplines and professions;
Trends and attributes analysis;
Mind-set-based disputes: i.e., misunderstanding or different ways of thinking of legal terms;
Alarming frequency;
Verdict-based analysis: the case laws and their final verdicts can lead us to a pattern to anticipate and deal with future disputes.
Then, the decision-making theory was developed after finding, categorizing, and analyzing former disputes. Hence, based on actual disputes, we developed a systematic approach to set a threshold of disputes and anticipate the probability of their occurrence. Being aware of the threshold of bringing a dispute to the court is essential for any manager or firm, which acts like an alarm, notifying the organizational system to take the right action at the right time.
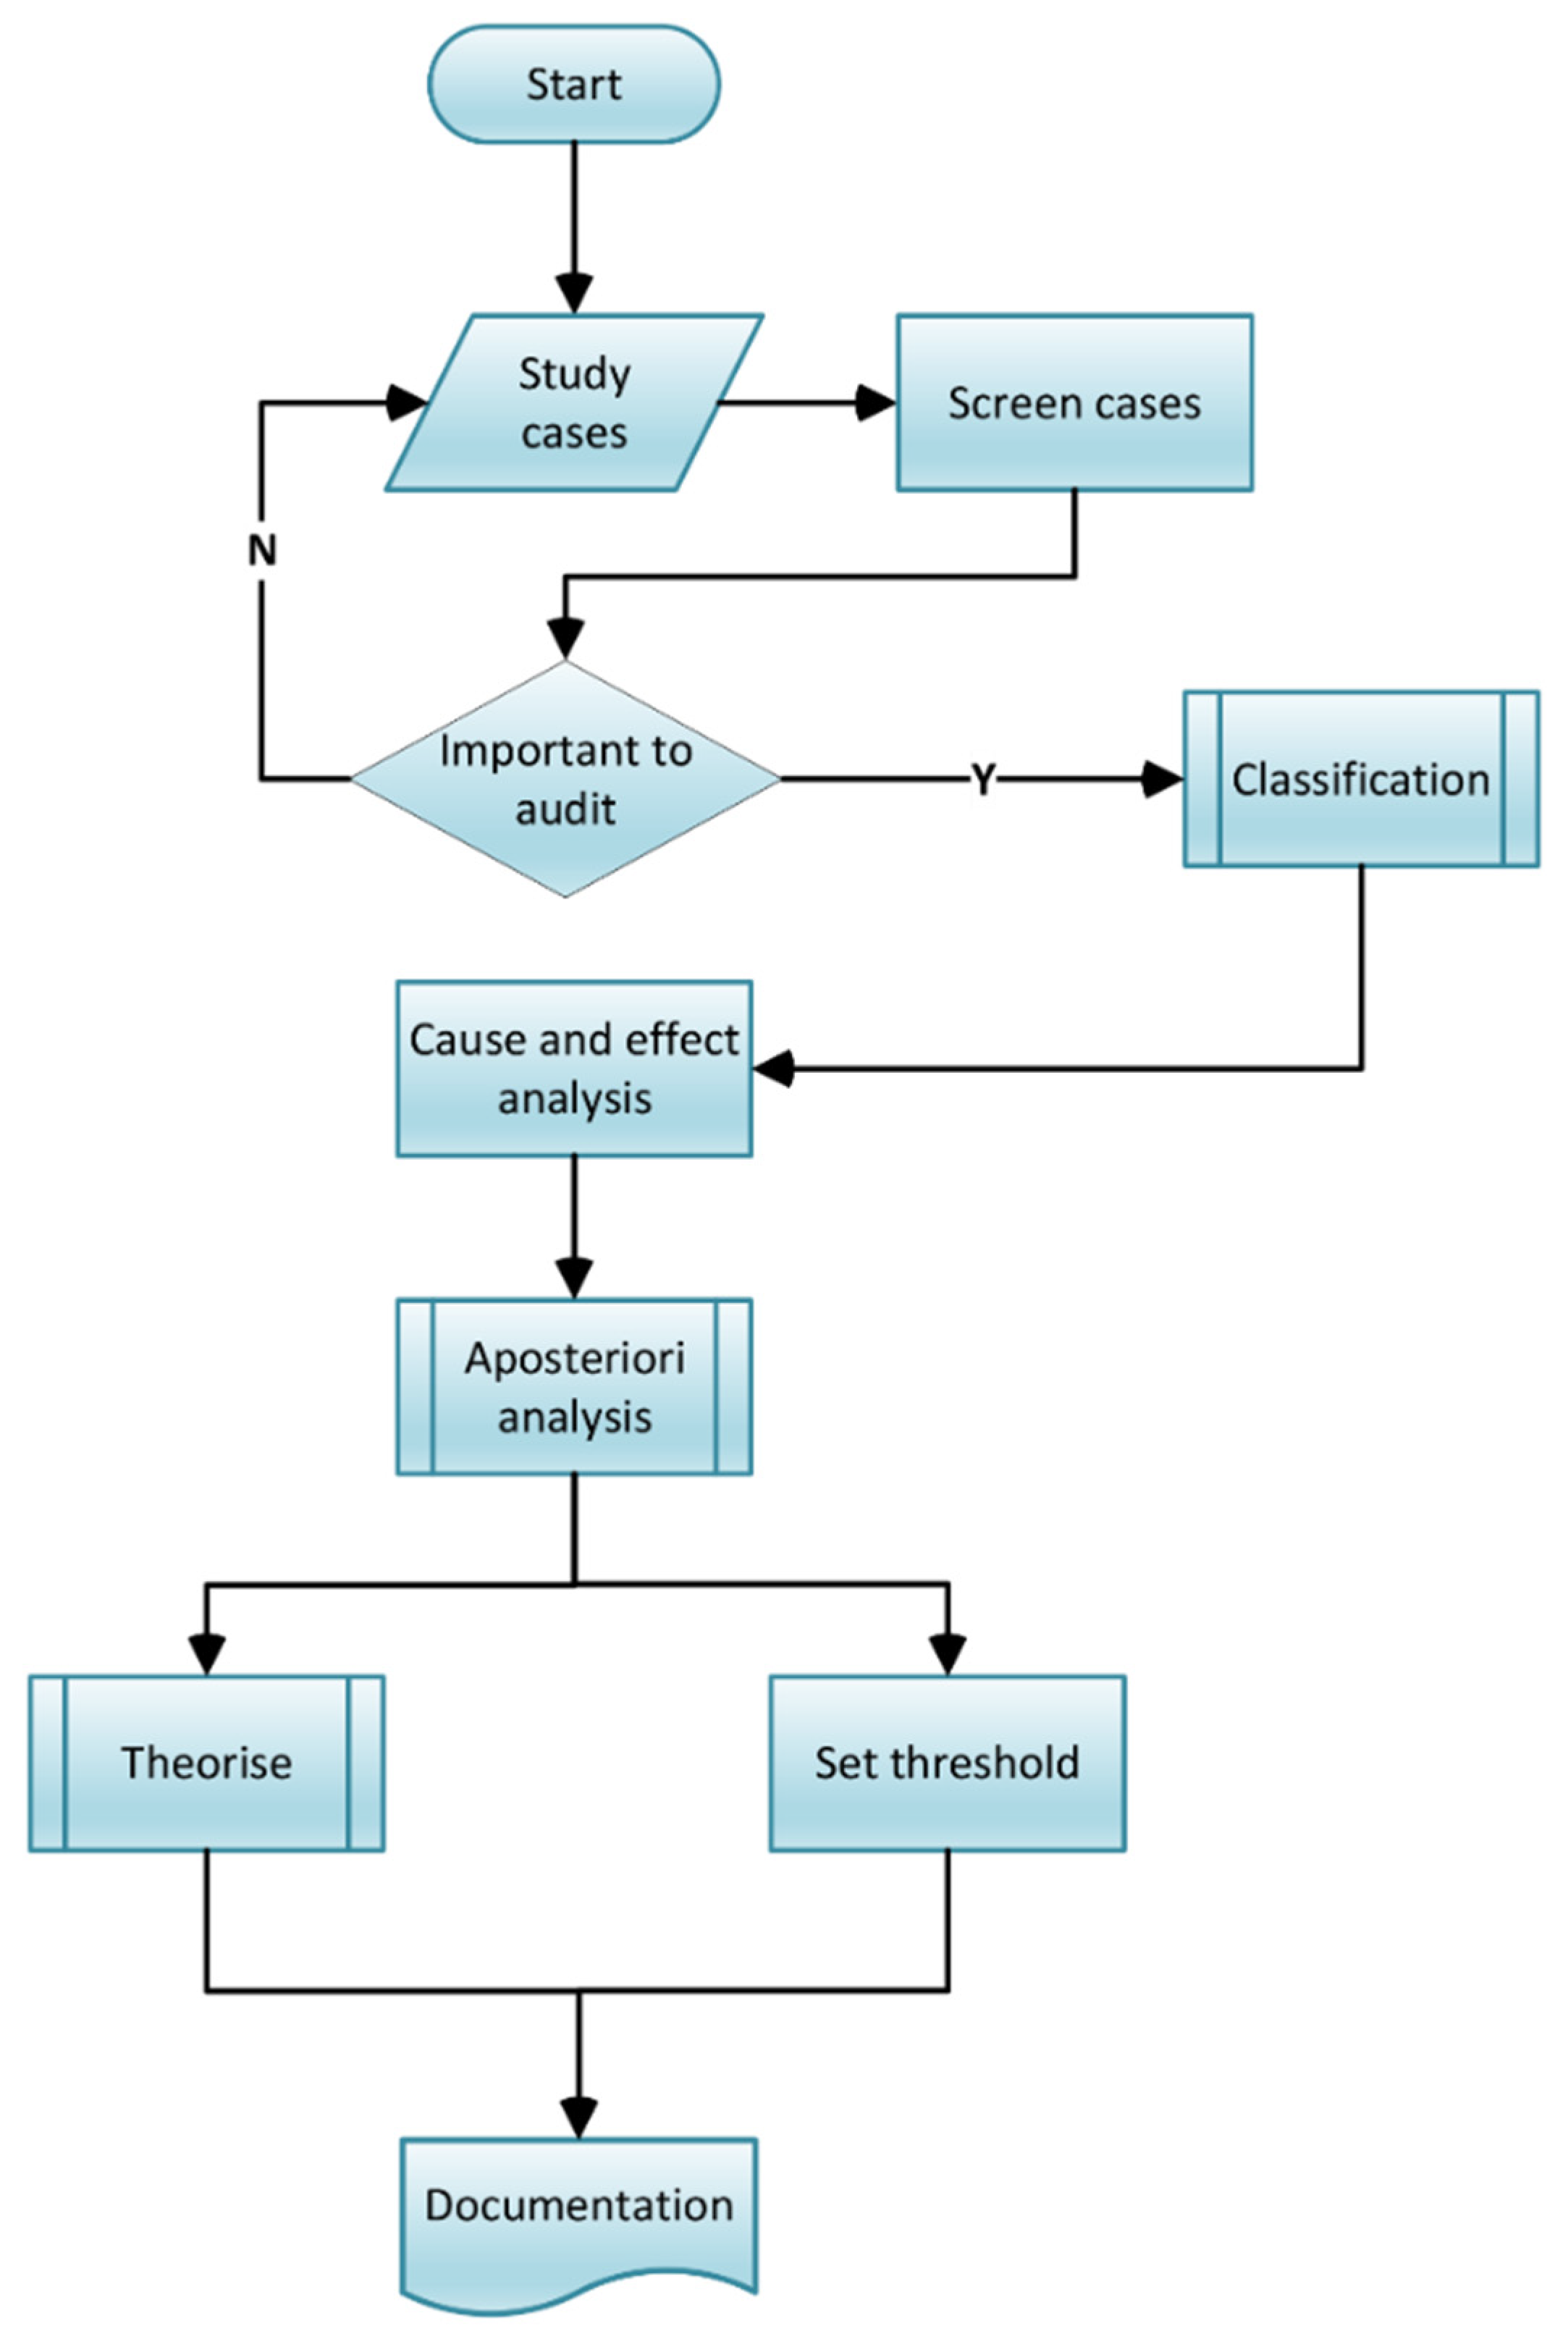
An in-depth literature survey was conducted to produce a comprehensive set of dispute causes recognized by the research community. Then, the most frequent ones in NSW cases were chosen to be analyzed. A total of 230 law cases (specifically the High Court litigations) in NSW between 2002 and 2021 (
) were studied. In this study, several databases, reports, and analyses conducted by lawyers are used. Besides information extracted from legal commentaries and reports, the LexiNexis
© database was used for case details. After finding parallelism between cases and classifying them according to causes, discipline, sector and frequency, we turn the focus on discovering correlations between disputes. The flowchart shown in
Figure 2 shows the steps of data collection and analysis.
Firstly, a profound study of construction-related litigations was performed (design, construction and operation phases). After screening the cases, data derived from cases were classified according to the type of contract, reason for arising conflicts, disciplines, outcomes, length of the dispute, impacts, probability of misunderstanding, etc. Comparative and in-depth quantitative analysis revealed several interrelations between parameters.
After grouping the causes and before PLS-SEM modelling, to have a systematic analysis and modelling that can validate the outer and inner model, the authors conducted a correlation and cause and effect analysis by the DEMATEL
© method, originally developed by Fonetla and Gabus in the 1970s. This method is a useful tool, applicable to setting up a network of relations, highlighting the internal relationships among the attributes [
64]. As Si et al. (2018) considered, the DEMATEL technique effectively identifies cause and effect chains in complex systems [
65], especially in finding the network of interdependent or mutual relationships amongst cause factors. In this research, instead of expert voting, the frequency of the causes was used to feed the DEMATEL system and PLS-SEM subsequently. Therefore, the frequency of any cause was considered as a comparison scale. Therefore, instead of a discrete five-scales system, we used a continuous series of integers (the number of cases or verdicts referred to a given cause).
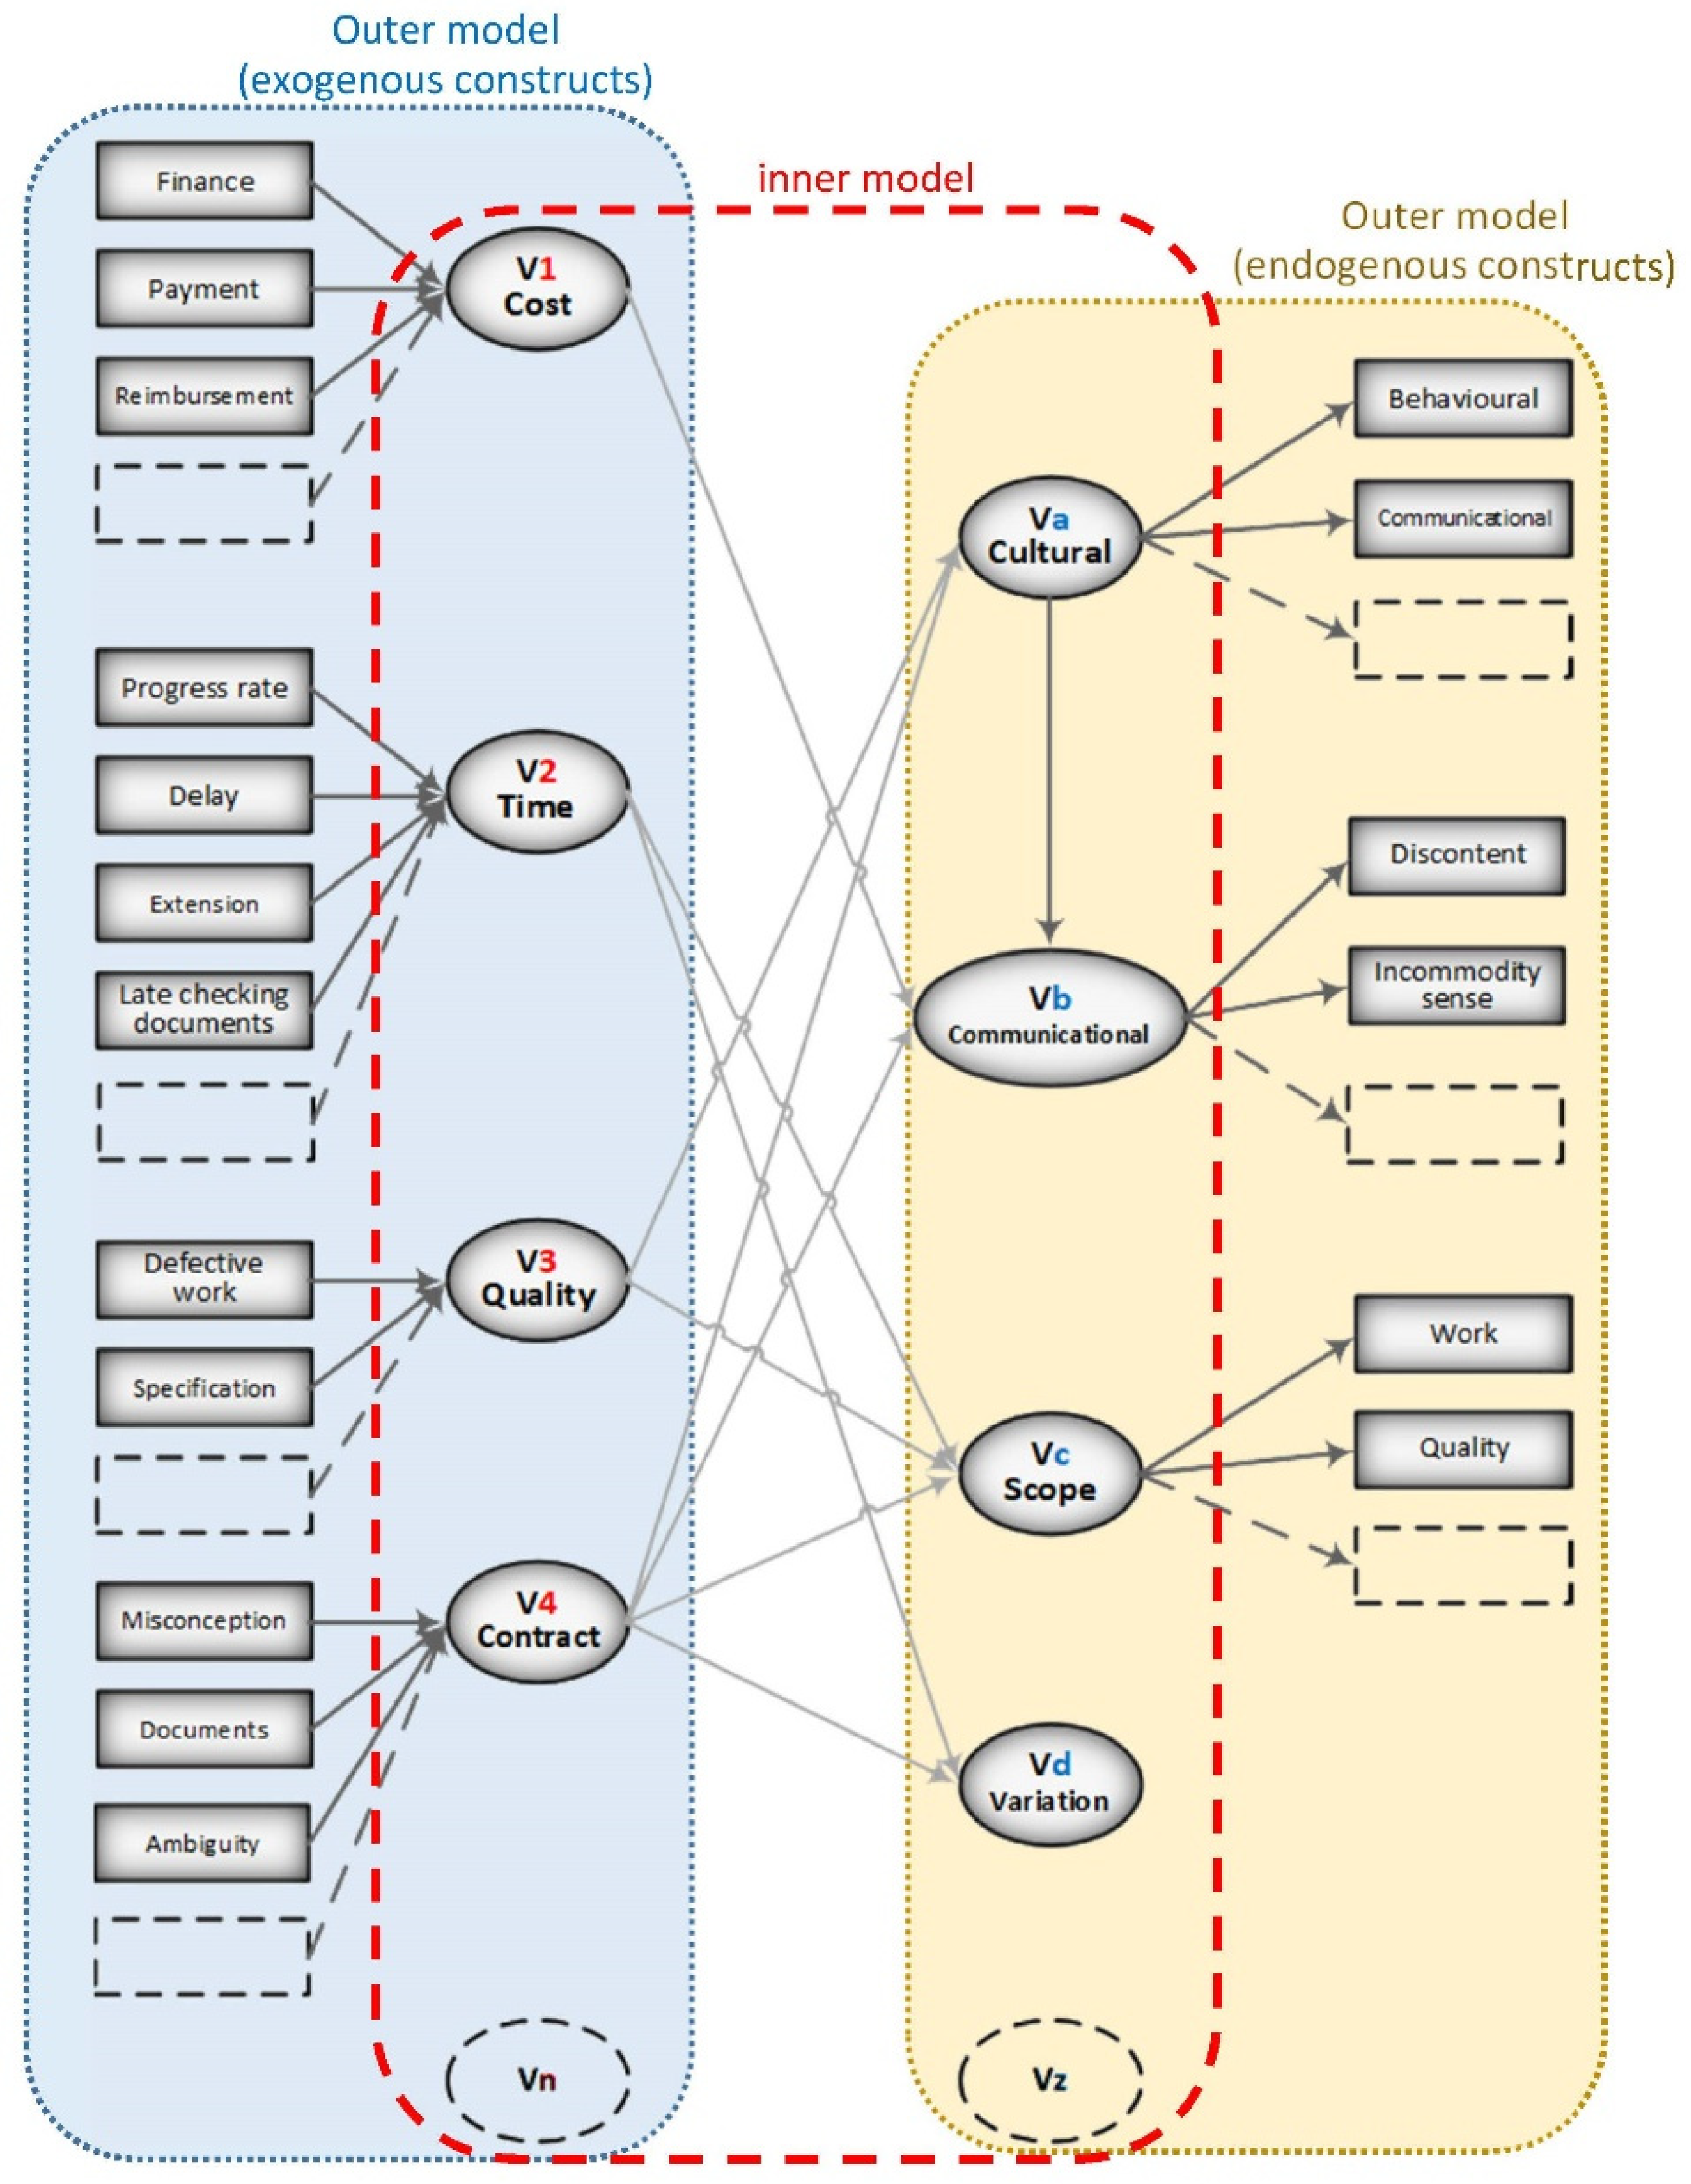
3.1. Model Specification
Each SEM model consists of two sub-models: the structural and measurement models [
56]. The inner (structural) model demonstrates the relationships between the constructs. The outer (measurement) models assess the relationships between the indicator variables and their interrelated construct [
63]. The first step is to create a path model that logically connects variables and constructs [
66]. Constructs are considered either exogenous (e.g., cost in
Figure 3) independent variables or endogenous defined by other constructs (e.g., communicational in
Figure 3) or both (e.g., cultural in
Figure 3) [
63]. The structural model is generally formulated as shown in Equation (1) [
56]:
where
ξj is the generic endogenous latent variable,
βqj is the generic path coefficient (interrelating the
q-th exogenous latent variable to the
j-th endogenous one), and
ϛj is the error in the inner relation. Dillon–Goldstein’s rho introduced by Wertz et al. (1974) is used to check a model’s reliability (i.e., if the model is developed homogeneously and is unidimensional). Dillon–Goldstein’s rho, also known as composite reliability, is a better indicator than Cronbach’s alpha as it is constructed based on the results from the model [
56,
67]. Dillon–Goldstein’s rho can be calculated as presented in Equation (2). According to Vinzi et al. (2010), a block is homogenous if
ρ ≥ 0.7 [
56]. For the model assembled in this study, the average
ρ is 0.81:
where
λpq is the loading associated with the
p-th manifest variable in the
q-th block.
The second step is specifying the outer models that require making a few decisions, such as using a multi-item or single-item scale [
63,
68]. After determining the outer models, they were evaluated by running the algorithm [
69]. The results obtained from this iteration are the basis of checking the reliability and validity of the construct measures. These results helped us characterize reflectively, and formatively measured constructs [
63,
70]. The results from this step were checked against the human-extracted relationship between cases. In addition to the classic PLS-SEM model, the authors adopted a moderator multi-group analysis due to the complexity and interrelationship between causes [
63,
71].
3.2. Model Evaluation
A model’s predictive accuracy is assessed by the Coefficient of Determination
(R2) which displays the exogenous variable’s connected effect on the endogenous ones [
63]. This coefficient that helps assess the quality of a PLS model [
63,
72], ranges from 0 to 1. For this study, the
R2 ≅ 0.73 shows a substantial predictive accuracy [
72,
73]. In addition to
R2, to evaluate the inner model’s predictive relevance, Cross-Validated Redundancy (
Q2) is helpful since it is made on sample re-use by excluding only pieces of each respondent’s data [
74] and approximates ‘the model parameters and predicts the omitted part using the estimates’[
63]. The higher the
Q2, the higher the predictive relevance [
63,
71]. In this project, the
Q2 is calculated to equal 0.59. After constructing and running the PLS model, the authors calculated the path coefficients, which describe the presumed relationships between the constructs [
63]. The average path coefficient for models presented in this research is +0.79 showing harmonious positive relationships [
56]. In addition to the mentioned coefficients, for each path model, effect size (
f2) can be worked out by calculating Cohen’s
f2. The
f2 is calculated by observing the change in
R2 when a construct is excluded from the model.
f2 can be calculated by Equation (3) [
63]. In this study, the average
f2 is 0.51. This value signifies a large effect size as it is interpreted as approximately moderate (
f2 ≥ 0.15) to large (
f2 ≥ 0.35) effect sizes [
75].
where
R2included is the full model and
R2excluded is the exact model that leaves out a selected exogenous construct.
4. Data Analysis and Results
Following the study of NSW construction case laws, it is found that the four items out of 11 causes mentioned in the literature are the most frequent triggers of disputes in the NSW construction industry. As conflict management is an essential element of project performance, defining, predicting, and managing potential disputes is crucial. There are commonly identified causes that give rise to claims and disputes in NSW. Based on the data analysis, these causes are categorized into 13 major groups, summarized in
Table 3.
Preliminary analysis shows that dispute occurrence is independent of time. Thus, the process could be assumed as weak stationary ergodic as it satisfies the conditions stated in Equation (4):
where
E(
y) is the expectation average,
δ is a constant.
4.1. Frequency and Future Likelihood Assessment
According to Pang and Cheung (2014), vigorousity and frequency of disputes ‘depend on the attitude, behavior, knowledge, and experience of the people involved’ [
19]. Therefore, in this study, we calculated the dispute frequencies holistically. In that respect, some researchers have applied discrete modelling [
18]. As shown in
Table 3, the highest rate of disputes has occurred in the most recent years. The occurrence of the equivalent of nearly two decades of disputes in just the past four years shows that the probability, causes and uncertainties in disputes are soaring.
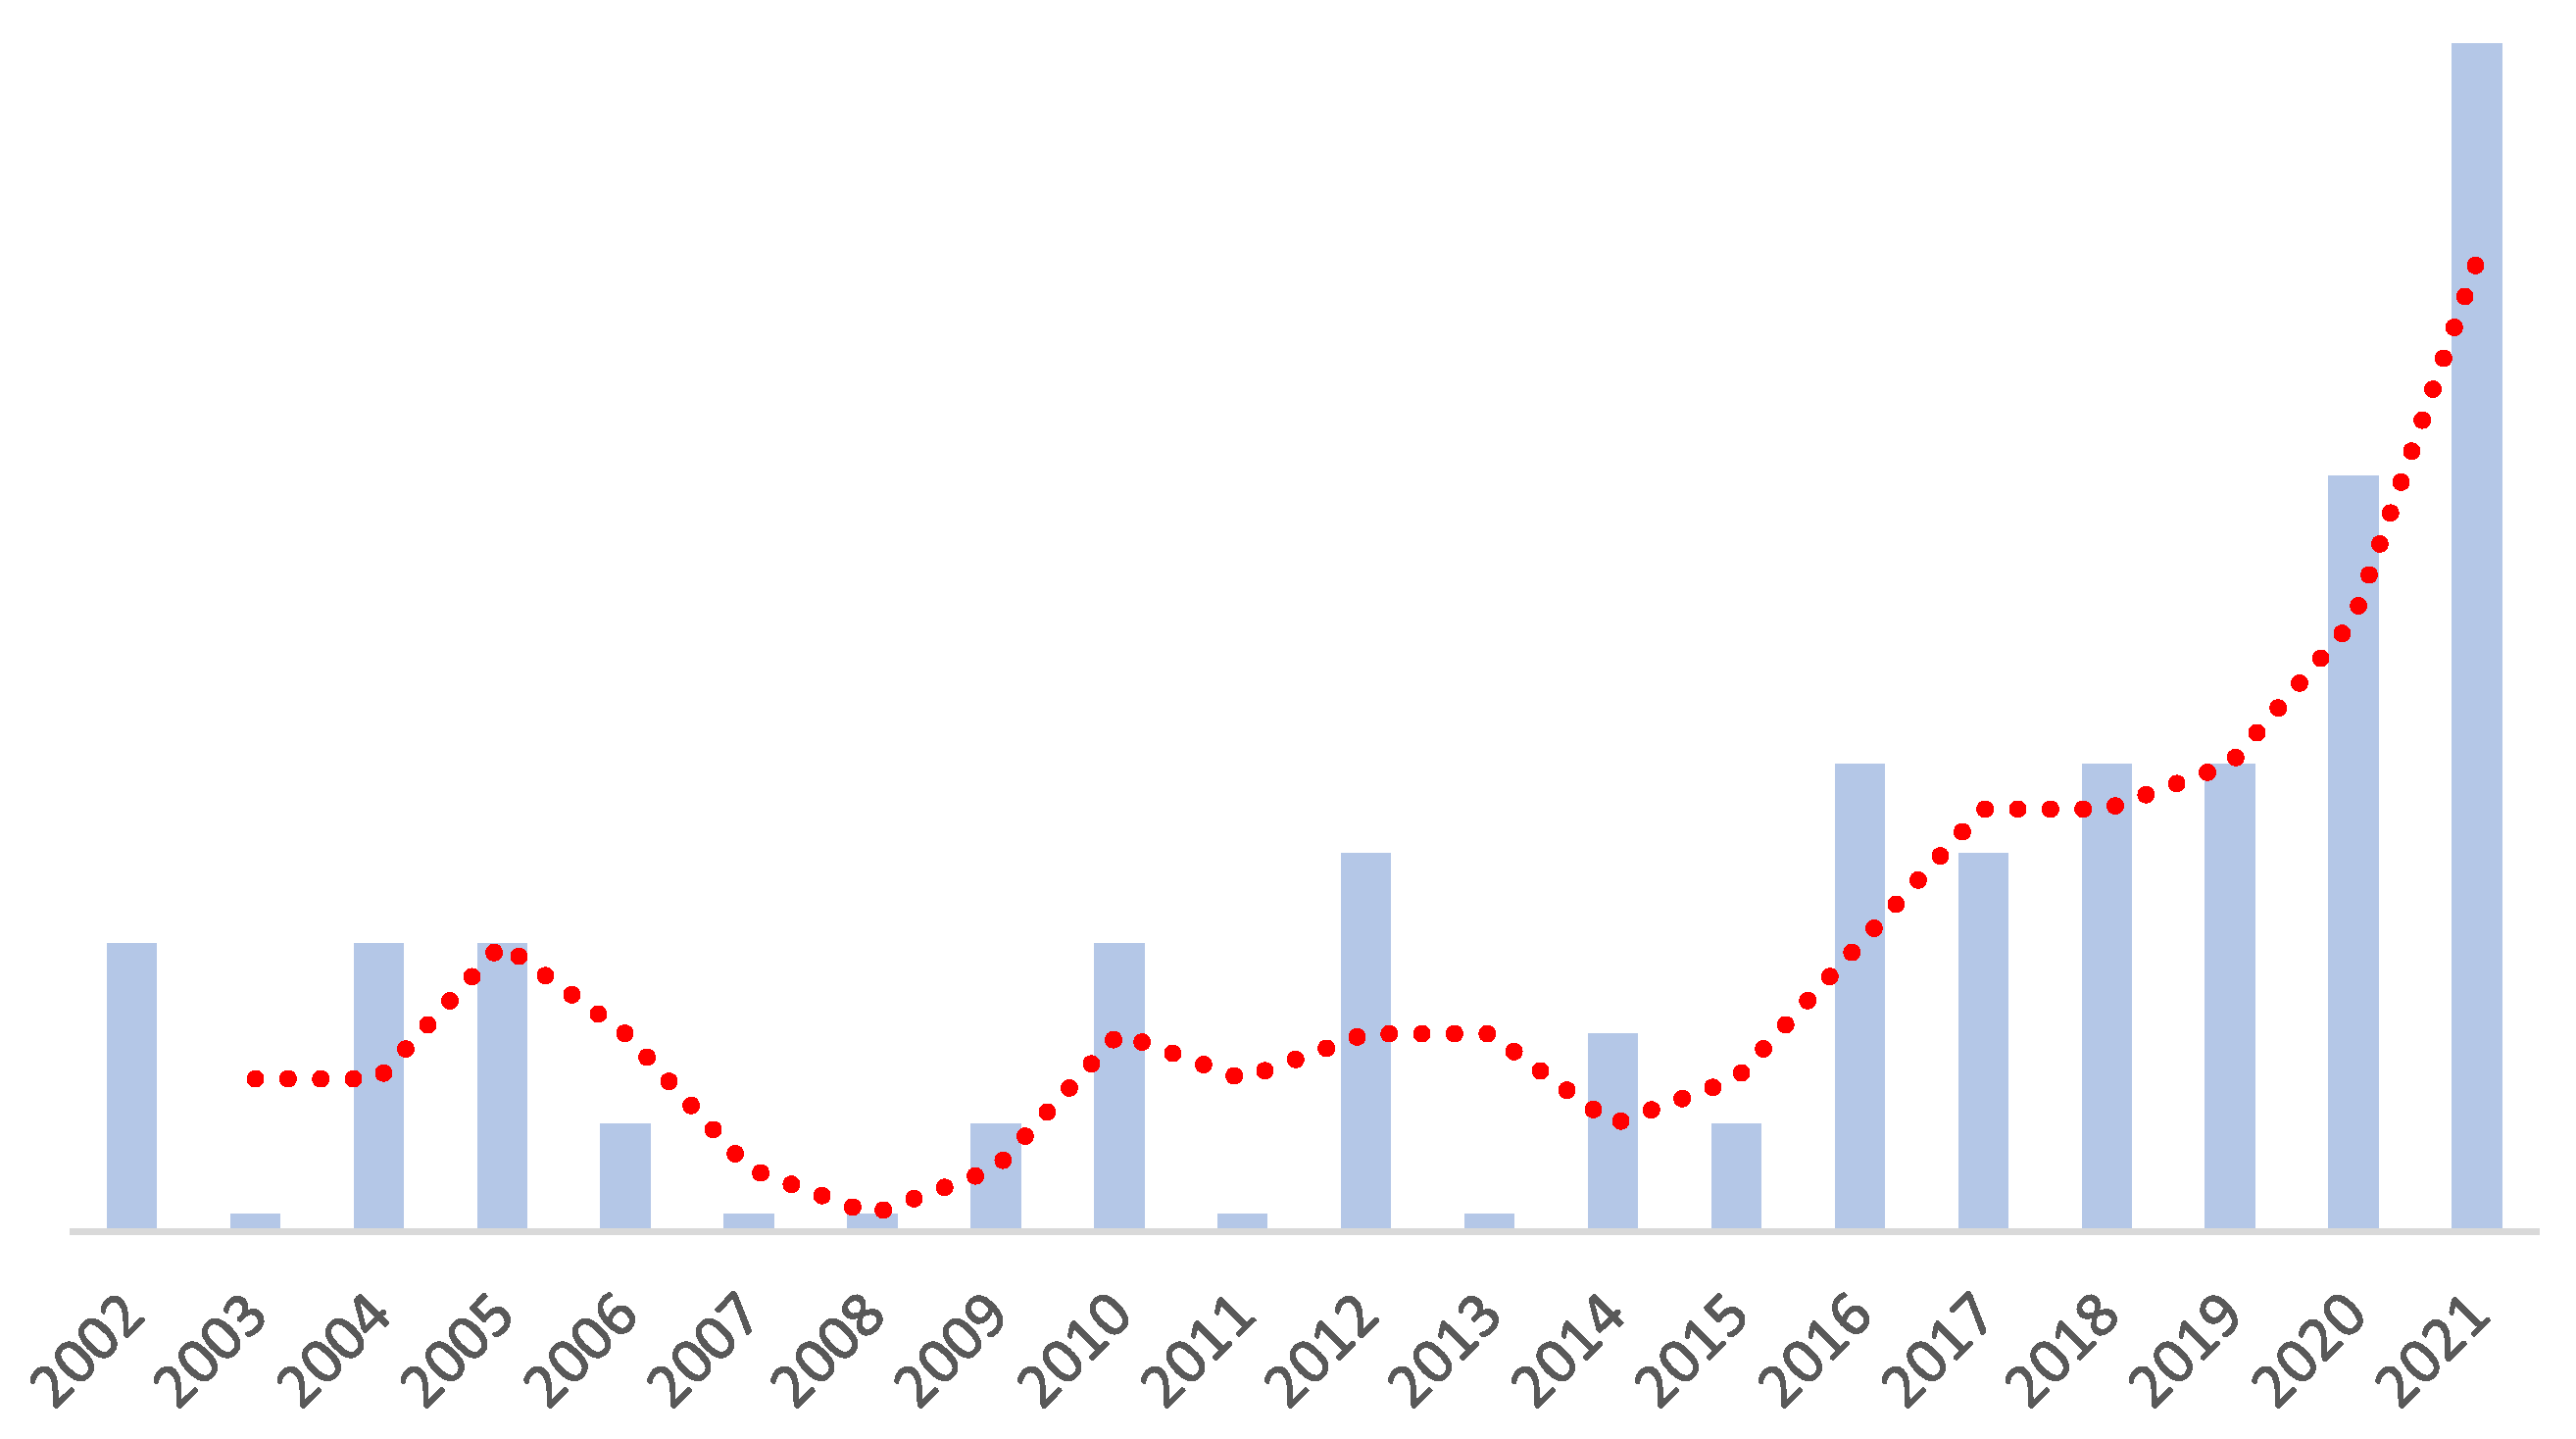
Figure 4 illustrates the distribution curve for cases between 2002 and 2021. The dotted line shows the trend of calculated frequencies. The highest drop of construction disputes occurred in NSW between 2005 and 2008 and the sharpest increase happened between 2014 and 2017. According to the Australian Bureau of Statistics, the value of work performed (total sector) is almost doubled in residential and increased 31% in non-residential from 2014 to 2017 [
76]. There is a linear structural relationship between the total number of disputes and the amount of work conducted in the residential construction industry during the mentioned period. Between 2017 to 2019, 16% growth was recorded in the value of work completed. Still, the increase in disputes is roughly 25% for residential and 22% for non-residential, which shows an exponential linear structure [
76]. The disturbing trend in 2020-2021 (the dotted line) is mainly attributed to the immediate impact of COVID-19 and subsequent impacts on the supply chain, liquidity, labor shortages, unpredicted long-term site shutdown, etc.
Table 3 demonstrates that the highest frequency of occurrence belongs to payment-related disputes. The payment category includes payment claim, payment overdue, changing the due date, progress payment, dishonoring payment, amount of payment, etc., between all parties, including owner–consultant, owner–builder, head-contractor–sub-contractor. In about half of the studied cases, payment disputes had arisen between head-contractor and sub-contractors. This means the highest rate of financial disputes in NSW occurs at the executive level.
Probing into cases revealed the perception of quality, damage, service, and completion is far different between executive representatives. Apart from damage-related payment disputes, in most cases in this category, the concept of work and its completion was the main point of dispute. Thus, it is understood that contractors’ perceptions of completed work are different to designers, owners and consultants. Unstable economic conditions of construction projects affect cost disputes vigorously. The majority of cases consist of lump-sum contracts, which accentuate the impact of economic conditions on arising financial disputes. As indicated in
Table 3, cost-related disputes are not as many as payment cases, but the highest frequency for cost disputes is recorded during the 2015–2019 period.
Based on collected cases, the time-related category is placed second in the ranks. Progress claims, rate of progress and delay are the leading causes of disputes in the time-related category of NSW cases. Most of these disputes were between owners and builders, which shows that owners’ anticipation of progress differs from operational personnel. Avoiding paying (progress payment) by owners (in about 40% of cases) and requesting for an extension by builders (in the absolute majority of cases) shows the contradictory mindset of the two involved parties, namely owners and builders.
Further analysis shows ’accurate baseline’ and ’simultaneous scheduling updates’ are the main reasons behind disputes associated with inadequate project records. Quality-related disputes hold the third place with the highest frequency. Cheung and Pang (2012) defined contract incompleteness as a platform for claims, and a principal element leading to contractual and speculative disputes [
77]. The majority of quality-related disputes were about defective material or workmanship, quality of the work performed, and defects. The terms ‘incomplete work’ and ‘defective work’ are generally related to quality disputes.
It Is impossible to study quality disputes, apart from contract-related disputes, because the expected level of quality is implicitly connected to the contracting. Inadequate technical specifications and poor communication between parties are the most significant causes of quality disputes in NSW. Contract incompleteness is another most frequent factor, usually neglected in the early stages of projects Even though the frequency of HSE-related cases is not amongst the higher ones, occurrence modelling shows that it was on the rise during 2015 to 2019.
Personal injury is the most frequent dispute in this field, which shows that safety issues will be scaled up. After personal injuries, negligence (duty of care) is the most common theme of disputes. The slightest reason to arise HSE conflict and disputes belongs to the ‘right of entry and licenses.’ Regarding other categories, ‘change or unclear scope’ and ‘unclear conditions’ are the other most frequent causes of disputes in NSW. Detailed analysis of cases revealed that most contract-related disputes are because by what Cheung and Pang (2014) called opportunism which is ‘an attitude unethically calculated efforts to mislead, distort, disguise, obfuscate or confuse’ or attempts to maximize a party’s interest [
1].
4.2. Cause and Effect Analysis
Analysis of the frequency and relationship between factors as well as project and organization levels revealed correlations amongst factors [
20]. The analysis revealed the most significant causes of conflicts and consecutive disputes in the construction industry of NSW. At first, to recognize the interrelation between causes, the authors focused on the most frequent cases in NSW. Then, the results were input into the network process; an in-depth analysis was carried out to find all parties, professions, disciplines, and levels involved in a given dispute and explore the interrelationship between categories. Finally, using the DEMATEL technique, the authors found and broke down the interrelationships amongst dispute categories and causes. In this research, the seven most frequent disputes were chosen to generate a direct-relation matrix (
M). A matrix of most frequent categories was created to establish the probable bidirectional relationships amongst the most frequent factors. The mentioned categories formed the row and column of the direct-relation matrix. After normalizing Matrix
M and producing the total-relation Matrix (
N(
I − N)
−1), the causal diagram of the interdependent relationship between causes is generated (
Figure 5). As demonstrated in
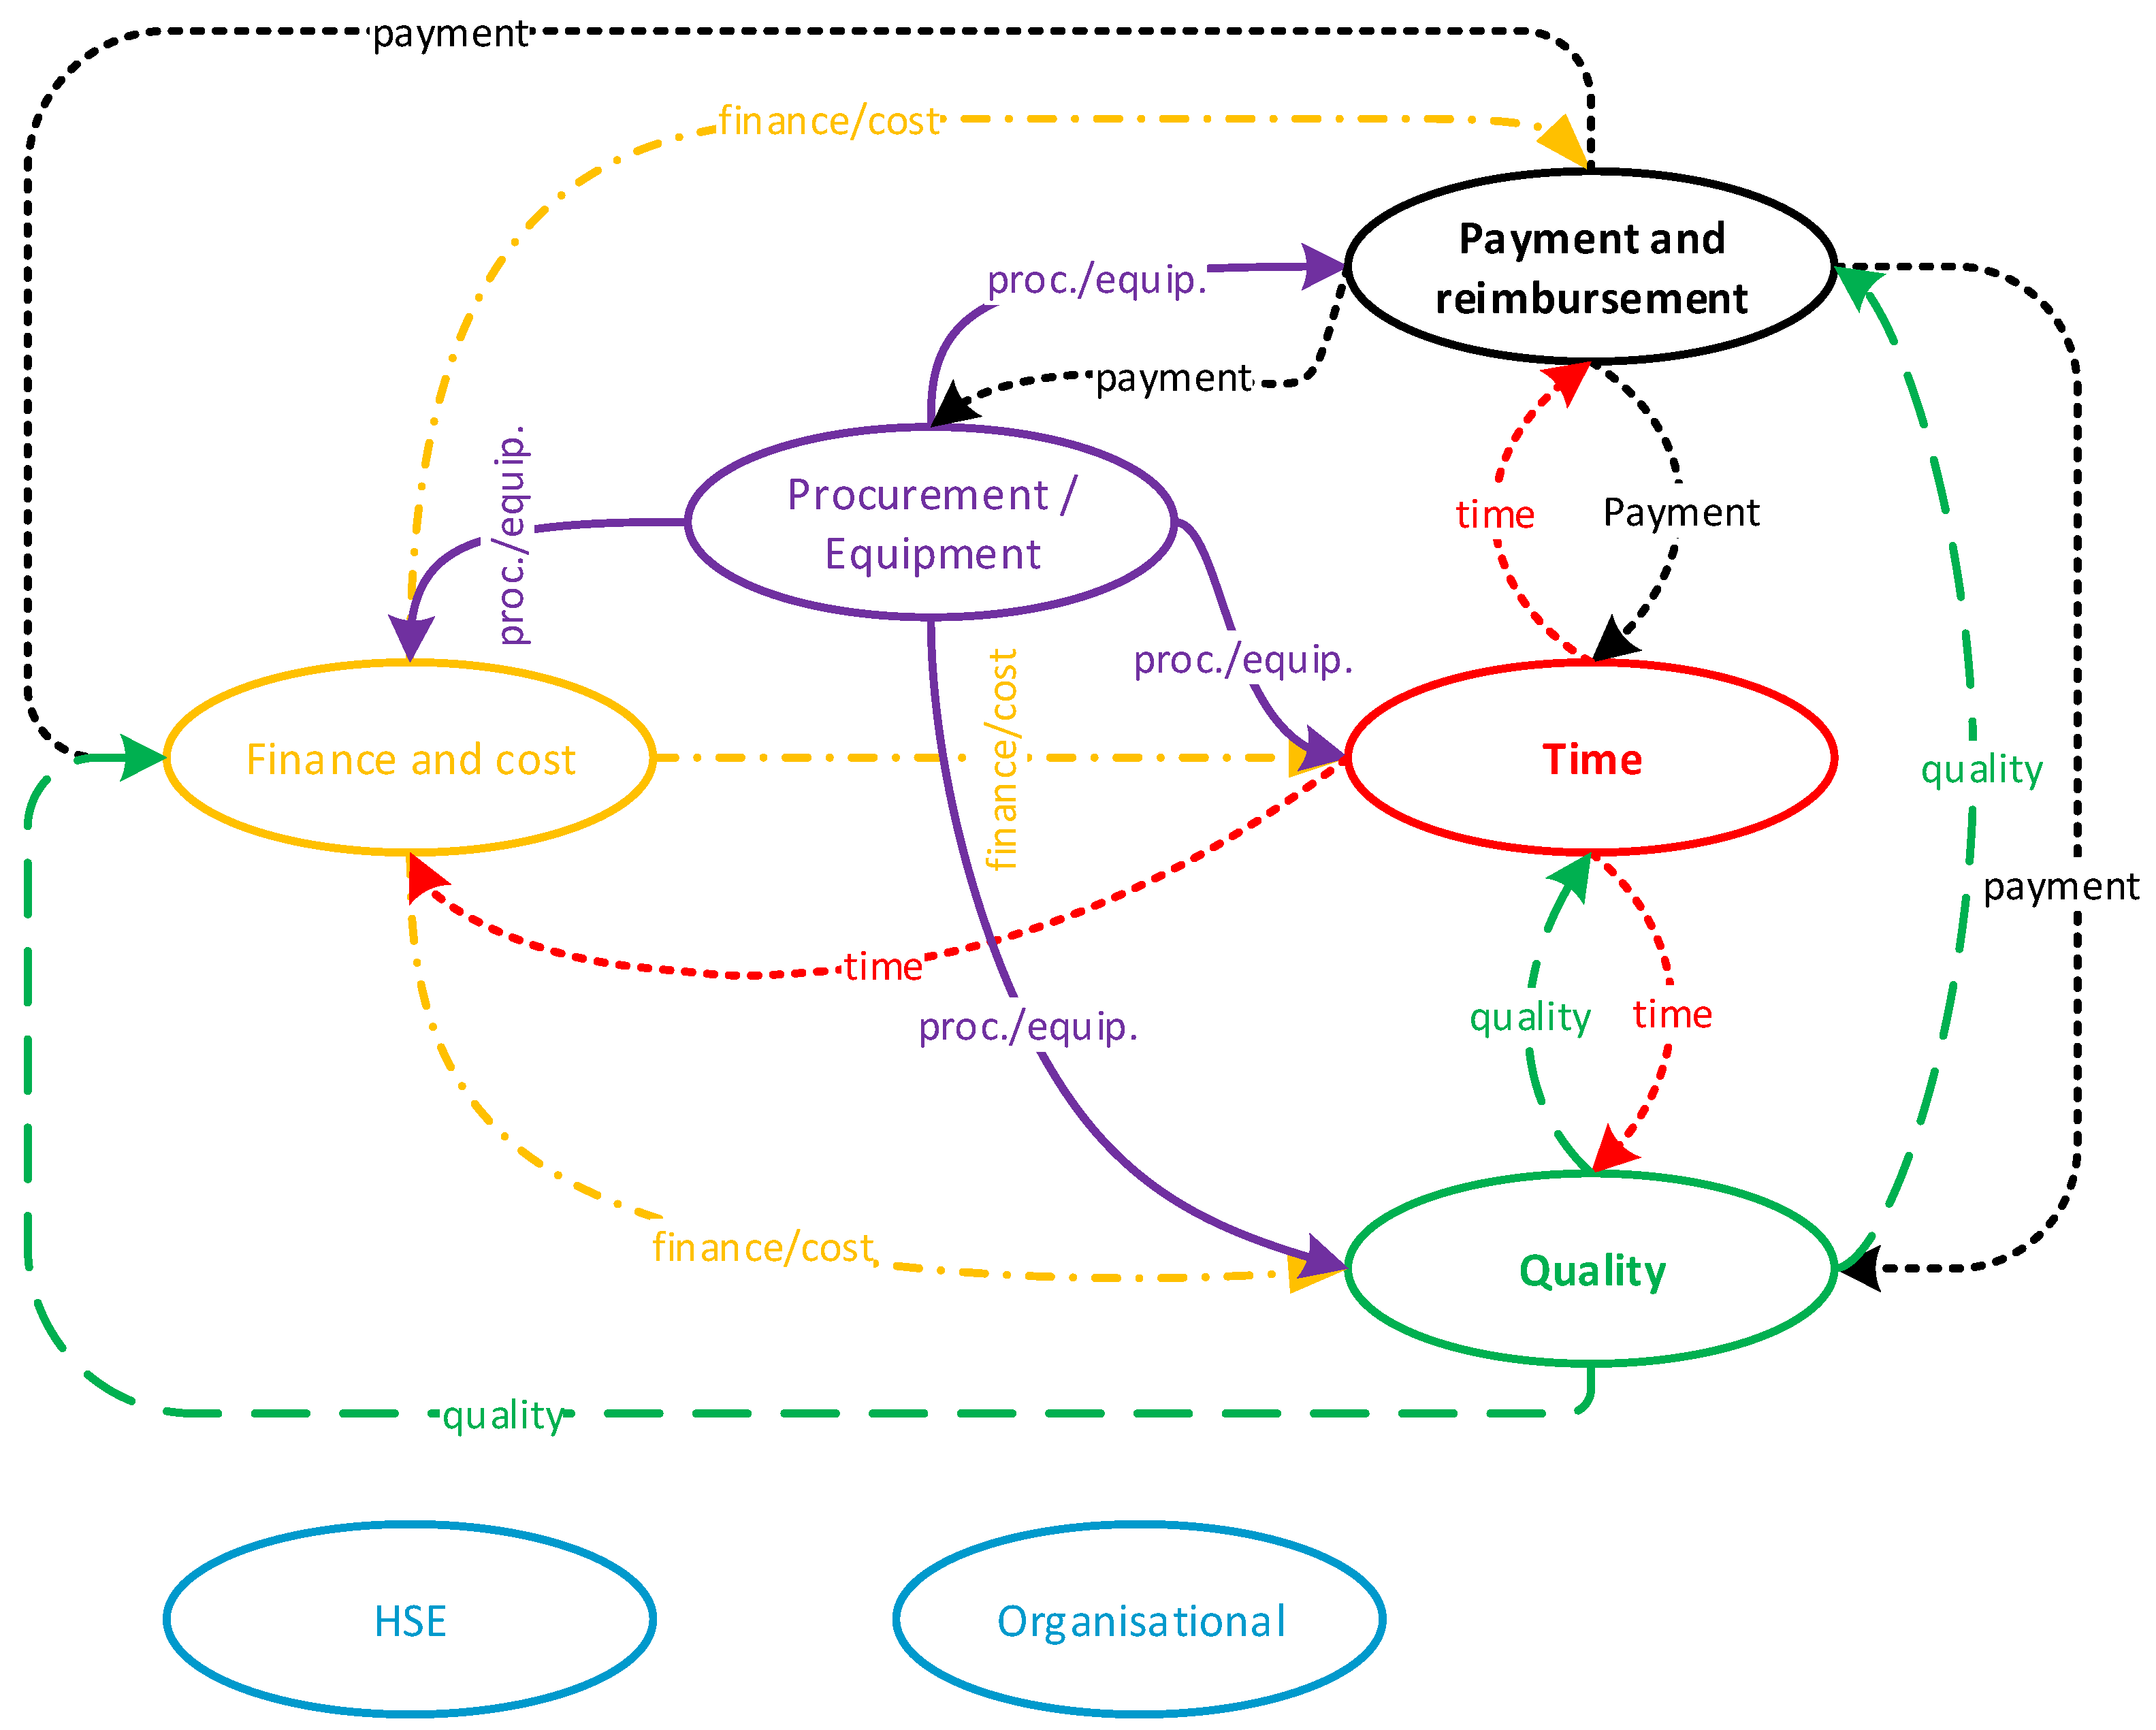
Figure 5, the most prominent cause is procurement/equipment cause, and payment/reimbursement and payment/reimbursement are the most impressive (highest relationship factor). In addition, the most related factor which has more relationship with other factors is the payment/reimbursement, and on the opposite, the less interactive factor is HSE.
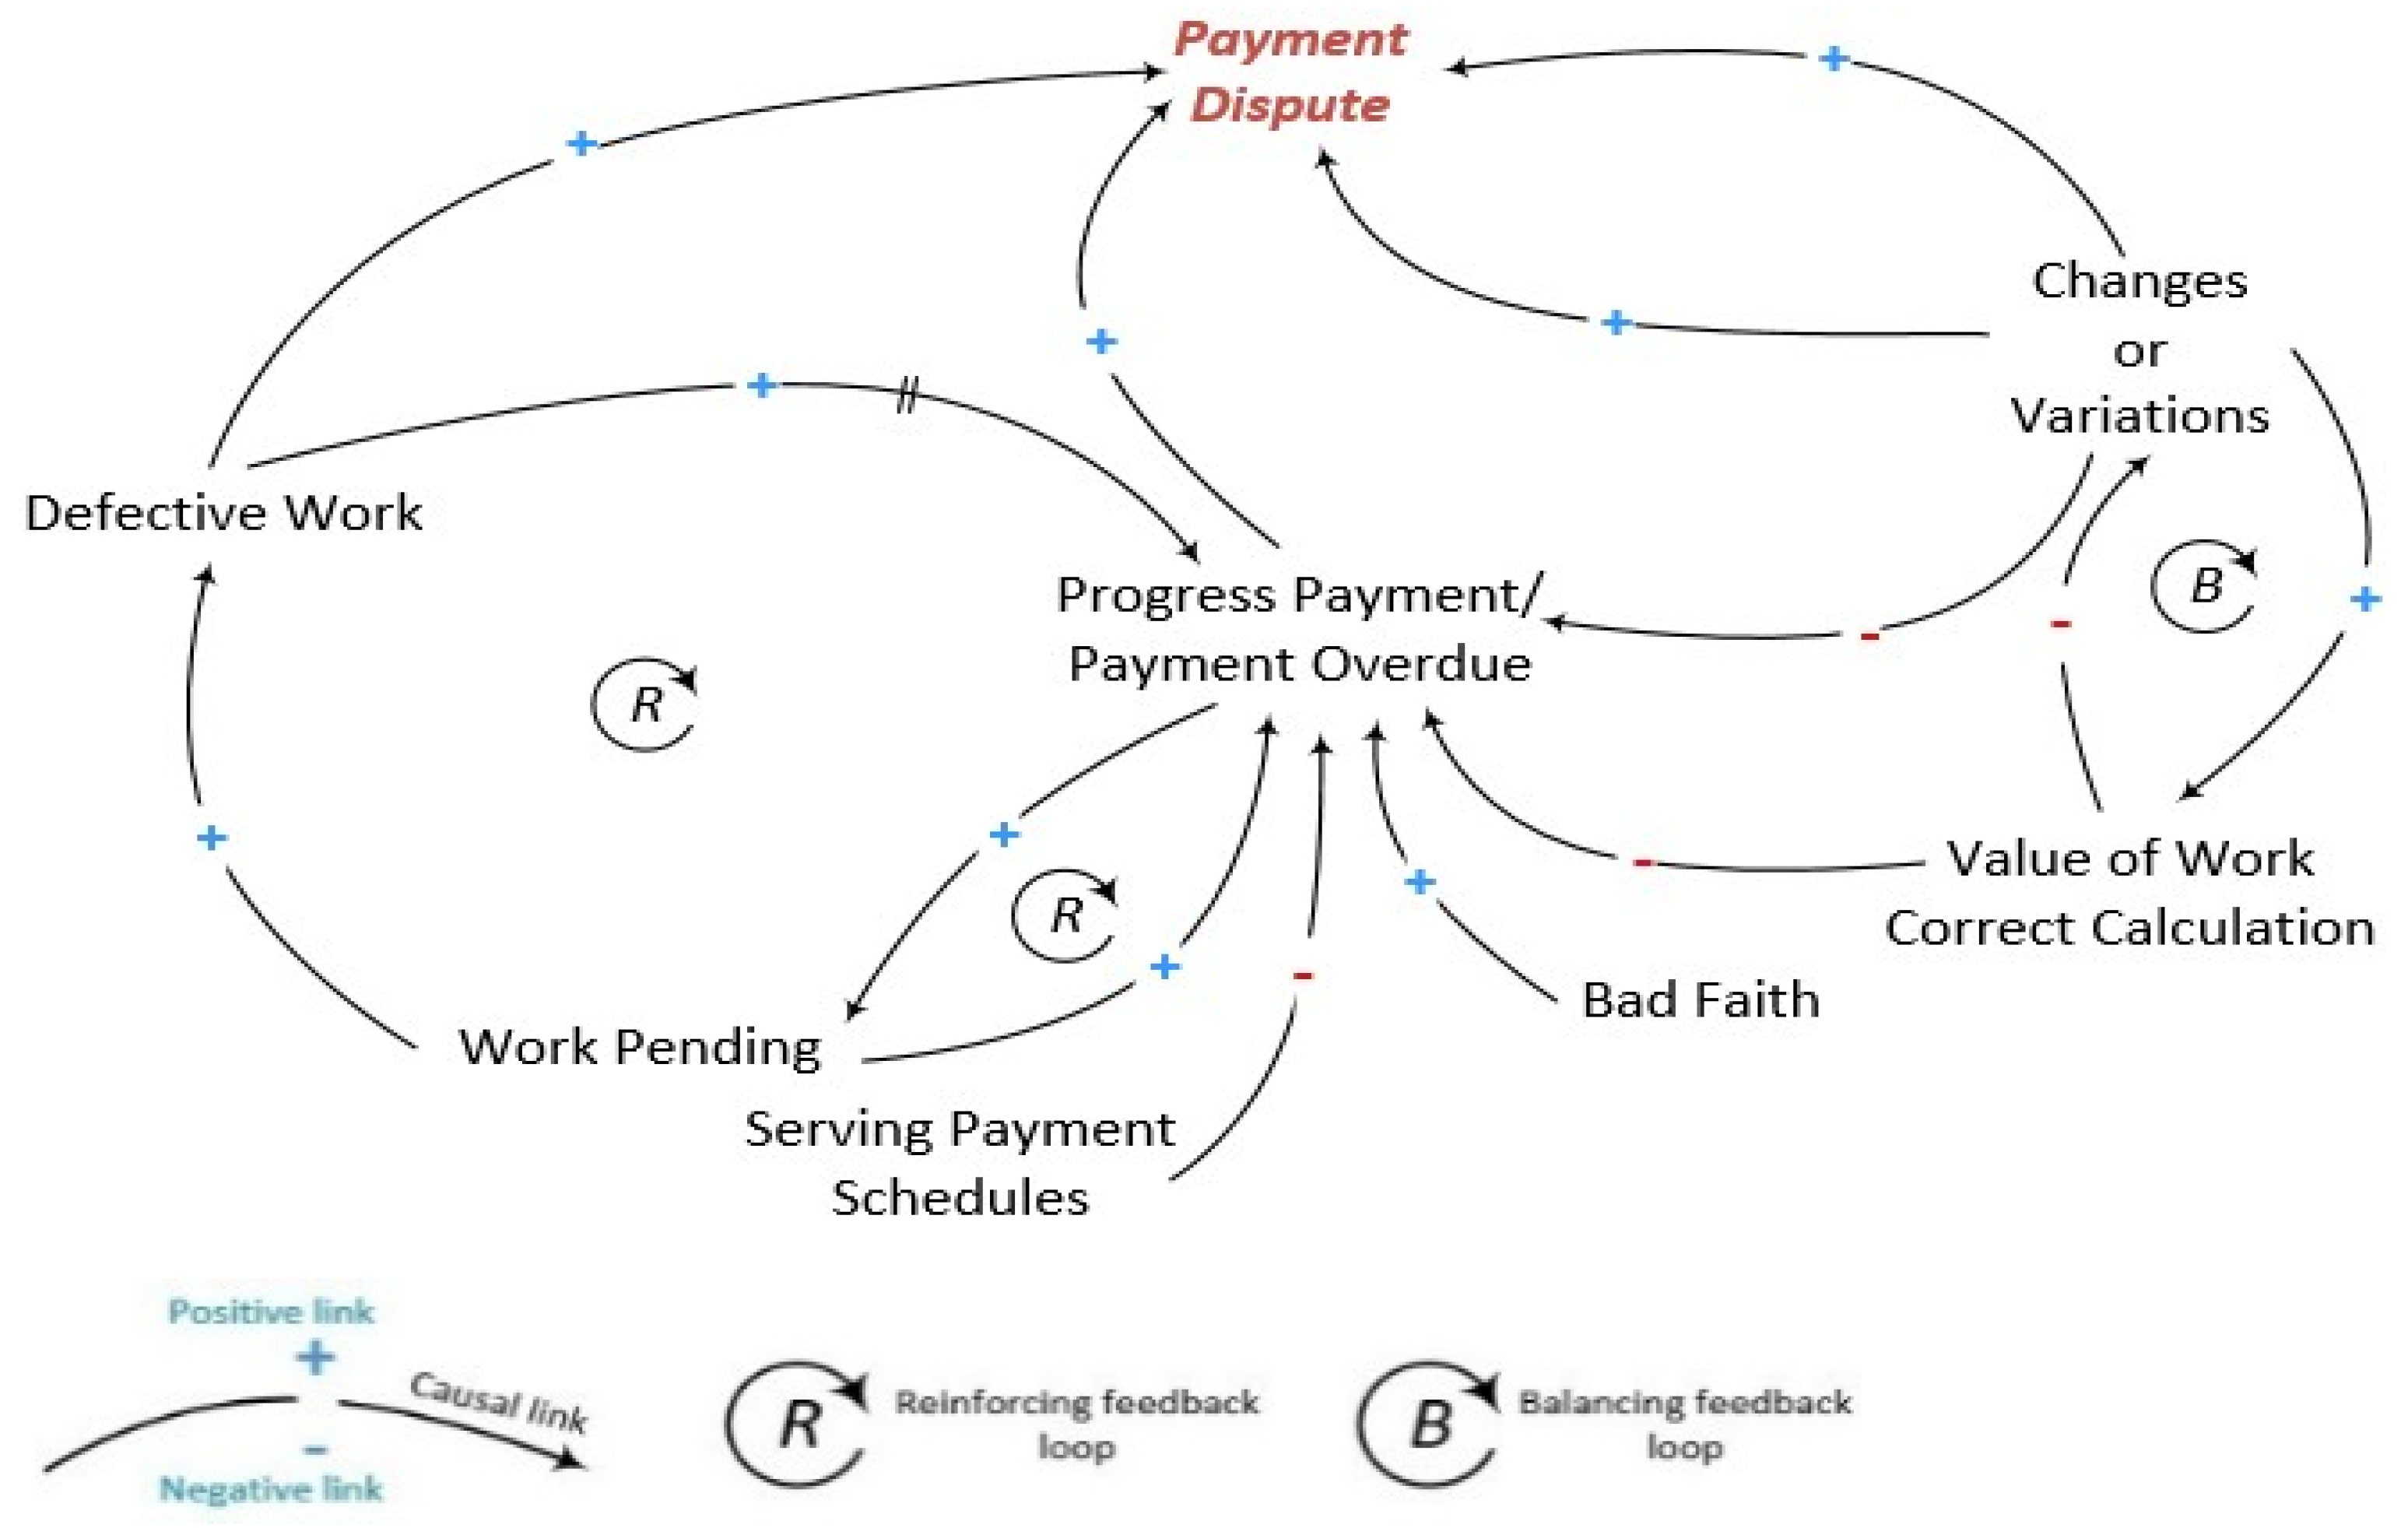
Figure 6 shows the Analytical Network Process of causal factors. The network illustrates the compelling relationship between factors based on the value threshold obtained through the DEMATEL process. The findings from this diagram provided input for the PLS-SEM model to be put into iterations. Payment-related disputes as the most prominent cause is further investigated. Detecting the most potent causes and assessing their effects requires drawing Causal Loop Diagrams (CLD), which helps recognize cause and effect relationships between parameters. In addition, these diagrams show the interactional feedbacks, which causes significant disputes. Within the category of finance and cost, cost-related disputes are the most frequent. The CLD of cost-related disputes in NSW construction cases is depicted in
Figure 7.
To look at causal interactions from a more refined lens, the MARS method, a developed automatic and non-parametric regression technique introduced by Friedman in 1991 [
78], was used to explore inter-relationship between identified factors and create a predictive model. This model uses Pricewise Linear Regression to detect causality relationships between categories of dispute and leading causes as well as other dispute categories.
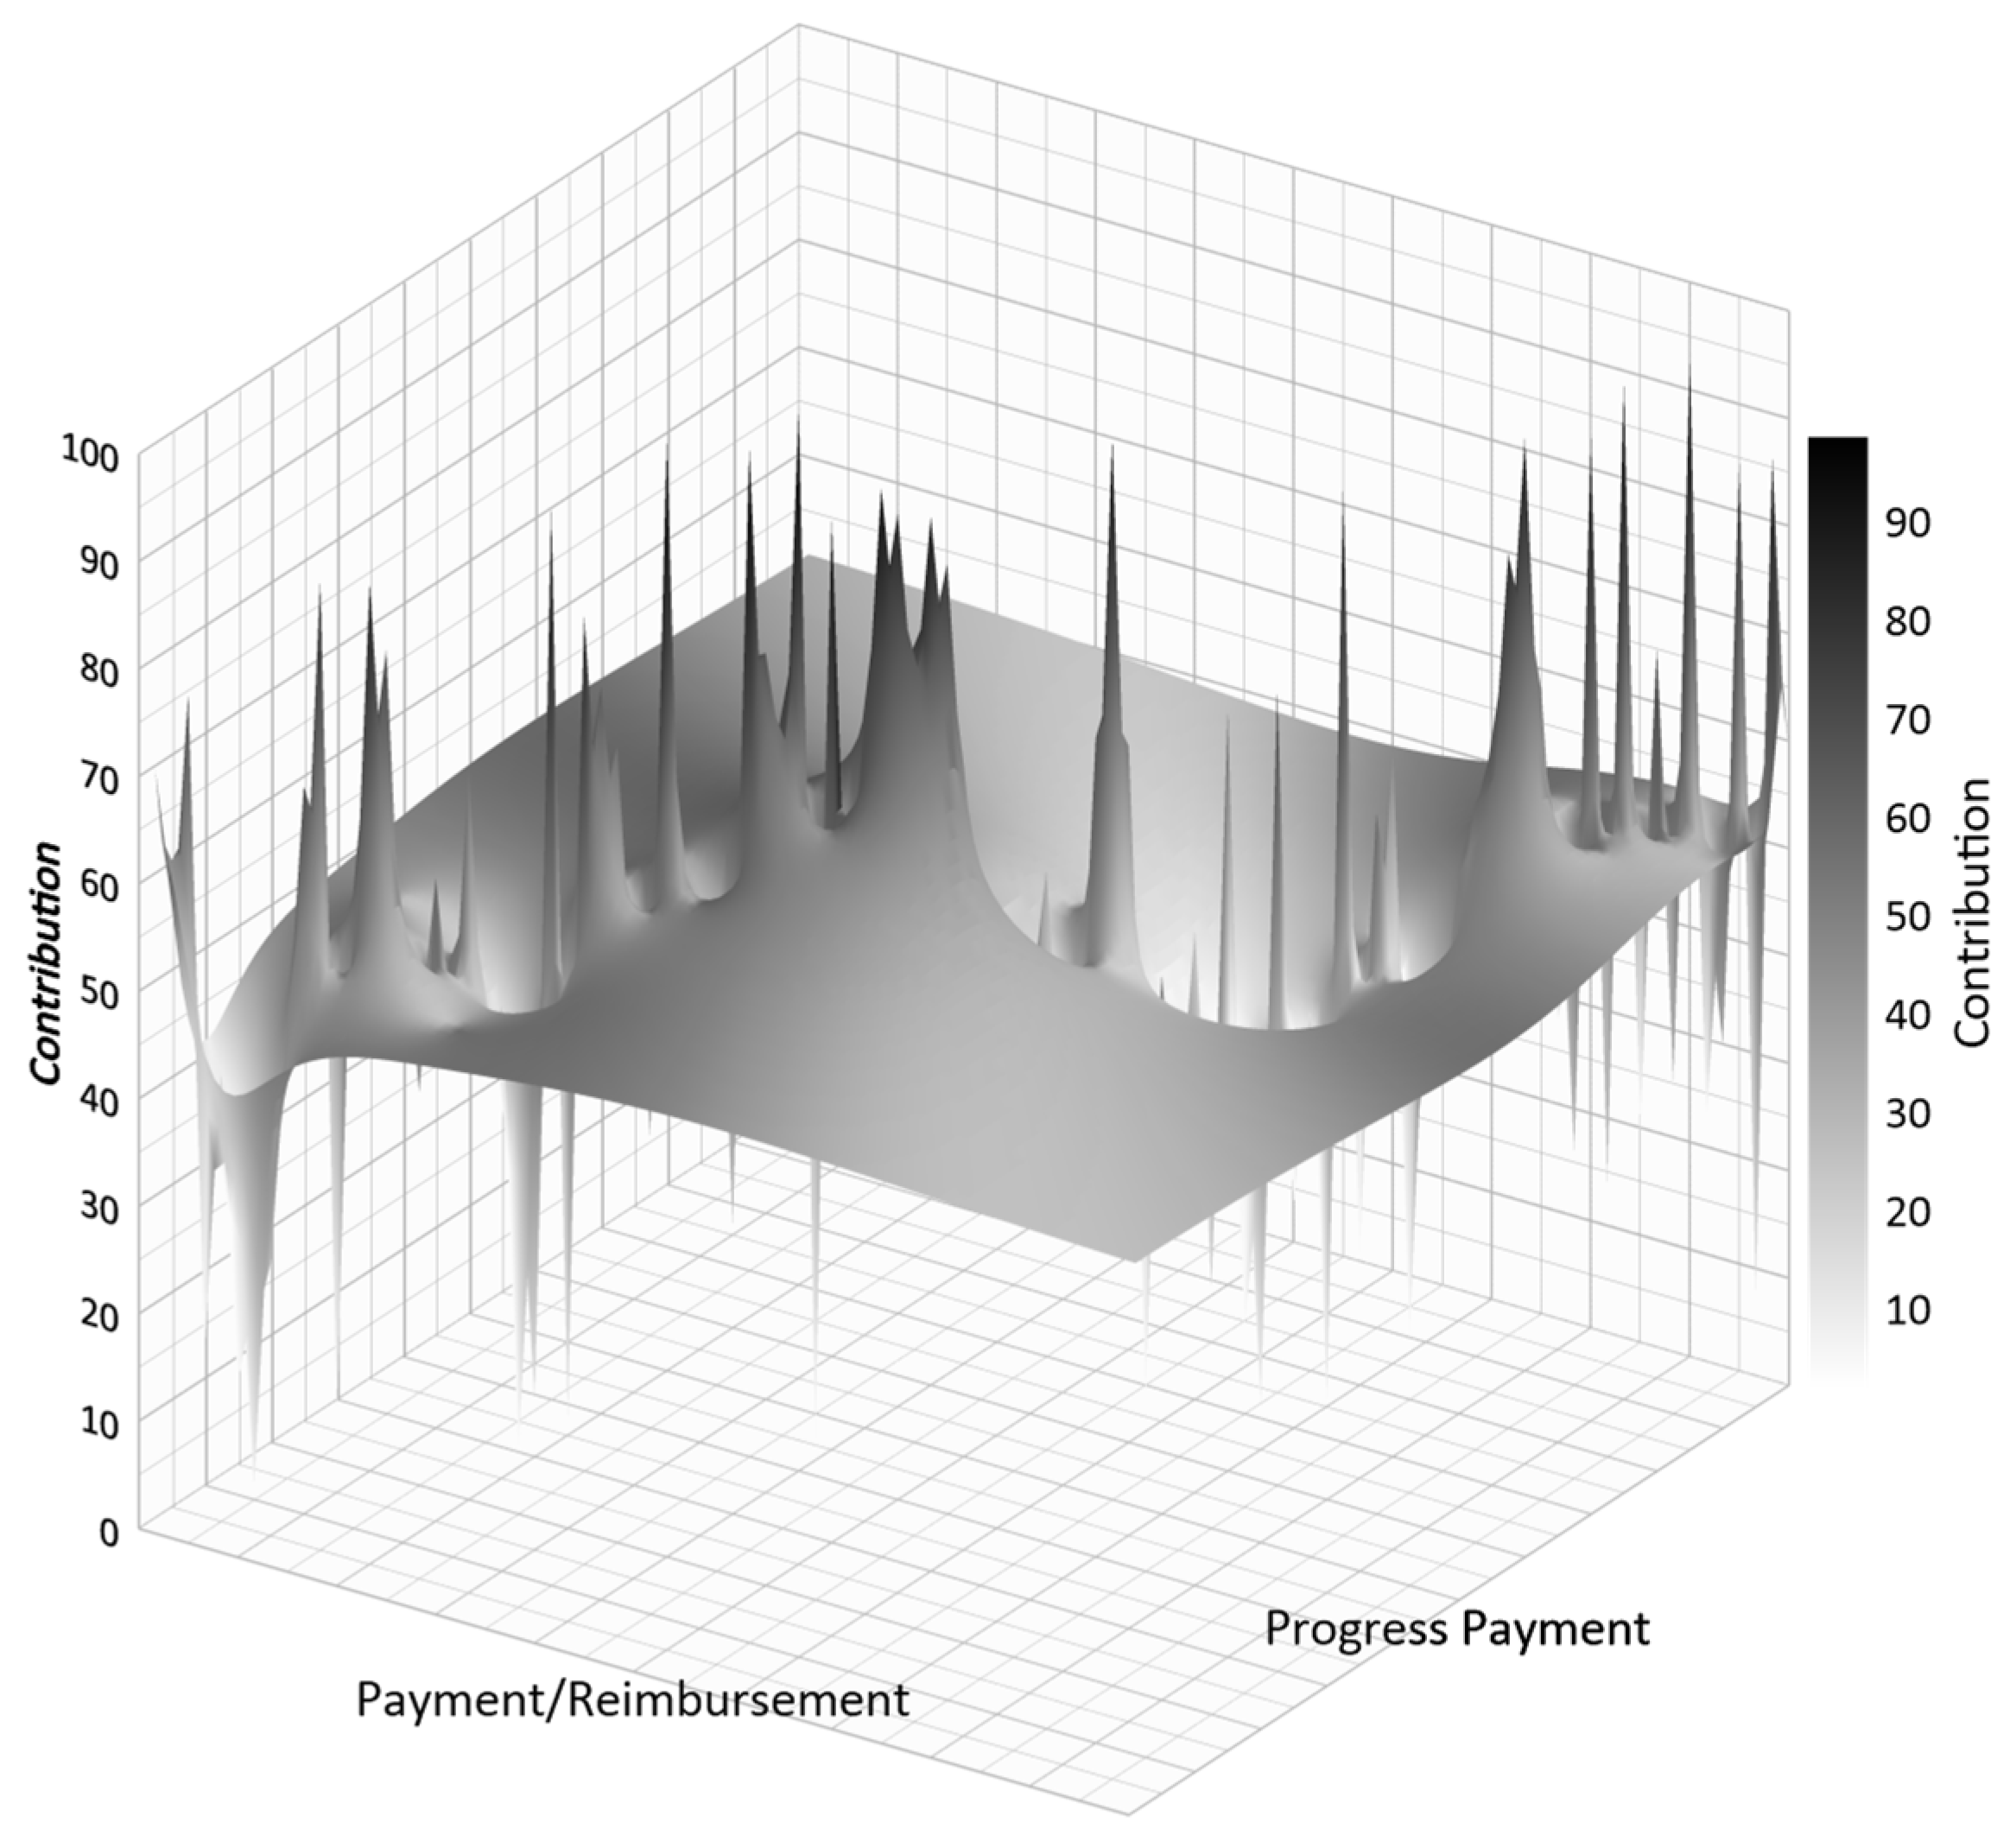
Figure 8 illustrates the contribution of ‘Progress Payment’ to ‘Payment/Reimbursement’ disputes. This figure shows a strong interaction between the two-mentioned categories of dispute, which most likely means payment eventuates in payment-related claims. The interaction between these two groups is mutual so that more than 52% of payment dispute reasons are progress payments.
In this regard, another MARS causality graph is provided in
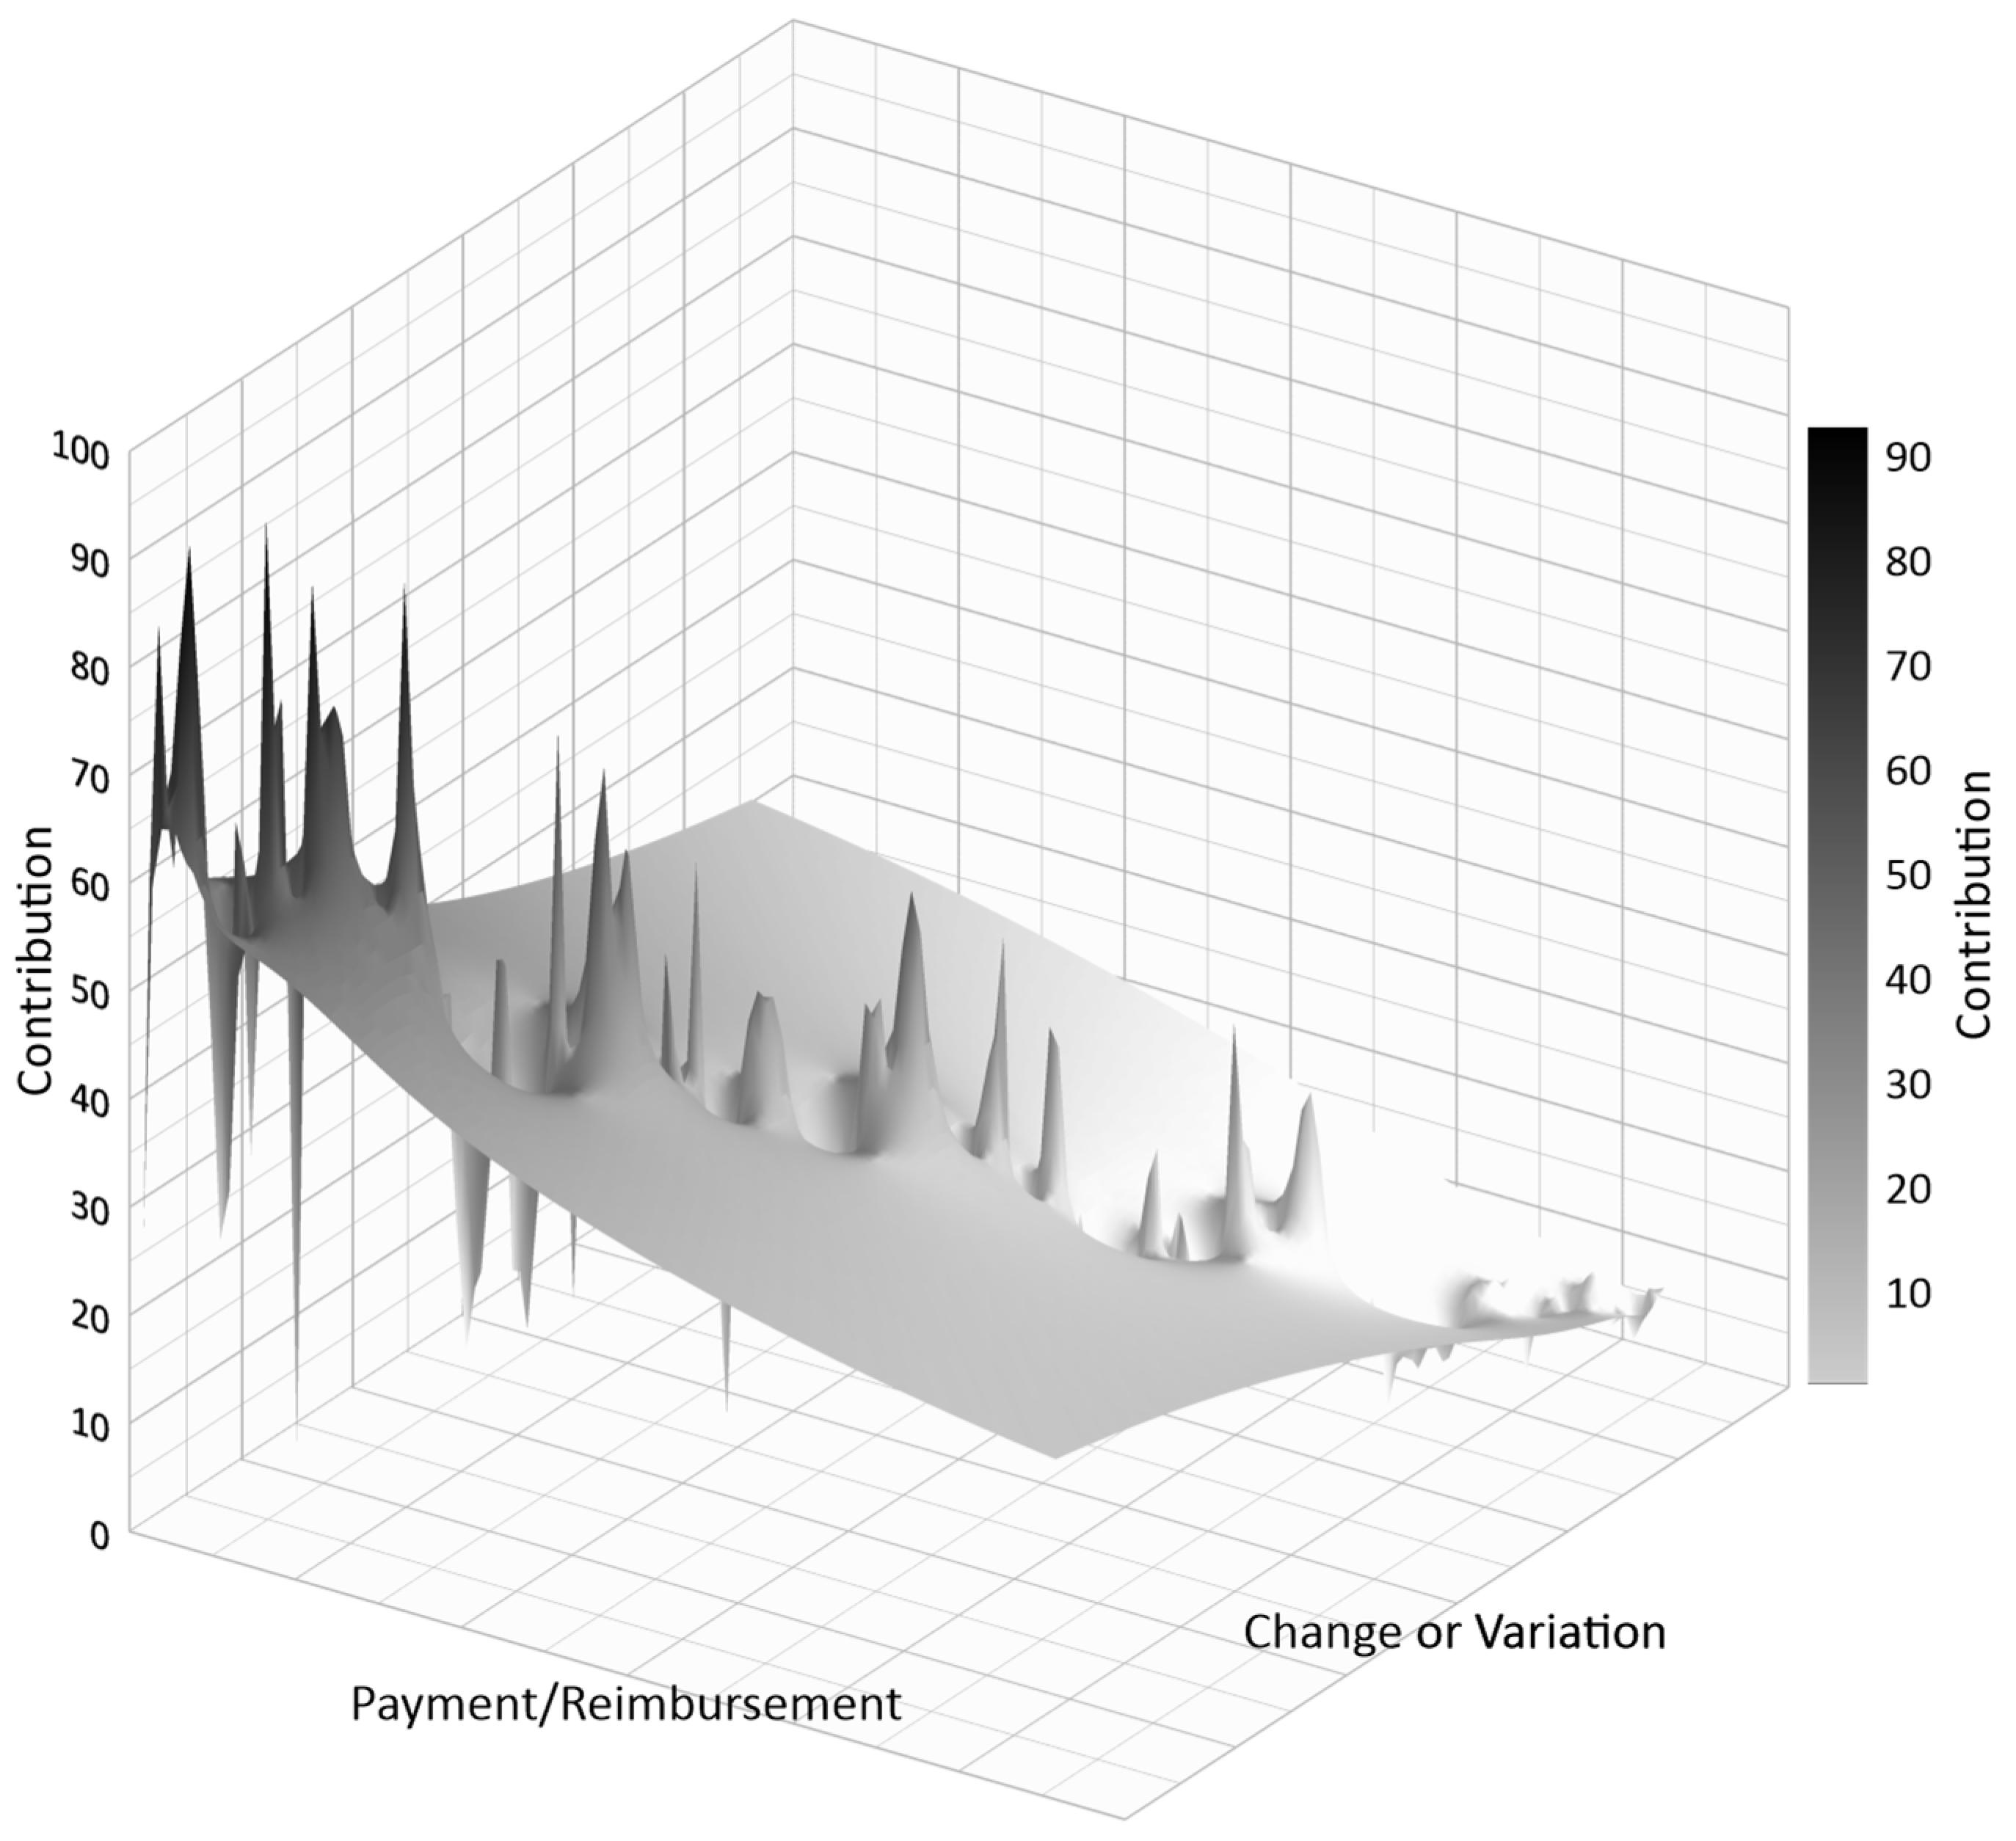
Figure 9, which shows the interaction between two groups of disputes: ‘Payment/Reimbursement’ as an effect and ‘Change or Variation’ as a cause. Generally, the variation may indirectly influence miscalculation, time/progress rate, and quality-related disputes. Hence, speculation on the interaction of these two types of disputes is obvious and is endorsed by even junior project managers. However, even though there is a direct interrelationship between these two causes of claim,
Figure 9 demonstrates the provoking fact that payment-related disputes due to variations are not widespread in NSW. Similarly, the common dispute sparking ‘Progress/Delay’ claims and its degree of affinity with ‘Payment/Reimbursement’ disputes are illustrated in
Figure 10 to be high, mutual, and evenly distributed.
Figure 11 provides illustrations with a high data-to-link ratio to demonstrate all identified inter-relationships between causes and their effects sorted according to the category, time, and frequency.
5. Conclusions
Although quantification of disputes in the context of construction contracts faces many obstacles, in this study a novel approach was utilized to analyze and forecast construction disputes. The findings of the study incorporate two different parts of ‘status quo’ and ‘predictive analysis’. In the first part, based on the available inferable information of recent cases accessible in legal databases, a logical categorization of raised disputes in the NSW has been presented. Based on the findings, raised disputes are classified into 13 categories that are based on the frequency, respectively including payment and reimbursement, time, quality, procurement, HSE, organizational, finance and cost, scope, contract, production of documents, progress rate, and debt and variation. As expected, payment and time-related disputes are in the first rank, but surprisingly other significant factors of project management in the construction industry, such as the progress of work and change orders, are not the most concerning disputes in the construction projects of NSW.
In the second part, a numeric analysis of the prospective probability of occurrence was conducted, utilizing the DEMATEL technique to look at the interactions between identified disputes. Payment and procurement factors are recognized as the most meaningful cause and impressive factors, respectively. However, the recent step reveals the level of interrelations between factors; the ‘payment’ factor has the most connection and effect on other factors, and on the other hand, ‘HSE’ is the least interactive factor in comparison to others. Therefore, as a practical implication and to decrease the complexity of the dispute administration, key stakeholders in construction projects should focus on the highest inter-related factors, such as payment, procurement, and time, that instantly trigger other kinds of disputes.
The current study contributes to the body of knowledge from two perspectives: static results of the configuration of disputes in the NSW at the present time, and proposing DEMATEL-based analysis to have a more dynamic outlook for prospective disputes in future projects. It is worth mentioning that the results and findings of this study are confined by the constraints triangle of time, geography and data; the domain of time between 2002 to 2021, the territory of NSW and the scope of the available information in the accessible data sets. Previous studies confirmed stakeholders’ concerns regarding increasing numbers of claims and disputes, especially in the case of construction megaprojects. Disputes are inevitable in the construction industry and should be properly administered to minimize undesirable impacts on the project. Therefore, the presented framework can be tailor-made for project managers as a preventive mechanism for claim administration. The presented framework benefits both sides of a contract by informing them of the most likely disputes in their projects to enable them to concentrate their resources to address them.
A study of the resolution of disputes is contemplated as the potential continuation of the work presented in this paper. For instance, by applying and considering a multi-stage process where the resolution mechanism is defined proportionate to the nature of each dispute. It is noteworthy to state that potential interactions with information systems deployed in the project to update critical parameters, including scope, schedule and cost, which varies due to the interactions with other dispute causes, are required to be investigated in the future. However, since soft project management skills, such as contract administration, are not widely analyzed quantitatively, modelling the impact of access to updated information via digitalization of project management activities paves the way to adopt modern technologies to avoid disputes.
This information can be used to develop targeted interventions aimed at probable dispute grounds. The findings of this study have some important implications for future practice. In line with these implications, this research has thrown up many questions in need of further investigation. The effect of a pandemic on the construction dispute that is mixed with a temporary change in the socioeconomic mindset of stakeholders, as well as post-pandemic shortages, is required to be studied. Our tacit understanding of the cases we reviewed suggests that it would be interesting to assess the direct and indirect effects of COVID-19 on disputes.
Finally, a number of significant limitations need to be considered. First, disputes during the COVID-19 period have made some aberrations that need to be analyzed in terms of pandemic circumstances, such as lockdown, temporary changed HSE regulations, etc., which was beyond the scope of this research. The second limitation was the assumption that individual judges apply a harmonized approach towards deciding the cases. We did not interrogate the data to verify this assumption. Further research might explore the jurisdiction mindset of construction disputes. The third limitation that the authors would also like to mention is that the immediate transfer of the findings of this study to another jurisdiction must be performed with extra care and adjustment for the differences in approaches applied in different jurisdictions towards dispute resolution in the construction context. Fourthly, our purely quantitative approach to analyzing court decisions, which are inherently statements of personal opinion, i.e., the judge’s opinion, might be complemented with a qualitative study of the judgment texts.


 ,
, 


