Article

Quantitative Analysis of the Accident Prevention Costs in Korean Construction Projects

Department of Safety Engineering, Seoul National University of Science and Technology, 232 Gongneung-ro, Nowon-gu, Seoul 01811, Korea
*
Author to whom correspondence should be addressed.
Buildings 2022, 12(10), 1536; https://doi.org/10.3390/buildings12101536
Submission received: 4 August 2022 / Revised: 9 September 2022 / Accepted: 21 September 2022 / Published: 26 September 2022
(This article belongs to the Section Construction Management, and Computers & Digitization)

Abstract

:
It is essential to objectively evaluate accident prevention costs (APCs) to respond to high-accident rates in the construction industry. However, currently, no quantitative APC analysis model considers the properties of the Korean construction industry. Therefore, in this study, the APC quantification structure was derived to comprehensively evaluate the properties of Korean construction projects, such as occupational safety and health management funds, safety management expenses, and others. Subsequently, the current status of APC in Korea was analyzed based on case studies on 38 projects for which questionnaires were collected. As a result of the study, the average ratio of the APC to total construction cost of the target project was calculated to be 1.95%. In addition, an average difference exists between groups according to client types and facility types in the target project. This study developed an APC quantification model considering Korea’s safety-related laws and insurance systems. It is expected that the results of this study can be used as objective data for evaluation according to the target project type.

1. Introduction

The International Labour Organization (ILO) [1,2] reported approximately 2.8 million casualties worldwide in 2019 owing to industrial accidents and problems, causing serious social and economic problems internationally. The construction industry has a high-accident rate compared with other industries because it is a representative labor-intensive industry involving various tasks performed simultaneously [3,4,5,6]. In addition, risk assessment, which identifies and analyzes risks performed by each construction process from a design and construction perspective, is a key element of safety management [7,8,9].
These issues can be addressed by systematically managing schedules, resources, costs of construction projects, and high-level safety management capabilities [10,11,12]. However, according to Gurcanli et al. [13], most construction companies worldwide perceive accident prevention costs (APCs) as additional costs and hesitate to invest. At actual construction sites, APC is related to the construction loss cost, and efforts to reduce the loss cost caused by disasters may significantly impact the financing of a construction project [14].
In this regard, Hallowell [15] insisted that including disaster loss costs can increase the overall performance of a project by up to 15%. Therefore, APC investment strategies based on risk analysis and quantification techniques for construction work are required to reduce the disaster occurrence frequency at construction sites [16,17,18,19]. In addition, it is essential to evaluate objectively the benefits of APC based on a systematic safety management process [14,15,20,21,22].
A quantification model that considers the characteristics of the Korean construction industry is required to conduct an objective quantification and evaluation of APCs in South Korea [23,24,25,26]. Regarding the overseas studies related to APC, Gurcanli et al. [10], Akcay et al. [27], and Aven et al. [28] presented APC quantification models for each country based on case studies. However, it is difficult to apply them in Korea because they do not reflect the characteristics of the Korean construction industry. Unlike other countries, the following two items must be considered for APC in Korea based on the legislature.
  • Occupational safety and health management funds (OSHMF): Article 72 of the Occupational Safety and Health Act (OSHA) administered by the Ministry of Employment and Labor (MOEL) [29].
  • Safety management expense (SME): Article 63 of the Construction Technology Promotion Act (CTPA) administered by the Ministry of Land, Infrastructure and Transport (MOLIT) [30].
Regarding domestic studies related to APC, Baek et al. [31], and Kim et al. [32] studied OSHMFs but only analyzed the ratio of performance to the plan and accounting standards. Meanwhile, Yoon et al. [33] and Yi [34] researched SMEs but did not present guidelines for the quantification of APC because they only focused on analyzing the calculated rate- and cost-effectiveness according to the construction scale [23].
As aforementioned, the analysis of previous domestic and overseas studies related to APC shows no objective and highly reliable quantification model for APC in Korea. As a result, it is necessary to develop a comprehensive analysis methodology for APC quantification in consideration of legal APC items and insurances related to construction accidents in Korea. Therefore, this study aimed to develop an APC quantification analysis structure that considers the characteristics of the Korean construction industry and analyzes the characteristics of APCs in Korea based on a case study.

2. Literature Review

As shown in Table 1, many studies have analyzed APCs to prevent accidents in the construction industry. These studies can be classified based on their contents and aims into (1) quantitative framework development and (2) prevention cost effectiveness analysis studies.

2.1. Quantitative Framework Development

Hallowell [15] utilized foundational risk quantification and analysis techniques to develop a framework to quantify the return on investment for APC. Gurcanli et al. [13] evaluated the safety investment cost of a construction project based on a survey of 25 construction sites in Istanbul. They found that the ratio of APC to the total construction cost (TCC) of a construction project in Istanbul was 1.92%, with APC/man-hour = 0.85 United States dollar (USD) and APC/unit area = 5.68 USD.
In addition, Ibarrondo-Dávila et al. [35] analyzed the APCs of construction companies in Spain and proposed an accounting model for analyzing and calculating APCs. They reported considerable APCs associated with construction companies, but these existed as invisible costs as the cost items were dispersed in different accounting items. Akcay [27] conducted regression and Pareto analyses on 30 construction projects and 400 industrial disasters and reported that APC can be estimated using the building area.
Yılmaz and Kanıt [36] developed a program for estimating the APC of a residential building project. The ratio of APC to the TCC of a residential building estimated through the developed program was 5.15%, with APC/unit area = 8.47 USD/m2.

2.2. Prevention Cost Effectiveness Analysis

Ikpe and Oloke [37] calculated the benefit of APC in the construction industry and found that the incurred APCs for small contractors were higher than those for medium or large contractors when the revenue was considered. In terms of benefits, small and medium-sized contractors had higher accident prevention benefits.
López-Alonso et al. [38] surveyed safety managers at 40 construction sites in Spain and found that the number of accidents were positively correlated with the total number of workers and the number of subcontractors.
Three relevant publications were published by Feng. In the study published in 2013 [39], it was reported that safety investment was more effective when the safety culture of a workplace was high. In the 2014 study [40], interactions among the APC, safety culture, and risk level of construction projects in Singapore were analyzed. It was found that safety performance was related significantly to APC, safety culture, and the risk level. In addition, in 2015, Feng [41] developed a mathematical model to determine the minimum value of voluntary safety investment. The developed model showed that the minimum value of voluntary investment varied depending on safety culture and the project risk level.
These studies analyzed the APC of the construction industry from various perspectives depending on the characteristics of each country and derived cost items. However, it is difficult to apply their results to the calculation of APC in Korea because some items and costs must be invested in construction safety in Korea, including the OSHMF by OSHA and SME by CTPA. In addition, business owners must pay for industrial accident insurance and voluntarily purchase compensation insurance for their workers. Therefore, all the mandatory items and costs based on Korea’s safety-related laws and insurance system need to be considered to analyze APCs suitable for the characteristics of the Korean construction industry.

3. Materials and Methods

As shown in Figure 1, in this study, research was conducted in three steps: (i) analysis of South Korea’s safety cost-related system, (ii) development of construction APC structure and survey for case study, and (iii) analysis of construction APC.

3.1. Analysis of Korea’s Safety Cost-Related System

This study aims to quantitatively analyze APCs invested in Korea’s construction projects to prevent accidents. First, it is necessary to analyze Korea’s safety cost-related system. In Korea, based on OSHA, the owner of a construction project must appropriate OSHMF, which is the cost needed to be used in the budget to prevent industrial disasters when establishing plans for the project [29]. Similarly, based on CTPA, the owner must appropriate SME, which is the cost required for the safety management of a construction project in the budget when signing contracts for the project [30].
In terms of OSHMFs, it is mandatory to appropriate OSHMFs in the budget for construction projects exceeding 20 million Korean won (KRW) (approximately 15 thousand USD) in construction costs. In this instance, a certain percentage of TCC must be appropriated in the budget for each construction scale based on OSHA. OSHMF mainly consists of items for the safety of workers, such as safety facility and educational events costs, as shown in Table 2.
In terms of SMEs, it is mandatory to appropriate SMEs in the budget for construction projects required to install, maintain, and repair civil engineering, architectural, industrial equipment, landscaping, and environmental and other facilities. Unlike OSHMF, there is no regulation on the percentage of TCC to be appropriated in the budget for SMEs. SMEs mainly consist of items required for the safety of facilities, such as surrounding damage prevention and structural safety costs, as shown in Table 3.
Therefore, the various cost items invested in construction projects in Korea must be considered to analyze APCs in Korea.

3.2. Development of Construction APC Structure

Korea’s safety cost-related system was analyzed above. To quantitatively analyze APCs in Korea, it is necessary to develop a cost structure first.
An expert group interview was performed in advance to analyze Korea’s safety cost-related system and conduct a related survey. Table 4 overviews the outcomes of the expert group interview. Group interviews were conducted with a number of experts working in Contractor A, B, and C. The cost items agreed by more than half of interviewees in the conference room were used in the APC structure.
In this study, an APC structure was developed as shown in Table 5. The developed APC structure considered the following items. First, OSHMF by OSHA was considered, with ten items from SMS included in the category “Others” as the detailed items of OSHMF [31,32]. Second, the SME by CTPA was considered, with six items from safety management plan to structural safety included as the detailed items of SME [33,34]. Third, the additional accident prevention cost (AAPC) invested by a construction company for worker safety, including mandatory equipment, was also considered. The insurance purchased by a construction company and other investment costs were included as the detailed items of AAPC. Insurance was divided into industrial accident compensation insurance and prevention premiums (IACIPP)—operated by the government [42]—and worker’s compensation insurance premiums (WCIP)—operated by the private sector [43]. Investment costs for smart safety management [44] can be included in other additional costs (OACs).
A survey was conducted to quantitatively analyze the APC structure developed above. The questionnaire was distributed via electronic mail to the occupational safety and health teams of all construction companies. The survey was conducted with ten construction companies, and replies were received from six of them. These six companies operated 38 construction sites, including 29 architectural sites and nine civil engineering sites. Among the 38 sites, 28 were private construction projects, while 10 were public construction projects.
The questionnaire was composed of two sections, as shown in Table 6. The first section had questions about the information on the company. The second section had questions about the information on the construction sites operated by each company. Section 2 also included questions about the information on the APC paid at each site.
In this study, the quantitative analysis of APC was conducted based on the survey presented in Table 5. For all the items of the APC structure presented in this study, except for IACIPP, the average values of the 38 values collected through the survey were used. However, IACIPP was calculated using Equation (1) based on the information collected through the survey because it was paid for each company and not for each project.
IACIPP   of   each   site = Construction   cos t Revenue   of   company × IACIPP   of   company

3.3. Analysis of Construction Accident Prevention Cost

In this study, the APCs of the 38 sites were quantified based on the survey results. The 38 sites comprise 28 private projects and 10 public projects according to the client type. They also consisted of 29 building projects and nine infrastructure projects from a facility-type perspective. Therefore, in this study, the quantified APC was analyzed from the following three perspectives: (i) total target projects, (ii) client types, and (iii) facility types.
First, analysis of the total project was conducted. Frequency analysis was conducted for the five APC items presented in the APC structure described above. The frequency analysis was conducted by using Equations (2) and (3).
Average   of   APC   items   ratio   to   TCC   ( % ) = ( n = 1 38 ( APC   items i ) / 38 ) / ( n = 1 38 ( TCC i ) / 38 ) × 100
APC   items   rate   to   ( % ) = APC   items / APC × 100
Multiple regression analysis was then conducted using IBM SPSS Statistics for Windows (version 18.0, IBM Corporation, Armonk, NY, USA) to examine the relationships between APC and the five APC items.
Second, the 38 sites were analyzed by dividing them into public and private project sites from a client-type perspective. First, frequency analysis was conducted on the two groups through the APC ratio to TCC. t-test analysis was then conducted to examine any differences in APCs between the two groups.
Third, the 38 sites were analyzed by dividing them into public buildings, public infrastructure, private buildings, and private infrastructure sites from a facility-type perspective. Analysis of variance (ANOVA) was conducted to examine any differences in APCs among the four groups.

4. Results and Discussion

4.1. Results of the Accident Prevention Cost

Table 7 lists the ratio analysis results. For the 38 target projects, the average APC was 1.95% and the standard deviation was 0.44%. Among the APC items, OSHMF exhibited the largest proportion (1.34%) followed by IACIPP (0.56%), SME (0.04%), WCIP (0.004%), and OAC (0.002%).
According to Gurcanli and Sevim, 2015 [13], the ratio of APC to TCC in Istanbul was 1.92% as of 2013, which was calculated using data collected for nine APC items, as shown in Table 1. Conversely, Yılmaz and Kanıt [36] reported the ratio of APC in Turkey in 2018. The ratio of the mandatory occupational health and safety cost to the direct construction cost was found to be 5.15%. The APC framework for this included four items. As described, the ratio of APC may vary owing to different systems in each country.
Figure 2 shows the APC ratio to TCC for each of the 38 projects. Among the 38 projects, 21 projects exhibited values higher than the average value, and 17 projects yielded values lower than the average value.
Multiple regression analysis was conducted to derive relationships between APC and APC items, and the results are listed in Table 8. Among the five factors that constitute APC, only OSHMF and IACIPP yielded a significance probability of <0.05. Given that the adjusted coefficient of determination was as high as 84.5%, the multiple regression equation of APC was derived as shown in Equation (4). The exchange rate of 1297 KRW for 1 USD as of 7 July 2022, was applied. It was found that APC in Korea can be determined by using two major factors (OSHMF and IACIPP).
APC ( USD ) = 5 , 531 , 443 ( USD ) + 49.40 OSHMF ( USD ) + 54.50 IACIPP ( USD )
Note: The exchange rate (KRW/USD) was 1297 won to 1 USD (as of 7 July 2022).
In addition, a box plot was drawn to analyze the characteristics of the three variables that constitute the multiple regression equation, as shown in Figure 3. A box plot chart is a data visualization tool that shows the distribution of data and outliers while allowing easy comparison between different data groups. To this end, the minimum, maximum, upper quartile, median, and lower quartile values were calculated for each data group. The ratios of the difference between the upper and lower quartiles to the median values of OSHMF and IACIPP were calculated to be 10.19 and 6.70, respectively.
The frequency was analyzed for each section to analyze the characteristics of OSHMF, which represents the largest proportion among the APC items, as shown in Figure 4. The normal distribution probability was then derived based on the average value of 1.34% and the standard deviation of 0.33% for OSHMF. As aforementioned, OSHMF must be calculated based on OSHA in Korea. Using this method, a legal ratio of 1.45% was calculated for the 38 projects. The case study ratio (1.34%) was found to be almost the same (92.4%) as the legal ratio (1.45%). An expert group interview (refer to Table 2) conducted to examine this similarity showed that the government’s inspection of OSHMF was performed at 90% of the process rate for most projects. For this reason, it was estimated that the case study ratio in Korea was highly likely to converge at approximately 90% of the legal ratio.
Figure 5 shows the proportions of the components of APC and the ratios of each OSHMF item to OSHMF. OSHMF represents the largest proportion (68.8%) among the APC components, comprising ten detailed items. Among the items, SF (41.5%), SMS (32.5%), PPE (9.9%), and SSM (7.7%) accounted for 91.5%. Table 9 summarizes more detailed information on the average and standard deviation of the OSHMF items as well as their ratios with OSHMF. Through this analysis, both OSHMF and SME are legally stipulated, but OSHMF is about 31.3 times larger than that of SME. The reason is that, in the case of OSHMF, it is strongly managed by regular safety inspection by MOEL, the organizer, but in the case of SME, legal regulations are weak.
Conversely, Table 10 lists the analysis results of the ratios of SME items to TCC. SMEs comprised six items adding up to 0.04%, significantly lower compared with OSHMF. This lower value is obtained because OSHMF must be calculated at a certain legal rate compared with the target amount based on OSHA, but CTPA does not specify a legal rate for SMEs. Among the 38 projects, SMEs were appropriated for only 12 projects (31.6%) in the budget. In addition, SMEs were significantly different depending on the project, possibly because the level of awareness of SMEs is significantly low as there was no separate inspection on the use of SMEs after the approval of the safety management plan according to the expert group interview (refer to Table 2) [33]. Furthermore, it is difficult to find and analyze SME-invested items on the execution statement, and calculation criteria for SMEs are not specific. Therefore, efficient calculation of SMEs in an actual project is significantly limited [45]. A similar structural phenomenon of APC can also be found in a study by Ibarrondo-Dávila et al. [35], where the investment cost was not identified in the income statement for construction companies in Spain because its components were dispersed in different accounting items.

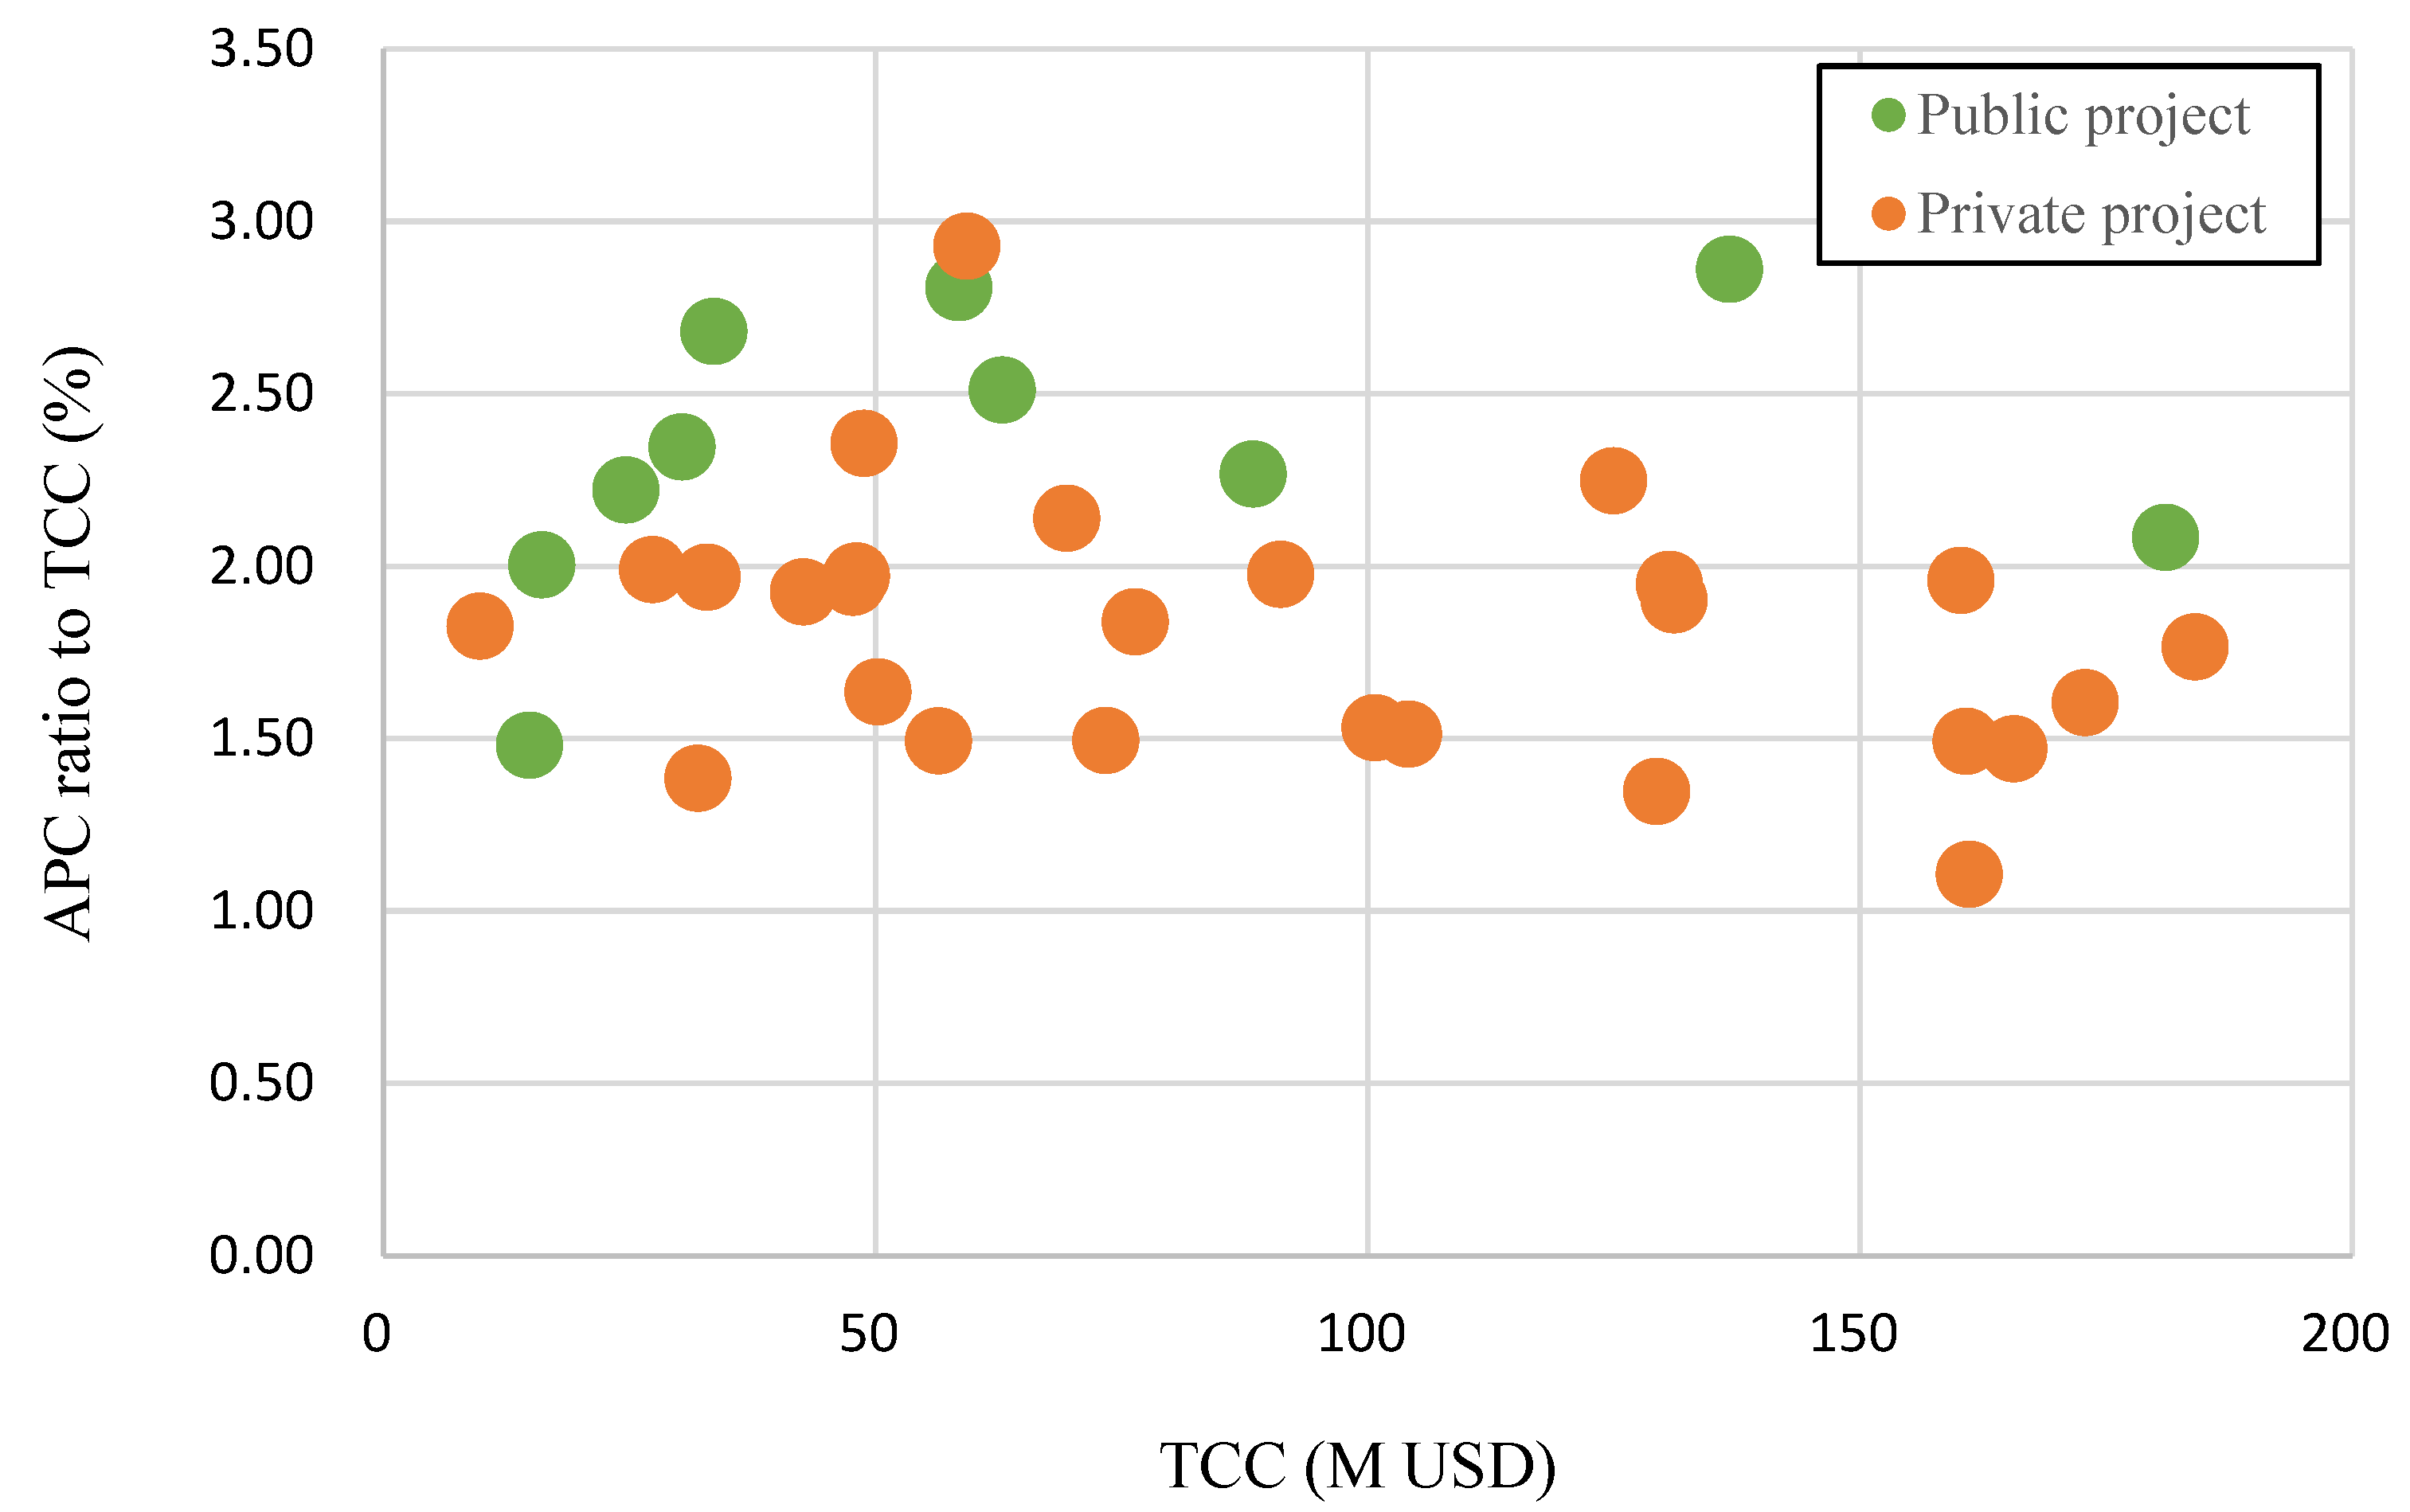
4.2. Analysis by Client Types

Figure 6 is a scatter plot showing the APC ratio to TCC by client types. Once the 38 target projects were divided based on client types, they were divided into two groups: 10 public projects and 28 private projects. The independent sample t-test was conducted to verify the average difference between the two groups, with the results listed in Table 11.
According to Levene’s test for the equality of variances, both groups can be assumed to have equal variances because the significance was 0.678 at the 95% confidence interval. In addition, given that the two-tailed significance was calculated to be 0.001, the average difference between the two groups can be said to be significant. Therefore, it is judged that the average APC of public projects is approximately 128.7% higher than that of private projects in Korea, possibly because APC is managed more strictly in public projects owing to their characteristics compared with private projects.
Figure 7 and Figure 8 are duplex comparison graphs showing OSHMF and SME items’ rates to OSHMF and SME by client types. For OSHMF, SF (39.8%) showed the largest proportion followed by SMS (37.8%) and PPE (12.4%) in public projects, while SF (42.2%) exhibited the largest proportion followed by SMS (30.1%) and SSM (11.0%) in private projects. These results indicate that private projects spend more on safety management costs for subcontractors than public projects.
For SME, TSM (29.3%) exhibited the largest proportion followed by SI (24.6%) and SDP (12.4%) in public projects, while SI (47.1%) yielded the largest proportion followed by TSM (13.1%) and SDP (12.9%) in private projects. It was determined that TSM yielded the largest proportion in public projects because they were mostly focused on infrastructure construction, while SI exhibited the largest proportion in private projects because they involved more complex tasks and many safety accidents.

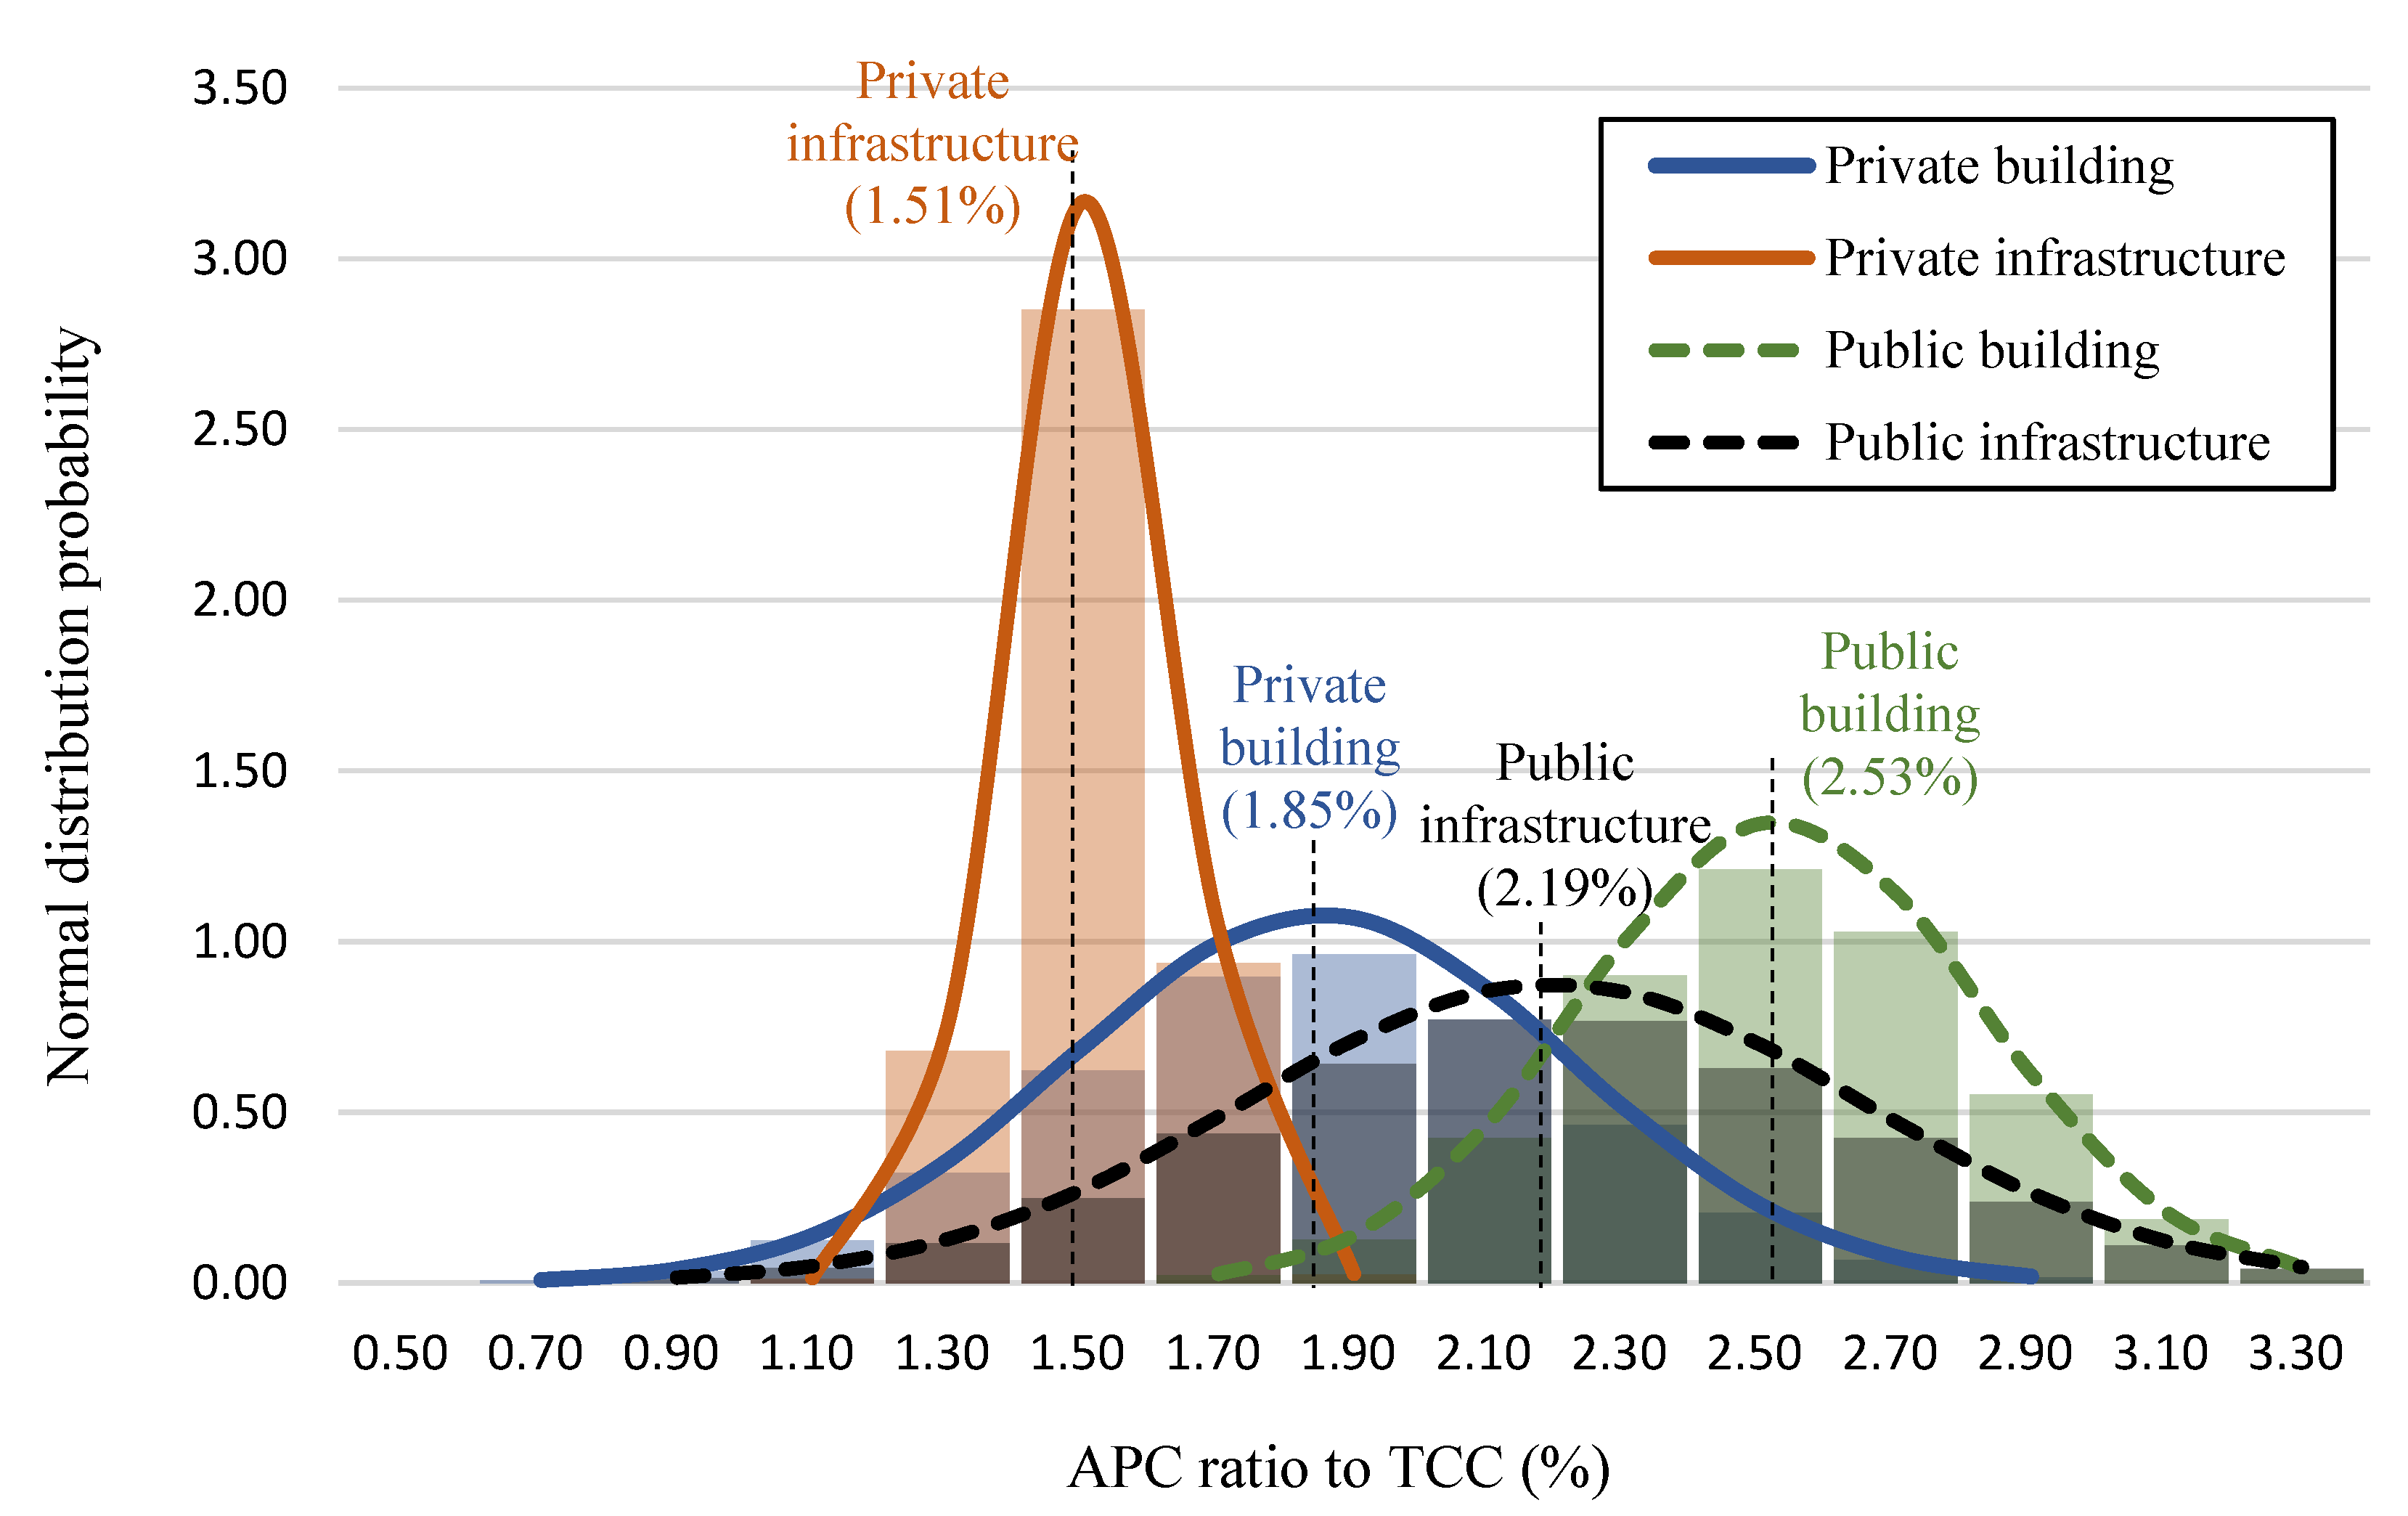
4.3. Analysis by Facility Types

Figure 9 shows the APC ratio to TCC in a scatter plot by dividing the 38 target projects into four facility types. The four groups comprised 4 public buildings, 6 public infrastructures, 25 private buildings, and 3 private infrastructures, respectively. One-way ANOVA was used to verify the differences among the average values of the four groups, with the results listed in Table 12.
According to the test of homogeneity of variances, all four groups can be assumed to have equal variances because the significance value was 0.510 at the 95% confidence interval. Given that the significance value of one-way ANOVA was found to be 0.002, there is a difference between the average values of at least any two groups among the four groups.
To examine any differences between the average values of any two groups, the post hoc-test (Multiple comparisons, Scheffé) was conducted as shown in Table 13. The results indicated a significant difference among the average values of public buildings, private buildings, public infrastructure, and private infrastructure groups at the 95% confidence interval. In addition, at the 90% confidence interval, a difference between the average values of the public building and private infrastructure groups can be interpreted.
For an easy comparison of the average and frequency among the four groups, the normal distribution probability is shown in Figure 10. Among the four groups, public buildings (2.53%) yielded the highest APC ratio to TCC followed by public infrastructures (2.19%), private buildings (1.85%), and private infrastructures (1.51%). These results indicate that the APC ratio to TCC is higher in public projects and buildings than in private projects and infrastructures. These observations show that it is necessary to distinguish client types and facility types when APC is analyzed.

5. Conclusions

In this study, an APC quantification analysis structure was derived in consideration of the characteristics of the Korean construction industry, which were subsequently analyzed based on a case study. The results of this study can be summarized as follows.
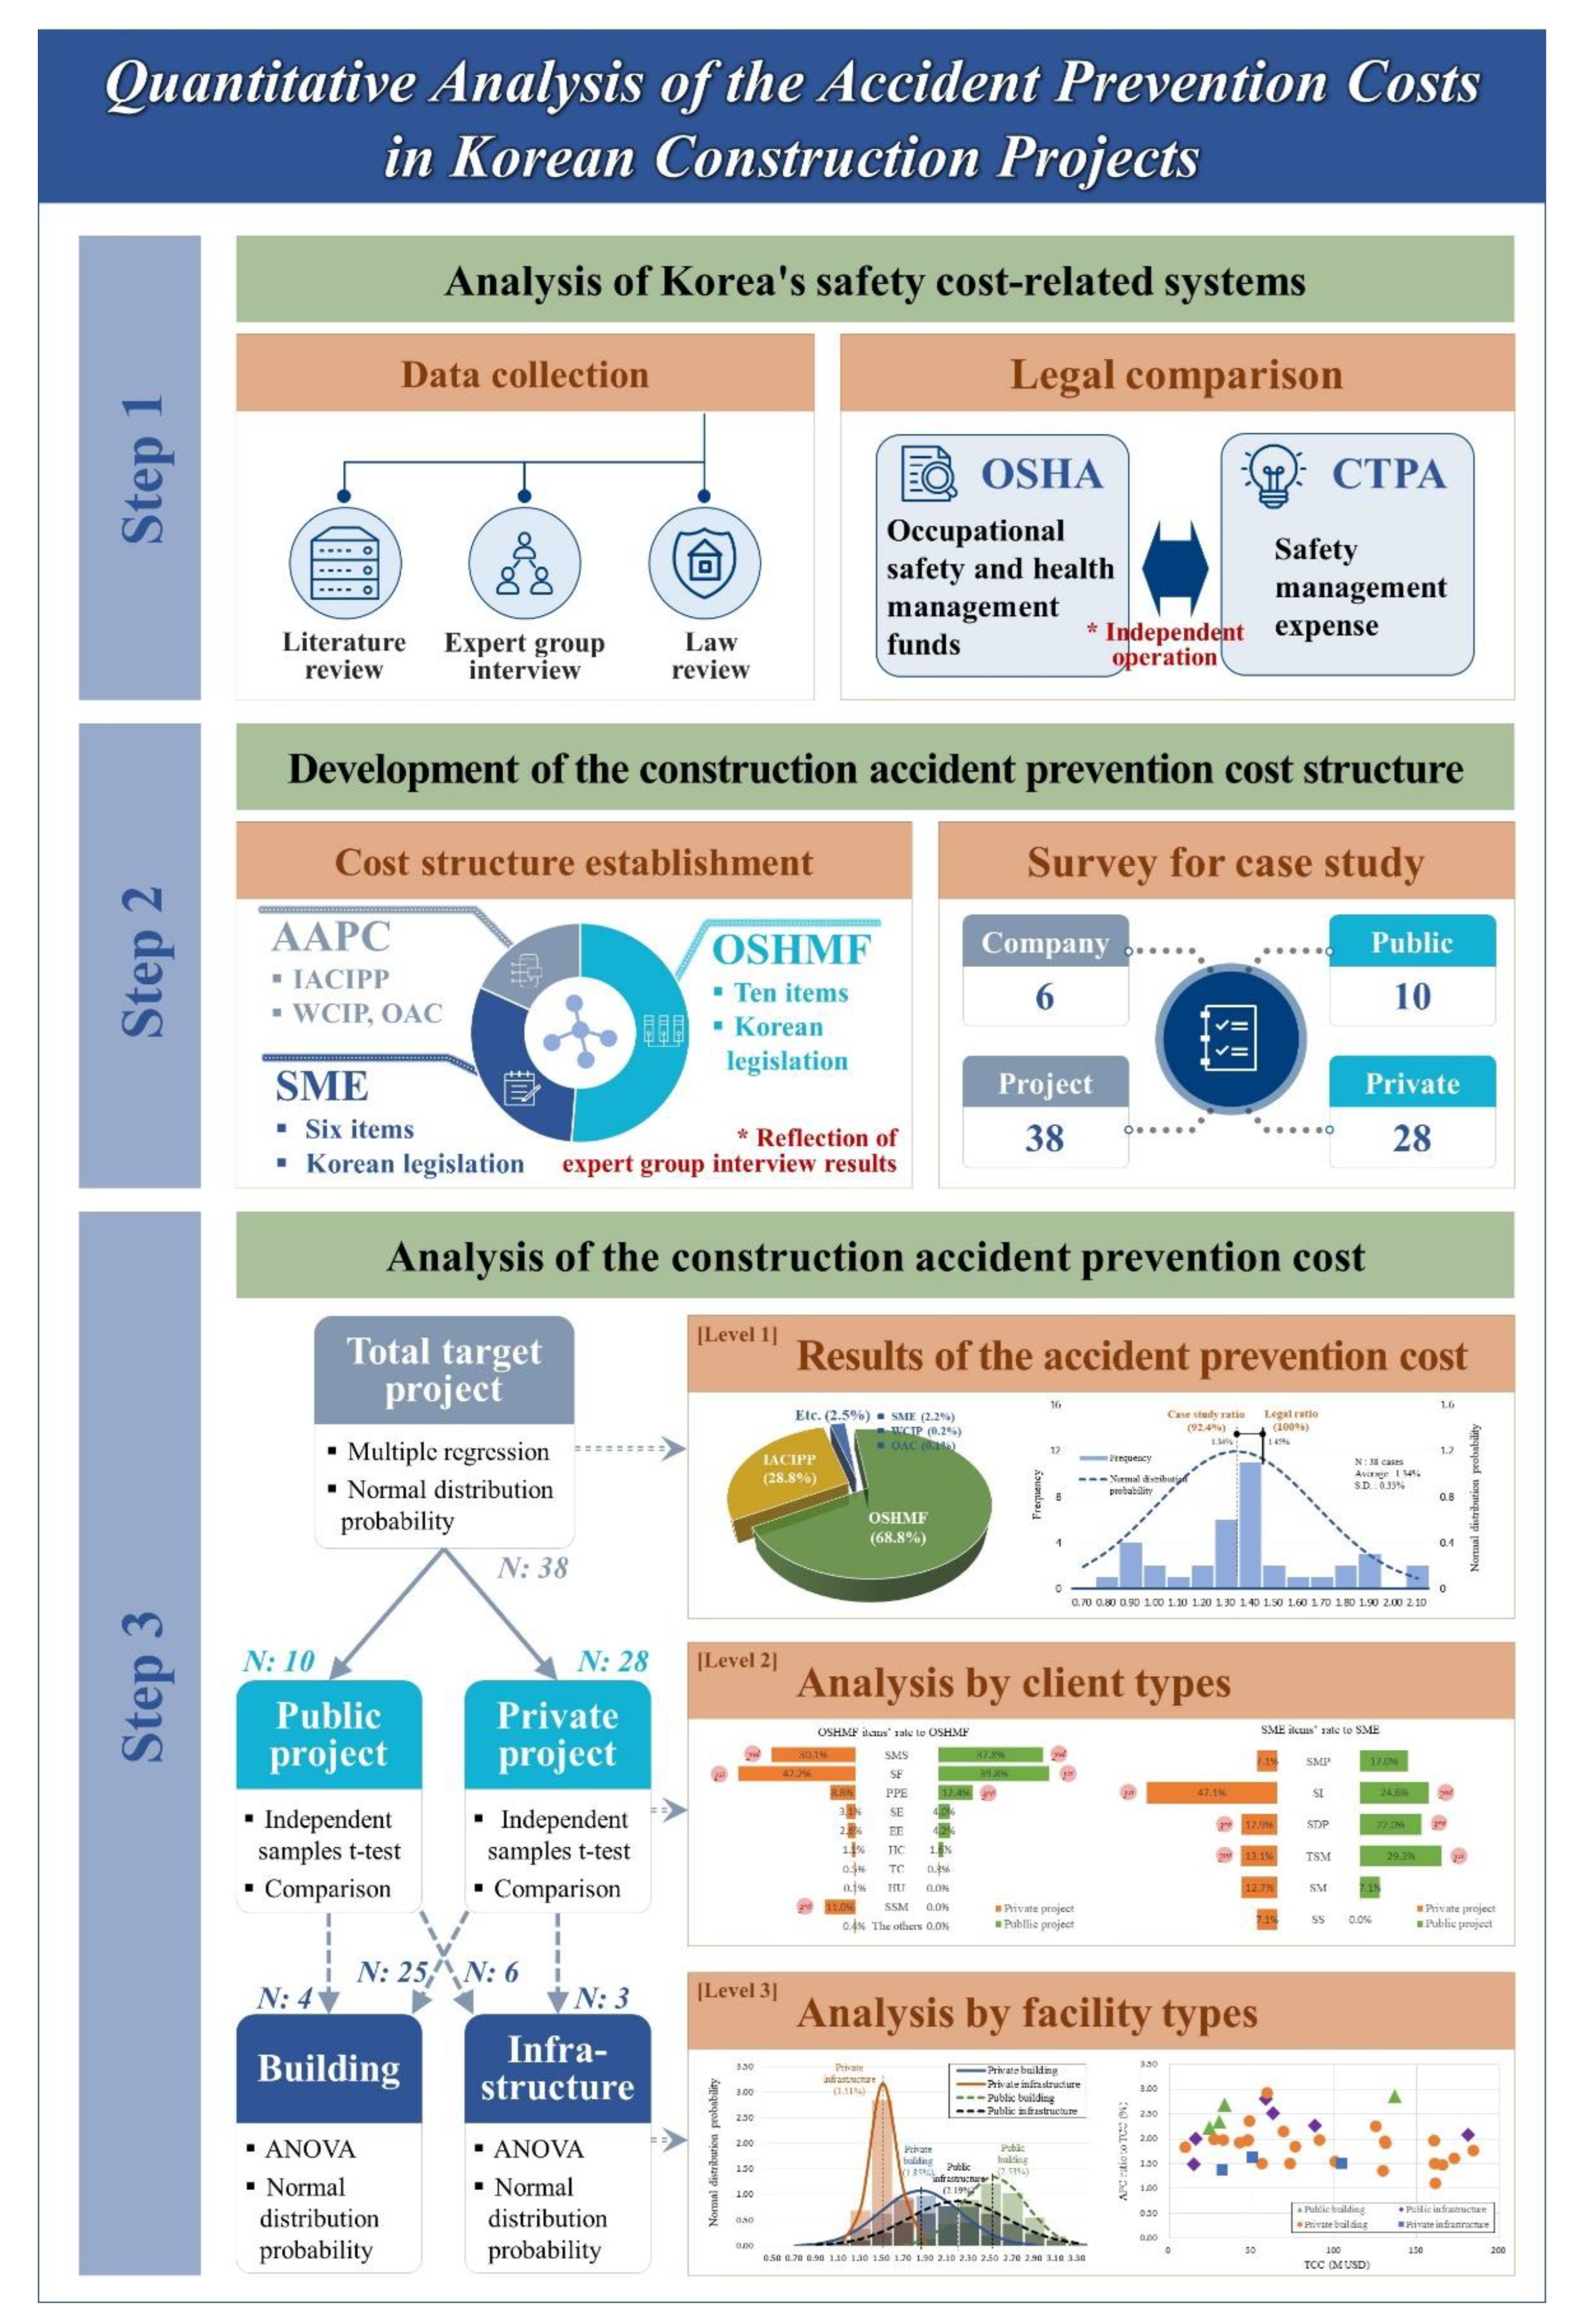
  • An APC quantification analysis structure that considers the characteristics of the Korean construction industry was derived based on a literature review, an expert group interview, and a law review.
  • The APC structure of the Korean construction industry comprised the following five items: OSHMF, SME, IACIPP, WCIP, and OAC.
  • When a survey was conducted for a case study, the questionnaires of 38 construction projects were recovered, excluding missing data.
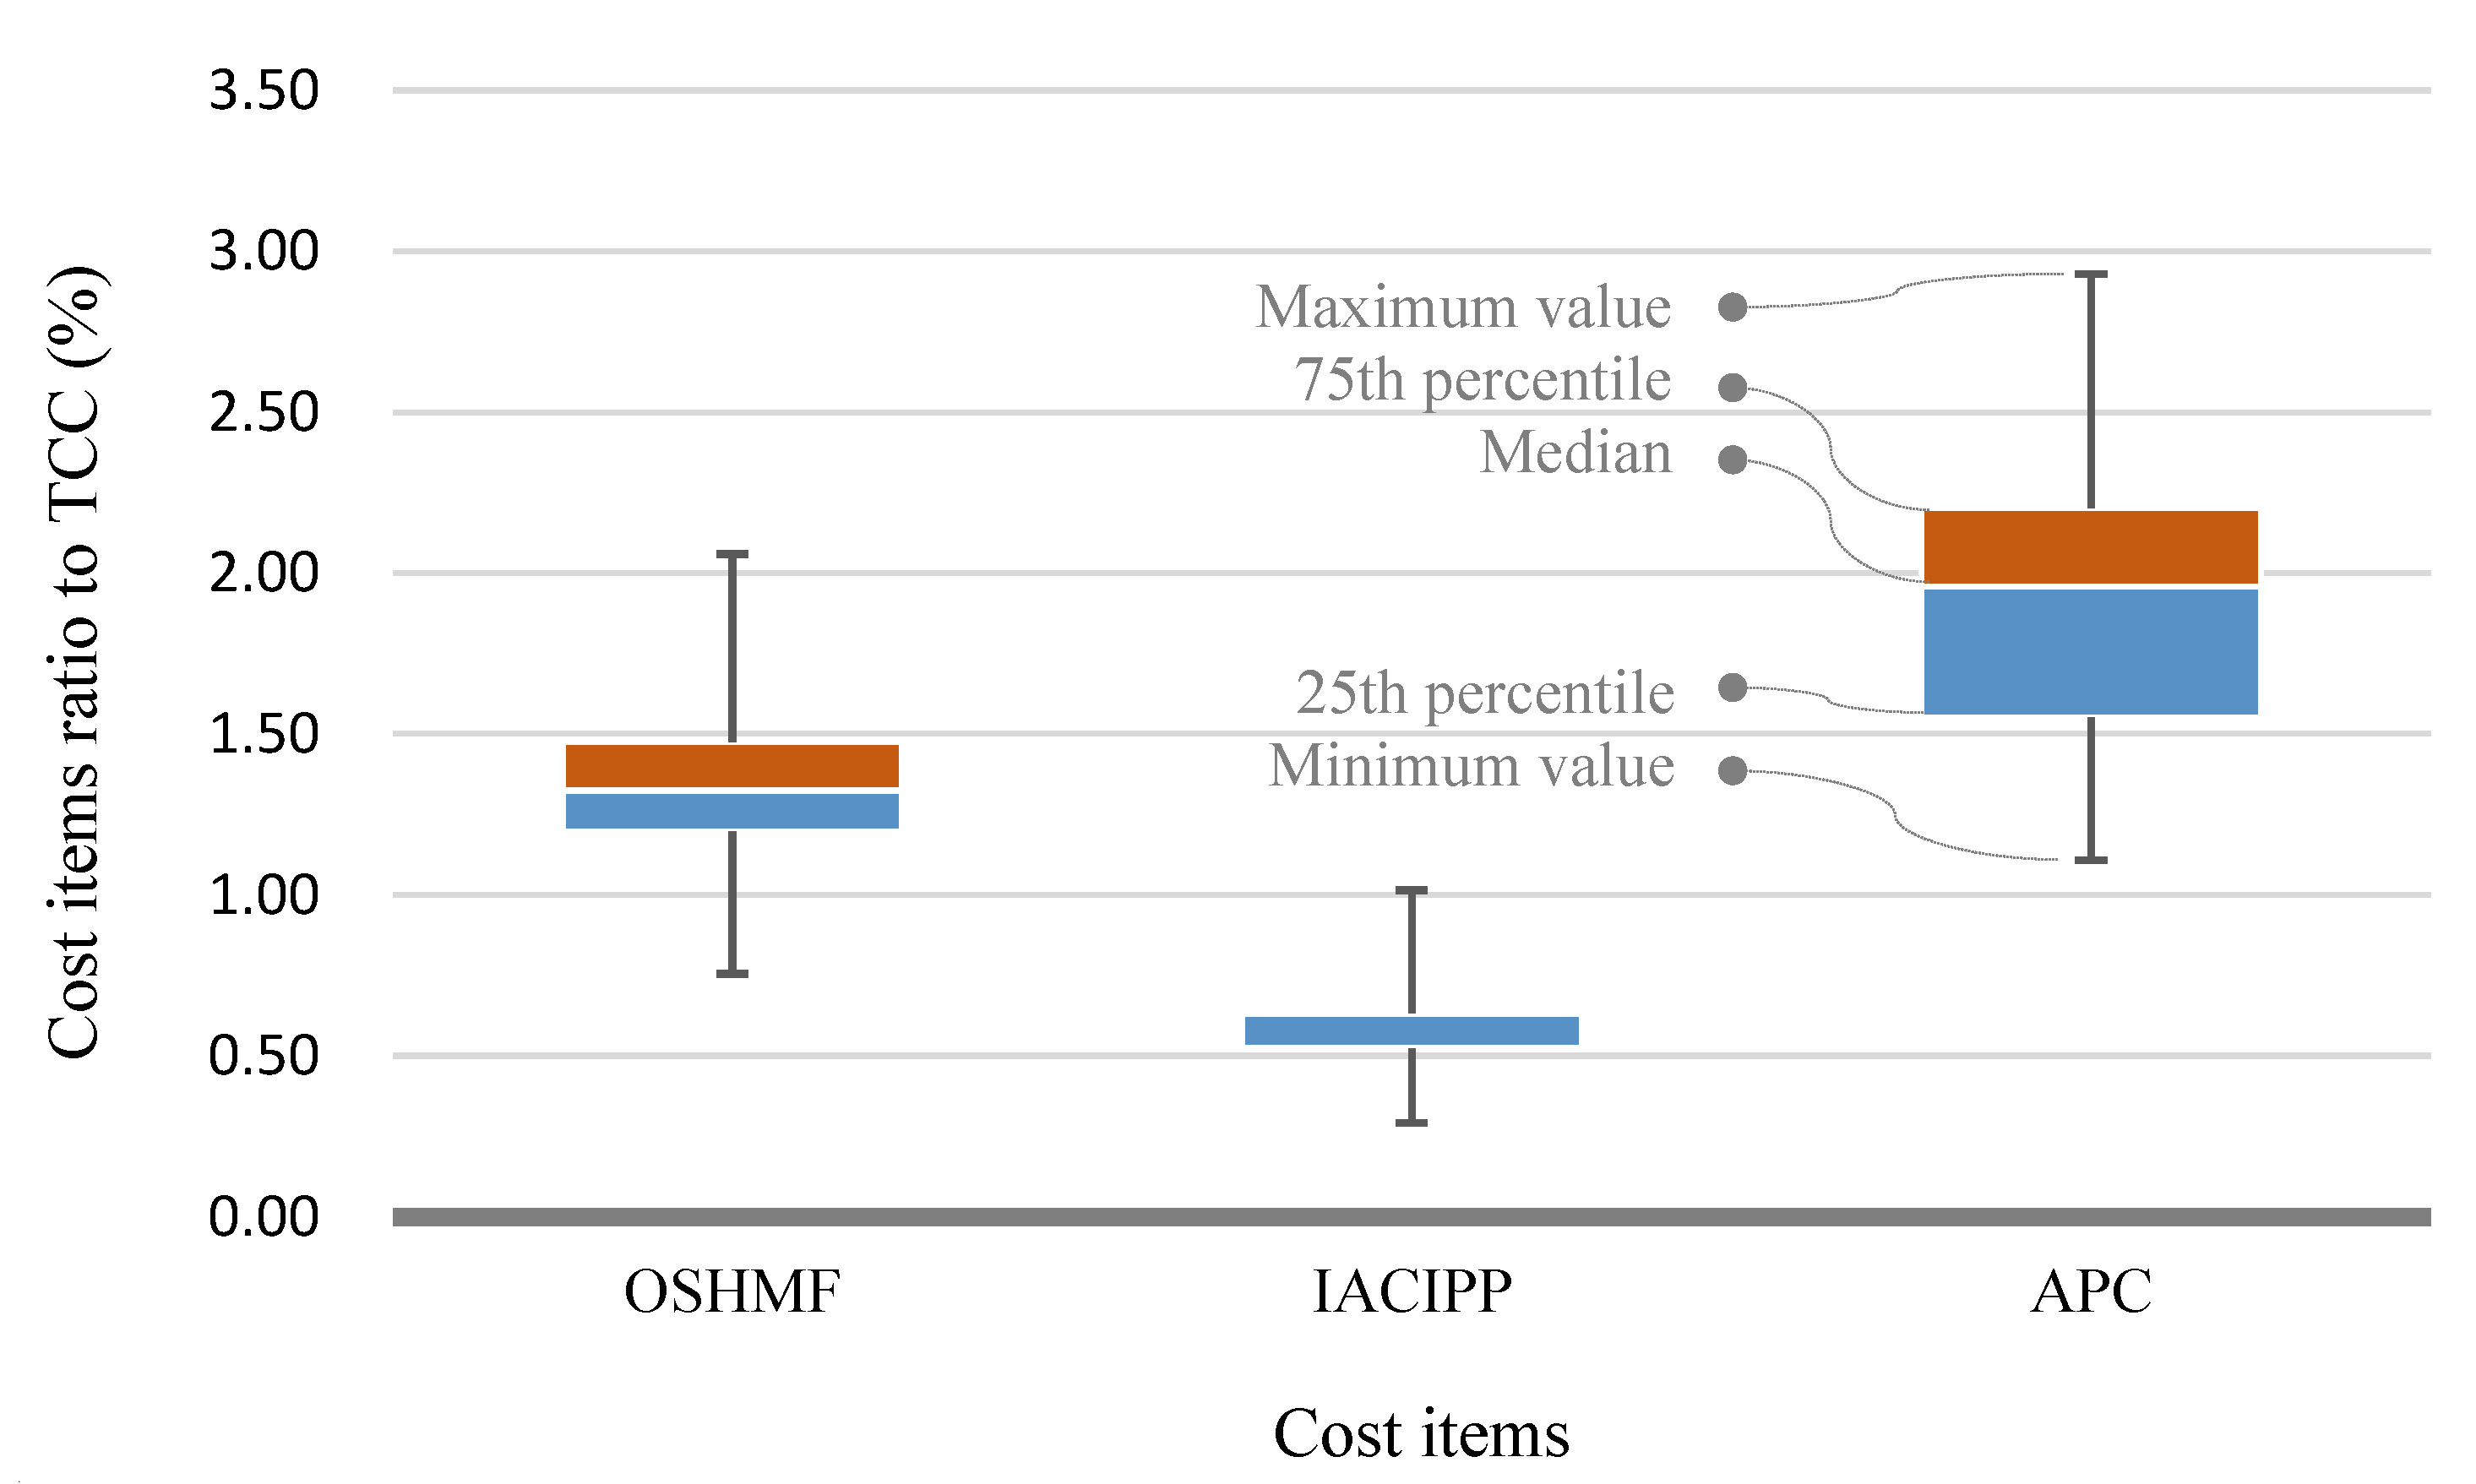
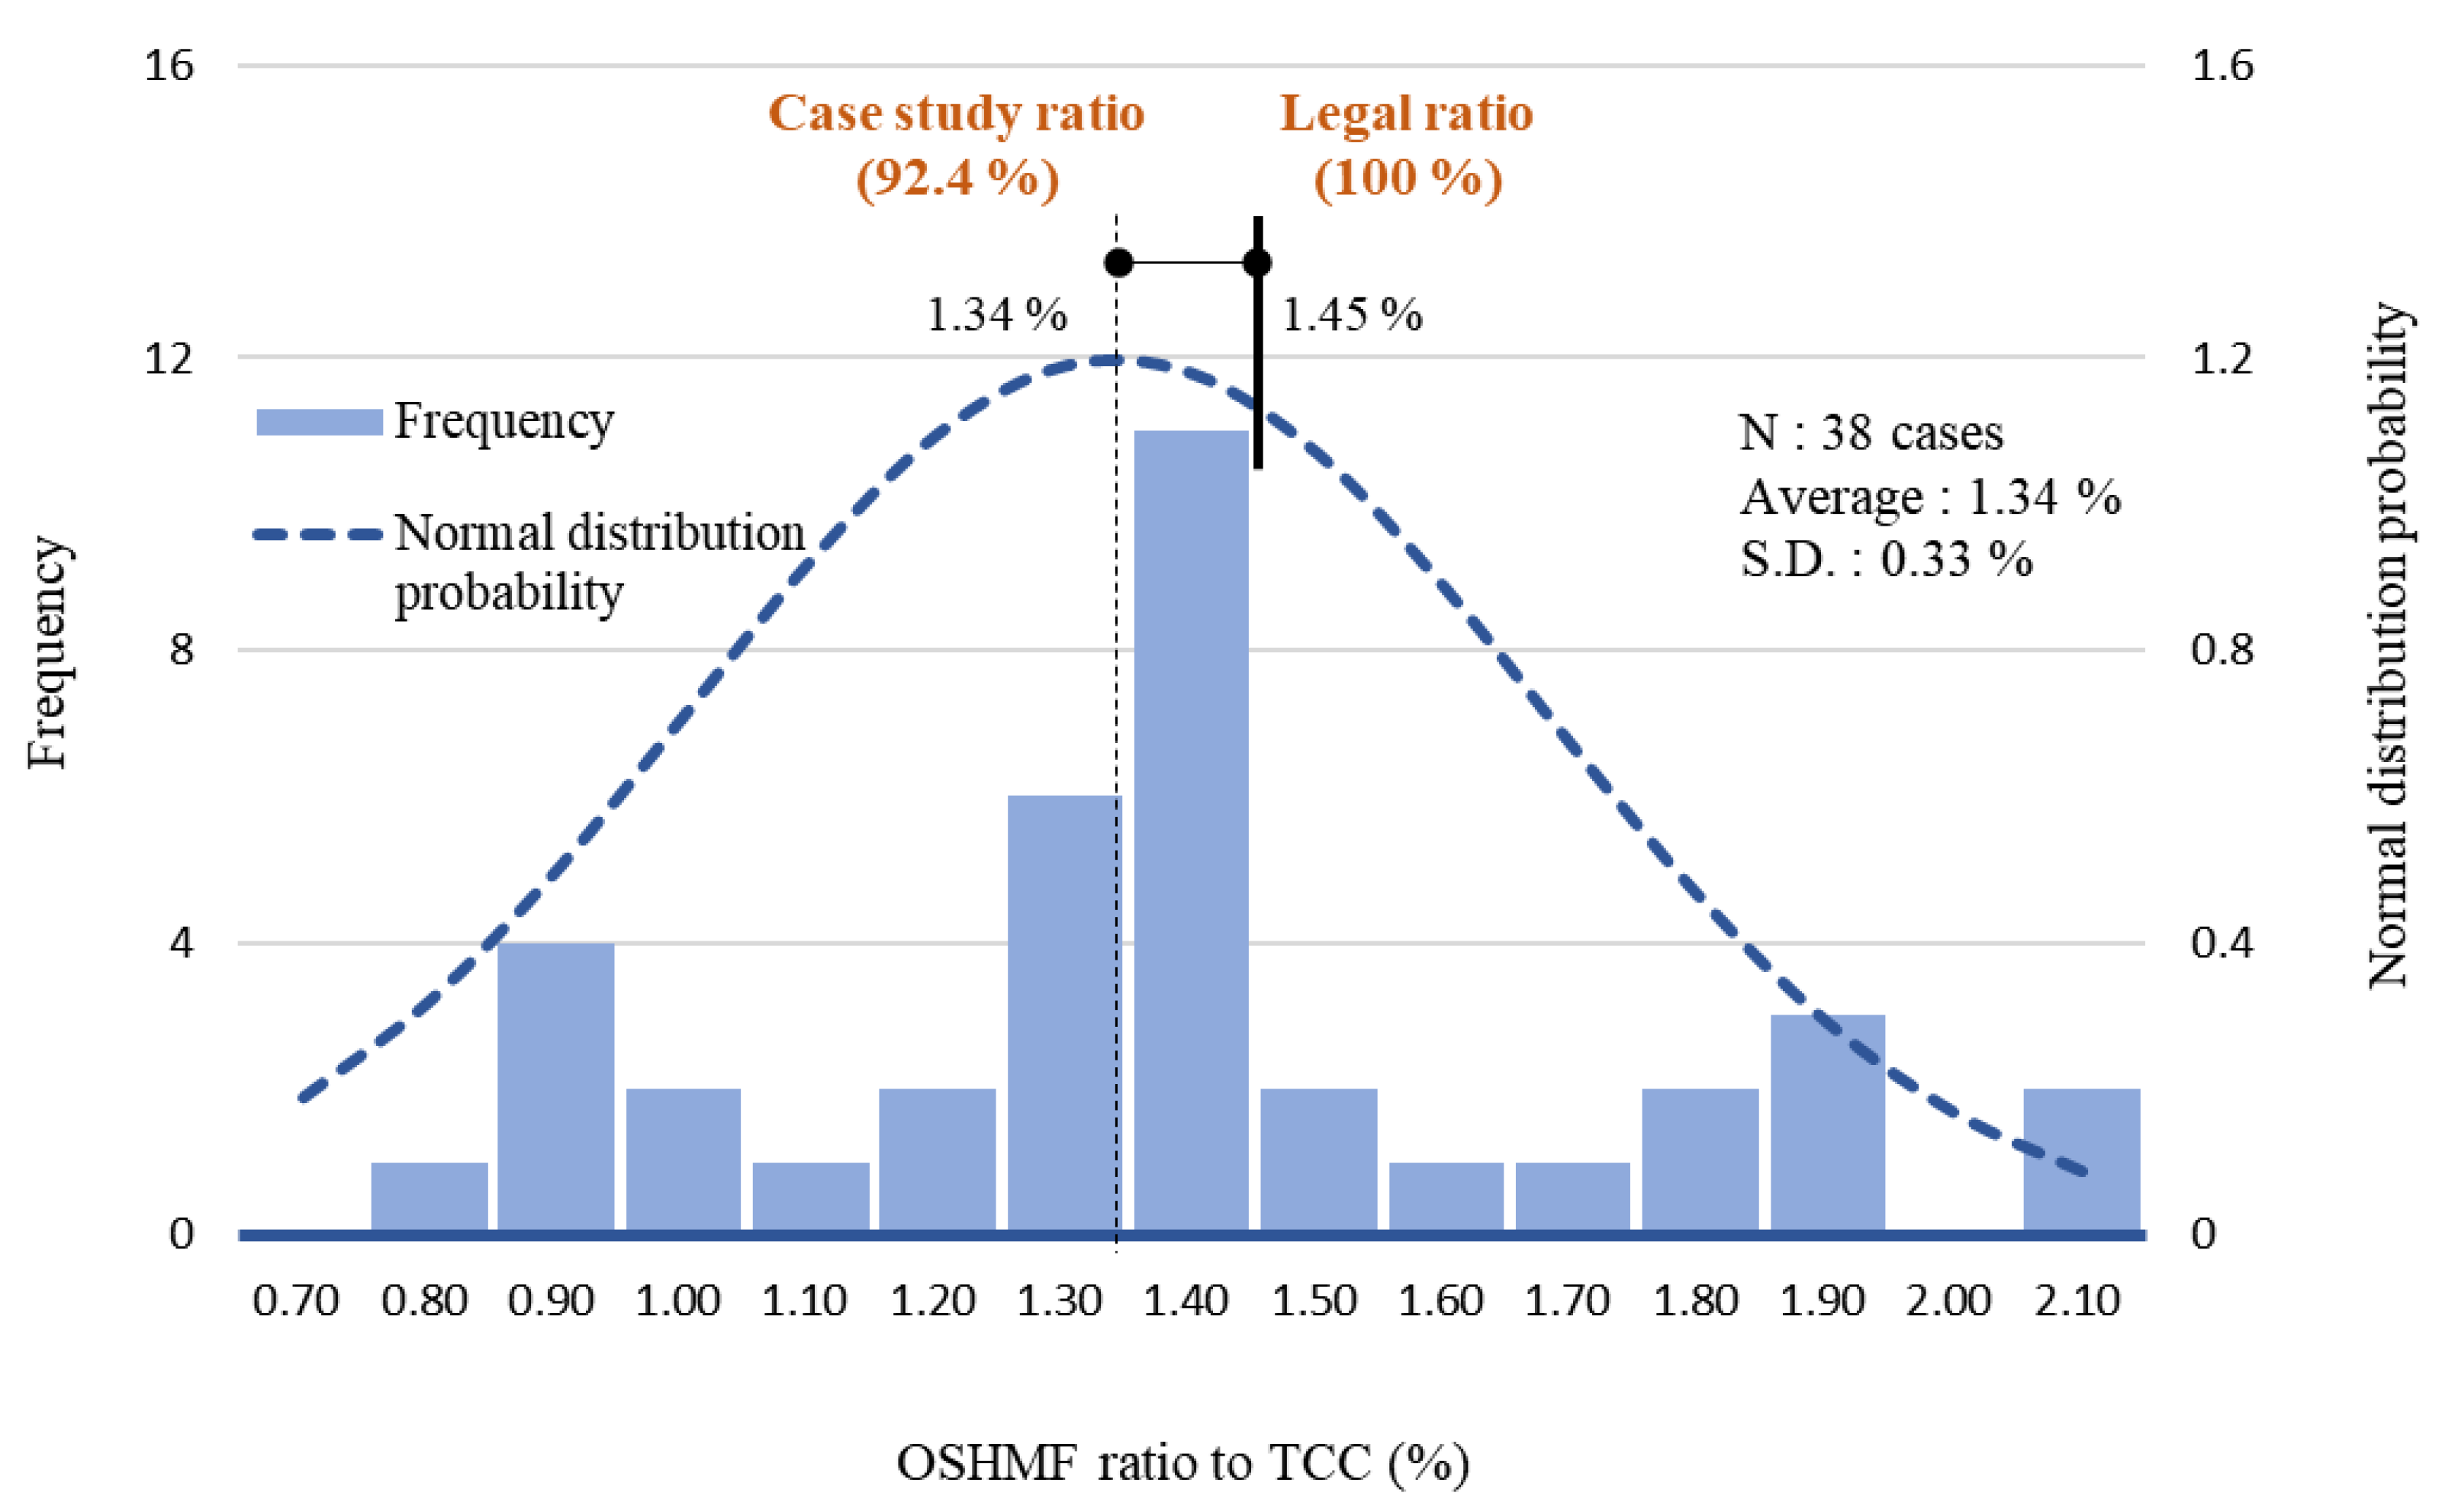
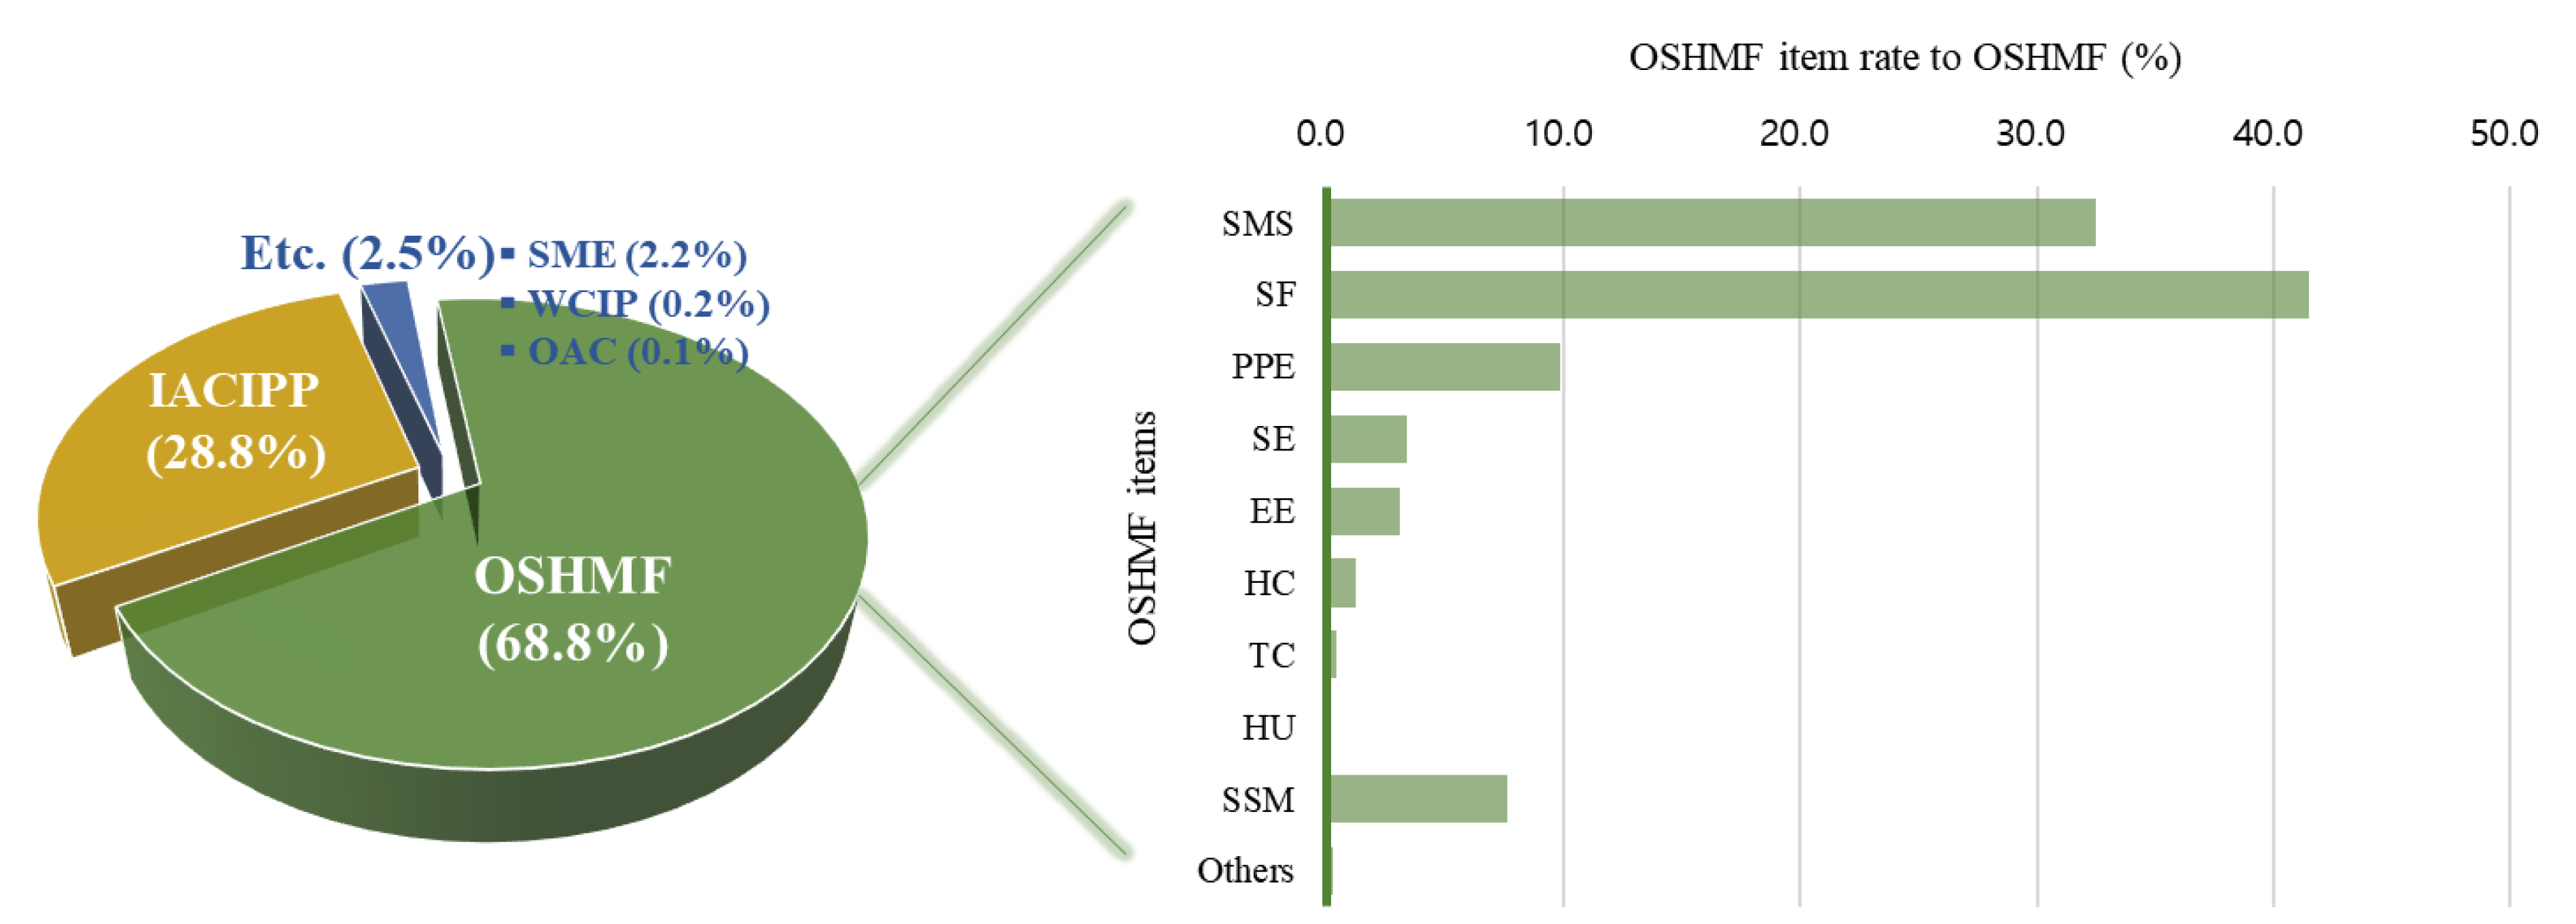
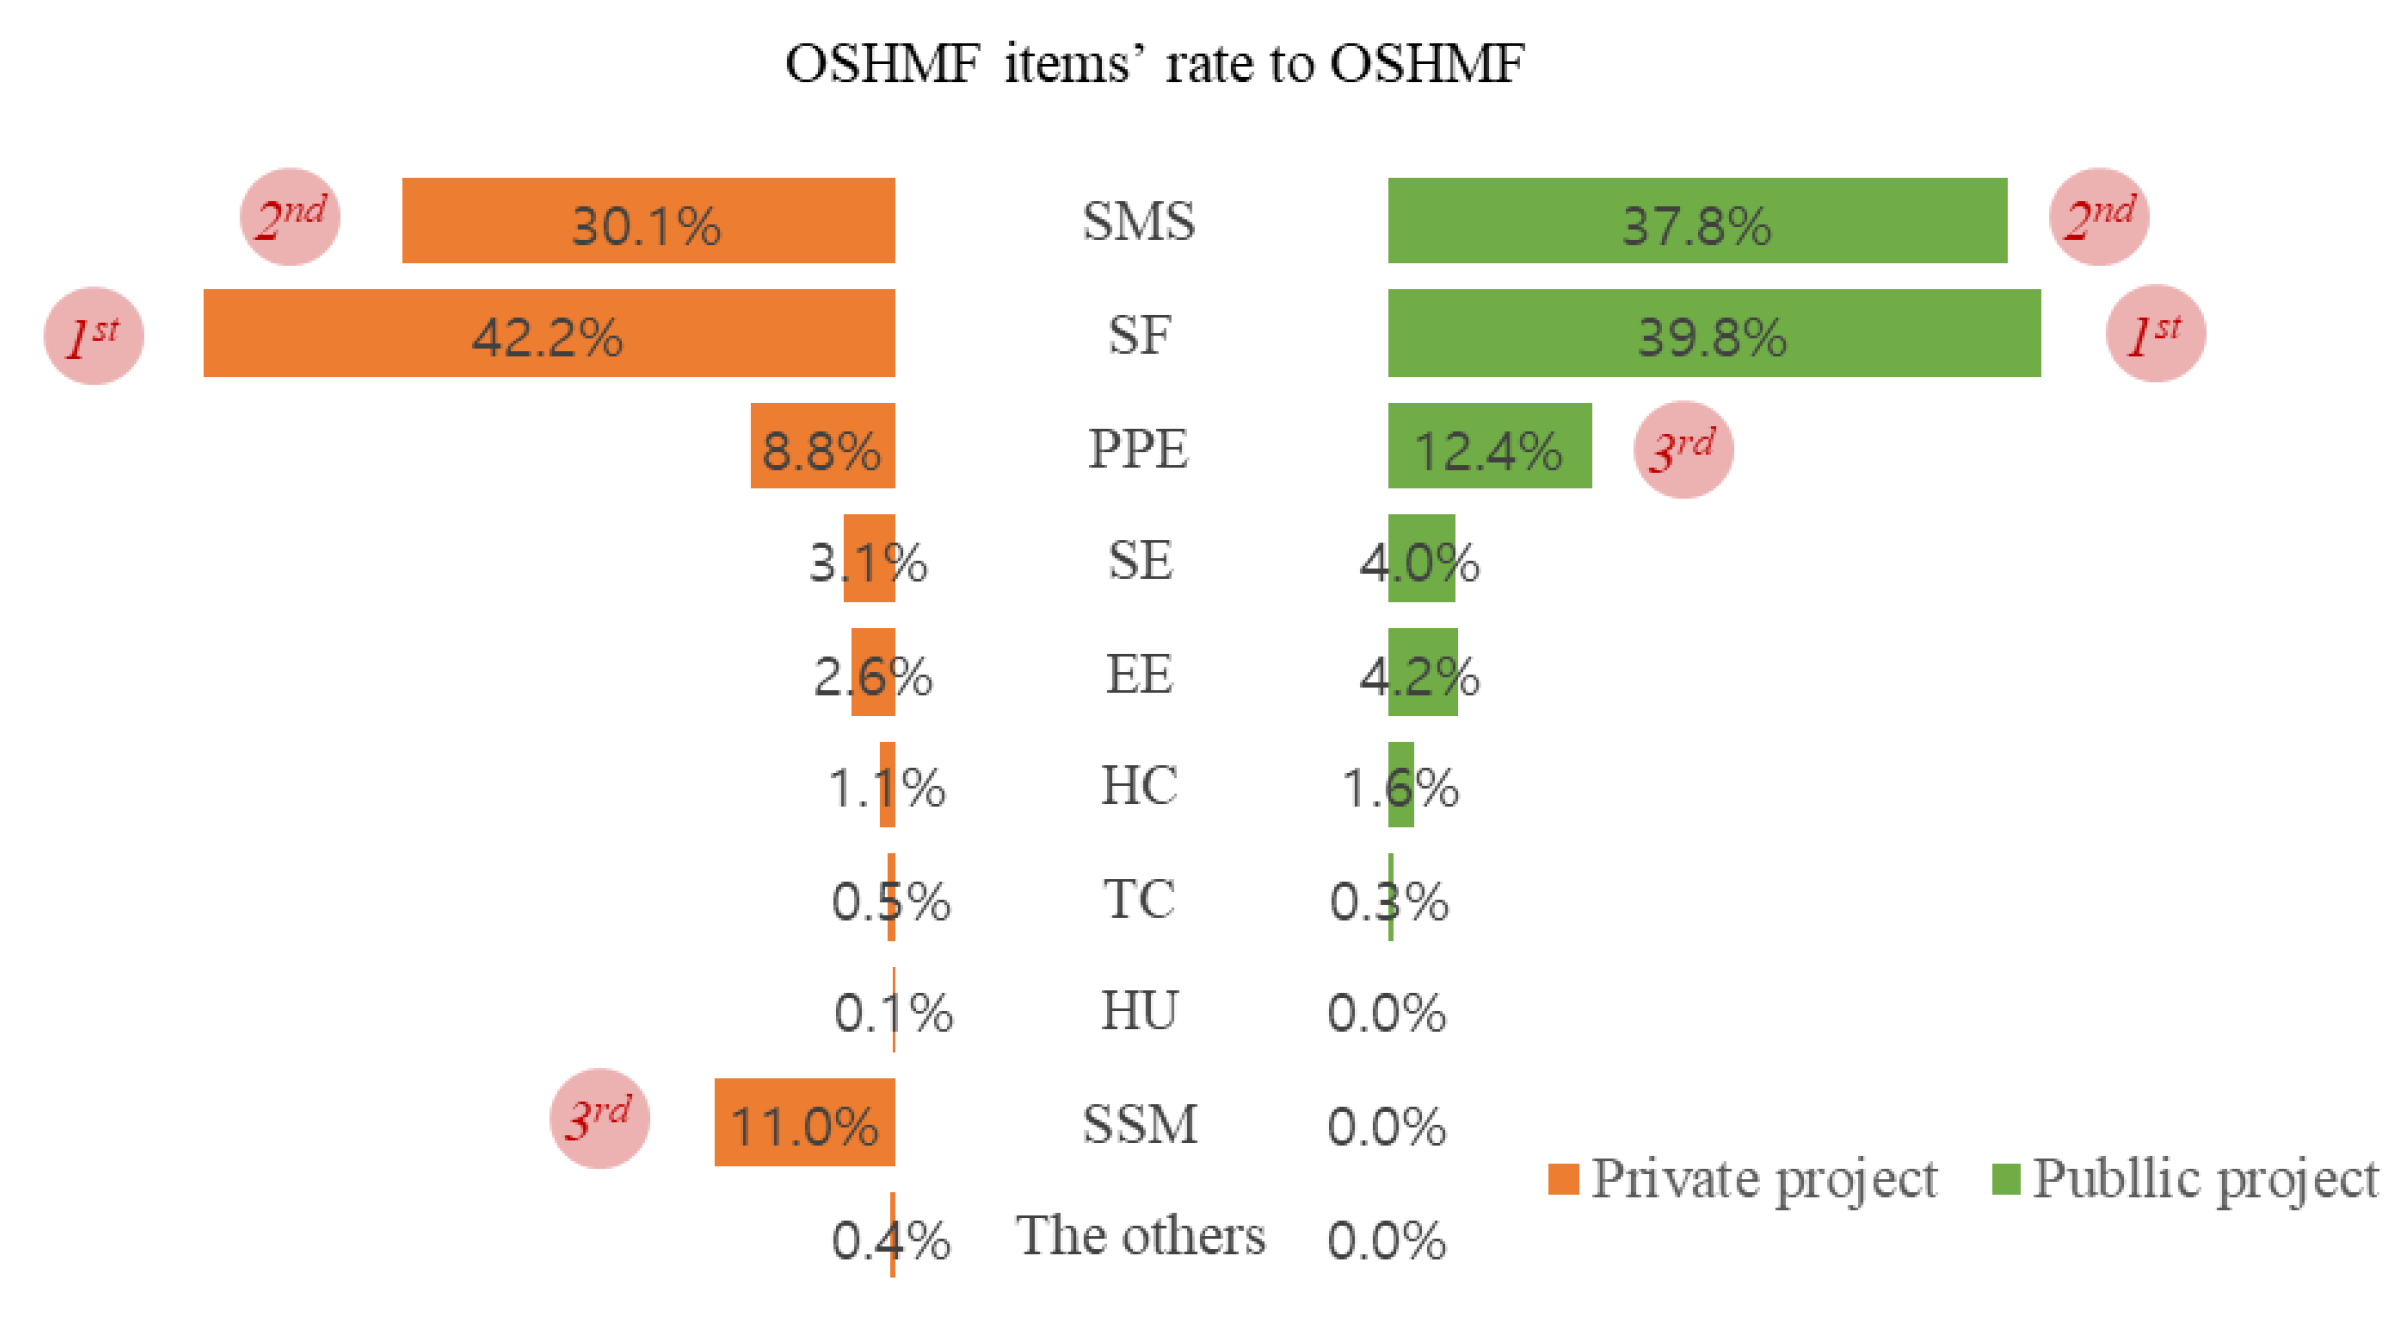
  • For the 38 target projects, the average ratio values of APC to TCC were calculated to be 1.95%. Among the detailed items of APC, OSHMF exhibited the largest proportion (68.8%), followed by IACIPP (28.8%). When multiple regression was performed, the relationship of APC (USD) = 5,531,443 (USD) + 49.40 × OSHMF (USD) + 54.50 × IACIPP (USD) was derived.
  • When the independent samples t-test was conducted on public and private projects according to client types, a significant difference between the average values of the two groups was observed because two-tailed significance values were calculated to be 0.001. It was found that the average APC of public projects was approximately 128.7% higher than that of private projects.
  • ANOVA and post hoc tests were conducted after dividing the 38 target projects into four groups according to facility types, with the results indicating a significant difference among the average values of public buildings, private buildings, public infrastructure, and private infrastructure groups at the 95% confidence interval.
This study contributed to the development of an APC quantification model based on OSHA and CTPA considerations to represent the characteristics of the Korean construction industry and conducted an objective analysis of the status and characteristics of APCs in Korea. However, there is a limitation in that only data on 38 sites were collected. Therefore, there is a need to increase the reliability of the derived calculation model by collecting additional data. In the future, these results are expected to be used as basic data to objectively and systematically evaluate the benefits of APCs according to the characteristics of target projects.

Author Contributions

J.L.: Methodology, Formal analysis, Resources, Validation, Visualization, Writing—Original draft. J.J. (Jaewook Jeong): Conceptualization, Supervision, Project administration, Writing—Review and Editing. J.S.: Methodology, Resources, Visualization, Writing—Original draft. J.J. (Jaemin Jeong): Methodology, Resources, Visualization, Writing—Review and Editing. All authors have read and agreed to the published version of the manuscript.

Funding

This study was financially supported by Seoul National University of Science and Technology.

Data Availability Statement

Not applicable.

Conflicts of Interest

The authors declare no conflict of interest.

Abbreviations

TCCTotal construction cost
OSHMFOccupational safety and health management funds
SMSSafety manager salary
SFSafety facility
PPEPersonal protective equipment
SESafety examination
EEEducational events
HCHealth care
TCTechnical consultant
HUHeadquarter use
SSMSubcontractor safety management
APCAccident prevention cost
SMESafety management expenses
SMPSafety management plan
SISafety inspection
SDPSurrounding damage prevention
TSMTraffic safety measure
SMSafety monitoring
SSStructural safety
AAPCAdditional accident prevention cost
IACIPPIndustrial accident compensation insurance and prevention premiums
WCIPWorker’s compensation insurance premiums
OACOther additional cost
OSHAOccupational Safety and Health Act
MOELMinistry of Employment and Labor
CTPAConstruction Technology Promotion Act
MOLITMinistry of Land, Infrastructure and Transport
IACIAIndustrial Accident Compensation Insurance Act

References

  1. International Labour Organization (ILO). International Labour Standards on Occupational Safety and Health. 2019. Available online: https://www.ilo.org/global/standards/subjects-covered-by-international-labour-standards/occupational-safety-and-health/lang--en/index.htm (accessed on 19 April 2022).
  2. International Labour Organization (ILO). World Day for Safety and Health at Work 2019. 2019. Available online: https://www.ilo.org/safework/events/safeday/lang--en/index.htm (accessed on 19 April 2022).
  3. Jeong, J.; Jeong, J. Comparative analysis of degree of risk between the frequency aspect and probability aspect using integrated uncertainty method considering work type and accident type in construction industry. Appl. Sci. 2022, 12, 1131. [Google Scholar] [CrossRef]
  4. Shim, Y.; Jeong, J.; Jeong, J.; Lee, J.; Kim, Y. Comparative analysis of the national fatality rate in construction industry using time-series approach and equivalent evaluation conditions. Int. J. Environ. Res. Public Health 2022, 19, 2312. [Google Scholar] [CrossRef] [PubMed]
  5. Heidary Dahooie, J.; Vanaki, A.S.; Firoozfar, H.R.; Zavadskas, E.K.; Čereška, A. An extension of the failure mode and effect analysis with hesitant fuzzy sets to assess the occupational hazards in the construction industry. Int. J. Environ. Res. Public Health 2020, 17, 1442. [Google Scholar] [CrossRef] [PubMed]
  6. Rodrigues, F.; Baptista, J.S.; Pinto, D. BIM approach in construction safety—A case study on preventing falls from height. Buildings 2022, 12, 73. [Google Scholar] [CrossRef]
  7. Sánchez Colmenarejo, J.I.; Camprubí, F.M.; González-Gaya, C.; Sánchez-Lite, A. Power Plant Construction Projects Risk Assessment: A Proposed Method for Temporary Systems of Commissioning. Buildings 2022, 12, 1260. [Google Scholar] [CrossRef]
  8. Sola-Caraballo, J.; Rincón-Calderón, J.M.; Rivera-Gómez, C.; López-Martínez, J.A.; Galán-Marín, C. On-Site Risk Assessment Methodology of Historic Timber Structures: The Case Study of Santa Cruz Church. Buildings 2022, 12, 935. [Google Scholar] [CrossRef]
  9. Marić, M.K.; Ivanković, A.M.; Srbić, M.; Skokandić, D. Assessment of Performance Indicators of a Large-Span Reinforced Concrete Arch Bridge in a Multi-Hazard Environment. Buildings 2022, 12, 1046. [Google Scholar] [CrossRef]
  10. Jeong, J.; Jeong, J. Quantitative risk evaluation of fatal incidents in construction based on frequency and probability analysis. J. Manag. Eng. 2022, 38, 04021089. [Google Scholar] [CrossRef]
  11. Moaveni, S.; Banihashemi, S.Y.; Mojtahedi, M. A conceptual model for a safety-based theory of lean construction. Buildings 2019, 9, 23. [Google Scholar] [CrossRef]
  12. Soh, J.; Jeong, J.; Jeong, J. Improvements of design for safety in construction through multi-participants perception analysis. Appl. Sci. 2020, 10, 4550. [Google Scholar] [CrossRef]
  13. Gurcanli, G.E.; Bilir, S.; Sevim, M. Activity based risk assessment and safety cost estimation for residential building construction projects. Saf. Sci. 2015, 80, 1–12. [Google Scholar] [CrossRef]
  14. Lee, J.; Jeong, J.; Soh, J.; Jeong, J. Development of framework for estimating fatality-related losses in the Korean construction industry. Int J. Environ. Res. Public Health 2021, 18, 8787. [Google Scholar] [CrossRef] [PubMed]
  15. Hallowell, M.R. Risk-based framework for safety investment in construction organizations. J. Construct. Eng. Manag. 2011, 137, 592–599. [Google Scholar] [CrossRef]
  16. Lu, M.; Cheung, C.M.; Li, H.; Hsu, S.C. Understanding the relationship between safety investment and safety performance of construction projects through agent-based modeling. Accid. Anal. Prevent. 2016, 94, 8–17. [Google Scholar] [CrossRef] [PubMed]
  17. Han, Y.; Li, J.; Cao, X.; Jin, R. Structural equation modeling approach to studying the relationships among safety investment, construction employees’ safety cognition, and behavioral performance. J. Construct. Eng. Manag. 2020, 146, 04020065. [Google Scholar] [CrossRef]
  18. Yiu, N.S.; Chan, D.W.; Sze, N.N.; Shan, M.; Chan, A.P. Implementation of safety management system for improving construction safety performance: A structural equation modelling approach. Buildings 2019, 9, 89. [Google Scholar] [CrossRef]
  19. Tan, H.; Wang, H.; Chen, L.; Ren, H. Empirical analysis on contribution share of safety investment to economic growth: A case study of Chinese mining industry. Saf. Sci. 2012, 50, 1472–1479. [Google Scholar] [CrossRef]
  20. Wang, Z.; Hofer, C.; Dresner, M.E. Financial condition, safety investment and accident propensity in the US airline industry: A structural analysis. Transport. Res. Part. E Logist. Transport. Rev. 2013, 49, 24–32. [Google Scholar] [CrossRef]
  21. Aminbakhsh, S.; Gunduz, M.; Sonmez, R. Safety risk assessment using analytic hierarchy process (AHP) during planning and budgeting of construction projects. J. Saf. Res. 2013, 46, 99–105. [Google Scholar] [CrossRef]
  22. Ma, Y.; Zhao, Q.; Xi, M. Decision-makings in safety investment: An opportunity cost perspective. Saf. Sci. 2016, 83, 31–39. [Google Scholar] [CrossRef]
  23. Lee, J.; Jeong, J.; Soh, J.; Jeong, J. Quantification analysis of safety investment cost and fatal accident cost in construction. J. Archit. Inst. Korea 2021, 37, 211–218. [Google Scholar]
  24. Tappura, S.; Sievänen, M.; Heikkilä, J.; Jussila, A.; Nenonen, N. A management accounting perspective on safety. Saf. Sci. 2015, 71, 151–159. [Google Scholar] [CrossRef]
  25. Mohammadi, A.; Tavakolan, M.; Khosravi, Y. Factors influencing safety performance on construction projects: A review. Saf. Sci. 2018, 109, 382–397. [Google Scholar] [CrossRef]
  26. Muhammad, B.A.; Abdulateef, I.; Ladi, B.D. Assessment of cost impact in health and safety on construction projects. Am. J. Eng. Res. 2015, 4, 25–30. [Google Scholar]
  27. Akcay, C.; Aslan, S.; Sayin, B.; Manisalı, E. Estimating OHS costs of building construction projects based on mathematical methods. Saf. Sci. 2018, 109, 361–367. [Google Scholar] [CrossRef]
  28. Aven, T.; Hiriart, Y. The use of a basic safety investment model in a practical risk management context. Reliab. Eng. Syst. Saf. 2011, 96, 1421–1425. [Google Scholar] [CrossRef]
  29. Ministry of Employment and Labor (MOEL). Occupational Safety and Health Act (OSHA). Article 72. 2020. Available online: https://elaw.klri.re.kr/kor_service/lawView.do?hseq=55395&lang=ENG (accessed on 30 April 2022).
  30. Ministry of Land, Infrastructure and Transport (MOLIT). Construction Technology Promotion Act (CTPA). Article 63. 2020. Available online: https://elaw.klri.re.kr/kor_service/lawView.do?hseq=54608&lang=ENG (accessed on 30 April 2022).
  31. Baek, Y.; Wee, K.; Baek, I.; Kim, J. A study on improvement of occupational safety and health management cost accounting standards. Korean J. Construct. Eng. Manag. 2020, 21, 39–46. [Google Scholar]
  32. Kim, S.H.; Kim, J.H.; Kim, B.S.; Park, J.K. A study on the actual condition of OSH expenses appropriation in the construction industry. J. Korea Saf. Manag. Sci. 2016, 18, 25–31. [Google Scholar]
  33. Yoon, Y.G.; Oh, T.K.; Lee, M.G.; Seong, J.H.; Jung, M.H. A study on the estimation of the proper rates of safety management cost in the construction technology promotion law for reasonable construction safety management. J. Korean Soc. Saf. 2018, 33, 84–91. [Google Scholar]
  34. Yi, K.J. Accident prevention cost-effectiveness of current safety manager assignment policies. J. Archit. Instit. Korea Struct. Construct. 2008, 24, 161–168. [Google Scholar]
  35. Ibarrondo-Dávila, M.P.; López-Alonso, M.; Rubio-Gámez, M.C. Managerial accounting for safety management. The case of a Spanish construction company. Saf. Sci. 2015, 79, 116–125. [Google Scholar] [CrossRef]
  36. Yılmaz, M.; Kanıt, R. A practical tool for estimating compulsory OHS costs of residential building construction projects in Turkey. Saf. Sci. 2018, 101, 326–331. [Google Scholar] [CrossRef]
  37. Ikpe, E.; Hammon, F.; Oloke, D. Cost-benefit analysis for accident prevention in construction projects. J. Construct. Eng. Manag. 2012, 138, 991–998. [Google Scholar] [CrossRef]
  38. López-Alonso, M.; Ibarrondo-Dávila, M.P.; Rubio-Gámez, M.C.; Munoz, T.G. The impact of health and safety investment on construction company costs. Saf. Sci. 2013, 60, 151–159. [Google Scholar] [CrossRef]
  39. Feng, Y. Effect of safety investments on safety performance of building projects. Saf. Sci. 2013, 59, 28–45. [Google Scholar] [CrossRef]
  40. Feng, Y.; Teo, E.A.L.; Ling, F.Y.Y.; Low, S.P. Exploring the interactive effects of safety investments, safety culture and project hazard on safety performance: An empirical analysis. Int. J. Proj. Manag. 2014, 32, 932–943. [Google Scholar] [CrossRef]
  41. Feng, Y. Mathematical models for determining the minimum level of voluntary safety investments for building projects. J. Construct. Eng. Manag. 2015, 141, 04015015. [Google Scholar] [CrossRef]
  42. Korea Workers’ Compensation & Welfare Service (COMWEL). Website of the Korea Workers’ Compensation & Welfare Service. Available online: https://www.comwel.or.kr/eng/index.jsp (accessed on 5 May 2022).
  43. AIG Korea Branch. Website of AIG Korea Branch. Available online: https://m.aig.co.kr/wp/dpwpt072.html?menuId=MS121&prodCd=GC012 (accessed on 5 May 2022).
  44. Wang, B.; Wu, C.; Huang, L.; Kang, L. Using data-driven safety decision-making to realize smart safety management in the era of big data: A theoretical perspective on basic questions and their answers. J. Clean Prod. 2019, 210, 1595–1604. [Google Scholar] [CrossRef]
  45. Ko, J.H. A study on the improvement of industrial safety and health management cost using the survey of construction safety experts. J. Soc. Disaster Inf 2020, 16, 331–342. [Google Scholar]
Figure 1. Research framework adopted in this study.
Buildings 12 01536 g001
Figure 2. Plot showing the ratios of APC to total construction cost (TCC) of the 38 projects studied herein.
Buildings 12 01536 g002
Figure 3. Properties of major variables in multiple regression equations.
Buildings 12 01536 g003
Figure 4. Frequency and normal distribution probability of the ratio of occupational safety and health management funds (OSHMF) to TCC.
Buildings 12 01536 g004
Figure 5. Component ratio of APC and OSHMF item rate to OSHMF.
Buildings 12 01536 g005
Figure 6. Plots of APC to TCC rations for different client types.
Buildings 12 01536 g006
Figure 7. Rates of OSHMF items to OSHMF for different client types.
Buildings 12 01536 g007
Figure 8. Rates of SME items to SME for different client types.
Buildings 12 01536 g008
Figure 9. Plots of APC to TCC ratios for different facility types.
Buildings 12 01536 g009
Figure 10. Probability of normal distribution (ratio of APC to TCC) for different facility types.
Buildings 12 01536 g010
Table 1. Results of literature review.
AimsNumberAuthorsCost ItemsResults
Quantitative
framework
development
1Hallowell, 2011 [15]
  • Safety and health committees
  • Safety and health orientation and training
  • Written and comprehensive safety and health plan
  • Emergency response planning
  • The research presents the framework that can evaluate the return on safety investment
2Gurcanli and Sevim, 2015 [13]
  • PPE
  • Collective protective measure
  • Safety consultancy cost
  • Safety training and expertise cost
  • The ratio of safety cost to total construction revenue is 1.92% in Istanbul
  • The safety cost per man-hour is 0.85 USD
  • The safety cost per m2 is 5.68 USD
3Ibarrondo-Dávila et al., 2015 [35]
  • Training cost
  • Health and safety measures
  • PPE
  • Collective protective equipment
  • Health and safety sign
  • General expense or the cost of supply
  • Staff health and safety cost
  • Health and safety administration cost
  • Health monitoring
  • Although the prevention cost is significant, it has been found to be invisible because the cost items are distributed within other accounting items in Spain
4Akcay et al., 2018 [27]
  • PPE
  • Curtain systems
  • Warning and hazard sign
  • Railing system
  • Façade coating system
  • Safety rope and safety belt
  • The six safety investment cost variables increased by 1.86 USD when the area of the construction project increased by 1 m2
5Yılmaz and Kanıt, 2018 [36]
  • Safety staffing cost
  • Safety training cost
  • Safety equipment and facilities cost
  • Safety promotion and incentive cost
  • The ratio of safety cost to direct construction revenue is 5.15% in Turkey
  • The safety cost per m2 is 8.47 USD
  • Among the safety cost variables, the cost of training account for the largest proportion at 38.5%
Prevention cost
effectiveness analysis
1Ikpe and Oloke, 2012 [37]
  • PPE (Personal Protective Equipment)
  • Safety training
  • Safety promotion
  • The ratio of prevention cost and benefits to prevention is 3:1
  • Small contractors are spending more on APC than medium and large contractors
2López-Alonso et al., 2013 [38]
  • Health and APC
  • Evaluation and monitoring cost
  • The number of accidents has a positive correlation with the total number of workers
  • The number of accidents has a negative correlation with the APC
3Feng, 2013 [39]
  • Staffing cost
  • Safety equipment and facilities cost
  • Compulsory training cost
  • Safety inspections and meetings cost
  • Safety prevention investments have a positive effect on accident prevention at higher safety culture and project risk levels
4Feng et al., 2014 [40]
  • Salaries of safety personnel
  • Cost of safety equipment
  • Safety training and orientation
  • Safety meeting and inspection
  • The safety performance of construction project is determined by the interrelationship between safety investment, safety culture, and project risk factors
  • The effectiveness of voluntary safety investment is influenced by safety culture
5Feng, 2015 [41]
  • Safety personnel
  • Safety equipment and facilities
  • Compulsory safety training course
  • Safety training and orientation
  • Safety inspection and meeting
  • Safety incentive and promotion
  • Design for safety
  • Voluntary safety investment ratio and accident frequency rate are inversely proportional to each other and are affected by the level of safety culture
  • Total accident cost ratio and accident frequency rate are proportional to each other and are moderated by project hazard level
Table 2. APC items of occupational safety and health management funds (OSHMF).
NumberAccident Prevention Cost Item
1Safety manager salary (SMS)
2Safety facility (SF)
3Personal protective equipment (PPE)
4Safety examination (SE)
5Educational events (EE)
6Health care (HC)
7Technical consultant (TC)
8Headquarter use (HU)
9Subcontractor safety management (SSM)
10Others
Table 3. APC items of safety management expenses.
NumberAccident Prevention Cost Item
1Safety management plan (SMP)
2Safety inspection (SI)
3Surrounding damage prevention (SDP)
4Traffic safety measure (TSM)
5Safety monitoring (SM)
6Structural safety (SS)
Table 4. Overview of information of expert group interview.
CompanyGroupNumber of IntervieweesPositionCareer
Contractor AEnvironment, safety, and health5ManagerMore than 10 years
Contractor BHealth and safety7ManagerMore than 15 years
Contractor CSafety3General managerMore than 12 years
Table 5. Construction APC structure in South Korea.
Accident Prevention CostDefinition
Level 1Level 2
Occupational safety and health
Management funds
SMSLabor cost of safety manager
SFCost of installing SF
PPECost of purchasing PPE
SECost of SE
EECost of safety training and event
HCCost of health care of worker
TCCost of technical consultant for accident
Prevention
HUCost used by headquarters’ safety
Department
SSMSafety management cost used by subcontractor
OthersOther costs required for safety
Safety management expensesSMPCost of developing an SMP
SICost of SI
SDPCost of damage prevention for buildings in the surrounding area
TSMCost of traffic safety measure around construction sites
SMCost of installing and operating safety monitoring devices
SSCost of structural safety of temporary
Structures
Additional APCsIndustrial accident compensation insurance and prevention premiums (IACIPP)Cost of insurance premium operated by the government
Worker’s compensation insurance premiums (WCIP)Cost of insurance premium operated by a private company
Other additional costsAdditional costs for the safety of construction workers by contractor
Table 6. Questions for survey based on the proposed structure.
SectionQuestionsPurpose
CompanyCompany nameCompany identification
Revenue of companyCalculation to IACIPP
Industrial accident insurance premiums of companyCalculation to IACIPP
Number of projectsProject identification
ProjectProject nameProject identification
Type of buildingProject identification
Private/Public constructionProject identification
Construction costCalculation of IACIPP
Construction periodProject identification
Occupational safety and health expensesSMSCalculation of SMS cost
SFCalculation of SF cost
PPECalculation of PPE cost
SECalculation of SE cost
EECalculation of EE cost
HCCalculation of HC cost
TCCalculation of TC cost
HUCalculation of HU cost
SSMCalculation of SSM cost
OthersCalculation of other costs
Safety management expensesSMPCalculation of SMP cost
SICalculation of SI cost
SDPCalculation of SDP cost
TSMCalculation of TSM cost
SMCalculation of SM cost
SSCalculation of SS cost
Additional APCWCIPCalculation of WCIP
Other additional costsCalculation of OAC
Table 7. Ratio analysis results.
ItemsAPC ItemsAPC
(A–E Subtotal)
OSHMF
(A)
SME
(B)
AAPC
IACIPP
(C)
WCIP
(D)
OAC
(E)
Ratio of average APC value to TCC (%)1.340.040.560.000.001.95
Standard deviation of APC ratios to TCC (%)0.330.140.170.020.010.44
APC item rate to APC (%)68.82.228.80.20.1100.0
Table 8. Multiple regression analysis outcomes.
StatisticsRegression Analysis Results
ItemsValueItemsCoefficientt-Statisticp-Value
Multiple correlation coefficient0.924Y-intercept5.530.830.41
Adjusted coefficient of determination0.845OSHMF49.406.491.7 × 10−7
Standard error21.554IACIPP54.502.975.4 × 10−3
Table 9. Ratio analysis result by OSHMF items to TCC.
ItemsOSHMF ItemsOSHMF (A–J Subtotal)
SMS
(A)
SF
(B)
PPE
(C)
SE
(D)
EE
(E)
HC
(F)
TC
(G)
HU
(H)
SSM
(I)
Others (J)
Average of OSHMF item ratio to TCC (%)0.430.560.130.050.040.020.010.000.100.001.34
Standard deviation of OSHMF item ratio to TCC (%)0.170.280.080.030.030.010.020.010.220.020.33
OSHMF item rate to OSHMF (%)32.541.59.93.43.11.20.40.17.70.3100.0
Table 10. Ratio analysis of SME items to TCC.
ItemsSME ItemsSME
(A–F Subtotal)
SMP
(A)
SI
(B)
SDP
(C)
TSM
(D)
SM
(E)
SS
(F)
Average SME item ratio to TCC (%)0.010.010.010.010.000.000.04
Standard deviation of SME item ratio to TCC (%)0.030.030.040.060.010.000.14
SME item rate to SME (%)14.929.520.025.78.31.6100.0
Table 11. Independent sample t-test outcomes.
Independent
Variable
Client TypesNMeanStandard
Deviation
Levene’s Test for
Equality of Variances
Independent Samples Test
FSig.tSignificance (Two-Tailed)
APCPublic
project
102.330.420.1750.6783.6760.001
Private
project
281.810.37
Table 12. One-way analysis of variance (ANOVA) outcomes.
VariableFacility TypesNMeanStandard DeviationTest of Homogeneity of VariancesOne-Way ANOVA
Levene StatisticSignificanceF ValueSignificance
APCPublic building42.530.290.7870.5106.1800.002
Public infrastructure62.190.46
Private building251.850.37
Private infrastructure31.510.13
Table 13. Post hoc test outcomes.
Dependent Variable: APCPost hoc Test (Multiple Comparisons, Scheffé)
Variable 1Variable 2Mean DifferenceStandard ErrorSignificance
Public buildingPublic infrastructure0.3340.2380.583
Public buildingPrivate building0.6780.1980.017 *
Public buildingPrivate infrastructure1.0140.2810.011 *
Public infrastructurePrivate building0.3440.1670.257
Public infrastructurePrivate infrastructure0.6800.2600.098 **
Private buildingPrivate infrastructure0.3360.2250.534
Note: * Significance < 0.05, ** Significance < 0.10.
Publisher’s Note: MDPI stays neutral with regard to jurisdictional claims in published maps and institutional affiliations.

