Perspective

An AI/ML-Based Strategy for Disaster Response and Evacuation of Victims in Aged Care Facilities in the Hawkesbury-Nepean Valley: A Perspective

by
Hafiz Suliman Munawar
1,*,
Mohammad Mojtahedi
1,
Ahmed W. A. Hammad
1,
Michael J. Ostwald
1 and
S. Travis Waller
2
1
School of Built Environment, University of New South Wales, Kensington, Sydney, NSW 2052, Australia
2
School of Civil and Environmental Engineering, University of New South Wales, Kensington, Sydney, NSW 2052, Australia
*
Author to whom correspondence should be addressed.
Buildings 2022, 12(1), 80; https://doi.org/10.3390/buildings12010080
Submission received: 24 December 2021 / Revised: 9 January 2022 / Accepted: 10 January 2022 / Published: 14 January 2022
(This article belongs to the Special Issue Construction Management and Disaster Risk Management)

Abstract

:
The Hawkesbury-Nepean Valley, Australia’s longest coastal catchment, is spanned by a river system of more than 470 km, that runs from Goulburn to Broken Bay, covering a total area of over 2.2 million hectares. This region has remained prone to flood events, with considerable mortalities, economic impacts and infrastructural losses occurring quite regularly. The topography, naturally variable climatic conditions and the ‘bathtub’ effect in the region are responsible for the frequent flood events. In response, the Government at the national/federal, state and local level has focused on the design of efficient flood risk management strategies with appropriate evacuation plans for vulnerable communities from hospitals, schools, childcare and aged care facilities during a flood event. Despite these overarching plans, specialized response and evacuation plans for aged care facilities are critical to reducing the loss incurred by flood events in the region. This is the focus of this present paper, which reviews the history of flood events and responses to them, before examining the utilization of artificial intelligence (AI) techniques during flood events to overcome the flood risks. An early flood warning system, based on AI/Machine Learning (ML) strategy is being suggested for a timely decision, enhanced disaster prediction, assessment and response necessary to overcome the flood risks associated with aged care facilities within the Hawkesbury-Nepean region. A framework entailing AI/ML methods for identifying the safest route to the destination using UAV and path planning has been proposed for timely disaster response and evacuation of the residents of aged care facilities.

1. Introduction

Floods are natural hazards that result in loss of life and extensive damages in the form of commodity loss. Additionally, over time, an ever-increasing trend in annual flood-related costs has been observed in Australia, some of which may be attributed to increases in the Australian population living in flood regions. Therefore, there is an ever-escalating need for appropriate flood risk management strategies to elucidate the factors associated with changes in flood magnitude and frequency [1,2,3]. Some of these factors are frequency, pattern, intensity, location and duration of rainfall. However, other factors such as the overall wetness of the catchment before a flood event along with its hydraulic characteristics, also play a role in incurring a flood hazard. Problematically, only a limited number of flood-based assessments of these factors have been conducted using Australian flood data trends. As such, flood magnitude has either remained largely unchanged or a decrease is observed in various parts of the country [4]. As of result of these complex conditions, increasing our understanding of, and capacity to respond to flood hazards remains a challenging endeavor. Additionally, most of the Australian inhabited catchments display anthropogenic modifications, suggesting that a deeper knowledge of nature, timing and extent of influences are required to understand changes in flood behavior [5]. It is, therefore, not only difficult to identify various factors associated with the changes in flooding events due to long-term variability in the climatic system [5] and anthropogenic climate change [6,7], but it is also challenging to provide flood management and evacuation facilities to vulnerable communities. This is especially the case for aged care facilities which face challenges during floods [8]. Furthermore, one of Australia’s most flood-prone regions, the Hawkesbury-Nepean Valley, is also home to large numbers of aged care facilities. These three themes—disaster preparedness, aged care facilities and the Hawkesbury-Nepean Valley—are at the core of the present paper.
The Hawkesbury-Nepean Valley has the most significant exposure to flood risk in New South Wales (NSW), if not all of Australia. The Hawkesbury River is one of the longest settled river catchments in Australia. It is a major source of sustenance for nearby communities, through the provision of food, drinking water, an irrigation system and a transport system. In the last few decades, urban development has rapidly expanded in the area in response to the expansion requirements of the mushrooming city of Sydney. The need for effective flood management strategies became apparent in 2020 and 2021 when serious flooding impacted the Hawkesbury-Nepean Valley [9]. The high flood risk in the region means that having access to the best available flood information is vital. Over time, there have been significant advances in technology, as well as some changes to the valley landscape. There is also a need to consider the potential impacts of climate change on flooding.
Australian governments have certainly not ignored the huge losses caused by natural disasters [10] and the insurance industry (which bore losses in 2019 and 2020 of up to AUD 5 billion due to natural disasters and extreme climate conditions [11]) has also been proactive in calling for solutions. In response, different levels of the Australian Government have focused on developing planning policies about appropriate land usage for healthcare, aged care and other facilities. For example, for standard residential constructions, a Flood Planning Level (FPL) with a lower minimum floor level is recommended for a 1 in 100 chance per year flood event. However, for aged care facilities, healthcare and other developments that require evacuation or emergency response, higher FPLs are necessitated and recommended for a 1 in 100 chance per year flood event. Such plans acknowledge not only the heightened flood risk but the different risk factors associated with different types of facilities.
The design of an effective flood risk management strategy necessitates a consideration of the types of people who will be subjected to this risk. Age, cognitive capacity, preparedness and physical capability are all significant factors shaping a person’s capacity to understand and respond to alarming situations [12]. Therefore hospitals, schools, childcare and aged care facilities are more vulnerable to flooding risks and require specialized strategies in addition to proper land use planning and flood risk management strategies. Ideally, aged care facilities, hospitals and childcare facilities should not be constructed in flood-prone areas. However, what can be done about these facilities that already exist in these areas? Or what can be done about expansions (new and refurbished buildings) to these facilities? For such cases, effective flood management and evacuation strategies must be adopted to ensure the safe evacuation of vulnerable communities.
A regional flood study on the Hawkesbury-Nepean Region was conducted in 2019 to calibrate the hydrologic model and to verify the flow-frequency distributions derived from the Monte Carlo simulations [13]. A hydrologic model (RORB) was developed to calculate flood flows resulting from rainfall events. Seven historical flood events were used for calibration. Peak flood levels were calculated using a quasi-two-dimensional hydraulic model (RUBICON). Monte Carlo modeling was carried out to replicate the variability in actual flood events mostly determined by the temporal pattern of rainfall events, dam drawdown, tides, tributary flows, etc. Monte Carlo modeling approach provides information for defining the limits of flood-prone land (Probable Maximum Flood (PMF)) and to inform regional land use and evacuation planning. The flood study found that the peak flood levels have increased at different sites within the region. Very large flood height ranges (over 21 m) between the 1 in 100 AEP and PMF events have been identified for the Wallacia floodplain due to the constrictive effects of the gorges between Wallacia and Penrith. The majority of the floodplain is considered unsafe for vehicles and people due to the weak infrastructure. A special engineering design and construction is needed for building infrastructures for flood hazard categories of 1 in 100 AEP events. Using the Monte Carlo approach, the Regional Flood Study also generated Outputs on the rate of rising and fall, and time to rise and fall above critical levels and travel time for key locations in the floodplain were generated using the Monte Carlo model. This information is critical for assessing the risk to life and increased peak flood levels for the PMF at several sites requiring emergency response planning accordingly [13].
Strategic land use planning must consider PMF and a full range of flooding. Land use planning must involve the preparation of regional, metropolitan and district plans, environmental planning instruments, planning proposals and local strategic planning statements. The limitation of flooding on land results in flood function, flood hazards, the extent of flooding behavior and risk to human life [14]. Identification of floodways, storage areas and fringe areas are important for estimating flood function. The floodways and storage areas are sensitive to the changes in flood behavior. The degree of flood hazards varies with location in the flood plain and the scale of the event.
The Australian Government relies on the “Total Flood Warning System (TFWS)” as an early warning system for floods. Compared to international flood warning systems, TFWS is technically robust. The TFWS consists of six different components which give a holistic picture of the flood scenario, i.e., prediction, interpretation, message construction, communication, response and review [15]. Reduction in flood damage can be carried out with access to real-time information and data which will help in generating flood maps, identifying the evacuation routes and locating the victims. Innovative technologies must be implemented for gathering data and transferring that to the central unit which will inform the emergency services to act. After-flood-event technology such as aerial imagery can facilitate damage assessment.
Developing flood resilience has emerged as an important component of strategies to deal with extreme weather conditions and associated adverse effects, but significant knowledge gaps are evident in terms of exploring resilience-based concepts and management approaches [16]. To address these knowledge gaps and improve disaster resilience, new technologies offer ways of gathering detailed data to inform policymakers to make actionable decisions for at-risk aged care facilities. Application of cutting-edge technologies such as satellite imagery, image processing, machine learning (ML), drone technology and analysis of data using AI could significantly enhance disaster risk management and risk-mapping for future events. This is particularly significant for enabling improvements in aged care facilities that are in flood-prone areas, such as those in the Hawkesbury-Nepean Valley [17].
The three research questions addressed in this paper are as follows:
  • What are the impacts of past flooding on the Hawkesbury-Nepean catchment area?
  • What are the existing flood risk management and evacuation strategies used in the Hawkesbury-Nepean Region particularly for aged care facilities?
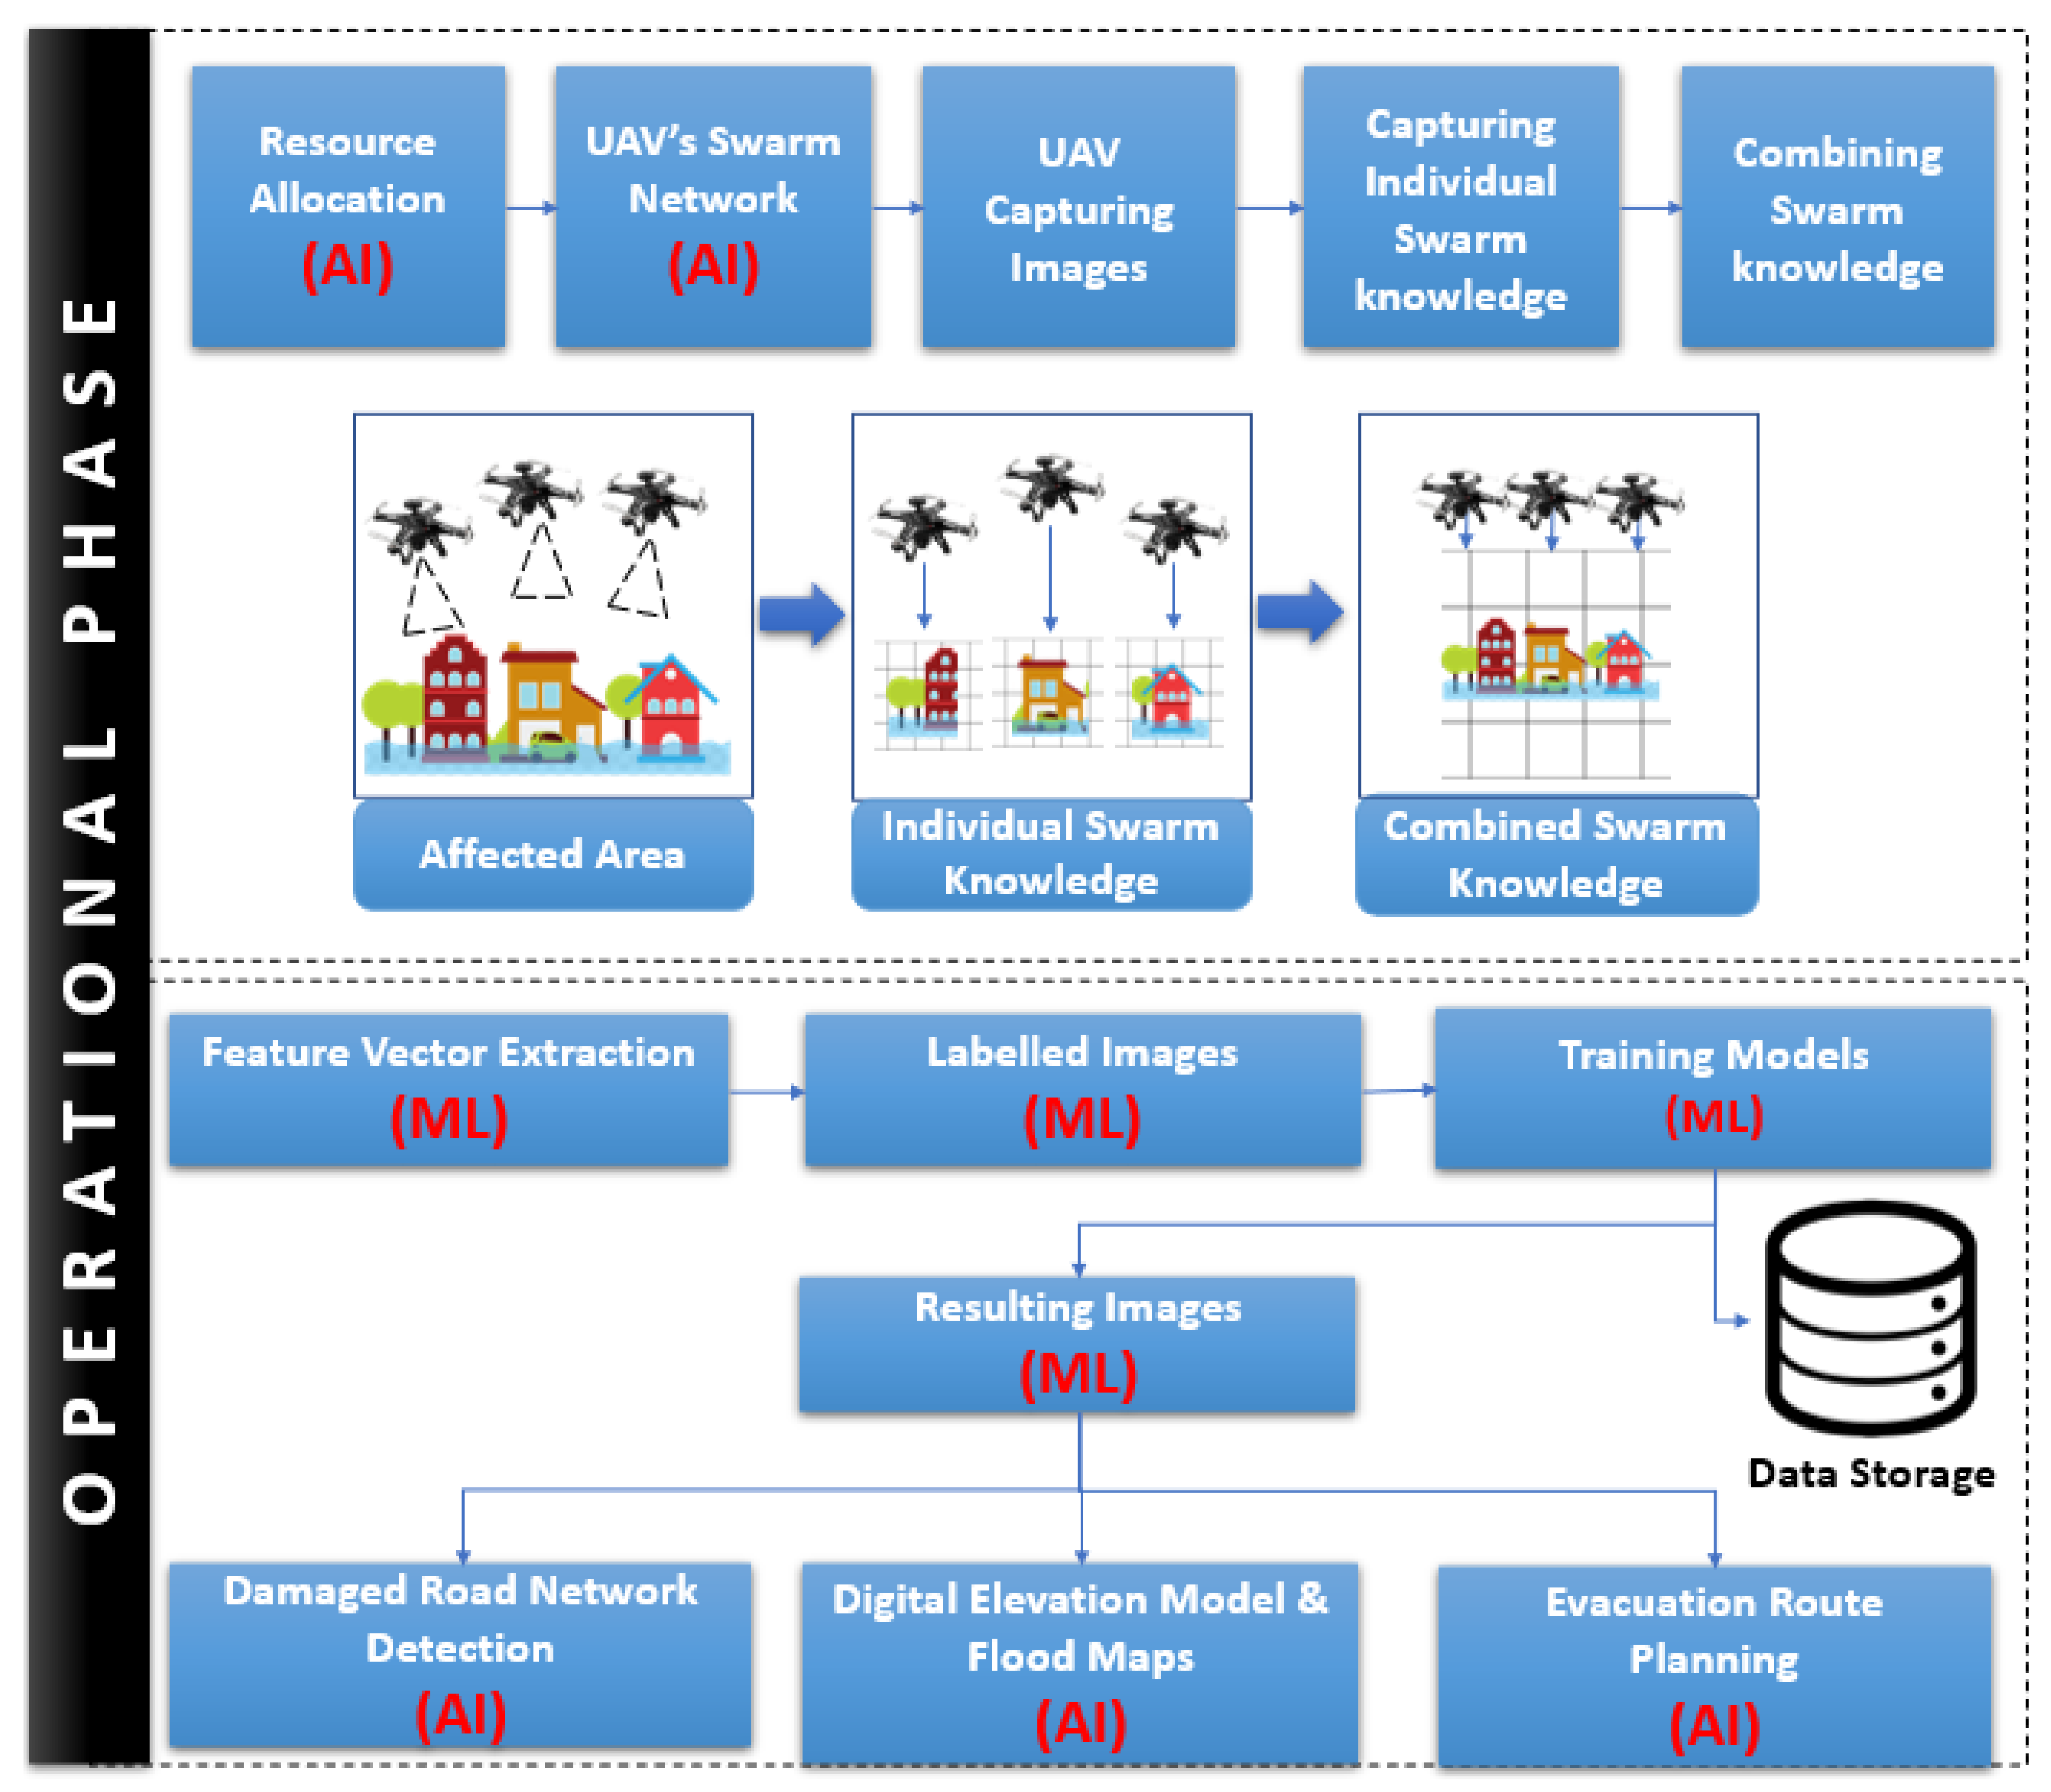
  • How can the existing methods of disaster risk management and evacuation strategies be improved through the application of the latest technologies like AI?

2. Methodology

Study Area Location and Concept

The Hawkesbury-Nepean Valley has the longest coastal catchment in Australia, which is spanned by a river system of more than 470 km that covers a total area of 22,000 km2 (2.2 million hectares) (Figure 1). The rivers typically flow from the higher altitude upland (wetland environments) to the Hawkesbury-Nepean River catchment via several main river channels. The Hawkesbury-Nepean catchment also covers a large area bounded by the Great Dividing Range, Illawarra Range, Cumberland Plain Hills and the Broken Bay Plateau in the west, south, east and north, respectively [18]. Moreover, the topography (i.e., regular sinuous river curves or windings through sandstone-based gorges) leads to the formation of four large floodplains with flatter water slopes and lower velocities at the outside of the main channels during the major floods. The high-risk floodplains in the region are (1) Wallacia, (2) Penrith/Emu Plains/Castlereagh, (3) Richmond/Windsor/Wilberforce and (4) Lower Hawkesbury Floodplain (Figure 2) [19,20]. These floodplains are connected through a series of gorges or fast-flowing channels which restrict the amount of water escaping downstream [21]. The Hawkesbury Local Government Area (LGA) constitutes about 2793 square km in the northwest of the Sydney Metropolitan region with 72% of it zoned as National Parks and Nature Reserves. It has a population of 67,083, amounting to 6% of the Western City District’s population. Compared to the surrounding LGAs, the Hawkesbury LGA has a relatively low residential density at 1141 persons per square kilometer. The buildable area is limited, resulting in Hawkesbury’s population concentrating in a few town centers in the southern part of the LGA [6].
The Hawkesbury-Nepean region has experienced warming by 0.8 °C since 1950 and a decrease in the average annual rainfall of 20–500 mm per decade (across different parts of the region). While it is difficult to distinguish the impacts of anthropogenic activities, it is anticipated that the climate will be warmer in the future [6]. However, the changes in average rainfall pattern are ambiguous, as with an expected higher rate of evaporation, the catchment is likely to be drier. The combination of these conditions could lead to higher winds, more frequent heatwaves and fire risks. Despite these trends towards a dry condition in the catchment, the potential for extreme rainfall events is also rising [6].
Buildings throughout the Hawkesbury LGA (especially in Windsor, Pitt Town and Wilberforce), display evidence of 50-year and 100-year flood events. Hawkesbury LGA is diverse in its socio-economic performance [6]. The northern areas are relatively socio-economically advantaged, with only a few pockets of disadvantage. South Windsor is among the lowest 20% of all suburbs in NSW under the socioeconomic SEIFA index which identifies disadvantage, whereas Pitt Town and Windsor Downs are among the highest 10 per cent of all suburbs in NSW.
The Hawkesbury River displays a normal pattern that is dominated by alternative flooding and drought regimes [18]. The flood management strategy for the Hawkesbury-Nepean River considers flooding spanning from Bents Basin, near Wallacia, to the Brooklyn Bridge, an area collectively referred to as the Hawkesbury-Nepean Valley [19]. The Hawkesbury-Nepean Catchment Management Authority (HNCMA) works to protect the natural values of the Hawkesbury-Nepean and ensure it continues to be a healthy and productive catchment. Its priorities are to improve river health including stable and healthy riparian areas and healthy drinking water supplies. The Hawkesbury-Nepean River Environmental Monitoring Program (HN-EMP) is a long-term monitoring program operating at a catchment-scale level and enabling the broadscale assessment of river health. It is complemented by shorter-term program-specific monitoring such as replacement flow monitoring. The HN-EMP program has gathered information on the effects of natural climate cycles (e.g., El Niño Southern Oscillation signals) and regulation of flow in the Hawkesbury-Nepean River. It has also demonstrated the long-term average flows at Penrith Weir have now consistently fallen below that of the unregulated Colo River for the first time since records began in the early 1900s.
Source: Infrastructure NSW [18]
  • WMA water for the taskforce;
  • Lismore Floodplain Risk Management Plan—Glossary and Appendices (Lismore City Council, 2014);
  • Nyngan April 1990 Flood Investigation (NSW Department of Water Resources 1990).

3. Hawkesbury-Nepean Flooding

3.1. History of Flood Events

Generally, flood patterns since 1900 in NSW reflect rainfall patterns [20], and heavy rains have led to major, destructive floods around the Hawkesbury River (Figure 3) [21]. These same flood patterns have also played an important role in creating the landscape of Hawkesbury-Nepean Valley. The depositions of sediments during flood events have led to the formation of extensive floodplains around Richmond and Windsor for millions of years. The historical flood events in the region are described in the following sections.

3.1.1. Pre-1900 Floods

Since the earliest days of European settlement, the Hawkesbury-Nepean Valley has faced multiple hazardous floods. For example, the flood events of the early 1800s posed serious concerns for the sustenance of the food supply and economy of Sydney where an early relocation of river settlements to higher areas was led by Governor Macquarie [21]. Smaller and fewer flood events were reported during the years 1820 to 1856, with the largest flood event being observed in the year 1830. However, from 1857 to 1900, many flood events were reported. The recorded highest and second-highest flood events in terms of magnitude were in the years 1867 and 1864, respectively [21].

3.1.2. Floods during the 1900s

The largest flood event in the area occurred in 1987 during which, a level of 19.7 m Australian Height Datum (AHD) was reached by the river at Windsor. The flood event of 1987 represents a 1 in 500 chance of flood per year, a reading that is still being validated/verified [22]. Another recent flood event corresponding to greater than 1 in 20 chances per year occurred in 1978. The levels for several historical flood events at Penrith and Windsor in the Hawkesbury-Nepean Valley are presented in Figure 4. During flood events, variable contributions of different sub-catchments have been observed due to the construction of Warragamba Dam in 1960 as shown in Figure 4. Approximately, 42% of the flood at Windsor came from the Warragamba sub-catchment in the year 1986. Whereas, for the 1990 flood event, about 73% of the floodwaters at Windsor were contributed by the Warragamba catchment [23]. Figure 5 provides a representation of the flood event history in the Hawkesbury-Nepean Valley at Windsor with flood levels above 12.2 m.

3.1.3. Floods during the 2000s

The historical perspective of flood events in the Hawkesbury-Nepean Valley has revealed that some of the latest floods were experienced during the years 2012, 2013 and 2015. Amongst these, the largest was observed in the year 2012. The flood event of 2012 caused the flood levels to reach the Windsor (6.0 AHD) and Penrith (18.6 AHD) gauges, respectively [24]. Additionally, other major floods occurred in the years 2020–2021 (12.9-meter flood) having a considerable impact on the region and New South Wales [25].
During these periods, excessive rainfall caused the rivers to rise continuously, posing serious threats to the residing population. However, for the Hawkesbury-Nepean basin regions, the worst effects of a flood similar in magnitude to the 1990 event were observed at Penrith, Richmond (14.05 m) and Windsor (12.9 m) [26,27]. Moreover, the occurrence of the flood events (2021) in the Hawkesbury-Nepean River region can be attributed to the combined effect of higher rainfalls and the Warragamba Dam [28].
The current population, homes and local businesses in the valley face substantial flood risk. For instance, if history repeats itself with the worst flood of the valley, it will put hundreds of lives in danger, affecting more than 90,000 people with 12,000 homes impacted. The ‘flood planning level’ for residential development is based on 1 in 100 (or 1%) chance of flood annually. Any new residential construction below this level in a high flood zone is prohibited. Below the flood planning level, special building controls are applied to the residential developments. These controls relate to property safety including the floor levels, building adhering to safety standards and reducing risk for inhabitants. The Hawkesbury-Nepean Valley has a unique flood risk [29]. For instance, in the Richmond-Windsor region, the largest possible flood height is up to nine meters above the 1 in 100 (or 1%) chance per year flood level. Therefore, the land use planning controls do not effectively address the risks posed by the deep flood levels experienced in different parts of the valley. This does not imply that development is prohibited in the PMF, but there is a need to consider flood height, evacuation capacity and ability to recover from a flood event when applying development controls.

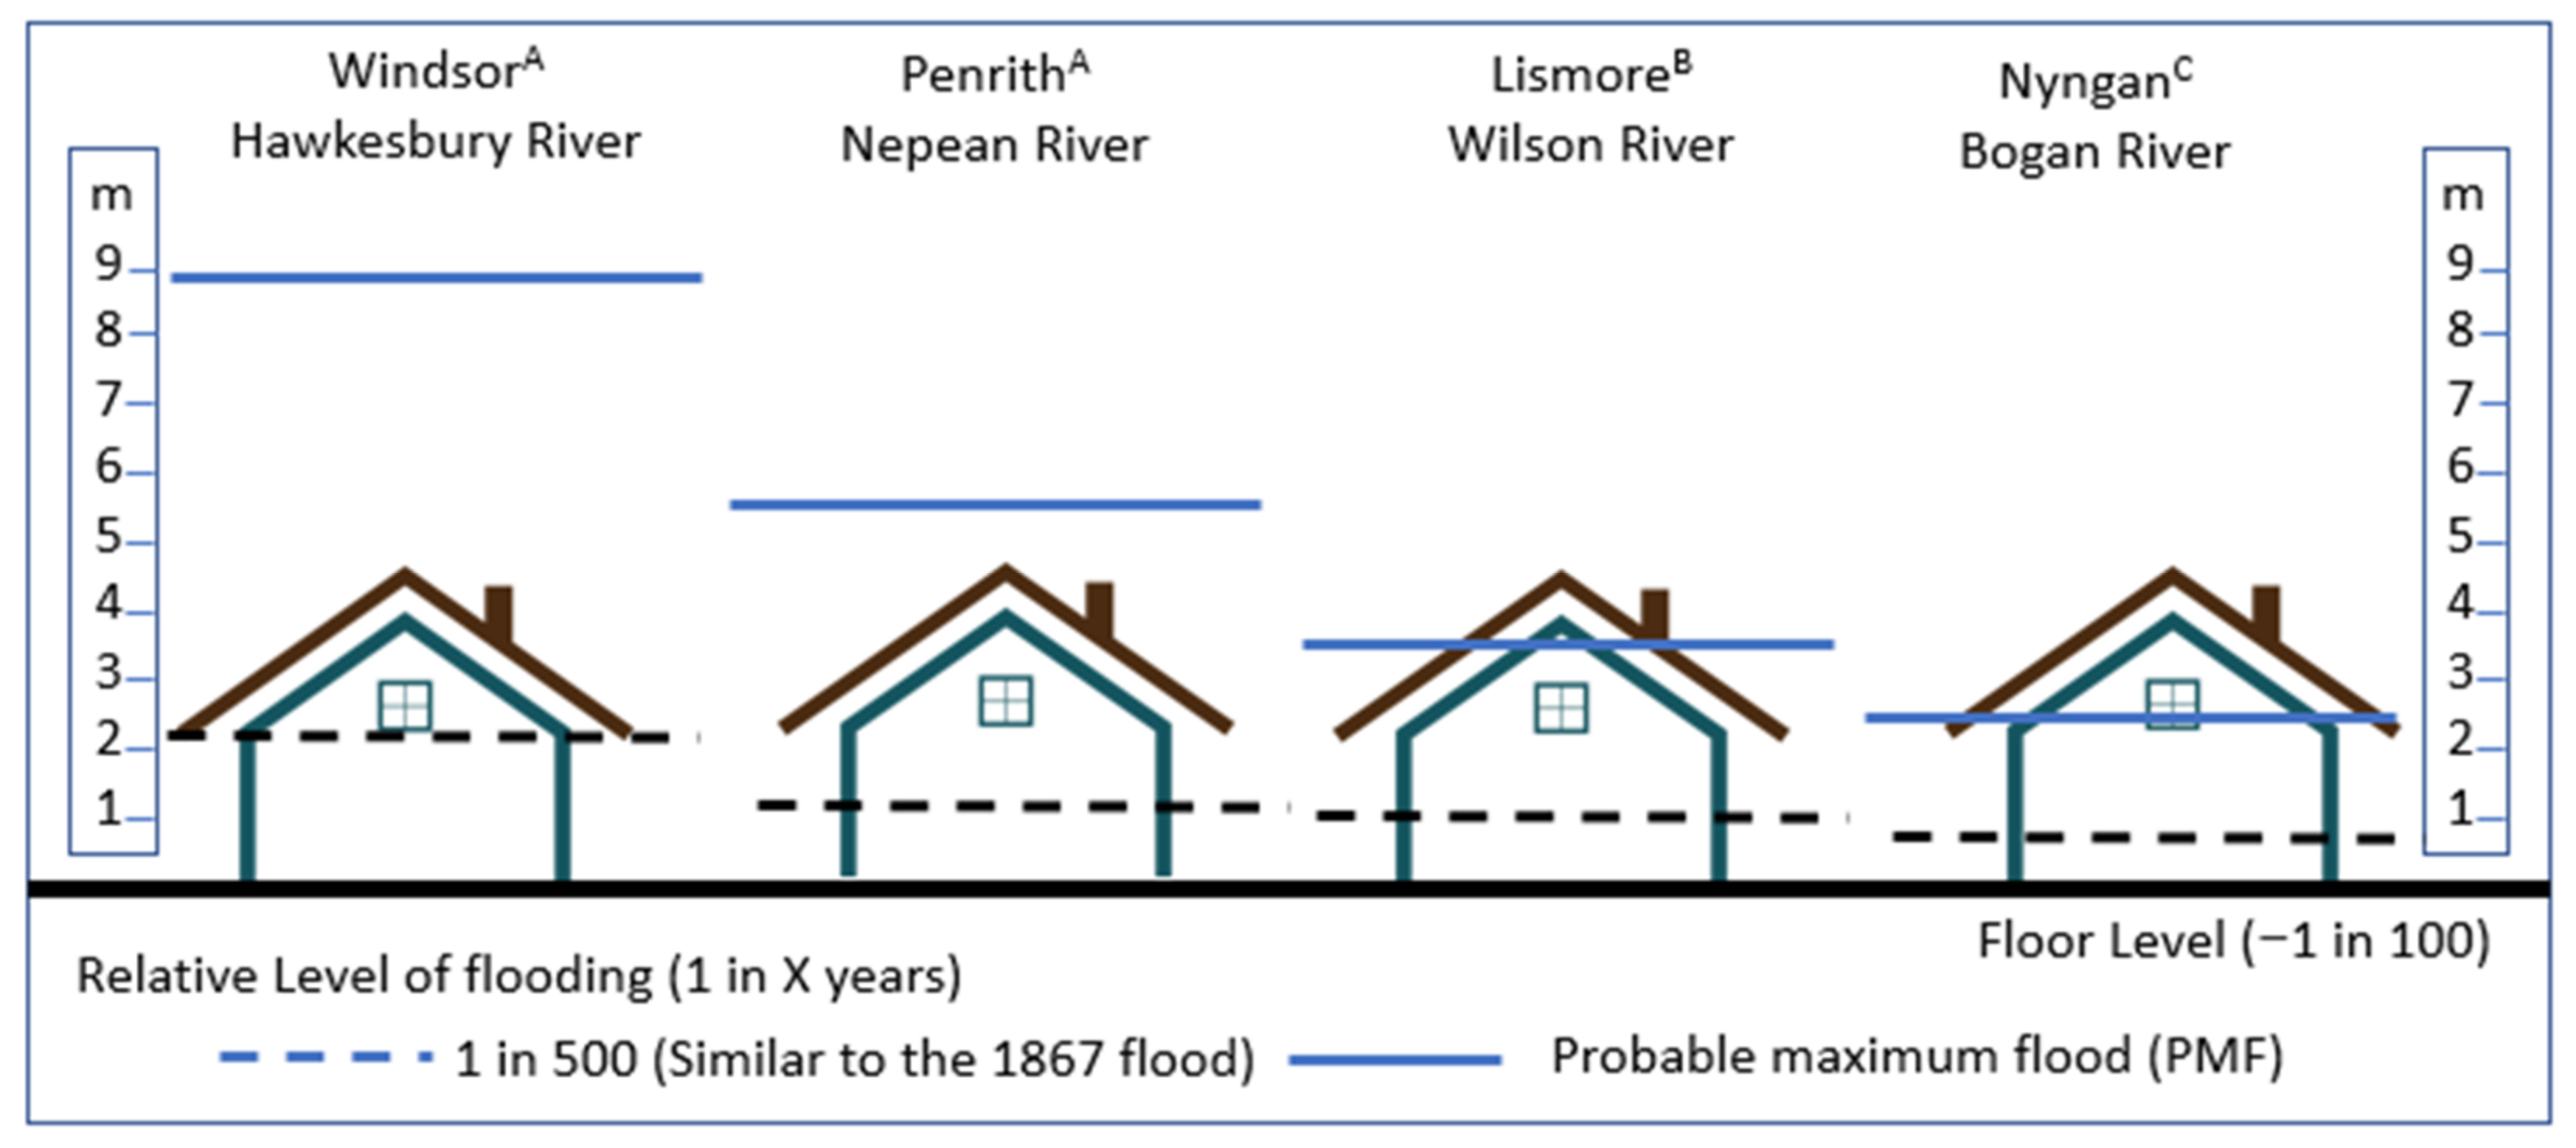
3.2. The Bathtub Effects

The topology of the floodplains and gorges of the Hawkesbury-Nepean Valley increases its susceptibility to flooding events. These flood events are mainly due to the presence of a combined framework of large upstream catchments and narrow downstream gorges. The presence of this topological condition leads to the backing-up of floodwaters behind the natural choke points. The so-called “bathtub effect” is what leads to the occurrence of flood events in Penrith and the Richmond-Windsor area. This means that the floods in this region can rise quickly, which might hinder evacuation during a flood event.
The PMF indicates the occurrence of the worst conceivable flood event, and it is used to define the possible evacuation planning strategies following the extent and area requirements of the floodplains. Therefore, there exists a strong need to plan for risk management strategies to ensure personal safety through the consideration of all occurrences of flood events up to the PMF. Another important consequence of the “bathtub effect” in the Hawkesbury-Nepean floodplain is the larger range of flood depths during the flood event. However, for most of the rivers in NSW, the PMF is typically less than two meters and the differences in the flood depth lie between 1 in 100 chance per year flood level, respectively. Nevertheless, for the region of Richmond-Windsor, a PMF up to nine meters above the 1 in 100 chance per year flood level is reported, thus leading the normal level of the river to rise by 26 m. Even for Windsor, the 1 in 100 chance per year flood would be nearly 17 m above the normal level of the river at Windsor [29].

4. Impacts of Flood Events and the Population at Risk

When considering the population at risk of a flood event in the area, there are approximately 90,000 current residents and 48,000 non-residents who work in the Hawkesbury-Nepean Valley [30]. Thus, a total of 138,000 people could require urgent evacuation in case of future flood events [31]. This situation is exacerbated by the State Government’s A Plan for Growing Sydney, which indicates a growth of 1.6 million people (by 2031) with approximately 900,000 of these in the Metropolitan West sub-region, a major part of which lies within the Hawkesbury-Nepean Valley [32]. A Plan for Growing Sydney aims to provide about 39,000 new homes and 37,000 new jobs in the Hawkesbury-Nepean floodplain region. This is approximately 90,000 people in addition to the current 138,000 people who will be living and working in the Hawkesbury-Nepean floodplain [33,34,35,36,37].

5. Aged Care Facilities in the Hawkesbury-Nepean Valley

Generally, evacuations are employed to reduce the damages associated with flood events and both able and vulnerable populations. In the Hawkesbury-Nepean Valley, there are 18 residential aged care facilities, 37 schools, 34 childcare facilities, and one public and three private hospitals, all of which are at a greater risk [38]. Additionally, some other facilities that are likely to be affected up to the PMF in this region are Western Sydney University, Richmond TAFE, Nirimba TAFE and Nepean TAFE [39].
The State Government’s aged care facilities provide support to older citizens, but this must be achieved by bringing into consideration the accessibility and requirements of older citizens and by developing resilience in terms of flooding [40]. Furthermore, the population of citizens aged 65 years and above in the Nepean Blue Mountains (a region including Blue Mountains, Hawkesbury, Lithgow and Penrith LGAs) is projected to increase by over 20.7% by the year 2036. Additionally, by the year 2036, the highest growth is projected from 5600 to 16,300 individuals aged 85 years and above in the Nepean Blue Mountains. Figure 6 reports the population increase of older persons with an age of 65 years and above in Nepean Blue Mountains, by LGA, from the years 2016 to 2036 [41].
The isolation of aged care facilities during a flood event makes evacuation, provision of goods, discharge/admission of patients and other related tasks very difficult. One of the most serious impacts of flooding is the evacuation and relocation of aged people who are confined to bed or are in poor health conditions. Additionally, various shortcomings such as lower flood awareness and limited coordination with agencies for emergency planning are also evident. The estimated number of properties and people affected by flooding in the Hawkesbury-Nepean Floodplain during the 2020–2021 flood is given in Table 1. In response to these issues, a Community Resilience Network and communication plan with key stakeholders could be developed [42]. Moreover, addressing the barriers to building resilience and developing strategies for flood response will form an important part in improving the aged care facilities in flood events.
Acknowledging these concerns, the NSW Government has developed strategies to improve aged care facilities, including hosting an all-day workshop and training session in 2019 to assist residential aged care providers to prepare for future flood events in the Hawkesbury-Nepean Valley. These workshops were executed in collaboration with Infrastructure NSW, NSW Health, NSW SES and NSW Police. Key staff, board members and managers from more than 19 residential aged care facilities attended these workshops. The issues in the current plans for flood events and details of flooding risks were provided to the residential aged care providers [43]. In other states, extensive efforts have also been made to improve aged care facilities for flood events. Towards this end, a Toolkit for Assessing Disaster Resilience for Aged Care Facilities has been developed under the Natural Disaster Resilience Program (NDRP) by the South Australian State Government and the Commonwealth Department of Home Affairs [44]. This is the outcome of a two-year project for aged care facility providers to equip them to respond comprehensively and recover from flood events [45].

6. Flood Risk Management and Evacuation Strategies Used in Hawkesbury Region

6.1. Flood Risk Management Plan

A flood risk management strategy was formulated and implemented in June 2016 by the NSW Government following the recommendations of the Hawkesbury-Nepean Valley Flood Management Taskforce. Their investigations considered feasible infrastructure and non-infrastructure options for the reduction of the flood risk in the Hawkesbury-Nepean Valley. This built on the findings of a previous report in response to the “State Infrastructure Strategy 2012–2032” by the Hawkesbury-Nepean Valley Flood Management Review in 2013. This report established that raising the wall of the Warragamba Dam by ~14 m would serve as an infrastructural option delivering maximum benefit. This would assist with increased capacity in the dam that would temporarily hold back floodwater, allowing for the slow release of floodwaters approaching from the Warragamba River catchment, thus reducing the overall damages caused by flood events by an average of 75%. By the year 2041, this will effectively reduce the flood damages for the current levels of urban development from AUD 5 billion to AUD 2 billion for a 1 in 500 chance per year flood [46]. Generally, the Flood Risk Management Strategy is based on deliverance of nine major outcomes that are described as follows:
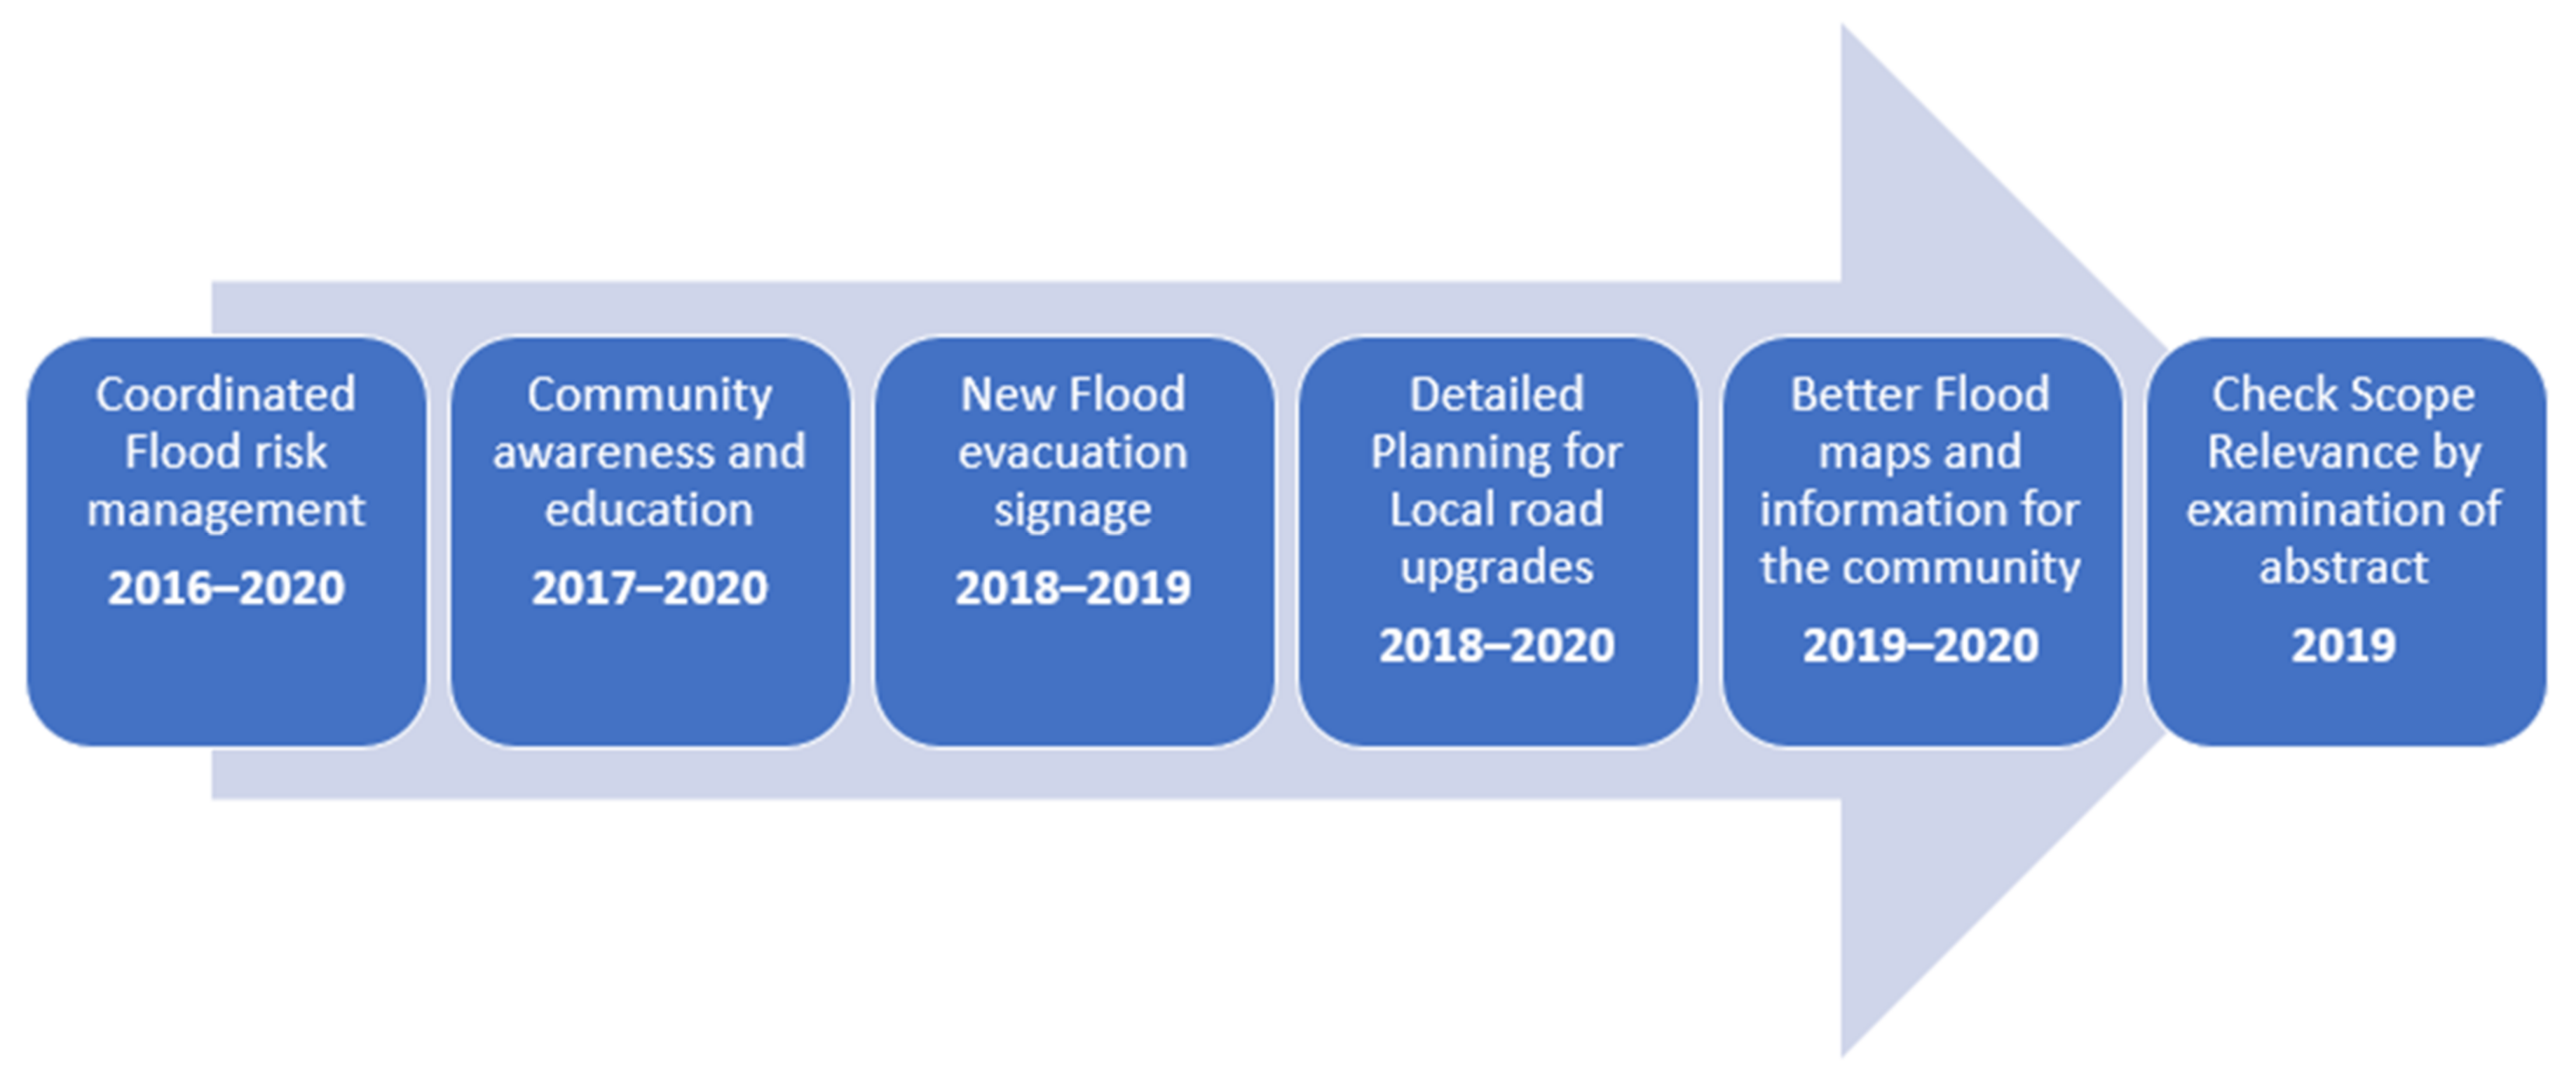
  • The establishment of a coordinated flood risk management strategy for the current and future application to the Hawkesbury-Nepean Valley that would also include a new Hawkesbury-Nepean Valley Flood Risk Management Directorate with Infrastructure NSW to administer the implementation of the strategy.
  • Reduction of the flood risks by raising a wall of the Warragamba Dam by approximately 14 m.
  • The design of the Regional Land Use Planning Framework and road planning (i.e., Regional Evacuation Road Master Plan) for the management of flood risks at an adequate level.
  • An overall improvement in the accessibility, mapping and availability of information for the management of flood risks in the valley.
  • Creating an aware, prepared, responsive and resilient community with an adequate understanding of evacuation routes and risks associated with flood events in the valley.
  • An overall improvement in the weather and flood prediction forecasting by the Bureau of Meteorology’s Hawkesbury-Nepean.
  • Appropriate emergency response and recovery plan to be used by the NSW Office for Emergency Management.
  • The creation of sufficient local roads for evacuation considering 40 high-priority local evacuation road upgrades.
  • Regular monitoring, reporting and evaluation to improve the Flood Strategy framework.
  • The timeline and milestones for the implementation of the flood management strategy for the Hawkesbury-Nepean valley are presented in Figure 7 [47].

6.2. General Perspective and Gaps on the Hawkesbury-Nepean Flood Risk Management Strategy

There are four main gaps in the FRM strategy (2017) for the Hawkesbury-Nepean Valley. The first gap is increased population, as flood risks have escalated in parallel with the increase in residential construction on lower lands. The flood risks are likely to worsen as the NSW Government intends to dramatically increase the number of residents in the northwest floodplain of Sydney which, when combined with extreme climate changes and increased frequency of severe storms will further aggravate the flood risks [48].
The second gap is the barriers to a coordinated effort. The National Strategy for Disaster Resilience [49] sets the framework for disaster management through the cooperation of multiple responsible sectors in Australia [50]. It aims to build resilience against disasters and assists in improving synchronization across all sectors of society [51]. Additionally, in March 2020, the National Disaster Risk Reduction Framework was endorsed by COAG, which was concurrent with the execution of the National Partnership Agreement on Disaster Risk Reduction (NPADRR). The NPADRR facilitates the Australian Government’s plans for the deliverance of the National Disaster Risk Reduction Framework to different states and territories [52,53,54]. Furthermore, the Australian Emergency Floodplain Framework highlights the requirement of a coordinated approach for the management of flood risks at various levels of government, through the provision of technical, financial, legislative and regulatory flood management efforts [55]. The barriers to coordinated efforts between different levels of government and poor coordination issues associated with a complex arrangement of agencies in Australia have been reported by various authors as being responsible for poor flood risk management strategies [56].
The third gap identified in the FRM (2017) is setting the appropriate risk levels. Towards this end, generally, for Australia, a flood planning level is set to 1% annual exceedance probability (AEP) [57]. Evidence from literature, however, indicates that setting 1% AEP is not adequate [58]. Regardless of this criticism, the AEP of 1% remains the most prevalent form of practice in the Hawkesbury-Nepean Valley [59].
A flood risk assessment is a critical quantitative and scientific process that requires taking into consideration a wide range of sociopolitical dimensions. For a flood event, the strategies through which risks are measured and managed are highly by the perceptions of various groups of the community and other implementation bodies [60]. A combined practical approach for risk management based on technical information and clear knowledge of people at risk was proposed by Young [61]. The findings from the literature suggest a difference in the views of the communities and experts in terms of evaluation of the flood risk and management [62]. Despite this fact, top-down information sharing exists for community engagement in the Hawkesbury-Nepean Valley.
The community consultation in the Hawkesbury-Nepean region is based on a collection of historical flood data and mitigation-related opinions of the community, as it does not take into account the assessment of community-based acceptable levels of flood risk. This points towards the fourth gap in the FRM (2017), which is the lack of information exchange, which is another interlinked aspect of flood risk management (FRM). Therefore, there exists a need to examine the requirements for data sharing and information exchange to further meet the diverse needs of the involved agencies [63]. Moreover, the availability of multiple information sources and deficiency of verifiable information has created complexity assessing the actual risks associated with flood events [63]. The Hawkesbury-Nepean Valley Flood Risk Management Strategy, 2017, was prepared by the NSW Government but the benefits of independence expertise and scientific review are not evident [64]. Moreover, the strategy was focused on infrastructure choices that were evaluated using a narrow cost-benefit analysis framework.

6.3. Flood Evacuation Strategy

It is well established that the topography of a region has a considerable effect on how the floodwaters settle in a landscape and on the chances of the evacuation of occupants. Particularly, for the Hawkesbury-Nepean floodplain, various evacuation routes have low points that become flooded and cut off even before the highly inhabited regions undergo inundation which leads to the isolation of flood islands with restricted access during a flood event. A number of these flood islands can become completely isolated as the flood water level rises. During large floods, the areas of Richmond, Windsor, South Windsor, Bligh Park, Pitt Town and McGraths Hill will become inundated with flood islands. As such, evacuations need to begin before an urban area becomes flooded, mainly due to the presence of low points of flood evacuation routes that are often lower than the higher urban area. The evacuation time includes the time required to:
(1)
receive a flood warning,
(2)
mobilize the State Emergency Service (SES) personnel of NSW,
(3)
start the evacuation,
(4)
accept and act on the warning and
(5)
drive the evacuation route leading to a safer area outside the flooding level.
Moreover, the SES is compelled to make evacuation decisions based on rainfall forecast which has varying degrees of uncertainty and accuracy [65]. The evacuation of people away from inundated areas is the principal method used for the reduction of risk to life during a flood event. For the evacuation of people in the Valley, a mass self-evacuation strategy involving private motor vehicles was adopted by the NSW State Emergency Service, as other means of transport are more vulnerable to floods [66]. Road-based movements are the most effective means that allows residents greater control over their evacuation. Whereas the rail-based evacuation in the Hawkesbury LGA flood islands is limited because the Richmond railway line is cut around 12.5–13.5 m near Vineyard. As far as the Richmond Air Force Base is concerned, it only offers limited evacuation capability that is restricted to Richmond Sector, as the road access to the Windsor sector is cut at 14.2 m AHD at Rickaby’s Creek. The NSW SES Local Flood Plans contain the details of the evacuation options for each sector. The evacuation for each sector will be based on the level of flooding/inundation and commencement from the lowest affected regions [67].
The nominated routes for regional evacuations for flood operations are defined as follows: (1) Windsor Road Route (a closure at 13.5 m AHD), (2) Pitt Town Road Route (a closure at 16 m AHD), (3) George Street Route (a closure at 15.0 m AHD), (4) Hawkesbury Valley Way Route (a closure at 17.3 m AHD), (5) Blacktown-Richmond Road Route (a closure at 14.2 m AHD), (6)The Llandilo Road Route (a closure at 23.8 m AHD), (7) The Northern Road Route (a closure at 18.1 m AHD), (8) The Londonderry Road Route (a closure at 18 m AHD), (9) The Castlereagh Road Route (a closure at 20.2 m AHD), (10) The M4 Motorway Route (a closure at 32.8 m AHD and 28.5 m AHD-South Creek), (11) The Great Western Highway Route (a closure at 25.2 m AHD-South Creek), (12) The Old Northern Road Route (not closed due to flood event), (13) The Park Road Route (a closure at 39.8 m AHD) and (14) Wallacia Alternative Route (a closure at 61.3 m AHD) [68]. It is well known that the current road capacity is not sufficient for the timely and safe evacuation of people, as multiple communities rely on common and congested road routes for evacuation. If a flood level exceeds the predictions, the lives of people could be at serious risk during a flood event. Whereas many unnecessary evacuations would be performed if the flood does not reach the desired prediction level. This can ultimately lead to reluctance in following the evacuation orders [69].
The semi-rural landscape of the Hawkesbury-Nepean Valley has changed to an urban landscape mainly due to Sydney’s rapidly expanding Northwest Growth sector. Approximately, a total of about 134,000 people currently live (90,000 people) or work (48,000 people) within the floodplain and thus, could require evacuation in case of future flood events [70]. This number is likely to double (158,000–171,000 people) over the next 30 years. Moreover, in the Hawkesbury-Nepean Valley, about 36,700 residential properties and two million square meters of commercial space are exposed to flood risks during a PMF event which is likely to increase in the coming years [71]. Greater than 64,000 people would require evacuation if a 1 in 100 chance per year flood occurred now, which can increase up to 90,000 people for a 1 in 500 chance per year flood [72]. Therefore, there is a need to upgrade the major regional road options for evacuation which would ultimately assist in reducing the exposure to flooding risk by increasing the chances of people evacuating safely. It is also notable that the investment in infrastructure for road evacuation purposes does not lead to a change in flood behavior and levels in the valley, neither does it decrease the damage caused by floods. Nine major regional road options were considered in the investigation by the State Emergency Service and Infrastructure NSW. These options were formulated using the combinations of points described as follows:
  • Selection of existing low points on the roads for raising in the context of the current 1 in 100 and 1 in 200 chance per year flood levels.
  • The addition of lane capacity for evacuation in case of emergency through the adjustment of existing road usage.
  • Accelerating the construction of Castlereagh Freeway to several road heights.
From a total of about 177 projects with around 40 of high priority, local evacuation road upgrades were identified to be essential for the maintenance of access to major regional evacuation routes. These upgrades were led by the Roads and Maritime Services in collaboration with other bodies including local councils, NSW State Emergency Service and other stakeholders [73]. The Hawkesbury FRM strategy lacks attention to aged care facilities and the utilization of emerging cutting-edge technologies such as AI, the Internet of Things (IoT) and Unmanned Aerial Vehicles (UAV) for flood disaster management. Moreover, it is deficient in emphasizing the need for planning evacuation systems with the effective amalgamation of conventional strategies and new technologies for the aged care facilities, particularly in the Hawkesbury-Nepean Valley. Therefore, the Flood Risk Management Strategy, 2017, lacks in terms of the facts, which is a critical gap and needs a more rigorous and thorough investigation for developing flood resilience in aged care facilities.

7. Flood Risk Management and Evacuation Strategies for the Aged Care Facilities

With advancements in technology, effective strategies for flood risk management have been proposed to overcome the risks associated with flood events. Keeping in mind the flood events in Hawkesbury-Nepean Valley, there is an increasing need to use technology-based strategies (i.e., smartphones, IoT, AI, ML and UAVs) to reduce the overall risks associated with these flood events. It is also important to improve the aged care facilities through the effective utilization of the techniques during flood events.
As far as the technological perspectives are considered, it is well known that the utilization of smartphones for communication is widely spread across various age groups and parts of the world which leads to the production of immense data [74,75,76]. The utility of this data for health information, safety, location, marketing, and for the identification of the geographical position of individuals during times of disaster has already been reported [76]. Therefore, particularly for aged care facilities in the Hawkesbury-Nepean Valley, smartphone-based data can be effective and potentially lifesaving for older individuals during a flood event. Many applications and software programs have been developed to provide accurate real-time information. Some of the important applications that can help in improving safe evacuation of aged care facilities in Hawkesbury-Nepean are Help me [77] First Aid application [78] and u-Rep [79]. These applications might help by pinpointing disaster locations and the nearest available help in the absence of an internet connection. Emergency+ is another prominent application developed by Australia’s emergency services and industry partners in 2013. This application also provides the location of callers to initiate an emergency response or service [80].
IoT is an extensively emerging technology where real-time data is collected and stored using sensor technology [81]. The IoT paradigms can be used for data collection, analysis, generating early warnings, remote monitoring of flood events, locating aged care facilities and generating the relevant real-time data for the Hawkesbury-Nepean region. An example of one IoT-based infrastructure for flood events is the Citizen Flood Detection Network, which was implemented in the Oxford floodplains. Such an IoT-based infrastructure can also be implemented for the real-time monitoring of the floods in aged care facilities of this region [82,83,84,85].
Extensive literature has also highlighted the importance of adopting amalgamated approaches based on image processing and machine learning techniques since ML techniques bring along a wide range of benefits such as processing of large datasets, training of the predictive models and higher accuracy of results [86]. Moreover, the available literature supports the utility of numerous AI and ML approaches in various scenarios, however, inadequate levels of the integrated AI and ML technologies have been reported for the improved management of floods. Besides the use of technology, the appropriate and well-planned construction of buildings, land usage and eased evacuation routes for aged care facilities are essential components to improve the safety of aged care facilities in the Hawkesbury-Nepean floodplain. Notably, the utility of AI-based techniques can assist in providing reliable information for flood events, thus enabling timely decisions for the mitigation, preparedness, management, response and recovery during a flood event [87]. The vulnerable communities and critical structures can be assessed using data from physical sensors and social networks. However, weather predictions through existing methods can be greatly enhanced using AI [88].
Additionally, the existing systems for flood risk management can be enhanced by mapping the flood regions through aerial satellite-based imagery or using UAVs to capture the flood-affected areas [89]. The UAVs are the only viable solution when the evacuation routes (i.e., roads) become blocked due to damages and various obstacles during flood events (Figure 8). Thus, the UAV-captured images can assist in improving the rescue or evacuation efforts during flood events. An additional advantage of the UAVs is the ability to map flood-damaged areas rapidly despite connectivity failures and extreme weather conditions [89].
Many developed countries have implemented innovation strategies based on big data, AI and IoT as priority areas for digital application, information security, information economy, public health, etc. In Australia, it is anticipated that AI can assist government services that need advanced technologies; in Italy, AI applications in health, disability and learning systems have been implemented. A strategic council for AI technology has been established in Japan that facilitates government services at different levels. Similarly, the Republic of Korea has been keen on the application of disruptive technologies for solving social problems. In the UK, technologies have been implemented to improve the delivery of public services and AI strategy has been proposed for life sciences [90]. While in some countries, disruptive technologies are useful for regional development. China has developed strategies to develop the old industrial regions through the application of the latest technology for the revitalization of these regions [91]. Many public sector organizations and the private sector contribute to enhancing disaster relief operations, these efforts are held back by several challenges. One such challenge is the limited scope in the initiative of these organizations as they focus on specific use cases without collaborating with a wider disaster relief organization. Thus, the efforts are fragmented with limited AI-derived insights. Furthermore, the AI tools used by the organizations are not used to their full potential and are not incorporated effectively into the decision-making process [92]. Most of the ML methods have focused on the flood prediction and forecasting problem hence they were classified under the pre-disaster phase. In the domain of flood risk management, systems focusing on hydrological predictions remain to be a huge challenge for researchers. More recently, advancements in AI have introduced many powerful technologies to model hydrological events such as floods. Among these tools, ANN and SVM have been successfully used in a wide range of case studies related to flood prediction. One method is to gather rainfall data and daily water levels to test and train a ML model such as ANN [93]. This model has been built to predict the water levels after a time interval of 24, 48 and 72 h. Ruslan [94] used data based on water levels at three upstream river locations to train an ANN model. A Neural Network (NN) inverse model was integrated with the output to improve the results [94]. Shi et al. [95] used rainfall and river flow data to train an SVM classifier to make predictions regarding river flow change and peak flow within 48 h. ANN model is programmed to mimic the human’s brain way of learning. The relationship between inputs and outputs is recognized and learned by an ANN model during training. According to the latest research [96], ANN has shown promising results when dealing with a flood-related crisis by predicting streamflow. Additionally, the ANN model has proved to be beneficial for making flood-related predictions as it requires just one input variable. Thus, in such conditions where there is insufficient information related to the problem, ANN proves to be a viable approach [97]. An ANN model was formulated to simulate flows at a certain location in the river reach, based on flow at upstream locations [97]. Studies have shown that ANNs have higher speed and accuracy than many of the conventional models and tools used previously.
Therefore, an early flood warning system, AI/ML-based strategy for a timely decision, enhanced disaster prediction and response using UAV, is highly necessitated for the region. The proposed model is to ensure that the modern technology could be aligned to be used in the case of post-flood management. Since floods cannot entirely be avoided or stopped, knowledge about flood-prone areas and flood risks could be used for developing a method that could aid in disaster relief work [98]. For Hawkesbury-Nepean Valley, we propose the use of an optimized UAV route to provide maximum area coverage of the aged care facilities at the lowest possible cost and time as shown in Figure 8. The UAV swarm will allow for the collection of images from the affected regions (aged care facilities) in the Hawkesbury Valley, thus providing the gathered data to the control center. The drone-based collection of real-time data around the aged care facility centers during a flood event can be effectively analyzed using various ML pre-processing and edge detection methods for feature extraction and labeling of the flood images. The ML methods are then applied to extracted images of floods for training the models [92]. The ML methods can use pre-existing flood data and analyses’ risks without the need for working with the physical constraints or implications that hinder flood risk analysis. Floods, being natural disasters, are a complex phenomenon to be modeled using traditional statistical and mathematical methods [93]. During the last two decades, ML methods have significantly contributed to the development of advanced systems for predicting floods with enhanced performance and less expensive solutions. The ML methods offer a wide range of advantages which include being quick, cheap, high performing and easy to validate. Hybridization of standard models along with the introduction of new ones has become a common practice among researchers for flood prediction problems. Over the years, several different algorithms such as ANN, support vector regression (SVR) and support vector machine (SVM) have been shown to yield reliable results for flood predictions [84,85]. Different algorithms and systems of machine learning can be combined to build stronger flood prediction models. ANN and SVM models can be used for predicting flood events. The ANN model has proved to be beneficial for making flood-related predictions as it requires just one input variable. Moreover, the deployment of multiple UAV images is extremely useful for the analysis of road network infrastructure, bridges and other means of transportation in the near vicinity of the aged care facilities in the Hawkesbury-Nepean Valley, thus providing UAV coverage and allowing the transfer of associated information to the central control manager. UAV path planning can be optimized using Particle Swarm Optimization (PSO). This will further facilitate the development and construction of the rescue networks for the aged care facility providers in the Hawkesbury-Nepean region to be further used by the rescue teams. For identifying the flooded regions, application of image segmentation will be helpful. With GIS-DEM, the depth of the flooded areas and flood risk zone can be estimated. The extraction of information for damage infrastructure, road networks and bridges’ image processing and pre-trained ML models can be applied [98]. Road network information will help in devising evacuation plans for the aged care victims. For evacuating the victims, optimization algorithm such as ant colony and travel salesmen algorithm can be utilized. Furthermore, the collected data sets can undergo processing for the development of flood maps, evacuation plans and providing relief goods to the flood victims. Additionally, the use of such integrated technologies, such as cloud computing, image processing and AI for the collection of real-time information, will assist in finding the appropriate routes to reach the affected aged care facility centers in Hawkesbury Valley with a potential improvement in the response time and evacuation strategies [94].
UAVs can capture images with higher resolution than satellites. After Hurricane Katrina drones were used to locate the victims and assess river levels [99], the drone was found to be a viable solution as all the roads were blocked due to damages and various obstacles. Similarly, in Vanuatu, after Cyclone Pam, disaster assessment was carried out by a drone, an ideal option for rapid evaluation of the situation. The images captured by the drones helped the rescue team to identify which houses were unrepairable and which ones could be fixed [100]. This information guided in allocating funds and the recovery process. Open-source mapping platforms used these images to generate maps and geo-tagging images from social media [100]. Despite the failure of connectivity and severe weather conditions, the drones were able to map the damaged areas in a short amount of time.
There is a certain limitation of the UAV technology such as battery timings, maximum physical load, processing power and maneuvering in bad weather conditions. The power generation alternatives have been explored, however these are not sufficiently used in a practical sense. The processing power of computers installed in UAV motherboards is not comparable to the processing power of computer server machines [101]. Hence, when using UAVs for disaster monitoring issues such as collection of large amounts of data, deployment of UAV in bad weather conditions, assortment of different data sources, unstable power supply, power communication network and unpredicted node failures should be kept in mind.
The AI-based disaster management methods can aid the flood management authorities in terms of data offloading, real-time disaster detection, disaster preparedness, planning and decision making. The optimization of the route and floor plan simulation can help in identifying the shortest safety route for evacuation for the aged care facilities in the Hawkesbury region. Moreover, the flood management authorities of Hawkesbury Valley can apply the shortest path algorithm to design the best evacuation plan for aged care facilities in the Hawkesbury region. This will also guide the relief teams. Since the survey data are usually not accessible during the crisis, therefore, the patterns of the escape routes for aged care facilities during flood events can be explored using spatiotemporal analytics to provide useful real-time information [102]. Moreover, AI techniques can be used by the meteorological departments and disaster management authorities to predict and develop mitigation strategies during flood events. The infrastructural damages are usually assessed using the fragility curves predictions that are built on statistical and historical data. However, now, the utilization of Random Forest, One-shot learning, neural networks, and Support Vector Machine (SVM)-based AI methods can be used effectively in the detection of damages during a flood event [103]. Particularly, for the aged care facilities, the application of AI techniques will not only assist in damage detection but will also help in obtaining the forecasts of upcoming flood events and the provision of early warning for the safe evacuation of the aged care facilities.
The mobility patterns in the vicinity of the aged care facilities can be effectively analyzed using a deep learning approach, and algorithms with GPUs can help in the prediction of the traffic pattern for the effective management of traffic based on real-time data [104]. Currently, a wide range of technologies and models are available which can work considerably well in dynamic environments through the effective assessment of the risks and the use of appropriate decision-making procedures. Therefore, a better comprehended understanding and applicability of the technologies by the disaster management authorities can speed up the relief options in the occurrence of flood events or other disasters.
Therefore, we must learn from previous events and take initiatives that facilitate building resilience through enhanced operational response and innovation. Local communities need to understand their flood risk by providing them with updated information and flood maps indicating the extent and depth of floods. The emergency management and evacuation plans should be updated regularly based on flood behavior. The planning of regional land use, road networks and new developments must be based on a road evacuation framework. Local environmental plans, developmental control plans and flood policies should be considered for land use development. There is a need to assess regional flood mitigation possibilities. The asset owners should be facilitated in making decisions necessary for flood risk mitigation [105].

8. Conclusions

The Hawkesbury-Nepean Valley is important from a wide range of perspectives, from ecological to social and economic, and it has a large population. The Hawkesbury-Nepean region is prone to major flood events due to its topology and the bathtub effect. Therefore, this study aimed to design an effective flood risk management strategy to reduce the adverse effects of future flood events in the Hawkesbury-Nepean catchment area. One important aspect of the effective flood risk management strategy was the overall improvement in the aged care facilities of the region. An early flood warning system, AI/ML-based strategy for a timely decision, enhanced disaster prediction, assessment, response using UAVs and path planning has been proposed. The identification of the safest route to the destination using UAVs and path planning has been suggested for timely disaster response and evacuation of the residents of aged care facilities. Besides the use of technology, appropriate and well-planned construction of buildings, land usage and eased evacuation routes are essential for post-flood rescue missions. The following recommendations have been proposed for the evacuation management of Hawkesbury-Nepean Valley aged care facilities:
  • Integrate new technologies along with conventional methods to address the barriers to building resilience.
  • The aged care facilities have higher needs and more complex requirements for evacuating the residents to the nearest shelter. The proposed framework could be applied by the local authorities to enhance existing disaster response practices.
  • The optimization of the route and floor plan simulation can help in identifying the shortest safety route for evacuation response. The shortest path algorithm can be applied to design the best evacuation plan for residents of aged care facilities.

Author Contributions

Conceptualization, H.S.M., M.M., A.W.A.H. and M.J.O.; methodology, H.S.M. and M.M.; software, H.S.M. and A.W.A.H.; validation, H.S.M., A.W.A.H. and M.M.; formal analysis, H.S.M. and A.W.A.H.; investigation, H.S.M. and M.M.; resources, A.W.A.H., M.M. and M.J.O.; data curation, H.S.M. and M.M.; writing—original draft preparation, H.S.M., A.W.A.H. and M.M.; writing—review and editing, M.J.O.; visualization, H.S.M.; supervision, A.W.A.H. and S.T.W.; project administration, A.W.A.H., M.J.O. and S.T.W.; funding acquisition, M.M. All authors have read and agreed to the published version of the manuscript.

Funding

This research received no external funding.

Institutional Review Board Statement

Not applicable.

Informed Consent Statement

Not applicable.

Data Availability Statement

Data is available with the first author and can be shared with anyone upon reasonable request.

Acknowledgments

The authors would like to acknowledge CDRI for the guidance and support.

Conflicts of Interest

The authors declare no conflict of interest.

Abbreviations

S. No.AbbreviationMeaning
1AIArtificial intelligence
2AHDAustralian Hight Datum
3AEPAnnual Exceedance Probability
4FPLFlood Planning Level
5FRMFlood Risk Management
6GPUsGraphical Processing Units
7IoTInternet of Things
8LGALocal Government Areas
9MLMachine Learning
10NSWNew South Wales
11NDRPNatural Disaster Resilience Program
12NPADRRNational Partnership Agreement on Disaster Risk Reduction
13PMFProbable Maximum Flood
14SESState Emergency Services
15SVMSupport Vector Machine
16TAFETechnical and Further Education
17UAVUnmanned Aerial Vehicle

References

  1. Abdelkader, M.; Shaqura, M.; Ghommem, M.; Collier, N.; Calo, V.; Claudel, C. Optimal multi-agent path planning for fast inverse modelling in UAV-based flood sensing applications. In Proceedings of the 2014 International Conference on Unmanned Aircraft Systems (ICUAS), Orlando, FL, USA, 27–30 May 2014; pp. 64–71. [Google Scholar] [CrossRef]
  2. Ahmad, D.; Afzal, M. Household vulnerability and resilience in flood hazards from disaster-prone areas of Punjab, Pakistan. Nat. Hazards. 2019, 99, 337–354. [Google Scholar] [CrossRef]
  3. Akay, S.S.; Özcan, O.; Balık Şanlı, F. Quantification and visualization of flood-induced morphological changes in meander structures by UAV-based monitoring. Eng. Sci. Technol. Int. J. 2021. Available online: https://www.sciencedirect.com/science/article/pii/S2215098621001282 (accessed on 18 October 2021). [CrossRef]
  4. Albano, R.; Samela, C.; Crăciun, I.; Manfreda, S.; Adamowski, J.; Sole, A.; Sivertun, Å.; Ozunu, A. Large Scale Flood Risk Mapping in Data Scarce Environments: An Application for Romania. Water 2020, 12, 1834. [Google Scholar] [CrossRef]
  5. Anbarasan, M.; Muthu, B.; Sivaparthipan, C.B.; Sundarasekar, R.; Kadry, S.; Krishnamoorthy, S.; Dasel, A.A. Detection of flood disaster system based on IoT, big data and convolutional deep neural network. Comput. Commun. 2020, 150, 150–157. [Google Scholar] [CrossRef]
  6. Anusha, N.; Bharathi, B. Flood detection and flood mapping using multi-temporal synthetic aperture radar and optical data. Egypt. J. Remote Sens. Space Sci. 2020, 23, 207–219. [Google Scholar] [CrossRef]
  7. Arrowsmith, J.; Miller, P. Phase II and Phase III attrition rates 2011–2012. Nat. Rev. Drug Discov. 2013, 12, 569. [Google Scholar] [CrossRef]
  8. Bahrawi, J.; Ewea, H.; Kamis, A.; Elhag, M. Potential flood risk due to urbanization expansion in arid environments, Saudi Arabia. Nat. Hazards 2020, 104, 795–809. [Google Scholar] [CrossRef]
  9. Bakuła, K.; Zelaya Wziątek, D.; Weintrit, B.; Jędryka, J.; Pilarska, M.; Ryfa, T.; Kurczyński, Z. Multi-sourced. remote sensing data in levees monitoring: Case study of Safedam project. Int. Arch. Photogramm. Remote Sens. Spat. Inf. Sci. 2018, XLII-3/W4, 101–108. [Google Scholar] [CrossRef] [Green Version]
  10. Molés-Cases, V.; Piũero, G.; Gonzalez, A.; de Diego, M. Providing Spatial Control in Personal Sound Zones Using Graph Signal. In Proceedings of the 27th European Signal Processing Conference (EUSIPCO), La Coruña, Spain, 2–6 September 2019; pp. 1–5. [Google Scholar] [CrossRef]
  11. Bell, H.; Tobin, G. Efficient and effective? The 100-year flood in the communication and perception of flood risk. Environ. Hazards 2007, 7, 302–311. [Google Scholar] [CrossRef]
  12. Bhadra, T.; Chouhan, A.; Chutia, D.; Bhowmick, A.; Raju, P.L.N. Flood Detection Using Multispectral Images and SAR Data. In Machine Learning, Image Processing, Network Security and Data Sciences, Proceedings of the Second International Conference on Machine Learning, Image Processing, Network Security (MIND 2020), Silchar, India, 30–31 July 2020; Bhattacharjee, A., Borgohain, S.K., Soni, B., Verma, G., Gao, X., Eds.; Springer: Singapore, 2020; pp. 294–303. [Google Scholar] [CrossRef]
  13. Cao, C.; Xu, M.; Kamsing, P.; Boonprong, S.; Yomwan, P.; Saokarn, A. Flooding Identification by Vegetation Index. In Environmental Remote Sensing in Flooding Areas; Springer: Singapore, 2021; pp. 29–44. [Google Scholar] [CrossRef]
  14. Casado, M.R.; Leinster, P. Towards more effective strategies to reduce property level flood risk: Standardising the use of Unmanned Aerial Vehicles. J. Water Supply Res. Technol.-Aqua 2020, 69, 807–818. [Google Scholar] [CrossRef]
  15. Chang, D.-L.; Yang, S.-H.; Hsieh, S.-L.; Wang, H.-J.; Yeh, K.-C. Artificial Intelligence Methodologies Applied to Prompt Pluvial Flood Estimation and Prediction. Water 2020, 12, 3552. [Google Scholar] [CrossRef]
  16. Chang, F.-J.; Guo, S. Advances in Hydrologic Forecasts and Water Resources Management. Water 2020, 12, 1819. [Google Scholar] [CrossRef]
  17. Chen, Y.; Tan, M.; Wan, J.; Weise, T.; Wu, Z. Effectiveness evaluation of the coupled LIDs from the watershed scale based on remote sensing image processing and SWMM simulation. Eur. J. Remote Sens. 2021, 54, 77–91. [Google Scholar] [CrossRef]
  18. Robins, L. More than 30 years of ‘Landcare’ in Australia: Five phases of development from ‘childhood’ to ‘mid-life’ (crisis or renewal?). Australas. J. Environ. Manag. 2018, 25, 385–397. [Google Scholar] [CrossRef]
  19. Kagohashi, K.; Fujimoto, T. Landcare, water resource management and sustainable development: Implications from a case study of a community-based approach to micro-hydropower development and social issues in Gokase township, Japan. Energy Procedia 2019, 156, 154–158. [Google Scholar] [CrossRef]
  20. Pan, Z.; David Cheok, A.; Mueller, W.; Zhang, M. Transactions on Edutainment XI; Springer: Berlin/Heidelberg, Germany, 2015. [Google Scholar] [CrossRef]
  21. Dawson, D.A.; Vercruysse, K.; Wright, N. A spatial framework to explore needs and opportunities for interoperable urban flood management. Philos. Trans. R. Soc. A Math. Phys. Eng. Sci. 2020, 378, 20190205. [Google Scholar] [CrossRef] [PubMed] [Green Version]
  22. Dhara, S.; Dang, T.; Parial, K.; Lu, X.X. Accounting for Uncertainty and Reconstruction of Flooding Patterns Based on Multi-Satellite Imagery and Support Vector Machine Technique: A Case Study of Can Tho City, Vietnam. Water 2020, 12, 1543. [Google Scholar] [CrossRef]
  23. Donratanapat, N.; Samadi, S.; Vidal, J.M.; Sadeghi Tabas, S. A national scale big data analytics pipeline to assess the potential impacts of flooding on critical infrastructures and communities. Environ. Model. Softw. 2020, 133, 104828. [Google Scholar] [CrossRef]
  24. Dos Reis, A.A.; Franklin, S.E.; de Mello, J.M.; Acerbi, F.W. Volume estimation in a Eucalyptus plantation using multi-source remote sensing and digital terrain data: A case study in Minas Gerais State, Brazil. Int. J. Remote Sens. 2019, 40, 2683–2702. [Google Scholar] [CrossRef]
  25. Elhag, M.; Abdurahman, S.G. Advanced remote sensing techniques in flash flood delineation in Tabuk City, Saudi Arabia. Nat. Hazards 2020, 103, 3401–3413. [Google Scholar] [CrossRef]
  26. Erdelj, M.; Król, M.; Natalizio, E. Wireless Sensor Networks and Multi-UAV systems for natural disaster management. Comput. Netw. 2017, 124, 72–86. [Google Scholar] [CrossRef]
  27. Esteban, J.; McRoberts, R.E.; Fernández-Landa, A.; Tomé, J.L.; Nӕsset, E. Estimating Forest Volume and Biomass and Their Changes Using Random Forests and Remotely Sensed Data. Remote Sens. 2019, 11, 1944. [Google Scholar] [CrossRef] [Green Version]
  28. Ezequiel, C.A.F.; Cua, M.; Libatique, N.C.; Tangonan, G.L.; Alampay, R.; Labuguen, R.T.; Favila, C.M.; Honrado, J.L.E.; Canos, V.; Devaney, C.; et al. UAV aerial imaging applications for post-disaster assessment, environmental management and infrastructure development. In Proceedings of the 2014 International Conference on Unmanned Aircraft Systems (ICUAS), Orlando, FL, USA, 27–30 May 2014; pp. 274–283. [Google Scholar] [CrossRef]
  29. Fu, G.; Meng, F.; Rivas Casado, M.; Kalawsky, R.S. Towards Integrated Flood Risk and Resilience Management. Water 2020, 12, 1789. [Google Scholar] [CrossRef]
  30. Gan, J.L.; Zailah, W. Water Level Classification for Flood Monitoring System Using Convolutional Neural Network. In Proceedings of the 11th National Technical Seminar on Unmanned System Technology 2019 (NUSYS’19), Pahang, Malaysia, 2–3 December 2019; Zain, Z.M., Ahmad, H., Pebrianti, D., Mustafa, M., Abdullah, N.R.H., Samad, R., Noh, M.M., Eds.; Springer: Singapore, 2019; pp. 299–318. [Google Scholar] [CrossRef]
  31. Gautam, A.; Sit, M.; Demir, I. Realistic River Image Synthesis Using Deep Generative Adversarial Networks. arXiv 2020, arXiv:2003.00826. Available online: https://arxiv.org/abs/2003.00826 (accessed on 18 October 2021).
  32. Gimenez-Maranges, M.; Breuste, J.; Hof, A. Sustainable Drainage Systems for transitioning to sustainable urban flood management in the European Union: A review. J. Clean. Prod. 2020, 255, 120191. [Google Scholar] [CrossRef]
  33. Guikema, S. Artificial intelligence for natural hazards risk analysis: Potential, challenges, and research needs. Risk Anal. 2020, 40, 1117–1123. [Google Scholar] [CrossRef] [PubMed]
  34. Masud, S.; Merson, J.; Robinson, D.F. Adapting a holistic approach to flood management in the Hawkesbury-Nepean region: Complexities and perceptions of the agencies involved. J. Environ. Plan. Manag. 2016, 59, 1126–1147. [Google Scholar] [CrossRef]
  35. Gupta, K. Challenges in developing urban flood resilience in India. Philos. Trans. R. Soc. A Math. Phys. Eng. Sci. 2020, 378, 20190211. [Google Scholar] [CrossRef] [Green Version]
  36. Hakdaoui, S.; Emran, A. Extraction of Water Information Based on SAR Radar and Optical Image Processing: Case of Flood Disaster in Southern Morocco. In Geospatial Technology; Oulidi, H.J., Fadil, A., Semane, N.E., Eds.; Springer: Cham, Switzerland, 2020; pp. 15–29. [Google Scholar] [CrossRef]
  37. Handayani, W.; Chigbu, U.E.; Rudiarto, I.; Putri, I.H.S. Urbanization and Increasing Flood Risk in the Northern Coast of Central Java—Indonesia: An Assessment towards Better Land Use Policy and Flood Management. Land 2020, 9, 343. [Google Scholar] [CrossRef]
  38. Hildmann, H.; Kovacs, E. Review: Using Unmanned Aerial Vehicles (UAVs) as Mobile Sensing Platforms (MSPs) for Disaster Response, Civil Security and Public Safety. Drones 2019, 3, 59. [Google Scholar] [CrossRef] [Green Version]
  39. Hong, H.; Panahi, M.; Shirzadi, A.; Ma, T.; Liu, J.; Zhu, A.-X.; Chen, W.; Kougias, I.; Kazakis, N. Flood susceptibility assessment in Hengfeng area coupling adaptive neuro-fuzzy inference system with genetic algorithm and differential evolution. Sci. Total Environ. 2019, 621, 1124–1141. [Google Scholar] [CrossRef]
  40. Hong, H.; Tsangaratos, P.; Ilia, I.; Liu, J.; Zhu, A.-X.; Chen, W. Application of fuzzy weight of evidence and data mining techniques in the construction of flood susceptibility map of Poyang County, China. Sci. Total Environ. 2018, 625, 575–588. [Google Scholar] [CrossRef] [PubMed]
  41. Hussein, K.; Alkaabi, K.; Ghebreyesus, D.; Liaqat, M.U.; Sharif, H.O. Land use/land cover change along the Eastern Coast of the UAE and its impact on flooding risk. Geomat. Nat. Hazards Risk 2020, 11, 112–130. [Google Scholar] [CrossRef] [Green Version]
  42. Iqbal, U.; Perez, P.; Li, W.; Barthelemy, J. How computer vision can facilitate flood management: A systematic review. Int. J. Disaster Risk Reduct. 2021, 53, 102030. [Google Scholar] [CrossRef]
  43. Ishak, E.H.; Rahman, A.; Westra, S.; Sharma, A.; Kuczera, G. Evaluating the non-stationarity of Australian annual maximum flood. J. Hydrol. 2013, 494, 134–145. [Google Scholar] [CrossRef]
  44. Jacinth Jennifer, J.; Saravanan, S.; Abijith, D. Integration of SAR and multi-spectral imagery in flood inundation mapping—A case study on Kerala floods. ISH J. Hydraul. Eng. 2018. Available online: https://www.tandfonline.com/doi/abs/10.1080/09715010.2020.1791265 (accessed on 18 November 2021).
  45. Jahangir, M.H.; Mousavi Reineh, S.M.; Abolghasemi, M. Spatial predication of flood zonation mapping in Kan River Basin, Iran, using artificial neural network algorithm. Weather Clim. Extremes 2019, 25, 100215. [Google Scholar] [CrossRef]
  46. Sharples, J.J.; Cary, G.J.; Fox-Hughes, P.; Mooney, S.; Evans, J.P.; Fletcher, M.S.; Baker, P. Natural hazards in Australia: Extreme bushfire. Clim. Change 2016, 139, 85–99. [Google Scholar] [CrossRef]
  47. Juan, A.; Gori, A.; Sebastian, A. Comparing floodplain evolution in channelized and unchannelized urban watersheds in Houston, Texas. J. Flood Risk Manag. 2020, 13, e12604. [Google Scholar] [CrossRef]
  48. Kankanamge, N.; Yigitcanlar, T.; Goonetilleke, A.; Kamruzzaman, M. Determining disaster severity through social media analysis: Testing the methodology with South East Queensland Flood tweets. Int. J. Disaster Risk Reduct. 2020, 42, 101360. [Google Scholar] [CrossRef]
  49. Karamuz, E.; Romanowicz, R.J.; Doroszkiewicz, J. The use of unmanned aerial vehicles in flood hazard assessment. J. Flood Risk Manag. 2020, 13, e12622. [Google Scholar] [CrossRef]
  50. Karunarathne, A.Y.; Lee, G. The geographies of the dynamic evolution of social networks for the flood disaster response and recovery. Appl. Geogr. 2020, 125, 102274. [Google Scholar] [CrossRef]
  51. Kellens, W.; Zaalberg, R.; Neutens, T.; Vanneuville, W.; De Maeyer, P. An Analysis of the Public Perception of Flood Risk on the Belgian Coast. Risk Anal. 2011, 31, 1055–1068. [Google Scholar] [CrossRef] [Green Version]
  52. Khalilpourazari, S.; Pasandideh, S.H.R. Designing emergency flood evacuation plans using robust optimization and artificial intelligence. J. Comb. Optim. 2021, 41, 640–677. [Google Scholar] [CrossRef]
  53. Khosravi, K.; Shahabi, H.; Pham, B.T.; Adamowski, J.; Shirzadi, A.; Pradhan, B.; Dou, J.; Ly, H.B.; Gróf, G.; Ho, H.L.; et al. A comparative assessment of flood susceptibility modeling using Multi-Criteria Decision-Making Analysis and Machine Learning Methods. J. Hydrol. 2019, 573, 311–323. [Google Scholar] [CrossRef]
  54. Chen, W.; Hong, H.; Li, S.; Shahabi, H.; Wang, Y.; Wang, X.; Bin Ahmad, B. Flood susceptibility modelling using novel hybrid approach of reduced-error pruning trees with bagging and random subspace ensembles. J. Hydrol. 2019, 575, 864–873. [Google Scholar] [CrossRef]
  55. Langhammer, J.; Janský, B.; Kocum, J.; Minařík, R. 3-D reconstruction of an abandoned montane reservoir using UAV photogrammetry, aerial LiDAR and field survey. Appl. Geogr. 2018, 98, 9–21. [Google Scholar] [CrossRef]
  56. Lioi, B.; Gioia, A.; Totaro, V.; Balacco, G.; Iacobellis, V.; Chiaia, G. Coupled Use of Hydrologic-Hydraulic Model and Geomorphological Descriptors for Flood-Prone Areas Evaluation: A Case Study of Lama Lamasinata. In Computational Science and Its Applications—ICCSA 2020, Proceedings of the International Conference on Computational Science and Its Applications, Cagliari, Italy, 1–4 July 2020; Gervasi, O., Murgante, B., Morterra, C., Misra, S., Garau, C., Blečić, I., Taniar, D., Apduhan, B.O., Rocha, A.M.A.C., Tarantino, E., et al., Eds.; Springer: Cham, Switzerland, 2020; pp. 607–619. [Google Scholar] [CrossRef]
  57. Lütjens, B.; Leshchinskiy, B.; Requena-Mesa, C.; Chishtie, F.; Díaz-Rodriguez, N.; Boulais, O.; Piña, A.; Newman, D.; Lavin, A.; Gal, Y.; et al. Physics-informed GANs for Coastal Flood Visualization. arXiv 2020, arXiv:2010.08103. Available online: https://arxiv.org/abs/2010.08103 (accessed on 18 October 2021).
  58. Makker, M.; Ramanathan, R.; Dinesh, S.B. Post Disaster Management Using Satellite Imagery and Social Media Data. In Proceedings of the 2019 4th International Conference on Computational Systems and Information Technology for Sustainable Solution (CSITSS), IEEE, Bengaluru, India, 20–21 December 2019; pp. 1–6. [Google Scholar] [CrossRef]
  59. Matgen, P.; Schumann, G.; Henry, J.-B.; Hoffmann, L.; Pfister, L. Integration of SAR-derived river inundation areas, high-precision topographic data and a river flow model toward near real-time flood management. Int. J. Appl. Earth Obs. Geoinf. 2007, 9, 247–263. [Google Scholar] [CrossRef]
  60. Mel, R.A.; Viero, D.P.; Carniello, L.; D’Alpaos, L. Optimal floodgate operation for river flood management: The case study of Padova (Italy). J. Hydrol. Reg. Stud. 2020, 30, 100702. [Google Scholar] [CrossRef]
  61. Miřijovský, J.; Langhammer, J. Multitemporal Monitoring of the Morphodynamics of a Mid-Mountain Stream Using UAS Photogrammetry. Remote Sens. 2015, 7, 8586–8609. [Google Scholar] [CrossRef] [Green Version]
  62. Mishra, A.; Arya, D.S. Development of Decision Support System (DSS) for Urban Flood Management: A Review of Methodologies and Results. In Proceedings of the World Environmental and Water Resources Congress 2020: Water, Wastewater, and Stormwater and Water Desalination and Reuse, Henderson, Nevada, USA, 17–21 May 2020; American Society of Civil Engineers: Reston, VA, USA, 2020; pp. 60–72. [Google Scholar] [CrossRef]
  63. Mohan, P.; Mittal, H. Review of ICT usage in disaster management. Int. J. Inf. Technol. 2020, 12, 955–962. [Google Scholar] [CrossRef]
  64. Mohanty, M.P.; Nithya, S.; Nair, A.S.; Indu, J.; Ghosh, S.; Bhatt, C.M.; Rao, G.S.; Karmakar, S. Sensitivity of various topographic data in flood management: Implications on inundation mapping over large data-scarce regions. J. Hydrol. 2020, 590, 125523. [Google Scholar] [CrossRef]
  65. Montasari, R.; Carroll, F.; Macdonald, S.; Jahankhani, H.; Hosseinian-Far, A.; Daneshkhah, A. Application of Artificial Intelligence. In Digital Forensic Investigation of Internet of Things (IoT) Devices; Montasari, R., Jahankhani, H., Hill, R., Parkinson, S., Eds.; Springer: Cham, Switzerland, 2021; pp. 47–64. [Google Scholar] [CrossRef]
  66. Santato, S.; Bender, S.; Schaller, M. The European floods directive and opportunities offered by land use planning; Technical Report for Climate Service Center: Hamburg, Germany, 2013. [Google Scholar]
  67. Houston, N.; Chok, H.; Luck, L. Stomal therapy service evaluation: How well are we supporting our patients? J. Stomal Ther. Aust. 2021, 41, 10–16. [Google Scholar] [CrossRef]
  68. Ofli, F.; Imran, M.; Alam, F. Using Artificial Intelligence and Social Media for Disaster Response and Management: An Overview. In AI and Robotics in Disaster Studies; Kumar, T.V.V., Sud, K., Eds.; Palgrave Macmillan: Singapore, 2020; pp. 63–81. [Google Scholar] [CrossRef]
  69. Oktari, R.S.; Munadi, K.; Idroes, R.; Sofyan, H. Knowledge management practices in disaster management: Systematic review. Int. J. Disaster Risk Reduct. 2020, 51, 101881. [Google Scholar] [CrossRef]
  70. Ortiz, B.; Kahn, L.; Bosch, M.; Bogden, P.; Pavon-Harr, V.; Savas, O.; McCulloh, I. Improving Community Resiliency and Emergency Response with Artificial Intelligence. arXiv 2020, arXiv:2005.14212. Available online: https://arxiv.org/abs/2005.14212 (accessed on 18 October 2021).
  71. Pham, B.T.; Luu, C.; Van Phong, T.; Nguyen, H.D.; Van Le, H.; Tran, T.Q.; Ta, H.T.; Prakash, I. Flood risk assessment using hybrid artificial intelligence models integrated with multi-criteria decision analysis in Quang Nam Province, Vietnam. J. Hydrol. 2021, 592, 125815. [Google Scholar] [CrossRef]
  72. Pouyanfar, S.; Tao, Y.; Sadiq, S.; Tian, H.; Tu, Y.; Wang, T.; Chen, S.-C.; Shyu, M.-L. Unconstrained Flood Event Detection Using Adversarial Data Augmentation. In Proceedings of the 2019 IEEE International Conference on Image Processing (ICIP), IEEE, Taipei, Taiwan, 22–25 September 2019; pp. 155–159. [Google Scholar] [CrossRef]
  73. Pradeep, R.M.M.; Wijesekera, N.T.S. Incorporating stakeholder concerns in Land Information Systems for urban flood management. Array 2020, 8, 100037. [Google Scholar] [CrossRef]
  74. Puno, G.R.; Puno, R.C.C.; Maghuyop, I.V. Two-dimensional food model for risk exposure analysis of land use/land cover in a watershed. Glob. J. Environ. Sci. Manag. 2021, 7, 225–238. [Google Scholar] [CrossRef]
  75. Razali, N.; Ismail, S.; Mustapha, A. Machine learning approach for flood risks prediction. IAES Int. J. Artif. Intell. 2020, 9, 73. [Google Scholar] [CrossRef]
  76. Riza, H.; Santoso, E.W.; Tejakusuma, I.G.; Prawiradisastra, F.; Prihartanto, P. Utilization of Artificial Intelligence to Improve Flood Disaster Mitigation. J. Sains Teknol. Mitigasi Bencana 2020, 15, 1–11. [Google Scholar] [CrossRef]
  77. Said, A.; Shaat, O.; Su, P.-H.; Bogden, P.; Kraig, R.; Bosch, M. Understanding Flooding Detection Using Overhead Imagery—Lessons Learned. In Advances in Visual Computing, Proceedings of the 15th International Symposium on Visual Computing, San Diego, CA, USA, 5–7 October 2020; Bebis, G., Yin, Z., Kim, E., Bender, J., Subr, K., Kwon, B.C., Zhao, J., Kalkofen, D., Baciu, G., Morterra, C., Eds.; Springer: Cham, Switzerland, 2020; pp. 696–706. [Google Scholar] [CrossRef]
  78. Saravi, S.; Kalawsky, R.; Joannou, D.; Rivas Casado, M.; Fu, G.; Meng, F. Use of Artificial Intelligence to Improve Resilience and Preparedness against Adverse Flood Events. Water 2019, 11, 973. [Google Scholar] [CrossRef] [Green Version]
  79. Schumann, G.; Matgen, P.; Cutler, M.E.J.; Black, A.; Hoffmann, L.; Pfister, L. Comparison of remotely sensed water stages from LiDAR, topographic contours and SRTM. ISPRS J. Photogramm. Remote Sens. 2008, 63, 283–296. [Google Scholar] [CrossRef]
  80. Sermet, Y.; Demir, I. Towards an information centric flood ontology for information management and communication. Earth Sci. Inform. 2019, 12, 541–551. [Google Scholar] [CrossRef]
  81. Shah, S.A.; Seker, D.Z.; Hameed, S.; Draheim, D. The Rising Role of Big Data Analytics and IoT in Disaster Management: Recent Advances, Taxonomy and Prospects. IEEE Access 2019, 7, 54595–54614. [Google Scholar] [CrossRef]
  82. Mohammadi, A.; Kamran, K.V.; Karimzadeh, S.; Shahabi, H.; Al-Ansari, N. Flood Detection and Susceptibility Mapping Using Sentinel-1 Time Series, Alternating Decision Trees, and Bag-ADTree Models. Complexity 2020, 2020, 1–21. [Google Scholar] [CrossRef]
  83. Shahabi, H.; Shirzadi, A.; Ghaderi, K.; Omidvar, E.; Al-Ansari, N.; Clague, J.J.; Geertsema, M.; Khosravi, K.; Amini, A.; Bahrami, S.; et al. Flood Detection and Susceptibility Mapping Using Sentinel-1 Remote Sensing Data and a Machine Learning Approach: Hybrid Intelligence of Bagging Ensemble Based on K-Nearest Neighbor Classifier. Remote Sens. 2020, 12, 266. [Google Scholar] [CrossRef] [Green Version]
  84. Simmons, B.; Pinto, U.; Scott, J.; Maheshwari, B. Development of Future Management Options for the Hawkesbury River. In Balanced Urban Development: Options and Strategies for Liveable Cities; Springer: Cham, Switzerland, 2016; pp. 539–553. [Google Scholar] [CrossRef] [Green Version]
  85. Singh, G.; Pandey, A. Mapping Punjab Flood Using Multi-Temporal Open-Access Synthetic Aperture Radar Data in Google Earth Engine. In Hydrological Extremes; Pandey, A., Mishra, S., Kansal, M., Singh, R., Singh, V.P., Eds.; Springer: Cham, Switzerland, 2021; pp. 75–85. [Google Scholar] [CrossRef]
  86. Maya Sintha, E.O.; Suryadi, B.; Syafari, M.R. Performance Assessment of Local Government Organizations on Flood Disaster Prevention and Preparedness in Gunung Mas Regency. Sch. Int. J. Law Crime Justice 2020, 3, 458–462. [Google Scholar] [CrossRef]
  87. Smith, K.; Berry, R.; Clarke, L.E. Exploring the potential of Google Earth as a communication and engagement tool in collaborative Natural Flood Management planning. Geogr. J. 2020, 186, 171–185. [Google Scholar] [CrossRef]
  88. Steinführer, A.; Kuhlicke, C.; De Marchi, B.; Scolobig, A.; Tapsell, S.; Tunstall, S. Towards flood risk. In Flood Risk Management: Research and Practice; CRC Press: Boca Raton, FL, USA, 2008; pp. 945–955. [Google Scholar] [CrossRef]
  89. Stylianidis, E.; Akca, D.; Poli, D.; Hofer, M.; Gruen, A.; Sánchez Martín, V.; Smagas, K.; Walli, A.; Altan, O.; Jimeno, E.; et al. FORSAT: A 3D forest monitoring system for cover mapping and volumetric 3D change detection. Int. J. Dig. Earth 2020, 13, 854–885. [Google Scholar] [CrossRef]
  90. Sun, W.; Bocchini, P.; Davison, B.D. Applications of artificial intelligence for disaster management. Nat. Hazards 2020, 103, 2631–2689. [Google Scholar] [CrossRef]
  91. Syifa, M.; Park, S.J.; Achmad, A.R.; Lee, C.-W.; Eom, J. Flood Mapping Using Remote Sensing Imagery and Artificial Intelligence Techniques: A Case Study in Brumadinho, Brazil. J. Coast. Res. 2019, 90, 197. [Google Scholar] [CrossRef]
  92. Tamminga, A.D.; Eaton, B.C.; Hugenholtz, C.H. UAS-based remote sensing of fluvial change following an extreme flood event. Earth Surf. Process. Landf. 2015, 40, 1464–1476. [Google Scholar] [CrossRef]
  93. Elsafi, S.H. Artificial Neural Networks (ANNs) for flood forecasting at Dongola Station in the River Nile, Sudan. Alex. Eng. J. 2014, 53, 655–662. [Google Scholar] [CrossRef]
  94. Ruslan, F.A.; Nur, K.Z.; Adnan, R. Flood modelling using Artificial Neural Network. In Proceedings of the 2013 IEEE 4th Control and System Graduate Research Colloquium, Shah Alam, Malaysia, 19–20 August 2013; pp. 116–120. [Google Scholar]
  95. Shi, Y.; Taalab, K.; Cheng, T. Flood Prediction Using Support Vector Machines (SVM). In Proceedings of the 24th GIS Research UK (GISRUK) Conference (GISRUK2016), London, UK, 30 March–1 April 2017. [Google Scholar]
  96. Panagoulia, D.; Tsekouras, G.; Kousiouris, G.J.G.N.J. A multi-stage methodology for selecting input variables in ANN forecasting of river flows. Glob. NEST J. 2017, 19, 49–57. [Google Scholar]
  97. Trim Peter, R.J. An integrative approach to disaster management and planning. Disaster Prev. Manag. Int. J. 2004, 13, 218–225. [Google Scholar] [CrossRef]
  98. Munawar, H.S.; Ullah, F.; Heravi, A.; Thaheem, M.J.; Maqsoom, A. Inspecting Buildings Using Drones and Computer Vision: A Machine Learning Approach to Detect Cracks and Damages. Drones 2022, 6, 5. [Google Scholar] [CrossRef]
  99. Li, X.; Yu, L.; Xu, Y.; Yang, J.; Gong, P. Ten years after Hurricane Katrina: Monitoring recovery in New Orleans and the surrounding areas using remote sensing. Sci. Bull. 2016, 61, 1460–1470. [Google Scholar] [CrossRef] [Green Version]
  100. Ofli, F.; Meier, P.; Imran, M.; Castillo, C.; Tuia, D.; Rey, N.; Briant, J.; Millet, P.; Reinhard, F.; Parkan, M.; et al. Combining human computing and machine learning to make sense of big (aerial) data for disaster response. Big Data 2016, 4, 47–59. [Google Scholar] [CrossRef] [PubMed] [Green Version]
  101. Twumasi, Y.A.; Merem, E.C.; Namwamba, J.B.; Okwemba, R.; Ayala-Silva, T.; Abdollahi, K.; Lukongo, O.E.B.; Tate, J.; La Cour-Conant, K.; Akinrinwoye, C.O. Use of GIS and Remote Sensing Technology as a Decision Support Tool in Flood Disaster Management: The Case of Southeast Louisiana, USA. J. Geogr. Inf. Syst. 2020, 12, 141–157. [Google Scholar] [CrossRef]
  102. Ullah, K.; Zhang, J. GIS-based flood hazard mapping using relative frequency ratio method: A case study of Panjkora River Basin, eastern Hindu Kush, Pakistan. PLoS ONE 2020, 15, e0229153. [Google Scholar] [CrossRef] [Green Version]
  103. Venturini, F.; Mason, F.; Pase, F.; Chiariotti, F.; Testolin, A.; Zanella, A.; Zorzi, M. Distributed Reinforcement Learning for Flexible and Efficient UAV Swarm Control. IEEE Trans. Cognit. Commun. Netw. 2021, 7, 955–969. [Google Scholar] [CrossRef]
  104. Vidal, S.; Richaud, B.; Hansen, F.; Courtigne, J. Flood Forecast Tool to Help Dam Management from France to Thailand. In Advances in Hydroinformatics; Gourbesville, P., Caignaert, G., Eds.; Springer: Singapore, 2020; pp. 427–435. [Google Scholar] [CrossRef]
  105. Wagenaar, D.; Curran, A.; Balbi, M.; Bhardwaj, A.; Soden, R.; Hartato, E.; Mestav Sarica, G.; Ruangpan, L.; Molinario, G.; Lallemant, D. Invited perspectives: How machine learning will change flood risk and impact assessment. Nat. Hazards Earth Syst. Sci. 2020, 20, 1149–1161. [Google Scholar] [CrossRef]
Figure 1. The Hawkesbury-Nepean floodplain.
Buildings 12 00080 g001
Figure 2. Comparison of the differences in flood levels and flood risk between the Hawkesbury-Nepean River and other floodplains.
Buildings 12 00080 g002
Figure 3. The NSW coast has been drowned by at least 200 mm, and in some places, more than 400 mm of rain.
Buildings 12 00080 g003
Figure 4. The overall sub-catchment contributions to flooding events at Windsor since 1960.
Buildings 12 00080 g004
Figure 5. Major flood events of Hawkesbury-Nepean valley displaying a level of 12.2 m or above at Windsor [28,29].
Buildings 12 00080 g005
Figure 6. Distribution of older persons with an age of 65 years and above in the Nepean Blue Mountains according to LGA from the years 2016–2036.
Buildings 12 00080 g006
Figure 7. The timeline and milestones for the implementation of the flood management strategy for the Hawkesbury-Nepean Valley.
Buildings 12 00080 g007
Figure 8. Proposed strategy for flood risk management.
Buildings 12 00080 g008
Table 1. Estimated number of properties and people affected by flooding in the Hawkesbury-Nepean Floodplain [Source: HNV Strategy: January 2020].
People Who Live in the Floodplain=People Who Live in the Floodplain+Employee Who Works in the Floodplain but Live Outside the Floodplain
PropertiesPeople
Flood Size (1 in x Chance per Year)Residential Properties Affected by Flooding (Note 1) (Note 2)Residential Properties Affected by Flooding More than 2.1 m Deep at Location of Dwelling (Note 2)Number of Commercial and Industrial Buildings Affected by Flooding (Note 3)ResidentsEmployeesTOTAL People Who Live or Work in the Flooded Areas
Residential Population in Flooded AreasEmployees Who Work in the Floodplain but Live Outside the Floodplain
1 in 5730403016002701900
1 in 101600420110380016005400
1 in 2025001200200610029009000
1 in 504800270053012,400590018,200
1 in 1007600410094019,800960029,400
1 in 20099005500120025,70012,30038,100
1 in 50015,5007400180039,00023,70062,600
1 in 100019,6009900230049,10030,30079,400
1 in 200023,60014,400270058,50036,50095,000
1 in 500026,20019,700310065,10039,900105,000
PMF36,70031,800380091,00048,100139,000
Note 1: Residential properties and population include manufactured homes (caravans, manufactured homes, temporary dwellings, cabins, etc.) located within caravan parks. Note 2: The number of residential properties affected by flooding relates to the property level (2017 Lidar, 2011 Lidar downstream of Wisemans Ferry) at the location of the dwelling (not the centroid of the property). The number of properties does not relate to the floor level of the dwelling. Note 3: The number of commercial and industrial buildings affected by flooding relates to the property level (2017 Lidar, 2011 Lidar downstream of Wisemans Ferry) at the centroid of the building (not the centroid of the property). The number of properties does not relate to the floor level of the building.
Publisher’s Note: MDPI stays neutral with regard to jurisdictional claims in published maps and institutional affiliations.

