
Passive Energy-Saving Optimal Design for Rural Residences of Hanzhong Region in Northwest China Based on Performance Simulation and Optimization Algorithm


Abstract
:1. Introduction
2. Methods
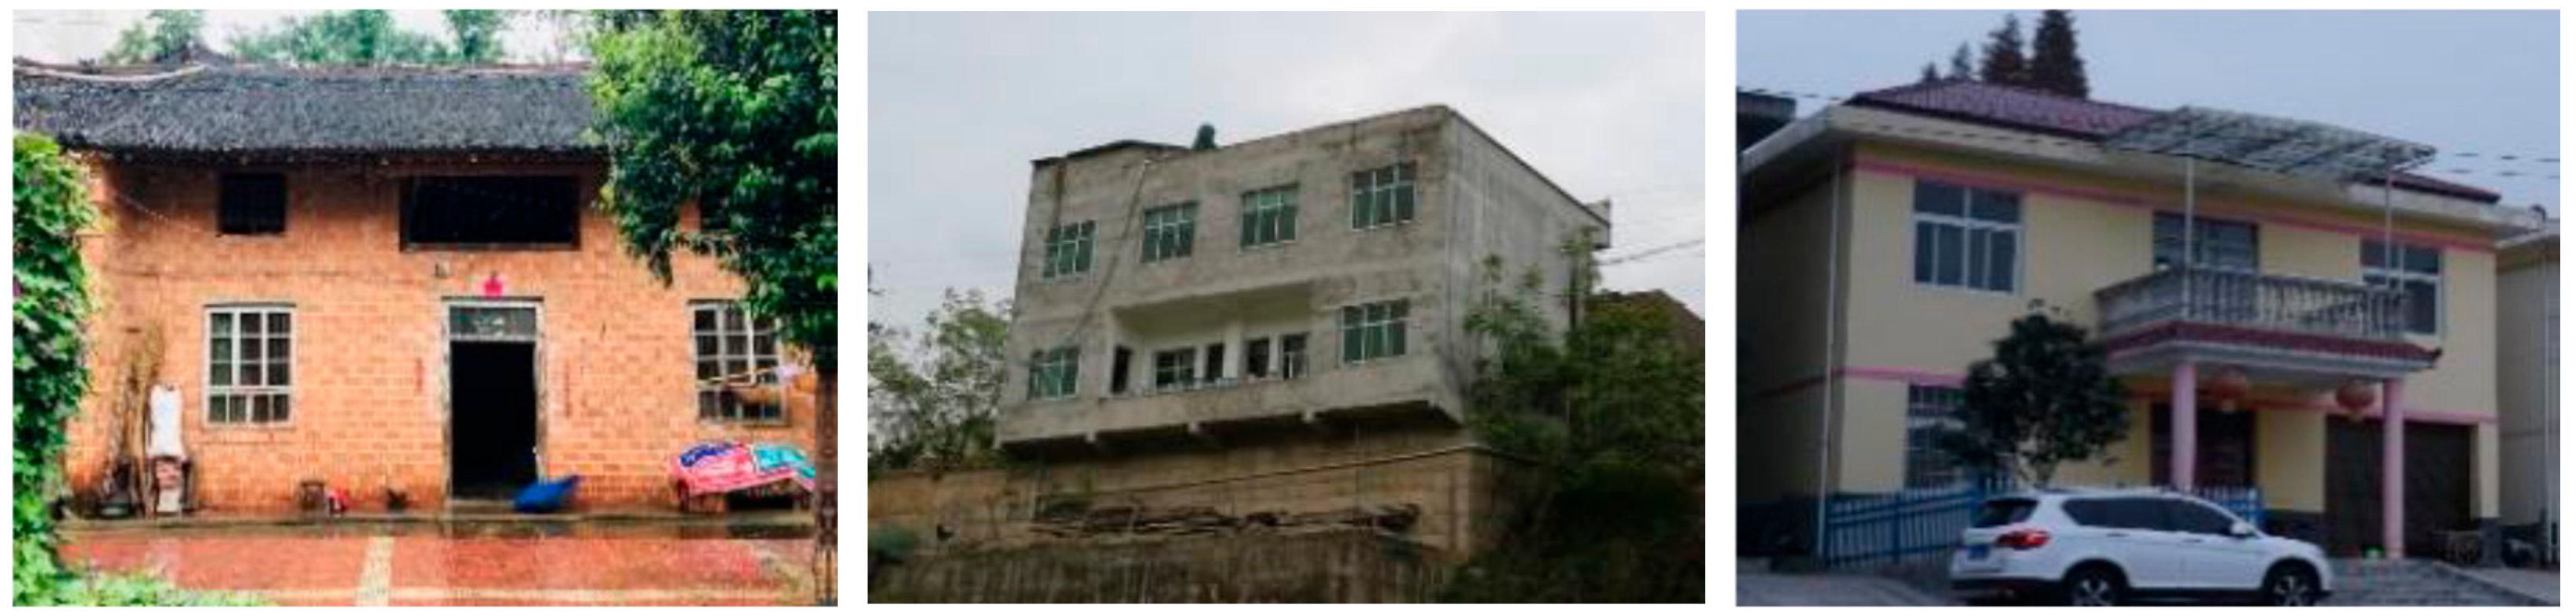
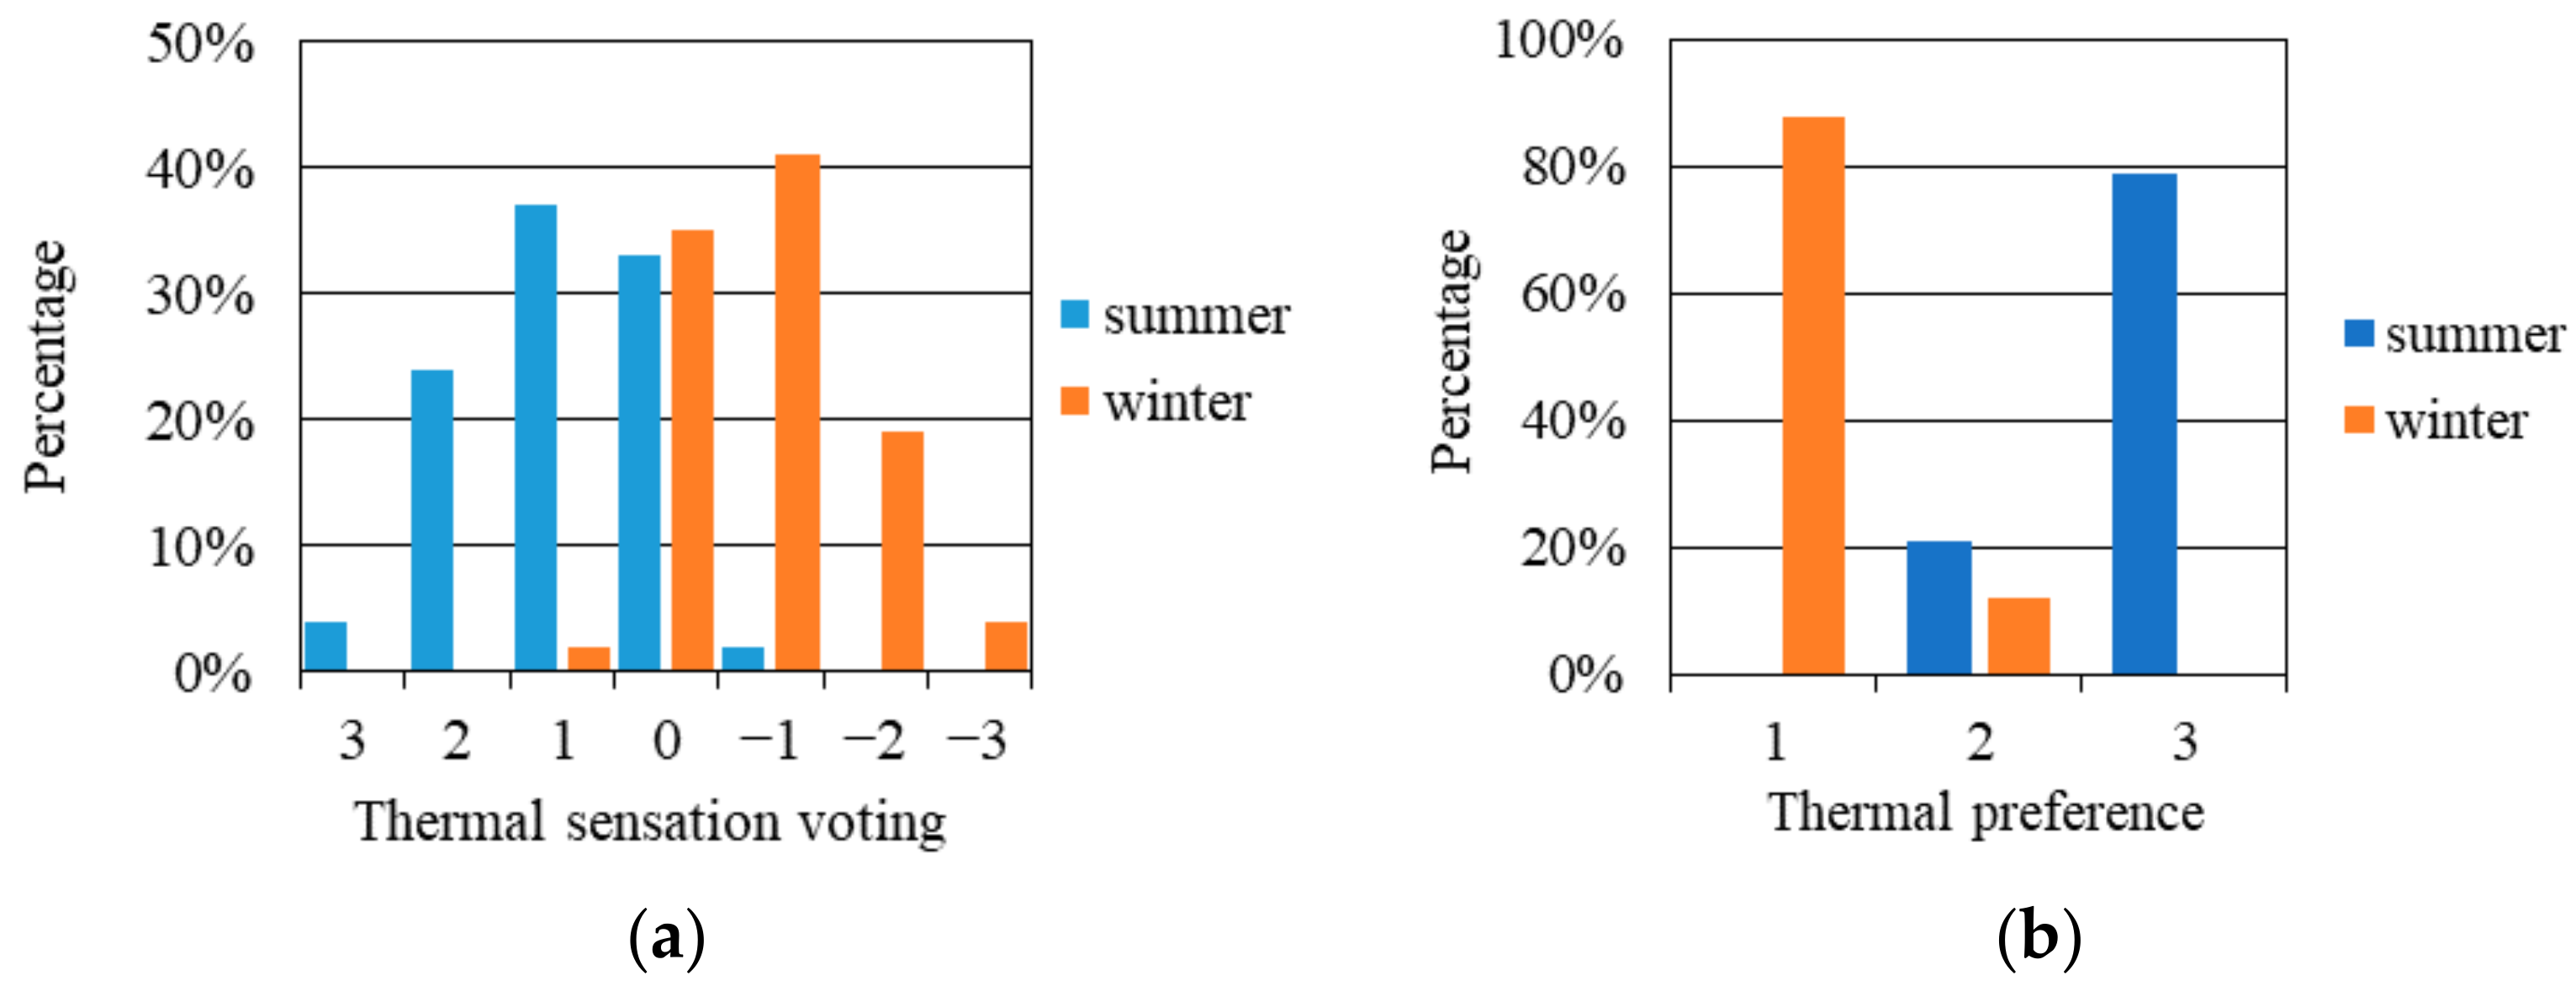
2.1. Field Survey
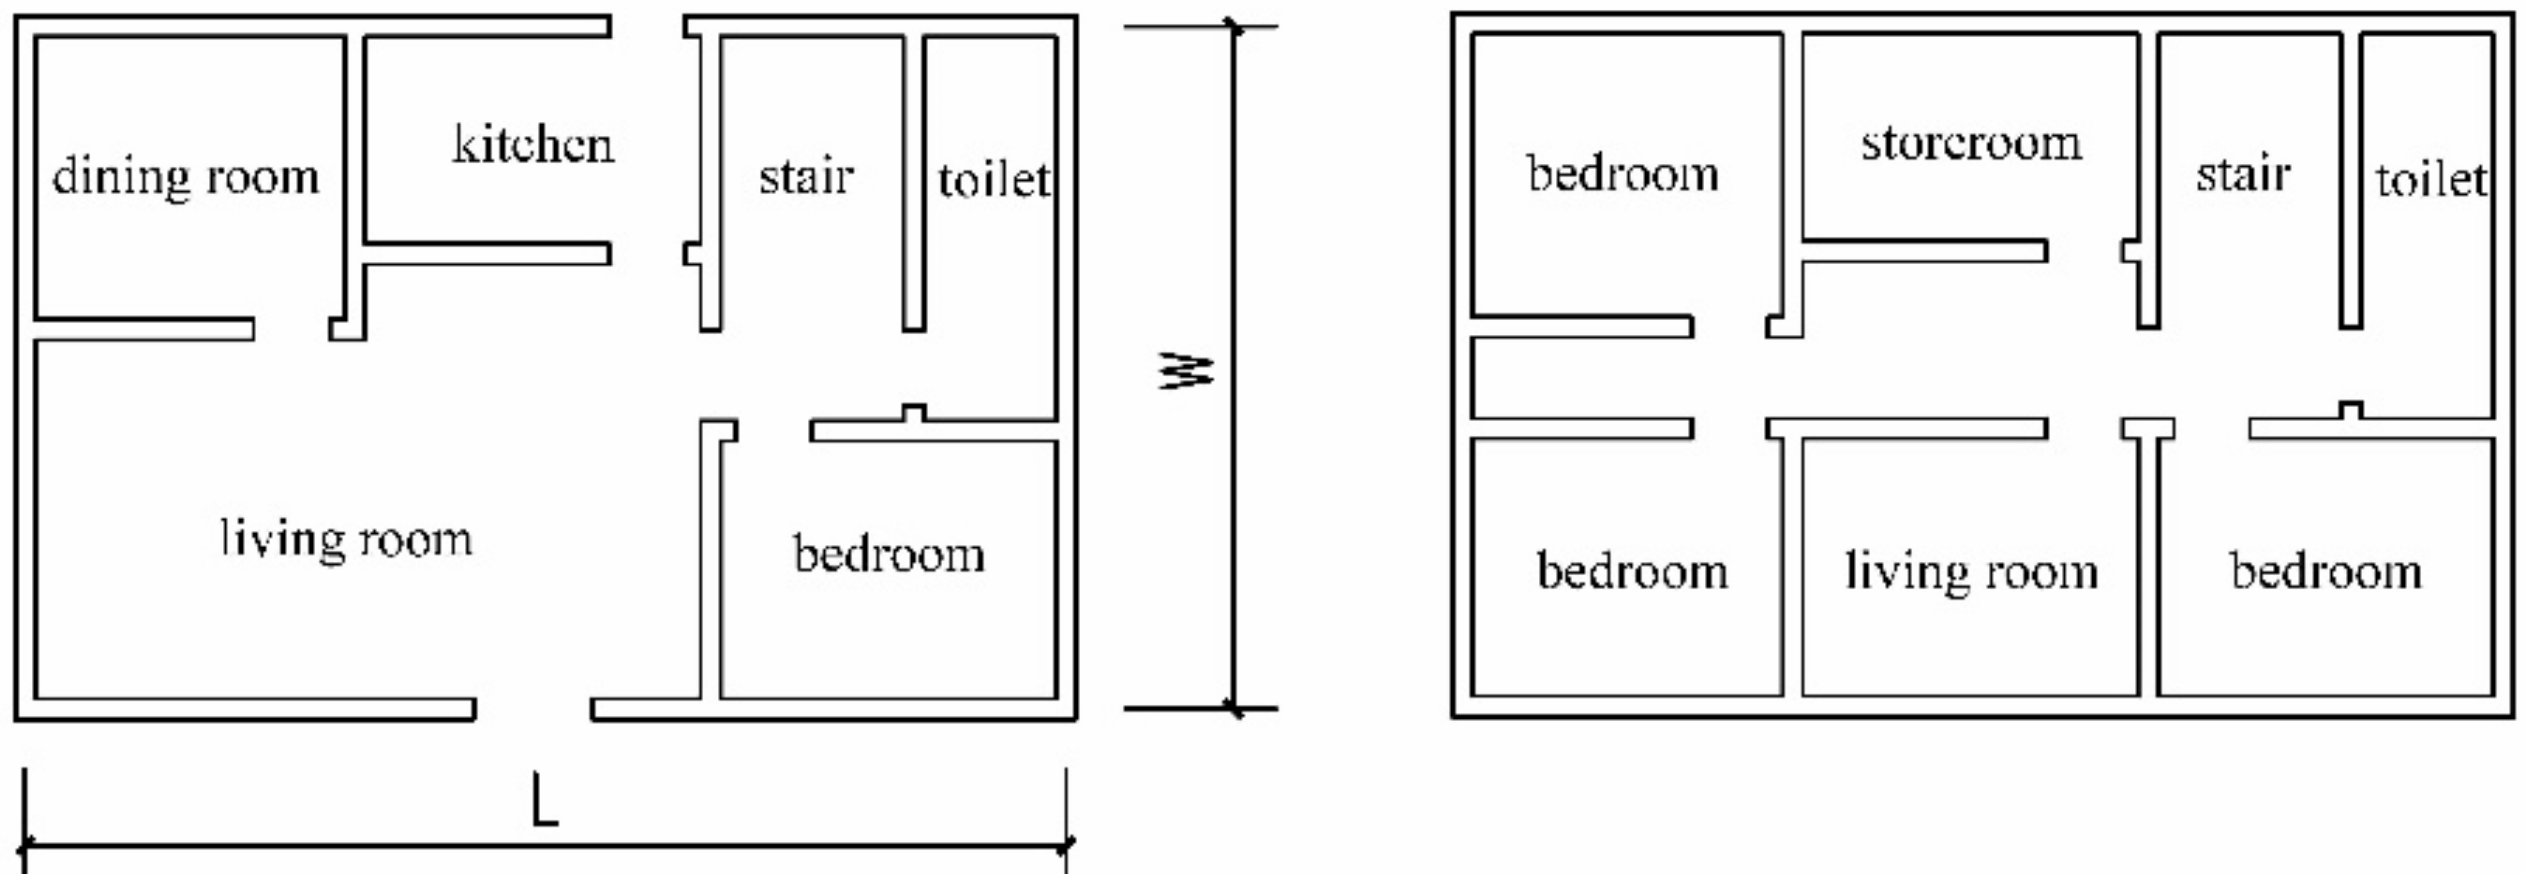
2.2. Baseline Model
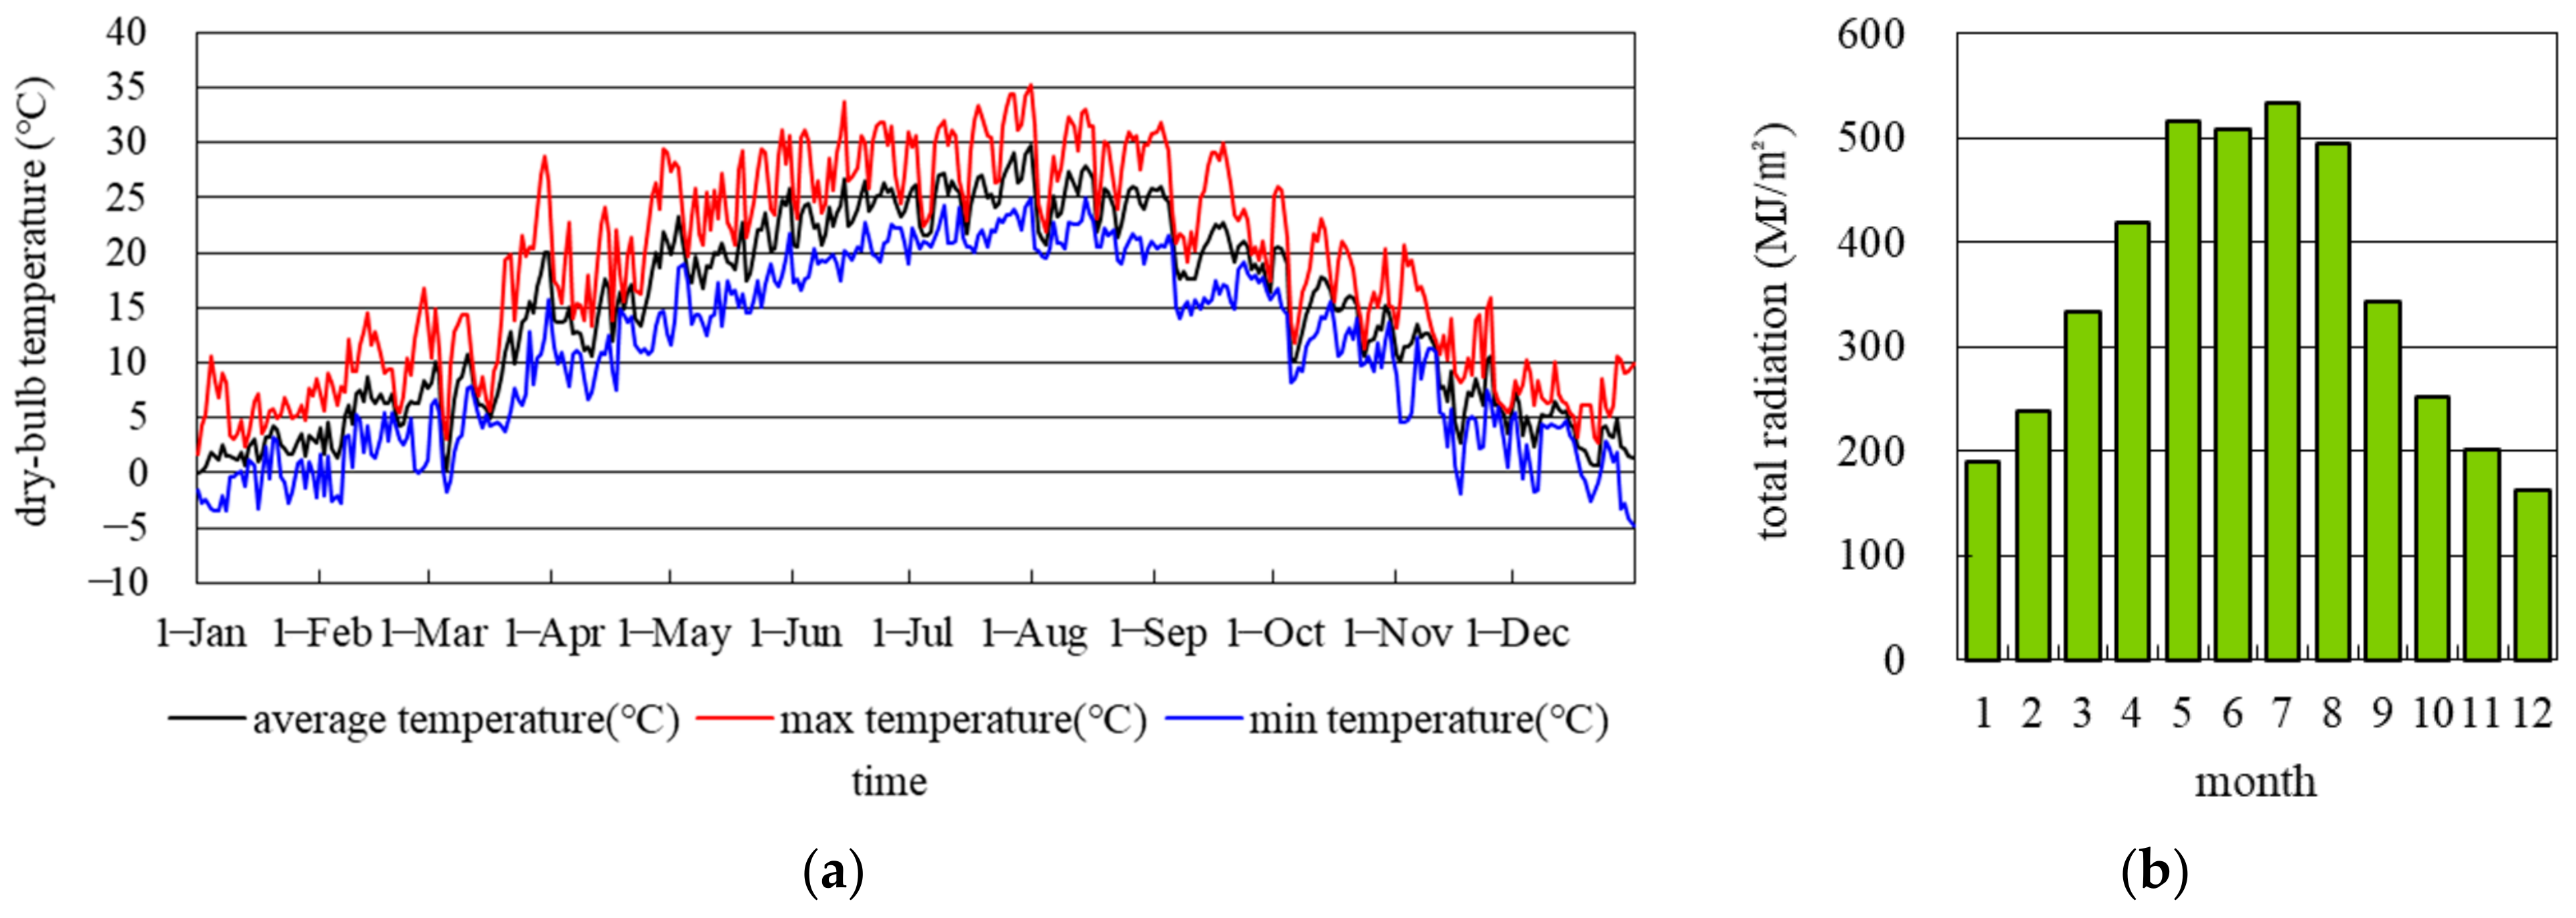
2.2.1. Meteorological Data
2.2.2. Parameters of Retained Building Envelope
2.2.3. Heating and Air Conditioning Systems
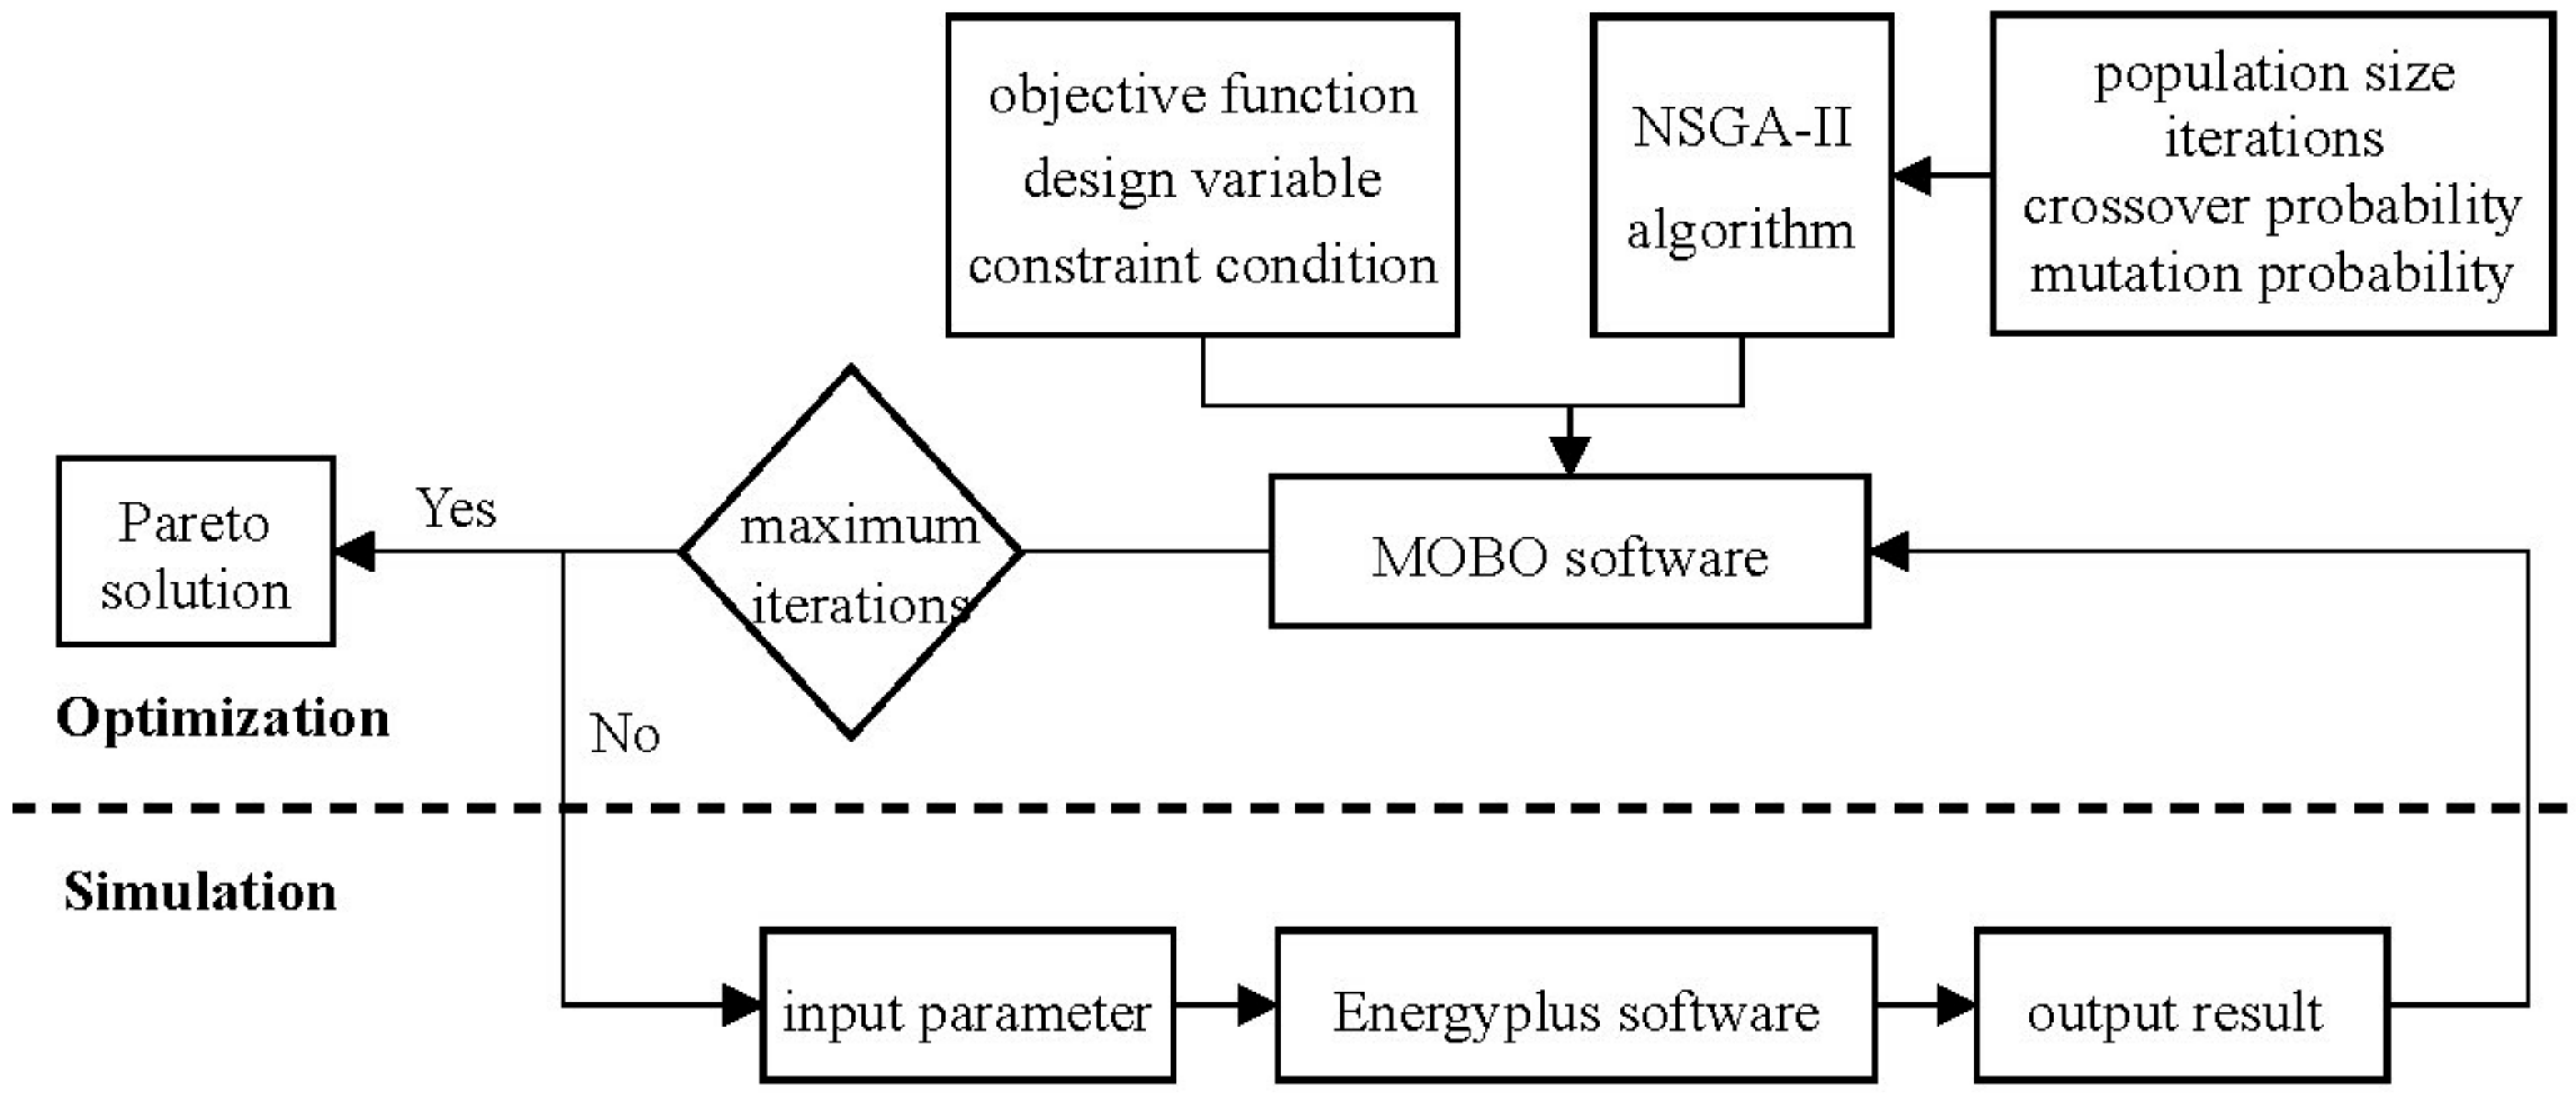
2.3. Optimization Platform: Coupling of EnergyPlus and MOBO
2.4. Multi-Attribute Decision Making
2.5. Passive Design Parameters
2.5.1. Parameters of Building Form: Orientation and Building Shape
2.5.2. Parameters of Building Envelope: External Wall, Roof and Window
- External wall
- Roof
- External window
2.5.3. Parameters of Building Interface: Shading System and Window-Wall Ratio
- External sun-shading
- Window–wall ratio (WWR)
3. Results and Discussion
3.1. Single-Parameter and Single-Objective Analysis: Quantitative Relationships between Design Parameter and Energy Consumption
3.1.1. Building Form Parameters
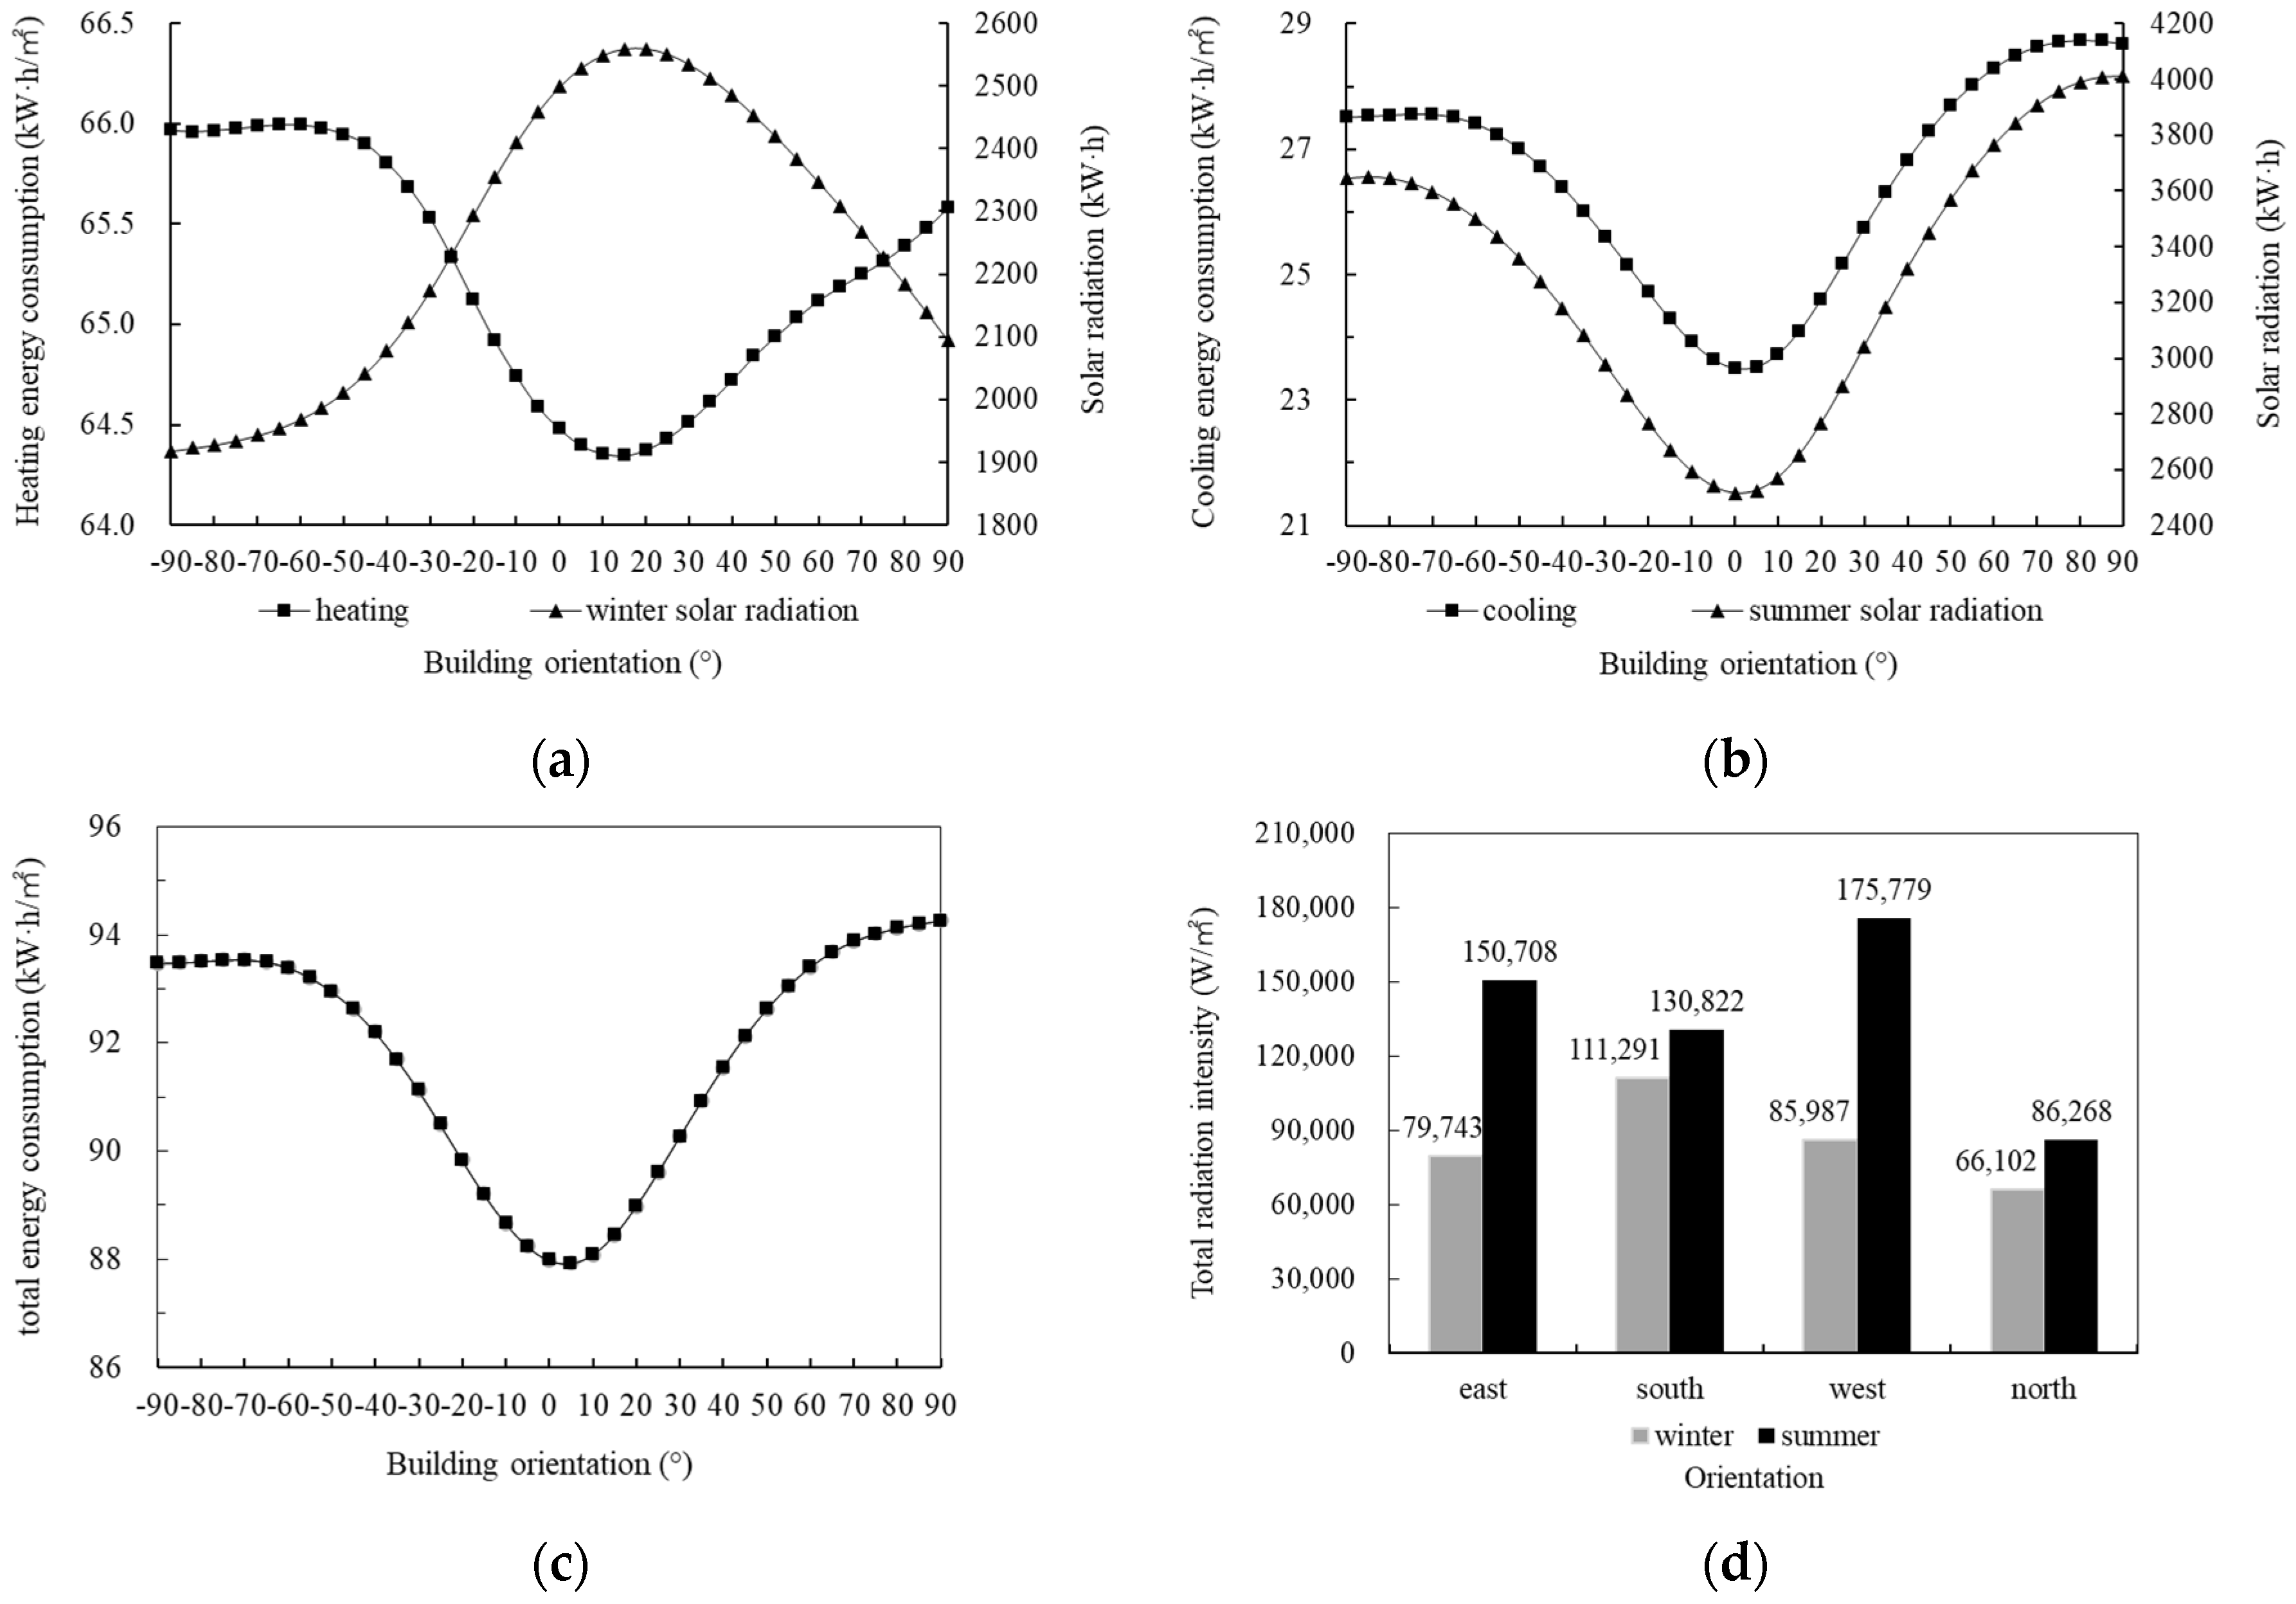
- Building orientation
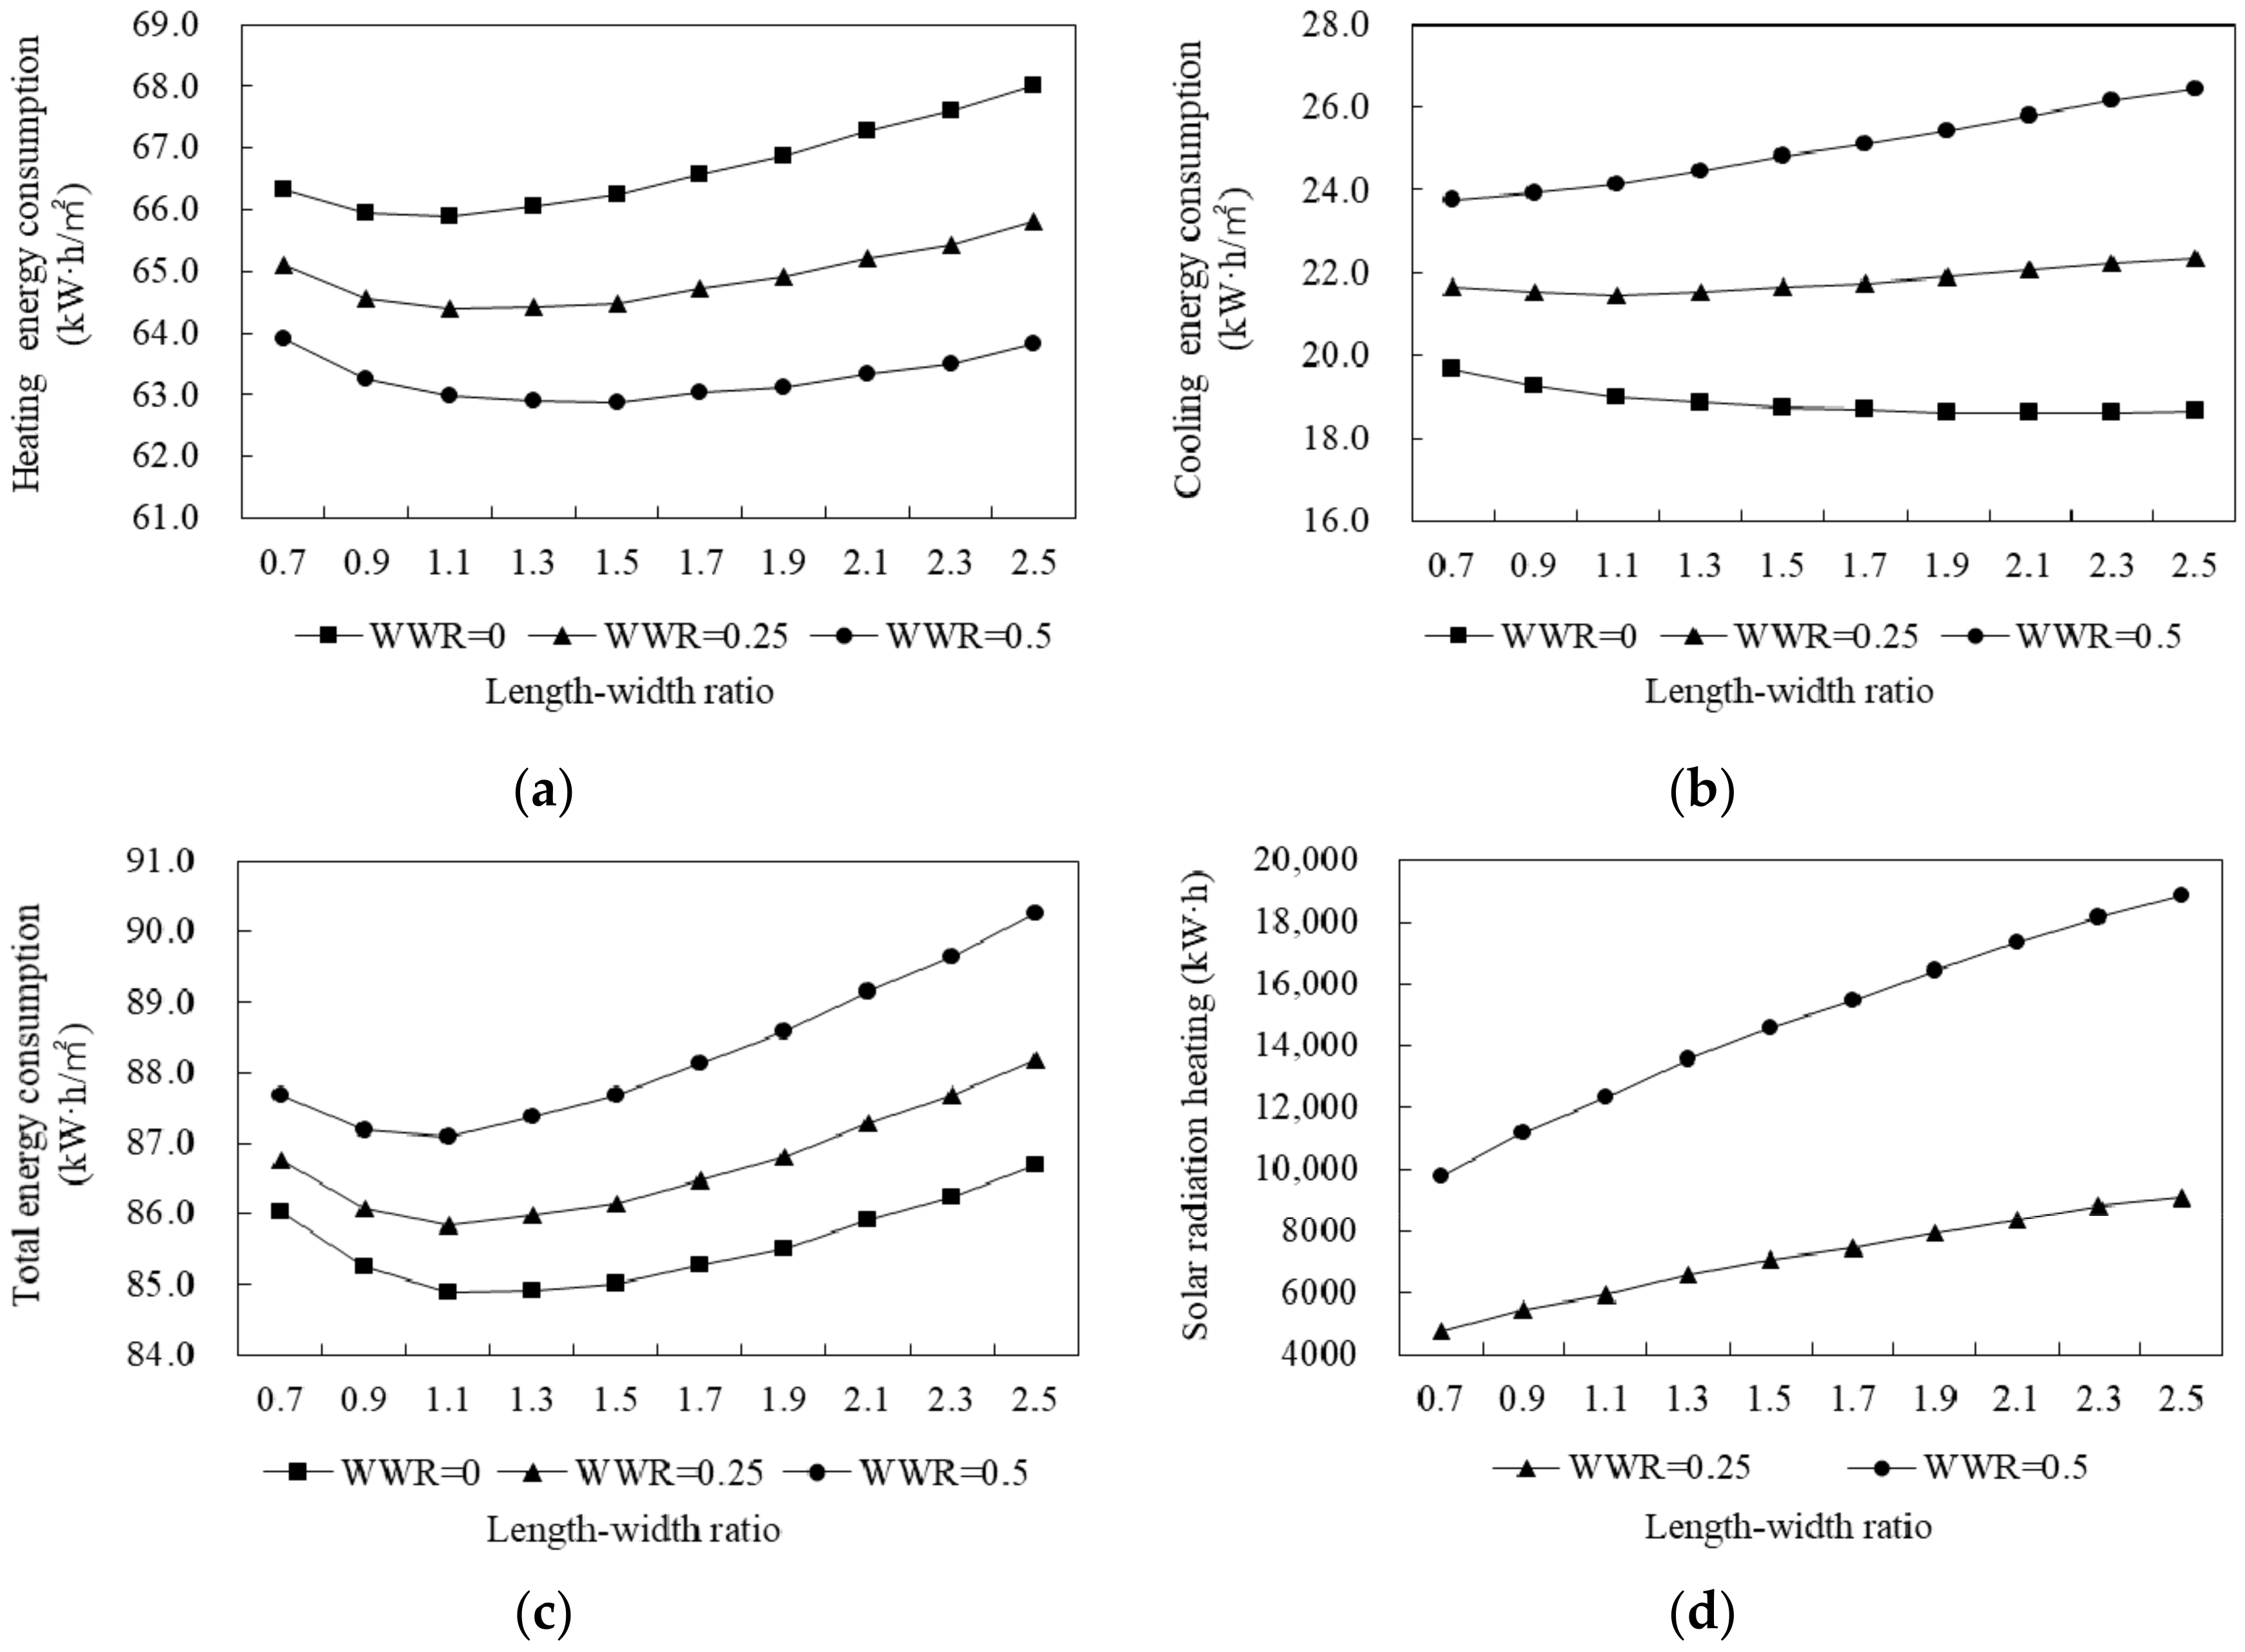
- Length–width ratio (LWR)
3.1.2. Building Envelope Parameters
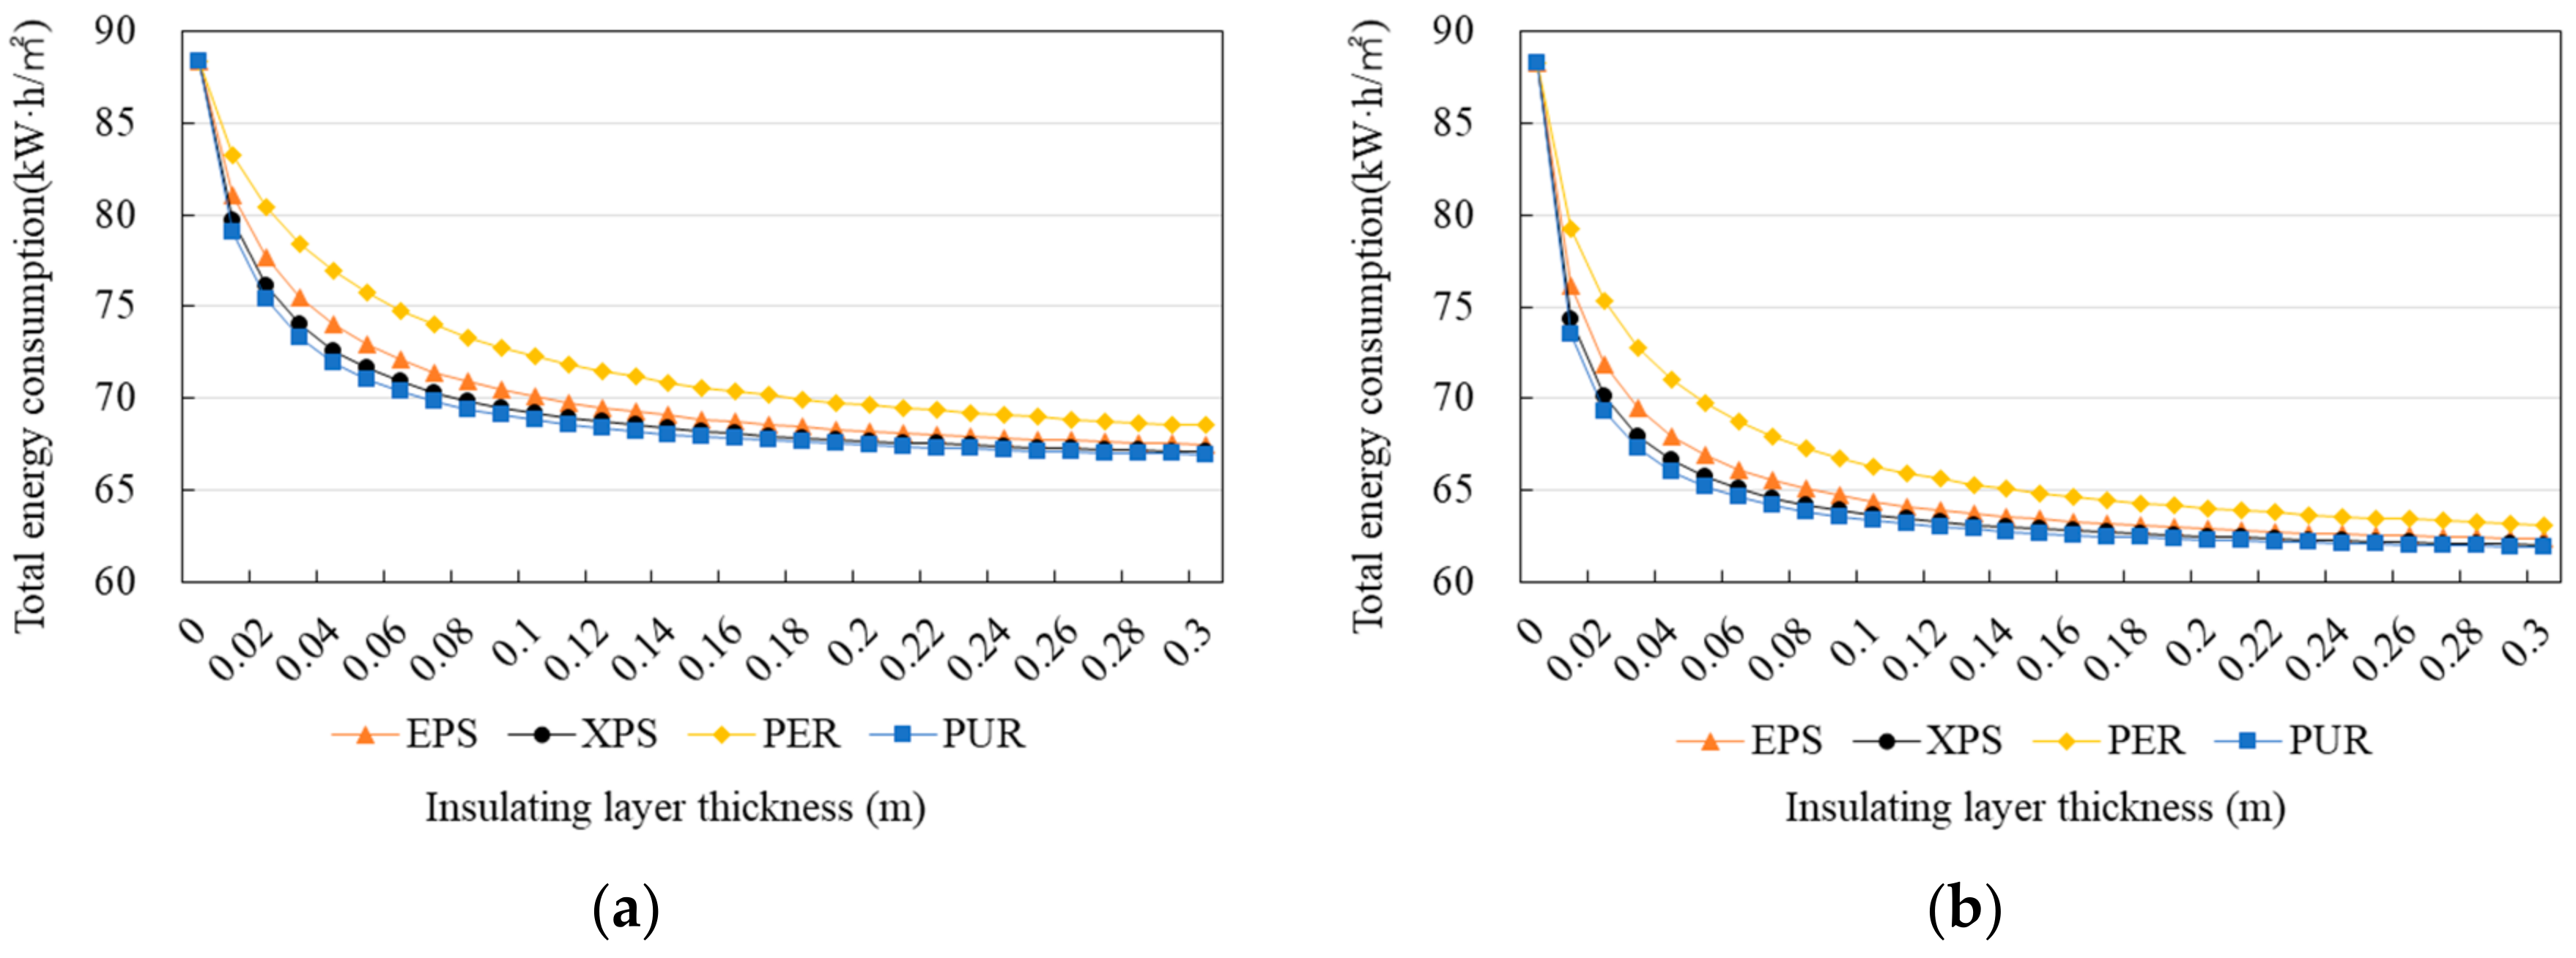
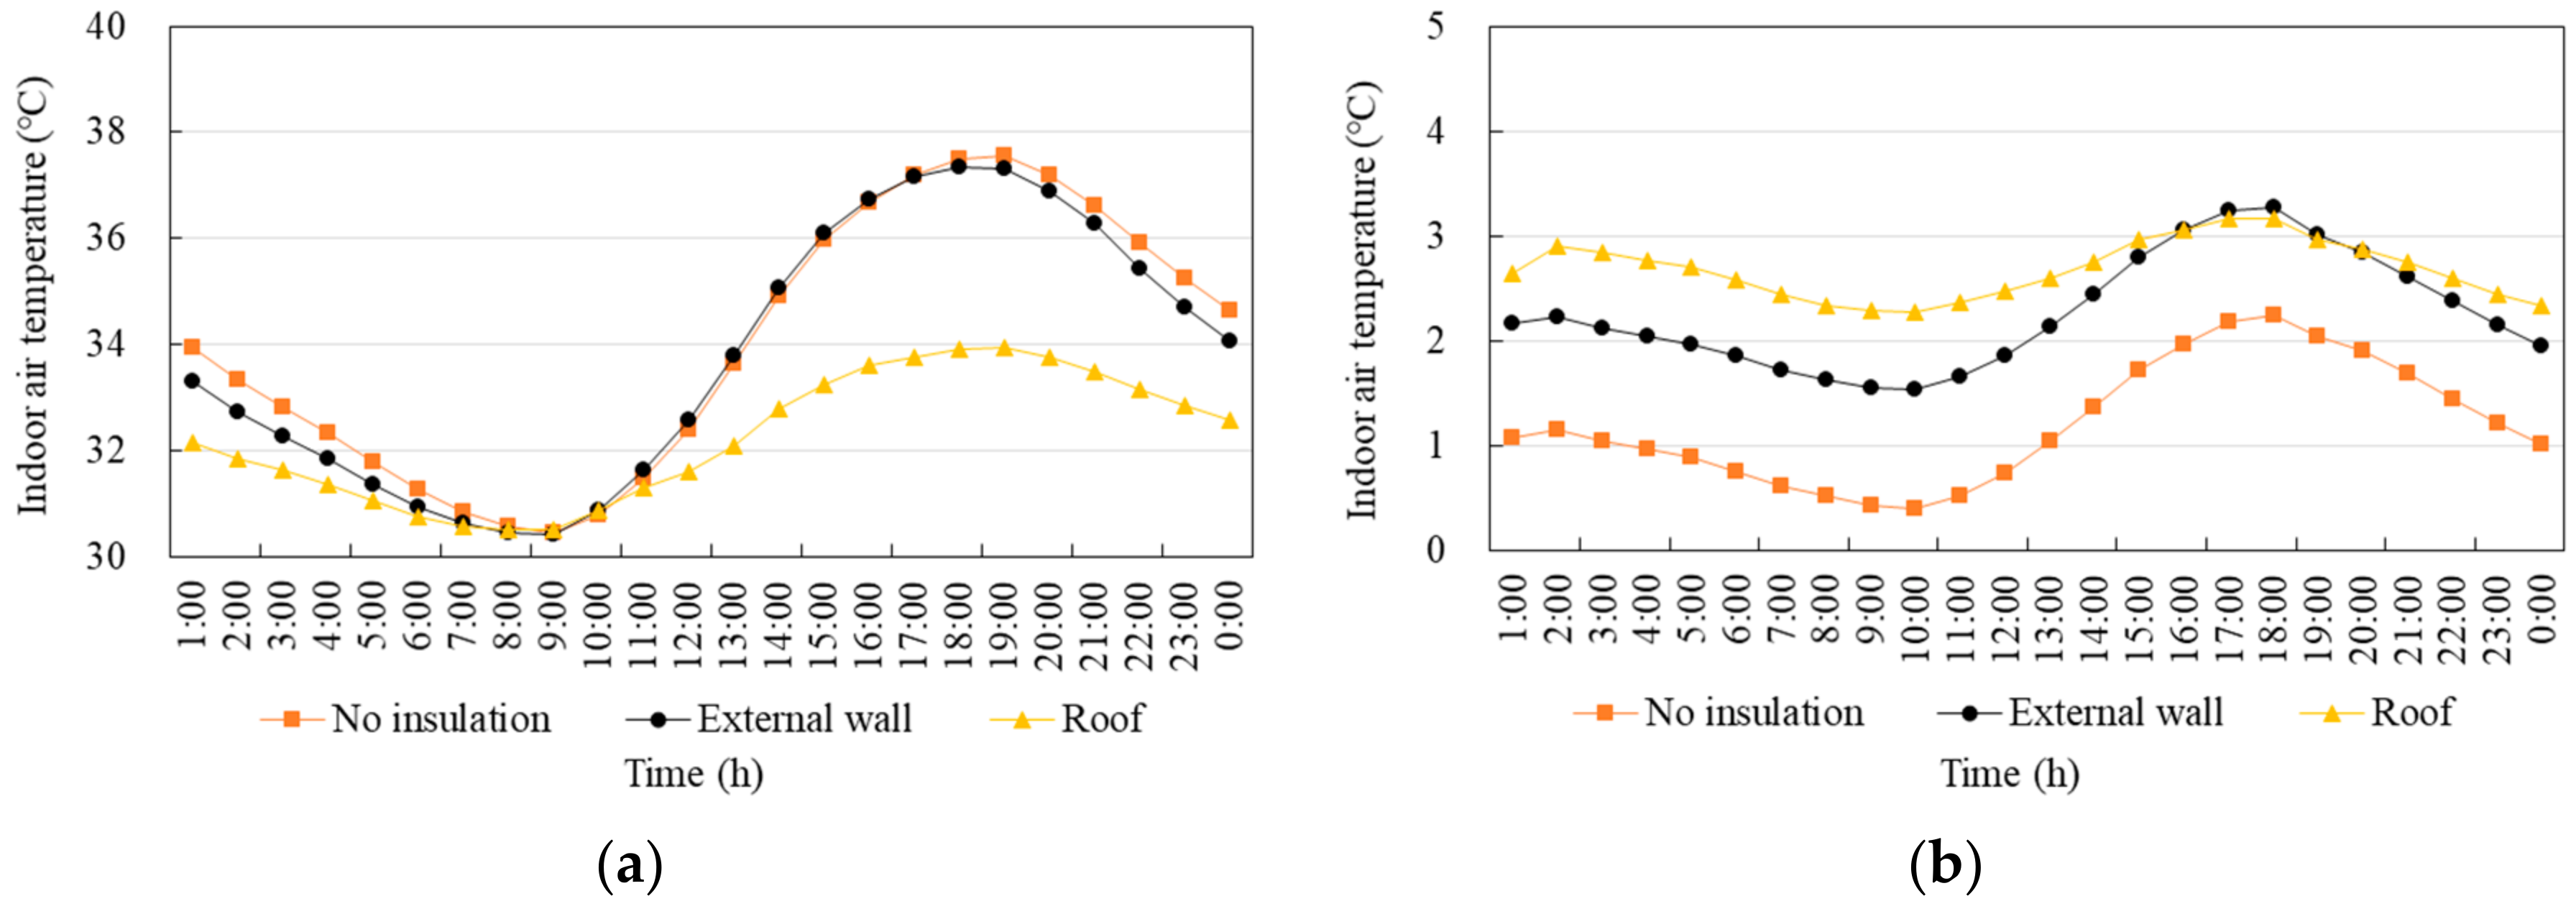
- External wall and roof
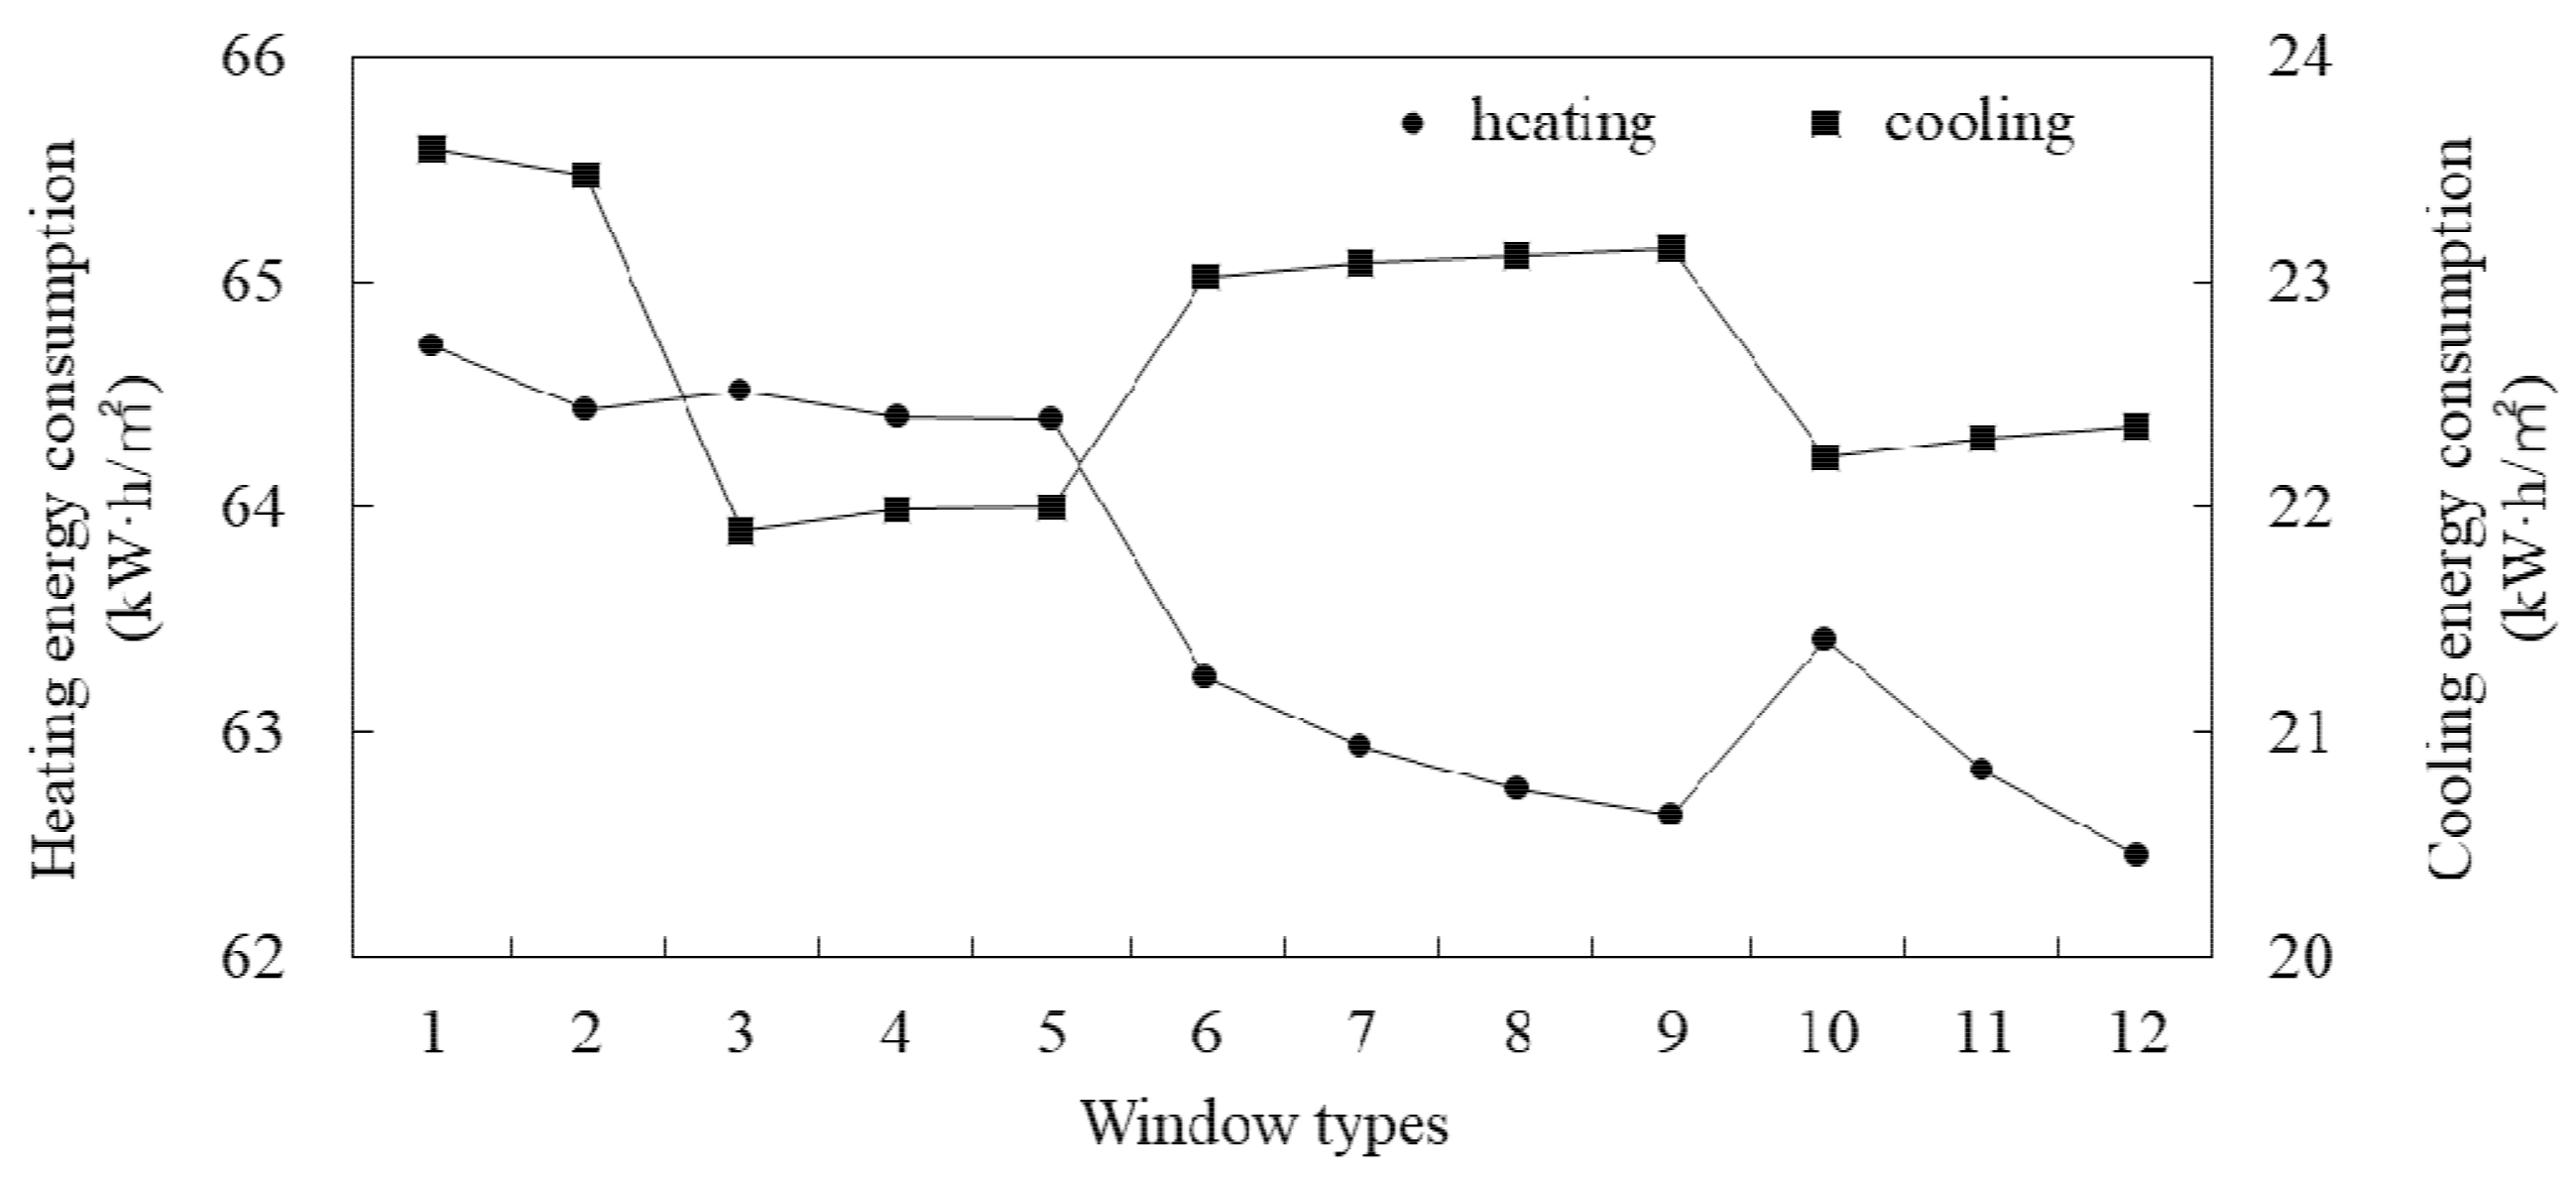
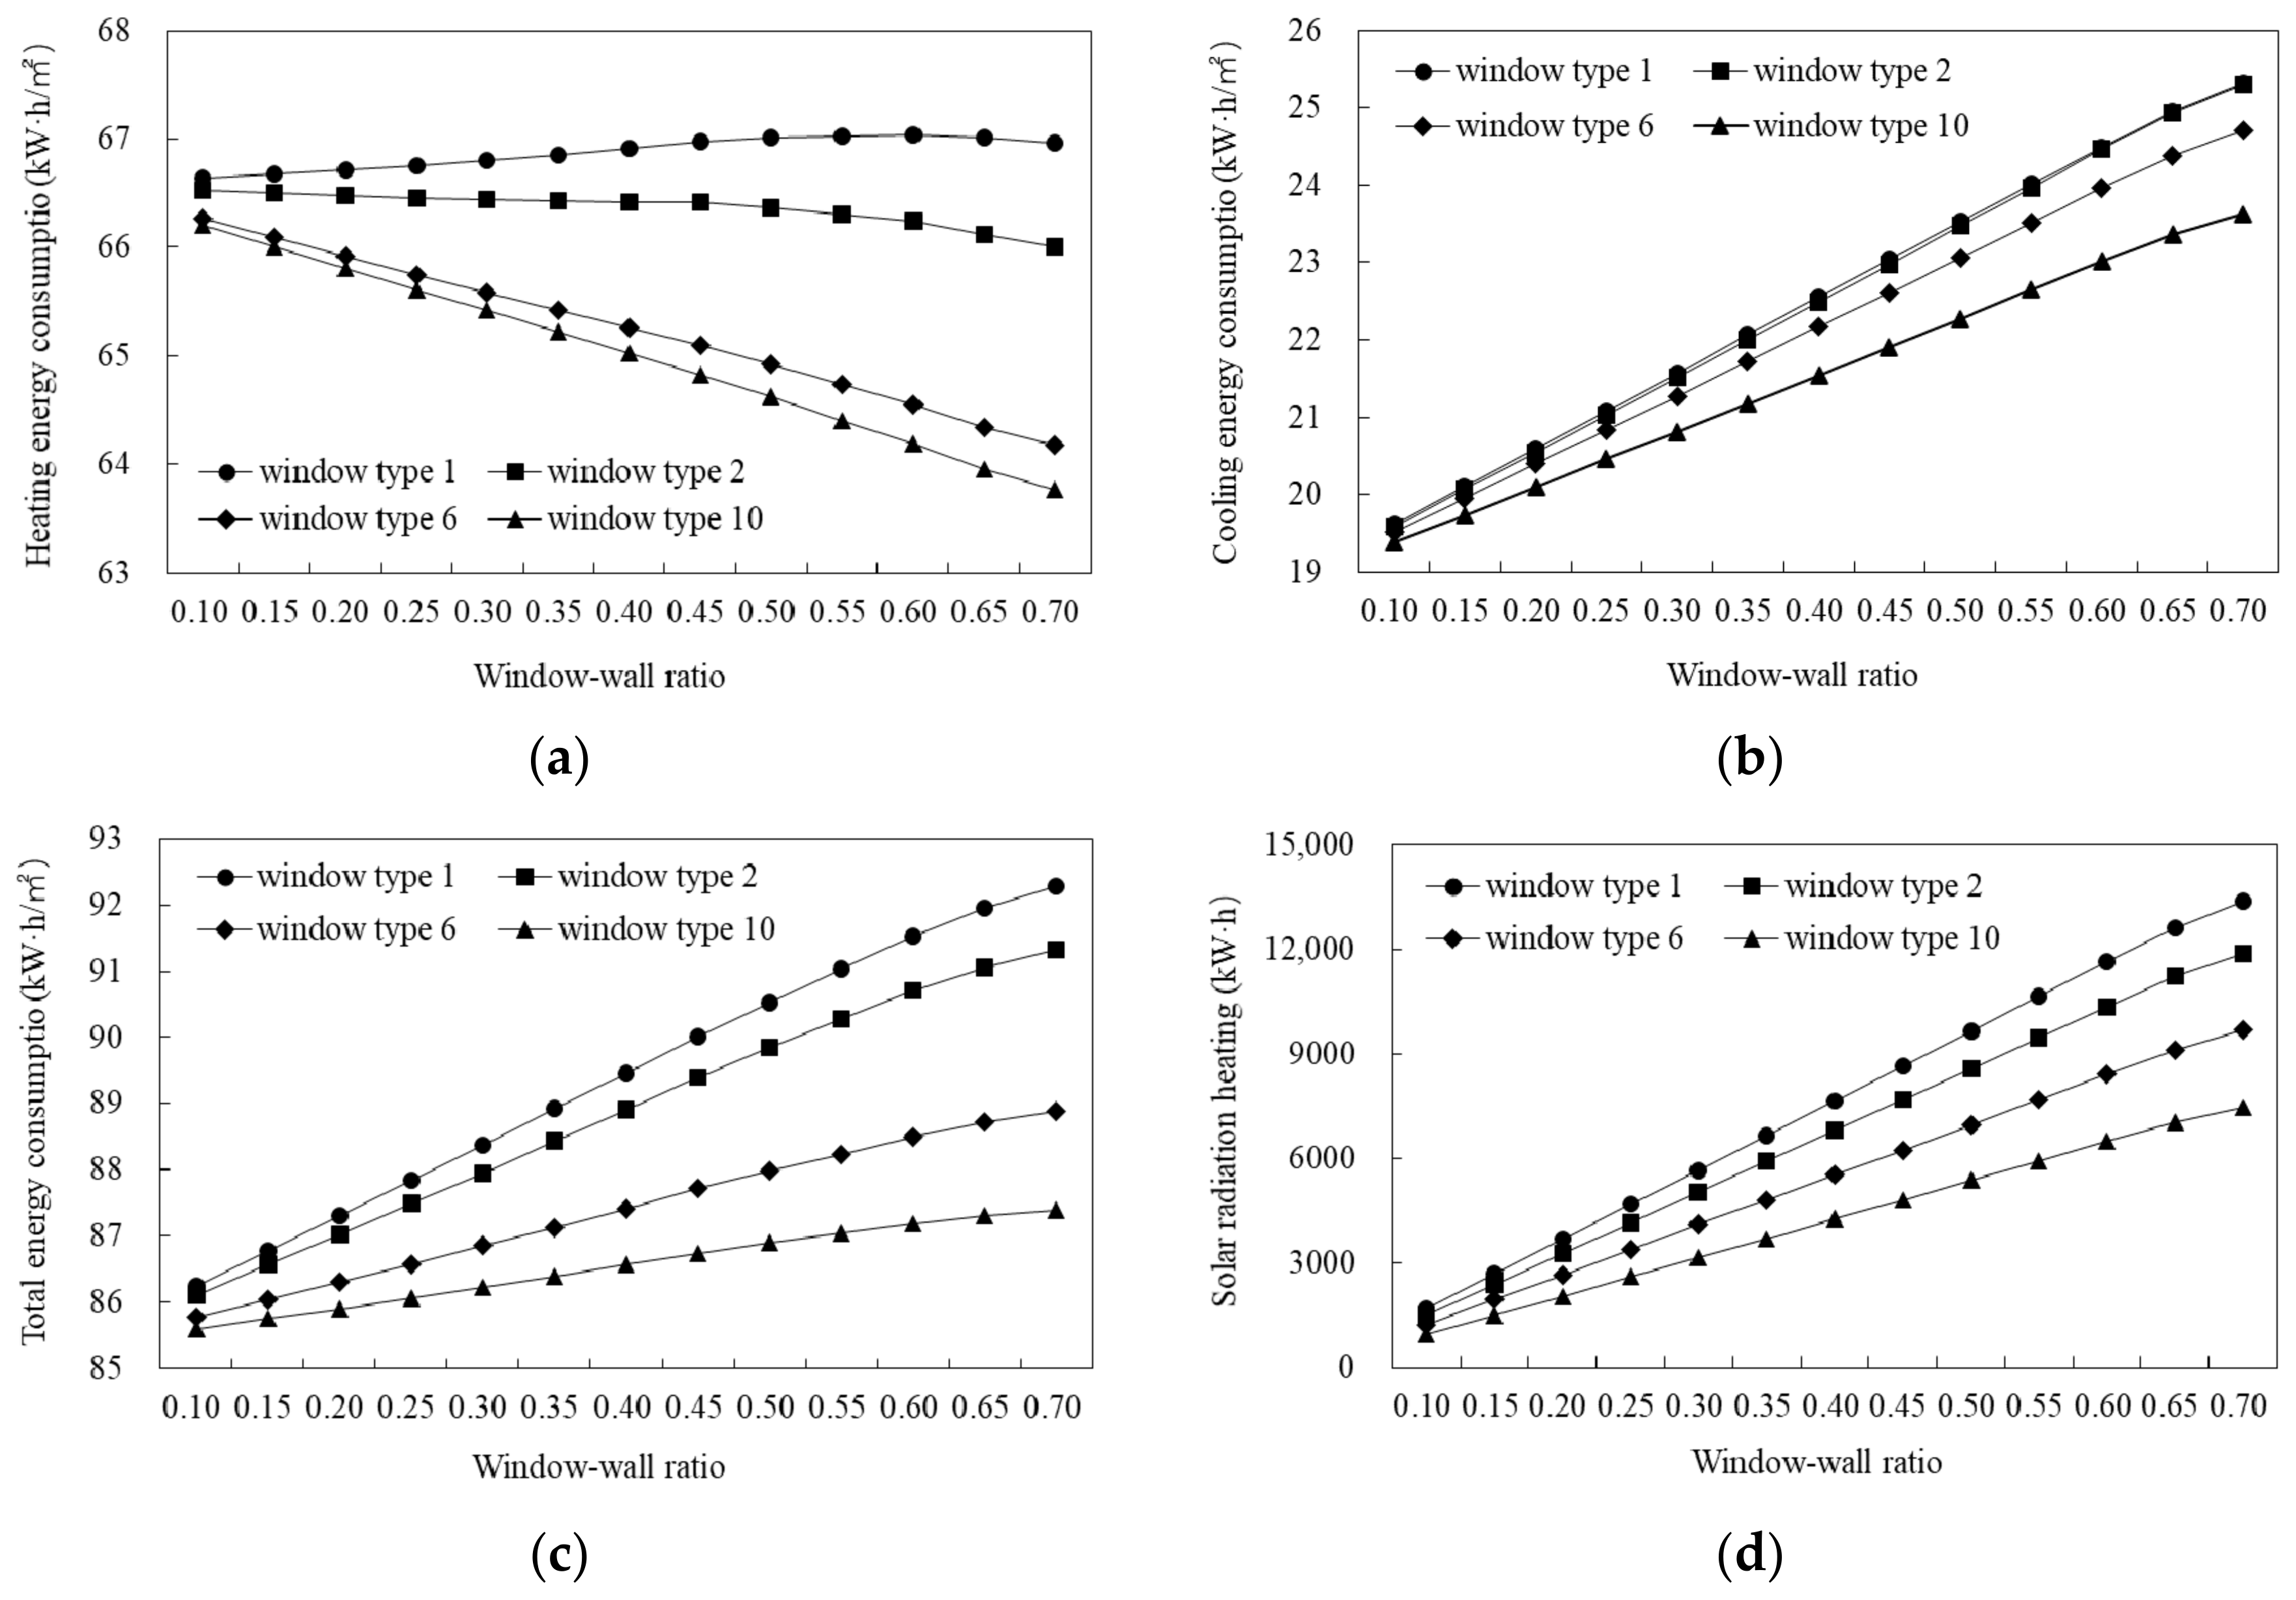
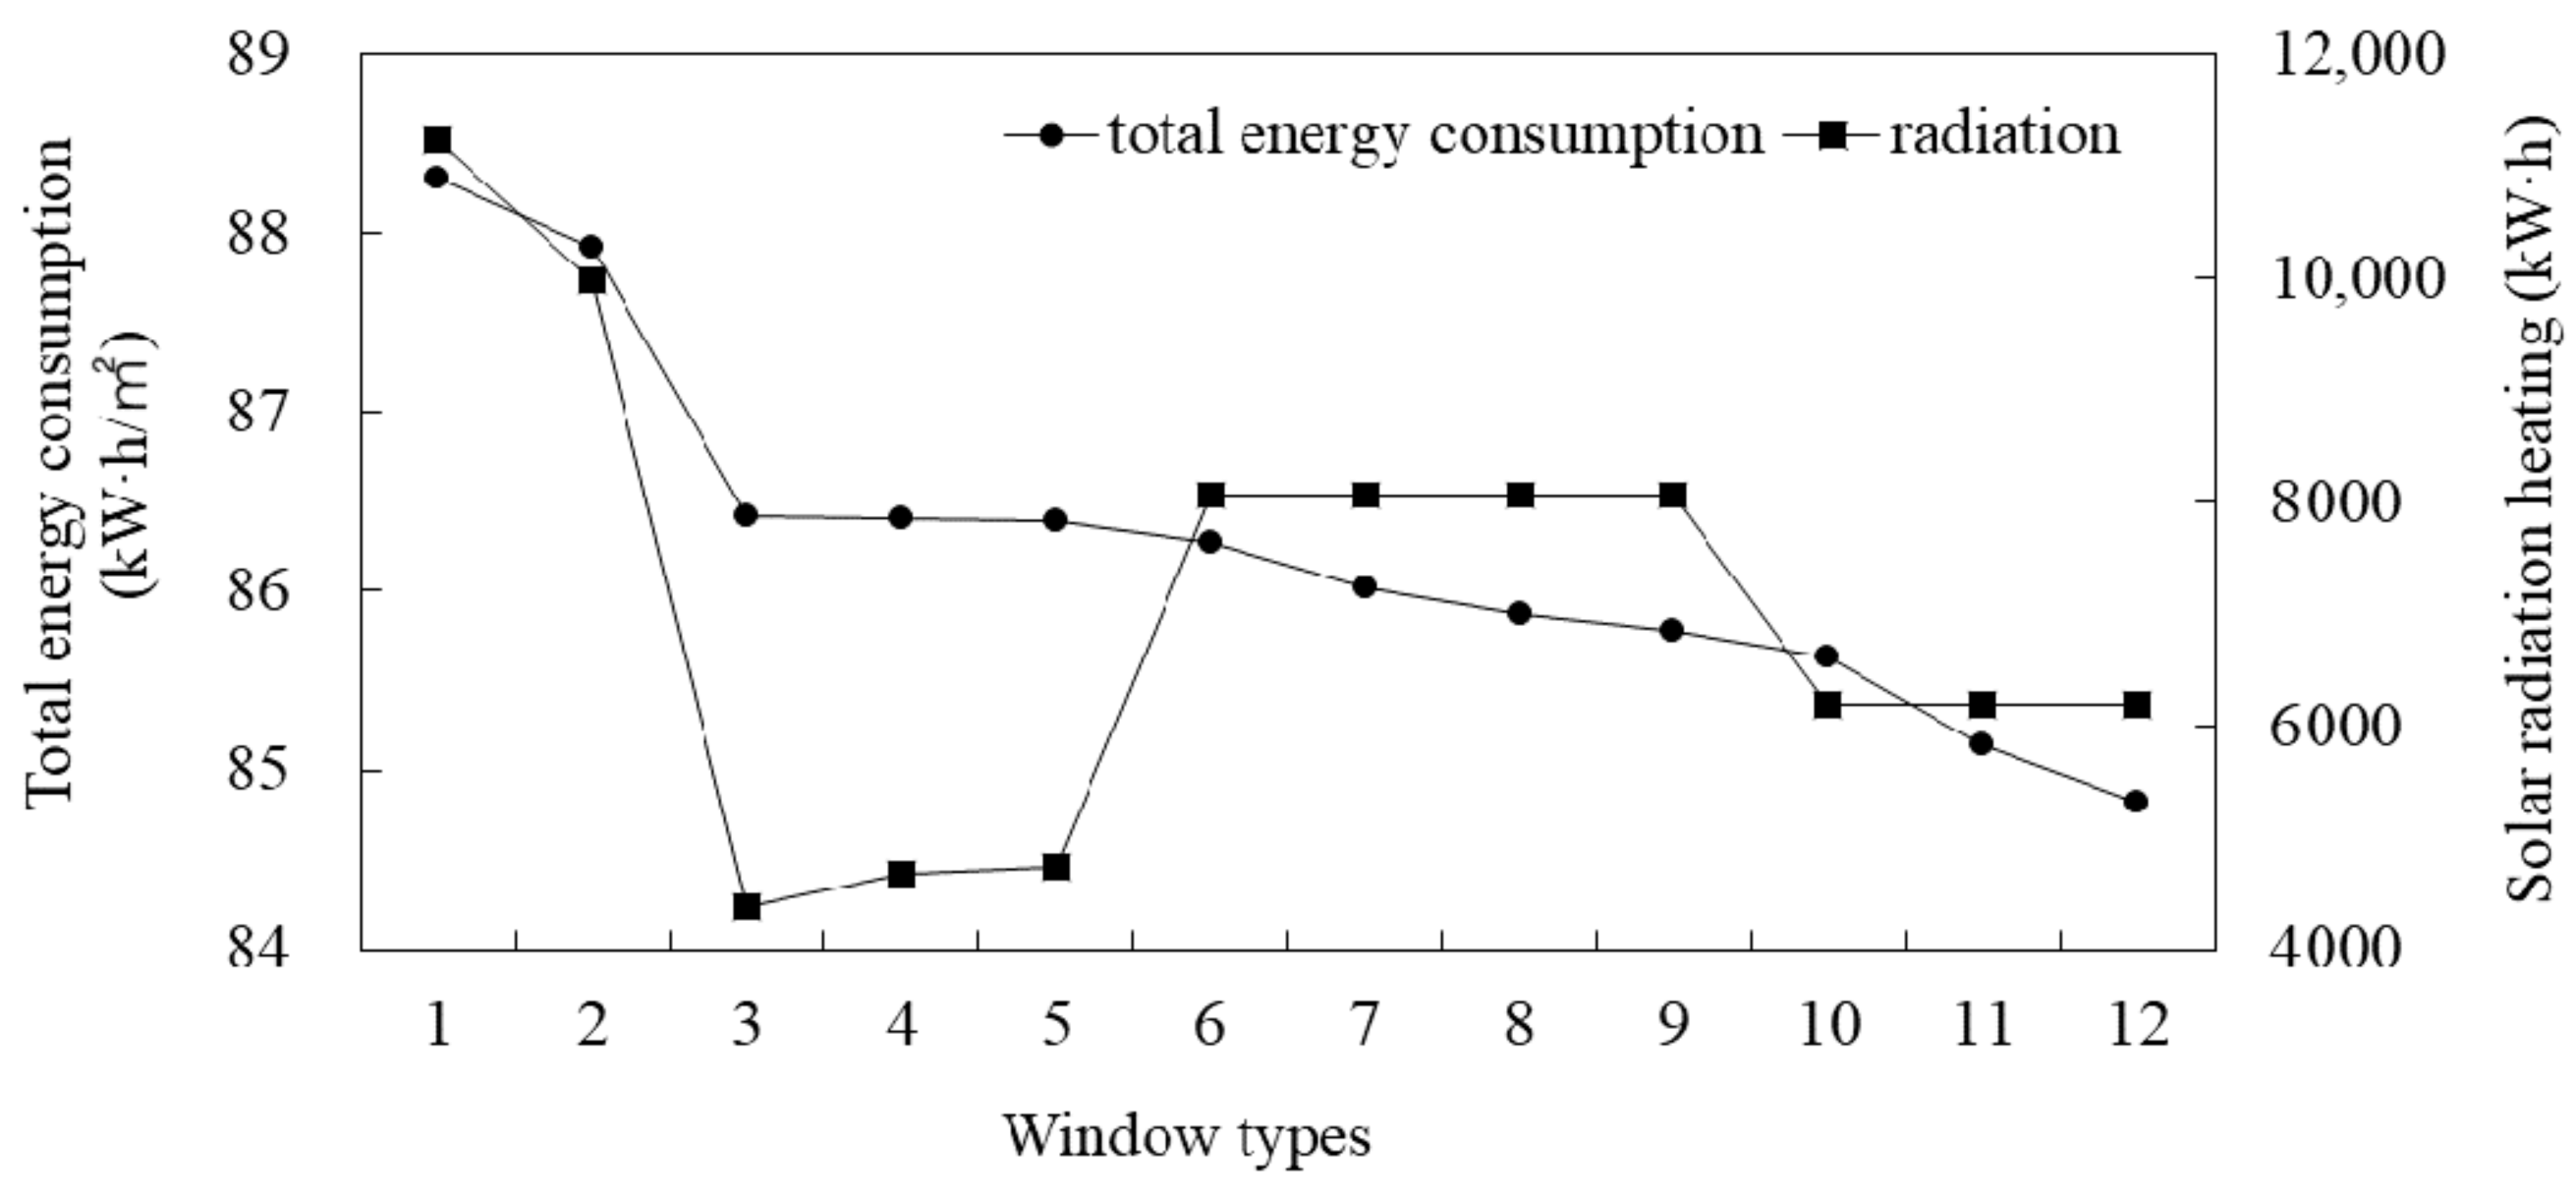
- External window
3.1.3. Building Interface Parameters
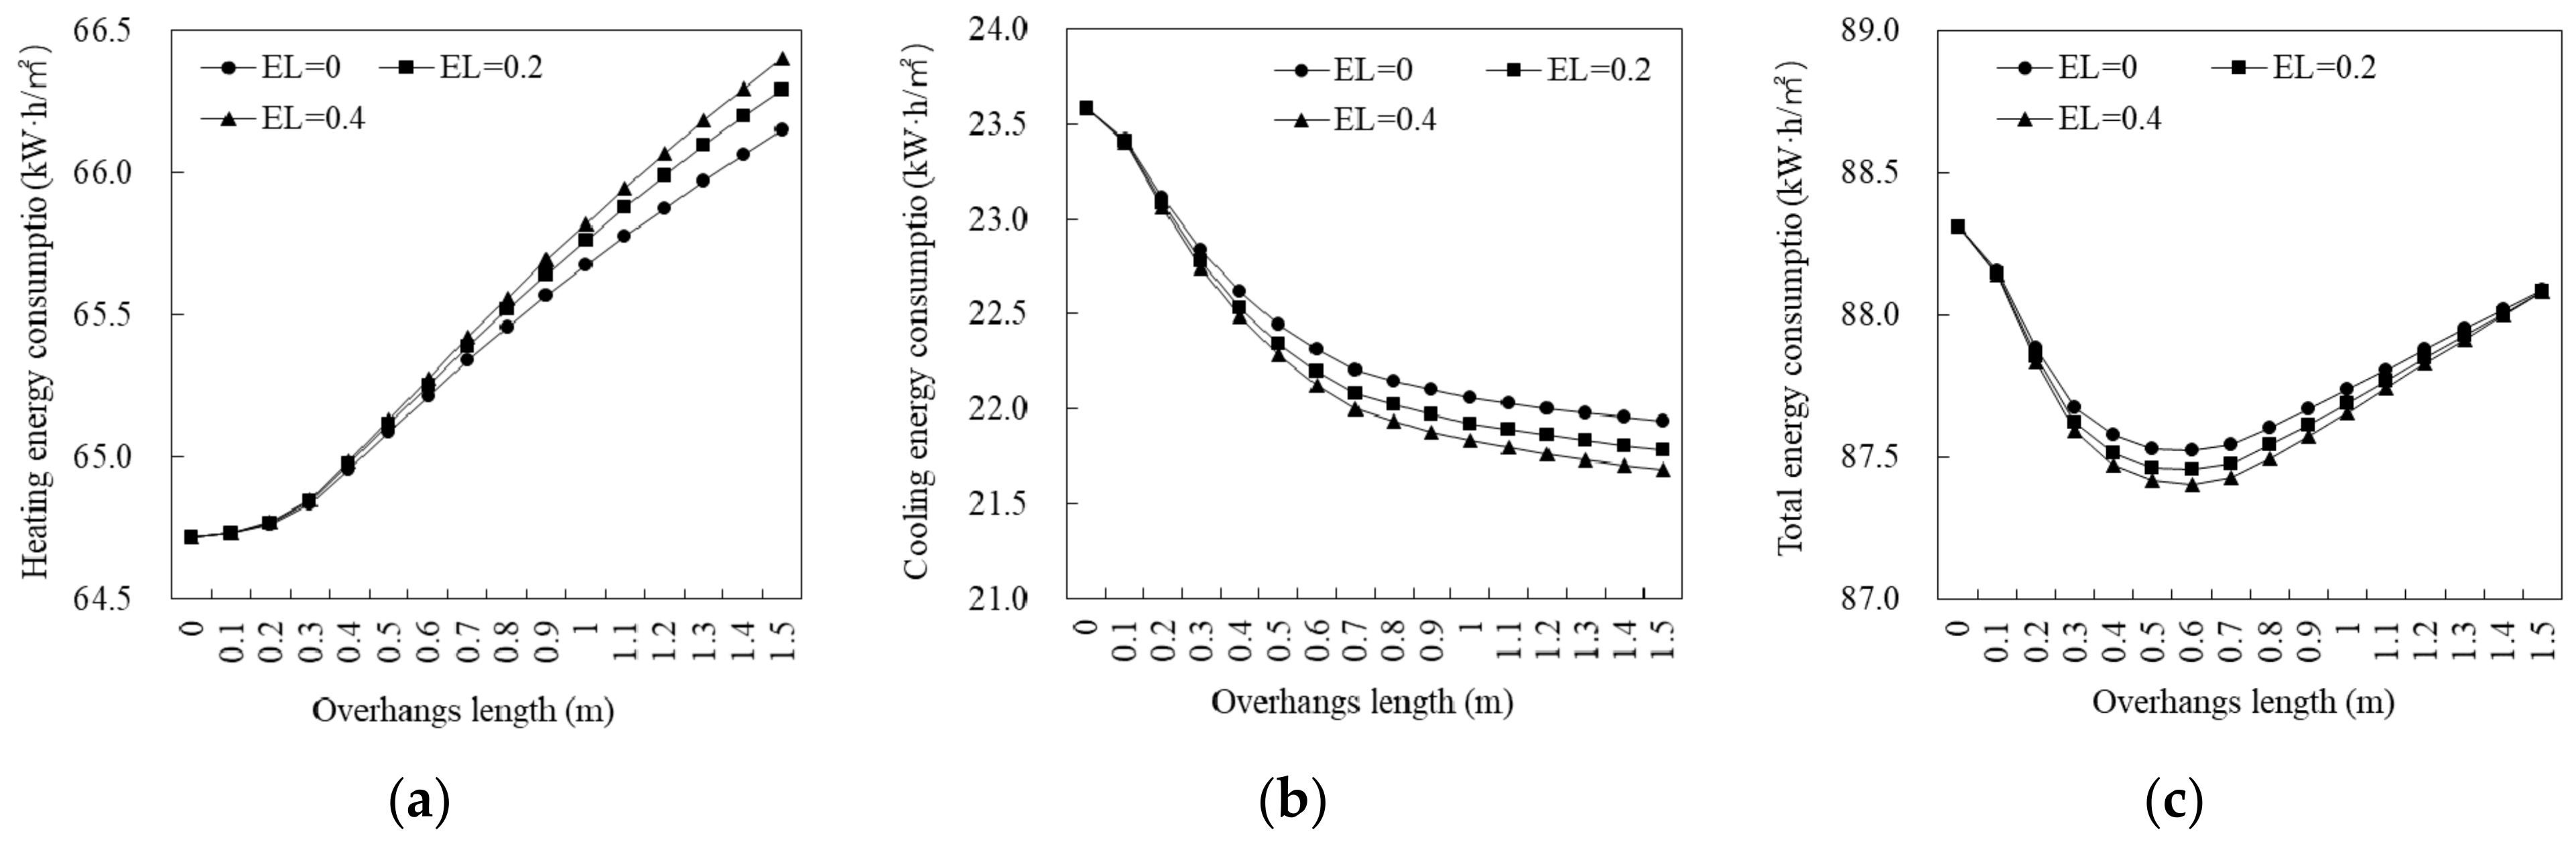
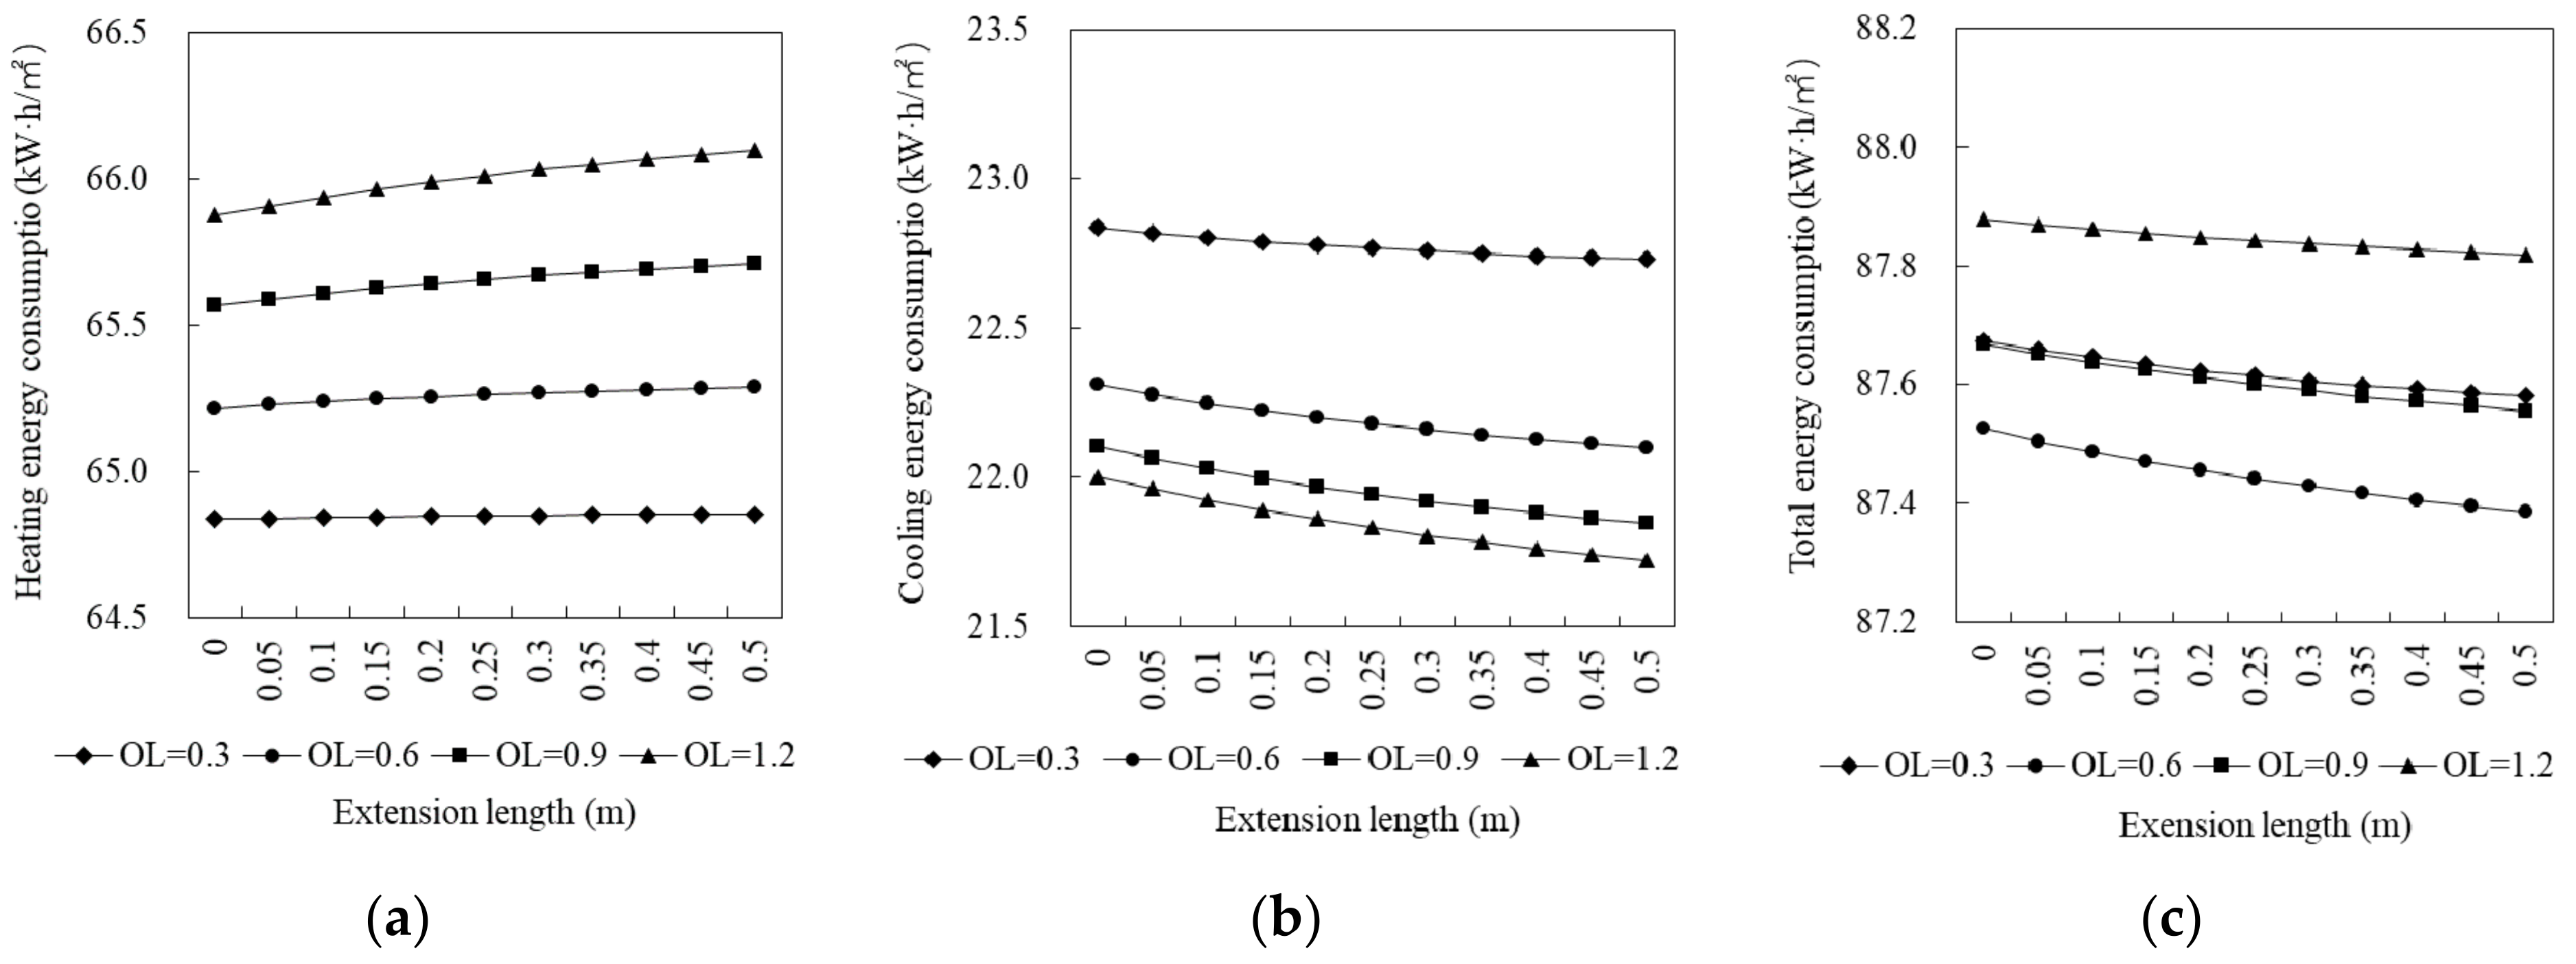
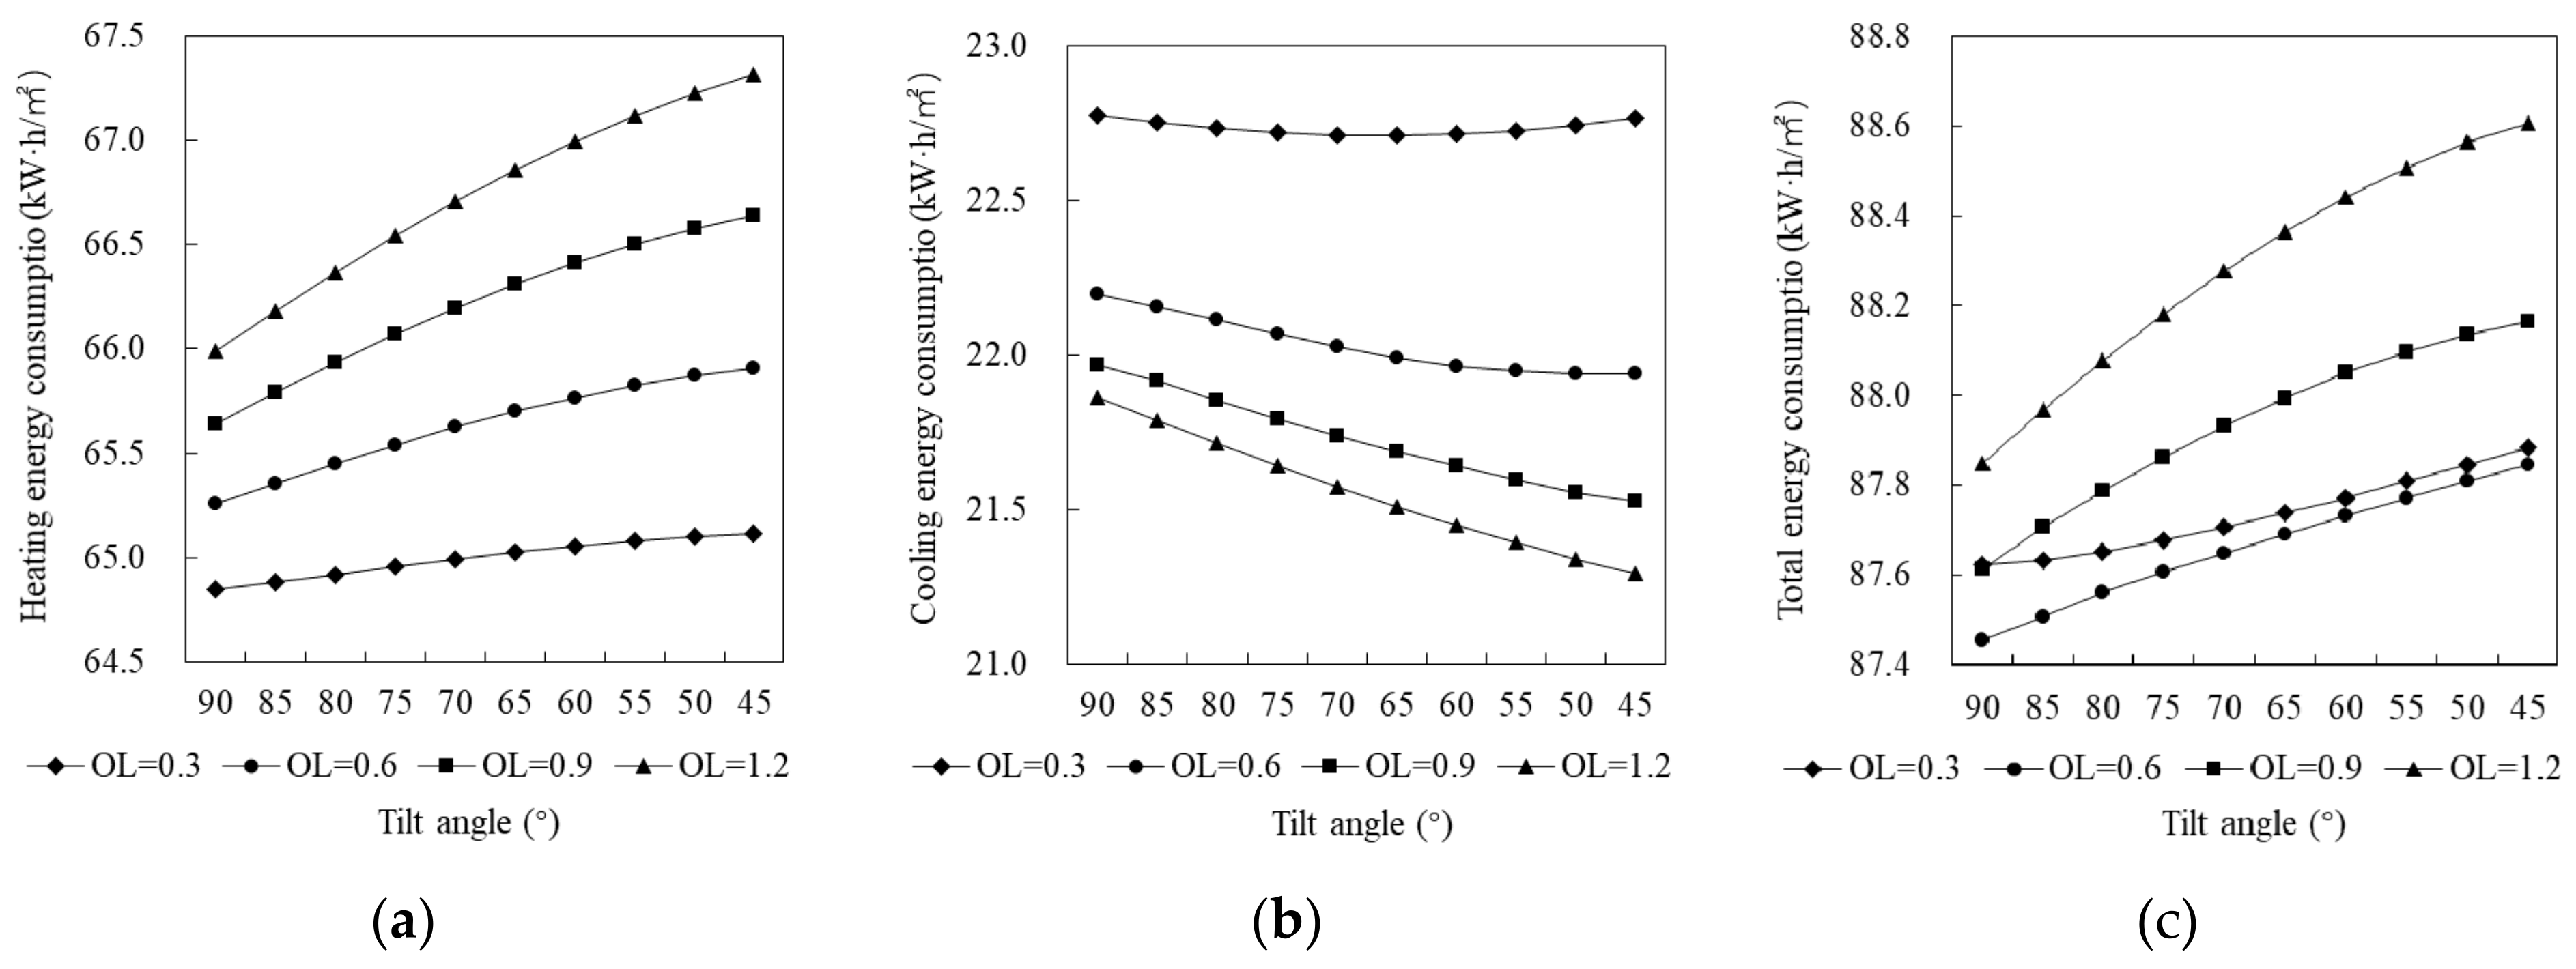
- External shading system
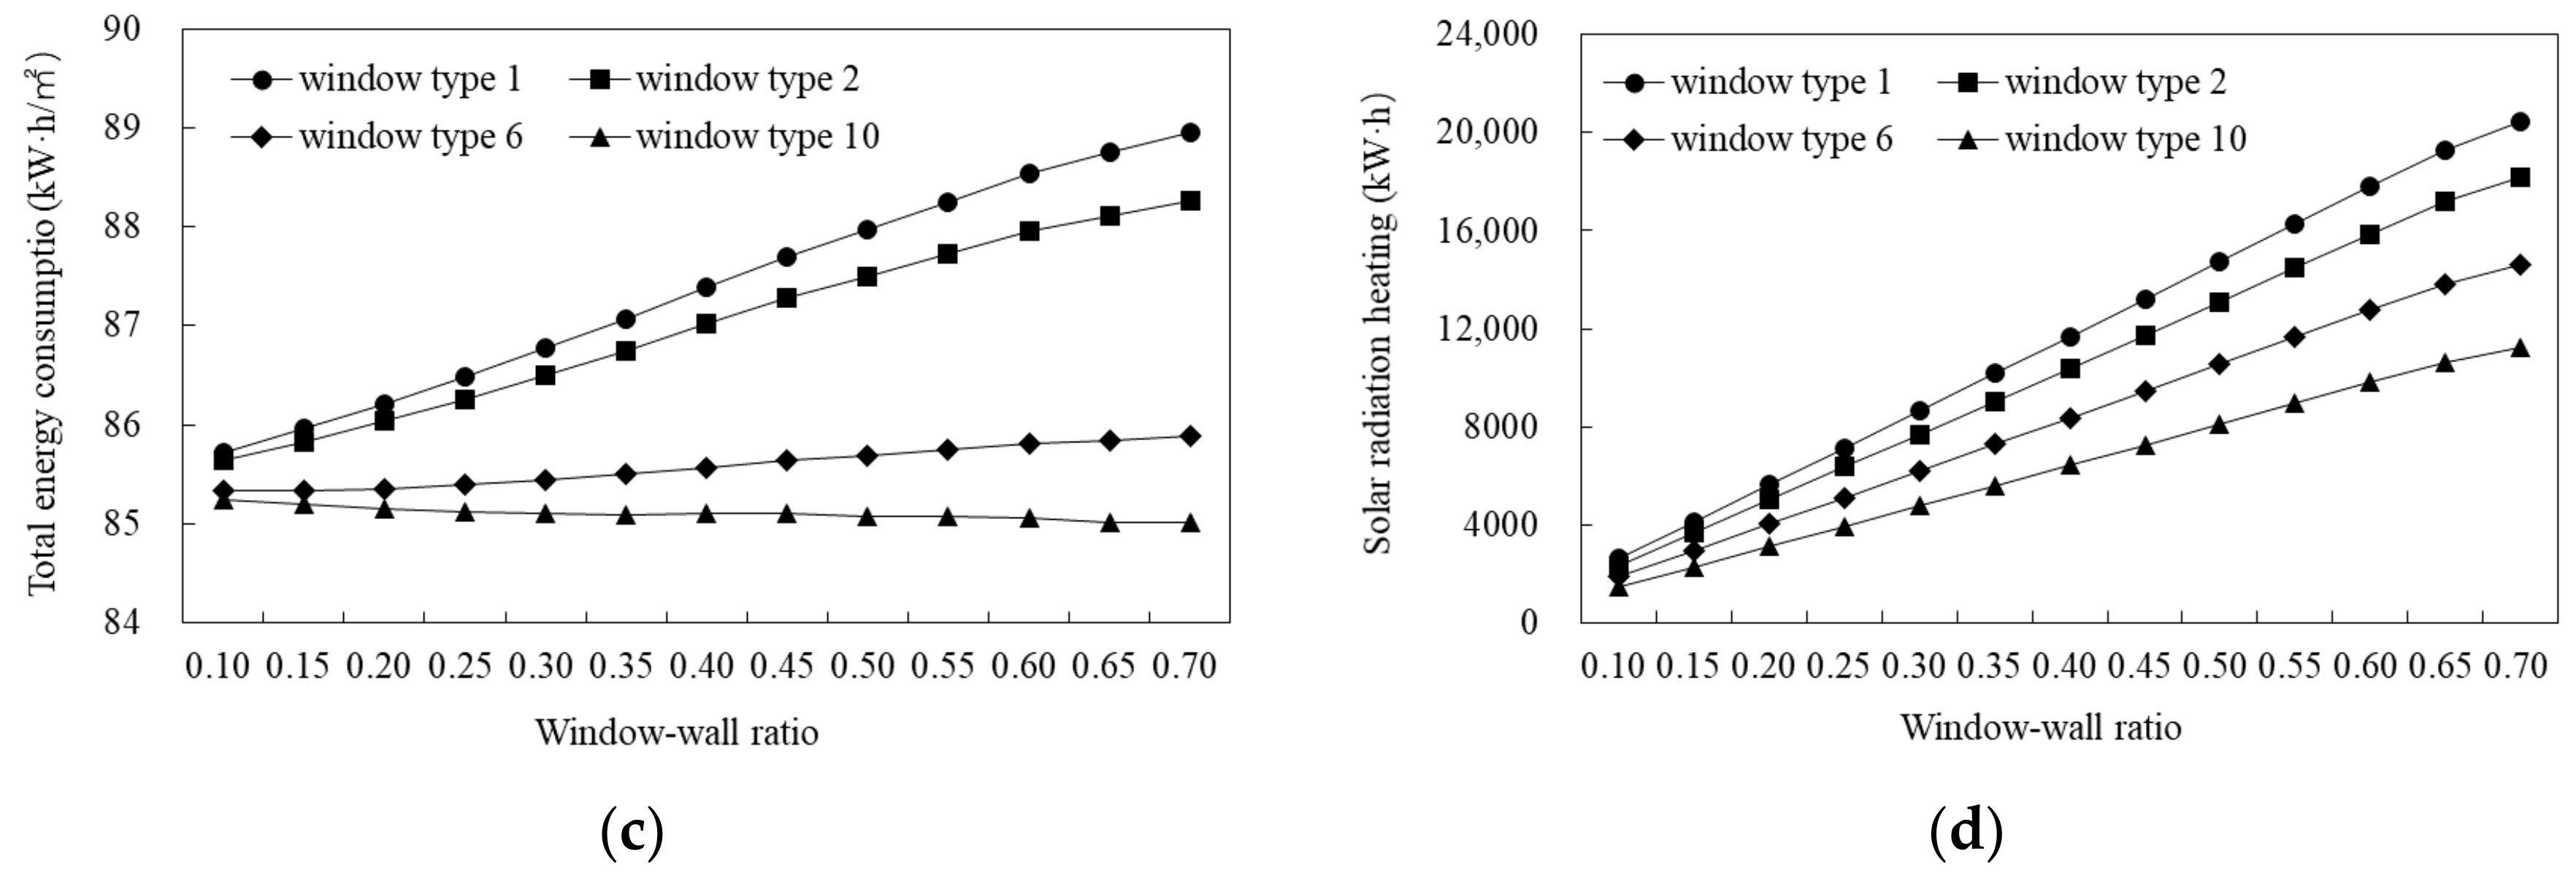
- Window–wall ratio
3.2. Multi-Parameters and Multi-Objective Optimization: Parameters Combination Based on Energy Consumption and Initial Investment Cost
3.2.1. Objective Functions
- Total energy consumption
- Initial investment cost
3.2.2. Design Variables
3.2.3. Analysis of Pareto Solutions
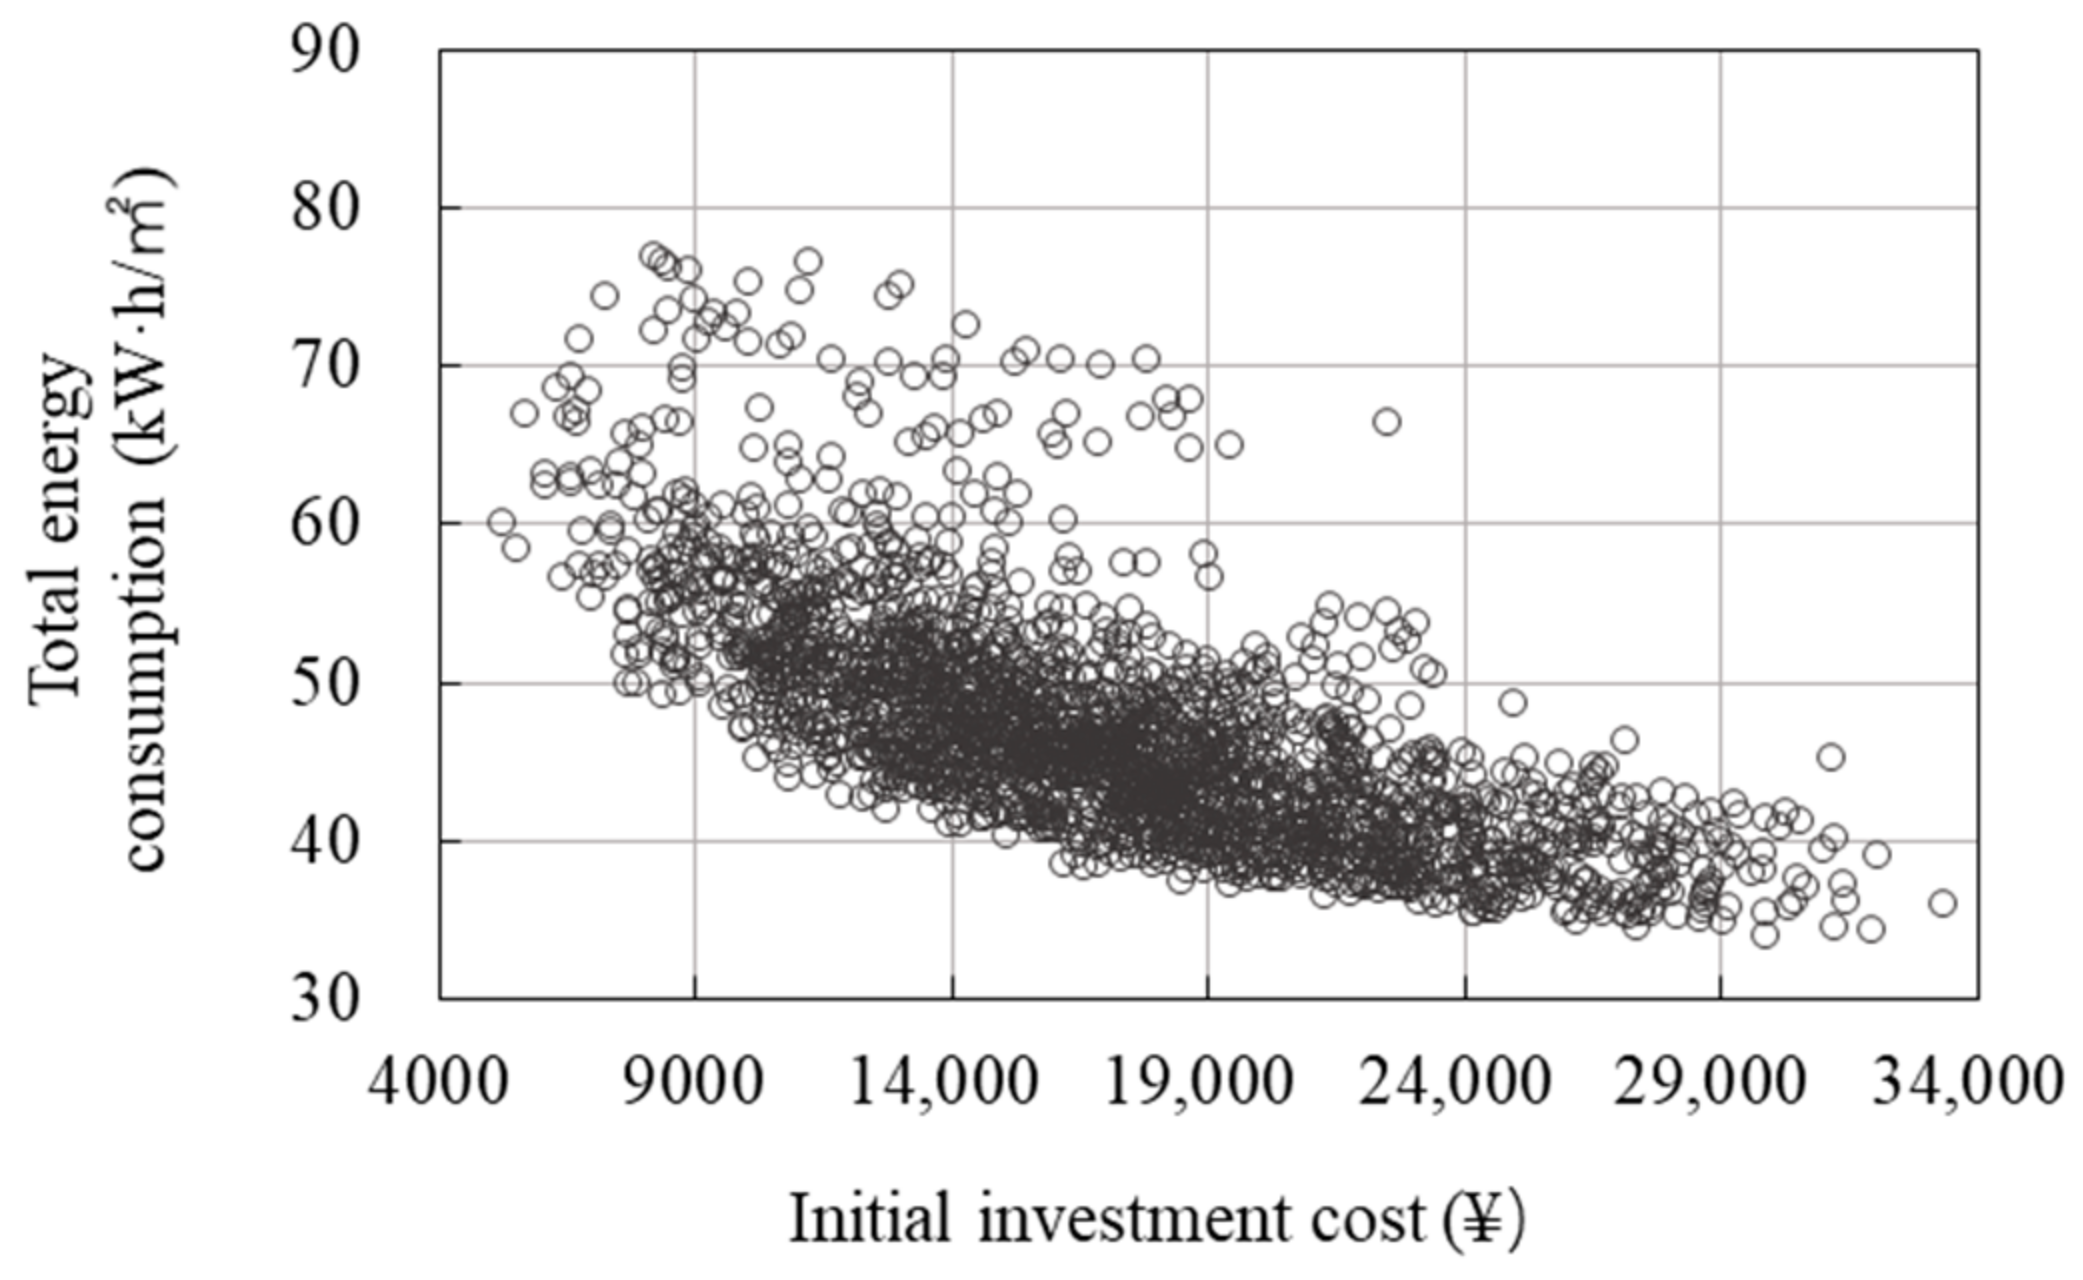
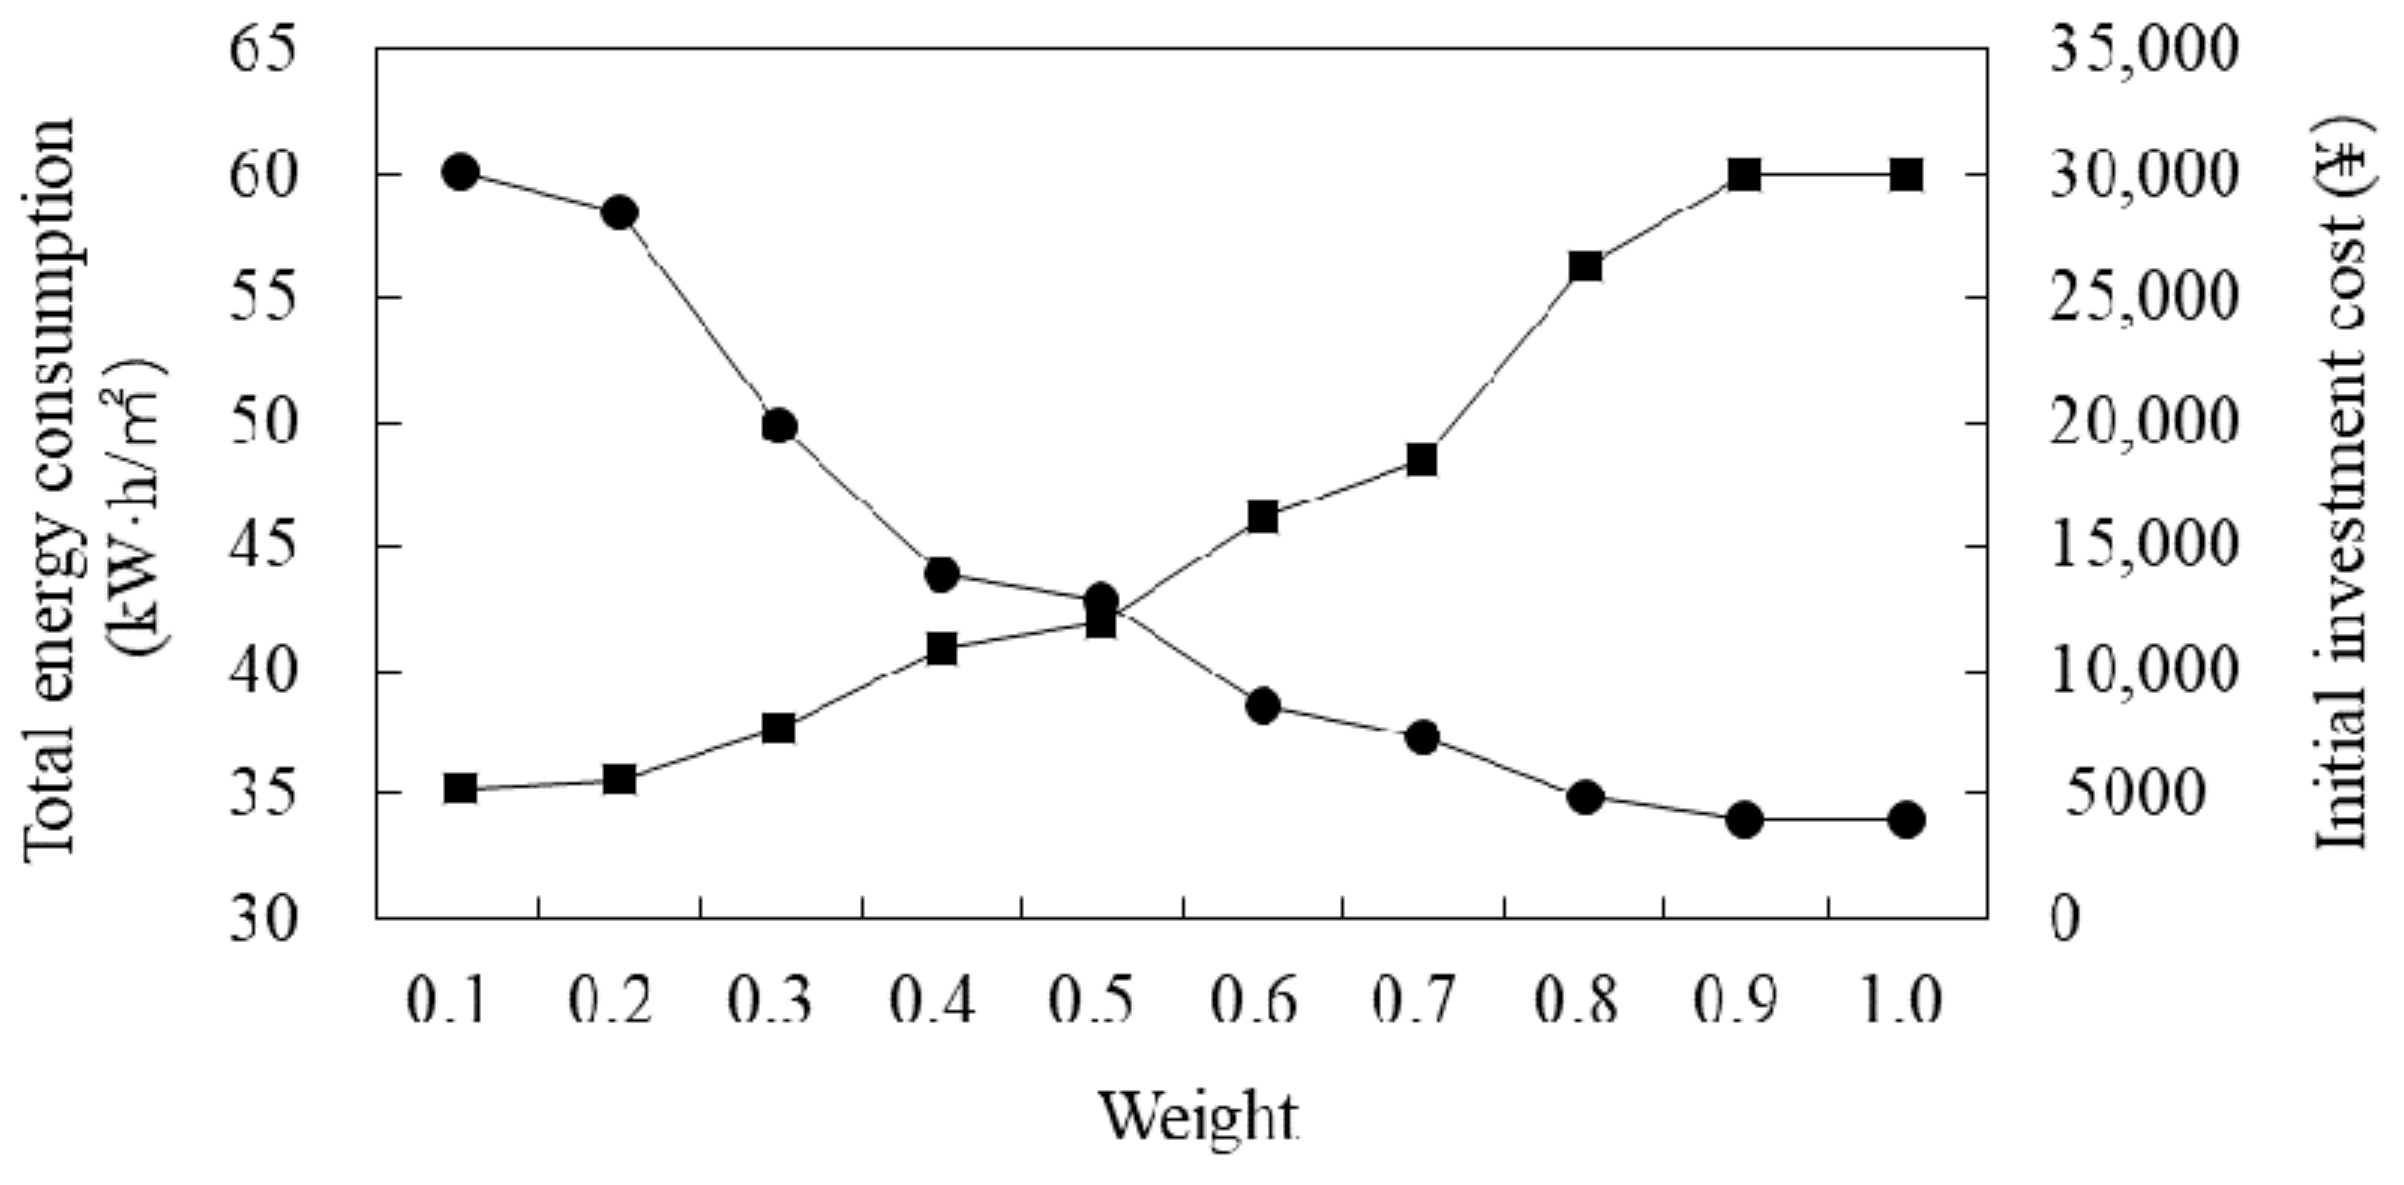
- Correlation and value distribution of multi-objectives
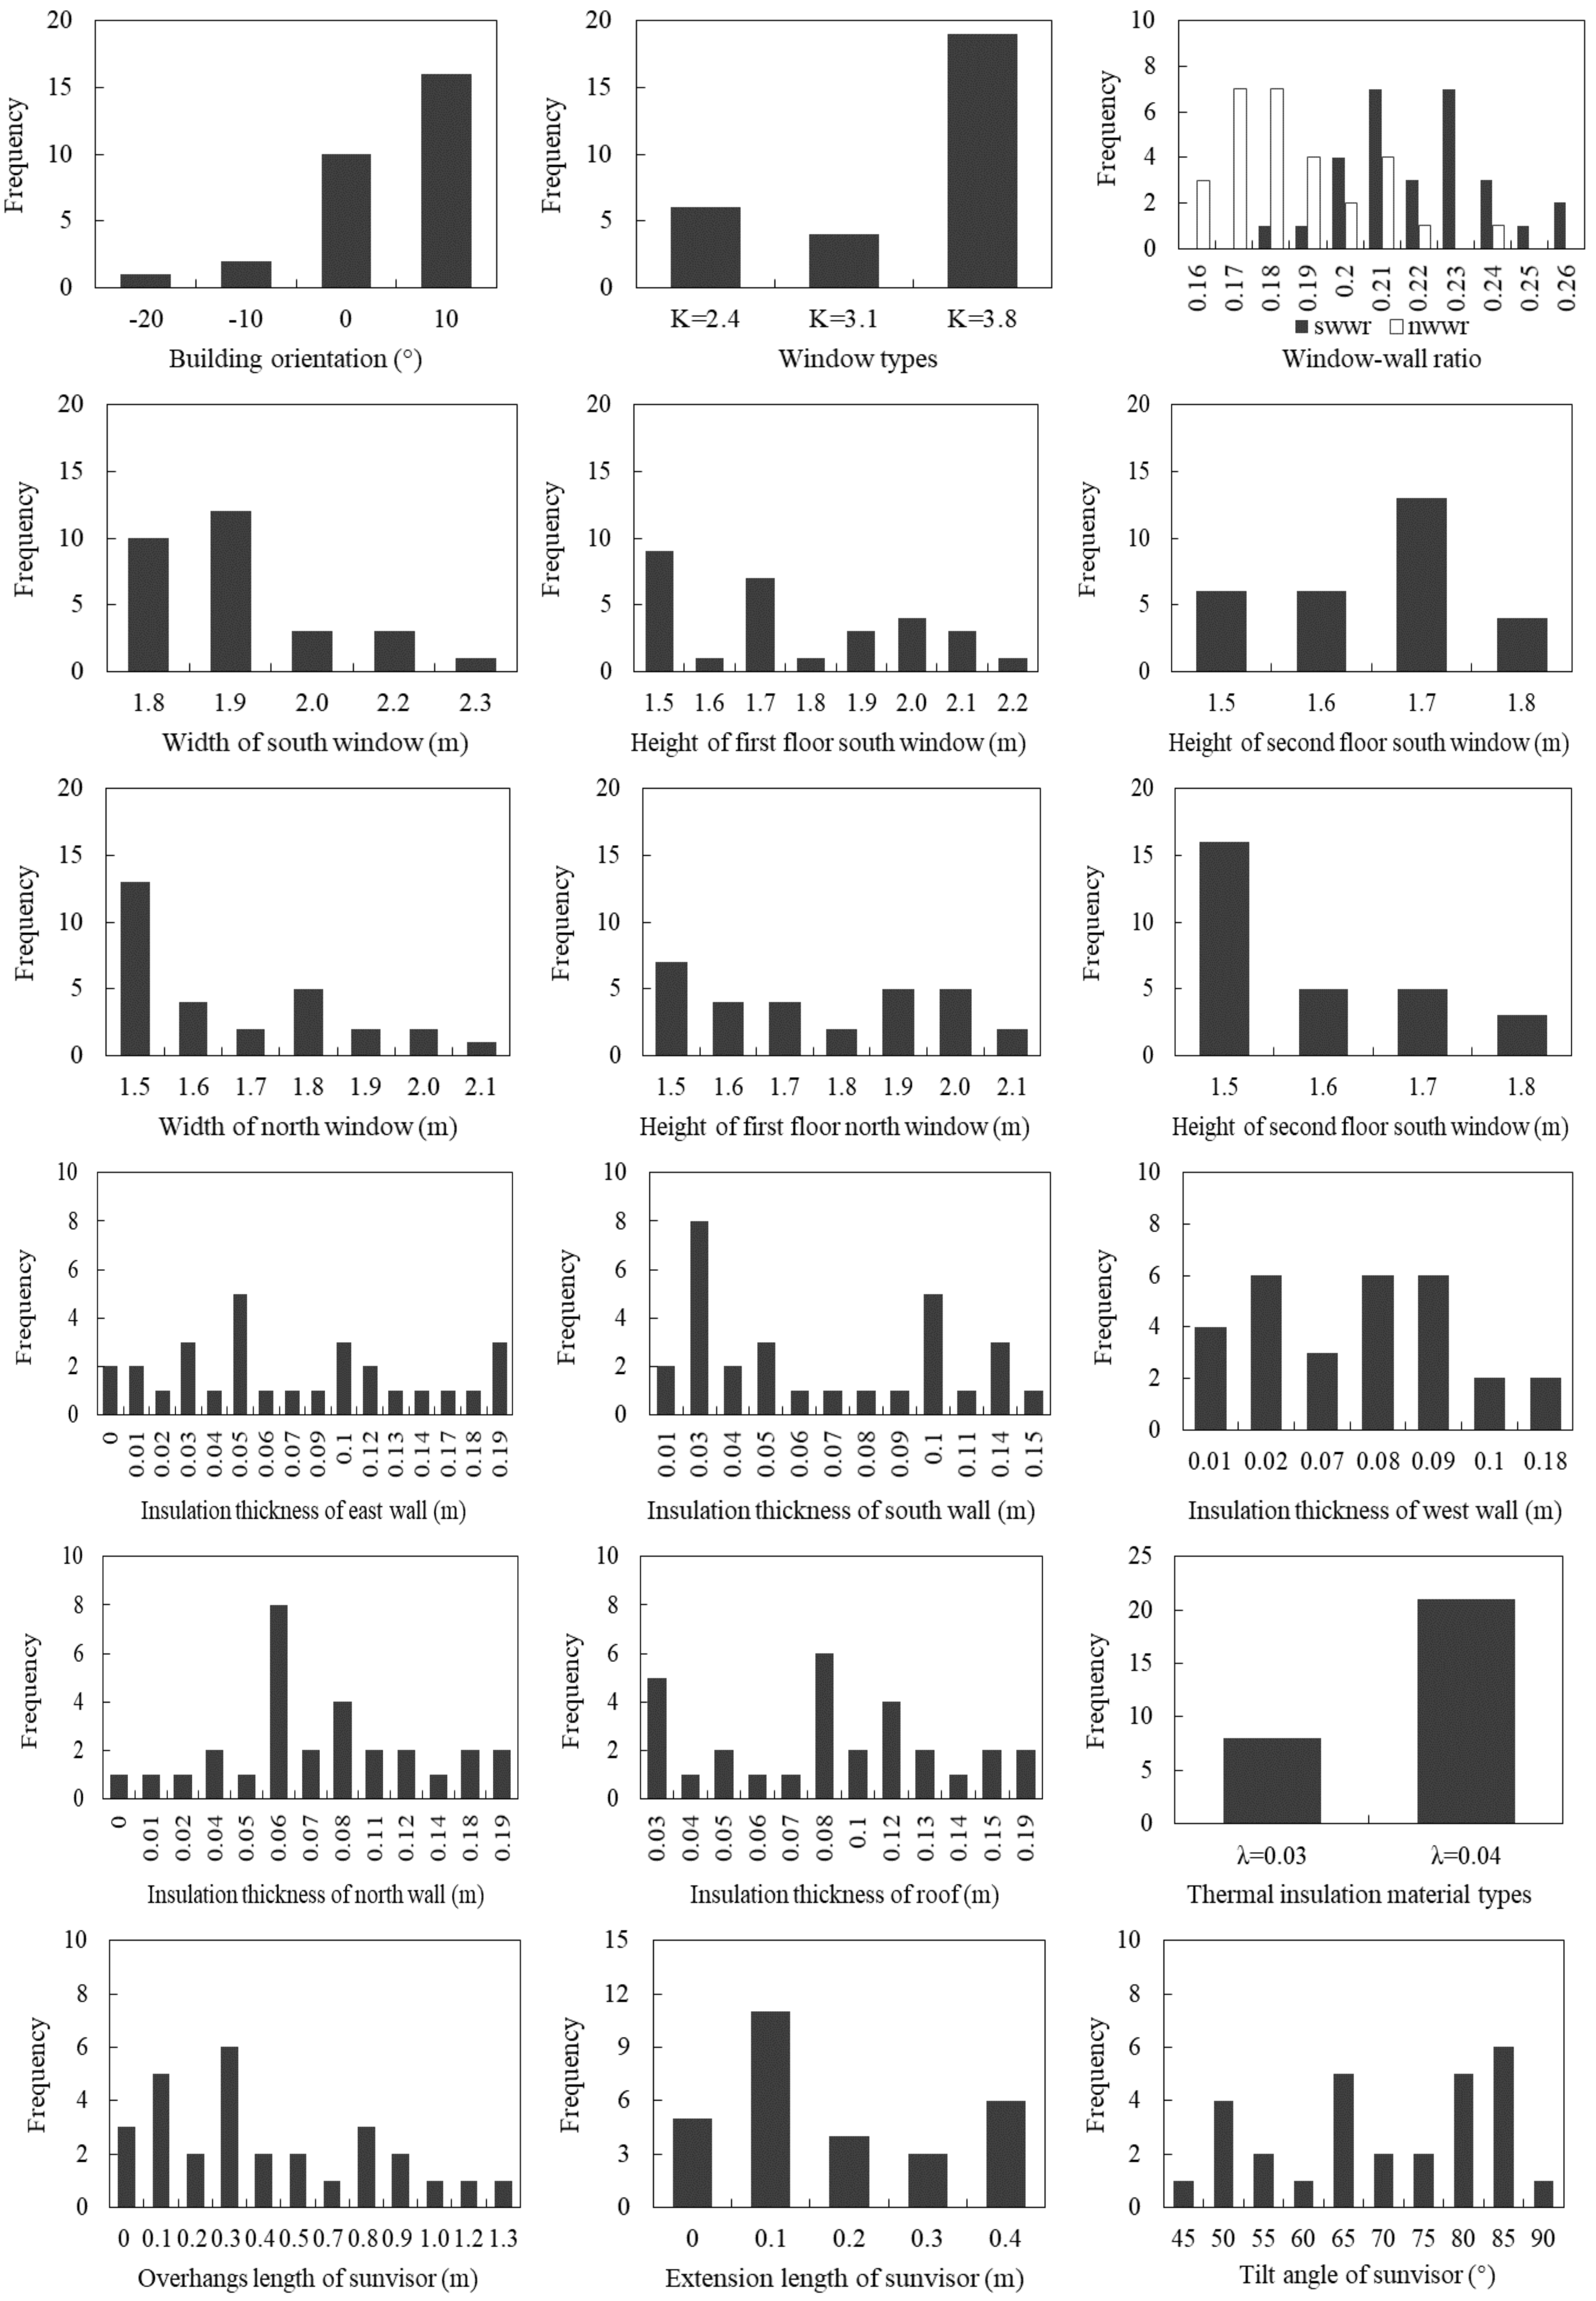
- Value distribution of design variables
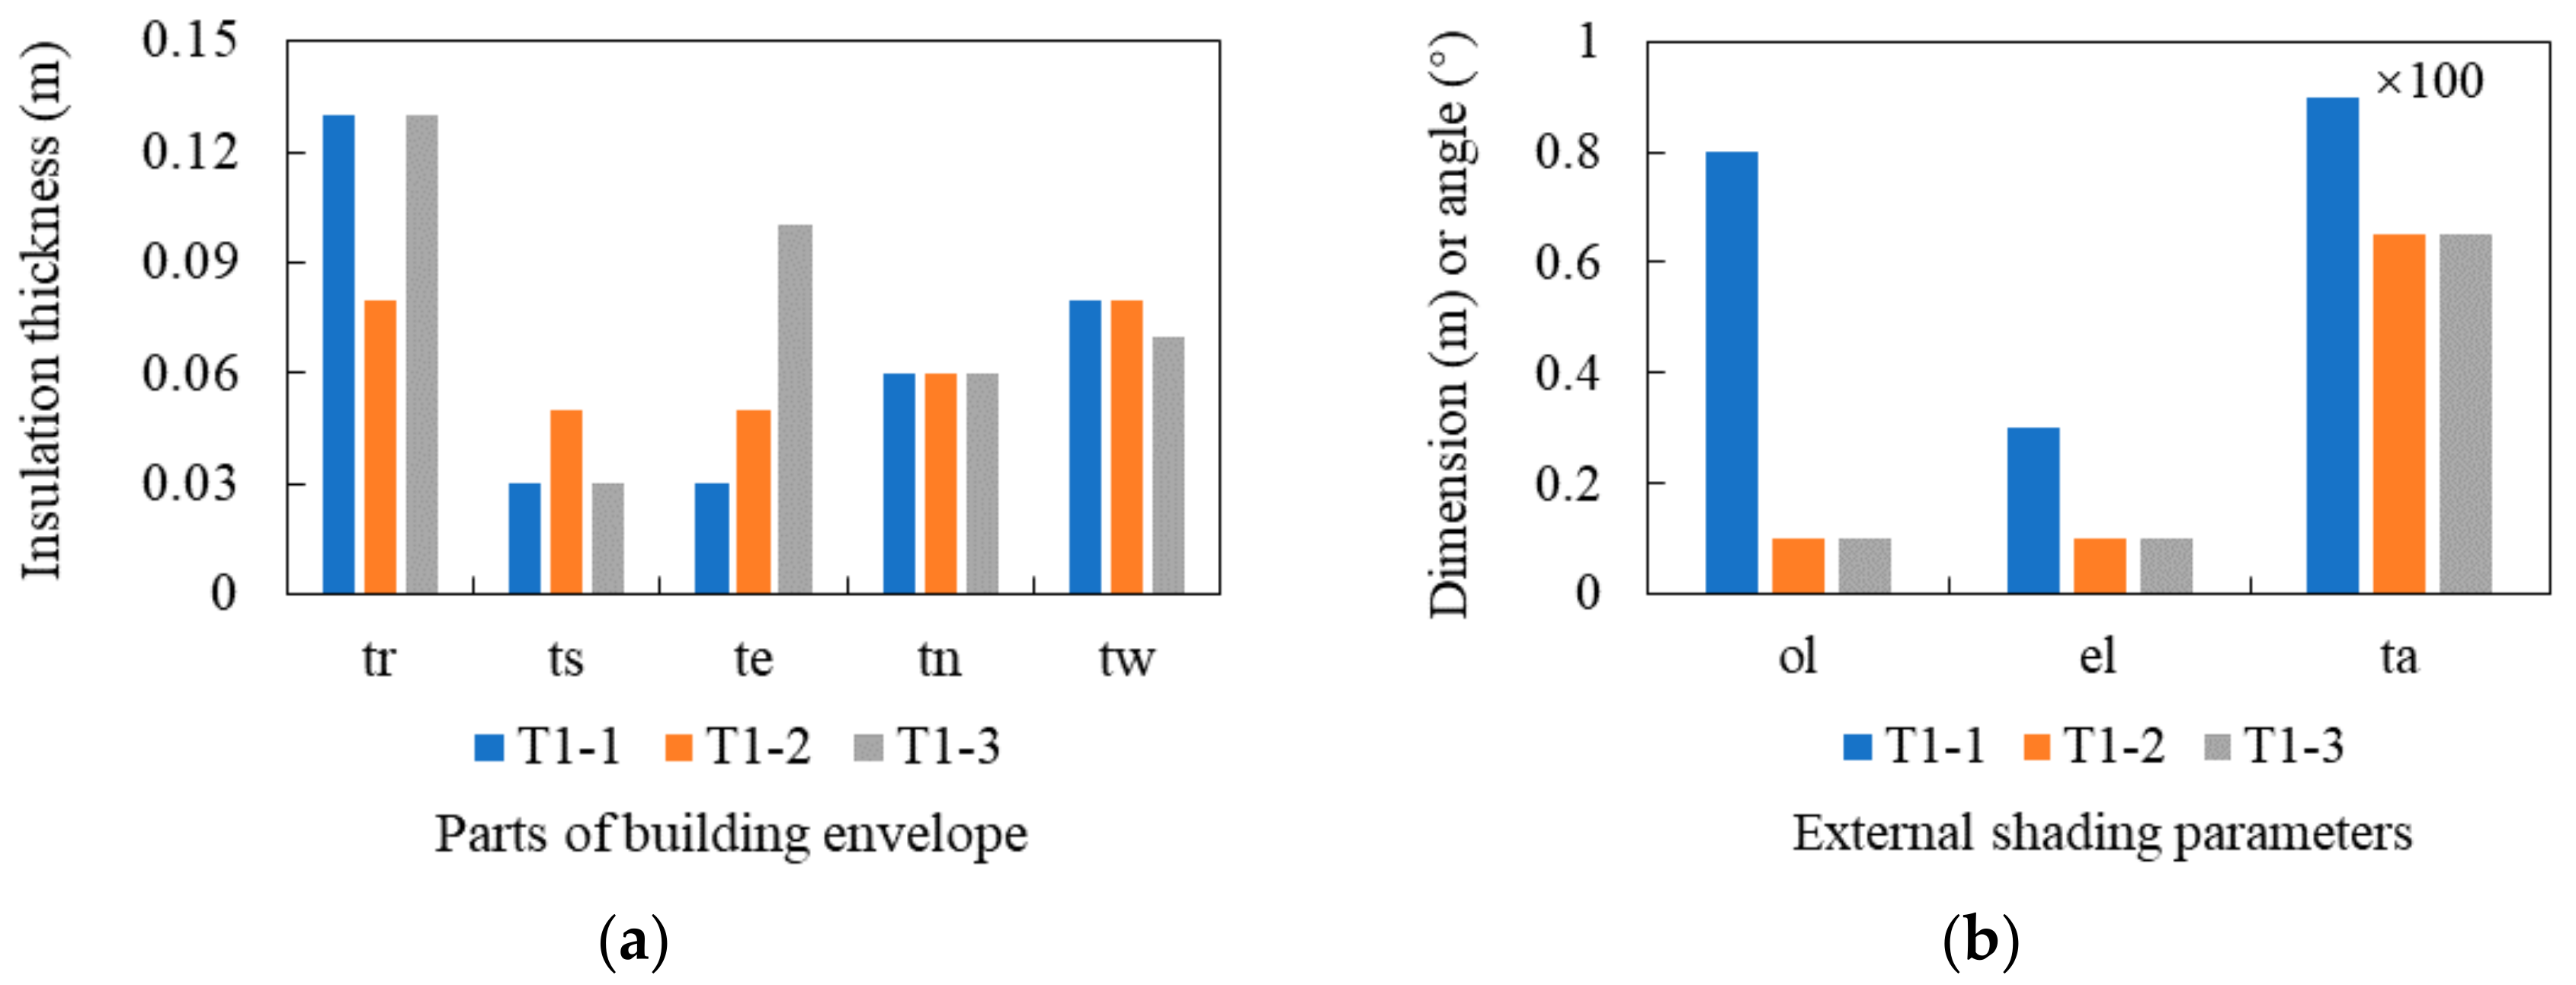
- First parameter combinations of different patterns
4. Conclusions
Author Contributions
Funding
Data Availability Statement
Conflicts of Interest
References
- Sterner, T. Fuel taxes: An important instrument for climate policy. Energy Policy 2007, 35, 3194–3202. [Google Scholar] [CrossRef]
- Ministry of Housing and Urban-Rural Development of PRC. Technical Standard for Nearly Zero Energy Buildings (GB/T 51350-2019); China Architecture Industry Press: Beijng, China, 2019.
- Zou, Y.; Song, B.; Liu, J. An interpretation of the national standards for energy efficiency design of rural residential buildings. Heat. Vent. Air Cond. 2013, 43, 77–81. [Google Scholar]
- Shao, T.; Zheng, W.X.; Jin, H. Analysis of Indoor Thermal Environment and Passive Energy Saving Optimization Design of Rural Dwellings in Zhalantun Area, Inner Mongolia, China. Sustainability 2020, 12, 1103. [Google Scholar] [CrossRef] [Green Version]
- Building Energy Efficiency Research Center, Tsinghua University. 2021 Annual Report on China Building Energy Efficiency; China Architecture & Building Press: Beijing, China, 2021. [Google Scholar]
- Ministry of Housing and Urban-Rural Development of PRC. The 13th Five-Year Plan of Building Energy Conservation and Green Building Development; Ministry of Housing and Urban-Rural Development of PRC: Beijing, China, 2017.
- Ma, C.; Liu, Y.; Wang, D. Analysis of thermal performance and energy saving strategy of rural residential buildings in Northwest China. J. Xi’an Univ. Arch. Technol 2015, 47, 427–432. [Google Scholar]
- Chen, X.; Yang, H.; Lu, L. A comprehensive review on passive design approaches in green building rating tools. Renew. Sustain. Energy Rev. 2015, 50, 1425–1436. [Google Scholar] [CrossRef]
- ECGB Editorial Department. Regional Green Building in the Background of Urban-Rural Integration: Interview with Academician Liu Jiaping, Professor of College of Architecture, Xi’an University of Architecture & Technology. Eco-City Green Build. 2014, 1, 16–17. [Google Scholar]
- Zhu, X.R.; Liu, J.P.; Yang, L.; Hu, R.R. Energy performance of a new Yaodong dwelling, in the Loess Plateau of China. Energy Build. 2014, 70, 159–166. [Google Scholar] [CrossRef]
- Yang, W.J.; Gao, Q.; Xu, B.; Yin, S.S. Inheriting and Updating the Technology of Low Energy Consumption Used in Waterside Vernacular Dwellings in the Lower Yangtze Basin. Archit. J. 2015, 1, 66–69. [Google Scholar]
- Yang, W.J.; Xu, B.; Chang, L. Research on the Ecological Design Strategy of Rural Housing in Qinghai. Eco-City Green Build. 2015, Z1, 112–119. [Google Scholar]
- Zhou, T.J.; Liu, H.J. A Study on the Application of Low-tech Energy-saving Strategies in the New Rural Residence in Sichuan Province-Exampled by the Residential Design of the No.2 Settlements in Nanlin Village, Xiwai Township, Guanghan City. Hum. Settl. Forum West China 2014, 3, 32–37. [Google Scholar]
- He, Q.; Gao, H.Q.; Liu, D.L.; Zhu, X.R. Study on Energy Saving Optimization of Traditional Houses in Lhasa. Archit. Cult. 2019, 180, 243–245. [Google Scholar]
- Hao, S.M.; Song, Y.H.; Li, J.J.; Zhu, N. Field Study on Indoor Thermal and Luminous Environment in Winter of Vernacular Houses in Northern Hebei Province of China. J. Harbin Inst. Technol. 2014, 21, 77–83. [Google Scholar]
- Sun, H.J.; Leng, M.J. Analysis on building energy performance of Tibetan traditional dwelling in cold rural area of Gannan. Energy Build. 2015, 96, 251–260. [Google Scholar] [CrossRef]
- Liu, S.; Huang, C.H. Analysis of the Thermal Environment and Energy-Saving Retrofitting of a Traditional Dwelling in Western Hunan. Build. Sci. 2016, 6, 27–32. [Google Scholar]
- Xu, G.Q.; Jin, H.; Kang, J. Experimental Study on the Indoor Thermo-Hygrometric Conditions of the Mongolian Yurt. Sustainability 2019, 11, 687. [Google Scholar]
- Jin, H.; Ling, W. Low Energy Consumption, Low-tech and Low Cost: Study on the Design for Rural Energy-saving Housing in Cold Region. Archit. J. 2010, 8, 14–16. [Google Scholar]
- Zhang, X.Y.; Jin, H. Strategies of function improvement on existing rural housing in severe cold and cold regions. J. Harbin Inst. Technol. 2011, 18, 117–121. [Google Scholar]
- Li, G.; Feng, G.H.; Wang, L.; Wang, Q.; Li, Z. Energy consumption simulation and analysis on energy saving reconstruction of rural house in China extreme cold areas. J. Shenyang Jianzhu Univ. 2012, 28, 884–890. [Google Scholar]
- Li, J.; Zou, Y.; Liu, J. Study on Building Envelope Optimization Parameters and Energy-saving Rate of Rural Residential Buildings in Severe Cold and Cold Zones. Build. Sci. 2012, 28, 6–9. [Google Scholar]
- Lv, S.L.; Wang, R.; Zheng, S.Q. Passive Optimization Design Based on Particle Swarm Optimization in Rural Buildings of the Hot Summer and Warm Winter Zone of China. Sustainability 2017, 9, 2288. [Google Scholar]
- Gossard, D.; Lartigue, B.; Thellier, F. Multi-objective optimization of a building envelope for thermal performance using Genetic Algorithms and Artificial Neural Network. Energy Build. 2013, 67, 253–260. [Google Scholar] [CrossRef] [Green Version]
- Ascione, F.; Bianco, N.; Stasio, C.D.; Mauro, G.M.; Vanoli, G.P. A new methodology for cost-optimal analysis by means of the multi-objective optimization of building energy performance. Energy Build. 2015, 88, 78–90. [Google Scholar] [CrossRef]
- Delgarm, N.; Sajadi, B.; Delgarm, S.; Kowsary, F. A novel approach for the simulation-based optimization of the buildings energy consumption using NSGA-II: Case study in Iran. Energy Build. 2016, 127, 552–560. [Google Scholar] [CrossRef]
- Bre, F.; Roman, N.; Fachinottia, V.D. An efficient metamodel-based method to carry out multi-objective building performance optimizations. Energy Build. 2020, 206, 109576. [Google Scholar] [CrossRef]
- Harkouss, F.; Fardoun, F.; Biwole, P.H. Multi-Objective Optimization Methodology for Net Zero Energy Buildings. J. Build. Eng. 2018, 16, 57–71. [Google Scholar] [CrossRef]
- Yu, Z.Y.; Lu, F.; Zou, Y.; Xu, W.; Sun, D.Y.; Liu, C.P. A Simulation-based Multi-objective Optimization Approach for Design of Nearly Zero Energy Buildings. Build. Sci. 2019, 35, 8–15. [Google Scholar]
- Zhu, L.; Wang, B.H.; Sun, Y. Multi-objective optimization for energy consumption, daylighting and thermal comfort performance of rural tourism buildings in north China. Build. Environ. 2020, 176, 106841. [Google Scholar] [CrossRef]
- Hong, T.; Kim, J.; Lee, M. A multi-objective optimization model for determining the building design and occupant behaviors based on energy, economic, and environmental performance. Energy 2019, 174, 823–834. [Google Scholar] [CrossRef]
- Xiao, Q.B. Research on Energy Saving Optimization of Exterior Wall and Roof Structure of Existing Rural Houses in the Ningqiang Region of South Shaanxi Province. Master’s Thesis, Northwestern Polytechnical University, Xi’an, China, 2019. [Google Scholar]
- Ministry of Housing and Urban-Rural Development of PRC. Design Standard for Energy Efficiency of Rural Residential Buildings (GB/T 50824); Chinese Architecture Industry Press: Beijing, China, 2013.
- Ministry of Housing and Urban-Rural Development of PRC. Code for Thermal Design of Civil Building. Chinese Architecture (GB 50176-2016); Chinese Architecture Industry Press: Beijing, China, 2016.
- Ministry of Housing and Urban-Rural Development of PRC. Design Standard for Energy Efficiency of Residential Buildings in Hot Summer and Cold Winter Zone (JGJ 134-2010); Chinese Architecture Industry Press: Beijing, China, 2010.
- ASHRAE. ANSI/ASHRAE Standard 140-2007, Standard Method of Test for the Evaluation of Building Energy Analysis Computer Programs; ASHRAE: Atlanta, GA, USA, 2007. [Google Scholar]
- Krzysztof, G.; Joanna, F.G. Multi-Objective Optimization of the Envelope of Building with Natural Ventilation. Energies 2018, 11, 1383. [Google Scholar]
- Palonen, M.; Hamdy, M.; Hasan, A. MOBO A New Software for Multi-Objective Building Performance Optimization. In Proceedings of the 13th Conference of International Building Performance Simulation Association, Chambéry, France, 26–28 August 2013. [Google Scholar]
- Evins, R. A review of computational optimization methods applied to sustainable building design. Renew. Sustain. Energy Rev. 2013, 22, 230–245. [Google Scholar] [CrossRef]
- Deb, K.; Pratap, A.; Agarwal, S. A fast and elitist multi-objective genetic algorithm: NSGA-II. IEEE Trans. Evol. Comput. 2002, 6, 182–197. [Google Scholar] [CrossRef] [Green Version]
- Delgarm, N.; Sajadi, B.; Delgarm, S. Multi-objective optimization of building energy performance and indoor thermal comfort: A new method using artificial bee colony (ABC). Energy Build. 2016, 131, 42–53. [Google Scholar] [CrossRef]
- Yu, W.; Li, B.Z.; Jia, H.Y.; Zhang, M.; Wang, D. Application of multi-objective genetic algorithm to optimize energy efficiency and thermal comfort in building design. Energy Build. 2015, 88, 135–143. [Google Scholar] [CrossRef]
- Asadi, E.; Silva, M.G.D.; Antunes, C.H.; Dias, L.; Glicksman, L. Multi-objective optimization for building retrofit: A model using genetic algorithm and artificial neural network and an application. Energy Build. 2014, 81, 444–456. [Google Scholar] [CrossRef]
- Yusoff, Y.; Ngadiman, M.S.; Zain, A.M. Overview of NSGA-II for Optimizing Machining Process Parameters. Procedia Eng. 2011, 15, 3978–3983. [Google Scholar] [CrossRef] [Green Version]
- Si, B.H.; Wang, J.G.; Yao, X.Y.; Shi, X.; Jin, X.; Zhou, X. Multi-objective optimization design of a complex building based on an artificial neural network and performance evaluation of algorithms. Adv. Eng. Inform. 2019, 40, 93–109. [Google Scholar] [CrossRef]
- Zhao, H.; Jin, H. Research on the local optimum eco-technologies of rural housing in the chill region of China. J. Harbin Inst. Technol. 2007, 39, 235–237. [Google Scholar]


| Parts | Construction |
|---|---|
| External wall | Exterior surface + 240 mm shale solid brick + 20 mm composite mortar |
| Roof | Tile + roof truss +20 mm cement mortar + 100 mm reinforced concrete slab |
| Ground | Surface layer + damp-proof layer + 20 mm cement mortar + 100 mm fine aggregate concrete |
| External window | Single-frame single-glass aluminum window |
| Parameter Name | Initial Value | Minimum Value | Maximum Value | Step Size |
|---|---|---|---|---|
| Building orientation | 0° (south) | −90° | 90° | 5° |
| Length–width ratio | 1.5 | 0.7 | 2.5 | 0.2 |
| Name | Diagram | Layer |
|---|---|---|
| External thermal insulation of shale solid brick | 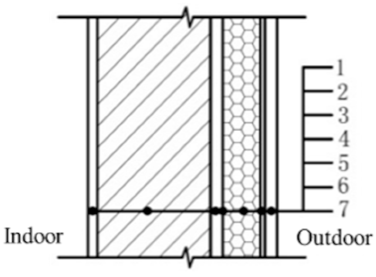 | 1—20 mm composite mortar 2—240 mm shale solid brick 3—Screed-coat (cement plaster) 4—Cementing compound 5—Insulation layer 6—5 mm anti-crack mortar with alkali resistant glass fiber mesh cloth 7—Exterior surface |
| Parts | Name | Density (kg/m3) | Heat Conductivity Coefficient (W/m·K) | Specific Heat (J/kg·K) |
|---|---|---|---|---|
| External wall, roof | Expanded polystyrene board (EPS) | 15 | 0.040 | 1400 |
| Extruded polystyrene board (XPS) | 35 | 0.030 | 1400 | |
| Perlite board (PER) | 120 | 0.070 | 1170 | |
| Polyurethane board (PUR) | 35 | 0.026 | 1590 |
| Name | Diagram | Layer |
|---|---|---|
| Reinforced concrete roof (waterproofing is undertaken by the slope roof) | 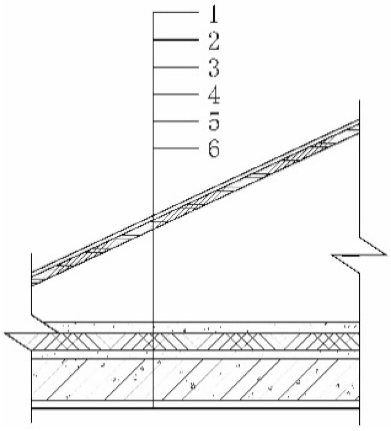 | 1—Slope roof 2—Covering layer 3—Insulating layer 4—20 mm cement plaster 5—Reinforced concrete board 6-Interior surface |
| Number | Window Type | K (W/m2·K) | SHGC |
|---|---|---|---|
| 1 | Single clear 6 mm | 5.778 | 0.819 |
| 2 | Single Low-e clear 6 mm | 3.779 | 0.720 |
| 3 | 6 mm clear + 6A + 6 mm grey | 3.094 | 0.485 |
| 4 | 6 mm clear + 6A + 6 mm bronze | 3.094 | 0.504 |
| 5 | 6 mm clear + 6A + 6 mm green | 3.094 | 0.507 |
| 6 | 6 mm clear + 6A + 6 mm clear | 3.094 | 0.700 |
| 7 | 6 mm clear + 9A + 6 mm clear | 2.822 | 0.702 |
| 8 | 6 mm clear +12A + 6 mm clear | 2.685 | 0.703 |
| 9 | 6 mm clear + 15A + 6 mm clear | 2.665 | 0.703 |
| 10 | 6 mm clear + 6A + 6 mm Low-e | 2.429 | 0.569 |
| 11 | 6 mm clear + 9A + 6 mm Low-e | 1.977 | 0.568 |
| 12 | 6 mm clear + 12A + 6 mm Low-e | 1.771 | 0.568 |
| Diagram | Parameter Name | Range | Step Size |
|---|---|---|---|
 | Overhangs length of sunvisor (OL) | 0–1.5 m | 0.1 |
| Extension length of sunvisor (EL) | 0–0.5 m | 0.05 | |
| Tilt angle of sunvisor(TA) | 45–90° | 5° |
| Parameter Name | Range | Step Size | Window Type |
|---|---|---|---|
| South window–wall ratio | 0.1–0.7 m | 0.05 | NO.1, NO.2, NO.6, NO.10 in Table 6 |
| North window–wall ratio | 0.1–0.7 m | 0.05 |
| K | SHGC | ||
|---|---|---|---|
| Heating energy consumption | Pearson correlation | 0.715 ** | −0.128 |
| Significance (bilateral) | 0.009 | 0.692 | |
| Cooling energy consumption | Pearson correlation | 0.534 | 0.982 ** |
| Significance (bilateral) | 0.074 | 0.000 | |
| Total energy consumption | Pearson correlation | 0.939 ** | 0.501 |
| Significance (bilateral) | 0.000 | 0.097 |
| Parameter Name | Symbol | Range | Step Size | Initial Value | Variable Type |
|---|---|---|---|---|---|
| Building orientation (°) | o | [−30, 30] | 5 | 0 | continuous |
| Width of south window (m) | ws | [1.8, 2.7] | 0.1 | 2.4 | continuous |
| Height of first floor south window (m) | hsf | [1.5, 2.2] | 0.1 | 1.8 | continuous |
| Height of second floor south window (m) | hss | [1.5, 1.8] | 0.1 | 1.8 | continuous |
| Width of north window (m) | wn | [1.5, 2.1] | 0.1 | 1.5 | continuous |
| Height of first floor north window (m) | hnf | [1.5, 2.2] | 0.1 | 1.5 | continuous |
| Height of second floor north window (m) | hns | [1.5, 1.8] | 0.1 | 1.5 | continuous |
| Insulation materials | im | 2 | — | NO.1 | discrete |
| Insulation thickness of south wall (m) | ts | [0, 0.2] | 0.01 | 0 | continuous |
| Insulation thickness of north wall (m) | tn | [0, 0.2] | 0.01 | 0 | continuous |
| Insulation thickness of east wall (m) | tw | [0, 0.2] | 0.01 | 0 | continuous |
| Insulation thickness of west wall (m) | te | [0, 0.2] | 0.01 | 0 | continuous |
| Insulation thickness of roof (m) | tr | [0, 0.2] | 0.01 | 0 | continuous |
| Window type (K, SHGC) | win | 3 | — | NO.1 | discrete |
| Overhangs length of sunvisor (m) | ol | [0, 1.5] | 0.1 | 0.9 | continuous |
| Extension length of sunvisor (m) | el | [0, 0.5] | 0.1 | 0.2 | continuous |
| Tilt angle of sunvisor (°) | ta | [45, 90] | 5 | 90 | continuous |
| Parts | No. | Materials | Performance Parameters | Price |
|---|---|---|---|---|
| External wall, roof | 1 | Expanded polystyrene board (EPS) | λ = 0.040 W/m·K | 360 ¥/m3 |
| 2 | Extruded polystyrene board (XPS) | λ = 0.030 W/m·K | 480 ¥/m3 | |
| Window | 1 | Single Low-e clear 6 mm | K = 3.8 W/m2·K, SHGC = 0.72 | 200 ¥/m2 |
| 2 | 6 mm clear + 6A + 6 mm clear | K = 3.1 W/m2·K, SHGC = 0.70 | 260 ¥/m2 | |
| 3 | 6 mm clear + 6A + 6 mm Low-e | K = 2.4 W/m2·K, SHGC = 0.57 | 350 ¥/m2 | |
| External shading | 1 | Concrete slab | —— | 100 ¥/m2 |
| Variables | Unit | T1 | T2 | T3 |
|---|---|---|---|---|
| Initial investment cost | ¥ | 11,860.6 | 18,501.6 | 7715.3 |
| Total energy consumption | kW·h/m2 | 42.8 | 37.3 | 49.9 |
| o | ° | 0 | 0 | 0 |
| tr | m | 0.13 | 0.12 | 0.05 |
| ts | m | 0.03 | 0.10 | 0.03 |
| te | m | 0.03 | 0.09 | 0.05 |
| tn | m | 0.06 | 0.19 | 0.05 |
| tw | m | 0.08 | 0.09 | 0.01 |
| im | 0.04 | 0.04 | 0.04 | |
| ol | m | 0.8 | 0.3 | 0.2 |
| el | m | 0.3 | 0.0 | 0.2 |
| ta | ° | 90 | 80 | 65 |
| win | 3.8 | 3.1 | 3.8 | |
| ws | m | 1.9 | 1.9 | 1.8 |
| hsf | m | 1.5 | 1.7 | 1.7 |
| hss | m | 1.7 | 1.5 | 1.7 |
| Asw | m2 | 15.39 | 15.01 | 15.30 |
| wn | m | 1.5 | 1.5 | 1.8 |
| hnf | m | 2.0 | 1.5 | 1.9 |
| hns | m | 1.7 | 1.7 | 1.5 |
| Anw | m2 | 11.10 | 9.60 | 12.24 |
Publisher’s Note: MDPI stays neutral with regard to jurisdictional claims in published maps and institutional affiliations. |
© 2021 by the authors. Licensee MDPI, Basel, Switzerland. This article is an open access article distributed under the terms and conditions of the Creative Commons Attribution (CC BY) license (https://creativecommons.org/licenses/by/4.0/).
Share and Cite
Shao, T.; Zheng, W.; Cheng, Z. Passive Energy-Saving Optimal Design for Rural Residences of Hanzhong Region in Northwest China Based on Performance Simulation and Optimization Algorithm. Buildings 2021, 11, 421. https://doi.org/10.3390/buildings11090421
Shao T, Zheng W, Cheng Z. Passive Energy-Saving Optimal Design for Rural Residences of Hanzhong Region in Northwest China Based on Performance Simulation and Optimization Algorithm. Buildings. 2021; 11(9):421. https://doi.org/10.3390/buildings11090421
Chicago/Turabian StyleShao, Teng, Wuxing Zheng, and Zheng Cheng. 2021. "Passive Energy-Saving Optimal Design for Rural Residences of Hanzhong Region in Northwest China Based on Performance Simulation and Optimization Algorithm" Buildings 11, no. 9: 421. https://doi.org/10.3390/buildings11090421
APA StyleShao, T., Zheng, W., & Cheng, Z. (2021). Passive Energy-Saving Optimal Design for Rural Residences of Hanzhong Region in Northwest China Based on Performance Simulation and Optimization Algorithm. Buildings, 11(9), 421. https://doi.org/10.3390/buildings11090421