Article

Seismic Analysis of the Bell Tower of the Church of St. Francis of Assisi on Kaptol in Zagreb by Combined Finite-Discrete Element Method

Faculty of Civil Engineering, Architecture and Geodesy, University of Split, Matice Hrvatske 15, 21000 Split, Croatia
*
Author to whom correspondence should be addressed.
Buildings 2021, 11(8), 373; https://doi.org/10.3390/buildings11080373
Submission received: 9 July 2021 / Revised: 9 August 2021 / Accepted: 19 August 2021 / Published: 21 August 2021

Abstract

:
The paper presents a failure analysis of the bell tower of the church of St. Francis of Assisi on Kaptol in Zagreb subjected to seismic activity using the finite-discrete element method—FDEM. The bell tower is a masonry building, and throughout history it has undergone multiple damages and reconstructions. It was significantly damaged during the earthquake in Zagreb which occurred on 22 March 2020 with a magnitude of 5.5. The analysis was performed on a simplified FDEM 2D numerical model which corresponds to the structure in its current pre-disaster state and the structure after the proposed post-disaster reconstruction. The obtained results showed a good agreement of the crack pattern in the numerical model and the cracks that occurred due to these earthquakes. In addition, the conclusions based on the conducted analysis can provide a better insight into the behaviour and serve as guidelines to engineers for the design of such and similar structures.

1. Introduction

The assessment of seismic vulnerability of historical structures is a necessary precondition for their continuous protection [1,2] and is also of strategic importance considering the richness of the European and Croatian architectural heritage.
The bell towers within the old churches and monasteries are characterised as seismically vulnerable due to their structural and geometric configurations andheterogeneous and deteriorated materials. Such structures are generally very slender, characterised by a relatively large height in relation to the plane disposition. They are mostly square or approximately square in plan, without internal orthogonal walls and rigid horizontal diaphragms. They can be independent structures or incorporated within a monastery or church.
Seismic events that occurred in Croatia throughout 2020 have confirmed high seismic vulnerability and damaged many of these structures. Due to this issue, it is necessary to determine the damage level, assess the seismic resistance of damaged structures and, if necessary, suggest a method for their repair and rehabilitation. Considering that these monumental buildings were not built according to any valid regulations for building structures that define the method and intensity of seismic loading, it is difficult to evaluate their seismic resistance without a proper numerical analysis.
Various methods and numerical models are used for the analysis of masonry structures, based upon the degree of complexity, volume of input data and accuracy of the required solution. There are two basic approaches in numerical modelling of masonry structures: idealisation using continuum and discontinuum.
The continuum approach assumes that stress and strains over the observed structure are approximated by continuous functions. The most frequently used numerical tool in the continuum approach is the finite element method [3,4,5,6,7,8,9,10,11], where different modelling strategies at micro-, simplified micro- and macroscale have been developed to model masonry structures with the desired accuracy. In the micro-modelling approach, the block, mortar as well as the block-mortar connection are modelled separately. These models require significant computational power, and their application is limited to the simulation of tests on small specimens. A simplified micro-modelling approach considers expanded blocks, which are modelled with solid finite elements, while the connection between mortar and block is modelled with zero-thickness contact elements that also represent potential cracks. In the macro-modelling approach, the characteristics of blocks, mortar and interfaces between blocks and mortar are uniformly spread over the structure treated as a homogeneous isotropic or orthotropic continuum with various constitutive laws. Within the macro-scale approach, the structure is usually discretised with 2D or 3D solid finite elements [3,4,5,6,7,8,9,10] or with simplified fibre and layered finite elements [3,11]. Although the simplified microscale finite element models using interface elements within the blocks enable the modelling of discontinuities, a need for the modelling of the mutual mechanical interaction, finite displacement and rotation, including a complete detachment of the structure which is especially expressed in the structures under dynamic loading conditions, led to the development of numerous discontinuum models represented through the framework of discrete element method.
The main idea behind the application of the discrete element method to masonry refers to the idealisation of the structure as a discontinuum, where the blocks are represented by rigid discrete elements, while the joints are modelled as contact surfaces between different blocks. Rigid body and spring model [10,12] and rigid element method [3], which are based on rigid elements interconnected by non-linear axial and shear springs exhibiting softening and energy dissipation under cyclic loads, can also be classified into a group of discrete element methods.
Recently, there has been an increase in the number of numerical models that combine the advantages of structural idealisation using the continuum and discontinuum approach. Within this approach, the structure is modelled with deformable solid finite elements between which zero-thickness contact elements are implemented for simulating crack initiation and propagation. According to this approach, the structure can also be modelled at micro, simplified micro and macro level.
In addition to the previously mentioned numerical models based on the structural idealisation using continuum or discontinuum, the literature also provides for simplified numerical models based on the dynamic response of a single degree of freedom non-linear system [13] or rigid macro-blocks for estimating the limit load and collapse mechanism [10,14].
In order to get a more realistic insight into the behaviour of masonry structures exposed to seismic excitation and to devise a plan for the repair of the structure, it is necessary to conduct analyses with a numerical model that can take into account most phenomena occurring in that structure due to seismic activity. These phenomena primarily include crack initiation and propagation, complete separation of parts of the structure due to propagation of cracks as well as a possible rocking motion of the structure on the substrate due to horizontal and vertical ground excitation.
This paper presents a case study of the bell tower of the church of St. Francis of Assisi on Kaptol in Zagreb (see Figure 1) which was significantly damaged during the 5.5 magnitude earthquake in Croatia [2] with the epicentre in Zagreb which occurred on 22 March 2020 [2]. The Church of St. Francis was built during the period from 1255 to 1264. In 1435, the monastery, church, bells and workshops burned down in a fire. The church was rebuilt throughout the middle of the 15th century at which time the bell tower was presumably built. Over its long history, the bell tower was damaged several times, especially by the earthquake in 1880, when it was removed down to the height of the church cornice. At the end of the nineteenth century, the tower was rebuilt by Herman Bollé in its present form.
Numerical analyses of the bell tower were performed with the open-source software package Y-FDEM, based on the combined finite-discrete element Method [15,16,17,18,19,20] from a group of numerical methods which combine the advantages of finite and discrete element methods. Combined finite-discrete element method was developed mainly for the simulation of fracturing problems considering a large number of mutually interacting discrete elements, where the elements can fracture and fragment, thus increasing the total number of discrete elements. It has proven appropriate for the seismic analysis of dry-stone masonry and masonry with mortar joints [21,22,23,24,25] within the simplified micro-modelling approach. However, to the best of the authors’ knowledge, this research is one of the few applications of combined finite-discrete element method on masonry structures at the macroscale level.
Within this paper, a series of numerical analyses were performed in which: (a) the advantages of the adopted numerical method was demonstrated by comparing the crack pattern that occurred in the bell tower after the Zagreb earthquake and the crack pattern from the numerical model; (b) the response and the seismic resistance of the bell tower was analysed after the proposed reconstruction; (c) the response and the seismic resistance of the bell tower was analysed in the case when the bell tower is completely detached from the rest of the church and the monastery.
The paper is structured in five sections. Following a brief description of the theoretical basis on which the combined finite-discrete element method is based in the second chapter, the third chapter presents the description of the numerical models of the tower used in the case study. The results of the numerical analysis with discussions and explanations are presented in the fourth chapter, while the fifth chapter presents the conclusions and guidelines for further research.

2. FDEM Numerical Modelling

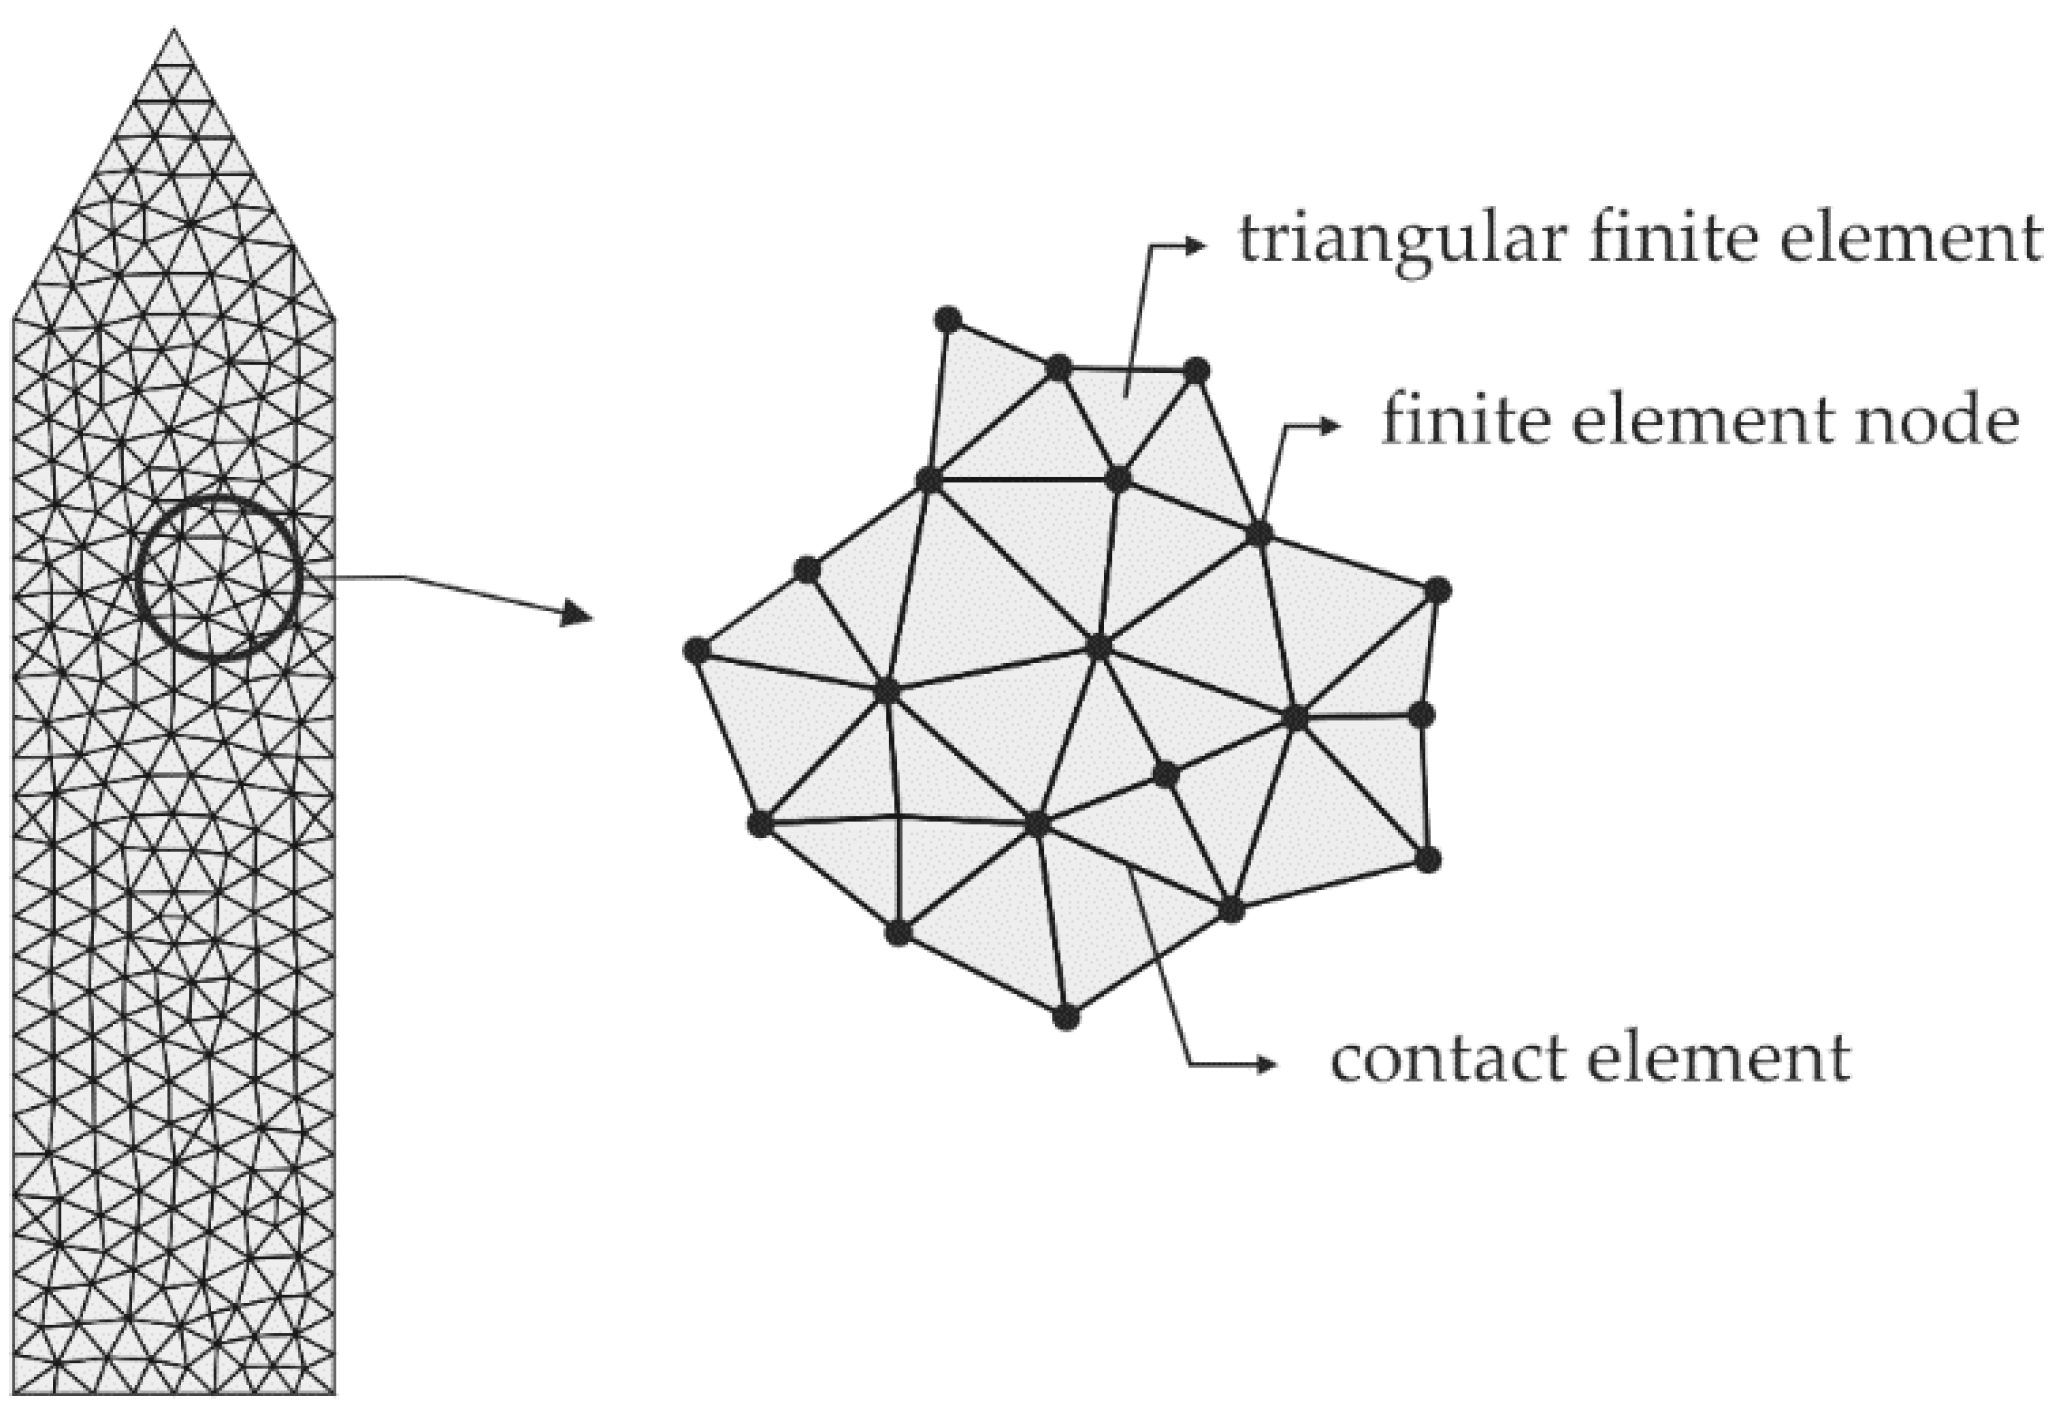
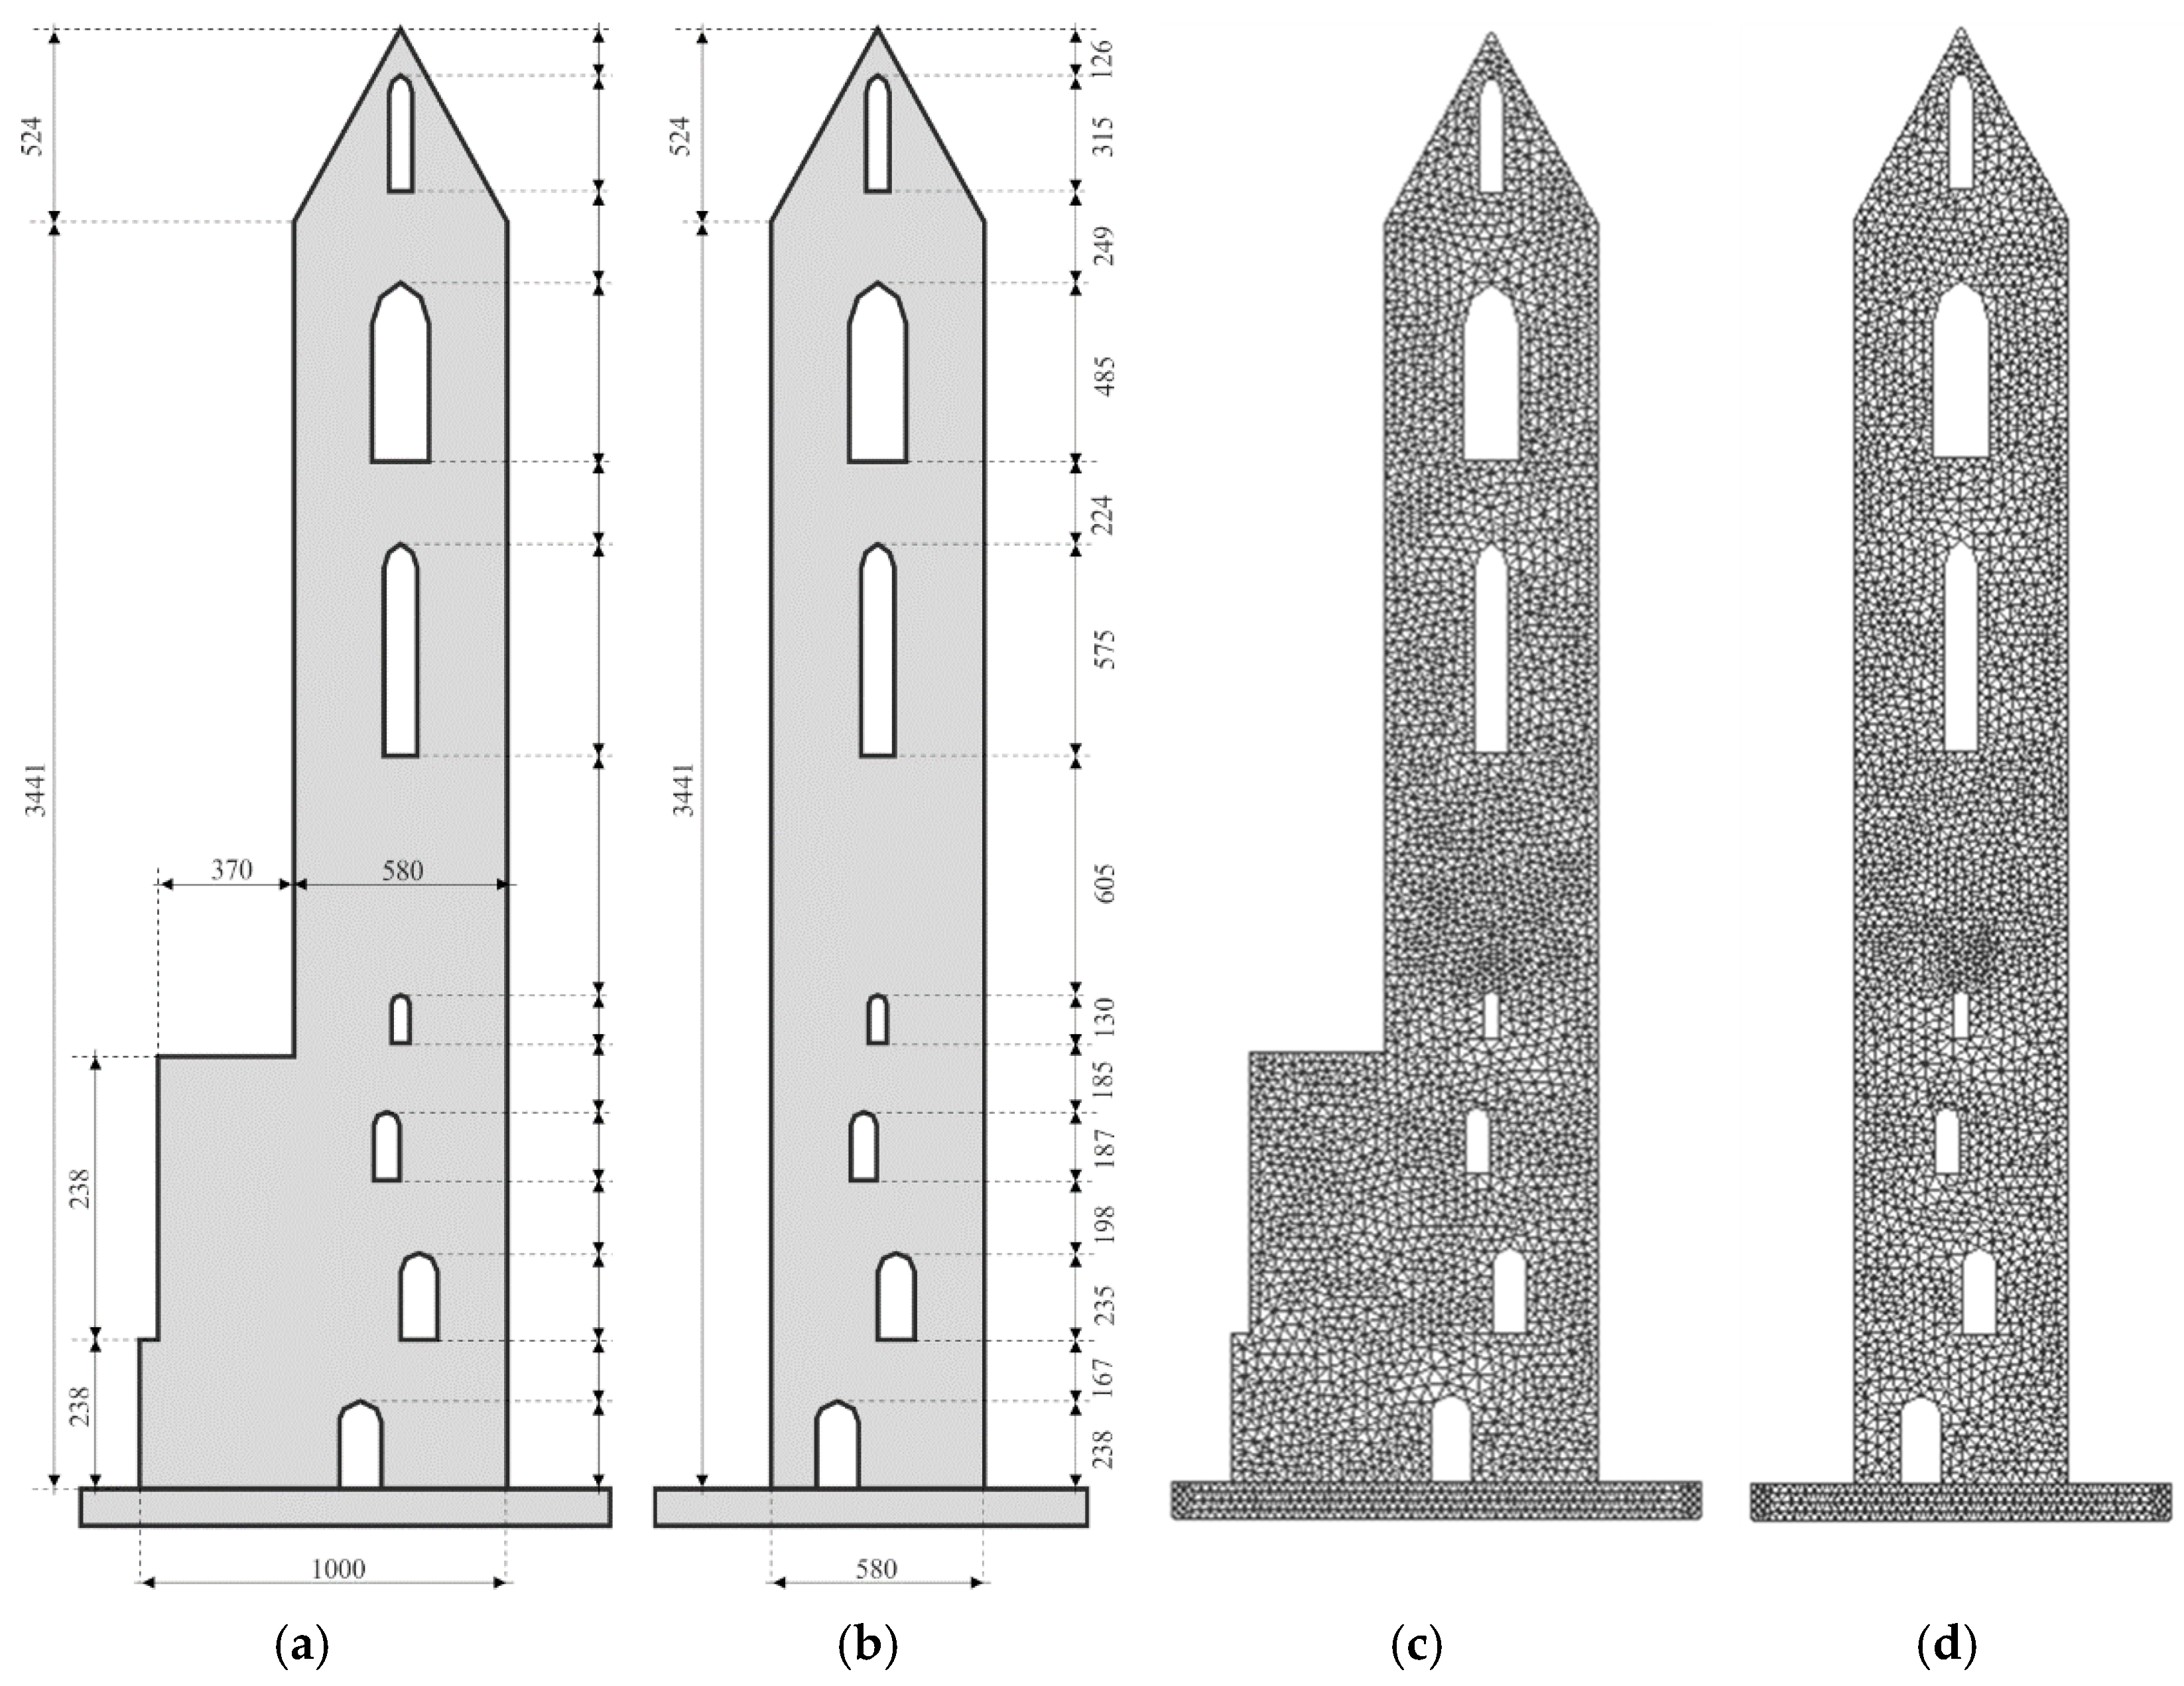
2.1. Discretisation of the Structure

Within FDEM, the structure is discretised with constant strain triangular finite elements (see Figure 2) which enable the deformability of the structure. The material model in finite elements is linear viscoelastic. The material non-linearity including fracture and fragmentation is considered through contact elements, which are implemented within the finite element mesh. Contact interaction between the fragmented parts of the structure is considered through the contact interaction algorithm based on the principle of potential contact forces. The mass of structure is lumped into the nodes of finite elements, while the time integration of the motion equation is applied node by node and degree-of-freedom by degree-of-freedom. This is performed in explicit form by using the central difference time-integration scheme. The main processes included in the FDEM method are contact detection, contact interaction, finite strain elasticity as well as fracture and fragmentation.

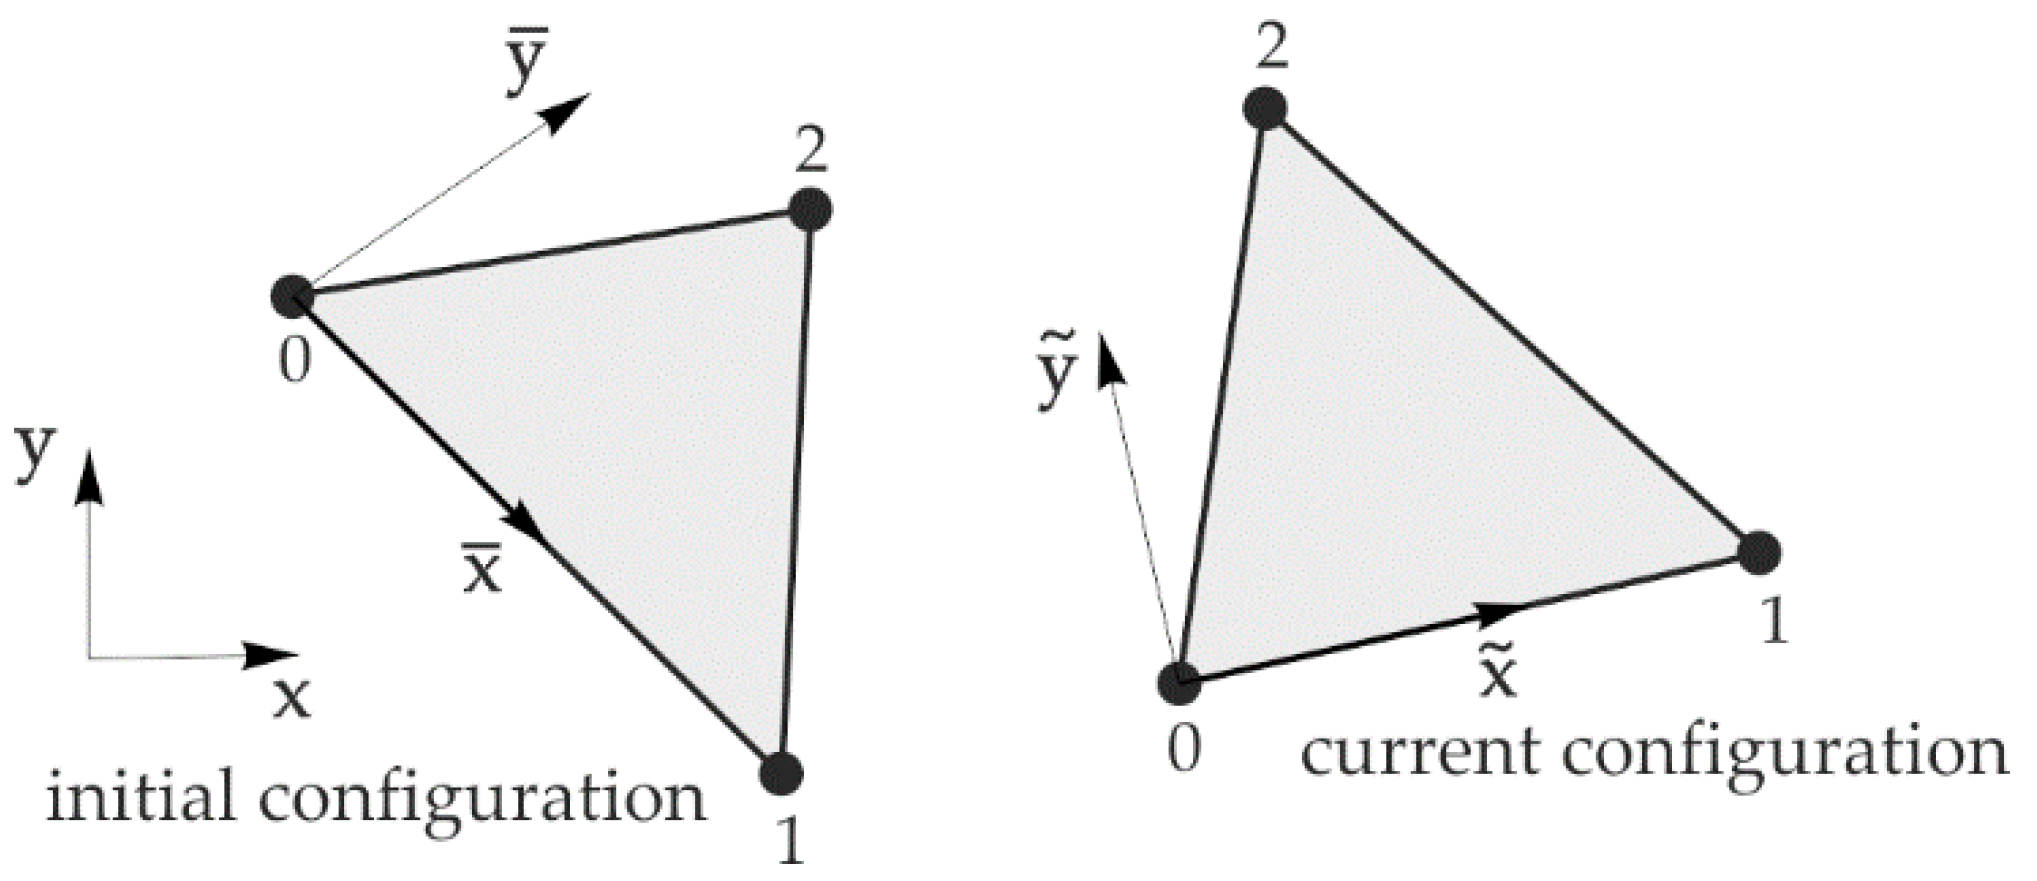
2.2. Deformability of Finite Elements

The geometry of a constant strain triangular finite element is defined by global coordinates of each node (x, y, z), where (xi, yi, zi) represent the coordinates of the initial configuration, and (xc, yc, zc) represent the coordinates of the current configuration (Figure 3). Since discrete elements change their positions in space, their displacements can be divided into two different components: displacements of discrete elements as solid bodies which cause translation and rotation, and displacements causing shape and volume deformations. Displacements of a deformable body involving rotation and deformation in the vicinity of a certain point are defined by the deformation gradient F.
A rotated local coordinate system is adopted to improve the CPU efficiency while preserving a consistent multiplicative decomposition. The global nodal coordinates of each finite element are transferred to a local coordinate system. The deformation gradient F is then calculated as follows [15]:
F = [ x ˜ 1 x ˜ 2 y ˜ 1 y ˜ 2 ] [ x ¯ 1 x ¯ 2 y ¯ 1 y ¯ 2 ] 1 .
Green–St. Venant strain tensor E can be calculated by using the known deformation gradient F from the following expression:
E = 1 2 ( F F T I ) .
Adopting the linear-viscoelastic relationship between stress and strain, the Cauchy stress tensor T can be obtained as follows:
T = E 1 + υ E + E 1 2 υ ε v I + μ ¯ D .
where E is the modulus of elasticity, υ is the Poisson ratio and εv is the volume deformation, while the last element on the right-hand side of the Equation (3) represents the contribution of the deformation velocity, where μ ¯ is the viscos damping coefficient and D is the rate of the deformation tensor [15].
The force belonging to each node from the corresponding side of the triangular finite element is obtained as one half of the traction force according to the following expression:
[ f x f y ] = 1 2 T [ n x ˜ n y ˜ ] .
where n x ˜ and n y ˜ represent the components of the outer normal to the edges of triangle in the current configuration whose magnitude is equal to the length of the corresponding edge.

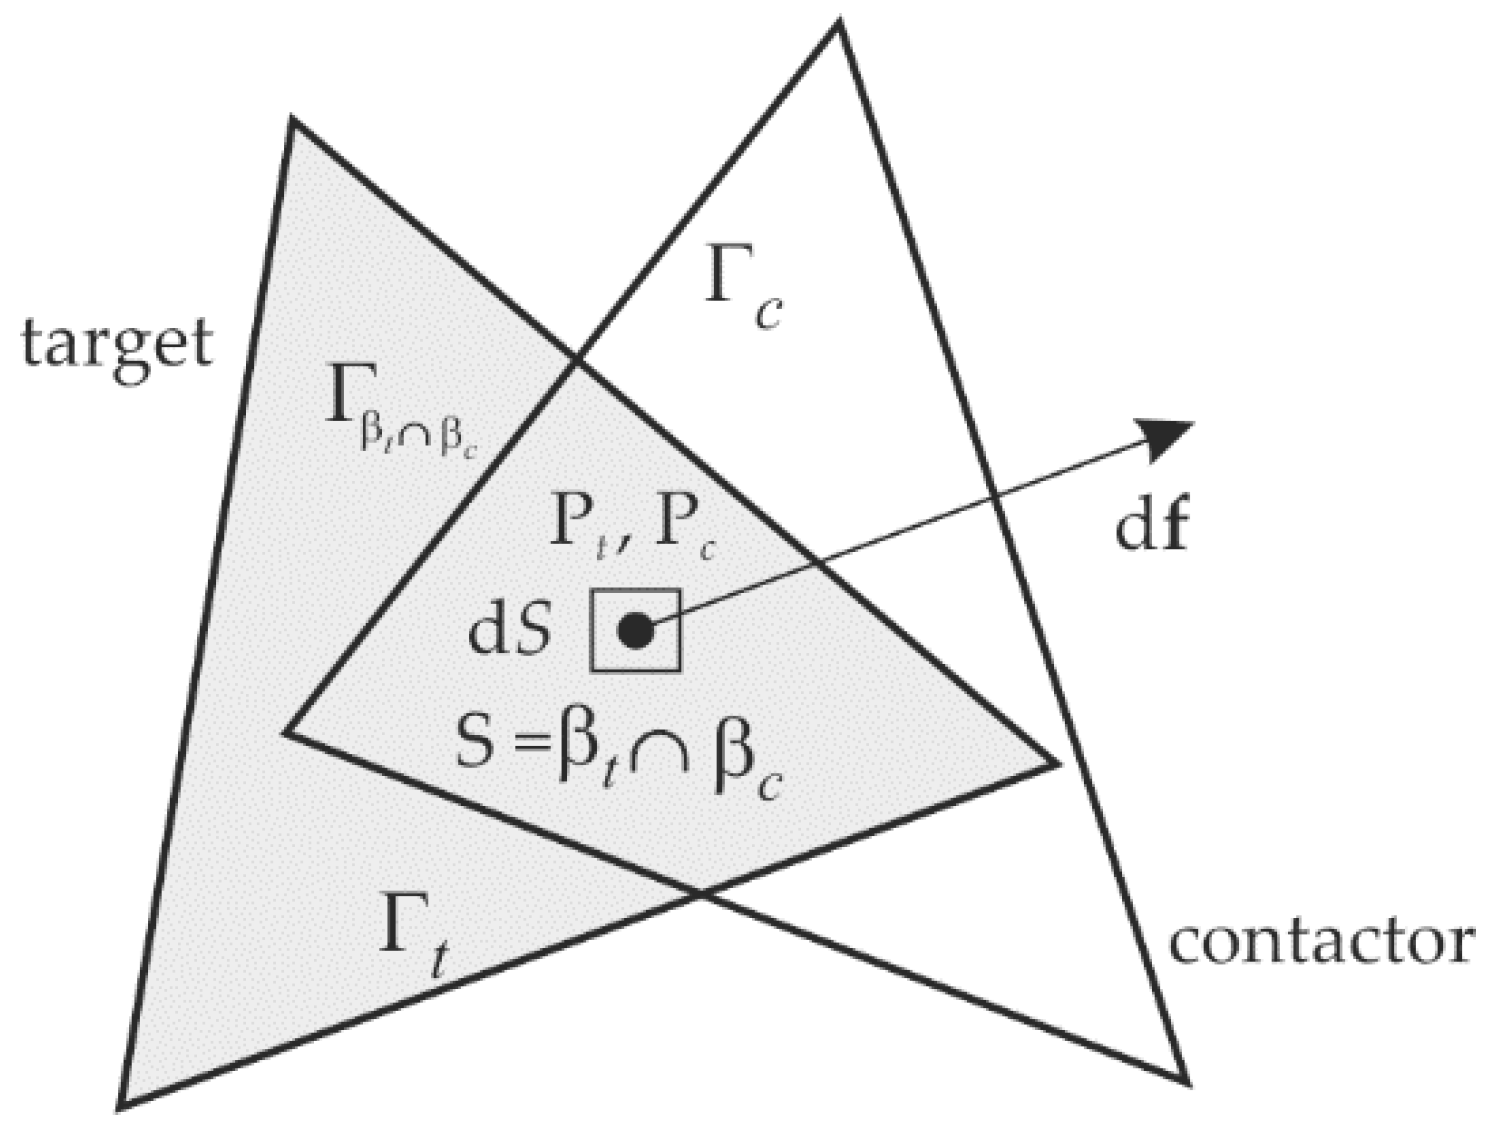
2.3. Contact Detection and Interaction

A contact detection algorithm is aimed at detecting the pairs of mutually contacting finite elements and eliminating the non-contacting pairs that are far apart. Munjiza-NBS contact detection algorithm is implemented in Y code based on FDEM [17]. The total CPU time required by this algorithm to detect all contacting pairs of finite elements is proportional to the total number of finite elements. Once the contacting couples are detected by the contact detection algorithm, the contact interaction algorithm is applied to calculate the contact forces between them.
Contact interaction between the finite elements is calculated by using the distributed potential contact force based on the penalty function method [18], which relies on the assumption that two contacting bodies, one denoted as the contactor and the other as the target, penetrate each other thus generating the distributed contact force. As the contactor penetrates an elemental surface dS into the target, it generates the infinitesimal contact force given by:
d f c = [ g r a d φ c ( P c ) g r a d φ t ( P t ) ] d S ,
where Pt and Pc represent the points in which the target and the contactor overlap, while φ is a potential field assuming the zero-equalling value on the edge and the maximum value at the centre of the finite element.
The total contact force exerted by the target onto the contactor is obtained by the integration of the infinitesimal contact force dfc over the overlap surface S (Figure 4), which leads to:
f c = S = β t β c ( g r a d φ c g r a d φ t ) d S .
where βt and βc are the surfaces of target and contactor, respectively. The previous equation can also be expressed as an integral over the line Γ of the overlapping surface as follows:
f c = Γ β t β c n ( φ c φ t ) d Γ .
where n is the outward unit normal to the boundary of the overlapping area. It should be emphasised that each triangle is considered twice, once as a contactor and once as a target. Within the contact interaction algorithm, the Coulomb-type law of friction is also implemented as follows:
f t = k t δ t .
where ft is the tangential elastic contact force, kt is the penalty term for friction, δt is the tangential displacement vector between the particles [26].
If ft is greater than the friction force satisfying the Coulomb-type friction law, |ft| > µ|fn|, the particles slide over each other and the tangential force is calculated using the total normal elastic contact force fn:
f t = μ f n .
where µ is the coefficient of sliding friction.

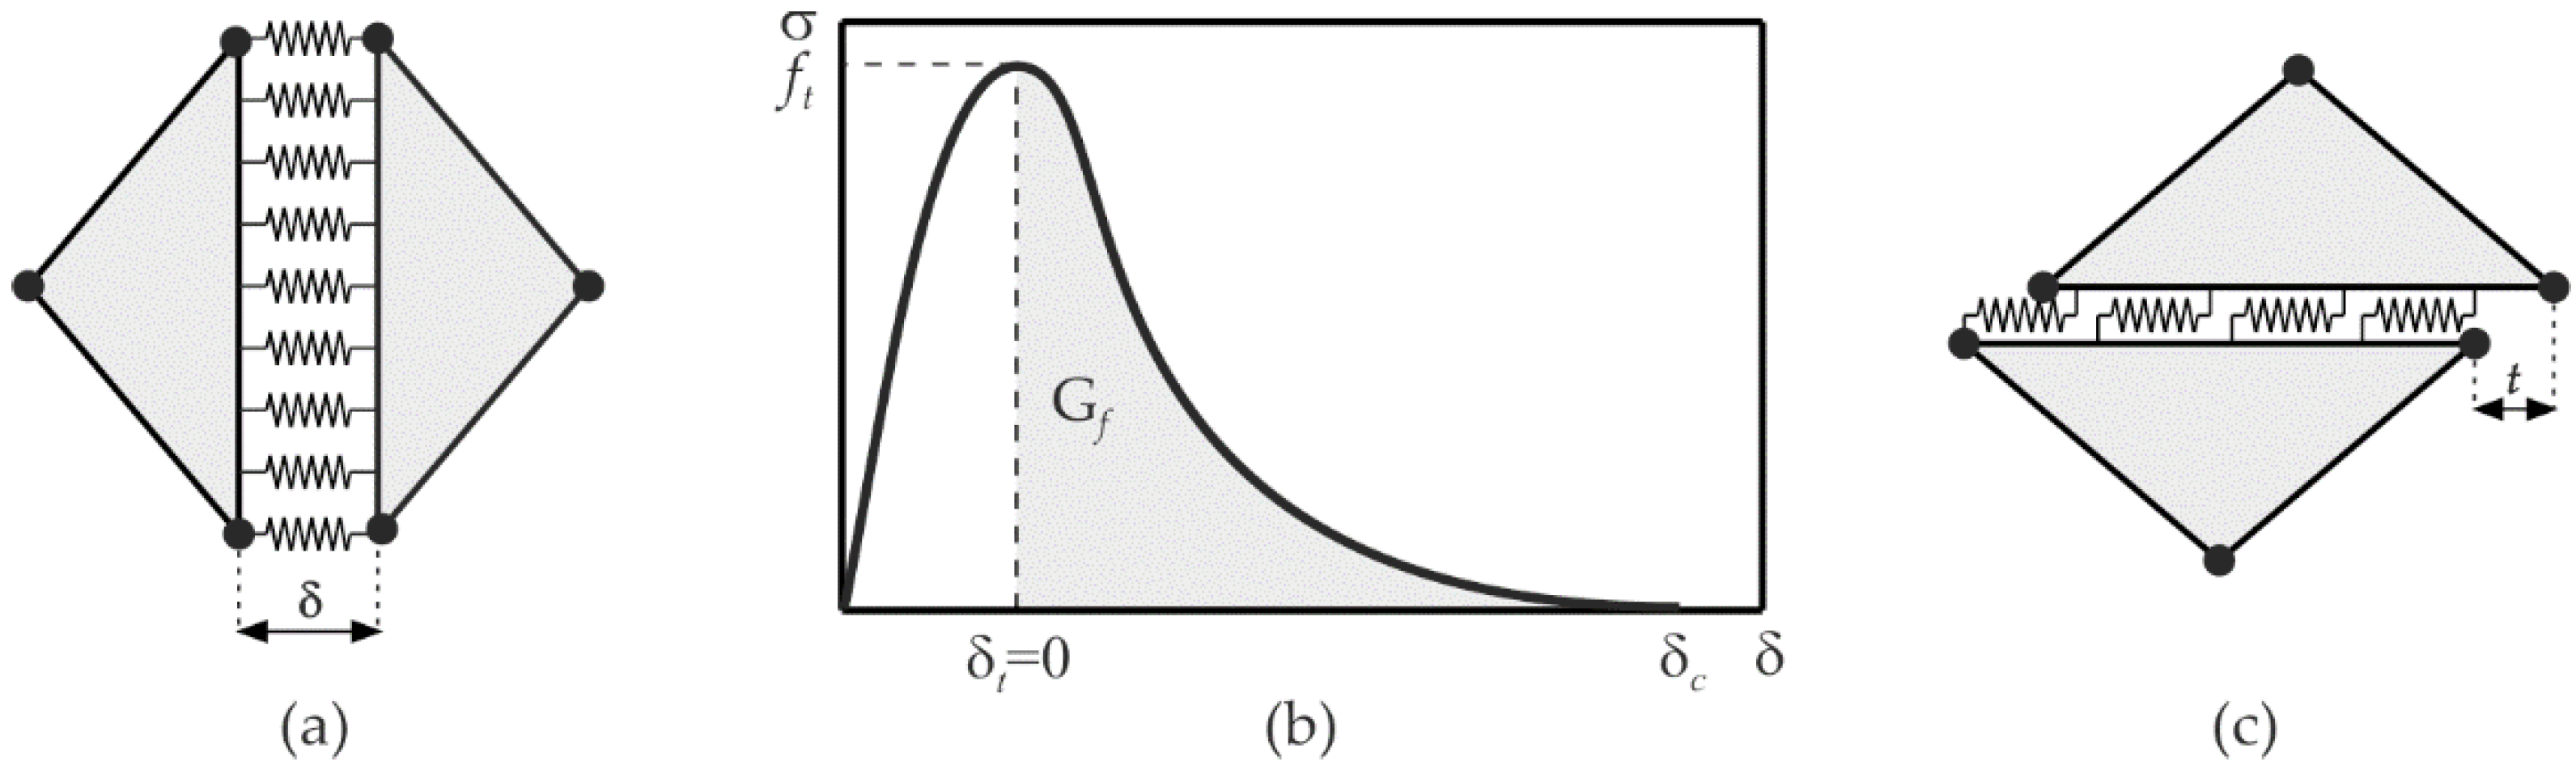
2.4. Fracture and Fragmentation

Within the combined finite-discrete element method, fracture and fragmentation are realised with a combined single and a smeared crack model [19] where the strain softening, which appears in brittle materials after reaching the tensile or shear strength, is described in terms of displacement. This is achieved by zero-thickness contact elements which are implemented within the finite element mesh. The contact elements also assume the locations of potential cracks, which means that the cracks are assumed to coincide with the finite element edges. The separation of these edges in tension (see Figure 5a) induces a bonding stress which is taken to be a function of the size of separation δ (see Figure 5b).
The area under the stress-displacement curve represents the energy release rate Gf = 2γ, where γ is the surface energy, i.e., the energy needed to extend the crack surface by a unit area. Theoretically, there is no separation δ before reaching the tensile strength. In the actual implementation, it is enforced by the penalty method. For the separation δδt, the bonding stress σ is given by:
σ = [ 2 δ δ t ( δ δ t ) 2 ] f t ,
where δt = 2hft/p is the normal separation inducing the bonding stress equal to the tensile strength ft, h is the size of the finite element, and p is the penalty term. Hence, the relative displacement error is independent of the finite element size.
After reaching the tensile strength ft, the stress decreases with an increase of the normal separation δ, whereas at δ = δc the bonding stress tends to zero. For the separation δt < δ < δc, the bonding stress is given by:
σ = z f t ,
where z is the scaling function representing an approximation of the experimental stress–displacement curves taken according to Hillerborg [27]:
z = [ 1 a + b 1 a + b e ( D a + c b ( a + b ) ( 1 a b ) ) ] [ a ( 1 D ) + b ( 1 D ) c ] ,
where a = 0.63, b = 1.8 and c = 6.0 represent the parameters chosen [27] to fit a particular experimental curve in tension, while the damage parameter D is determined according to the expression:
D = D t = { ( δ δ t ) / ( δ c δ t ) ,   if   δ t < δ < δ c ; 1 ,   if   δ > δ c .
The edges of two adjacent finite elements are also held together by shear springs as shown in Figure 5c. Before reaching shear strength fs, which coincides with sliding t = ts, shear stress is given by:
τ = [ 2 t t s ( t t s ) 2 ] f s ,
where ts = 2hfs/p is shear separation inducing shear stress which is equal to shear strength fs, h is the size of the finite element, and p is the penalty term. After reaching shear strength fs, the stress decreases with an increasing sliding t, and at t = tc shear stress tends to zero. For sliding ts < |t| < tc, shear stress is given by:
τ = z f z ,
where z is the scaling function given by relation (12) with the damage parameter D given by:
D = D s = { ( t t s ) / ( t c t s ) ,   if   t s < t < t c ; 1 ,   if   t > t c .
For interaction tension and shear, damage parameter D in relation (12) is given by:
D = D t 2 + D s 2

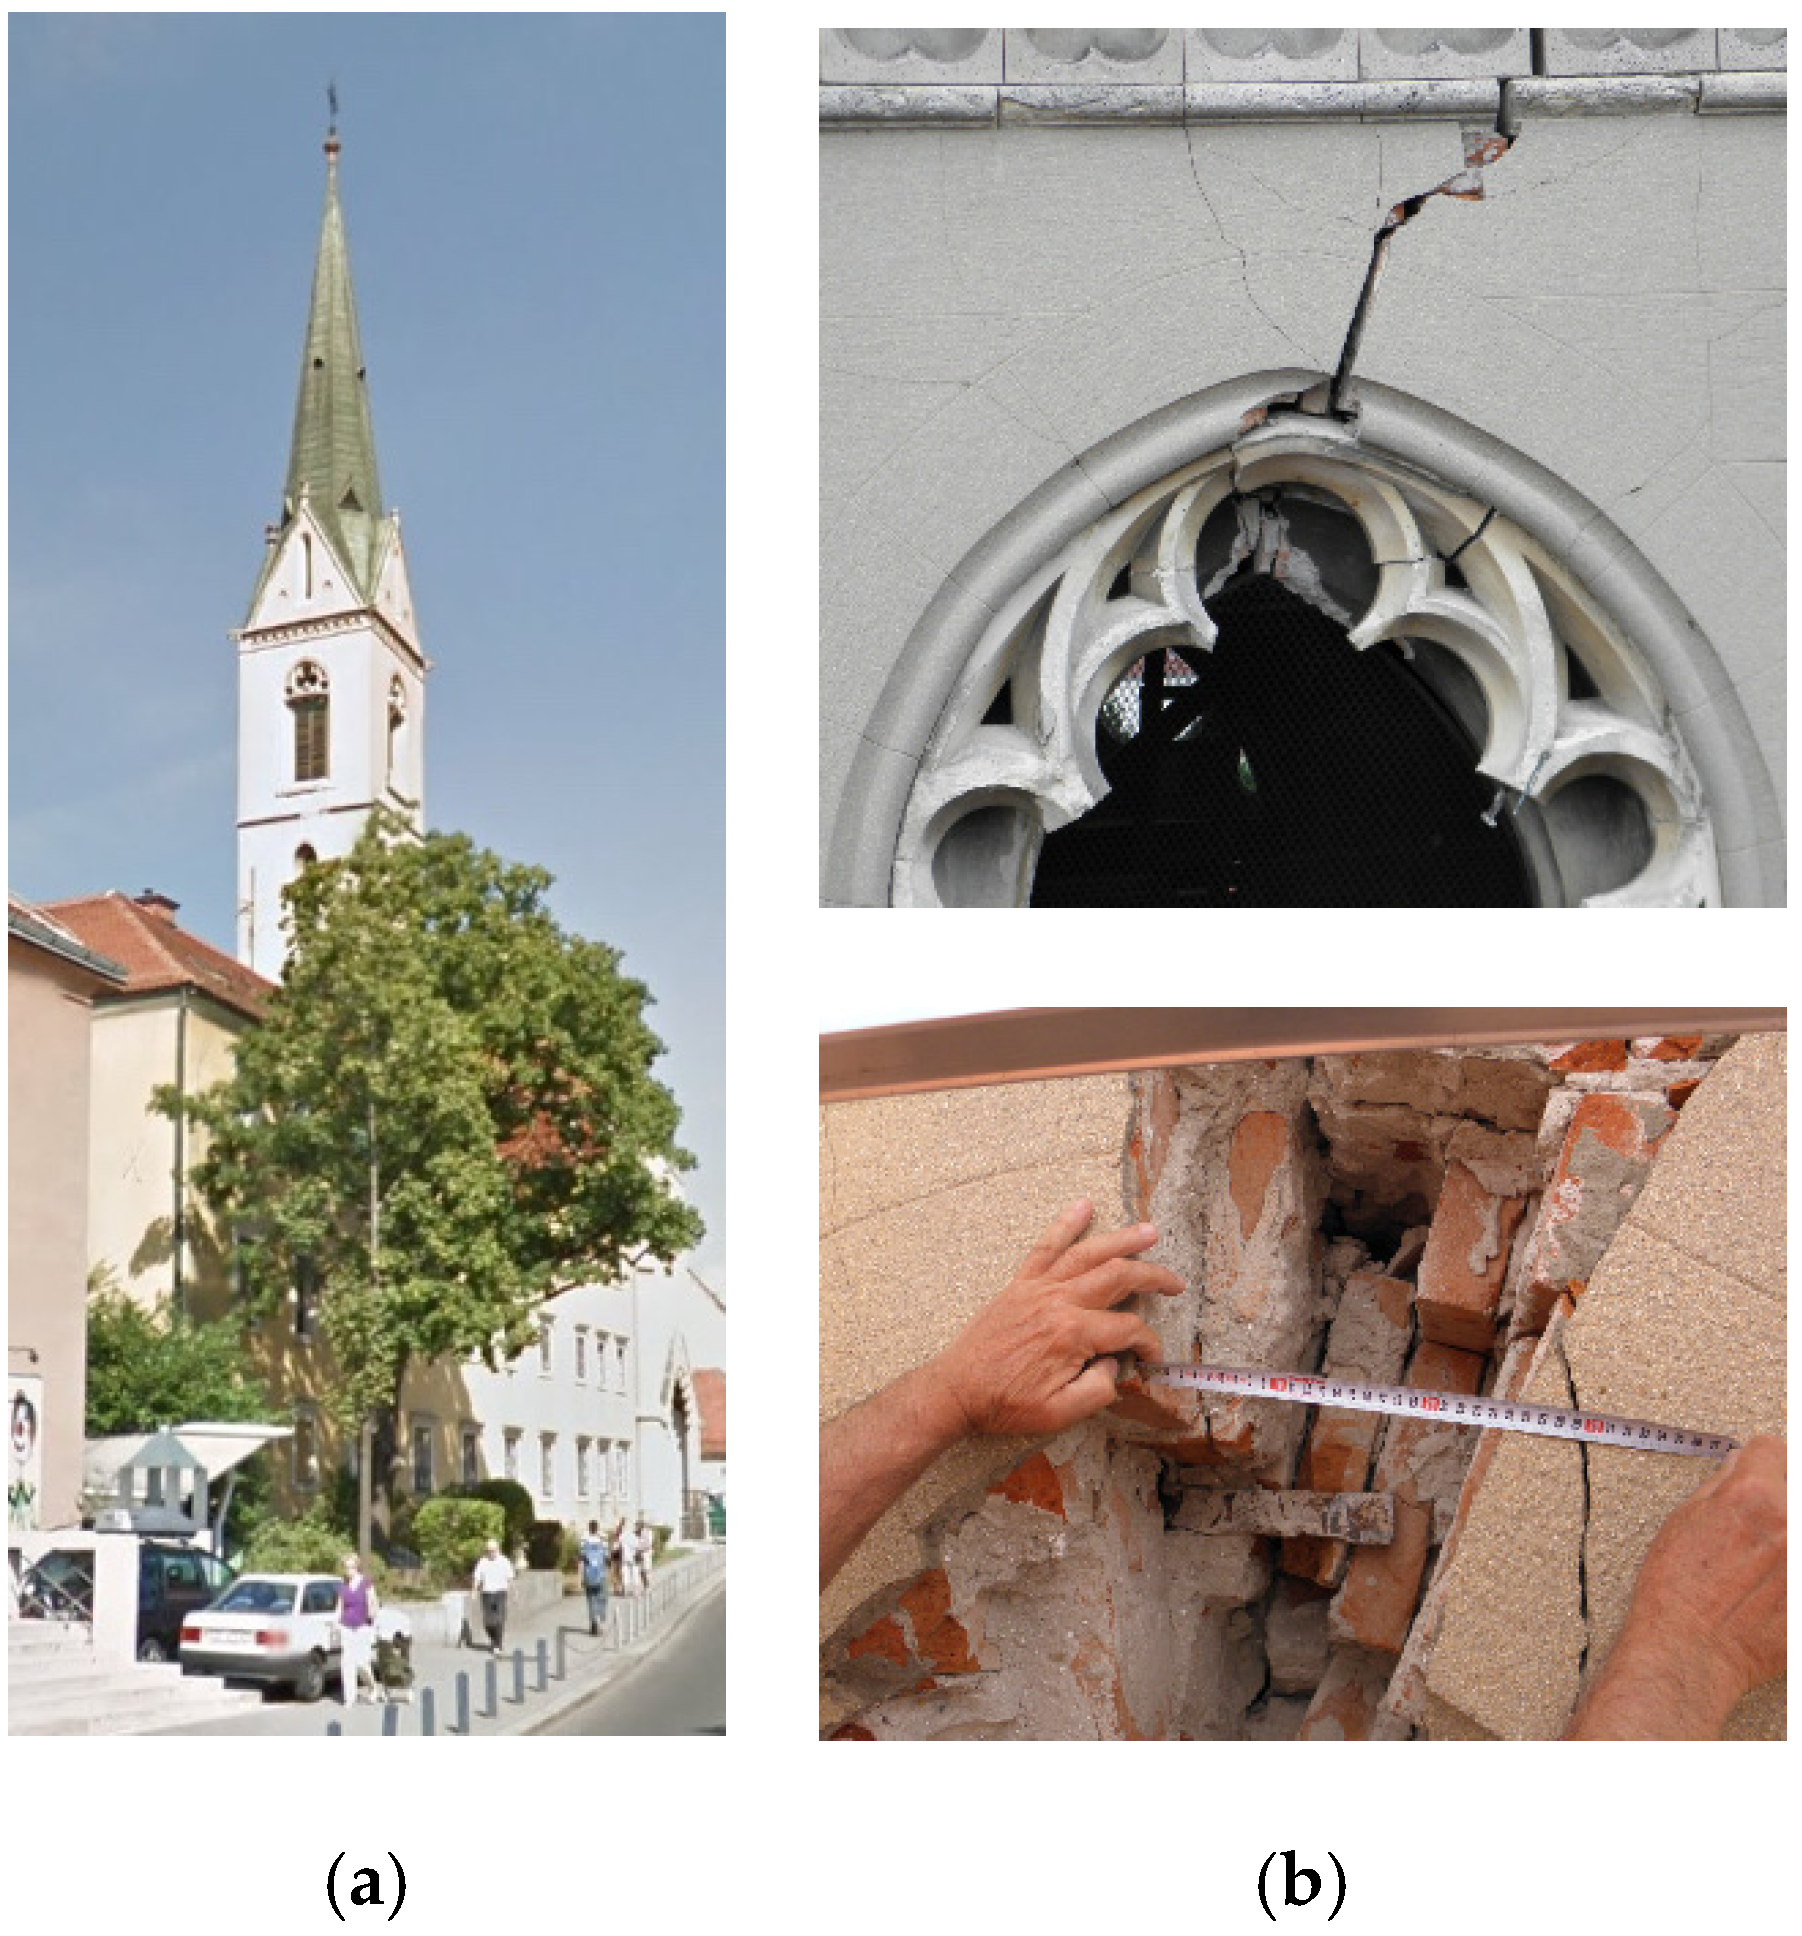
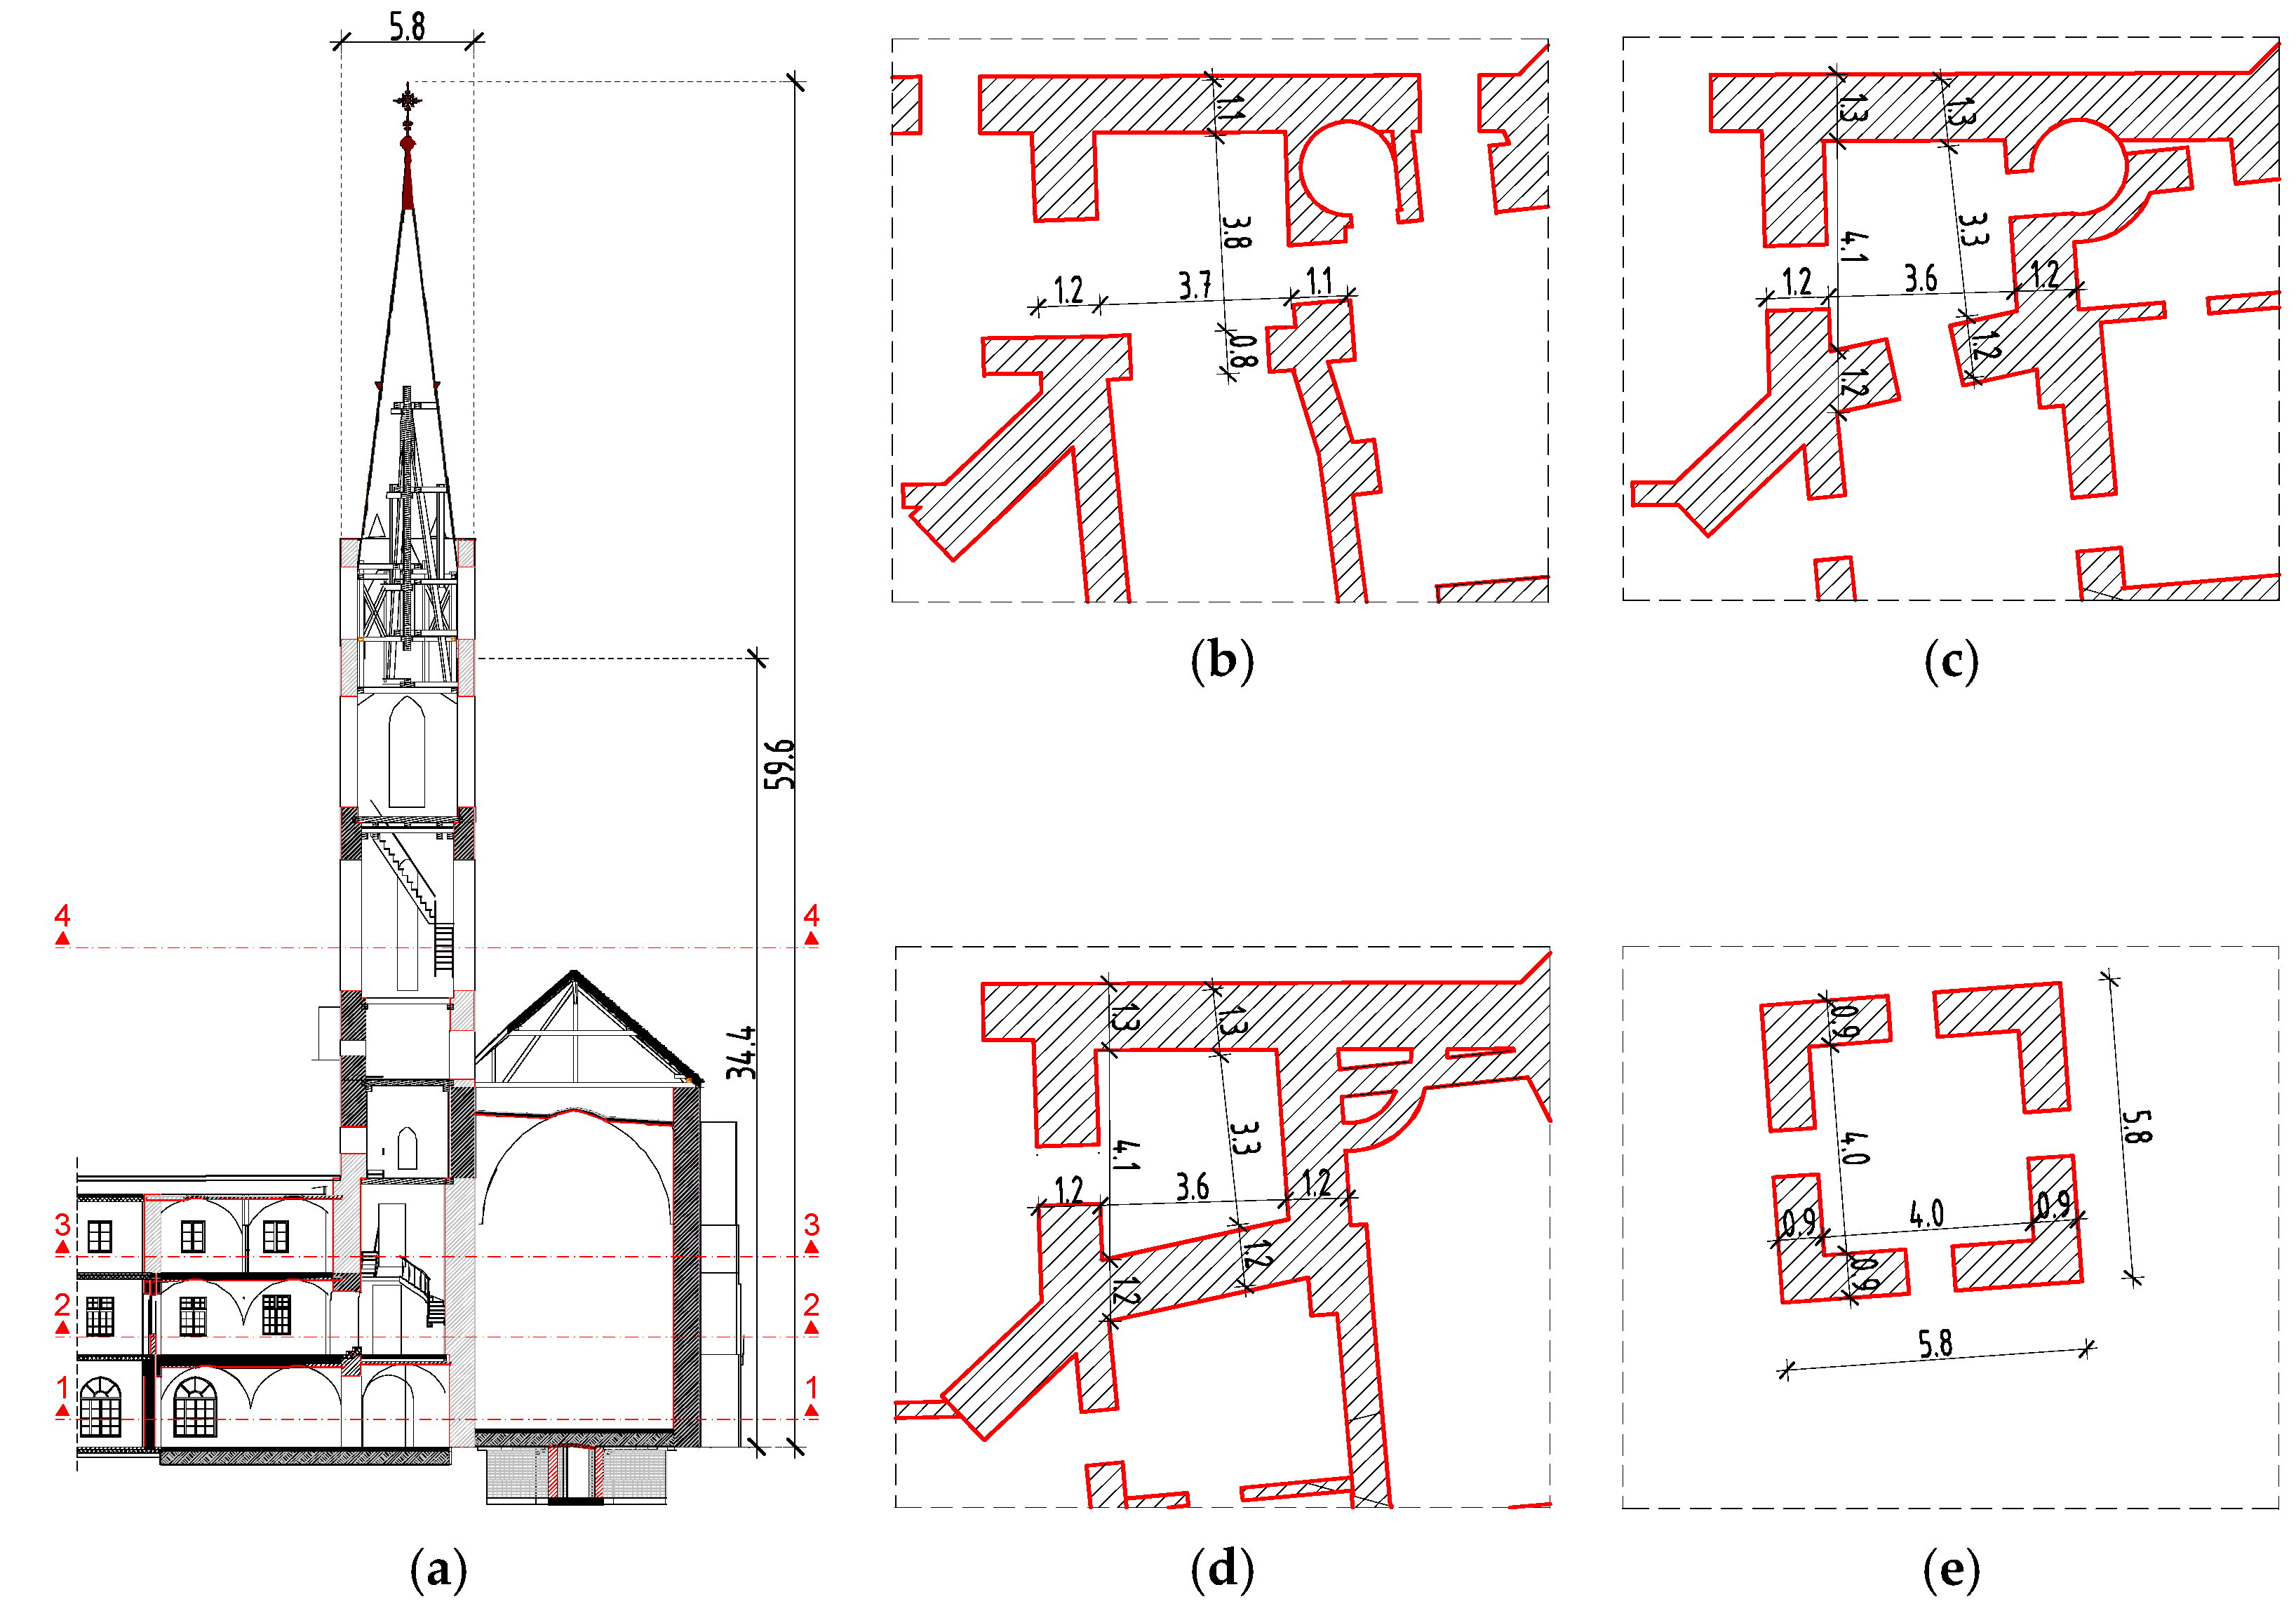
3. Description of the Structure and Numerical Model of Bell Tower

The bell tower is a masonry building made of solid bricks in lime mortar, with galleries made of wooden beams [28,29,30]. The total height of the bell tower is 34.4 m measured from the floor level of the ground floor to the roof cornice, or 59.6 m to the top of the cross. The height disposition of the tower is shown in the Figure 6a.
In the plane layout, the bell tower is an asymmetrical building, mainly because of the multiple reconstructions over the course of its long history, but also due to its oblique buttress from the south-east direction and the walls of the monastery. On the ground floor of the monastery, the walls of the bell tower are significantly perforated with openings, and in the horizontal direction they are supported by an oblique masonry buttress and the walls of the monastery and the church, as shown in Figure 6b. On the first and second floors of the monastery, the bell tower has a trapezoidal ground plan, as shown in Figure 6c,d respectively, with a significant discontinuity of the south wall in relation to the wall on the ground floor. The north wall of the bell tower is also part of the south wall of the church. Through the other floors, the bell tower has a regular square-shaped plan of 5.8 m in span, as shown in Figure 6e.
During the earthquake in Zagreb, the bell tower was significantly damaged. As the earthquake came from the north-south direction, the west and east walls of the bell tower endured the most damage, as shown in Figure 7, while the north and south walls remained mostly undamaged. The resulting cracks are mostly concentrated around the opening of the bell tower, however, two vertical cracks formed below the largest opening extending towards the bottom of the bell tower can also be detected. Given the damage pattern, the authors propose the repair of the structure be executed by making a core of 10-cm-thick reinforced spread mortar on the inside of the bell tower, and adding carbon fibre cloth on the outside of the bell tower walls.
The aim of the numerical analyses was to obtain an insight into the behaviour of the structure during the earthquake in question. Since the dominant response of the structure during this earthquake was in the north-south direction, a planar numerical model, which simulates the dynamic behaviour of the structure in the north-south direction, was made. With the planar numerical model, the influence of torsion was neglected, which is justified considering the nature of the excitation and the geometry of the tower which makes it relatively torsionally rigid in relation to the bending stiffness. In addition, the crack pattern, which occurred only in the west and east walls, confirms that there was no significant torsional response of the bell tower. If the torsion mode was dominant, then cracks would appear on the bell tower on all outer walls.
Numerical analyses were performed with two geometries (G1 and G2) and two variants of material properties (P1 and P2) of numerical models. Geometry G1 (see Figure 8a) refers to the bell tower as it really is and its connections to the surrounding walls of the monastery and the church through the first three floors. The walls considered to contribute to the shear stiffness of the bell tower during earthquakes are taken into account in the numerical model. Geometry G2 (see Figure 8b) refers to the situation where the bell tower is completely detached from the surrounding structures of the monastery and the church and freely resting on the base. Since the tower in plane layout is not completely symmetrical on the first three floors due to the asymmetrical openings in the west and east walls, geometry of both models was made on the basis of the average sizes and positions of the openings of the east and west walls of the bell tower. Numerical model G1 was discretised with 5623, while the numerical model G2 was discretised with 4719 constant strain triangular finite elements, as shown in Figure 8c,d respectively. For the purposes of simulating the crack initiation and propagation, contact elements were implemented within the finite element mesh with the possibility of tension and shear fracture. The thickness of the edge finite elements in the numerical model (1 m from the edge) was 5.8 m simulating the north and south walls, while the thickness of the central finite elements was 2.0 m simulating the east and west walls of the bell tower with an average thickness of 1.0 m.
Material properties P1 refer to the current state with material properties assumed in the structure immediately before the earthquake, while the material properties P2 assume a reconstructed state with average material properties after the proposed reconstruction. The proposed reconstruction consists of grouting all cracks caused by the earthquake, adding reinforced sprayed mortar with an average thickness of 10 cm on the inside of all bell tower walls, and adding two layers of 0.125-mm-thick carbon fibre cloth on the outside of the bell tower walls. The adopted material characteristics of mortar, carbon and steel that would be used for the reconstruction are shown in Table 1.
In the absence of more accurate data on material properties P1, considering the similarities in architectural features and used construction technique, the recommended values from the Italian literature [31] shown in Table 2 were adopted. Material properties P2 were determined on the basis of averaging the properties of materials which are envisaged for the reconstruction and on the basis of the existing properties of materials P1.
Numerical models (M1–M4) of the bell tower used in numerical analyses are summarised in Table 3.
In all numerical analyses, the structure was exposed to horizontal and vertical ground acceleration (Figure 9a,b) which was recorded on 22 March 2020 during an earthquake with the epicentre in Zagreb (Croatia) [32]. The accelerogram is first given with original amplitudes, with peak ground acceleration agr.max. = 0.216 g, and later scaled on peak ground acceleration ag = 0.26 g which is relevant for the Zagreb region. After that, the acceleration was gradually increased to the collapse of the structure.

4. Results and Discussion

The aim of the numerical analyses was not to reproduce the behaviour of the structure during the earthquake but to gain insight into the behaviour of the structure in order to make a decision on the optimum recovery method for the structure.
A comparison of the crack pattern that appeared on the structure of the bell tower after the Zagreb earthquake and the numerically obtained crack pattern from the model M1 exposed to the recorded accelerogram is shown in Figure 10, where a very good agreement of the crack pattern is obtained. In both the numerical model and the actual structure cracks appeared around the openings on higher floors, which indicates that the upper part of the bell tower behaved similarly to a frame with rigid bars. Two approximately vertical cracks, starting from the bottom of the opening at an elevation of 19.9 m and descending towards the bottom of the tower, can also be observed. The presented results indicate that the adopted numerical model can be applied for additional numerical analyses of varying boundary condition, material properties and peak ground acceleration of the recorded accelerogram.
Figure 11 shows a crack pattern on numerical models (M1–M4) exposed to recorded horizontal and vertical accelerations during the Zagreb earthquake.
The numerical model M2, which refers to a variant of a tower completely detached from the surrounding structure and resting on a rigid base, experienced a similar crack pattern as obtained by the numerical model M1. The numerical models M3 and M4, which refer to the tower connected to the surrounding structure and the completely detached tower respectively, but with the material properties assumed after the proposed reconstruction, remained undamaged.
The displacement of the top of the tower in the numerical models, exposed to recorded horizontal and vertical accelerations, is presented in Figure 12. It shows that the maximum displacement of the numerical model M1 was approximately 12 cm with the appearance of permanent deformations resulting from the cracking of the structure. It also shows that the collapse of the numerical model M2 occurred around the tenth second. The maximum displacement of the numerical model M3 with improved material properties was approximately 3 cm, while the phenomenon of rocking motion with maximum amplitudes of the order of magnitude 5 cm is observed in the numerical model M4.
Figure 13 shows a crack pattern on the numerical models (M1–M4) exposed to ground acceleration scaled to a peak acceleration of agr.max. = 0.26 g which is relevant for the Zagreb region. It shows that the numerical models M1 and M2 are substantially damaged and that their mechanical resistance and stability for possible future earthquakes are negligible. It also shows that the numerical models M3 and M4 remained undamaged, which indicates that the proposed method of recovery of the structure is acceptable.
The displacement of the top of the tower in the numerical models M3 and M4, exposed to ground acceleration scaled to a peak acceleration of agr.max. = 0.26 g, is presented in Figure 14a,b respectively. A maximum displacement of about 3.5 cm can be observed in the M3 model, while the rocking motion with maximum amplitudes of the order of magnitude 6 cm is observed in M4.
Figure 15a,b show the crack pattern in the numerical models M3 and M4 exposed to accelerations 0.4 g, respectively. In the numerical model M3, a horizontal crack is observed at a height to which horizontal movement is prevented, while the numerical model M4 remains undamaged, neglecting a small crack above the opening on the ground floor. This suggests that the free-standing bell tower after the proposed recovery spends most of its seismic energy on the rocking motion. It can also be concluded that the free-standing bell tower after the proposed recovery has sufficient mechanical resistance to withstand the local dynamic effects that occur during the rocking motion.

5. Conclusions

This paper presents the application of the combined finite-discrete element method in the seismic analysis of the bell tower of the church of St. Francis of Assisi on Kaptol in Zagreb. To the best of the authors’ knowledge, this research is one of the few applications of combined finite-discrete element method on masonry structures at the macro scale level. Based on the performed numerical analyses, the following conclusions can be made:
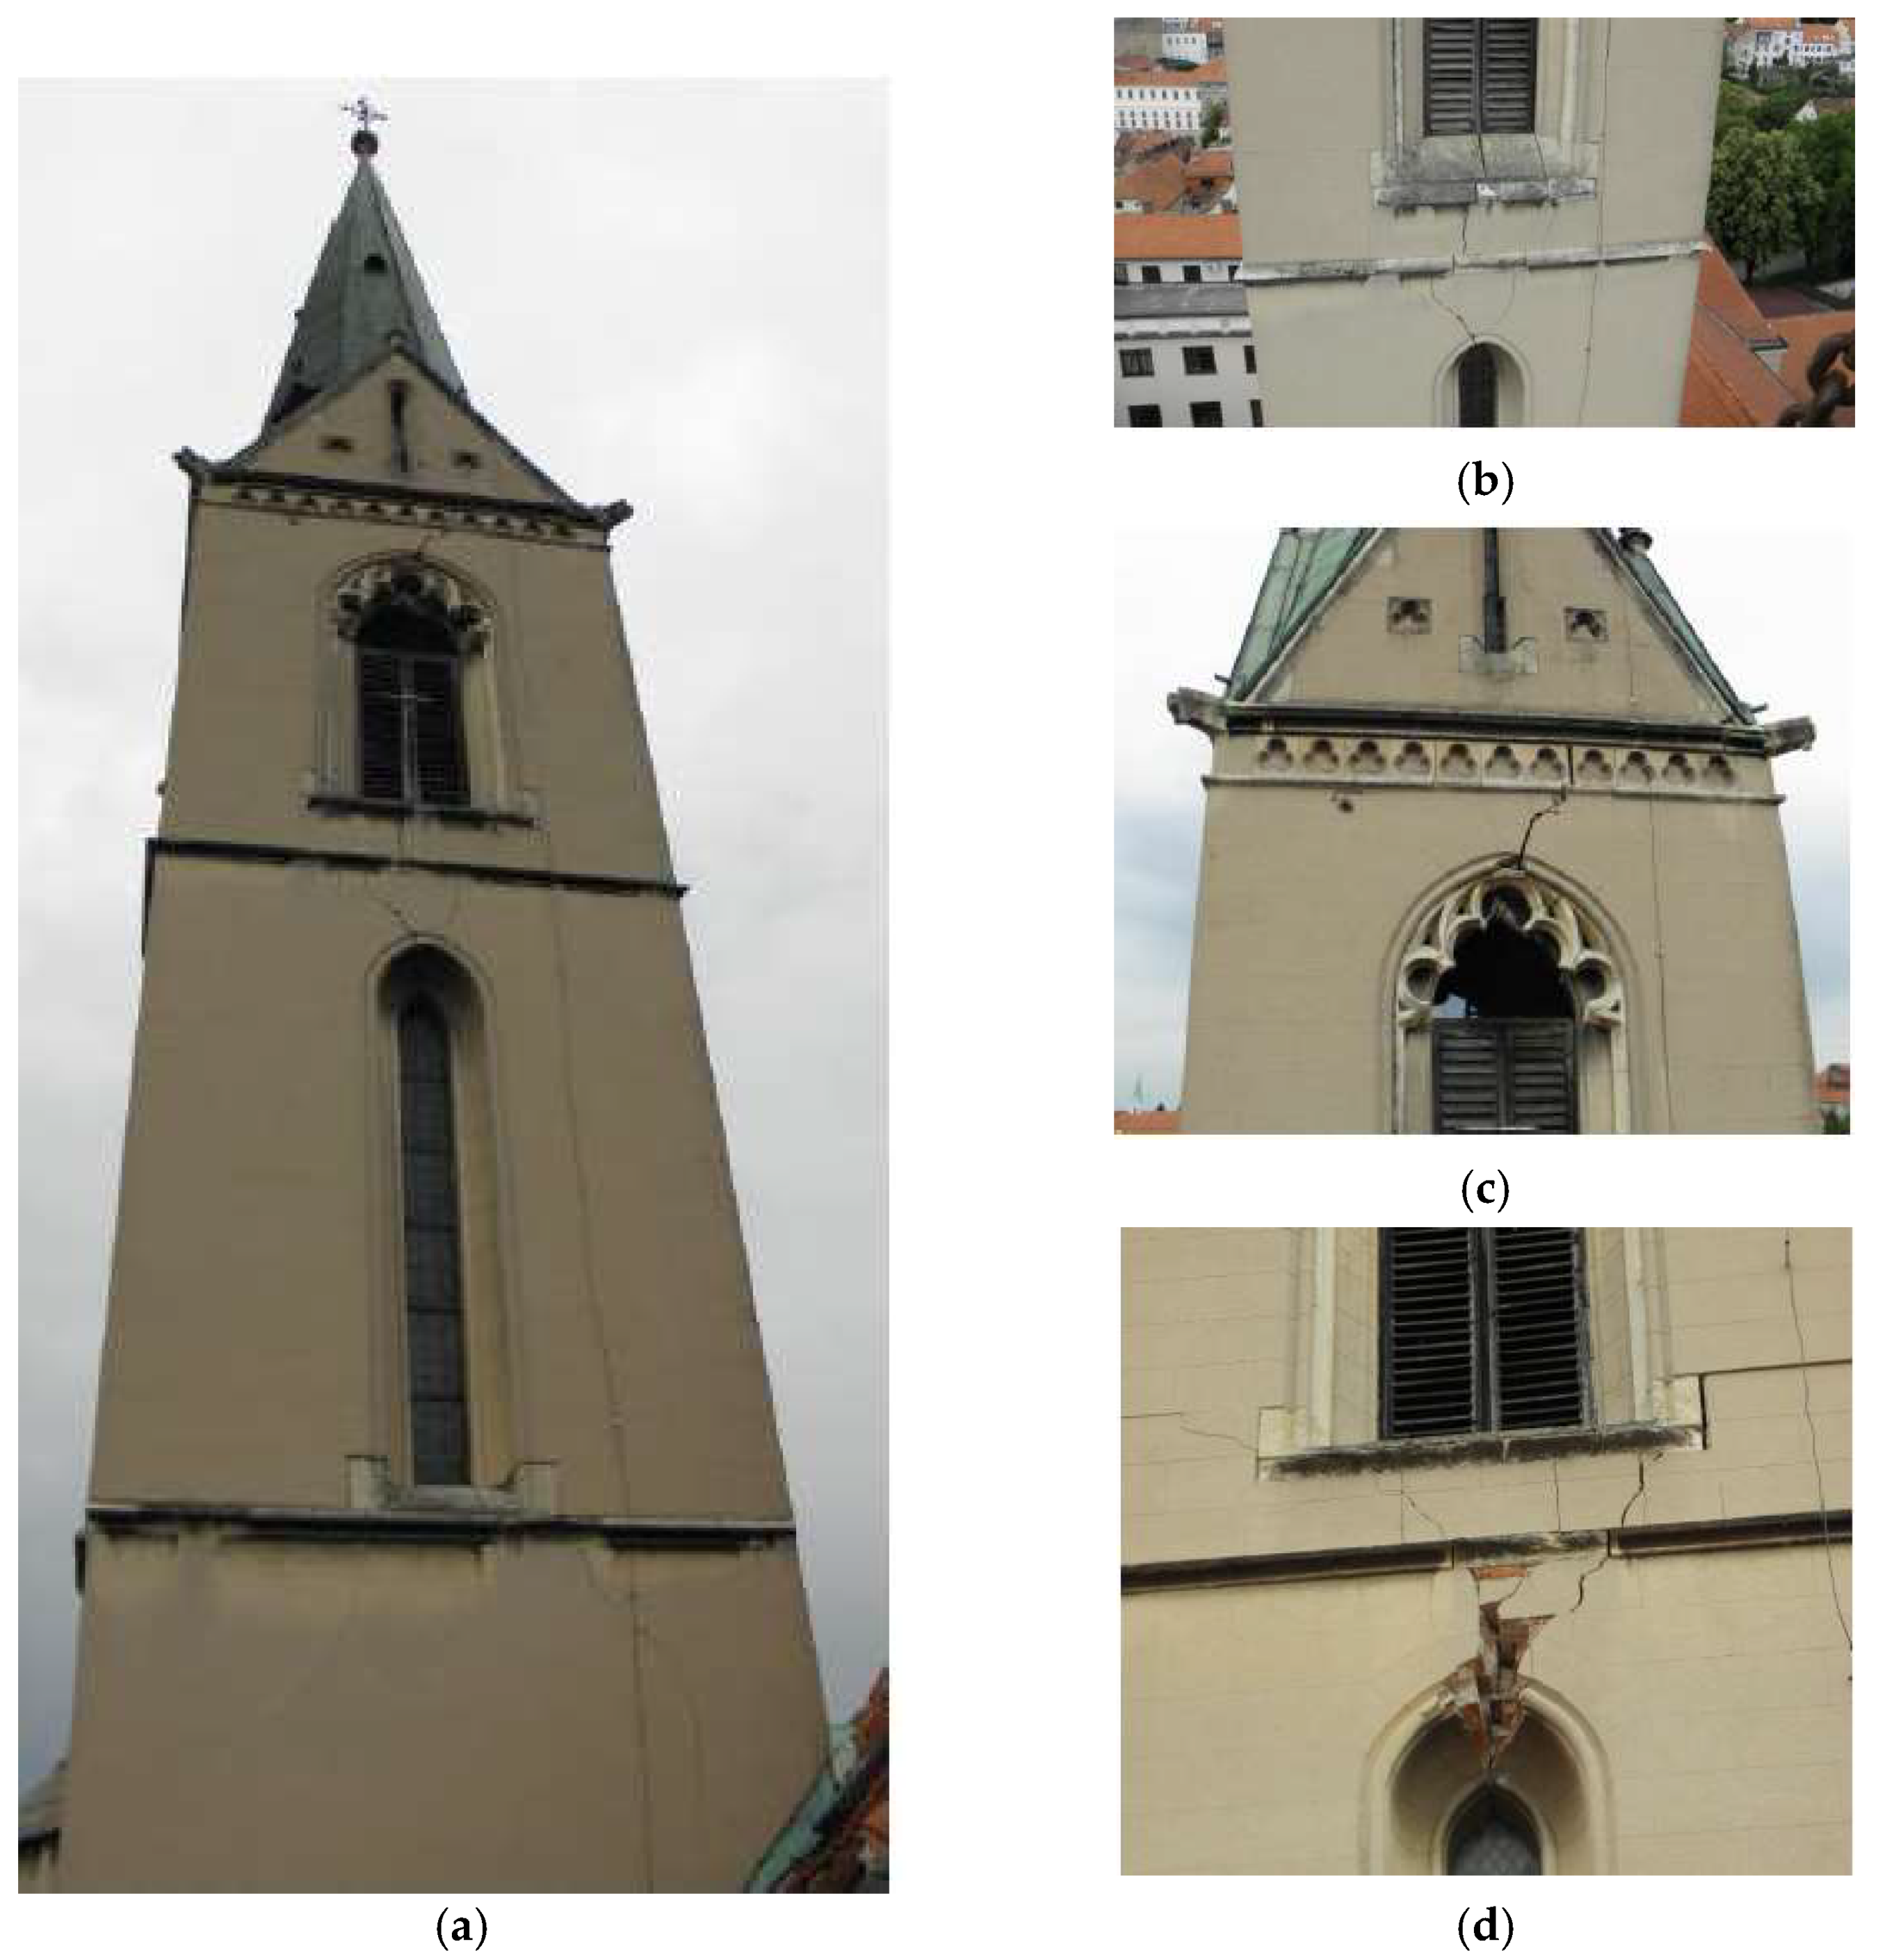
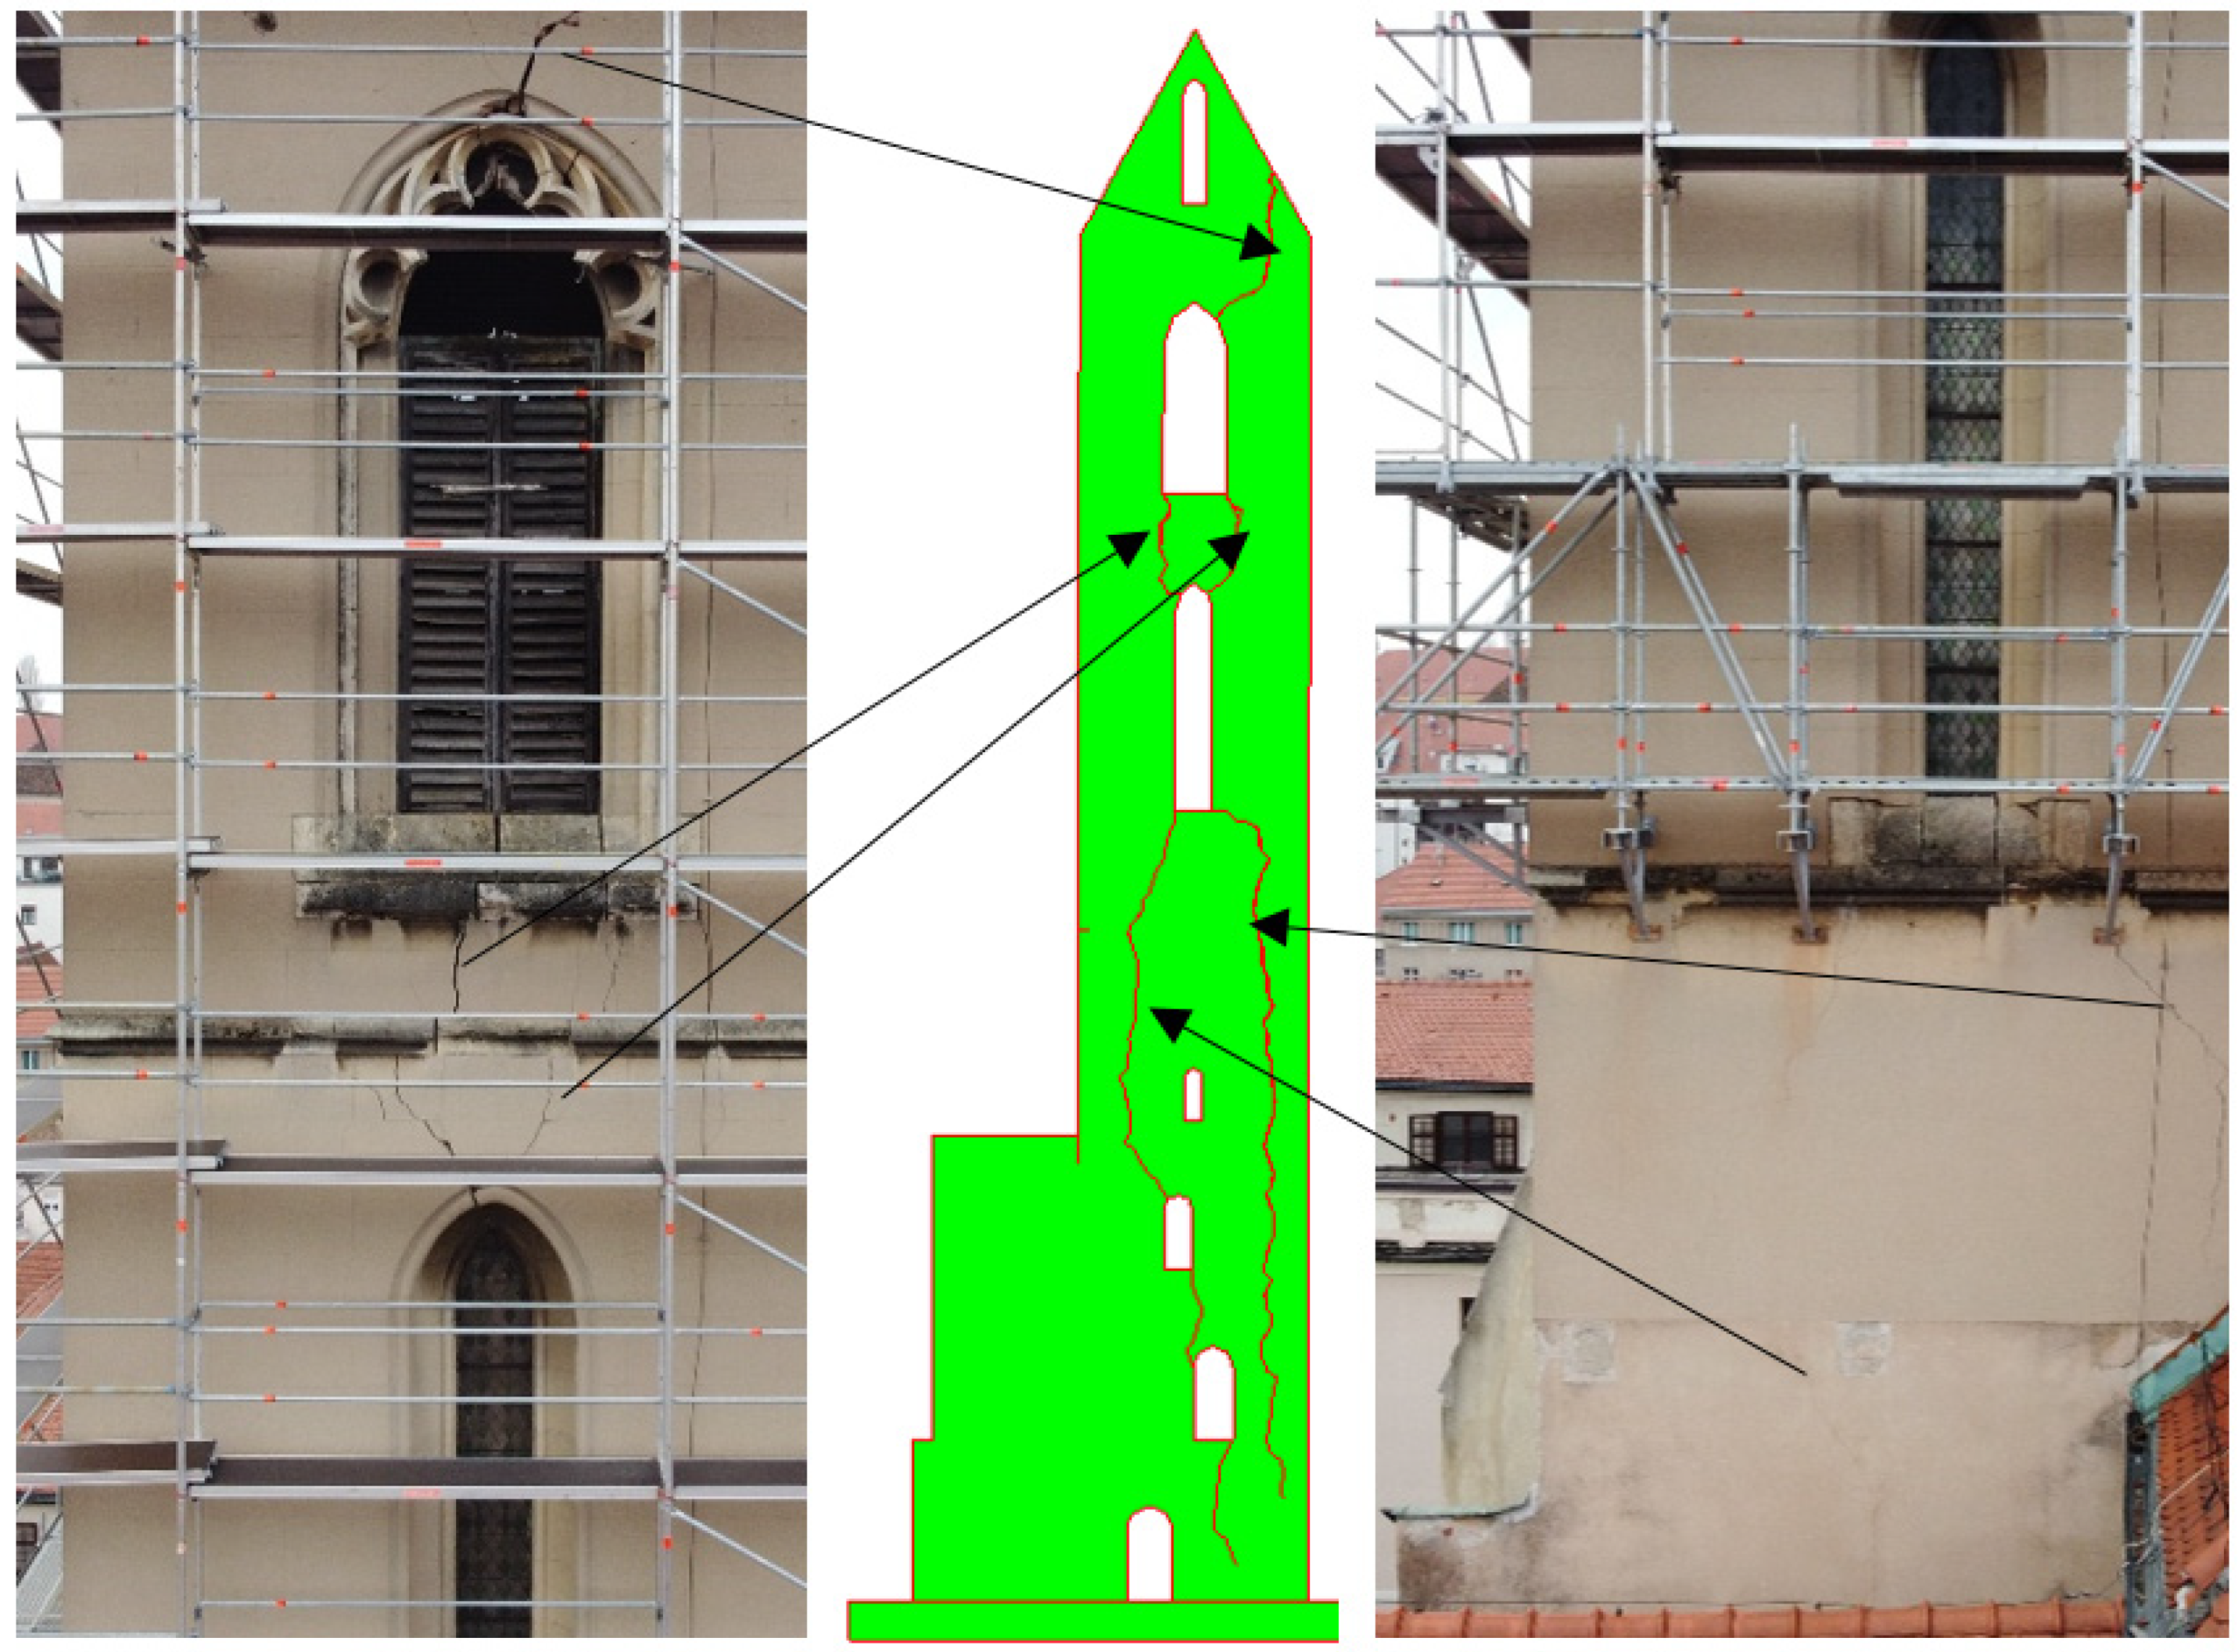
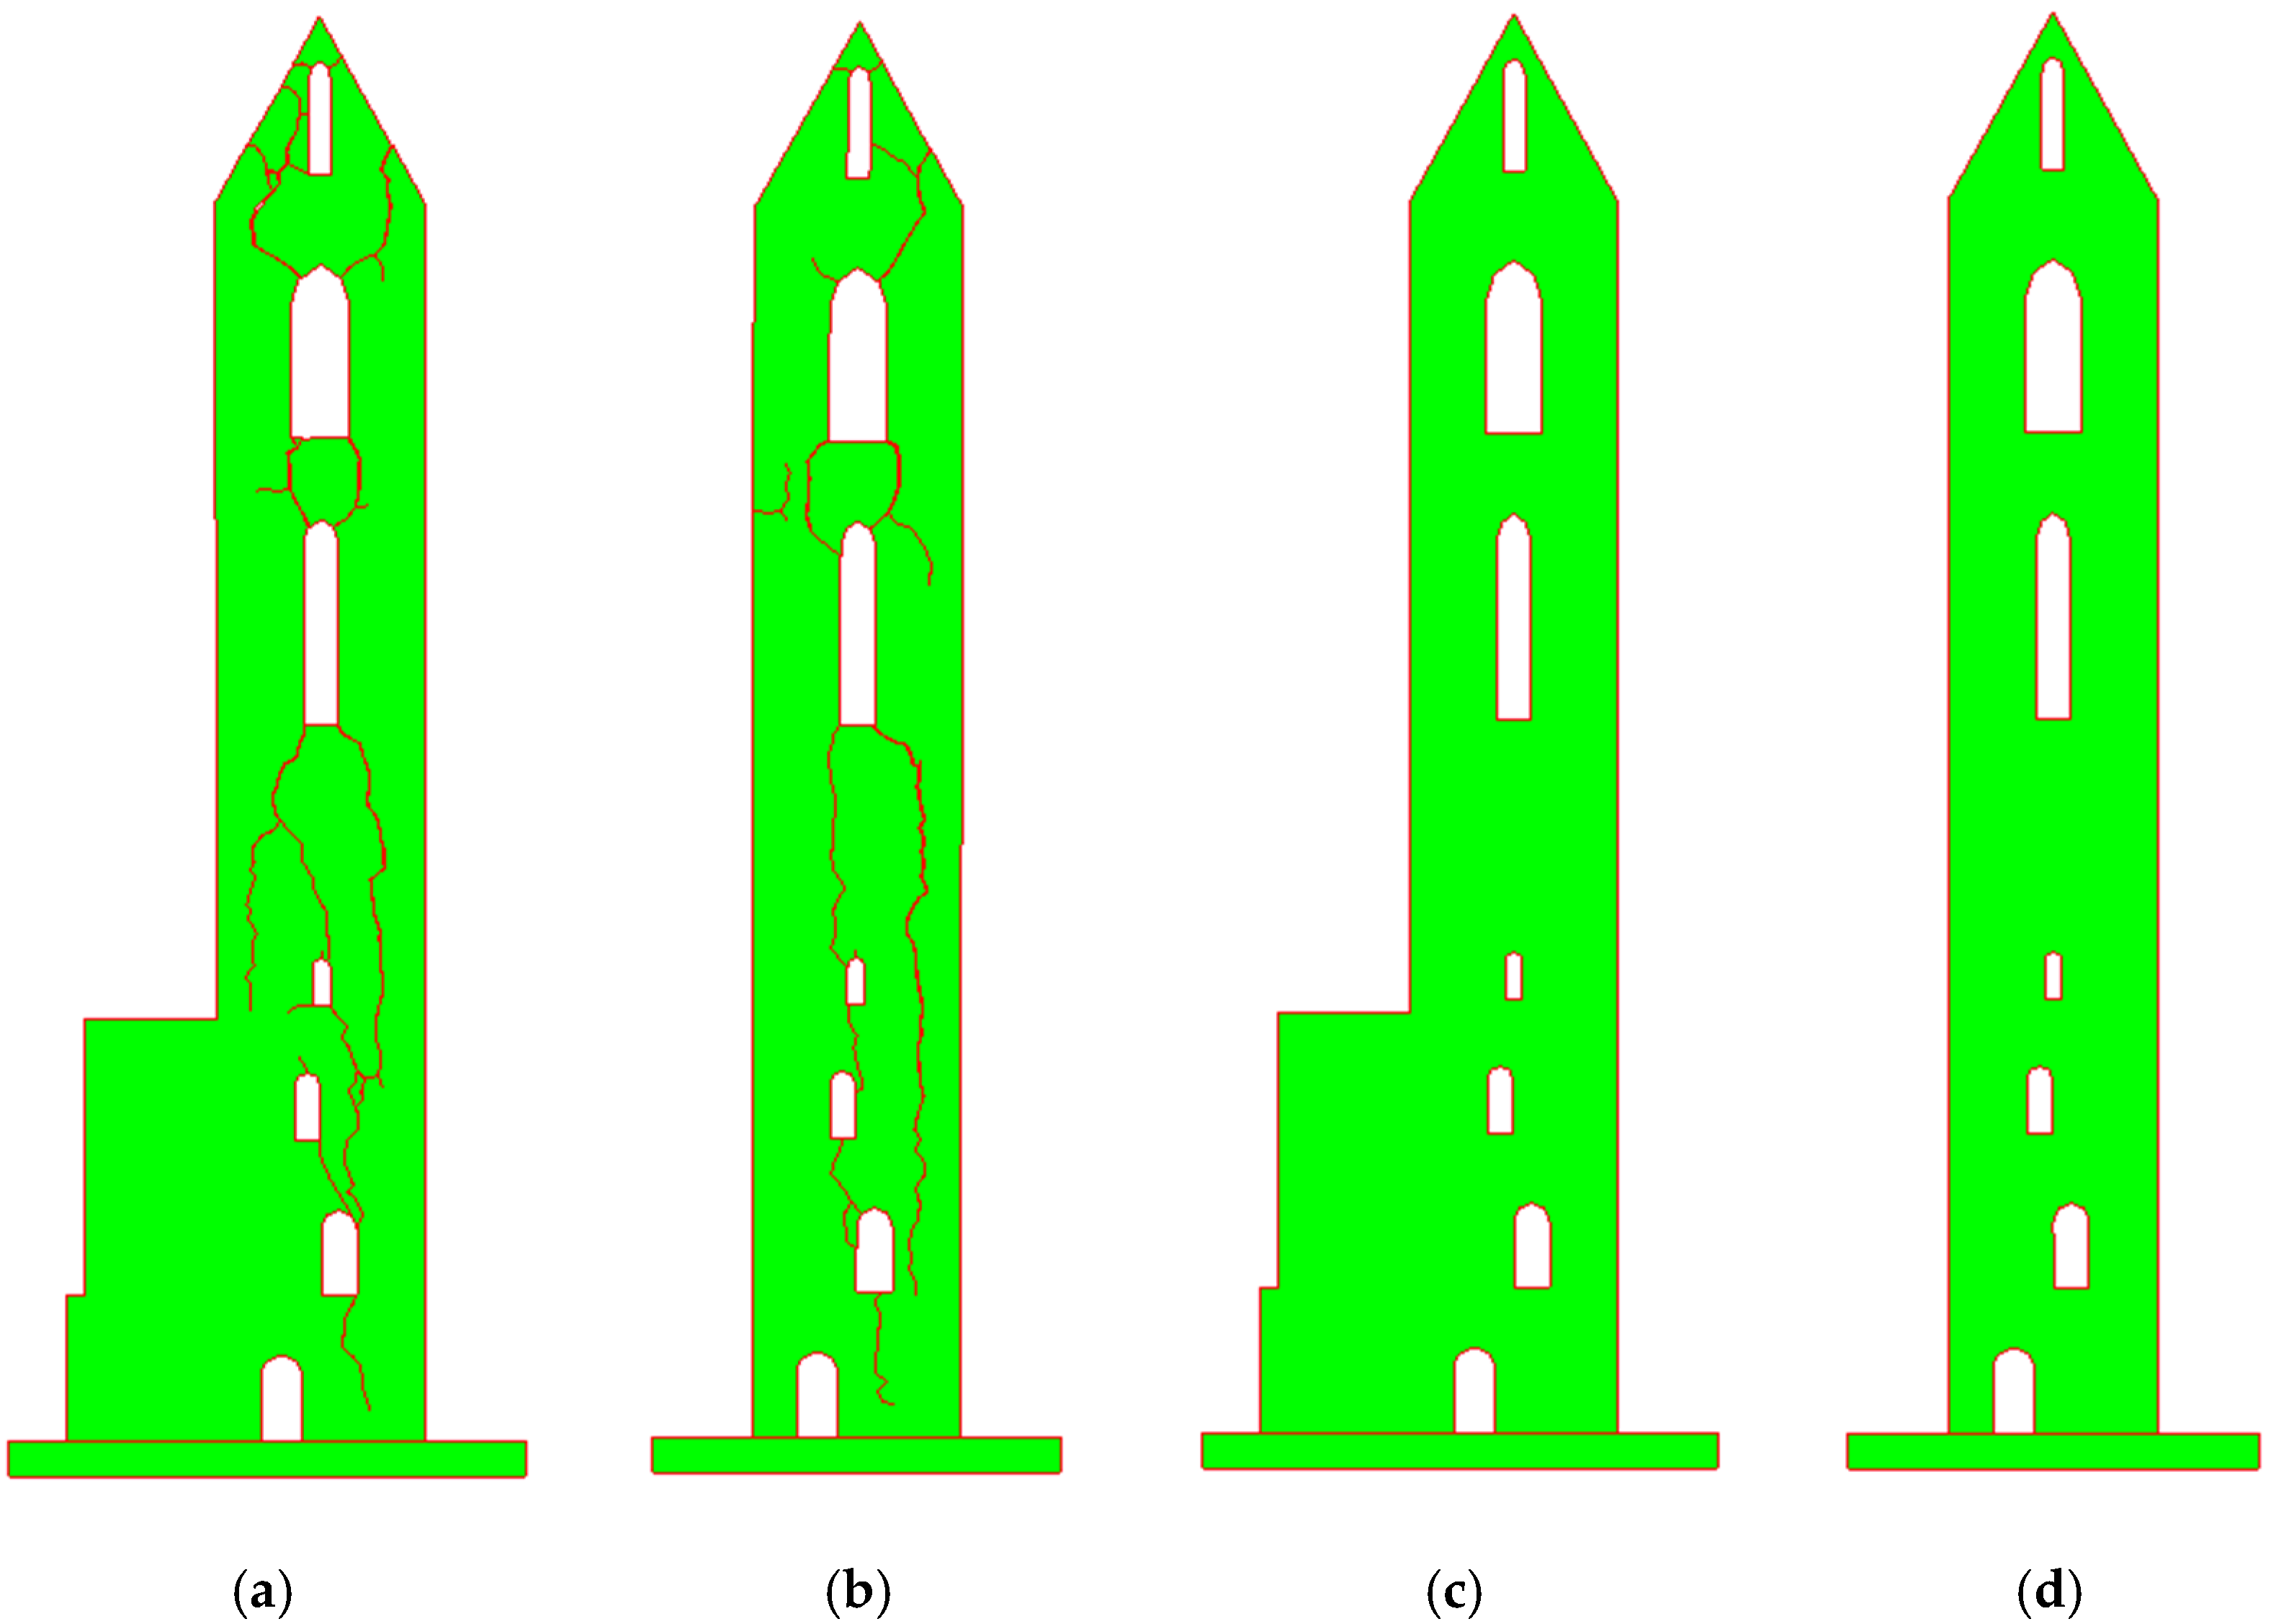
  • The comparison of the crack pattern obtained with the numerical model and the ones which occurred on the bell tower during the earthquake in Zagreb on 22 March 2020 confirms that the adopted numerical model, based on the combined finite-discrete element method, is suitable for analysing the dynamic response of this and similar structures due to seismic activity.
  • Very good matching of the crack pattern in the numerical model and on the actual structure confirms that the proposed modelling approach, which is based on the macro scale approach, is reliable enough to estimate the seismic resistance of this and similar structures. This finding may be significant since the macroscale approach is computationally very efficient for analysing the real-scale structure unlike the micro- and simplified microscale approach.
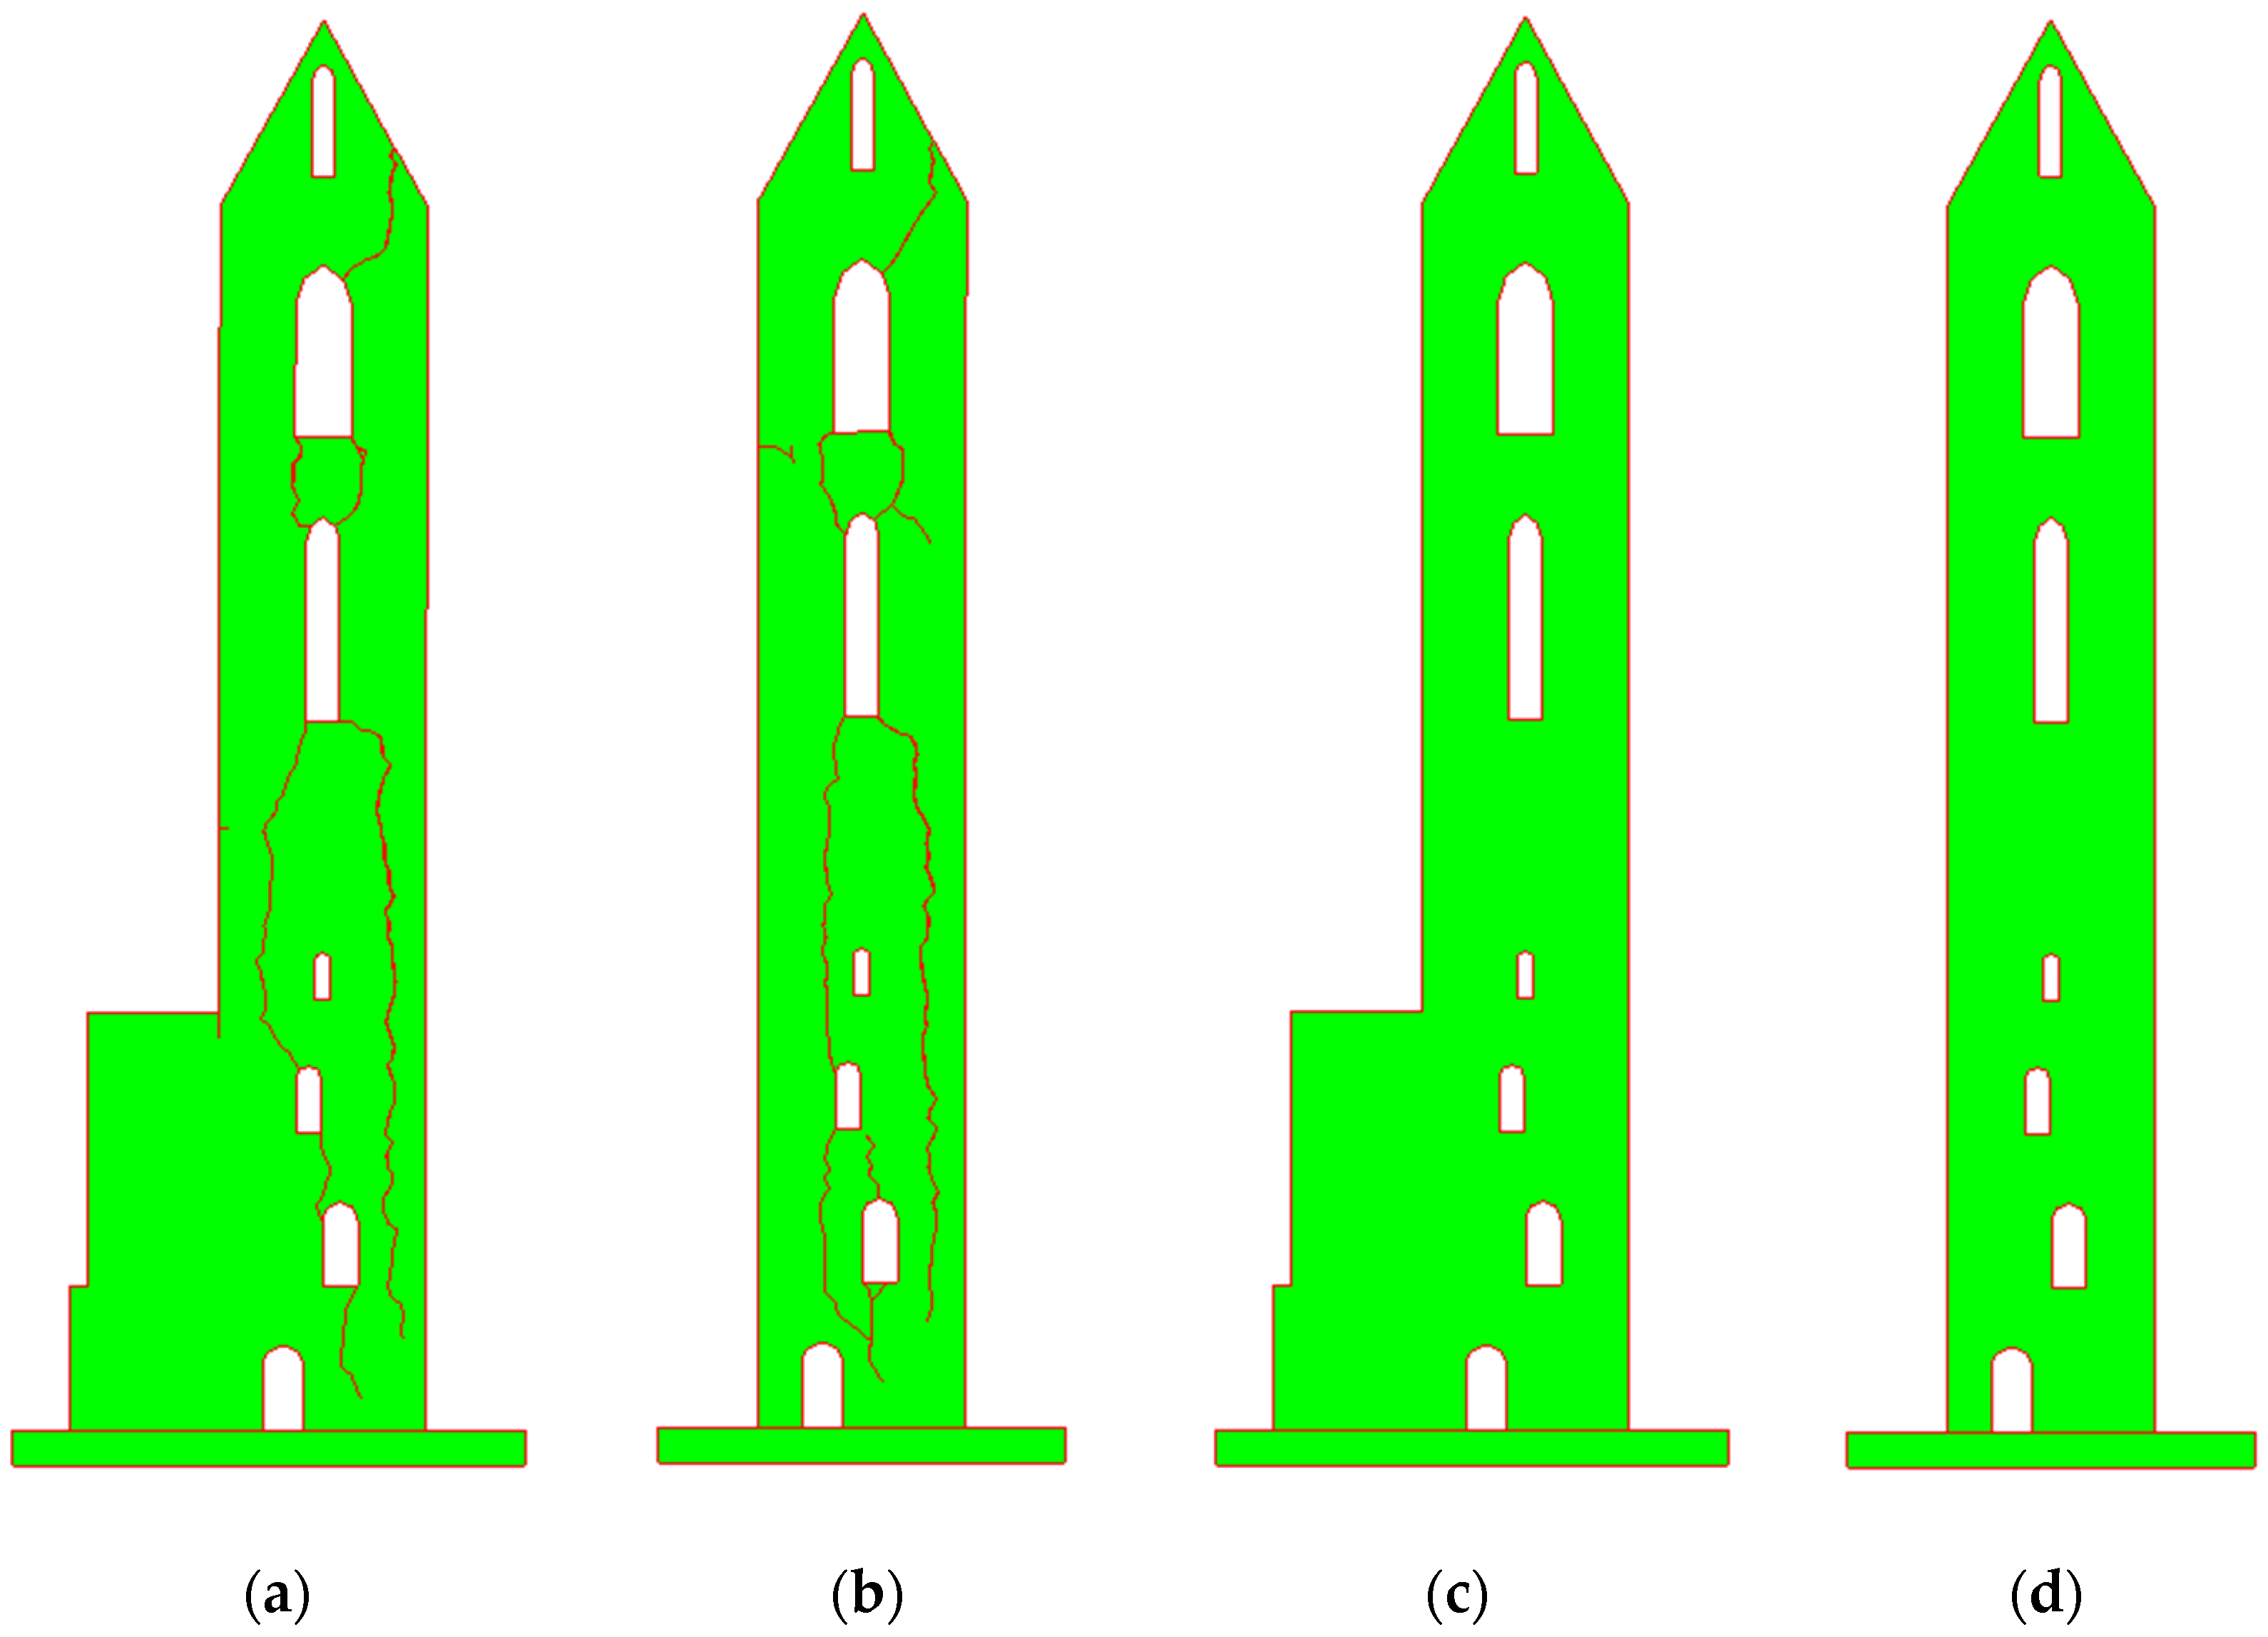
  • The bell tower, with the corresponding geometry and assumed material properties, did not have the appropriate level of mechanical resistance and stability due to seismic activity as required by the technical regulations for building structures. This conclusion suggests the need to check the mechanical resistance and stability of similar structures that are expected to be exposed to seismic activity.
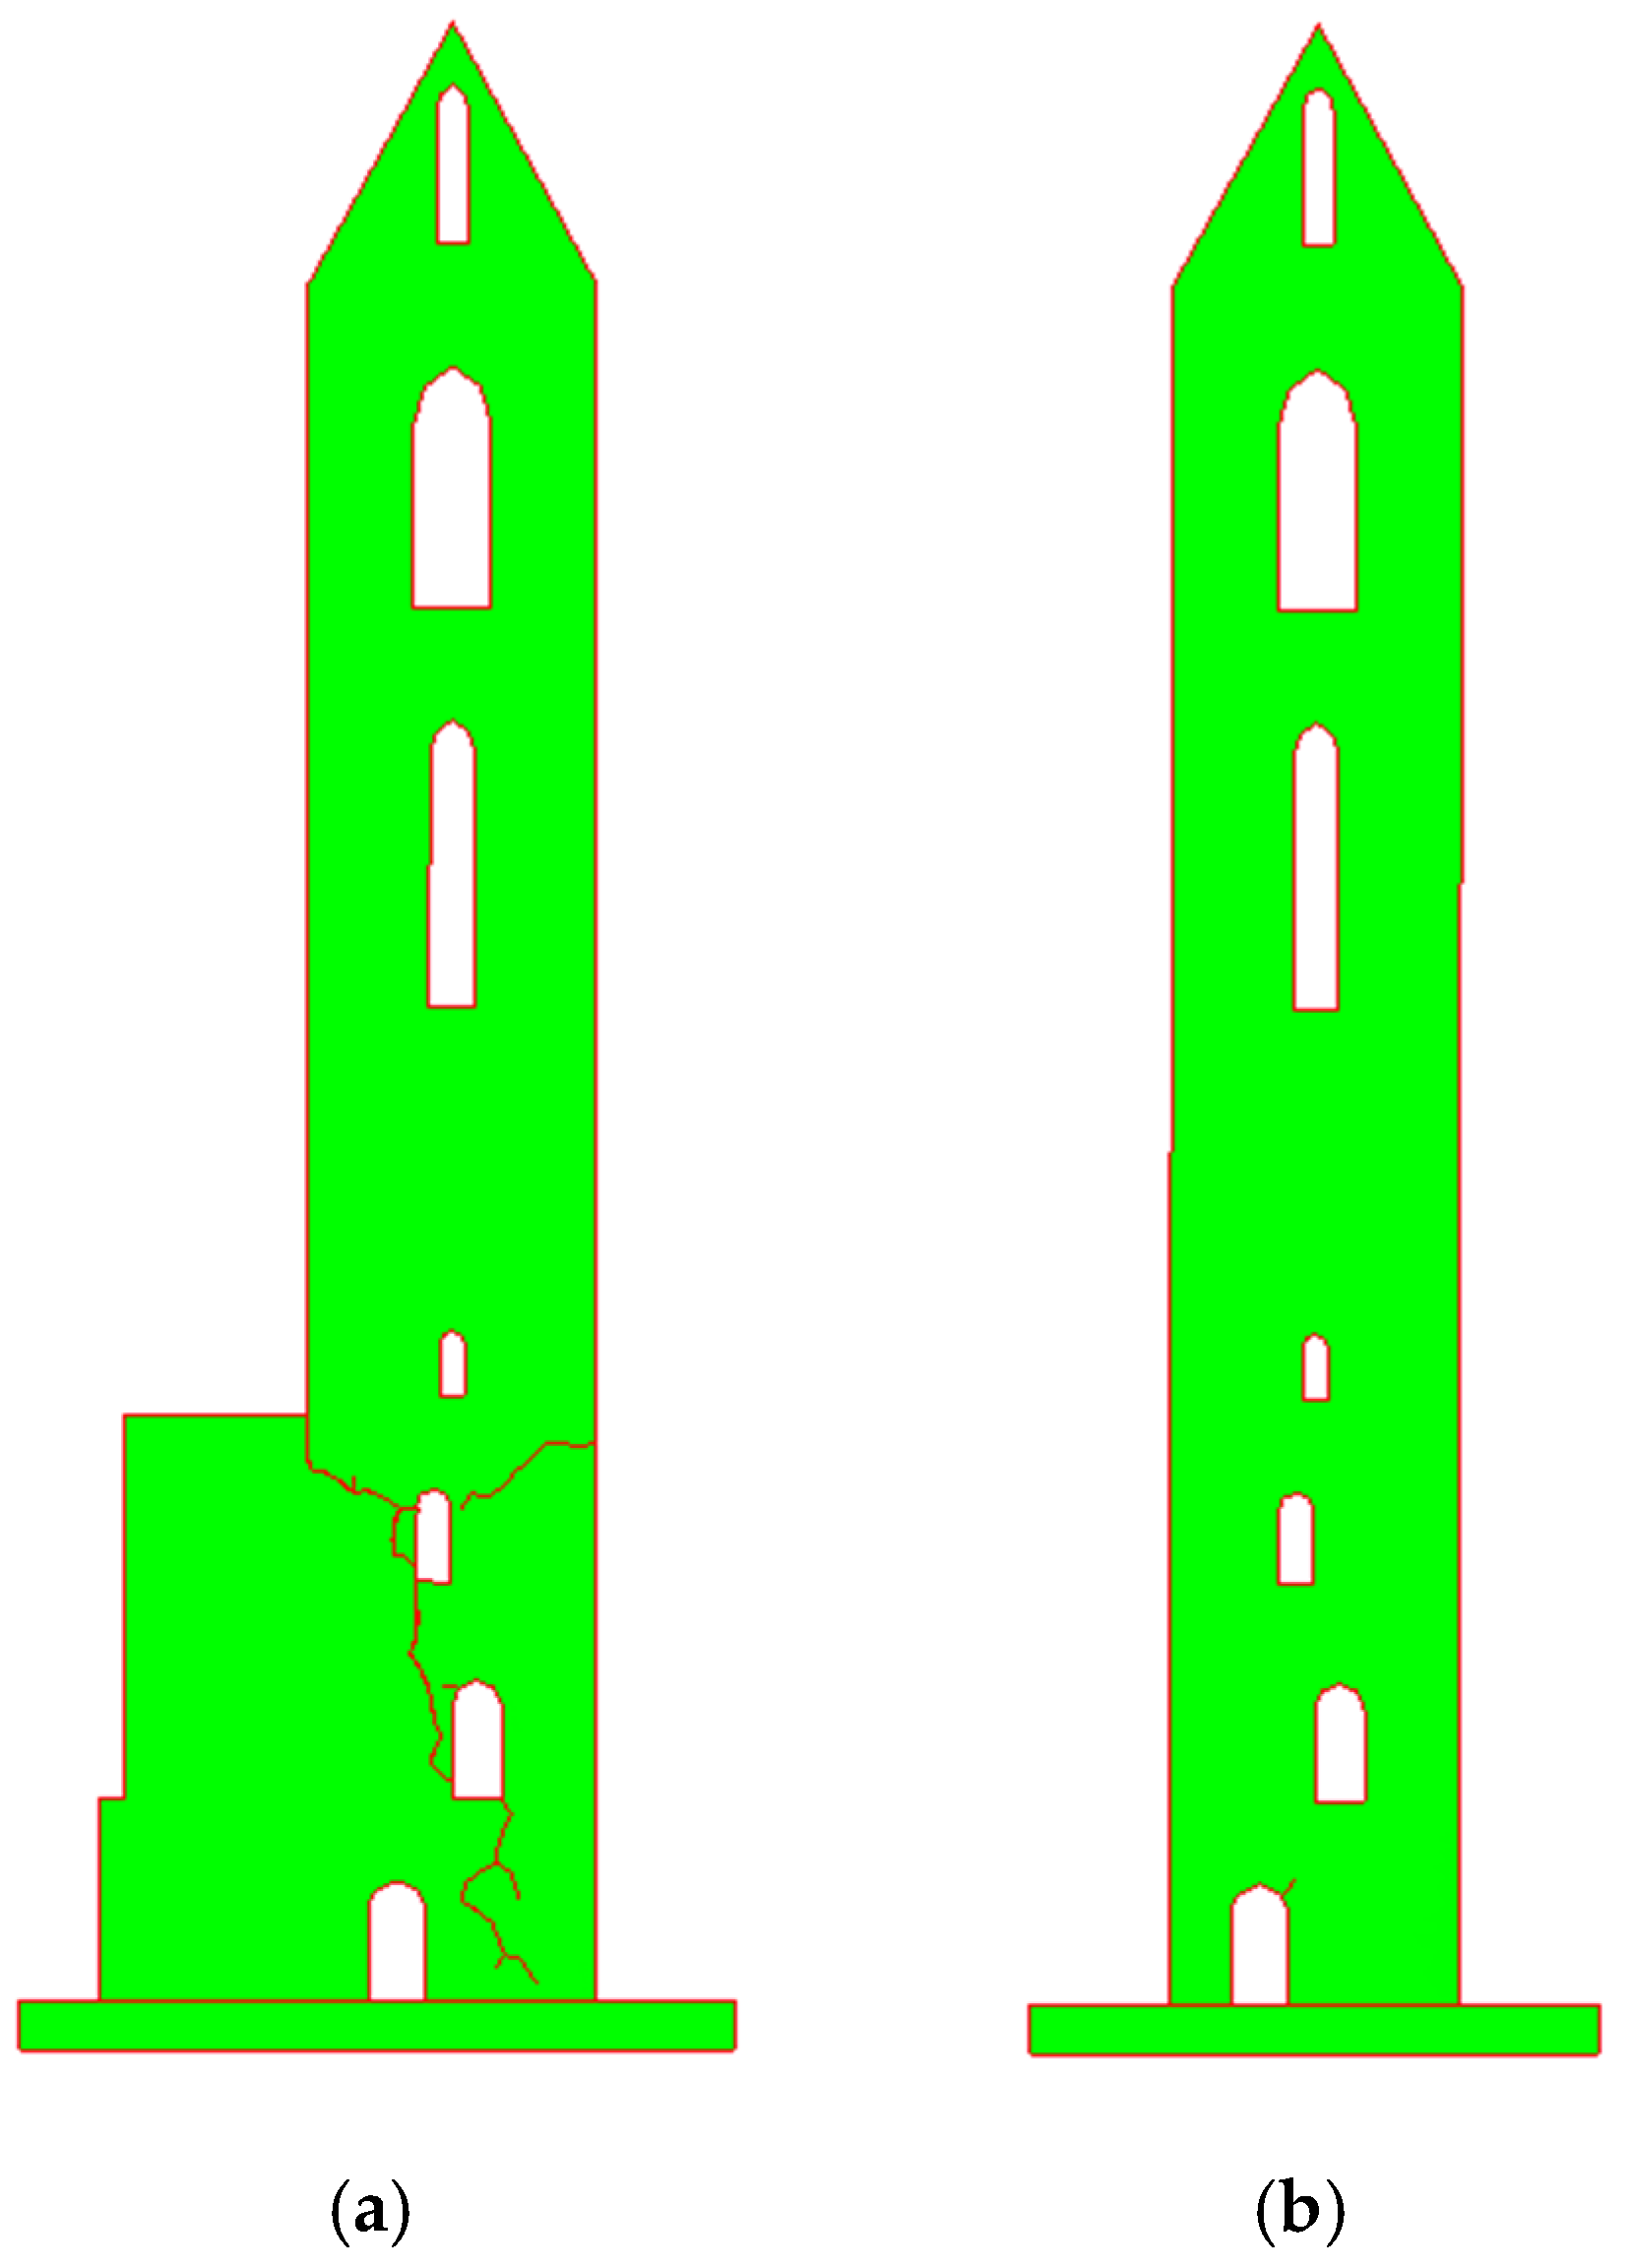
  • The proposed recovery of the structure, which consists of 10 cm of reinforced sprayed concrete on the inside of the bell tower walls and the installation of carbon fabric on the outside of the bell tower walls, can achieve the required level of mechanical resistance and stability of the bell tower. This type of reconstruction could be considered suitable for similar structures, however, additional numerical analyses are required to make a more general conclusion.
  • The bell tower, which would be completely detached from the structure but with the existing material properties, also does not have a sufficient level of mechanical resistance and stability to seismic activity.
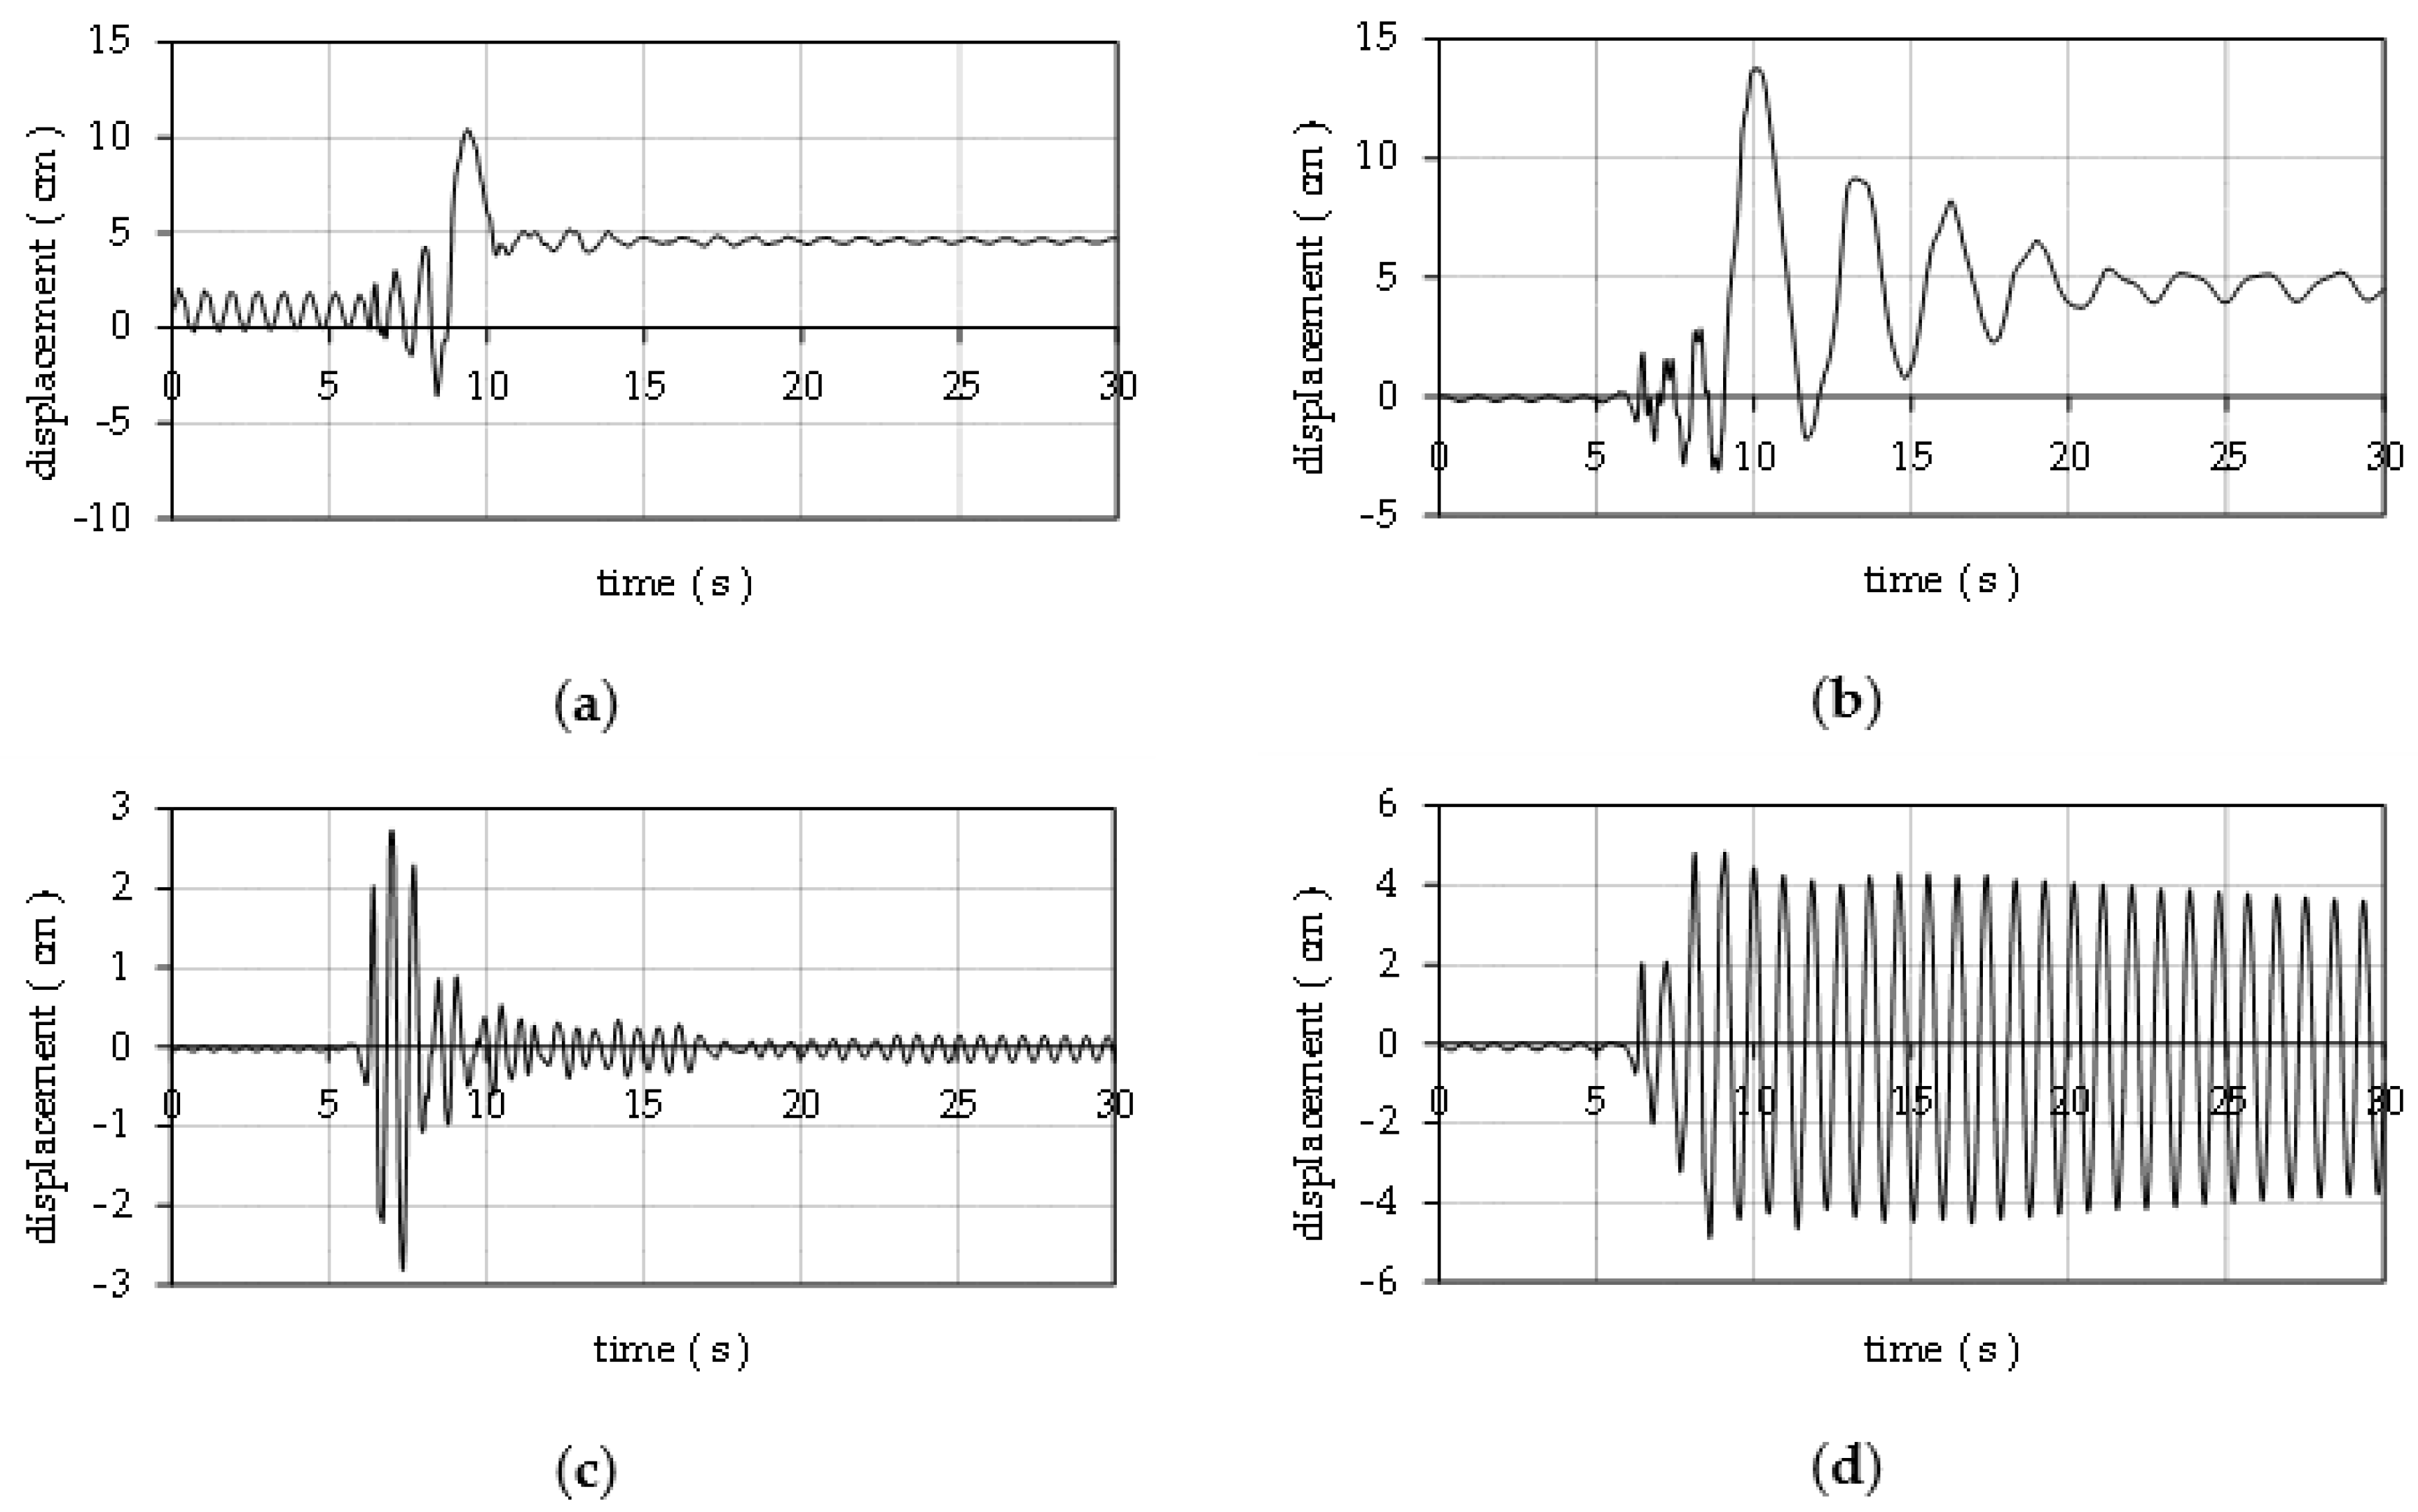
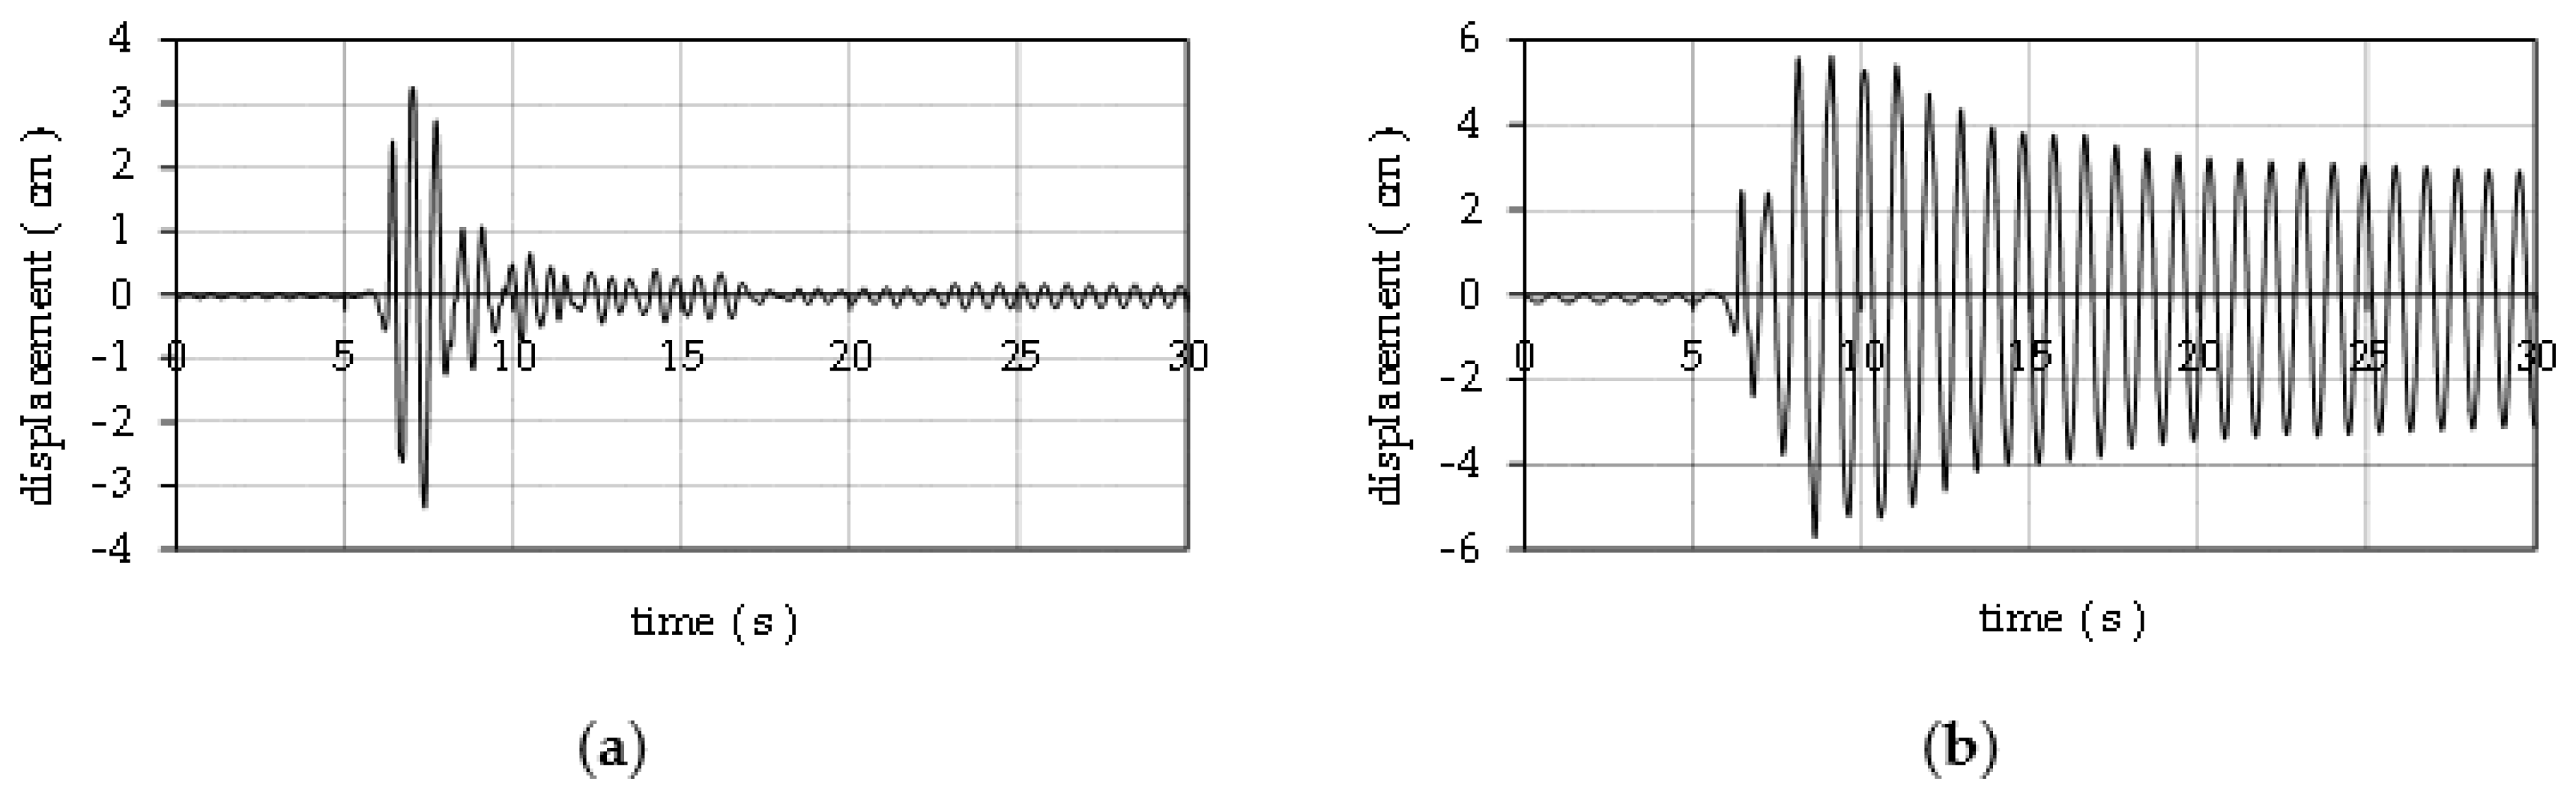
  • A completely detached, free-standing bell tower, with improved material properties after the proposed reconstruction, shows greater mechanical stability and resistance compared to the bell tower horizontally supported by the surrounding structure. This is because in this case the seismic energy introduced into the tower is mainly converted into kinetic energy due to the rocking motion unlike a horizontally supported tower where most of the seismic energy is converted into internal potential energy.
  • For further research, it would be interesting to analyse the behaviour of the bell tower in a damaged state due to the activity of additional earthquakes and the behaviour of the bell tower with the same geometry which is made of dry-stone masonry and exposed to seismic loading.

Author Contributions

Conceptualization, H.S., I.B. and B.T.; methodology, H.S., I.B. and B.T.; software, A.M.; validation, H.S. and I.B.; formal analysis, H.S. and I.B.; investigation, H.S., I.B. and B.T.; resources, I.B. and B.T.; data curation, H.S., I.B. and B.T.; writing—original draft preparation, H.S. and I.B.; writing—review and editing, H.S. and I.B.; visualization, H.S., I.B. and B.T.; supervision, A.M.; project administration, B.T.; funding acquisition, B.T. All authors have read and agreed to the published version of the manuscript.

Funding

This research received no external funding.

Data Availability Statement

The authors confirm that the data supporting the findings of this study are available within the article.

Acknowledgments

This research is partially supported through the project KK.01.1.1.02.0027, which is co-financed by the Croatian Government and the European Union through the European Regional Development Fund—the Competitiveness and Cohesion Operational Programme. The authors gratefully acknowledge the Seismological Survey, Department of Geophysics of the Faculty of Science, University of Zagreb for the accelerogram of the Zagreb earthquake.

Conflicts of Interest

The authors declare no conflict of interest.

References

  1. Ruggieri, S.; Tosto, C.; Rosati, G.; Uva, G.; Ferro, G.A. Seismic Vulnerability Analysis of Masonry Churches in Piemonte after 2003 Valle Scrivia Earthquake: Post-event Screening and Situation 17 Years Later. Int. J. Archit. Herit. 2020, 1–29. [Google Scholar] [CrossRef]
  2. Šodan, M.; Trogrlić, B.; Foretić, D.; Munjiza, A.; Balić, I.; Smoljanović, H. FDEM failure analysis: Bell tower of church of St. Francis of Assisi on Kaptol in Zagreb. In Proceedings of the 1st Croatian Conference on Earthquake Engineering—1CroCEE, Zagreb, Croatia, 22–24 March 2021; Lakusic, S., Atalic, J., Eds.; University of Zagreb, Faculty of Civil Engineering: Zagreb, Croatia, 2021; pp. 1569–1577. [Google Scholar]
  3. Peña, F.; Lourenço, P.B.; Mendes, N.; Oliveira, D.V. Numerical models for the seismic assessment of an old masonry tower. Eng. Struct. 2010, 32, 1466–1478. [Google Scholar] [CrossRef] [Green Version]
  4. Preciado, A. Seismic vulnerability and failure modes simulation of ancient masonry towers by validated virtual finite element models. Eng. Fail. Anal. 2015, 57, 72–87. [Google Scholar] [CrossRef]
  5. Shehu, R. Preliminary Assessment of the Seismic Vulnerability of Three Inclined Bell-towers in Ferrara, Italy. Int. J. Archit. Herit. 2020, 1–33. [Google Scholar] [CrossRef]
  6. Standoli, G.; Giordano, E.; Milani, G.; Clementi, F. Model Updating of Historical Belfries Based on Oma Identification Techniques. Int. J. Archit. Herit. 2021, 15, 132–156. [Google Scholar] [CrossRef]
  7. Ubertini, F.; Cavalagli, N.; Kita, A.; Comanducci, G. Assessment of a monumental masonry bell-tower after 2016 Central Italy seismic sequence by long-term SHM. Bull. Earthq. Eng. 2018, 16, 775–801. [Google Scholar] [CrossRef]
  8. Torelli, G.; D’Ayala, D.; Betti, M.; Bartoli, G. Analytical and numerical seismic assessment of heritage masonry towers. Bull. Earthq. Eng. 2020, 18, 969–1008. [Google Scholar] [CrossRef] [Green Version]
  9. Casolo, S.; Diana, V.; Uva, G. Influence of soil deformability on the seismic response of a masonry tower. Bull. Earthq. Eng. 2017, 15, 1991–2014. [Google Scholar] [CrossRef]
  10. Milani, G.; Casolo, S.; Naliato, A.; Tralli, A. Seismic Assessment of a Medieval Masonry Tower in Northern Italy by Limit, Nonlinear Static, and Full Dynamic Analyses. Int. J. Archit. Herit. 2012, 6, 489–524. [Google Scholar] [CrossRef]
  11. Casolo, S. A three-dimensional model for vulnerability analysis of slender medieval masonry towers. J. Earthq. Eng. 1998, 2, 487–512. [Google Scholar] [CrossRef]
  12. Casolo, S.; Milani, G.; Uva, G.; Alessandri, C. Comparative seismic vulnerability analysis on ten masonry towers in the coastal Po Valley in Italy. Eng. Struct. 2013, 49, 465–490. [Google Scholar] [CrossRef]
  13. Facchini, L.; Betti, M. Time-history analysis of slender masonry towers: A parametric study on the reliability of a simplified Bouc and Wen approach. Meccanica 2017, 52, 3181–3196. [Google Scholar] [CrossRef]
  14. Makris, N.; Alexakis, H. Limit equilibrium analysis of masonry buttresses and towers under lateral and gravity loads. Arch. Appl. Mech. 2015, 85, 1915–1940. [Google Scholar] [CrossRef]
  15. Munjiza, A. The Combined Finite-Discrete Element Method; John Wiley & Sons: Oxford, UK, 2004. [Google Scholar]
  16. Munjiza, A.; Knight, E.E.; Rouiger, E. Computational Mechanics of Discontinua; John Wiley & Sons: Oxford, UK, 2012. [Google Scholar]
  17. Munjiza, A.; Andrews, K.R.F. NBS contact detection algorithm for bodies of similar size. Int. J. Numer. Methods Eng. 1998, 43, 131–149. [Google Scholar] [CrossRef]
  18. Munjiza, A.; Andrews, K.R.F. Penalty function method for combined finite-discrete element system comprising large number of separate bodies. Int. J. Numer. Methods Eng. 2000, 49, 1377–1396. [Google Scholar] [CrossRef]
  19. Munjiza, A.; Andrews, K.R.F.; White, J.K. Combined single and smeared crack model in combined finite-discrete element method. Int. J. Numer. Methods Eng. 1999, 44, 41–57. [Google Scholar] [CrossRef]
  20. Munjiza, A.; John, N.W.M. Mesh size sensitivity of the combined FEM/DEM fracture and fragmentation algorithms. Eng. Fract. Mech. 2002, 69, 281–295. [Google Scholar] [CrossRef]
  21. Smoljanović, H.; Nikolić, Ž.; Živaljić, N. A combined finite-discrete numerical model for analysis of masonry structures. Eng. Fract. Mech. 2015, 136, 1–14. [Google Scholar] [CrossRef]
  22. Smoljanović, H.; Balić, I.; Trogrlić, B. Stability of regular stone walls under in-plane seismic loading. Acta Mech. 2015, 226, 1881–1896. [Google Scholar] [CrossRef]
  23. Balić, I.; Živaljić, N.; Smoljanović, H.; Trogrlić, B. Seismic resistance of dry stone arches under in-plane seismic loading. Struct. Eng. Mech. 2016, 58, 243–257. [Google Scholar] [CrossRef]
  24. Smoljanović, H.; Živaljić, N.; Nikolić, Ž.; Munjiza, A. Numerical analysis of 3D dry-stone masonry structures by combined finite-discrete element method. Int. J. Sol. Struct. 2018, 136–137, 150–167. [Google Scholar] [CrossRef]
  25. Munjiza, A.; Smoljanović, H.; Živaljić, N.; Mihanović, A.; Divić, V.; Uzelac, I.; Nikolić, Ž.; Balić, I.; Trogrlić, B. Structural applications of the combined finite-discrete element method. Comp. Part. Mech. 2020, 7, 1029–1046. [Google Scholar] [CrossRef]
  26. Xiang, J.; Munjiza, A.; Latham, J.P.; Guises, R. On the validation of DEM and FEM/DEM models in 2D and 3D. Eng. Comp. 2009, 26, 673–687. [Google Scholar] [CrossRef]
  27. Hillerborg, A.; Modeer, M.; Petersson, P.E. Analysis of crack formation and crack growth in concrete by means of fracture mechanics and finite elements. Cement Concrete Res. 1976, 6, 773–782. [Google Scholar] [CrossRef]
  28. Čopec, D. Restoration Intervention of Herman Bollé at the Franciscan Church on Kaptol in Zagreb. Master’s Thesis, Faculty of Civil Engineering, University of Zagreb, Zagreb, Croatia, 2014. (In Croatian). [Google Scholar]
  29. Foretić, D.; Foretić, I.; Foretić, F. A Snapshot of the Current Condition of the Franciscan Monastery—Map I; Foretić and Sons: Dugo Selo, Croatia, 2020. (In Croatian) [Google Scholar]
  30. Foretić, D.; Foretić, I.; Foretić, F. Franciscan Monastery Kaptol—Restoration Plan and Program; Foretić and Sons: Dugo Selo, Croatia, 2020. (In Croatian) [Google Scholar]
  31. Clementi, F.; Quagliarini, E.; Monni, F.; Giordano, E.; Lenci, S. Cultural Heritage and Earthquake: The Case Study of “Santa Maria Della Carità” in Ascoli Piceno. Open Civ. Eng. J. 2017, 11, 1079–1105. [Google Scholar] [CrossRef]
  32. Uroš, M.; Todorić, M.; Crnogorac, M.; Atalić, J.; Šavor Novak, M.; Lakušić, S. Earthquake Engineering—Renovation of Masonry Buildings; Faculty of Civil Engineering, University of Zagreb: Zagreb, Croatia, 2021. (In Croatian) [Google Scholar]
Figure 1. The bell tower of the church of St. Francis of Assisi on Kaptol in Zagreb: (a) bell tower in 2020; (b) some damage on the bell tower after earthquake 2020.
Buildings 11 00373 g001
Figure 2. Discretisation of the structure.
Buildings 11 00373 g002
Figure 3. Triangular finite element in initial and current configuration.
Buildings 11 00373 g003
Figure 4. Contact force due to an infinitesimal overlap around points Pt and Pc.
Buildings 11 00373 g004
Figure 5. (a) Normal spring; (b) strain softening defined in terms of displacement; (c) shear spring.
Buildings 11 00373 g005
Figure 6. The geometrical characteristics of the tower: (a) height disposition and section marks; (b) plan of the bell tower on the ground floor of the monastery—Section 1; (c) plan of the bell tower on the first floor of the monastery—Section 2; (d) plan of the bell tower on the second floor of the monastery—Section 3; (e) plan of the bell tower on the higher floors—Section 4.
Buildings 11 00373 g006
Figure 7. The cracks in the bell tower after the Zagreb earthquake on March 2020: (a) cracks in the east front wall; (b) the collapse of the lintel at the height of +27.26 m on the east wall; (c) characteristic cracks and damage of the lintel on the east wall; (d) characteristic cracks and damage to the lintel on the west front wall.
Buildings 11 00373 g007
Figure 8. The bell tower: (a) geometry of models M1 an M3; (b) geometry of models M2 and M4; (c) finite element mesh of models M1 an M3; (d) finite element mesh of models M2 an M4.
Buildings 11 00373 g008
Figure 9. Accelerograms of the earthquake in Zagreb recorded on 22 March 2020: (a) horizontal north-south direction; (b) vertical direction.
Buildings 11 00373 g009
Figure 10. Comparison of cracks on the bell tower and on the numerical model.
Buildings 11 00373 g010
Figure 11. Crack pattern for acceleration (agr.max. = 0.216 g) on the numerical model: (a) M1; (b) M2; (c) M3 and (d) M4.
Buildings 11 00373 g011
Figure 12. Displacement of the top of the tower under the accelerogram (agr.max. = 0.216 g) on the numerical model: (a) M1; (b) M2; (c) M3 and (d) M4.
Buildings 11 00373 g012
Figure 13. Crack pattern for acceleration (agr.max. = 0.26 g) on the numerical model: (a) M1; (b) M2; (c) M3 and (d) M4.
Buildings 11 00373 g013
Figure 14. Displacement of the top of the tower under the accelerogram (agr.max. = 0.26 g) on the numerical model: (a) M3 and (b) M4.
Buildings 11 00373 g014
Figure 15. Crack pattern for acceleration (agr.max. = 0.4 g) on the numerical model: (a) M3; (b) M4.
Buildings 11 00373 g015
Table 1. Mechanical characteristics of the materials used for rehabilitation.
Material PropertiesMortarCarbonSteel
Modulus of elasticity, Ec (MPa)30,000210,000210,000
Tensile strength, ft (MPa)2.53850500
Shear strength, fs (MPa)5.0--
Table 2. Adopted mechanical characteristics of the masonry.
Material PropertiesP1P2
Modulus of elasticity, Ec (MPa)22503584
Poisson’s ratio, ν0.30.3
0.670
Tensile strength, ft (MPa)0.270.67
Shear strength, fs (MPa)1.081.7
Fracture energy in tension Gf,t (N/m)3590
Fracture energy in shear Gf,s (N/m)140240
Unit mass, ρ (kg/m3)18001800
Table 3. Numerical models used in the analysis.
Numerical ModelGeometryMaterial Properties
M1G1 (horizontally supported with the walls)P1 (current properties before damage)
M2G2 (free tower resting on the base)P1 (current properties before damage)
M3G1 (horizontally supported with the walls)P2 (properties after structural repair)
M4G2 (free tower resting on the base)P2 (properties after structural repair)
Publisher’s Note: MDPI stays neutral with regard to jurisdictional claims in published maps and institutional affiliations.

