Abstract
Mixed-use development is increasingly popular in land use planning and zoning, fostering a combination of residential, commercial, and cultural uses into one space. However, there is a lack of understanding of the vertical mix office space within a high-rise commercial building and the dynamics of the industry mix between buildings. This paper examines the spatiotemporal patterns of industry mix between and within office buildings in Sydney CBD from 2006 to 2017, using the data obtained from the City of Sydney floor space and employment surveys. This is the first study that identifies the dynamics of an industrial ecosystem in central Sydney, which has transformed to homophily land blocks, with increasing vertically heterogeneous office buildings, over the past decade. In addition, the study found that the significant clustering of anchor tenants, such as finances, hospitalities, and knowledge-based industries, are apparent.
1. Introduction
Changing industry structure in cities shows the city’s competitiveness and productivity. For instance, the death of specific industries (e.g., labour-intensive manufacturing) resulted in declining post-industrial cities in the USA, UK, and Australia; additionally, the emergence of technological innovations, including artificial intelligence (AI), rapidly replaces conventional jobs with automated and specialised jobs.
Some economic geographers interpreted the changing industry structure within the broader context of agglomeration economy and the comparative advantage of one industry. They defined it as an industrial ecosystem in which dynamic interactions among industrial actors and exogenous forces, cause relational structures to evolve and, in the long term, it is adjustable to the industry system’s sustainability [1].
The evolving industrial ecosystem affects industry structure in certain regions, as well as land use patterns and zoning in cities and, thus, mixed-use within buildings. The industry clustering strategy in a region (e.g., Silicon Valley) has been criticised as more vulnerable to a global recession, such as the ‘dot-com bubble’ in the USA [2]. However, almost all studies in the industrial ecosystem focus on patterns of horizontal land use or industrial mix in certain regions or precincts. There is limited understanding of vertical mixed-use within high-rise buildings, such as office buildings, particularly in CBDs, where skyscrapers are built on highly valuable and constrained land. The industrial ecosystem represents how companies operate and interact with each other, within available production factors, such as natural resources, labour, capital, and infrastructure, to meet the supply needs [3]. As such, companies within an office building can be regarded as the basic units of the industry structure analysis, as the existence of related industries and institutions, within certain office buildings, share their recourses, such as labour pooling, shared building services and facilities, and transportation infrastructure.
In Sydney CBD, Australia, the mixed-use planning has already improved productivity and liveability, which attracts not only businesses, but also residents and visitors to a range of offices, hotels, residential towers, cultural amenities, and retail options. However, the latest [4] revisited the urban mix strategy in central Sydney, in response to current and future challenges with continuously growing residentially favoured market forces, at the expense of employment office floor space for future economic activities. Therefore, it is crucial to understand which industries play as the anchor-tenant (in pulling other industries into high-rise buildings). The classic example of an anchor-tenant is large department stores in suburban shopping malls, which have broad appeal and draw significant traffic and visitors to the centre and shops [5]. Hawken and Han [6] first used the 2011 Sydney floor space data of the City of Sydney to analyse the industrial ecosystem. However, the study was limited to a static view, at a specific time, without considering the changes over time. The critical question remains: ‘do the industry mix patterns of land blocks (horizontal) and buildings (vertical) in central Sydney become more homophily or heterogeneous over time?’
This paper identifies the vertical and horizontal industry mix patterns by analysing building floor space data in central Sydney and floorspace use changes over time.
2. Literature Review
2.1. Mixed-Use Planning
The concept of mixed-use emerged, alongside sceptical thinking, against the functionalism notion of modernised urban planning. By the 1950s, zoning policies were popular and widely applied in American cities to separate uses [7]. In 1961, Jane Jacobs [8] critiqued urban planning strategies in her most influential book, The Death and Life of Great American Cities. She argued that zoning laws were to blame for isolated, lifeless urban spaces and communities. To recreate vibrant and lively cities, Jacob advocated a fine grain mixed-use to ensure a diversity of activities on the streets, small blocks, and diverse buildings. Her research also found that mixed-use planning is useful to design human-scale urban spaces.
By the 1990s, the concept of mixed-use planning became one of the community design principles of new urbanism, the compact city ideal, and sustainable development [9,10]. Hendrigan and Newman [11] also illustrated that mixed-use planning can reduce travel distances between workplaces and residences, reducing car dependency. Shim et al. [12] emphasised that mixed-use development minimises urban sprawl by using available land with a combination of residential, retail, and offices. However, there is less academic literature on vertical mixed-use within buildings [13]. Additional recent research has studied high-rise, mixed-use office buildings. Liusman [14] investigated the relationship between office rentals and mixed-use development, in a case study on observations in 100 Grade-A office buildings in Hong Kong. This study found the existence of agglomeration economies in mixed-use office buildings, as well as a self-amplifying process; the increasing diversity of mixed-use development encourages more investment in an office building. In addition, Mualam et al. [15] also provided meaningful insights into the strategy of a public–private mix of use within buildings in Isreal and indicated this mix contributed to social wellbeing.
Planners and developers advocated mixed-use development as a planning strategy in practice [16]. In many cases, mixed-use development is integrated with planning strategies, such as the compact city model, transit-oriented development (TOD), and public-private partnerships (PPP), which provide urban amenities and services, as well as economic and social value [17]. The examples include European mixed-use policies integrating commercial, residential, and public amenity use to replicate the success of the traditional European compact urban form and the attractiveness of European townscapes [18]; North American planning policies have implemented mixed-use zoning to overcome problems of edge cities and car dependency [19].
Coupland [20] explored the mechanisms of practical mixed-use planning approaches and showed that mixed-use planning promotes vitality and vibrant urban centres by generating and concentrating diverse activities. Oslo, in Norway, provided a framework for an integrated mixed-use urban development that applies mixed-use planning tools in major hubs, which are centrally located, with public transport, accompanied by a combination of commercial and residential zones [21]. This approach provides an excellent opportunity to use public and active transport [22]. More recently, Sharmin et al. [23] developed an optimisation model for land use planners to predict alternative land use allocation, using a continuous decision variable to capture vertical growth and mixed-use development in Dhaka, Bangladesh. The optimal solutions of land use allocation are estimated by trading off land use compatibility and land price.
2.2. ‘What Mix?’ and ‘How to Mix?’
Strong support for mixed-use development has been found in many planning policies and strategies, but it has also been questioned and critiqued by scholars, who are sceptical of the role of mixed-use planning. Based on the literature, this paper addresses the limitations of the mixed-use concept and practice in urban planning: the classification of urban uses, doubt of the relationship between mixed-uses and economic productivity, different scales and settings of urban heterogeneity, and the understanding of mixed-use, given spatial heterogeneity.
Firstly, most studies classify urban uses into the five categories of office, commercial, residential, public space, and industrial uses, and then investigate the mixed-use development in cities, based on these classifications. However, the limitation is that the industry divisions that influence or impact the heterogeneity of cities are less commonly included. For instance, retail sectors tend to attract similar retail activity in urban renewal [24]. Furthermore, more detailed dimensions of the vertical mix, such as how different industries occupy the property, are less investigated, such as a high-rise office building, with the industrial mix of financial industries on upper levels and retail sectors on lower levels [25].
Secondly, studies also indicate that the process of industry mix occurs at different scales, phases, and settings [26,27]. From a macro perspective, mixed-use can exist within urban districts or neighbourhoods. From a micro point of view, mixed-use occurs within streets, blocks, or buildings. Local context is important to justify why mixed-use planning is necessary. Mixed-use planning provides appropriate land use capacity for future urban growth, differentiating locations such as urban centres, inner suburbs, or suburban edges. The dynamic processes of urban mix allow for the adjustment of the incremental changes of land uses, such as urban renewal or redevelopment.
Rodenburg and Nijkamp [28] noted that triggering a positive feedback circle is essential to the success of mixed-use development and identified two processes that could be seen as indications of a successful mix: (1) the continued increase of spatial heterogeneity over time and (2) the emergence of economies of synergy from the interaction and integration between different industries.
2.3. Anchor Tenants, Office Locations, and Heterogeneity
Some attempts have been made to broaden mixed-use development to incorporate anchor industries, in the context of cities and districts, to understand the strengths and weaknesses of urban competitiveness. Khalimova [29] investigated anchor firms in Siberia and found that large firms engaging in a particular technological area created externalities for smaller, innovative firms and had a significant, positive effect on strengthening the regional innovation system. The anchor tenant hypothesis has been developed and illustrated in literature and discussed in many research areas.
Agrawal and Cockburn [5] used the concept of deal flow to explain the technology transfer process and investigated the ability of large anchor tenants to generate knowledge spillovers. Feldman [30] studied the locational dynamics of the biotech industry in the USA. The study summarised three aspects for how existing anchor tenants benefit other related technology firms in the region and create regional specialisation and clusters: they attract skilled labour pools, pull specialised intermediate firms and industries, and provide knowledge spillovers.
The success of large anchor tenants in cities indicates the vitality of emerging industries [31]. Those anchor industries attract a large number of talented, educated employees and entrepreneurial thinkers and concentrate them in regions. From the mixed-used perspective, large global firms in cities can act as a catalyst to promote innovation, incentivise trade, and develop skilled labour pools. Studies of office locations indicate several factors that are critical to companies. Many types of firms prefer to locate their offices in or close to central business districts [32] and transport infrastructure [33] and consider socioeconomic factors, such as income level and population density [34]. However, there is a gap in firm location literature on how the office tenancy mix impacts the firms’ decision-making, regarding office locations, particularly for anchor tenants. A critical issue of a sustainable industrial ecosystem in CBD is how to ensure the supply of office floor space meets the underlying demand of various industries and provides a balanced industry mix to reduce business risks, such as a higher office vacancy rate.
To ensure the supply of office space is consistent with underlying demand, many firms tend to locate in urban areas, where there are companies in a similar or related field [35]. However, the demands for office space, by a certain industry type, are interrelated. For instance, one type of firm that uses the space may provide either positive or negative externalities for other types of industries [36], in either push or pull effects. A positive interaction between industry types can create a more diverse mix of uses within districts or at the scale of blocks and buildings. On the contrary, if one type of industry impinges on other tenants, it has a negative externality effect.
Further, Han and Hawken [37] stated that one of the essential characteristics of cities is economic heterogeneity, which is critical not only to the identity of cities, but also to economic productivity and innovative potential. They argued that mixed-use planning should extend to various types of industry mix, in different settings and scales (e.g., districts, neighbourhoods, blocks, and buildings as the vertical mix in buildings and horizontal mix in urban blocks).
3. Research Data and Methods
This paper uses the data collected through three surveys, conducted in 2006, 2012, and 2017, to investigate the employment and floor space changes in central Sydney. The City of Sydney council has been conducting the floor space and employment survey (FES) every five years, since 1976. The previous three FESs (2007, 2012, and 2017) covered the expanding local government area (LGA) boundaries and fully utilised geographic information system (GIS) tools to process and store data. The study conducted geoprocessing to clip the GIS data that falls into the study area, within the City of Sydney LGA, which is delimited by the area of Central Sydney Planning Strategy 2016, namely downtown Sydney or Central Sydney.
The size of the study area is approximately 4.25 km2, stretching from Circular Quay for about 3 km southwards to Central Station, with its east–west axis starting from a series of parklands, including Farm Cove, Royal Botanic Gardens, the Domain, and Hyde Park in the east, as well as Darling Harbour in the west. Central Sydney generates more than AUD 68 billion gross output, showing its increasingly important role in sustaining Sydney’s global city status [4]. Central Sydney is a high-density urban district, where knowledge-based industries and corporate headquarters, as well as finance and insurance firms agglomerate, served by an integrated transport system, including seven existing train stations (and three proposed stations for the future). In the past twenty years, one of the purposes of mixed-use planning in central Sydney has been to encourage more residential development in the area, to achieve more urban mix. It says the best cities are mixed-use cities [4], resulting in a steady increase in the number of people living in central Sydney. Since the 1990s, planning controls in central Sydney has incentivised residential development, including serviced apartments and hotels, by allowing an additional accommodation floor space.
This paper first conducted a time–series analysis of the number of business establishments, employment, and internal floor space changes for 22 industry types, over the past ten years. The time–series analysis examined the changing patterns of employment and floor space in central Sydney from 2006 to 2017, applying the measures by industry division to investigate changes in the industrial ecosystem.
A critical issue in urban mix research is selecting appropriate mixed-use measures. Song et al. [38] noted two ways to measure urban mix: integral and divisional measures. Integral measures are sensitive to variations of the unit of the analysis and tend to reflect the urban use balance or whether various uses are present, in equal proportion, in the spatial unit. In practice, this kind of measurement is often used for small spatial units. Divisional measures are more sensitive to variations of land use patterns within an area, and this method uses buffers to create spatial units for analysis. This method is often applied for larger spatial units and is not sensitive to variations at smaller scales.
This paper adopted the Herfindahl–Hirschman Index (HHI), commonly used to measure market concentration in urban economics (Equation (1)). It is calculated by squaring the market share of each company and then summing the resulting numbers. We applied HHI to measure the level of the industrial heterogeneity in the share of space (by different uses) within a building. The index usually ranges from 0 to 1. In this study, if one type of industry occupied most of the floor space of buildings (as vertical land use) and land blocks (as horizontal land use), the index would be close to 1, representing a lack of diversity or single use. On the contrary, if all industry types are equally present, then the index would be closer to 0, representing a higher heterogeneity.
Equation (1). The formula for the Herfindahl–Hirschman Index (HHI).
Let pi be the percentage of industry (i) of the floor space of the unit (building or block); Let R be the number of industry types (i). For instance, in a building with two types of industries, A and B, with 70% and 30% floor space each, the HHI can be calculated as (0.7)2 + (0.3)2 = 0.49 + 0.09 = 0.58.
This study uses the HHI method for its simplicity and acceptance as a heterogeneity index that is most appropriate to compare the complexity of vertical heterogeneity across entire buildings in central Sydney.
4. Research Analysis and Findings
4.1. Changes in Floor Space, Employees, and Business Establishments
Table 1 summarises the key changes between 2006 and 2017. In the period from 2006 to 2017, central Sydney had significant growth in employment, with an increase of 30.7%. However, the growth rate of internal floor space was much lower, at only 9.4%. On the other hand, the number of business establishments in central Sydney increased by almost 14%. The growth rates of internal floor space, employment, and business establishments were much higher from 2011 to 2017 than the first five years (since 2006), with the relatively slow growth attributed to the global financial crisis in 2008. Nevertheless, the growth in the number of business establishments in central Sydney, by about 700 from 2006 to 2011, shows the resilience of Sydney’s economy in withstanding global challenges. However, the relatively low internal floor space growth rate is also critical for evolving Sydney’s industrial ecosystem. There are specific businesses that are sensitive to changing working patterns (e.g., hot desking and work from home) and do not necessarily grow at the same rate as others.

Table 1.
Internal floor space, employment, and business establishment in central Sydney (2006–2017).
There are three anchor industries [39], including finance and insurance services; professional, scientific, and technical services; and information and communications technology services. Spatiotemporal analysis in this paper investigates the distribution patterns of anchor industries in central Sydney. The dataset in this study contains information on the geographic location of each business establishment in central Sydney. The spatial analysis identified locations in the study area where the density of business establishments of a specific industry type was higher than in the other part of the city; the analysis also examined if they are clustered in a particular area.
4.2. Changes in Industry Types and Structure
The time–series analysis investigated the changing patterns, by industry divisions, in terms of employment, internal floor space, business establishments, and workspace ratio in 2006–2017, summarised in Figure 1. Most industries in central Sydney showed steady growth in all three measures, but the industry sectors of manufacturing (C) and wholesale trade (F), as well as transport, postal, and warehouse (I) decreased in employees, floor space, and total establishments from 2006 to 2017. The government administration and safety sector remained stable in employment and floor space in the same period.
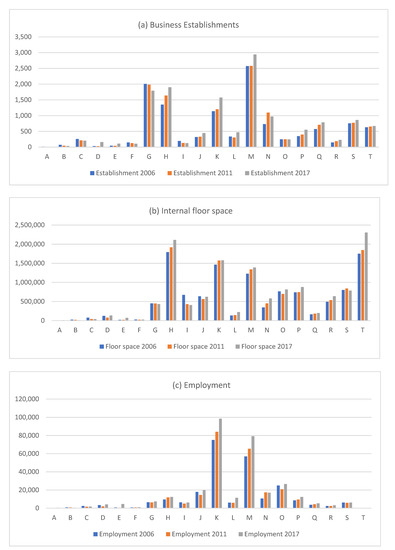
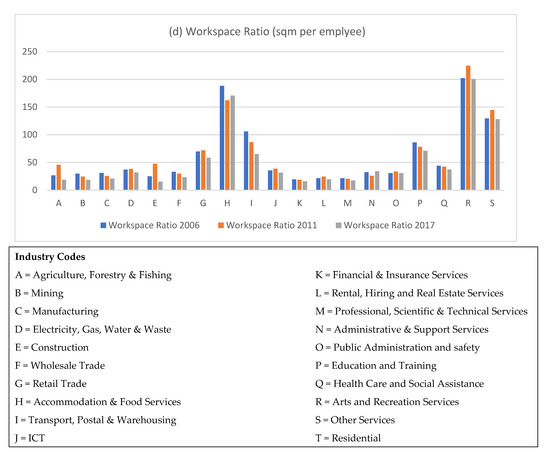
Figure 1.
Internal floor space, employment, business establishments, and workspace ratio, by industry division in central Sydney, 2006, 2011, and 2017.
In the period 2006–2017, the industry division with the highest growth in business establishments was financial and insurance services (K) (an increase of 433 businesses, 38% increase), followed by professional, scientific, and technical services (M) (increase of 371 businesses, 58% increase), education and training (P) (increase of 203 businesses, 58% increase), health care and social assistance (Q) (37% increase), and information and communications technologies (J) (39% increase). Of those growing industries, education and training (P) had the fastest growth rate (58%) in new establishments. The number of establishments for art and recreation services also increased in central Sydney.
The industries that had significant growth from 2006–2017 included financial and insurance services (K), administrative and support services (N), public administration and safety (O), education and training (P), accommodation and food services (H), art and recreation services (R), and residential (T). However, the time–series trends vary. Financial and insurance services (K) is one of the industry divisions that occupies the most internal floor space in central Sydney, with a 7% increase, in terms of floor space from 2006 to 2011, but its growth rate was only 0.42% in the next five years, from 2012 to 2017. For professional, scientific, and technical services, the growth of internal floor space did not change much in 2006–2017. The ICT sector declined from 2006–2011, losing 72,135 m2 floor space, but its position dramatically reversed from 2011–2017, with a sharp increase of 10%. The education and training industry was at a standstill from 2006–2011, with only a 1% increase in floor space, but it had strong growth from 2011–2017, with an 18% increase in floor space. The arts and recreation services showed strong growth.
Residential development (T) in central Sydney also had rapid growth. Residential floor space area increased by 552,472 m2, or 32%, from 2006–2017, with a rapid increase in 2011–2017, compared to the first five years.
The number of employees grew by 30.6%, or almost 75,000 workers, between 2006 and 2017. However, the growth of the workforce in 2006–2011 was modest, compared to the sharp increase from 2011–2017. Since 2012, most industries have increased their workforce in central Sydney, except administrative, services, and mining. The industry division with the most significant growth in employment was financial and insurance services (K), which increased by 14,332 workers (17% growth). Professional, scientific, and technical services (M) took second place with 13,855 workers (a 21% increase), followed by rental, hiring, and real estate services (L), which grew by 5568 workers (95% increase) and the ICT sector, which grew by 5276 workers (36% increase). However, the time–series trend varied by industry division. Three growth patterns were identified. The first group of industries includes financial, professional, scientific, and technical services, as well as education and training, which had a stable time–series growth in 2006–2017. The second group of industries, ICT (J), property development services (L), and public administration and security (O) had a V-shape trend in the workforce, with the 2011 survey serving as a significant landmark (when the decline was reversed); it grew in 2011–2017. The third group of industries are manufacturing, transport, postal, and warehousing, which shows a decrease in the workforce from 2006–2017.
The analysis also examined changes in internal floor space per employee, i.e., the workspace ratio, calculated by dividing the total floor space area (m2) by the total number of workers. In general, the workspace ratio decreased from 2006–2017, and the average for all industry divisions dropped from 57.8 m2 per employee in 2006 to 48.9 m2 per employee in 2017. However, the time–series trends varied by industry division. The financial and insurance services (K) and professional, scientific, and technical services (M) were the two most space-efficient industries, maintaining a workspace ratio under 20 m2 in the 2006, 2011, and 2017 surveys. Both had a slight decline in workspace ratio, to 16.04 m2 and 17.54 m2 per employee in 2017, respectively. The less space-efficient industries had a more significant reduction in workspace ratios, such as transport, postal, and warehousing (I), public administration and security (O), and education and training (P). From 2012 to 2017, accommodation and food services (H), which is not a space-efficient industry, had an increase in workspace ratio, from 162.28 m2 per employee to 170.62 m2 per employee. The art and recreation services (R) maintained a stable workspace ratio, with slight changes from 2006–2017.
4.3. Heterogeneity of Building Blocks and Emerging Industry Clusters
The within-blocks analysis revealed a trend that heterogeneity, within urban blocks, decreased steadily over the decade, with the mean HHI increased from 0.381 (Std. = 0.236) in 2006 to 0.408 (Std. = 0.257) in 2017 (6.14% growth), which means a declining heterogeneity of blocks over time. However, the results also imply the reasonable stability of the heterogeneity of urban blocks, with minimum fluctuations, since 2006. The time–series analysis revealed the distinct clustering of high heterogeneity urban blocks (Figure 2 and Figure 3). Hawken and Han [6] defined a heterogeneity cluster as more than two adjacent blocks with a HHI value of less than 0.20. Based on this definition, the distribution of high heterogeneity clusters appeared to be similar in 2006, 2011, and 2017, but there was some variation, in terms of the intensity of clusters and modest changes in the location of areas with a high degree of mix in industry types (Figure 3 and Figure 4).
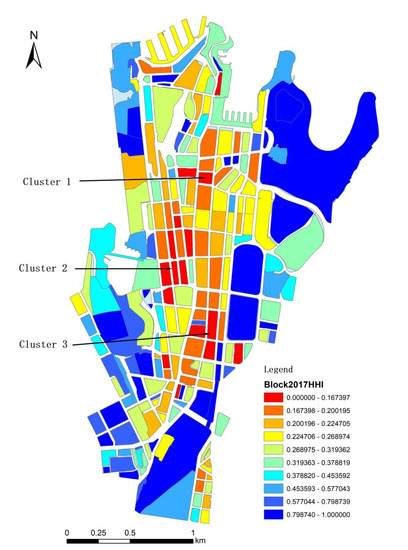
Figure 2.
Heterogeneity of urban blocks in 2017 (red colour, higher mixed-use land). Note: the natural break algorithm was used to define and visualise ten classes of HHI. Urban blocks with brighter colour (red) had low HHI, which means a higher heterogeneity within the blocks. Three clusters emerged in this analysis: one is around the Wynyard station (cluster 1), one is to the west of the town hall station (cluster 2), and the third is around the museum station, to the west of Hyde Park (cluster 3).
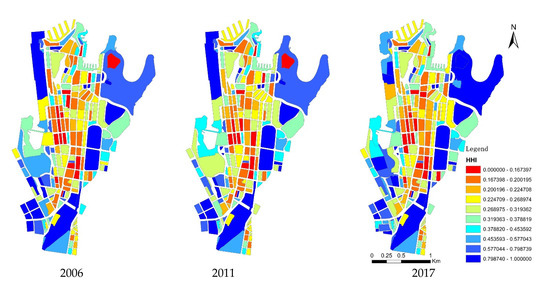
Figure 3.
Time–series analysis: economic heterogeneity of urban blocks, calculated using Herfindahl-Hirschman index (HHI).
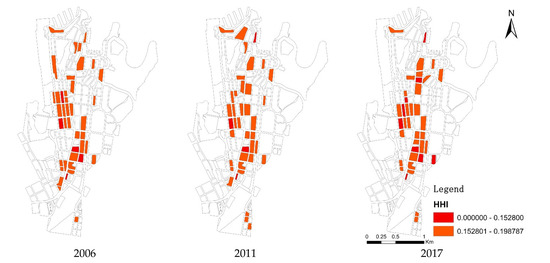
Figure 4.
Time–series analysis of highly heterogeneous urban blocks.
In 2017, three heterogeneous clusters emerged (Figure 2). Cluster 1 was around the northern part of George Street and Pitt Street, to the east–north of Wynyard station. This area is known for the agglomerative clustering of financial, and professional services firms, characterised by a combination of office buildings, hotels, and mixed-use developments, leading to highly mixed-uses within urban blocks. The City of Sydney wants to create a cluster of office towers in this area to provide office space for leading industries, such as the financial sector, to expand their occupation. One example is the construction of 10 Carrington, a 134 m high, mixed-use office and retail building in Wynyard Place, which will comprise of 27 levels of premium-grade office space; the new business districts in Barangaroo, to the west, will offer new supplies to the office market.
Another cluster of highly heterogeneous urban blocks is around the area to the west of the town hall station, described as cluster 2. This area is characterised by a mix of 20th-century office towers and warehouses, with relatively low building heights of less than 40 m. Building types and ages vary in this area, and many heritage constraints limit the opportunities for urban renewal. The urban blocks in this area are highly mixed with various industry types; their proximity to the cluster of global services firms is seen as an advantage. However, it is difficult for those blocks to accommodate a large global industry, due to their limitation in floor space. Cluster 3 is located to the west of Hyde Park, around the museum station. This area has a range of commercial buildings, attracting ICT and professional and scientific services, in recent years. It is also significant that the three clusters are close to train stations: cluster 1 is near the Wynyard station, cluster 2 is to the west of the town hall station, and cluster 3 is next to the museum station. Wynyard and town hall are highly accessible and valuable locations on Sydney’s extensive, heavy rail network, providing a high level of accessibility to the CBD for workers from across Sydney. This finding suggests that transport hubs are an essential factor that positively impact economic heterogeneity at a precinct scale.
4.4. George Street and Pitt Street as the Key Spine of Economic Heterogeneity
A time–series analysis was conducted to examine the dynamic changes of different clusters. From 2006–2017, the urban blocks around Wynyard station had a significant increase in heterogeneity. In 2006, only three highly heterogeneous urban blocks, with heterogeneous HHI (0.12–0.2), appeared in this area. However, in 2017, there were more than six highly heterogeneous blocks agglomerated near Wynyard station. This cluster expanded along the northern part of Pitt Street and George Street, two north–south streets. This phenomenon implies the growth of industry mix in the high-rise office tower cluster. Although the period 2006–2017 showed the decreasing intensity of highly heterogeneous urban blocks, most of which maintained a high mix of industries, without significant changes. The time–series trend shows the resilience of heterogeneous blocks. The pattern of highly heterogeneous blocks shows the tendency to generate a north–south spine along George Street and Pitt Street. This urban corridor leads to an increasingly vertical heterogeneity, with a diversity of industries within the buildings.
This highly mixed, north–south axis is also indicated by the time–series analysis of in-building heterogeneity (Figure 4 and Figure 5), which is more fragmented but still reveals the clustering of highly heterogeneous buildings around the finance and retail centre (along George Street and Pitt Street). The building heterogeneities vary by building types and sizes, ranging from large A-grade office towers to lower mixed-use buildings. The average value of in-building HHI has decreased slightly since the 2006 survey, indicating more diversity; the distribution pattern of those highly heterogeneous buildings also had modest changes over time.
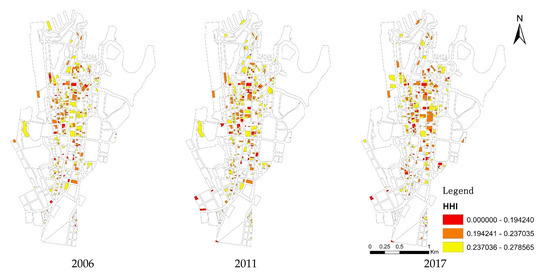
Figure 5.
Heterogeneity of individual buildings, calculated using the HHI index (red colours indicate a higher diversity of industries within buildings). Notes: analysis of in-building heterogeneity showed a dispersed pattern of buildings with high heterogeneity from 2006–2017; nevertheless, it showed intense clustering along George Street and Pitt Street, in the finance and retail districts.
From 2006–2017, the distribution of highly heterogeneous buildings showed a tendency of concentration towards the centre of the study area, along George Street and Pitt Street, where many high-rise office buildings and mixed-use commercial and retail centres cluster. The result of the time–series analysis shows the continued increase of economic heterogeneity along George Street and Pitt Street over time. This indicates positive feedback circles [28] that result in a higher diversity of industries and mixed-land use.
Apart from the highly heterogeneous precincts in the centre, another notable finding shows a low industry mix between the three clusters. One of these areas is Chinatown, a vibrant and lively district with high pedestrian traffic, retail, and restaurants (but with relatively low in-building heterogeneity). Another area with low heterogeneity is around Macquarie Street, where many civic and public institutions are located, partly reflecting early colonial origins.
The time–series HHI analysis in central Sydney provided insights into the within-block horizontal mix and within-building vertical mix, as well as changes over time. For planners and city managers, this analysis showed a cluster of heterogeneous urban blocks, and the time–series trend showed three clusters that tend to distribute near the key spine in the centre, along George Street and Pitt Street. Increased urban heterogeneity, urban planning, and policies need to consider the future development of the strategic spine, newly built office towers, and light rail, along with George Street.
The within-building HHI analysis for vertical land use indicated a more dispersed distribution of highly heterogeneous buildings and showed increasing numbers of the highly heterogenous buildings over time. The mean HHI for buildings decreased from 0.689 (Std. = 0.293) in 2006 to 0.679 (Std. = 0.307) in 2017. The time–series HHI analysis also showed the relative decline of highly heterogeneous buildings in the west and centre of Sydney central (see Figure 5 red coloured). Interestingly, more heterogeneous buildings emerged along Pitt Street and George Street, but some of those were not located in highly mixed urban blocks.
This analysis showed that the heterogeneity of horizontal land use does not necessarily represent the vertical heterogeneity of office buildings. Office building floor use tends to be homogenous, pulling in companion industries over time, especially if the finance and professional industries are anchor tenants within a building. Therefore, it is necessary to understand the interrelated effects of different industries and develop a tenant mix strategy within buildings by time and location. A report from commercial property agency CBRE provided remarkable insights into tenant mix strategy. By analysing more than 70,000 potential tenancy scenarios, the CBRE report showed that overall returns were the highest when the proportion of short-term tenants in an office building was higher [40].
5. Conclusions and Discussion
This paper examined the transformation of industry structure in central Sydney by investigating the spatiotemporal changes in internal floor space, employment, and business establishment from 2006 to 2017, using the data of three City of Sydney floor space and employment surveys. The study found the increased heterogeneity and significant growth of service industries in central Sydney, including finance, insurance, professional, scientific, ICT, education, and training services. Notably, there was a significant growth of experience services, such as accommodation, cafes, and restaurants, as well as media, art, and recreation services, that are highly associated with the amenity and identity of the city. The analysis also showed a steady increase in residential floor space in central Sydney and the growth of the resident population. This reconfirmed that the current mixed-used strategy leads to high-density living in the inner-city area. Furthermore, this study holds that the continued growth of knowledge-based industries and experience services in central Sydney can generate a virtuous circle that supports and complements each other. However, central Sydney has limited land, compared to the central business districts of other global cities, due to the harbour and topography.
According to JLL’s Future Cities report in 2019, the five capital cities in Australia will need to add more than 13 million square metres of new office space by 2047, and the demand is most urgent in Sydney and Melbourne [41]. We found that the mixed-used patterns transformed to increasingly homophily land blocks (e.g., more residential), with increasing vertically heterogeneous office buildings over the past decade. This shows that similar industries within a block tend to be clustered (not necessarily in the same building), and the anchor tenants within a building play a significant role in increasing vertical heterogeneity. The study argued that vertical mix strategies within a building will become crucial to accommodate future office and employment growth, as well as resource sharing, such as accessibility, labour pooling, and transport infrastructure (i.e., new metro), between industries.
The visualisation of HHI, at the building- and land block-scale, is useful in showing the spatiotemporal changes of heterogeneity, in terms of the intensity of mix, as well as the type and distribution of industry mix. The findings of HHI show the future mixed-use development areas, with the three high-industry heterogeneity clusters: the financial centre (close to Wynyard station), the heritage area (to the west of town hall station), and the commercial zone (near museum station). The study also identified the urban area, along George Street and Pitt Street, as the key spine of urban heterogeneity. The clusters of A-grade office towers and retail centres along this corridor could contribute to the high vertical heterogeneity.
Overall, the HHI analysis showed increasingly horizontal homophily of land blocks, with an increase in the vertical heterogeneity of office buildings, in central Sydney, over the past decade. The future mixed-use strategy should consider both horizontal land use mix (blocks) and vertical office space mix (buildings). The future planning implication will need to develop an interrelated and vertical tenancy mix strategy of the high-rise building floor space, not just a balanced mix of residential, commercial, cultural, and community land use.
Author Contributions
Research design and conceptualisation, H.H.; data analysis and visualisation, H.C. and H.H.; writing—original draft preparation, H.C., H.H. and J.L.; writing—review and editing H.H. and J.L.; supervision; H.H. All authors have read and agreed to the published version of the manuscript.
Funding
This research received no external funding.
Institutional Review Board Statement
Human ethics approval was waived for this study due to it does not involve human research and uses a secondary data source. City of Sydney gave a grant to use the office building floorspace data for the study.
Informed Consent Statement
Not applicable.
Data Availability Statement
The data presented in this study are available on request from the corresponding author.
Conflicts of Interest
The authors declare no conflict of interest.
References
- Scott, A.J. A perspective of economic geography. J. Eco. Geog. 2004, 4, 479–499. [Google Scholar] [CrossRef]
- Han, H.; Hawken, S. Introduction: Innovation and identity in next-generation smart cities. City Cult. Soc. 2018, 12, 1–4. [Google Scholar] [CrossRef]
- Porter, M. The Competitive Advantage of Nations. Harv. Bus. Rev. 1990, 1, 73–91. [Google Scholar]
- City of Sydney, Central Sydney Planning Strategy. 2016. Available online: https://www.cityofsydney.nsw.gov.au/__data/assets/pdf_file/0014/311036/C0_Overview_120715_WEB.pdf (accessed on 3 April 2019).
- Agrawal, A.; Cockburn, I. The anchor tenant hypothesis: Exploring the role of large, local, R&D-intensive firms in regional innovation systems. Int. J. Ind. Organ. 2003, 21, 1227–1253. [Google Scholar] [CrossRef]
- Hawken, S.; Han, H. Innovation districts and urban heterogeneity: 3D mapping of industry mix in downtown Sydney. J. Urban Des. 2017, 22, 568–590. [Google Scholar] [CrossRef]
- Hoppenbrouwer, E.; Louw, E. Mixed-use development: Theory and practice in Amsterdam’s Eastern Docklands. Eur. Plan. Stud. 2005, 13, 967–983. [Google Scholar] [CrossRef]
- Row, A.T.; Jacobs, J. The Death and Life of Great American Cities. Yale Law J. 1962, 71, 1597. [Google Scholar] [CrossRef]
- Bernick, M.; Cervero, R. Transit Villages in the 21st Century; McGraw-Hill: New York, NY, USA, 1997. [Google Scholar]
- Calthorpe, P. The Next American Metropolis: Ecology, Community, and the American Dream; Princeton Archi-tectural Press: New York, NY, USA, 1993. [Google Scholar]
- Hendrigan, C.; Newman, P. Dense, mixed-use, walkable urban precinct to support sustainable transport or vice versa? A model for consideration from Perth, Western Australia. Int. J. Sustain. Transp. 2015, 11, 11–19. [Google Scholar] [CrossRef]
- Shim, J.H.; Park, S.; Park, E.J. Public space planning of mixed-use high-rise buildings focusing on the use and impact of deck structure in an urban development in Seoul. In Proceedings of the CTBUH Conference, Seoul, Korea, 10–13 October 2004; pp. 764–771. [Google Scholar]
- Siemiatycki, M. Mixing Public and Private Uses in the Same Building: Opportunities and Barriers. J. Urban Des. 2015, 20, 230–250. [Google Scholar] [CrossRef]
- Liusman, E.; Ho, D.C.W.; Lo, H.C.; Lo, D.Y.F.; French, N. Office rents, mixed-use developments, and agglomeration economies: A panel data analysis. J. Prop. Investig. Financ. 2017, 35, 455–471. [Google Scholar] [CrossRef]
- Mualam, N.; Salinger, E.; Max, D. Increasing the urban mix through vertical allocations: Public floorspace in mixed use development. Cities 2019, 87, 131–141. [Google Scholar] [CrossRef]
- Grant, J.; Perrott, K. Where is the café? The challenge of making retail uses viable in mixed-use suburban develop-ments. Urban Stud. 2011, 48, 177–195. [Google Scholar] [CrossRef]
- Sagalyn, L.B. Public/private development: Lessons from history, research, and practice. J. Am. Plan. Assoc. 2007, 73, 7–22. [Google Scholar] [CrossRef]
- Coen, D.; Richardson, J. (Eds.) Lobbying the European Union: Institutions, Actors, and Issues; Oxford University Press: Oxford, UK, 2009. [Google Scholar]
- Grant, J. Mixed Use in Theory and Practice:Canadian Experience with Implementing a Planning Principle. J. Am. Plan. Assoc. 2002, 68, 71–84. [Google Scholar] [CrossRef]
- Coupland, A. Reclaiming the City: Mixed Use Development; Routledge: London, UK, 2005. [Google Scholar]
- Næss, P.; Næss, T.; Strand, A. Oslo’s Farewell to Urban Sprawl. Eur. Plan. Stud. 2011, 19, 113–139. [Google Scholar] [CrossRef]
- Næss, P.; Vogel, N. Sustainable urban development and the multi-level transition perspective. Environ. Innov. Soc. Transit. 2012, 4, 36–50. [Google Scholar] [CrossRef] [Green Version]
- Sharmin, N.; Haque, A.; Islam, M. Generating alternative land-use allocation for mixed use areas: Multi-objective optimisation approach. Geogr. Anal. 2019, 51, 448–474. [Google Scholar] [CrossRef]
- Sommella, R.; D’Alessandro, L. Retail Policies and Urban Change in Naples City Center: Challenges to Resilience and Sustainability from a Mediterranean City. Sustainability 2021, 13, 7620. [Google Scholar] [CrossRef]
- Rabianski, J.; Clements, J. Mixed-Use Development: A Review of Professional Literature; NAIOP Research Foundation: Herndon, VA, USA, 2007. [Google Scholar]
- Ryu, H.-Y.; Park, J.-A. A Study on the Variation Process of Commercial Gentrification Phase in Residential Area in Seoul: Focused on Business Type of Commercial Characteristics. J. Korea Plan. Assoc. 2019, 54, 40–51. [Google Scholar] [CrossRef]
- Rowley, A. Mixed-use development: Ambiguous concept, simplistic analysis and wishful thinking? Plan. Pract. Res. 1996, 11, 85–98. [Google Scholar] [CrossRef]
- Rodenburg, C.A.; Nijkamp, P. Multifunctional Land Use in the City: A Typological Overview. Built Environ. 2004, 30, 274–288. [Google Scholar] [CrossRef]
- Khalimova, S. Innovation development of large companies in Siberia. Area Dev. Policy 2016, 1, 378–388. [Google Scholar] [CrossRef]
- Feldman, M. The locational dynamics of the us biotech industry: Knowledge externalities and the anchor hypothesis. Ind. Innov. 2003, 10, 311–329. [Google Scholar] [CrossRef]
- Spencer, G.M. Knowledge Neighbourhoods: Urban Form and Evolutionary Economic Geography. Reg. Stud. 2015, 49, 883–898. [Google Scholar] [CrossRef]
- Maoh, H.F.; Kanaroglou, P.S.; Buliung, R.N. Modeling the Location of Firms within an Integrated Transport and Land-Use Model for Hamilton; Centre for Spatial Analysis, McMaster University: Hamilton: ON, Canada, 2005. [Google Scholar]
- Vahaly, J. The Location of Service and Office Activities in Nashville-Davidson County, 1970. Land Econ. 1976, 52, 479. [Google Scholar] [CrossRef]
- Shukla, V.; Waddell, P. Firm location and land use in discrete urban space: A study of the spatial structure of Dal-las-Fort Worth. Reg. Sci. Urban Econ. 1991, 21, 225–253. [Google Scholar] [CrossRef]
- Waddell, P.; Shukla, V. Manufacturing location in a polycentric urban area: A study in the composition and attrac-tiveness of employment subcenters. Urban Geogr. 1993, 14, 277–296. [Google Scholar] [CrossRef]
- Grenadier, S.R. Flexibility and tenant mix in real estate projects. J. Urban Econ. 1995, 38, 357–378. [Google Scholar] [CrossRef]
- Hawken, S.; Han, H. Industry mix and 3D urban heterogeneity: Insights into innovation districts. Procedia Eng. 2017, 198, 549–561. [Google Scholar]
- Song, Y.; Merlin, L.; Rodriguez, D. Comparing measures of urban land use mix. Comput. Environ. Urban Syst. 2013, 42, 1–13. [Google Scholar] [CrossRef]
- Smith, W.L.; Sassen, S. Cities in a World Economy. Teach. Sociol. 1995, 23, 426. [Google Scholar] [CrossRef]
- Adrian, B. Long-Term or Short-Term: What’s The Best Tenancy Mix? Realcommercial. 2017. Available online: https://www.realcommercial.com.au/news/long-term-or-short-term-whats-the-best-tenancy-mix (accessed on 4 March 2019).
- Annabel, M. How Much New Office Space does Australia Need? 2019. Available online: https://www.commo.com.au/news/2019/08/20/how-much-new-office-space-does-australia%20need/1566281436 (accessed on 30 January 2019).
Publisher’s Note: MDPI stays neutral with regard to jurisdictional claims in published maps and institutional affiliations. |
© 2021 by the authors. Licensee MDPI, Basel, Switzerland. This article is an open access article distributed under the terms and conditions of the Creative Commons Attribution (CC BY) license (https://creativecommons.org/licenses/by/4.0/).