
Risk Assessment of Joint Sealing Tape in Joints between Precast Concrete Sandwich Panels Resilient to Climate Change


Abstract
:1. Introduction
Aim and Objective
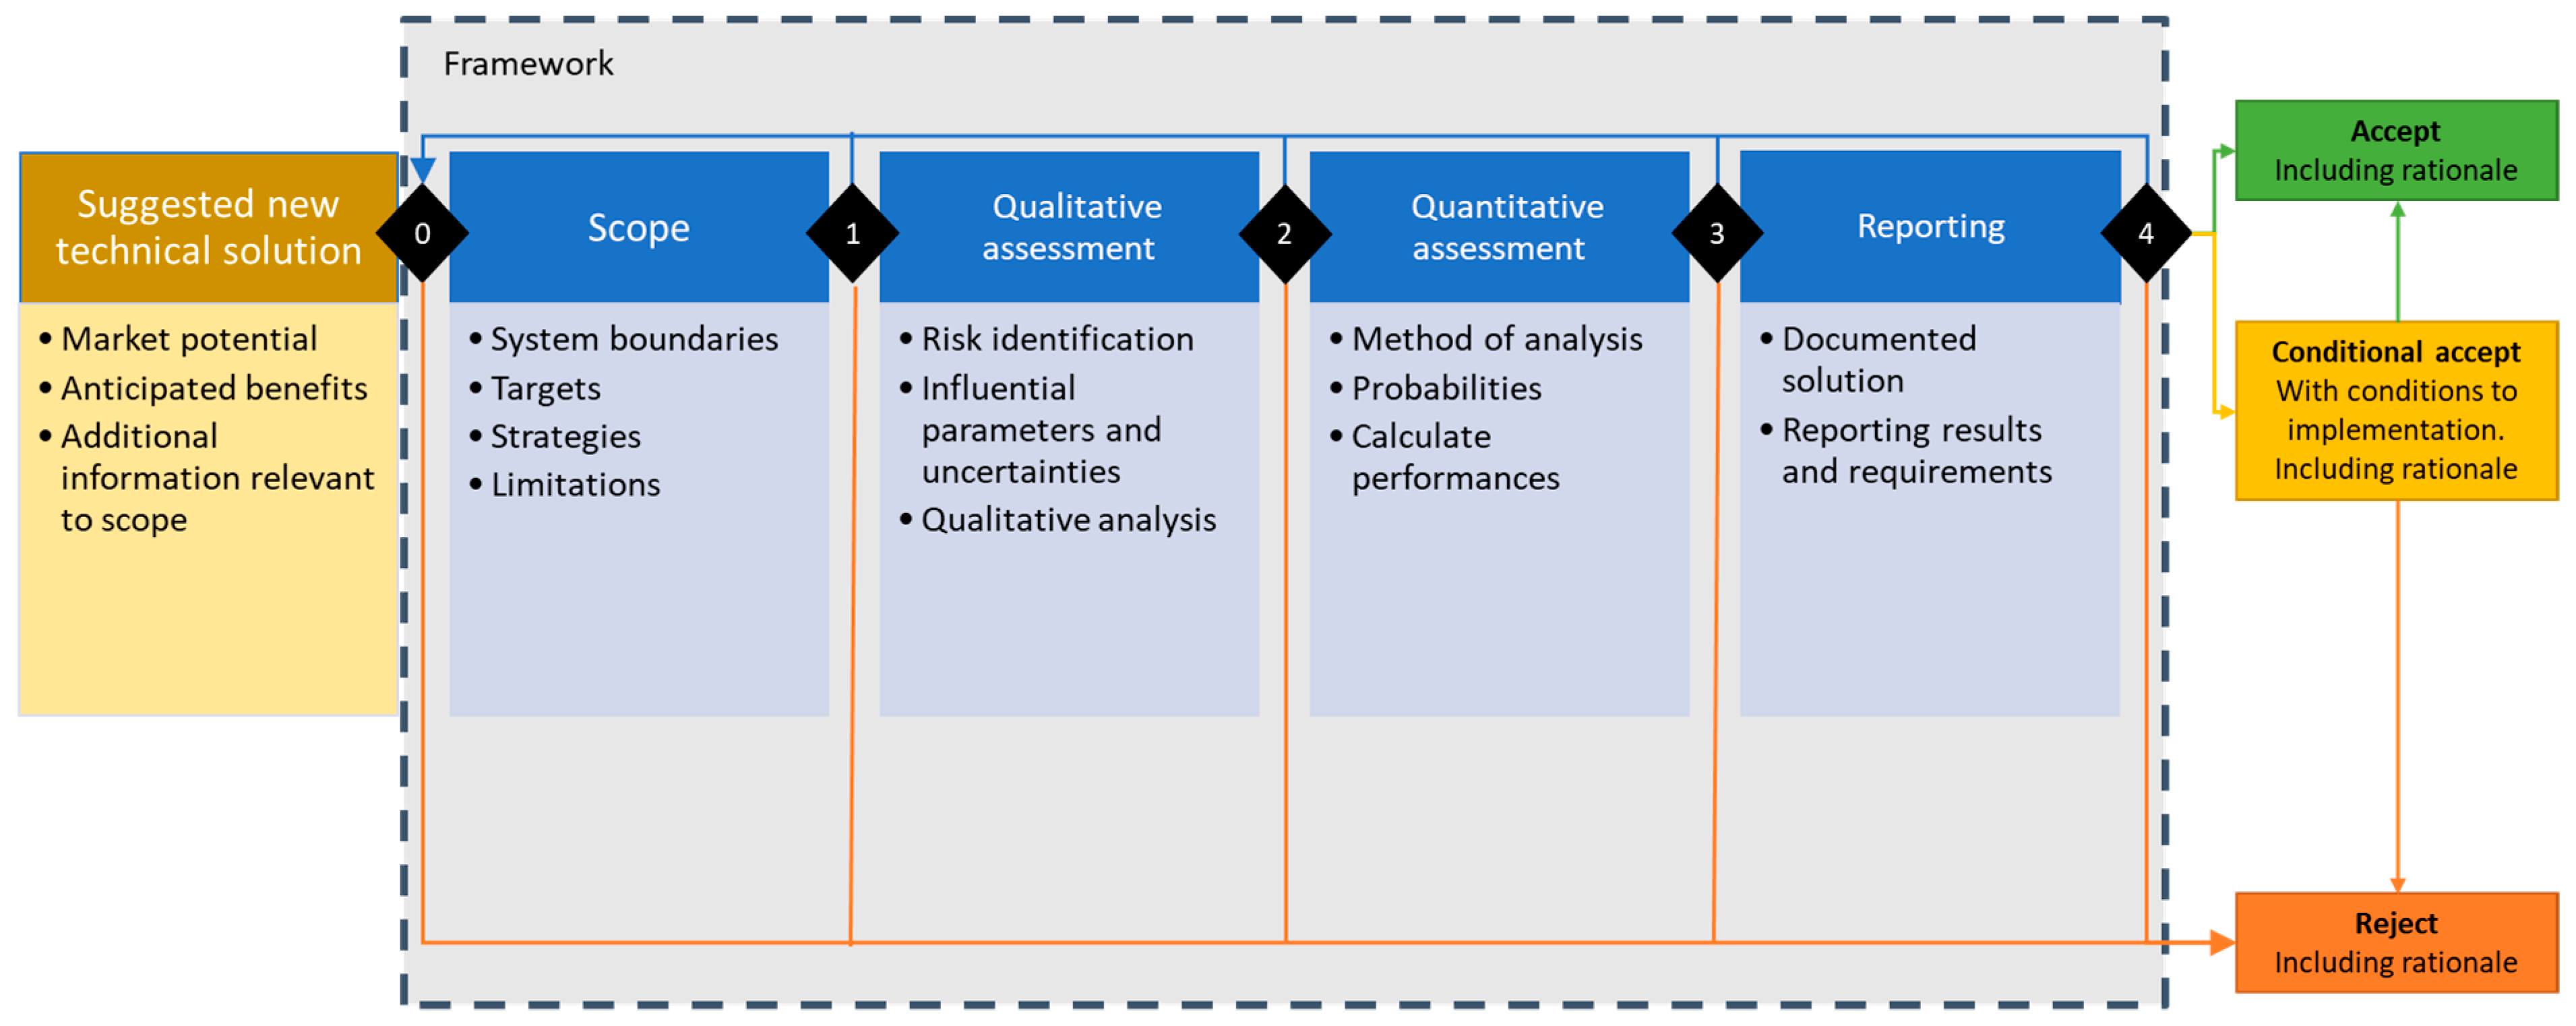
2. Method
- Scope. The scope is a specification of the new technical solution to be assessed, and it is important to establish a mutual understanding of what is being assessed. Important stakeholders should also be identified at this stage. The scope should comprise a thorough description divided into four parts: system boundaries, targets, strategies and limitations. Tools used are a stakeholder analysis, using a power versus interest grid combined with a participation planning matrix (e.g., [9]) and Annex I in Construction Products Regulation [10].
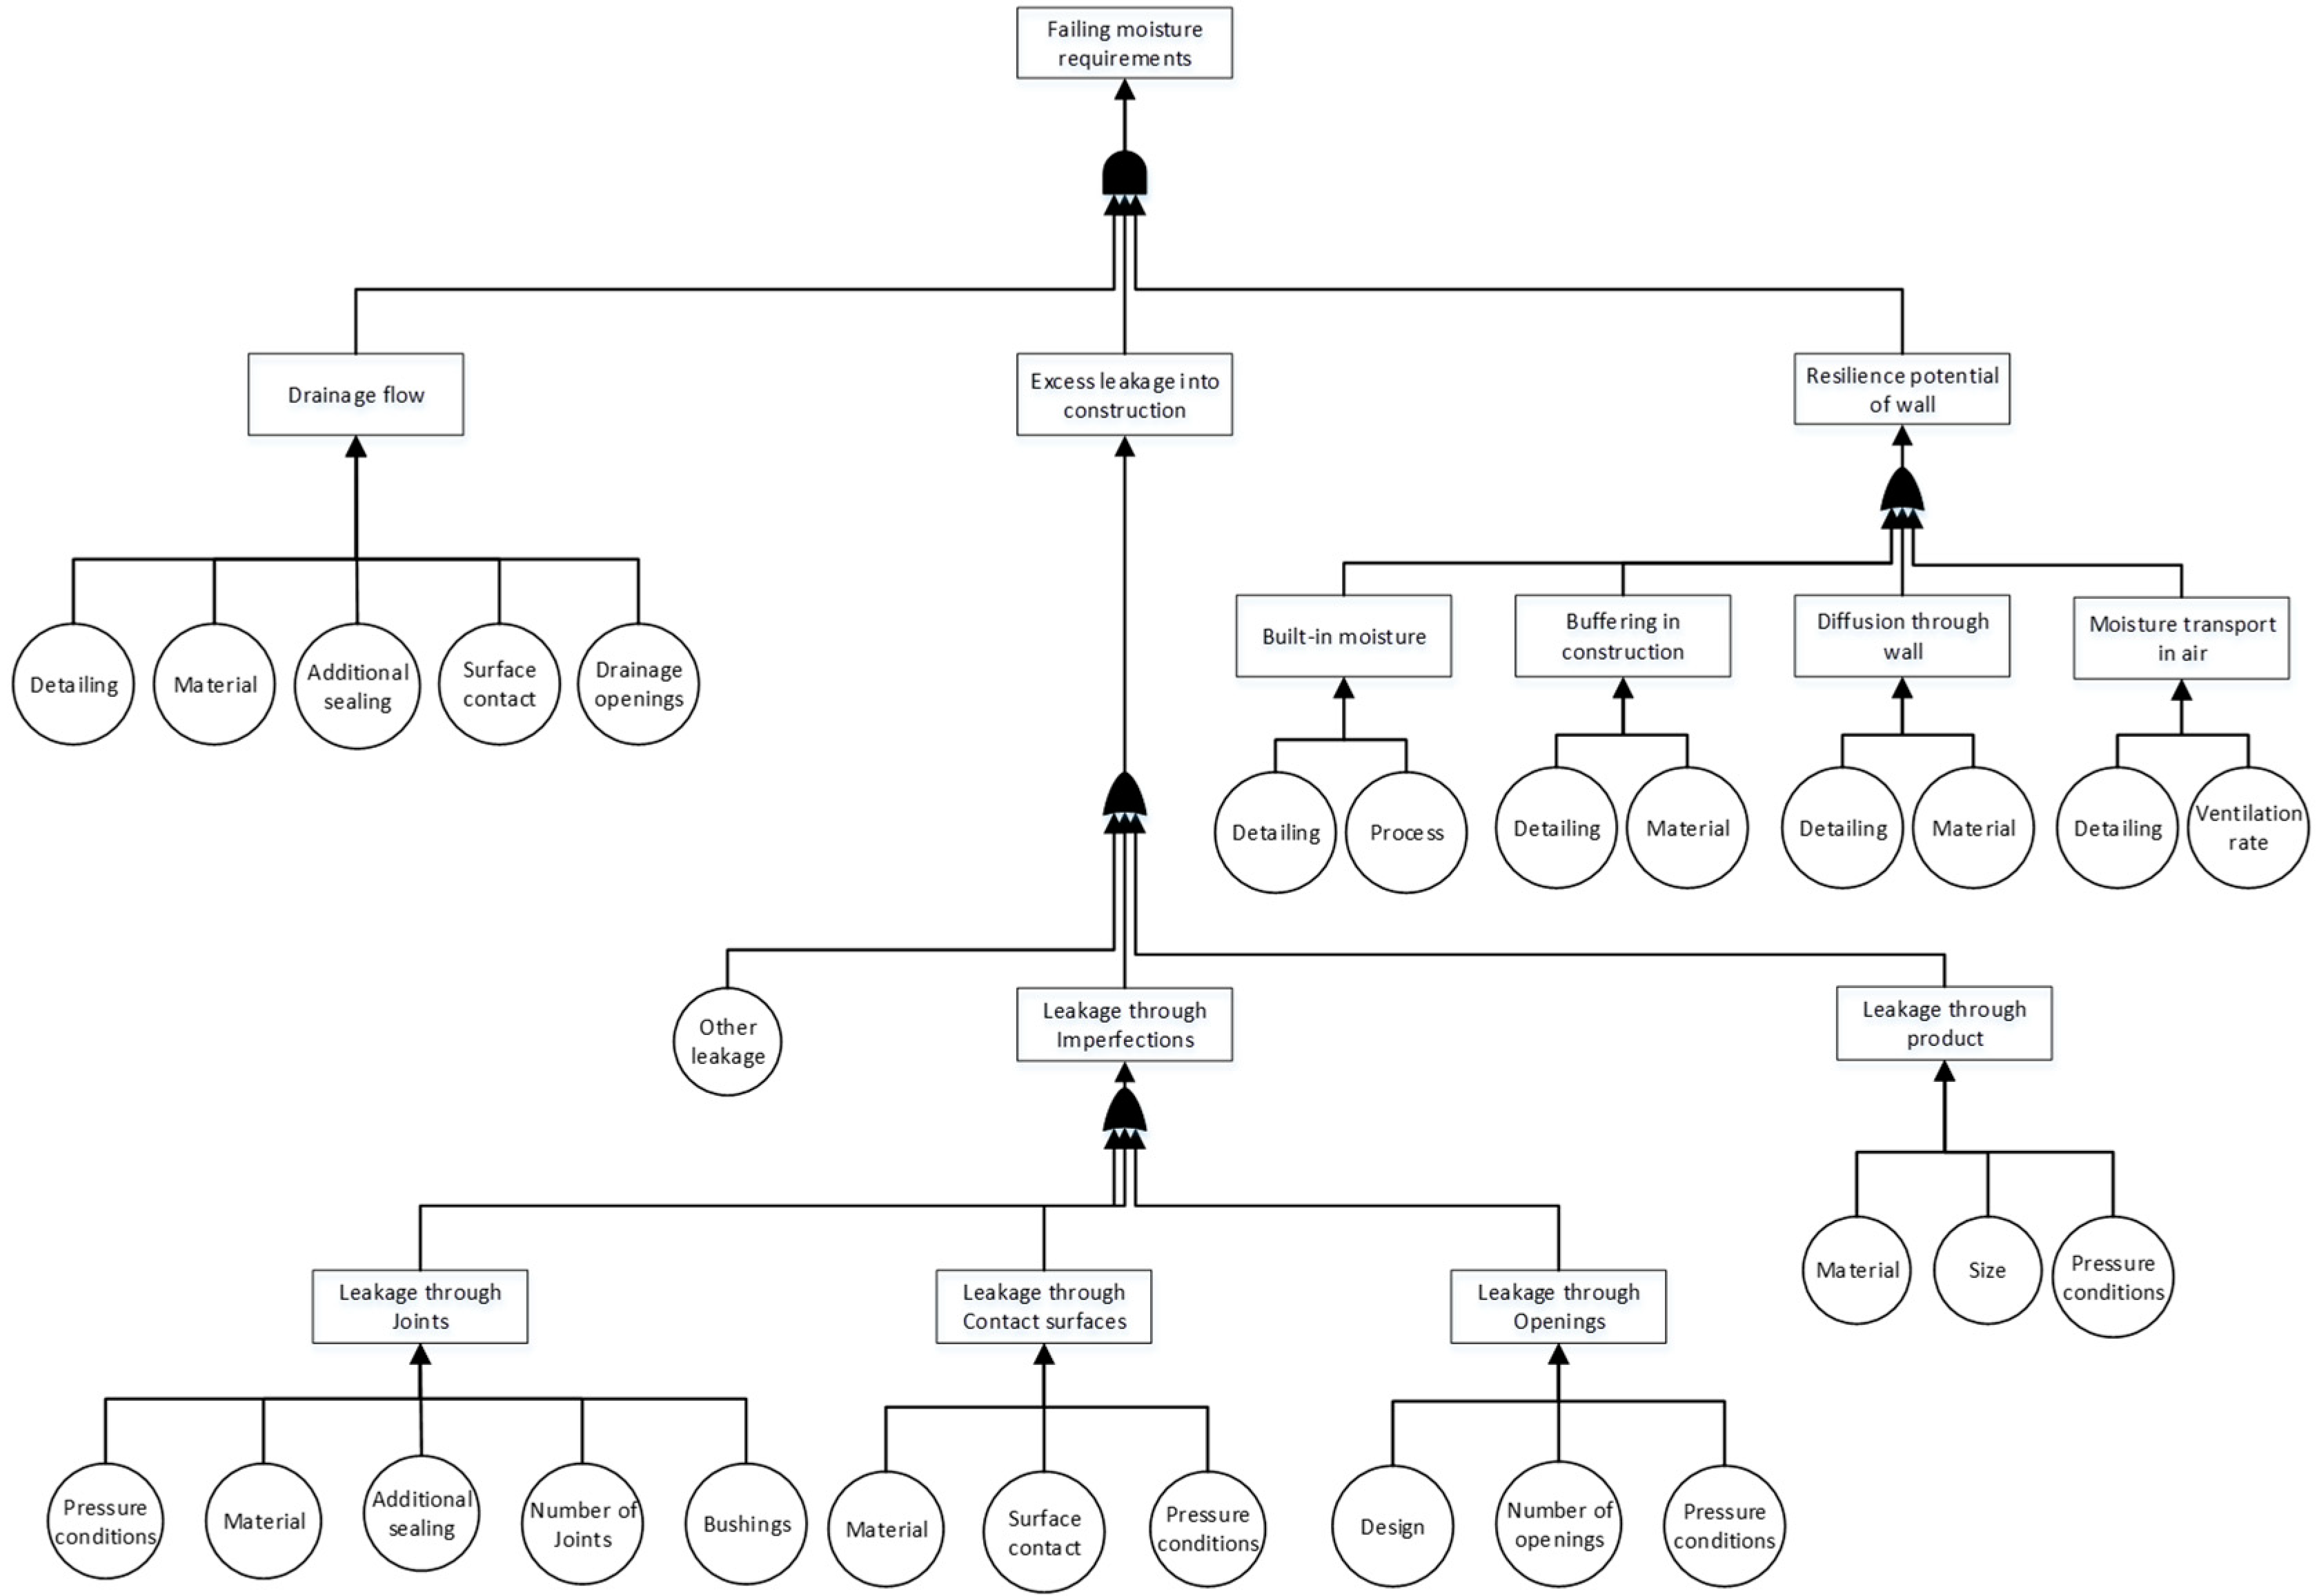
- Qualitative assessment. The qualitative assessment includes a risk identification, and identifying influential factors and their corresponding uncertainties, resulting in a qualitative assessment. Tools used for risk identification and structuring are expert workshops together with a literature review and a fault tree structure [11], respectively.
- Quantitative assessment. A quantitative assessment is made on basis of the qualitative assessment of the scope. Important steps of the suitable method are identified for analysis, distinguishing probabilities and calculating the performance of the solution. Tools used are laboratory testing according to [12] for assessing performance of identified critical issues and, based on moisture mass balance of joint, Monte Carlo simulations for creating probability functions of performance based on long sequences (≥30 years) of hourly values of climatic data.
- Evaluation reporting. The input and results of the assessments are compiled, recommendations and a relevant specification of requirements are established, again from a design–build contractors’ perspective, to serve as a basis of decisions. Verification and risk mitigation are suggested. Tools used are a table of assessment and recommendations. Recommendations can include references to a full-scale evaluation scheme.
3. Scope of the Assessment
Tollgate 1
4. Results
4.1. Qualitative Assessment
4.1.1. Risk Identification Workshop
4.1.2. Tollgate 2
4.2. Quantitative Assessment
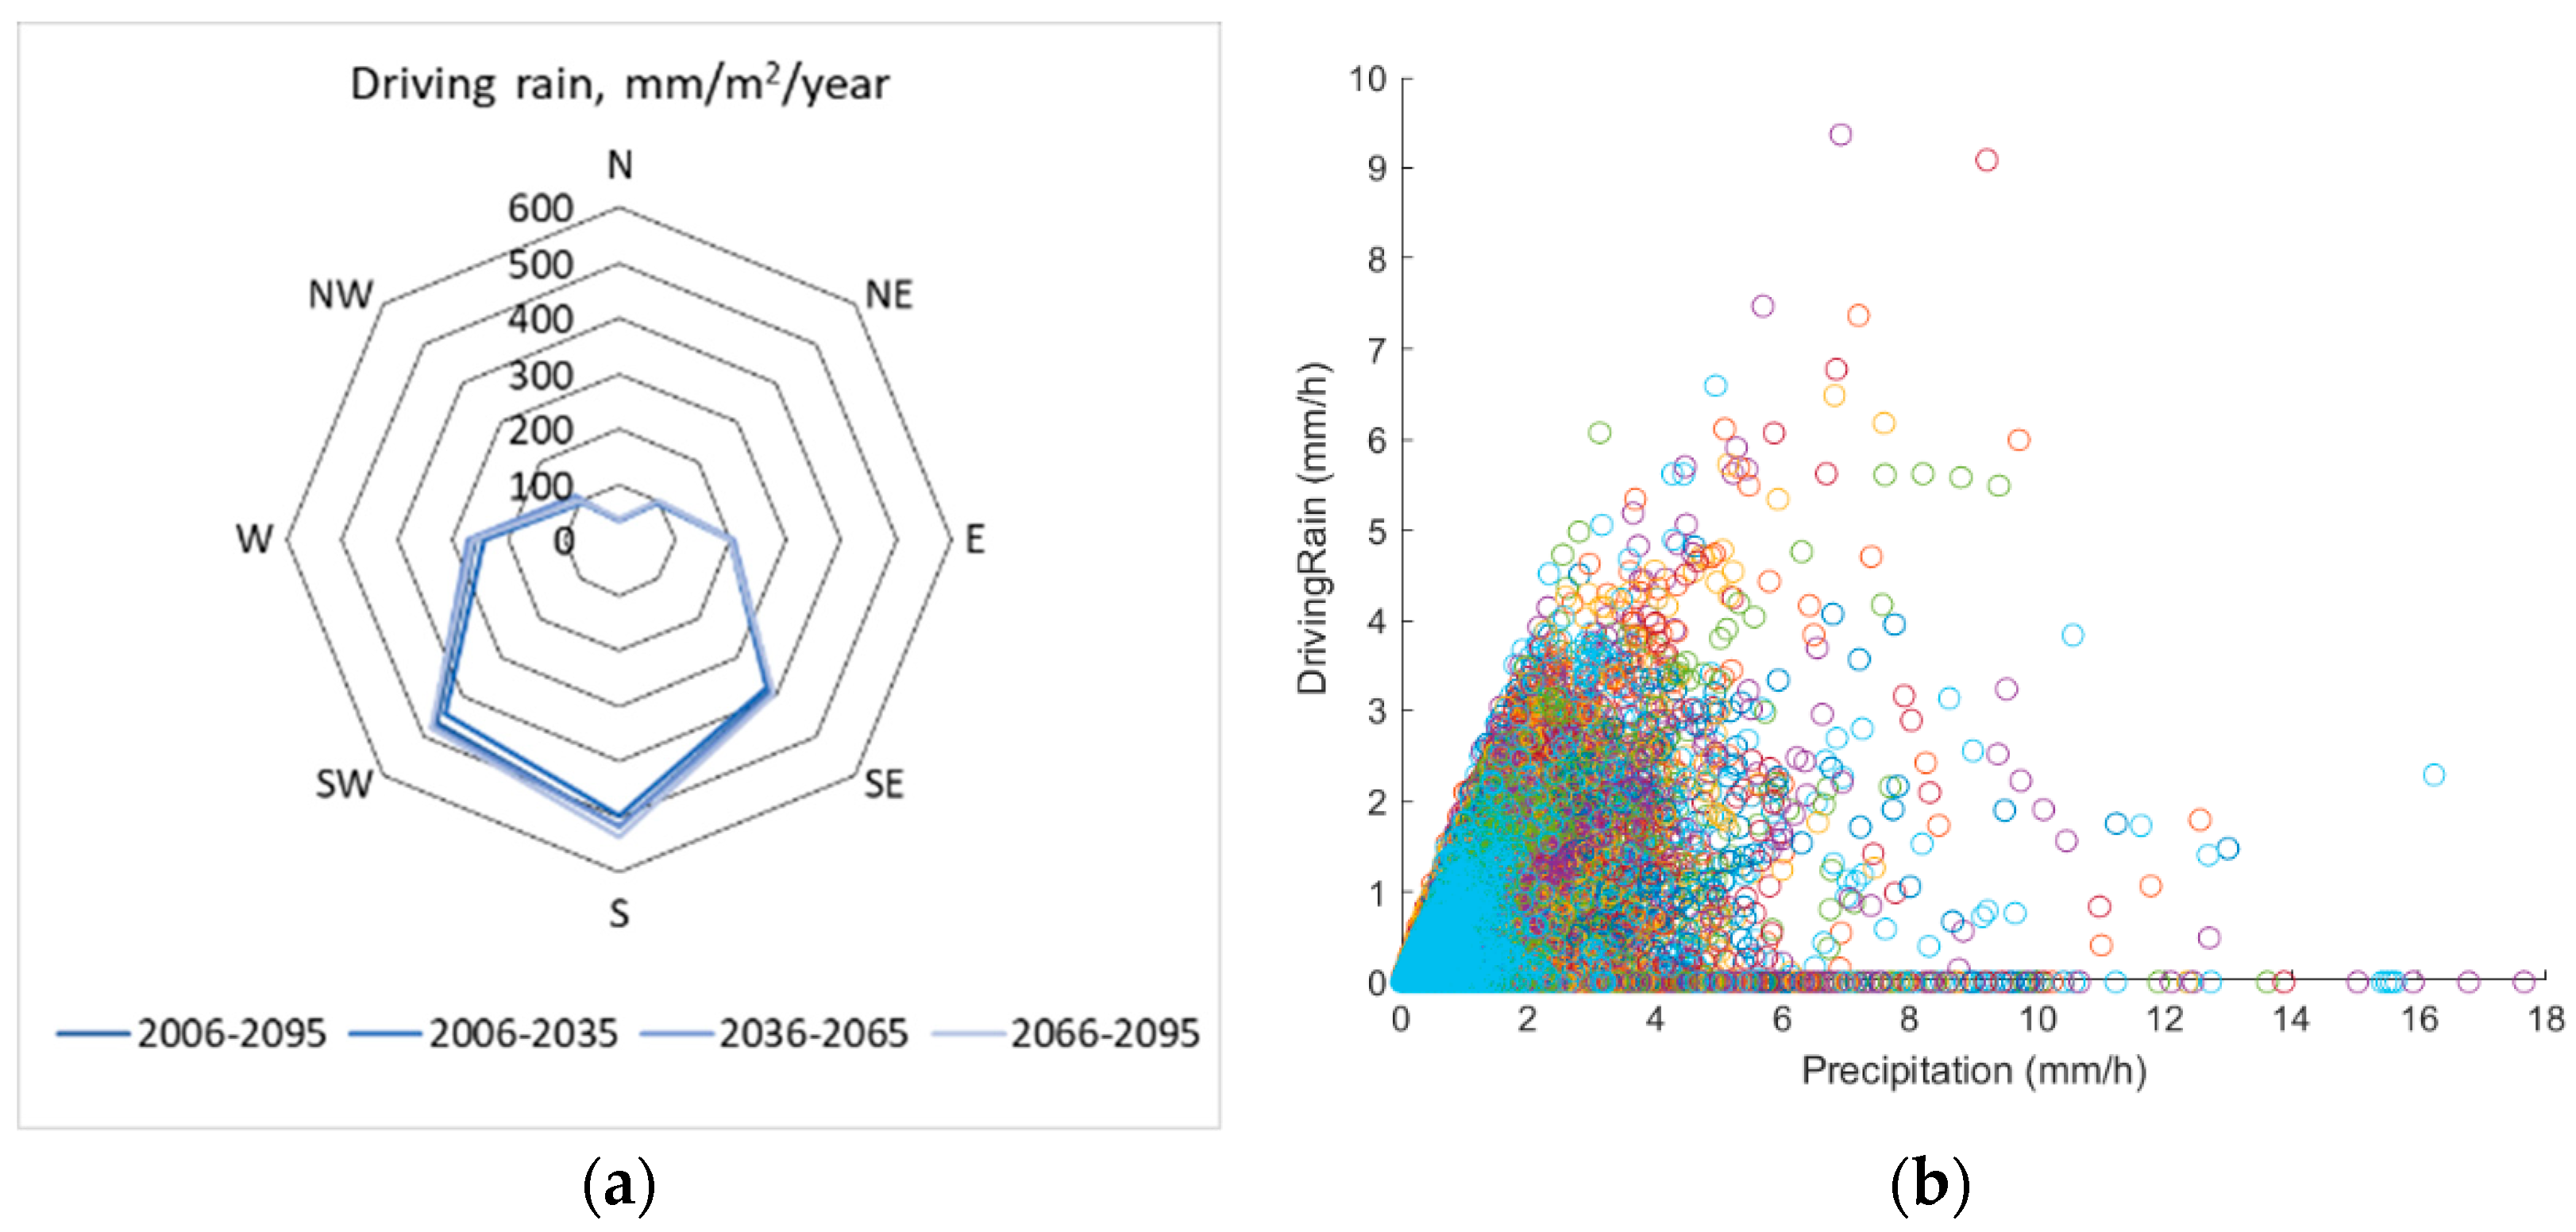
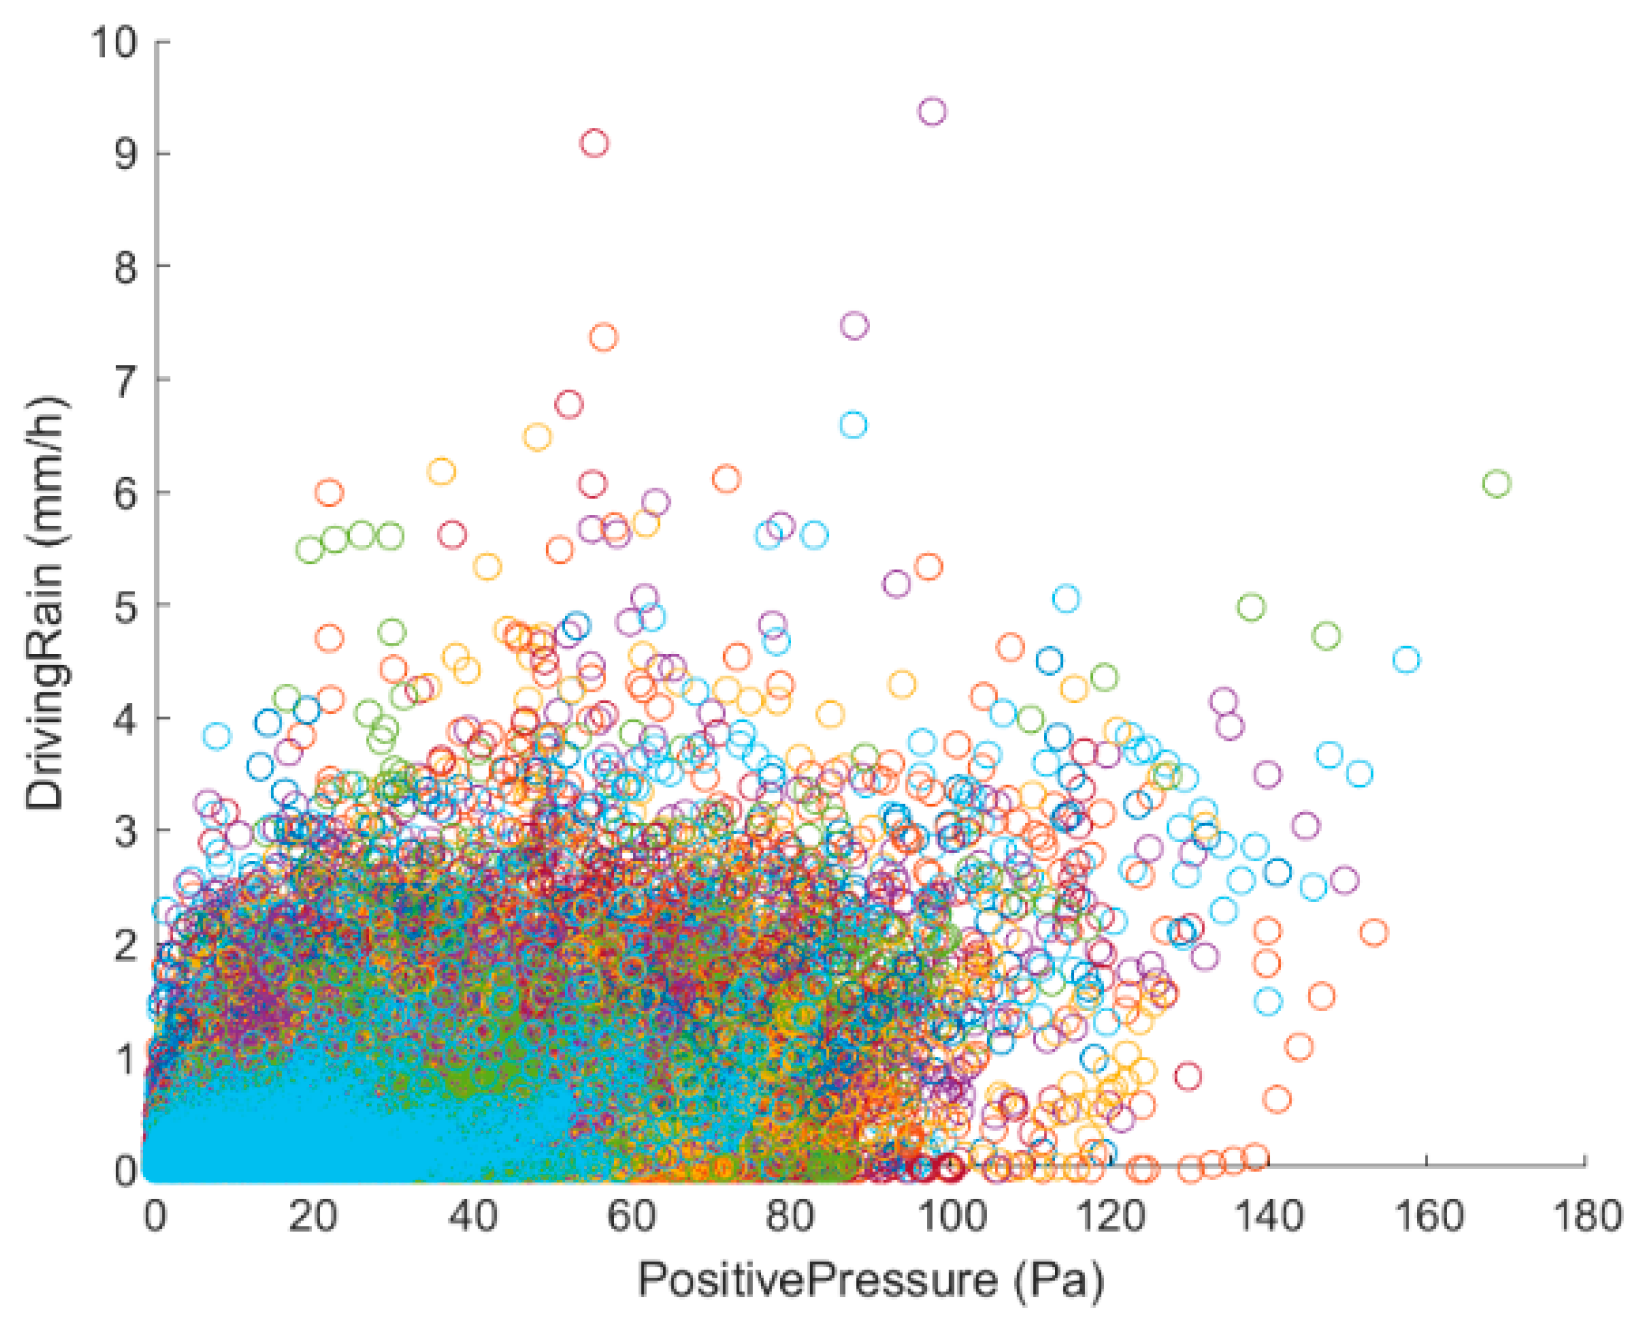
4.2.1. Climate Data
4.2.2. Results from Simulations
4.2.3. Tollgate 3
4.3. Evaluation Reporting, Tollgate 4
5. Discussion, Conclusions, and Future Work
5.1. Discussion on Technical Findings
5.2. Findings and Discussion on Evaluation Process
5.3. Conclusions and Suggestions for Future Work
- Further explorations of future climate scenarios, looking at different scenarios and locations;
- Laboratory testing to determine draining properties for joints using joint sealing tape;
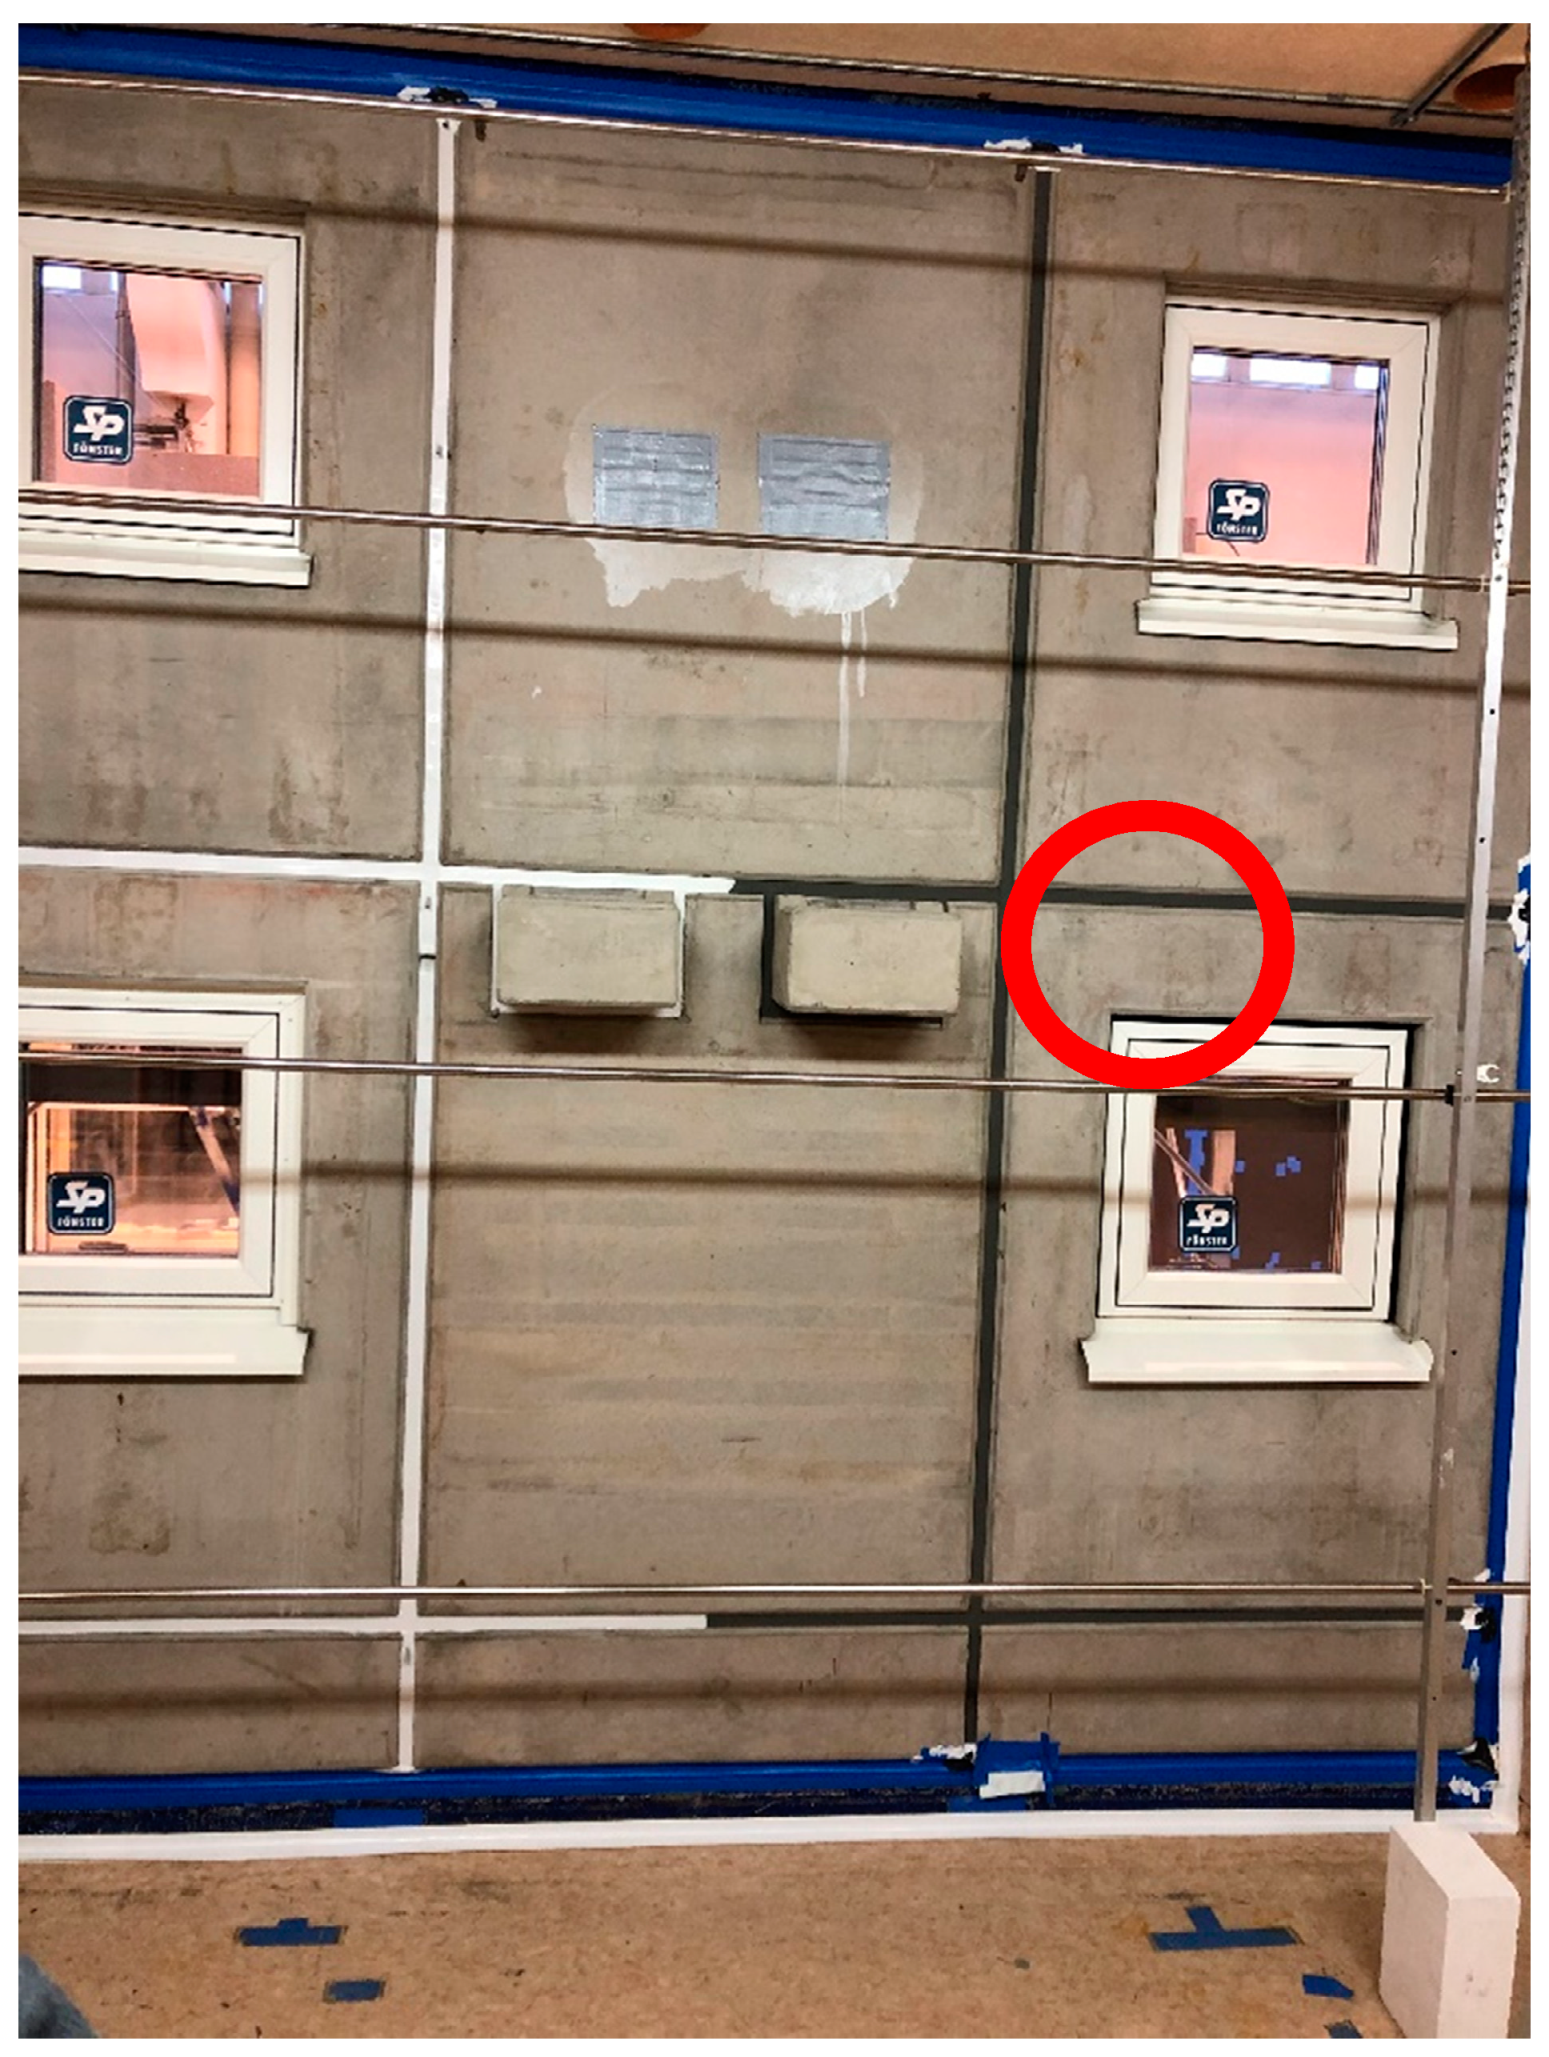
- Full-scale testing, including measurements and documentation of joint sealing tape in precast concrete sandwich facades, is suggested to verify the results. In addition, pressure differences over joint sealing tape are of interest. Before the full-scale testing, adequate documentation should be defined for the full-scale test to qualify as a reference case in future qualitative assessment. This could also be scaled to a generic requirement of documentation for reference cases.
- A risk assessment framework could be further explored by establishing generic questions to be answered at the different tollgates. This would facilitate the process for the design–build contractor and, thus, potentially increase the use of the framework and reduce serial failures.
Author Contributions
Funding
Institutional Review Board Statement
Informed Consent Statement
Data Availability Statement
Conflicts of Interest
Nomenclature
| Symbol | Parameter | Unit |
| Form factor (wind pressure), external | - | |
| Form factor (wind pressure), internal | - | |
| Moisture flow to buffer | kg/s | |
| Moisture flow through diffusion | kg/s | |
| Moisture flow through draining of wall | kg/s | |
| Moisture flow through leakage into wall | kg/s | |
| Moisture flow through ventilation | kg/s | |
| Correction term for wind speed according to xx | ||
| Pressure difference over building envelope due to wind | Pa | |
| Wind speed | m/s | |
| Wind direction | ||
| Wall direction | ||
| Air density | kg/m3 |
Appendix A

| Parameter | Unit | Value | Source/Motivation | |
|---|---|---|---|---|
| Wall direction | [°] | South | South façade exposed to high driving rain loads | |
| terrain roughness coefficient | [-] | 1.2 | [29] | |
| topography coefficient | [-] | 1 | [29] | |
| obstruction factor | [-] | 1 | [29] | |
| wall factor | [-] | 0.5 | [29] | |
| Fraction of heat resistance between exterior and joint air space | [W/m2K] | 0.13 | Industry practice, and supplier’s data: Utot ≈ 0.15 | |
| Internal temperature | [°C] | 21 | Industry practice, e.g., SVEBY. | |
| Ventilation rate of air space | [1/h] | 0 | The air space does not hold any ventilation openings. | |
| Equivalent area of diffusion, e.g., joint area | [m2] | 0.024 | Practice in construction industry (e.g., [24]) | |
| absorption coefficient for shortwave radiation | [-] | 0.65 | [40] | |
| radiation heat transfer coefficient | [W/(m2K)] | 4 | Based on mean temperature 8.8°C, | |
| convective heat transfer coefficient | [W/(m2K)] | 24 | = | |
| Sum of heat transfer coeffients | [W/(m2K)] | 28 | Sum of heat transfer coefficients for radiation and convection | |
| Albedo of surroundings | [-] | 0.2 | Estimated from [41] | |
References
- Brycke, E.; Svensson Tengberg, C. Fukt i Prefabricerade Betongsandwichelement. (Moisture in Precast Concrete Sandwich Elements) SBUF 13651; SBUF: Stockholm, Sweden, 2019. [Google Scholar]
- EOTA. “European Assessment Document. Joint Sealing Tape on the Basis of a Pre-Compressed Flexible Polyurethane Foam for Sealing around Windows and Joints in Building Facades,” European Organisation for Technical Assessment; EOTA: Brussels, Belgium, 2018. [Google Scholar]
- Farrington, E.S.; Anderson, T.; Grant, L.; Seraderian, R. Precast concrete-to-precast concrete facade joints using precompressed expandable foam. PCI J. 2019, 64, 80–91. [Google Scholar]
- Van Linden, S.; Van Den Bossche, N. Comperative study on the feasibility of watertight face-sealed building joints under simulated wind-driven rain conditions. Build. Res. Inf. 2021, Feb2021, 1–15. [Google Scholar] [CrossRef]
- Svensson Tengberg, C.; Hagentoft, C.-E. Introducing New Technical Solutions in the Swedish Construction Industry-Interviews with Key Actors. In Proceedings of the ASHRAE Thermal Performance of the Exterior Envelopes of Whole Buildings XIV International Conference, Clearwater, FL, USA, 9–12 December 2019; ASHRAE: Atlanta, GA, USA, 2019. [Google Scholar]
- Svensson Tengberg, C.; Hagentoft, C.E. Risk Assessment Framework to Avoid Serial Failure for New Technical Solutions Applied to the Construction of a CLT Structure Resilient to Climate. Buildings 2021, 11, 247. [Google Scholar] [CrossRef]
- Sasic, A.K.; Rode, C. Annex 55 RAP-RETRO. Framework for Probabilistic Assessment of Performance of Retrofitted Building Envelopes; Department of Civil and Environmental Engineering, Chalmers University of Technology: Göteborg, Sweden, 2015. [Google Scholar]
- Bednar, T.; Hagentoft, C.-E. Risk Management by Probabilistic Assessment. Development of Guidelines for Practice, IEA Annex 55, RAP-RETRO; Department of Civil and Enivronmental Engineering, Chalmers University of Technology: Göteborg, Sweden, 2015. [Google Scholar]
- Bryson, J.M. What to do when stakeholders matter. Stakeholder Identification and Analysis Techniques. Public Manag. Rev. 2004, 6, 21–53. [Google Scholar] [CrossRef]
- European Commission. Regulation (EU) No. 305/2011 of the European Parliament and the Council of 9 March 2011 on Harmonised Conditions for the Marketing of Construction Products. Construction Product Regulation (CPR); European Commission: Brussels, Belgium, 2011. [Google Scholar]
- Bedford, T.; Cooke, R. Probabilistic Risk Analysis: Foundations and Methods; Cambridge University Press: Cambridge, UK, 2001. [Google Scholar]
- SS-EN12865. Hygrothermal Performance of Building Components and Building Elements-Determination of the Resistance of External Wall Systems to Driving Rain under Pulsating Air Pressure; European Committee for Standardisation: Brussels, Belgium, 2001. [Google Scholar]
- Boverket. Boverket’s Mandatory Provisions and General Recommendations, BFS 2011:6 with Amendments up to BFS 2018:4; National Board of Housing, Building and Planning: Karlskrona, Sweden, 2018.
- EN14992:207+A1:2012. Precast Concrete Products-Wall Elements; European Committee for Standardization: Brussels, Belgium, 2012. [Google Scholar]
- EN13369:2018. Common Rules for Precast Concrete Products; European Committee for Standardization: Brussels, Belgium, 2018. [Google Scholar]
- DIN18542. Impregnated Sealing Tapes Made of Cellular Plastics for Sealing of Outside Wall Joints-Requirements and Testing; Deutsches Institut für Normung e. V.: Berlin, Germany, 2020. [Google Scholar]
- Betongelementföreningen. Bygga Med Prefab: Väggar och Fogar (Building Precast: Walls and Joints); Betongelementföreningen: Solna, Sweden, 2000. [Google Scholar]
- O’Hegarty, R.; Kinnane, O. Review of precast concrete sandwich panels and their innovations. Constr. Build. Mater. 2020, 233, 117–145. [Google Scholar] [CrossRef]
- Olsson, L. Regntäthet hos Prefabricerade Betongsandwichväggar Med Fönster-Och Balkonganslutningar (Rain Tightness in Precast Concrete Sandwich Facades with Windows and Balconies), SBUF13818; SBUF: Stockholm, Sweden, September 2021. [Google Scholar]
- Van Den Bossche, N. Watertightness of Building Components: Principles, Testing and Design Guidelines; Faculteit Ingenieurswetenschappen en Architectuur, Universiteit Gent: Gent, Belgium, 2013. [Google Scholar]
- Lacasse, M.A.; Miyauchi, H.; Hiemstra, J. Water Penetration of Cladding Components—Results from Laboratory Tests on Simulated Sealed Vertical and Horizontal Joints of Wall Cladding. J. ASTM Int. 2009, 6, 6. [Google Scholar] [CrossRef] [Green Version]
- Olsson, L. Results from laboratory tests of wind driven rain tightness in more than 100 facades and weather barriers. In Nordic Symposium Building Physics; NSB: Lund, Sweden, 2014. [Google Scholar]
- Svensk, B. Hus AMA 18 (General Material and Labour Description for House Building); Svensk Byggtjänst: Stockholm, Sweden, 2018. [Google Scholar]
- SFR. SFR Montageanvisning nr 1: Fogning Mellan Fasadelement av Betong. (Instruction No 1: Sealing of Joints between Concrete Panels); SFR Svenska Fogbranschens Riksförbund: Perstorp, Sweden, 1991; rev 2017. [Google Scholar]
- EN15651-1:2017. Sealants for Non-Structural Use in Joints in Buildings and Pedestrian Walkways-Part. 1: Sealants for Facade Elements; European Committee for Standardization: Brussels, Belgium, 2017. [Google Scholar]
- ISO11600:2002. Building Construction-Jointing Products-Classification and Requirements for Sealants; The International Organization for Standardization: Geneva, Switzerland, 2002. [Google Scholar]
- Nik, V. Making energy simulation easier for future climate–Synthesizing typical and extreme weather data sets out of regional climate models (RCMs). Appl. Energy 2016, 177, 204–226. [Google Scholar] [CrossRef]
- Nik, V.M. Application of typical and extreme weather data sets in the hygrothermal simulation of building components for future climate–A case study for a wooden frame wall. Energy Build. 2017, 154, 30–45. [Google Scholar] [CrossRef]
- SS-ENISO15927-3:2009. Hygrothermal Performance of Buildings-Calculation and Presentation of Climatic Data-Part. 3: Calculation of a Driving Rain Index for Vertical Surfaces from Hourly Wind and Rain Data; ISO: Geneva, Switzerland, 2009. [Google Scholar]
- Fraunhofer IBP WUFI Pro 5 Manual. Available online: https://wufi.de/en/service/downloads/ (accessed on 9 June 2021).
- Alexandersson, H. Vindstatistik för Sverige 1961–2004 (Wind Statistics for Sweden); SMHI Report 201: Norrköping, Sweden, 2006. [Google Scholar]
- Orme, M.; Liddament, M.; Wilson, A. Numerical Data for Air Infiltration and Natural Ventilation Calculations; AIVC: Coventry, UK, 1994. [Google Scholar]
- SMHI the Swedish Meteorological and Hydrological Institute, Open Data. Available online: www.smhi.se (accessed on 10 May 2021).
- ASHRAE. ANSI/ASHRAE Standard 160-2016. Criteria For Moisture-Control Design Analysis in Buildings; ASHRAE: Atlanta, GA, USA, 2016. [Google Scholar]
- Olsson, L. Driving Rain Tightness, Intrusion Rates and Phenomenology of Leakages in Defects of Façades: A New Calculation Algorithm; Chalmers University of Technology: Gothenburg, Sweden, 2018; ISBN 978-91-7597-813-0. [Google Scholar]
- FEBY. FEBY18. Kravspecifikation för Energieffektiva Byggnader. Bostäder och Lokaler. 2019. Available online: www.feby.se (accessed on 10 June 2021).
- EN1027:2016. Windows and Doors-Water Tightness-Test Method; European Committee for Standardization: Brussels, Belgium, 2016. [Google Scholar]
- EN12208. Windows and Doors-Watertightness-Classification; European Committee for Standardization: Brussels, Belgium, 2000. [Google Scholar]
- Rousseau, M.; Poirier, G.; Brown, W. Pressure Equalization in Rainscreen Wall Systems. Construction Technology Update No 17; National Research Council of Canada: Ottawa, ON, Canada, 1998. [Google Scholar]
- Hagentoft, C.-E. Introduction to Building Physics; Studentlitteratur AB: Lund, Sweden, 2001. [Google Scholar]
- Taha, H.; Akbari, H.; Rosenfeld, A.; Huang, J. Residential Cooling Loads and the Urban Heat Island-the Effects of Albedo. Build. Environ. 1988, 23, 271–283. [Google Scholar] [CrossRef]


| Actor | Implementation/Handling |
|---|---|
| Contractors, trade/company level | Contractor oversees the risk assessment. Knowledge on construction. |
| Developers/Property owners, trade/company level | Trade/company level needs to accept change to new solution when evaluated. Provides knowledge on property management. |
| Contractors, project managers | Contractor needs to accept the use of new solution when evaluated. Provides knowledge on construction as well as connecting building parts and works. |
| Suppliers, concrete panels | Supplier needs to provide relevant documentation and guarantees. Provides knowledge on concrete panels and experiences from other projects. |
| Suppliers, pre-compressed sealing tape | Supplier needs to provide relevant documentation and guarantees. Provides knowledge on pre-compressed joint sealing tape. |
| Sub-contractor, mounting concrete panels | Provides knowledge on practical issues during mounting. |
| Sub-contractor, sealant workers | Sub-contractor needs to provide guarantees when evaluated. Provides knowledge of application of products. |
| Design management/engineer | Design management needs to accept change to new solution when evaluated. Provides knowledge on relevant requirements in design. |
| Moisture consultant | Moisture consultant needs to make a risk assessment of solution and to accept change to new solution when evaluated. Provides knowledge on moisture and moisture damage. |
| Academia, building technology | Academia will be represented as workshop leaders. |
| Wild card | A wild card with only general knowledge could provide new perspectives |
| Main Topic: Basic Requirement | Applicability to Technical Solution |
|---|---|
| 1. Mechanical resistance and stability | Load transfer in joints between panels assumed negligible. |
| Load transfer in joints between panel and structure assumed negligible. | |
| Durability should be equivalent to traditional solution. * | |
| The solution should be able to handle dimensional tolerances according to practice. | |
| 2. Safety in case of fire | Fire performance should be equivalent to traditional solution. * |
| 3. Hygiene, health and environment | The technical solutions should not hold any harmful substances. |
| Critical moisture levels of materials in sandwich panels and materials of joints should not be exceeded. Main materials are concrete panels, insulation material, reinforcement bars and sealing material. The results should also be related to a current solution using sealant on backing rod with a drained and ventilated air gap. | |
| Water should not be accumulated in construction. Water from driving rain through joints and other normal imperfections should not be accumulated to harmful levels in sandwich panel, with no leakage to indoors. The results should also be related to traditional solution. * | |
| Air tightness should be equivalent to traditional solution. * | |
| 4. Safety in accessibility in use | Impact on safety in accessibility is assumed to be negligible. |
| 5. Protection against noise | Acoustic performance should be equivalent to traditional solution. * |
| 6. Energy economy and heat retention | Thermal performance should be in line with traditional solution * or assessed to be of minor impact to overall thermal performance. |
| 7. Sustainable use of natural resources | Other environmental issues not included in the assessment. |
| Disassembly is not included in the assessment. | |
| 8. Other | Working conditions should not cause any unacceptable work safety issues. Other work safety issues not included. |
| Aesthetics should be acceptable over time. | |
| Costs should be acceptable. |
| Panel Width | Temperature Movement | Joint Width, Theoretic * | Joint Width, Actual ** |
|---|---|---|---|
| 4 m | 3 mm | 16 mm | 8–24 mm |
| 6 m | 5 mm | 24 mm | 16–30 mm |
| 8 m | 7 mm | 32 mm | 24–40 mm |
| Target | Stage/Location | Identified Risk | Votes |
|---|---|---|---|
| 3 | Operation/Material | Leakage: Material | 2 |
| 3 | Operation/Material | Leakage: Joints in material | 12 |
| 3 | Operation/Panel | Leakage: Connection to panel | 7 |
| 3 | Operation/Material | Water trapping: Material | 6 |
| 3 | Operation/Panel | Water trapping: Panel | 9 |
| 8 | Operation/Material | Aesthetics unacceptable | 8 |
| 1,3,8 | Operation/Material | Aging unacceptable | 7 |
| 2 | Operation/Panel | Fire safety issues | 0 |
| 8 | Operation/Material | Maintenance issues | 3 |
| 8 | Operation/Panel | Costs unacceptable | 2 |
| 3 | Operation/Material | Environmental issues | 1 |
| - | -/- | Other | 1 |
| Parameter (Mean Values) | All Data 2006–2095 | Present 2006–2035 | Short Term 2036–2065 | Long Term 2066–2095 | Unit |
|---|---|---|---|---|---|
| Temperature | 8.8 | 8.3 | 8.8 | 9.2 | °C |
| Relative Humidity | 80.0 | 79.4 | 80.1 | 80.5 | % |
| Precipitation | 1048 | 1008 | 1069 | 1067 | mm/y |
| Wind Speed | 4.4 | 4.4 | 4.3 | 4.3 | m/s |
| Longwave Radiation | 2645 | 2531 | 2650 | 2674 | kWh/m2/y |
| Shortwave Radiation | 1186 | 1194 | 1181 | 1183 | kWh/m2/y |
| Precipitation sub 0 °C * | 16 | 21 | 15 | 12 | mm/y |
| Driving Rain, S ** | 516 | 497 | 516 | 535 | mm/y |
| Object/Test | Pressure Step (Pa) | Actual Pressure (Pa) | Leakage (kg/h) |
|---|---|---|---|
| 1/1 * | 0–300 | 187 | Indication |
| 1/2 | 0–450 | 173 | Indication |
| 1/3 ** | 0–150 | 52 | 0.06 |
| 1/3 ** | 0–300 | 110 | 0.27 |
| 1/3 ** | 0–450 | 173 | 0.28 |
| 2/1 * | 0–150 | 64 | Indication |
| 2/2 | 0–450 | 110 | 0.33 |
| 2/2 | 0–600 | 149 | 0.42 |
| 2/3 ** | 0–300 | 80 | 0.67 |
| Parameter | Unit | Distribution | Range | Source/Motivation | |
|---|---|---|---|---|---|
| Outdoor climate | Year | IntU | Y2006 | Y2035 | Climate data for Gothenburg [27] |
| Buffer capacity | kg | N | μ = 0.25 | σ = 0.05 | Typical short-time buffering was set to 0.25 kg, equal to 1 cm in joint. Sub-zero values were set to zero. |
| Catch area | m2 | U | 1.4 | 2.8 | Maximum catch area was one storey, obstructions may have occurred on the half wall. |
| Rain leakage | % driving rain | N | μmax = 0.4 | σmax = 0.25 | Assumption based on [19]. Linear increase from zero at 52 Pa to a maximum value at 176 Pa. Sub-zero values were set to zero. |
| Water vapour resistance | s/m | U | 3000 | 14,000 | Supplier’s data on joint sealing tape/WUFI calculation including influence of concrete. |
| Water Drainage | Number of Simulated Years | Unit | ||||
|---|---|---|---|---|---|---|
| 50 | 1000 | 2000 | 4000 | 5000 | ||
| Drained water, mean | 1.50 | 2.05 | 2.01 | 2.04 | 2.04 | kg/year |
| Drained water, SD | 1.70 | 1.78 | 1.75 | 1.77 | 1.78 | kg/year |
| Water Drainage | South | West | North | East | Unit |
|---|---|---|---|---|---|
| Yearly, mean | 2.04 | 0.58 | 0.00 | 0.03 | kg/year |
| Yearly, SD | 1.78 | 0.80 | 0.01 | 0.11 | kg/year |
| Day maximum, mean | 0.30 | 0.15 | 0.00 | 0.02 | kg/day |
| Day maximum, SD | 0.28 | 0.22 | 0.00 | 0.05 | kg/day |
| Day maximum, 95th percentile | 0.82 | 0.51 | 0.00 | 0.11 | kg/day |
| Water Drainage | All Years 2006–2095 | Present 2006–2035 | Long-Term 2066–2095 | Unit |
|---|---|---|---|---|
| Yearly, mean | 2.04 | 1.99 | 2.13 | kg/year |
| Yearly, SD | 1.78 | 1.83 | 1.89 | kg/year |
| Yearly day maximum, mean | 0.30 | 0.27 | 0.33 | kg/day |
| Yearly day maximum, SD | 0.28 | 0.26 | 0.30 | kg/day |
| Yearly day maximum, 95th percentile | 0.82 | 0.75 | 0.93 | kg/day |
| Water Drainage | Measurements [19] | ASHRAE [34] | Unit |
|---|---|---|---|
| S, 2006–2095 | S, 2006–2095 | ||
| Yearly, mean | 2.04 | 10.10 | kg/year |
| Yearly, SD | 1.78 | 2.96 | kg/year |
| Yearly day maximum, mean | 0.30 | 0.52 | kg/day |
| Yearly day maximum, SD | 0.28 | 0.18 | kg/day |
| Yearly day maximum, 95th percentile | 0.82 | 0.88 | kg/day |
| Identified Risk (Target) | Available Documentation and Recommended Action | Assessment |
|---|---|---|
| Leakage: Material (3) | Assessment: Available product documentation assessed as adequate, although products tested (7–12 mm) are below used range. Products tested and classified according to European standard on water tightness for windows and doors [37,38]. Recommendation: Require documentation on the specific product. Product should comply with national standard on driving rain class 9A. Size of product should be chosen at site according to supplier´s recommendation, actual width of joint and prevailing conditions. | QlRA |
| Leakage: Joints in material (3) | Assessment: Available documentation on performance assessed as incomplete. The test setup according to European standard on water tightness for windows and doors does not necessarily cover joints in materials although a test setup for braces is suggested in the EAD. Quantitative assessment indicates substantial water leakage in exposed facades, while less exposed facades are less affected. Recommendation: Full-scale testing in a building, combined with comprehensive monitoring of moisture conditions and documentation of conditions are recommended to create a documented and evaluated reference case before implementing in additional buildings. | QRA |
| Leakage: Connection to panel (3) | Assessment: Available documentation on performance assessed as incomplete. The test setup according to European standards on water tightness for windows and doors [37] is based on slender aluminium bars, not concrete surfaces. Recommendation: Full-scale testing in a building, combined with comprehensive monitoring of moisture conditions and documentation of conditions are recommended to create a documented and evaluated reference case before implementing in additional buildings. | QRA |
| Water trapping: Material (3) | Assessment: Available product documentation assessed as incomplete. Properties concerning vapour permeability are documented; however, there are no documented properties concerning water content or sorption. Recommendation: Require documentation on specific product. Low potential of holding water is assumed positive. | QlRA |
| Water trapping: Panel (3) | Assessment: Available documentation on performance regarding drainage assessed as incomplete. No verified drainage properties of product or design are given, only assumptions draining properties differ from tests using pulsating pressure. Quantitative assessment indicates substantial need for controlled drainage of exposed facades. Recommendation: Require documentation on draining properties using static pressure. Draining properties are assessed quantitively, indicating substantial draining water to be handled. Full-scale testing in a building, combined with comprehensive monitoring of moisture conditions and documentation of conditions are recommended to create a documented and evaluated reference case before implementing in additional buildings. | QRA |
| Aesthetics unacceptable (8) | Assessment: Available documentation show examples of design. Reference cases are given. Recommendation: Aesthetics should be evaluated for the specific application within the construction project based on available documentation or by visiting given reference cases. | QlRA |
| Aging unacceptable (1, 8) | Assessment: Available product documentation states expected life expectancy of more than 25 years, but the boundary conditions for this assessment is unclear. However, the EAD [2] states it is based on a 10 year service life. Reference to the DIN standard [16] on UV resistance and on compatibility to other materials. Critical moisture conditions are not defined. Recommendation: Require documentation on specific products, including boundary conditions, with full validation reports for assessment on applicability to prevailing conditions. | QlRA |
| Fire safety issues (2) | Assessment: Available documentation substandard, using national standards in other countries and providing different classifications (B and F, respectively) for same product. Recommendation: Require documentation on specific product, using applicable national standard. Include in fire safety documentation of the project. | QlRA |
| Maintenance issues (8) | Assessment: Available product documentation exists where no maintenance issues are stated except for replacing the material after service life. However, service life is unclear (see “Aging unacceptable”). Recommendation: Require documentation on specific product and include in operation and maintenance plan of the project. | QlRA |
| Costs unacceptable (8) | Assessment: No technical issue and, thus, not handled in this assessment.Recommendation: Handle in the estimation. | - |
| Environmental issues (3) | Assessment: Available product documentation on content existing for products. Life cycle assessment is not provided. Recommendation: Require documentation on specific products and check for compliance to applicable building regulations and requirements in the project. | QlRA |
| Other (-) | Assessment: No technical issue and, thus, not handled in this assessment. Recommendation: Assess and document questions arising in implementation. | - |
Publisher’s Note: MDPI stays neutral with regard to jurisdictional claims in published maps and institutional affiliations. |
© 2021 by the authors. Licensee MDPI, Basel, Switzerland. This article is an open access article distributed under the terms and conditions of the Creative Commons Attribution (CC BY) license (https://creativecommons.org/licenses/by/4.0/).
Share and Cite
Svensson Tengberg, C.; Olsson, L.; Hagentoft, C.-E. Risk Assessment of Joint Sealing Tape in Joints between Precast Concrete Sandwich Panels Resilient to Climate Change. Buildings 2021, 11, 343. https://doi.org/10.3390/buildings11080343
Svensson Tengberg C, Olsson L, Hagentoft C-E. Risk Assessment of Joint Sealing Tape in Joints between Precast Concrete Sandwich Panels Resilient to Climate Change. Buildings. 2021; 11(8):343. https://doi.org/10.3390/buildings11080343
Chicago/Turabian StyleSvensson Tengberg, Charlotte, Lars Olsson, and Carl-Eric Hagentoft. 2021. "Risk Assessment of Joint Sealing Tape in Joints between Precast Concrete Sandwich Panels Resilient to Climate Change" Buildings 11, no. 8: 343. https://doi.org/10.3390/buildings11080343
APA StyleSvensson Tengberg, C., Olsson, L., & Hagentoft, C.-E. (2021). Risk Assessment of Joint Sealing Tape in Joints between Precast Concrete Sandwich Panels Resilient to Climate Change. Buildings, 11(8), 343. https://doi.org/10.3390/buildings11080343