Article

The Improvement of Indoor Air Quality in Residential Buildings in Dubai, UAE

Department of Architecture, College of Architecture, Art and Design, Ajman University, P.O. Box 346 Ajman, United Arab Emirates
*
Author to whom correspondence should be addressed.
Buildings 2021, 11(6), 250; https://doi.org/10.3390/buildings11060250
Submission received: 10 May 2021 / Revised: 2 June 2021 / Accepted: 4 June 2021 / Published: 10 June 2021

Abstract

:
Due to unprecedented urbanization, UAE had built many new residential projects with poor choices of material and ventilation. This social phenomenon is leading UAE to Sick Building Syndrome (SBS) faster than any other countries. The Dubai Municipality regulates the indoor air quality with strict stipulation, but the detailed regulations are still insufficient. The objective of this paper is to measure the indoor air quality of new residential projects in Dubai to suggest the improvement of the regulations for indoor air quality. As a methodology, a field survey was conducted to investigate the status of indoor air pollution in residential buildings. Based on the field survey data, lab experiments for building materials were conducted and a computer simulation on radon gas was conducted. The result had shown that radon gas was mainly detected in new townhouses and labor camp houses, and its concentration was found to exceed the standard. Volatile organic compounds (VOCs) and formaldehyde (CH2O) were mainly detected in showhouses and new townhouses, and the concentration distribution was about 10 times higher than that of outdoors. It was proven that emission concentration of radon gas from various building materials were detected, and the order was red clay, gypsum board, and concrete. Volatile organic compounds (VOCs) are mainly detected in oil paints and PVC floor and the radiation amount of all pollutants increased with temperature increase. In computer simulation, it was found that a new townhouse needs a grace period from 20 days to 6 months to lower the radon gas concentration by 2 pCi/L. This study will serve as a basic data to establish more detailed regulation for the building materials and improve the IAQ standards in Dubai.

1. Introduction

Improving air quality is on the United Arab Emirates (UAE) government’s aspiration for a long time [1] and one of the goals in UAE National Vision 2021 is to enhance the outdoor air quality in the country to 90% by 2021 [2]. The UAE monitors outdoor air via the UAE AQI (Air Quality Index) regularly [3], and the Ministry of Climate Change and Environment is improving the national standards with its partners in the public and private sector and already achieved 89% in 2020 [4]. While outdoor air quality is being controlled systematically, however, clean indoor air becomes more imperative in the era of global pandemic [5,6]. The residents in UAE spend considerable amount of time indoors due to scorching summer and no clear demarcation between one season and the other [7,8]. The exposure to indoor air pollutants in long term can cause serious damage to health [9]. According to a UAE Health Ministry and Dubai Healthcare City reports, 15% of Dubai residents have chronic respiratory disease such as asthma [10,11]. Moreover, 90% of the 150,000 patients at Al Ain Hospital suffered from respiratory diseases of the upper respiratory tract, bronchitis, or asthma [12]. Due to the unprecedented urbanization, UAE had built many new residential projects with poor choices of material and ventilation [13,14]. This social phenomenon is leading UAE to Sick Building Syndrome (SBS) faster than any other countries [15].
The Dubai Municipality regulates the IAQ (Indoor Air Quality) with the stipulation of less than 0.08 ppm (parts per million) of formaldehyde, less than 300 micrograms/m3 of TVOC (Total Volatile Organic Compound), and less than 150 micrograms/m3 of suspended particulates (less than 10 microns) in 8 h of continuous monitoring prior to occupancy [16,17]. These IAQ standards need to be continuously adhered in a stringent manner [18], but as lack of ventilation due to continuous air conditioning and indiscriminate use of unproven finishing materials have increased, indoor air quality deteriorates day by day, threatening the health of residents [19,20]. Exposure to polluted air in the long term can lead residents to lowered immunity, respiratory ailments, hypersensitivity, allergies and susceptibility to viruses [21]. The UAE government aspires to develop and implement a green building initiative to control the SBS phenomenon [22,23]. In Dubai, the Emirates Green Building Council have taken initiatives to implement the sustainable building practices by Green Building Codes, and it will be a prerequisite and applicable to all new buildings in the UAE [24,25]. This study aims to measure the indoor air quality of a new residential projects in Dubai to verify whether Dubai Municipality’s IAQ standard is thoroughly complied, and to suggest the improvement of the standard for indoor air quality for the Green Building Codes.

2. Materials and Methods

Indoor air pollution refers to the condition of air pollution in various indoor spaces (houses, schools, offices, public buildings, hospitals, underground facilities, transportation, etc.) [6]. The reasons for indoor air pollution are very complex pollutant sources from both inside and outside, and the impact is clearly affecting the health of indoor occupants, if not to the extent that they are life-threatening [26]. To mitigate these problems, Dubai needs to adopt the progressive decarbonization of the energy system eventually, and the transition from traditional fuels to renewable sources for electricity generation is required [27]. According to recent research, indoor air pollutants include total suspended particles (TSP), nitrogen dioxide (NO2), carbon monoxide (CO), and carbon dioxide (CO2) from smoking and combustion gases [28]. As a natural radioactive material, radon gas, which is present in construction materials such as soil, cement, concrete, marble, sand, mud, brick, and gypsum board, is released into the air and causes lung cancer when inhaled by the residents [29,30,31]. In addition, contaminants such as formaldehyde (CH2O) and volatile organic compounds (VOCs) are released from composite materials and insulation materials such as wood and rubber, paints and adhesives, plastics and synthetic resins [32,33,34]. On the other hand, PVC-based (polyester-based and urethane-based) materials are widely used for flooring [35]. Most of these products are petrochemical products and generate toxic gases in case of fire [36]. In addition, it is known to emit pollutants such as volatile organic compounds (VOCs) and DEHP (di-(2-ethylhexyl)-phthalate) that cause unpleasant odors, respiratory irritation, fatigue, nausea, or decreased concentration in a room with limited openings [37].
Most pollutants in indoor air are known to be mainly emitted from construction materials, combustion fuels, household goods, and smoking [38]. The concentration of pollutants appears to be lower than that of the factory environment that handles large amounts of pollutants, but it is reported that the concentration of pollutants remains much higher than that of the outside air [39]. In particular, in the case of new buildings, the concentration distribution is as high as 100 times [40], and the types of building materials used are so diverse that it is difficult to grasp the discharge characteristics of pollutants [41]. Air quality standards are set by dividing into indoor environment, outdoor environment, and work environment because the occurrence of pollutants and the degree of impact on occupants are different according to each environmental characteristic [42]. In the case of European indoor air quality (IAQ) standards, the Air Quality Guidelines for Europe were already established in 1987, centered on the WHO, and various research results on indoor air environment and health have been accumulated [43,44,45]. In the States, ventilation regulations for maintaining the indoor air environment in consideration of indoor air quality for occupants are proposed from EPA (Environmental Protection Agency) and ASHRAE (The American Society of Heating, Refrigerating and Air Conditioning Engineers) [46,47]. As such, most advanced countries have already implemented detailed regulations on the emission of pollutants from indoor spaces. Table 1 below compares the indoor air quality standards of advanced countries.
The purpose of this study is to measure the indoor air quality of a new different building-type residential projects in Dubai to determine whether the IAQ standard is thoroughly complied, and to suggest the improvement of the standard for indoor air quality in the UAE. The characteristics of the indoor air quality were examined, and the pollution status of the indoor air quality was analyzed via a field survey of new different building-type residential projects in Dubai. Based on the analysis of the field survey data, the intensity of emission was determined in the laboratory among the different building materials that emit relatively large amounts of pollutants in the field survey. In addition, by conducting computer simulation, the status of building material application is to be verified since the detailed regulations on building material for indoor air quality are very insufficient [48]. If it is necessary, the improvement of building material standards should be urgently established for Sick Building Syndrome (SBS) [49,50].

3. Results

3.1. Field Survey

In this study, in order to investigate the current status of indoor air pollution in residential buildings, the pollution status was measured for various residential buildings such as new house, existing house, and show house in the UAE over the past three years from 2018 to 2020. The measurement is carried out by measuring air pollutants such as radon gas, volatile organic compounds (VOCs), formaldehyde (HCH2O), nitrogen dioxide (NO2), carbon dioxide (CO2) and total suspended particles (TSP).
Radon gas measurement was performed using the Radon WL Meter, which calculates the average concentration of indoor radon by alpha count detection [51]. At this time, the measuring point was 0.5 m from the floor and measured indoors and outdoors simultaneously. The measurement is the value obtained by performing the main measurement (at least 24 h) after the preliminary measurement (2 h) [52] and the ventilation frequency was 0.3 times/h. In Table 2, the distribution of average contamination concentration of radon gas was in the order of 2.55 pCi/L for existing labor camp houses, 1.46 pCi/L for new townhouses, 0.79 pCi/L for existing townhouses, and 0.03 pCi/L for showhouses. High pollution concentrations were seen in new townhouses due to radon gas’ short half-period and labor camp houses with insufficient ventilation and poor landscape. In particular, the radon contamination concentration values in the labor camp house far exceeded the standard value (ASHRAE: 2 pCi/L) [53], and in the case of a new townhouse, the contamination concentration distribution was about 12 times higher than that of the outdoors.
As for the volatile organic compounds, an air sampler was used as an activated carbon adsorbent according to the guidelines of NIOSH (1501) [54,55]. After collecting on-site for about 2–3 h at a flow rate of 200 cc/min at the height of human breathing (measured at four points at the same time), it was sealed and refrigerated, and then desorbed with CS2 solution and quantitatively analyzed by GC (HP, FID method) [56]. At this time, the Capillary Column is used exclusively for the fine concentration of VOCs in the room (60 m × 0.25 mm × 0.25 m) [57]. Formaldehyde was measured for an average of 2 h at the height of the human respiratory line using a passive bubbler monitor (four points were measured at the same time), and then the concentration was analyzed with a sorbing solution [58]. In the measurement results of contamination of volatile organic compounds (VOCs) and formaldehyde (CH2O), the highest concentration was detected in showhouses built mainly with finishing materials such as latex paint and calking agent, chipboard, plywood, and adhesive. In particular, a high pollution distribution was detected in new houses due to a short period of emission of pollution concentration after construction. All of these values were found to exceed the standard value, and in particular, the volatile organic compounds of the new townhouses was detected at a value that is about 10 times higher than that of the outdoors.
Nitrogen dioxide concentration is the result of concentration analysis by Spectrophotometer after collecting for 1 week by simultaneously installing at three points at the height of the breathing line 1.5 m away from the kitchen gas stove using a personal sampler of the Palmes tube [59]. In general, the concentration of nitrogen dioxide (NO2), generated from cooking gas appliances, was measured only for existing townhouses. The average concentration of nitrogen dioxide (NO2) pollutants during cooking was 36.8 ppb, showing a maximum concentration distribution of 60.8 ppb. It has been found that such a value does not exceed the standard (50 ppb).
For carbon dioxide (CO2), Portable GasTec (0–5000 ppm) in CMCD-10P format was used [60] and total suspended particles (dust) was measured using a light scattering type of dust track [61]. All are averaged values, measured for 2–3 h at 10 min intervals at the height of the respiratory line. In the indoor environment, carbon dioxide (CO2), mainly generated by combustion devices and human breathing, does not cause poisoning or physical disability by themselves. However, it is used as an indicator of indoor air quality because it increases proportionally when other pollutant concentrations increase. The pollution concentration of carbon dioxide (CO2) showed a very high concentration distribution value of 3001.8 ppm on average, especially in a labor camp house where ventilation was absolutely insufficient. It was also found that contaminants of dust (TSP) also had a high concentration distribution of 179.3 g/m3 in the labor camp house and all of these values greatly exceeded the respective reference values (1000 ppm, 150 g/m3).

3.2. Laboratory Experiment Results of Indoor Air Pollutants

Based on the above indoor air quality field survey results, a laboratory experiment for building materials, which produce many pollutants, was conducted to measure the contaminants released per unit area. In particular, as a result of the field survey, it was found that the concentration of indoor air pollution in the building showed a large difference depending on the structure of the building, that is, the finishing material composition and the ventilation condition of the building [62]. Therefore, in laboratory measurements, radon gas, mainly released from soil, cement, concrete, marble, sand, mud, brick, and gypsum board [63], volatile organic compounds (VOCs), generated from wood, rubber, paints, adhesives, plastics, and synthetic resins [64], and environmental hormones (DEHP (di-(2-ethylhexyl)-phthalate)), generated from PVC-based construction flooring materials such as polyester and urethane [65], are studied. Laboratory measurements are intended to quantitatively determine the concentration of pollutants according to the type of building material, and each of two sealed stainless steel and glass cylindrical models is implemented with a size of 0.14 m3 (diameter 0.5 m, height 0.7 m).
The measurement results of radon radiation in building materials were in the order of red clay, gypsum board, concrete, and cipolin. It was the highest detected in red clay (5.2 times that of general concrete) and showed a high concentration (3.6 times that of general concrete) in gypsum board. In particular, it was confirmed that radon gas was highly radiated from the ceramic itself by showing a high radiation amount of about 1.6 times (7.2 times that of general concrete) than the general red clay in the red clay mixed with ceramic. However, when a material such as concrete, gypsum board, and red clay from which radon gas is released is steam-cured, the amount of radon radiation is significantly reduced. In particular, in the case of red clay, by confirming that the radiation amount of radon is decreasing when the surface is finished with another material, it was found that the radiation amount of radon gas can be reduced to a certain level depending on the composition of the wall and the degree of surface treatment (Table 3).
Table 4 is the measurement of the amount of emission of volatile organic compounds (VOCs) pollutants in paint. The paint materials were compared and analyzed between general petrochemical product and imported natural materials-based product. In order to determine the amount of radiation according to the temperature difference, the laboratory temperature was measured by dividing it into cooling and non-cooling. As a result, it was found that volatile organic compounds (VOCs) pollutants were highly detected in paints of petrochemical products [66]. In particular, it can be seen that the oil paint shows a higher radiation dose value of about 30 times that of the aqueous paint [67]. In addition, it was confirmed that the radiation amount was significantly increased as the temperature increased.
Table 5 is a measurement of the radiation amount of volatile organic compounds pollutants emitted per unit surface area in a closed laboratory targeting three types of PVC floor (Pet, Non UV, UV). The change in the amount of pollutant emission according to the rise of the floor temperature was also measured at the same time. As a result, all pollutants of volatile organic compounds were detected in PVC floor (Non UV-Pet-UV in order). UV (Ultraviolet) products refer to products with improved quality by adding stain resistance and scratch resistance to existing PVC products (Pet, Non-UV) and performing surface treatment. It was found that when the floor temperature was heated to 35 °C and 50 °C, based on the average temperature of 25 °C, the radiation amount increased up to 14.8 times. It was also confirmed that the amount of polluted radiation was decreasing depending on the surface treatment condition of the product.

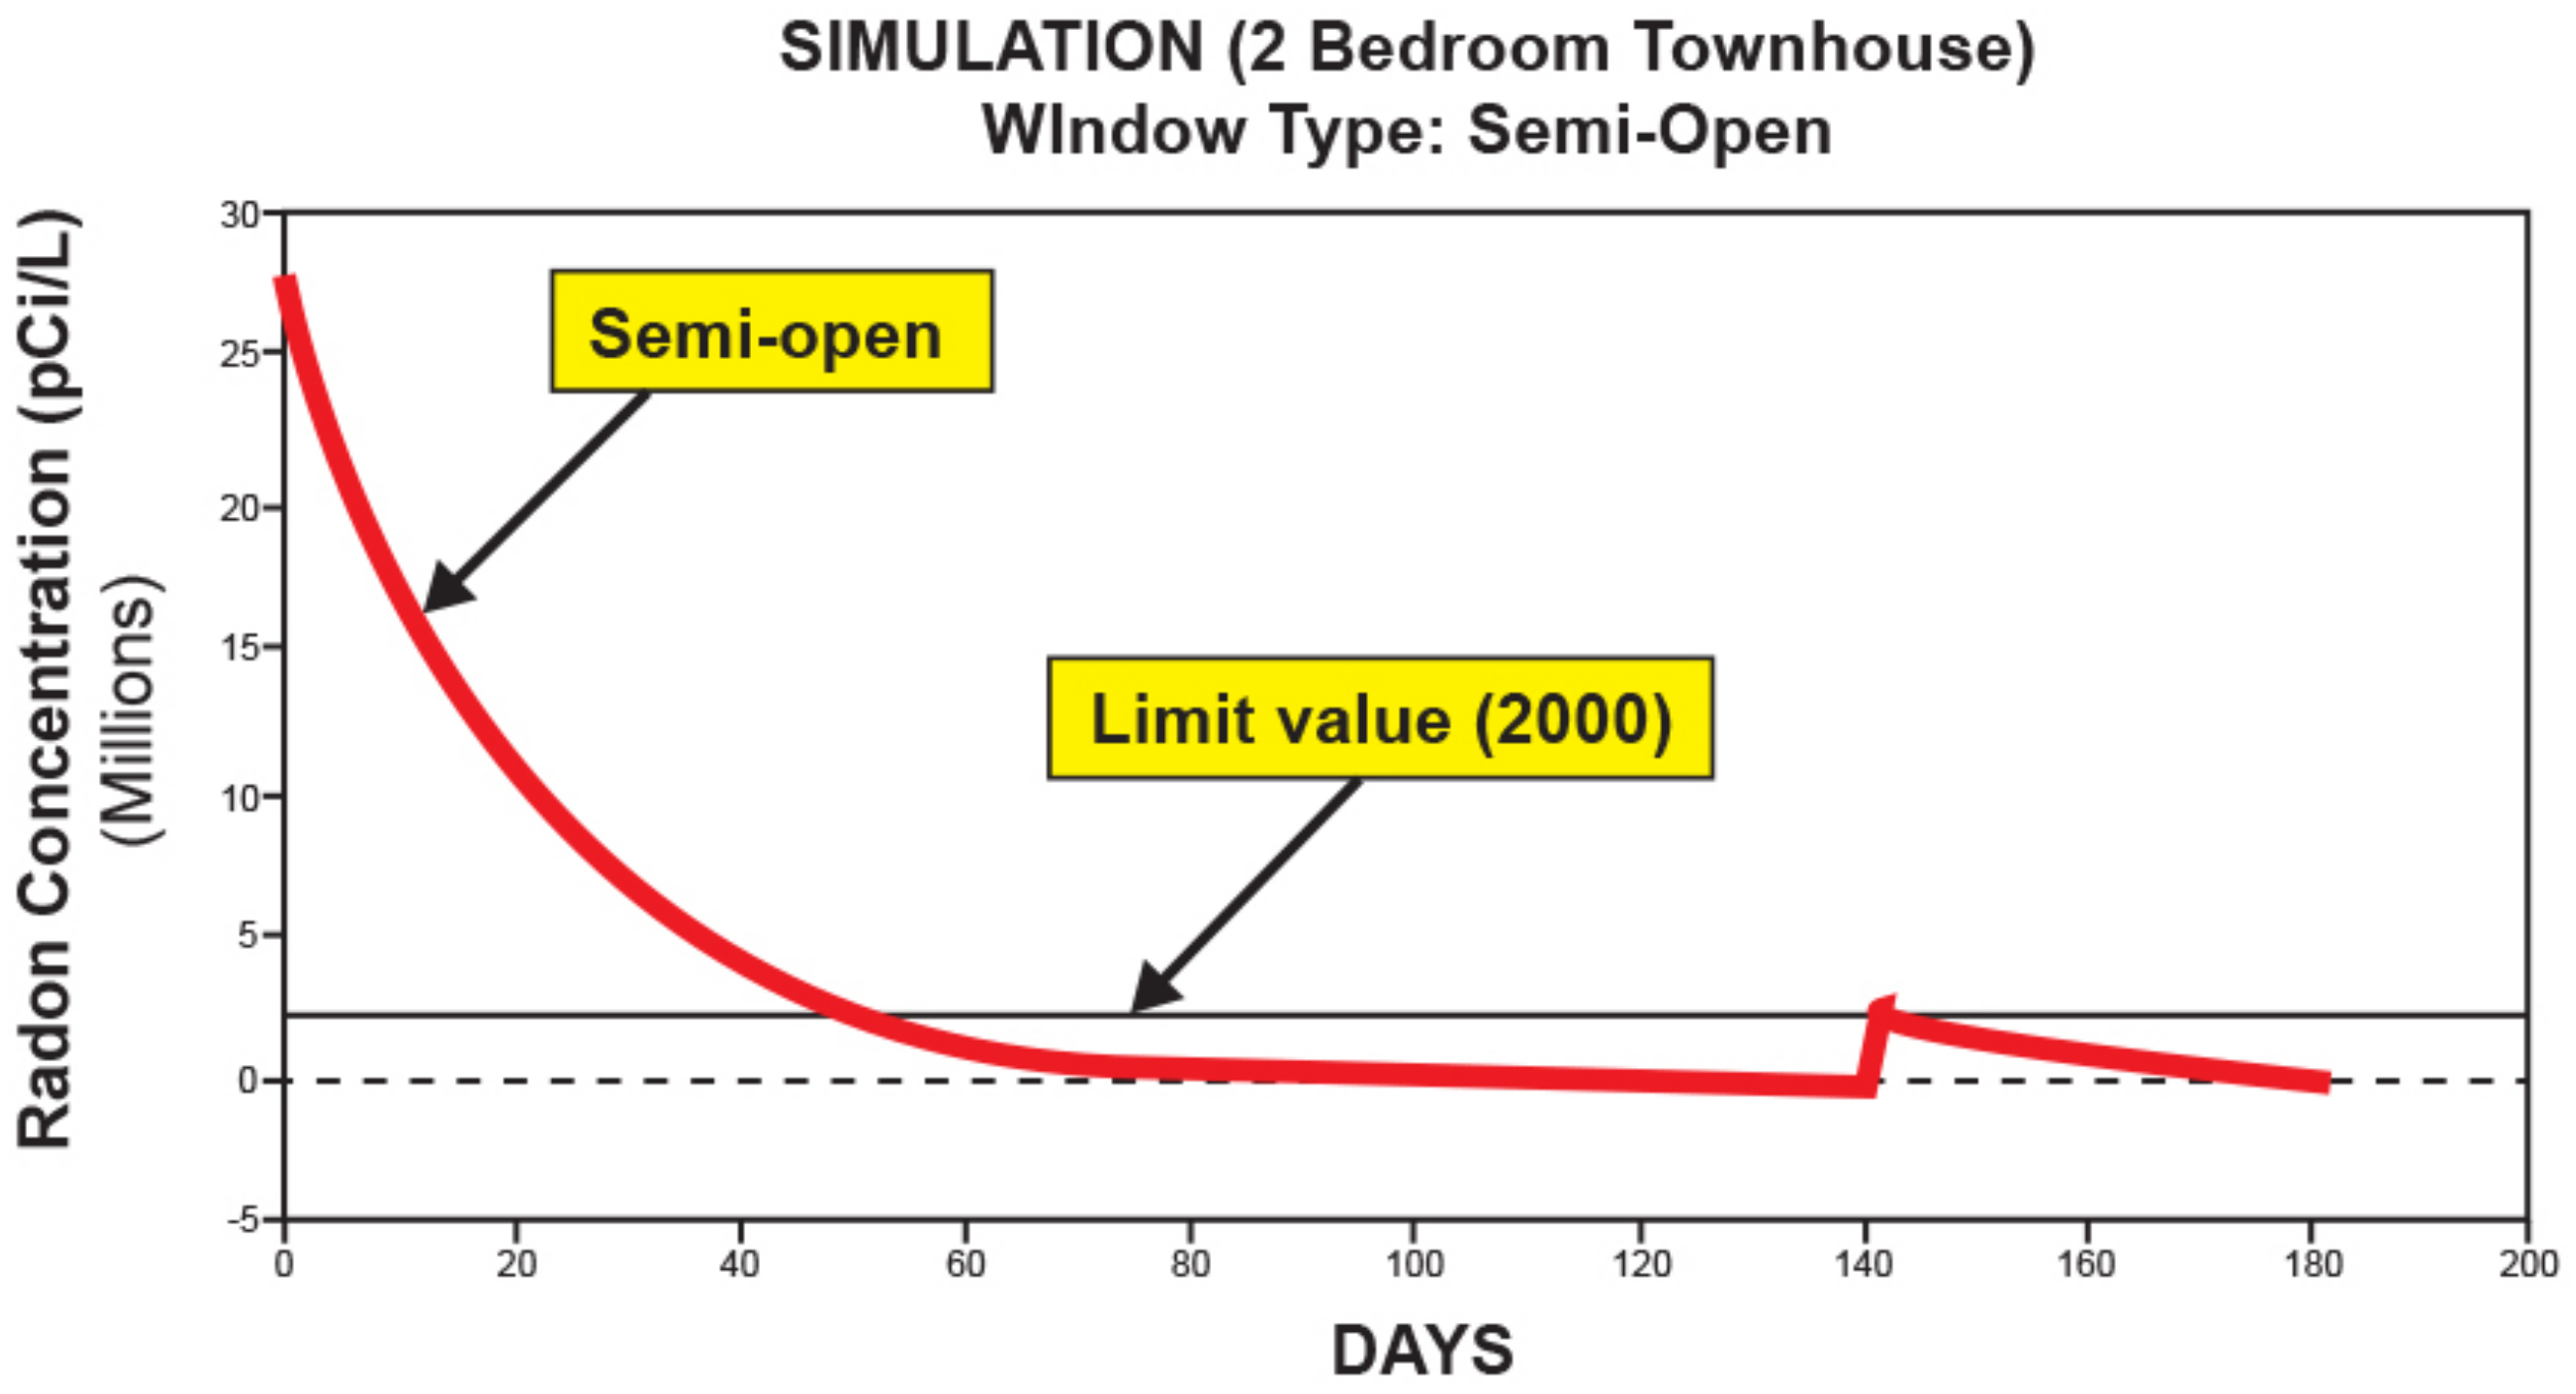
3.3. Simulation on Radon Gas

Computer simulation, focused on radon gas, was conducted to devise a plan to improve the indoor air quality of the building. It is not easy to determine the number of pollutants and their reduction rate, but radon gas was selected because data had accumulated from many field surveys and laboratory measurements. Since radon gas concentration is particularly high in new townhouses and labor camp houses, simulations were conducted by dividing into two as follows. In case of a new townhouse, the period to fall below the standard was calculated by considering the half-period of radon gas (Simulation-1), and in case of the labor camp house where the radon concentration is detected as high, the period of falling below the standard was calculated (Simulation-2). Simulation-1 is a case of calculating the period according to the radon half-period in the new townhouse, and the input data are as follows. First, the size of the house was 190 m2, which is the average size of a 2-bedroom townhouse in Dubai in 2018 [68]. Since radon gas is mainly released from concrete and gypsum board, it is assumed that it is released immediately after the completion of concrete curing. Even if the construction is finished, the radon concentration and duration were calculated based on the condition of the windows (closed, semi-open, fully open) until moving in. The measurement of ozone (O3) is excluded since ozone (O3) is measured mostly for the public space’s IAQ [69] and is not part of the Dubai Municipality’s regulations for housing IAQ standards. At this time, the ventilation amount was calculated as follows according to the opening condition, and the crack ratio was calculated as 2.5 cm2/lmc [linear meter of crack] by ASHRAE (Table 6).
Ci = S Q   [ 1 exp Qt V ] + Co
Equation (1) is an equation that calculates the concentration C2 at the time t2, given the concentration C1 and the time t1 at that time. It is an equation that calculates the change in concentration as a function of time, amount of generation, volume, and ventilation rate. Additionally, the expression that the generation of radon gas (S) changes with time (St) is as follows.
S t = S o × exp a × t
Here, therefore, is the initial content; a is the constant at which the rate of occurrence decreases with time (negative number means decrease), and S(t) is the amount of occurrence over time. The results of Simulation-1 are as follows (Figure 1, Figure 2 and Figure 3). Figure 1 shows the change in radon concentration according to the amount of natural ventilation when the opening is closed after the completion of the concrete frame construction in a new house. Figure 2 shows that when the opening is semi-opened without sealing after the completion of the concrete frame construction, the period for the contamination concentration to be less than the standard is about 40 days. Figure 3 shows that when the opening is completely opened after the concrete frame construction, the period of less than the standard is about 20 days. However, even if the contamination concentration drops below a certain level within a short period of time due to the introduction of a large amount of ventilation, when the opening is closed again, the contamination concentration rises again, and the contamination concentration has a close relationship with ventilation, but the emission time is also related.
Simulation-2 is to quantitatively analyze the change of pollution concentration according to the amount of ventilation in a labor camp house with weak ventilation. It is assumed that the same amount of radon gas is continuously emitted from the four walls under the condition with one ventilation window and one opening in a 18 m2 rectangular single room. At this time, the measured value of the pollutant radiation was applied in the previous section (Table 7).
The governing equation to solve Simulation-2 was the law of conservation of mass (Navier–Stokes equation), law of momentum conservation equation (continuity equation), the law of conservation of energy, and the convective–diffusion equation (concentration equation) (Equations (3)–(5)).
Continuity equation:
x i ρ u i = 0
Navier–Stokes equation:
x j ρ u j u i = p x i + τ i j x j
Concentration equation:
x j ρ u j C = x j µ S C + u t σ c C x j + S C
In this study, using the computer program PHOENICS 2018 Version 2, the number of ventilations of the room was changed in four steps from 0.5 times/h, 1.0 times/h, 3 times/h, and 5 times/h, and the results are as follows (Figure 4, Figure 5, Figure 6 and Figure 7). Figure 4 shows the average concentration of radon gas in the case of a ventilation frequency of 0.5 times/h in a labor camp house with a size of 18 m2 (5.56 pCi/L), which far exceeded the standard value (2 pCi/L). Figure 5 shows the ventilation volume increased to 1 time/h, Figure 6 is 3 times/h, and in Figure 7 the ventilation volume is increased to 5 times/h. As a result of the simulation, the pollution concentration gradually decreased as the ventilation volume increased, and the average concentration at the ventilation volume 5 times/h was lowering to 2.06 pCi/L, which is the standard level (2.0 pCi/L).

3.4. Results

The pollution of indoor air quality in various residential building types in Dubai is as follows. Radon gas was mainly detected in new townhouses and labor camp houses, and concentration values were mostly exceeding the standards. In addition, it was found that pollutants of volatile organic compounds (VOCs) and formaldehyde (CH2O) are mainly detected in showhouses built with fast-track mode with paint, chipboard, plywood, and adhesives, and in new townhouses that have a short, elapsed time after completion. The concentration distribution was about 10 times higher than that of outdoors. On the other hand, it was confirmed that in the labor camp house where ventilation was absolutely insufficient, pollutants such as carbon dioxide (CO2) and dust (TSP) were very high, and both significantly exceeded the standard. In particular, in the case of carbon dioxide (CO2), it was found that countermeasures against labor camp houses are urgent.
Measurement of the emission concentration of contaminants according to various building materials in a closed laboratory is as follows. The amount of radon gas emitted from soil and building structures was highest in the red clay, in the order of red clay, gypsum board, and concrete. However, it has also been found that even if the contamination concentration is radiated, the radiation amount of the contamination level can be reduced to a certain level by appropriately controlling the composition of the wall and the degree of surface treatment. Volatile organic compounds (VOCs) were mainly detected in paints. In particular, it was detected in a larger amount in oil paint than in aqueous paint, and it was confirmed that the amount of radiation was further increased with the temperature increase. Meanwhile, it was confirmed that almost no contaminants were detected from natural paint. In addition, volatile organic compounds (VOCs) contaminants were also detected in PVC floor material, and the amount of radiation was also increasing with temperature rise. However, like radon gas, it was confirmed that the amount of radiation was also decreasing depending on the surface treatment condition of the product.
The computer simulation results to devise a plan to improve the indoor air quality of the building are as follows. The simulation regarding radon gas were explored with two scenarios, a new townhouse (Simulation-1) and an existing labor camp house (Simulation-2). Simulation-1 is the calculation of the change in concentration and period according to the opening and closing status (natural ventilation) of the opening after the completion of the concrete frame in the new townhouse. The period of less than the standard value (2 pCi/L) was about 190 days when the opening was closed, about 40 days when half-opened, and about 20 days when opened. Therefore, in the case of new buildings, it was found that a grace period of 20 days to about 6 months was necessary to lower the radon contamination concentration below the standard value. However, it can be seen that the pollution concentration is related not only to the ventilation volume but also to the radiation time. Simulation-2 is to quantitatively analyze the change of pollution concentration according to the amount of mechanical ventilation in the labor camp house, an 18 m2 rectangular single-room with poor ventilation. While changing the number of ventilations of the room in four steps from 0.5 times/h, 1.0 times/h, 3 times/h, and 5 times/h, the average concentrations of radon gas were decreasing to 5.56 pCi/L, 5.37 pCi/L, 3.48 pCi/L, and 2.06 pCi/L, respectively.

4. Discussion

Comparatively speaking, UAE residents spend more time indoors due to desert climate with hot summer, in which average maximum temperatures reach above 45 °C. This is the reason why the exposure to indoor air pollutants is more problematic in UAE. According to Dubai Healthcare City reports, 15% of Dubai residents have a chronic respiratory disease such as asthma. Based on UAE Health Ministry, 90% of patients at Al Ain Hospital suffered from respiratory diseases. Moreover, because of fast urbanization with an unprecedented pace, UAE had built many new residential projects with poor material and ventilation. This social phenomenon is leading UAE to Sick Building Syndrome (SBS) faster than any other countries.
Even though the Dubai Municipality regulates the IAQ (Indoor Air Quality) with the stipulation of less than 0.08 ppm (parts per million) of formaldehyde, less than 300 micrograms/m3 of TVOC (Total Volatile Organic Compound), and less than 150 micrograms/m3 of suspended particulates (less than 10 microns) in 8 h of continuous monitoring prior to occupancy, the status of application needs to be verified since the detailed regulations on building material for indoor air quality are very insufficient. If it is necessary, the improvement of standards should be urgently established for SBS.
This study can be served as a basic data to establish more detailed regulation for the building materials and improve the IAQ standards in Dubai. Moreover, it was found that urgent attention is needed for labor camp houses. In the UAE, labor camp houses are the most neglected area, as employer companies ignore the rights of the workers even though stringent rules and regulations are enforced in UAE [70]. The challenge is to enhance the quality of the congested labor camp room, where 12–14 workers sleep with bunk beds [71]. This was the place where most of the COVID-19 cases in UAE came from in the era of pandemic. The future study will be focused on IAQ of the labor camp housing.

5. Conclusions

This study aims to improve the indoor air quality of residential buildings in Dubai, and the results of the study are summarized as follows.
First, radon gas was mainly detected in new townhouses and labor camp houses, and its concentration was found to exceed the standard value. Volatile organic compounds (VOCs) and formaldehyde (CH2O) were mainly detected in showhouses and new townhouses, and the concentration distribution was about 10 times higher than that of outdoors. In addition, in the case of carbon dioxide (CO2) and dust (TSP), the value were greatly exceeded than standard in the labor camp house.
Second, as a result of measuring the emission concentration of pollutants according to various building materials in a closed laboratory, radon gas is in the order of red clay, gypsum board, and concrete. It was detected the highest in red clay, which is 5.2 times that of concrete. Volatile organic compounds (VOCs) are mainly detected in oil paints and PVC floor, and the radiation amount of all pollutants increased with temperature increase. However, it has also been found that the radiation amount of the pollution can be reduced to a certain level depending on the surface treatment.
Third, in the computer simulation, it was found that in the case of a new townhouse, a grace period from 20 days to about 6 months is needed for the radon contamination concentration to be below the standard value (2 pCi/L) after the completion of the concrete frame construction. However, it was confirmed that the pollution concentration was not only related to the ventilation amount, but also the radiation time. In addition, in a labor camp house where ventilation is weak, the pollution concentration according to the amount of mechanical ventilation was decreasing with the amount of ventilation.
In order to improve the indoor air quality of a building, it is necessary to establish more detailed regulation for the rational selection and use of building materials. Not only can the municipality set up detailed regulation, but also manufacturers and contractors should be aware of pollutant emissions and take active countermeasures. Labor camp houses should recognize that ventilation is absolutely insufficient due to their structural characteristics, and more effective and continuous ventilation measures should be taken for the spread of pollution. However, above all, for a more fundamental solution, improvement and re-establishment of standards that can cope with various indoor spaces must be established.

Author Contributions

All authors contributed significantly to this study. C.J. and J.A. identified and secured the example buildings used in the study. The data acquisition system and installations of sensors were designed and installed by C.J. and J.A. J.A. was responsible for data collection. Data analysis was performed by C.J. The manuscript was compiled by C.J. and reviewed by J.A. All authors have read and agreed to the published version of the manuscript.

Funding

This research was funded by Ajman University.

Institutional Review Board Statement

The study was conducted according to the guidelines of Ajman University Research Ethics Committee.

Informed Consent Statement

Informed consent was obtained from all subjects involved in the study.

Data Availability Statement

New data were created or analyzed in this study. Data will be shared upon request and consideration of the authors.

Acknowledgments

The authors would like to express their gratitude to Ajman University for the generous support to publish this paper.

Conflicts of Interest

The authors declare no conflict of interest.

References

  1. Improving Air Quality. 2021. Available online: https://u.ae/en/information-and-services/environment-and-energy/improving-air-quality (accessed on 10 April 2021).
  2. Air Quality Index: Sustainable Environment and Infrastructure. 2018. Available online: https://www.vision2021.ae/en/national-agenda-2021/list/card/air-quality-index (accessed on 12 April 2021).
  3. Air Quality in Dubai: Air Quality Index (AQI) and PM2.5 Air Pollution in Dubai. 2021. Available online: https://www.iqair.com/united-arab-emirates/dubai (accessed on 14 April 2021).
  4. Gugler, P.; Alburai, M.; Stalder, L. Smart City Strategy of Dubai, 1st ed.; Harvard Business School: Cambridge, MA, USA, 2021; pp. 10–14. [Google Scholar]
  5. Here Is Why You Need to Improve Indoor Air Quality during COVID-19. 2020. Available online: https://www.financialexpress.com/lifestyle/here-is-why-you-need-to-improve-indoor-air-quality-during-covid-19/2005904/ (accessed on 16 April 2021).
  6. Amoatey, P.; Omidvarborna, H.; Baawain, M.S.; Al-Mamun, A. Indoor air pollution and exposure assessment of the gulf cooperation council countries: A critical review. Environ. Int. 2018, 121, 491–506. [Google Scholar] [CrossRef]
  7. Sick Building Syndrome: The Killer within 2011. Available online: https://www.khaleejtimes.com/nation/general/sick-building-syndrome-the-killer-within (accessed on 26 May 2021).
  8. Hachicha, A.A.; Al-Sawafta, I.; Said, Z. Impact of dust on the performance of solar photovoltaic (PV) systems under United Arab Emirates weather conditions. Renew. Energy 2019, 141, 287–297. [Google Scholar] [CrossRef]
  9. Mannucci, P.M.; Franchini, M. Health effects of ambient air pollution in developing countries. Int. J. Environ. Res. Public Health 2017, 14, 1048. [Google Scholar] [CrossRef]
  10. Ahmed, R.; Robinson, R.; Mortimer, K. The epidemiology of noncommunicable respiratory disease in sub-Saharan Africa, the Middle East, and North Africa. Malawi Med. J. 2017, 29, 203–211. [Google Scholar] [CrossRef] [PubMed] [Green Version]
  11. Sick Building Syndrome Fixes. 2007. Available online: https://www.arabianbusiness.com/sick-building-syndrome-fixes-55788.html (accessed on 27 May 2021).
  12. Sick Building Syndrome—Don’t Let Your Home Make You Ill. 2017. Available online: https://gulfnews.com/business/property/sick-building-syndrome----dont-let-your-home-make-you-ill-1.1955765 (accessed on 28 May 2021).
  13. Johnson, R.M.; Babu, R.I.I. Time and cost overruns in the UAE construction industry: A critical analysis. Int. J. Constr. Manag. 2020, 20, 402–411. [Google Scholar] [CrossRef]
  14. Al-Hajj, A.; Hamani, K. Material waste in the UAE construction industry: Main causes and minimization practices. Archit. Eng. Des. Manag. 2011, 7, 221–235. [Google Scholar] [CrossRef]
  15. Sick Buildings Are Leading to Sick UAE Office Workers, Doctors Say. 2016. Available online: https://www.thenationalnews.com/uae/health/sick-buildings-are-leading-to-sick-uae-office-workers-doctors-say-1.175866 (accessed on 26 May 2021).
  16. Let’s Not Forget Indoor Air Quality as Well. 2020. Available online: https://gulfnews.com/business/analysis/lets-not-forget-indoor-air-quality-as-well-1.1589873286956#:~:text=The%20Dubai%20Municipality%20standard%20for,of%20continuous%20monitoring%20pre-occupancy (accessed on 24 May 2021).
  17. Green Building Regulations & Specifications. 2021. Available online: https://www.dewa.gov.ae/~/media/Files/Consultants%20and%20Contractors/Green%20Building/Greenbuilding_Eng.ashx (accessed on 4 April 2021).
  18. Abdul-Wahab, S.A.; En, S.C.F.; Elkamel, A.; Ahmadi, L.; Yetilmezsoy, K. A review of standards and guidelines set by international bodies for the parameters of indoor air quality. Atmos. Pollut. Res. 2015, 6, 751–767. [Google Scholar] [CrossRef]
  19. Fadeyi, M.O.; Alkhaja, K.; Sulayem, M.B.; Abu-Hijleh, B. Evaluation of indoor environmental quality conditions in elementary schools’ classrooms in the United Arab Emirates. Front. Archit. Res. 2014, 3, 166–177. [Google Scholar] [CrossRef] [Green Version]
  20. Ibrahim, H.A. Indoor Air Quality in UAE Office Buildings and Their Effects on Occupants’ Health, Comfort, Productivity and Performance. Ph.D. Thesis, The British University in Dubai, Dubai, United Arab Emirates, 2015. [Google Scholar]
  21. Pérez-Padilla, R.; Schilmann, A.; Riojas-Rodriguez, H. Respiratory health effects of indoor air pollution. Int. J. Tuberc. Lung Dis. 2010, 14, 1079–1086. [Google Scholar]
  22. Gharzeldeen, M.N.; Beheiry, S.M. Investigating the use of green design parameters in UAE construction projects. Int. J. Sustain. Eng. 2015, 8, 93–101. [Google Scholar] [CrossRef]
  23. Najini, H.; Nour, M.; Al-Zuhair, S.; Ghaith, F. Techno-Economic Analysis of Green Building Codes in United Arab Emirates Based on a Case Study Office Building. Sustainability 2020, 12, 8773. [Google Scholar] [CrossRef]
  24. Small, E.P.; Al Mazrooei, M. Evaluation of construction-specific provisions of sustainable design codes and standards in the United Arab Emirates. Procedia Eng. 2016, 145, 1021–1028. [Google Scholar] [CrossRef] [Green Version]
  25. Abu-Hijleh, B.; Jaheen, N. Energy and economic impact of the new Dubai municipality green building regulations and potential upgrades of the regulations. Energy Strategy Rev. 2019, 24, 51–67. [Google Scholar] [CrossRef]
  26. Mannan, M.; Al-Ghamdi, S.G. Indoor Air Quality in Buildings: A Comprehensive Review on the Factors Influencing Air Pollution in Residential and Commercial Structure. Int. J. Environ. Res. Public Health 2021, 18, 3276. [Google Scholar] [CrossRef]
  27. Sofia, D.; Gioiella, F.; Lotrecchiano, N.; Giuliano, A. Cost-benefit analysis to support decarbonization scenario for 2030: A case study in Italy. Energy Policy 2020, 137, 111137. [Google Scholar] [CrossRef]
  28. Yeatts, K.B.; El-Sadig, M.; Leith, D.; Kalsbeek, W.; Al-Maskari, F.; Couper, D.; Olshan, A.F. Indoor air pollutants and health in the United Arab Emirates. Environ. Health Perspect. 2012, 120, 687–694. [Google Scholar] [CrossRef] [PubMed]
  29. Ye, W.; Zhang, X.; Gao, J.; Cao, G.; Zhou, X.; Su, X. Indoor air pollutants, ventilation rate determinants and potential control strategies in Chinese dwellings: A literature review. Sci. Total Environ. 2017, 586, 696–729. [Google Scholar] [CrossRef]
  30. Djamil, B. Indoor radon mitigation in South Korea. Int. J. Appl. Eng. Res. 2016, 11, 8521–8523. [Google Scholar]
  31. Akbari, K.; Mahmoudi, J.; Ghanbari, M. Influence of indoor air conditions on radon concentration in a detached house. J. Environ. Radioact. 2013, 116, 166–173. [Google Scholar] [CrossRef]
  32. Chi, C.; Chen, W.; Guo, M.; Weng, M.; Yan, G.; Shen, X. Law and features of TVOC and Formaldehyde pollution in urban indoor air. Atmos. Environ. 2016, 132, 85–90. [Google Scholar] [CrossRef] [Green Version]
  33. Panagopoulos, I.K.; Karayannis, A.N.; Kassomenos, P.; Aravossis, K. A CFD simulation study of VOC and formaldehyde indoor air pollution dispersion in an apartment as part of an indoor pollution management plan. Aerosol Air Qual. Res. 2011, 11, 758–762. [Google Scholar] [CrossRef] [Green Version]
  34. Nielsen, G.D.; Wolkoff, P. Cancer effects of formaldehyde: A proposal for an indoor air guideline value. Arch. Toxicol. 2010, 84, 423–446. [Google Scholar] [CrossRef] [Green Version]
  35. Lent, T.; Silas, J.; Vallette, J. Chemical hazards analysis of resilient flooring for healthcare. HERD Health Environ. Res. Des. J. 2010, 3, 97–117. [Google Scholar] [CrossRef]
  36. Assael, M.J.; Kakosimos, K.E. Fires, Explosions, and Toxic Gas Dispersions: Effects Calculation and Risk Analysis, 1st ed.; CRC Press: Boca Raton, FL, USA, 2010; pp. 42–54. [Google Scholar]
  37. Liu, C.; Zhao, B.; Zhang, Y. The influence of aerosol dynamics on indoor exposure to airborne DEHP. Atmos. Environ. 2010, 44, 1952–1959. [Google Scholar] [CrossRef]
  38. Tran, V.V.; Park, D.; Lee, Y.C. Indoor air pollution, related human diseases, and recent trends in the control and improvement of indoor air quality. Int. J. Environ. Res. Public Health 2020, 17, 2927. [Google Scholar] [CrossRef] [Green Version]
  39. Uzoigwe, J.C.; Prum, T.; Bresnahan, E.; Garelnabi, M. The emerging role of outdoor and indoor air pollution in cardiovascular disease. N. Am. J. Med. Sci. 2013, 5, 445–453. [Google Scholar] [PubMed]
  40. Zamani, M.E.; Jalaludin, J.; Shaharom, N. Indoor air quality and prevalence of sick building syndrome among office workers in two different offices in Selangor. Am. J. Appl. Sci. 2013, 10, 1140–1147. [Google Scholar] [CrossRef] [Green Version]
  41. Kim, E.H.; Kim, S.; Lee, J.H.; Kim, J.; Han, Y.; Kim, Y.M.; Ahn, K. Indoor air pollution aggravates symptoms of atopic dermatitis in children. PLoS ONE 2015, 10, e0119501. [Google Scholar] [CrossRef] [PubMed] [Green Version]
  42. McClellan, R.O. Role of science and judgment in setting national ambient air quality standards: How low is low enough? Air Qual. Atmos. Health 2012, 5, 243–258. [Google Scholar] [CrossRef] [Green Version]
  43. Guerreiro, C.B.; Foltescu, V.; De Leeuw, F. Air quality status and trends in Europe. Atmos. Environ. 2014, 98, 376–384. [Google Scholar] [CrossRef] [Green Version]
  44. Sofia, D.; Lotrecchiano, N.; Giuliano, A.; Barletta, D.; Poletto, M. Optimization of number and location of sampling points of an air quality monitoring network in a n urban contest. Chem. Eng. Trans. 2019, 74, 277–282. [Google Scholar]
  45. Sofia, D.; Giuliano, A.; Gioiella, F. Air quality monitoring network for tracking pollutants: The case study of Salerno city center. Chem. Eng. Trans. 2018, 68, 67–72. [Google Scholar]
  46. Introduction to Indoor Air Quality (IAQ). 2021. Available online: https://www.epa.gov/indoor-air-quality-iaq/introduction-indoor-air-quality (accessed on 8 April 2021).
  47. Indoor Air Quality Guide. 2021. Available online: https://www.ashrae.org/technical-resources/bookstore/indoor-air-quality-guide (accessed on 14 April 2021).
  48. Švajlenka, J.; Kozlovská, M.; Pošiváková, T. Assessment and biomonitoring indoor environment of buildings. Int. J. Environ. Health Res. 2017, 27, 427–439. [Google Scholar] [CrossRef] [PubMed]
  49. Švajlenka, J.; Kozlovská, M.; Pošiváková, T. Biomonitoring the indoor environment of agricultural buildings. Ann. Agric. Environ. Med. 2018, 25, 292–295. [Google Scholar] [CrossRef] [PubMed] [Green Version]
  50. Švajlenka, J.; Kozlovská, M.; Pošiváková, T. Analysis of the indoor environment of agricultural constructions in the context of sustainability. Environ. Monit. Assess. 2019, 191, 1–21. [Google Scholar] [CrossRef] [PubMed]
  51. Appleton, J.D. Radon in air and water. In Essentials of Medical Geology; Selinus, O., Ed.; Springer: Dordrecht, The Netherlands, 2013; pp. 227–263. [Google Scholar]
  52. Mowlavi, A.A.; Fornasier, M.R.; Binesh, A.; De Denaro, M. Indoor radon measurement and effective dose assessment of 150 apartments in Mashhad, Iran. Environ. Monit. Assess. 2012, 184, 1085–1088. [Google Scholar] [CrossRef]
  53. Persily, A. Challenges in developing ventilation and indoor air quality standards: The story of ASHRAE Standard 62. Build. Environ. 2015, 91, 61–69. [Google Scholar] [CrossRef] [PubMed]
  54. Eisenberg, S. NIOSH safe handling of hazardous drugs guidelines becomes state law. J. Infus. Nurs. 2012, 35, 316–319. [Google Scholar] [CrossRef]
  55. Yauk, M.; Stenson, J.; Donor, M.; Van Den Wymelenberg, K. Evaluating Volatile Organic Compound Emissions from Cross-Laminated Timber Bonded with a Soy-Based Adhesive. Buildings 2020, 10, 191. [Google Scholar] [CrossRef]
  56. Mermet, K.; Sauvage, S.; Dusanter, S.; Salameh, T.; Léonardis, T.; Flaud, P.M.; Locoge, N. Optimization of a gas chromatographic unit for measuring biogenic volatile organic compounds in ambient air. Atmos. Meas. Tech. 2019, 12, 6153–6171. [Google Scholar] [CrossRef] [Green Version]
  57. Yang, S.; Gao, K.; Yang, X. Volatile organic compounds (VOCs) formation due to interactions between ozone and skin-oiled clothing: Measurements by extraction-analysis-reaction method. Build. Environ. 2016, 103, 146–154. [Google Scholar] [CrossRef]
  58. Li, J.; Dasgupta, P.K.; Luke, W. Measurement of gaseous and aqueous trace formaldehyde: Revisiting the pentanedione reaction and field applications. Anal. Chim. Acta 2005, 531, 51–68. [Google Scholar] [CrossRef]
  59. Faustini, A.; Rapp, R.; Forastiere, F. Nitrogen dioxide and mortality: Review and meta-analysis of long-term studies. Eur. Respir. J. 2014, 44, 744–753. [Google Scholar] [CrossRef] [PubMed] [Green Version]
  60. Hill, R.J.; Smith, P.A. Exposure Assessment for carbon dioxide gas: Full shift average and short-term measurement approaches. J. Occup. Environ. Hyg. 2015, 12, 819–828. [Google Scholar] [CrossRef]
  61. Chen, C.; Zhao, B. Review of relationship between indoor and outdoor particles: I/O ratio, infiltration factor and penetration factor. Atmos. Environ. 2011, 45, 275–288. [Google Scholar] [CrossRef]
  62. Nematchoua, M.K.; Tchinda, R.; Orosa, J.A.; Andreasi, W.A. Effect of wall construction materials over indoor air quality in humid and hot climate. J. Build. Eng. 2015, 3, 16–23. [Google Scholar] [CrossRef] [Green Version]
  63. Al-Jarallah, M.I.; Musazay, M.S.; Aksoy, A. Correlation between radon exhalation and radium content in granite samples used as construction material in Saudi Arabia. Radiat. Meas. 2005, 40, 625–629. [Google Scholar] [CrossRef]
  64. Harb, P.; Locoge, N.; Thevenet, E.F. Emissions and treatment of VOCs emitted from wood-based construction materials: Impact on indoor air quality. Chem. Eng. J. 2018, 354, 641–652. [Google Scholar] [CrossRef]
  65. Xiu, F.R.; Lu, Y.; Qi, Y. DEHP degradation and dechlorination of polyvinyl chloride waste in subcritical water with alkali and ethanol: A comparative study. Chemosphere 2020, 249, 126138. [Google Scholar] [CrossRef]
  66. Giosuè, C.; Belli, A.; Mobili, A.; Citterio, B.; Biavasco, F.; Ruello, M.L.; Tittarelli, F. Improving the impact of commercial paint on indoor air quality by using highly porous fillers. Buildings 2017, 7, 110. [Google Scholar] [CrossRef] [Green Version]
  67. Lynes, J. Zero VOC; eco-friendly paint for commercial applications. Adv. Coat. Surf. Technol. 2013, 26, 1–3. [Google Scholar]
  68. Developers Cut Unit Size to Make Homes Affordable in Dubai. 2019. Available online: https://www.khaleejtimes.com/developers-cut-unit-size-to-make-homes-affordable-in-dubai (accessed on 12 April 2021).
  69. Guo, C.; Gao, Z.; Shen, J. Emission rates of indoor ozone emission devices: A literature review. Build. Environ. 2019, 158, 302–318. [Google Scholar] [CrossRef]
  70. Labour Camps a Neglected Area. 2004. Available online: https://www.khaleejtimes.com/nation/general/labour-camps-a-neglected-area (accessed on 26 May 2021).
  71. Gulf’s Migrant Workers Left Stranded and Struggling by Coronavirus Outbreak. 2020. Available online: https://www.reuters.com/article/uk-health-coronavirus-gulf-workers-idUKKCN21W1NZ (accessed on 26 May 2021).
Figure 1. Changes in radon concentration with window closed.
Buildings 11 00250 g001
Figure 2. Changes in radon concentration with window semi-open.
Buildings 11 00250 g002
Figure 3. Changes in radon concentration with window fully open.
Buildings 11 00250 g003
Figure 4. ACH = 0.5 time, average concentration: 5.56 pci (Max: 11.84 pci, Min: 0.44 pci).
Buildings 11 00250 g004
Figure 5. ACH = 1 time, average concentration: 5.37 pci (Max: 11.50 pci, Min: 0.30 pci).
Buildings 11 00250 g005
Figure 6. ACH = 3 times, average concentration: 3.48 pci (Max: 7.84 pci, Min: 0.54 pci).
Buildings 11 00250 g006
Figure 7. ACH = 5 times, average concentration: 2.06 pci (Max: 5.21 pci, Min: 0.93 pci).
Buildings 11 00250 g007
Table 1. Global standards for indoor air quality.
PollutantGlobal Standards for Indoor Air
Carbon Dioxide (CO2)1000 ppm (Japanese Building Standards Act)
1000 ppm (ASHRAE)
Carbon Monoxide (CO)10 ppm (Japanese Building Standards Act & Building Hygiene Management Act)
20 ppm (Japanese School Hygiene Standards)
8.6 ppm (WHO Europe: 8 Hour Average)
9 ppm (US NAAQS (National Ambient Air Quality Standards): 8 Hour Average)
Formaldehyde (CH2O)0.1 ppm (ASHRAE)
0.08 ppm (WHO Europe)
0.08 ppm (Dubai Municipality, 8 Hour Average)
Nitrogen Dioxide (NO2)0.21 ppm (WHO Europe: 1 Hour Average)
0.075 ppm (WHO Europe: 24 Hour Average)
0.053 ppm (NAAQS: 24 Hour Average)
Radon4.0 pCi/L (EPA)
2.0 pCi/L (ASHRAE)
Total Suspended Particles (TSP)0.15 mg/m3 (Japanese Building Hygiene Management Act/Building Standards Act)
0.1–0.12 mg/m3 (WHO, 8 Hour Average)
150 µg/m3 (Dubai Municipality, 8 Hour Average)
Volatile organic compounds (VOCs)0.2–0.6 mg/m3 (FISIAQ (Finnish Society of Indoor Air Quality and Climate))
300 µg/m3 (Dubai Municipality, 8 Hour Average)
Table 2. Air pollutants concentration distribution.
PollutantsBuilding TypeConcentrationIndoor/Outdoor Concentration Ratio
Indoor AverageOutdoor Average
Radon Gas
(unit: pCi/L)
New Townhouses (2)1.46 (Max 4.56)0.1112.24
Existing Townhouses (2)0.79 (Max 2.70)0.451.73
Labor Camp House (2)2.55 (Max 6.63)0.584.32
Showhouse (2)0.030.021.4
Volatile organic compounds
(unit: ppm)
New Townhouses (2)0.40240.040110.0
Existing Townhouses (2)0.1151Not Detected-
Labor Camp House (2)0.06550.01215.3
Showhouse (2)2.9960.03778.8
Formaldehyde
(unit: ppb)
New Townhouses (2)308.162.94.8
Existing Townhouses (2)95.053.01.7
Labor Camp House (2)93.623.14.0
Showhouse (2)421.1121.43.4
Nitrogen Dioxide
(unit: ppb)
Existing Townhouses (2)Before Cooking22.61.5
Not Detected
After Cooking
36.8 (Max 60.8)
Carbon Dioxide
(unit: ppm)
Existing Townhouses (2)816.1331.32.4
Labor Camp House (2)3001.8633.14.6
Total Suspended Particles
(unit: µg/m3)
Existing Townhouses (2)45.020.12.2
Labor Camp House (2)179.328.26.3
Table 3. Laboratory measurement result of radon gas emission by material.
Average Pressure
Difference (Kpa)
Radon Concentration (pCi/m2h)
MaterialAverage
ConcreteReinforced ConcreteNot Examined599514
Precast ConcreteNot Examined429
CipolinOriginalNot Examined386409
ShatteredNot Examined432
Gypsum BoardGeneral0.0052179.11819
Steam Cured0.0041458.8
Red ClayPure Red Clay0.0452813.83104
Pure Red Clay + Ceramic (50%)0.0423200.1
Pure Red Clay + Ceramic (100%)0.0444449.2
Pure Red Clay + Special Coating0.0441955.6
Table 4. Laboratory measurement results of emission of VOCs in paints.
General Petrochemical Product (Unit: ppm/m2)Natural Materials-Based Product (Unit: ppm/m2)
Oil PaintNo A/CA/COverall AverageOil PaintNo A/CA/COverall Average
VOCsBenzeneN/DN/DN/DVOCsBenzene0.444N/D0.222
Toluene4.11.12640Toluene2.4801.0001.748
Xylene34,49023,60029,100XyleneN/DN/DN/D
TVOC38,60024,74031,740TVOC2.9441.0001.972
Aqueous PaintNo A/CA/COverall AverageAqueous PaintNo A/CA/COverall Average
AverageAverageAverageAverage
VOCsBenzene0.7850.7000.065VOCsBenzene0.102N/D0.051
Toluene2.1900.9241.562TolueneN/DN/DN/D
XyleneN/DN/DN/DXyleneN/DN/DN/D
TVOC1.0101.6241.626TVOC0.102N/D0.051
Table 5. Laboratory measurement results of VOCs radiation from flooring (unit: µg/m2h).
BenzeneTolueneEthylbenzeneXyleneTVOC
PET25 °CN/D1.570.401.183.178
35 °CN/D1.860.471.864.220
50 °C0.4615.422.183.8821.97 (6.9 times)
NON-UV25 °C1.501.411.020.744.71
35 °C10.042.641.681.2315.5
50 °C10.327.022.562.1222.05 (4.7 times)
UV25 °CN/D0.120.140.120.4
35 °C0.240.430.760.662.10
50 °C2.010.881.301.705.92 (14.8 times)
Table 6. The amount of ventilation in a 2-bedroom townhouse.
Opening Type and SizeSize (m)Closed (m2)Semi-Open (m2)Fully Open (m2)
2-Bedroom TownhouseRoom 12.3 × 2.40.00292.75.4
Room 21.5 × 1.60.00191.22.3
Kitchen2.7 × 0.50.00180.71.4
Living Room3.0 × 2.40.00332.37.0
Room 33.0 × 2.00.00353.06.0
Total 0.00291.743.58
The Amount of Ventilation
(Q: m3/h)
25646713,297
The equation applied is as follows. Ci.
Table 7. Simulation-2 overview.
The Size of the Room5 m × 3.6 m × 3 m
OpeningWindow: 1.2 m × 0.6 m, Door: 1.8 m × 0.9 m
PollutantTypeRadon
Radiation0.0320 pCi/secm2
Radiation Area15.72 m2
Ventilation Frequency0.5 times/h, 1.0 times/h, 3.0 times/h, 5.0 times/h
Publisher’s Note: MDPI stays neutral with regard to jurisdictional claims in published maps and institutional affiliations.

