Article

Risk Assessment Framework to Avoid Serial Failure for New Technical Solutions Applied to the Construction of a CLT Structure Resilient to Climate

by
Charlotte Svensson Tengberg
1,2,* and
Carl-Eric Hagentoft
1
1
Department of Architecture and Civil Engineering, Chalmers University of Technology, SE-412 96 Gothenburg, Sweden
2
Skanska Sverige AB, SE-405 18 Gothenburg, Sweden
*
Author to whom correspondence should be addressed.
Buildings 2021, 11(6), 247; https://doi.org/10.3390/buildings11060247
Submission received: 30 April 2021 / Revised: 2 June 2021 / Accepted: 3 June 2021 / Published: 9 June 2021
(This article belongs to the Special Issue Climate Resilient Buildings)

Abstract

:
Design-build contractors are challenged with the task of minimizing failure risks when introducing new technical solutions or adapting technical solutions to new conditions, e.g., climate change. They seem to have a disproportional trust in suppliers and their reference cases and might not have adequate resources or methodologies for sufficient evaluation. This creates the potential for serial failures to spread in the construction industry. To mitigate this, it was suggested that a predefined risk assessment framework should be introduced with the aim of providing a prequalification and requirements for the use of the technical solution. The objectives of this paper are to develop a comprehensive risk assessment framework and to explore the framework’s potential to adequately support the design-build contractor’s decisions. The framework uses qualitative assessment, relying on expert workshops and quantitative assessments, with a focus on simulation and probabilities. Tollgates are used to communicate risk assessments to the contractor. The framework is applied to a real-life case study of construction with a CLT-structure for a Swedish design-build contractor, where exposure to precipitation during construction is a key issue. In conclusion, the chosen framework was successful in a design-build contractor context, structuring the process and identifying difficulties in achieving the functional requirements concerning moisture. Three success factors were: documentation and communication, expert involvement, and the use of tollgates. Recommendations to the design-build contractor on construction of CLT structure are to keep construction period short and to use full weather protection on site.

1. Introduction

It is challenging to successfully introduce new technical solutions, i.e., materials, products, designs, or processes, to the construction industry [1]. Slow adaptation leads to loss of competitiveness for a design-build contractor and anticipated benefits, such as reducing greenhouse gas emissions, while too fast an adaptation can result in poor quality and failure as the performance requirements are not met. Historically, there were issues with new technical solutions that were insufficiently investigated, and when introduced to the construction industry, they failed to sustain functional requirements due to deficiencies in design or production that should be predicted by calculations or other assessments in the design phase. Multiple cases of this kind of failure were defined as serial failures in [2]. Serial failures might also occur with traditional technical solutions due to changes in conditions, e.g., climate change. To support the design-build contractor, a more structured way is needed than current practice to provide basis for well-founded and documented yet cost-effective decisions. This paper suggests and demonstrates a risk assessment framework to guide the design-build contractor to adequately assess new technical solutions identified to be of potential interest, with the overall aim of reducing serial failures.
There are several examples of serial failures resulting in high costs in the construction industry. Three costly Swedish examples of historic serial failures when new or modified technical solutions were introduced are the outdoor ventilated crawlspaces [3], the EIFS (Exterior Insulation and Finishing Systems) [4], and the MgO-boards [5]. Overall, the construction industry battles with high costs for failures. In a report from the Swedish National Board of Housing and Planning [6], overall cost for failures in the range of 7–11% of production costs were reported related to performance failures in the Swedish building sector. Part of these costs can be assumed to be related to serial failures after introducing new technical solutions. The responsibility of the design-build contractor in relation to serial failures was pinpointed in two verdicts concerning EIFS in the Swedish Supreme Court [7]. In the verdicts, it was stated that the contractor could not rely only on common practice in the industry but had a responsibility to perform adequate verification of the used technical solution. However, in the verdicts the definition of “adequate verification” was not defined.
In an interview study exploring introduction of new technical solutions in the Swedish construction industry [2], the suppliers were found to be the main drivers of introducing new technical solutions, as well as the main source of information on the new solutions. The suppliers indicated that they follow a structured innovation process or product development process. The product development from the supplier’s perspective can comprise the steps of planning, concept development, system design, detail design, testing and refinement, and production rampup [8], resulting in a product ready for customers, e.g., design-build contractors. From a design-build contractor’s perspective the supplier’s documentation must be confirmed and complemented based on the intended application within the building project in focus. The corresponding project risk management [9,10] handles a wide array of risks, including technical risks. However, in a literature review [11], a lack of guidelines and systematic approach for selecting appropriate risk identification techniques were identified. From a design-build contractor’s perspective, there is also a lack of available verified documentation and processes to evaluate the new solutions [2]. Another issue is the lack of available product data and documented experience, such as documented reference cases. For new technical solutions, this is especially evident. Unfortunately, there are indications of the use of reference case as basis to implement new technical solutions without having documentation on either the context or the outcome of the reference projects used [12]. Evidently, a systematic approach for design-build contractors when introducing new technical solutions are lacking. There are existing frameworks with the potential of evaluating performance, but there is a discrepancy between practice and theory, as frameworks are not used in practice in the construction industry when evaluating new technical solutions before implementing. From a design-build contractor’s perspective, the models might not be accessible—possibly too time-consuming or too challenging to practice in building projects—or not applicable to the implementation of new technical solutions, as the models might focus on addressing issues connected to current solutions.

Aim and Objectives

This paper is part of a research project initiated with the overall aim of contributing to reducing serial failures related to new technical solutions by proposing a systematic approach for adequate risk assessment for new technical solutions from the design-build contractor’s perspective. The risk assessment framework is expected to facilitate and improve risk assessments before introducing new technical solutions or adapting technical solutions to new conditions in companies. By the structured approach, the awareness and knowledge of risk assessment on durability issues are expected to increase within the involved organizations. The main objective of this paper is to develop a comprehensive risk assessment framework adapted to a design-build contractor’s perspective and to explore the potential of the suggested elaborated risk assessment framework to adequately support the design-build contractor’s decision when implementing new technical solutions, or adapting technical solutions to new conditions. This is done by applying the framework to a real-life case study at a design-build contractor. The second objective is to identify suggestions for further adjustments of the risk assessment framework from the design-build contractor’s perspective based on the experiences of the real-life case study. The study does not include evaluation on the ability of the framework to detect potential serial failures, nor any comparison with that of other potential frameworks.

2. Background and Applied Method

There are several frameworks and tools for the assessment of durability issues for buildings, both on building physics simulations and within building projects. There is an international standard “General principles on the design of structures for durability” [13], which describes how durability issues can be handled with limit-state and provide a framework for using mathematical models. Recently, a CIB publication, Guideline on Design for Durability of Building Envelopes [14], further elaborated the issues addressing expert practitioners with explicit guidance applicable to a number of identified construction designs. At the same time, during the last 20 years, more probabilistic methods gained ground in building physics research. According to [15], the purpose of probabilistic studies on mold growth was to emphasize uncertainties, evaluate performance with the aim of differentiating between designs, and evaluate uncertainties and identify important ones. From the probabilistic methods, there was also an effort to compile the research results to create accessible models based on advanced simulation tools, such as within the EU projects RIBuild [16] and Tallfacades [17], to handle internal insulation of historical buildings and envelopes in wooden structures, respectively, as well as the wall assessment system BSA [18]. Within predefined boundaries and preset assumptions, the user can benefit from probabilistic assessment based on large sets of simulations when evaluating performance of building components; however, when introducing new technical solutions, these models are usually not applicable as they are based on preset boundaries.
Specifically concerning moisture issues, moisture safety design in building projects was developed throughout the years, and there is a current Swedish trade standard for moisture safety in building projects, ByggaF [19], whose explicit purpose is to highlight moisture issues and document activities and actions required to ensure moisture safety design in construction projects. One component of the method comprises “dry building design” with a structured routine and a checklist for the designing engineer to make the assessment. The dry building design routine also allows for conducting a risk analysis. With the scope to develop and provide decision support data and tools for energy retrofitting measures, an ambitious IEA annex with researchers in building physics from 15 participating countries was initiated. A framework for a risk management process concerning issues of “dry building design” specifically was presented in [20,21] with the aim of providing instruction on how to analyze the complex retrofitting case and how to identify the risks. The framework has a detailed step-by-step workflow and is anticipated to be a part of quality assurance with respect to moisture safety.

The Applied Risk Assessment Framework

The risk assessment framework was adapted from the risk management process framework developed in [21]. To better fit the case of risk assessment of new technical solutions from a design-build contractor’s perspective, the framework features a complementary suggestion of organizing a separate assessment project at company level using added tollgates for management decisions.
The adapted framework is suggested to be applied at a company’s central level, initiated by management, to evaluate the potential of new technical solution and to define requirements for prequalification before evaluating and possibly implementing a building project. By performing a general evaluation, the requirements to be fulfilled within construction projects can be predefined. Thus, part of the time and resources needed for evaluation are transferred from the construction project level to company level, to ensure adequate time and resources are available for the evaluation and to ensure uniform evaluation standards.
As the framework is applied by the design-build contractor at a central level, it should be run as a standalone project initiated and financed by management, led by a designated project manager who reports to a steering group representing management. To fit the design-build contractor’s perspective, elements of product development [8] were implemented where the initiation step was given greater emphasis and tollgates for management decisions of the design-build contractor were added to structure the process and to enhance communication. In each tollgate, the steering group decision can be to proceed, to revise an earlier step or to cancel the assessment. The framework is visualized in Figure 1.
Prior to the initiation of the framework, a new technical solution of interest is identified by management based on documented estimated market potential, and anticipated benefits together with other information relevant to setting up a scope. The new technical solution should also be given a descriptive name for identification purposes. The first tollgate, Tollgate 0, is where the decision to initiate the process or not is taken for an identified new technical solution. If the process is started, a project manager and a budget is assigned to set up the scope, according to directives from management. The rationale for this decision should be added to the documentation.
An overview of the defined steps of the framework are given below; these are further explored in the case study in Section 3.
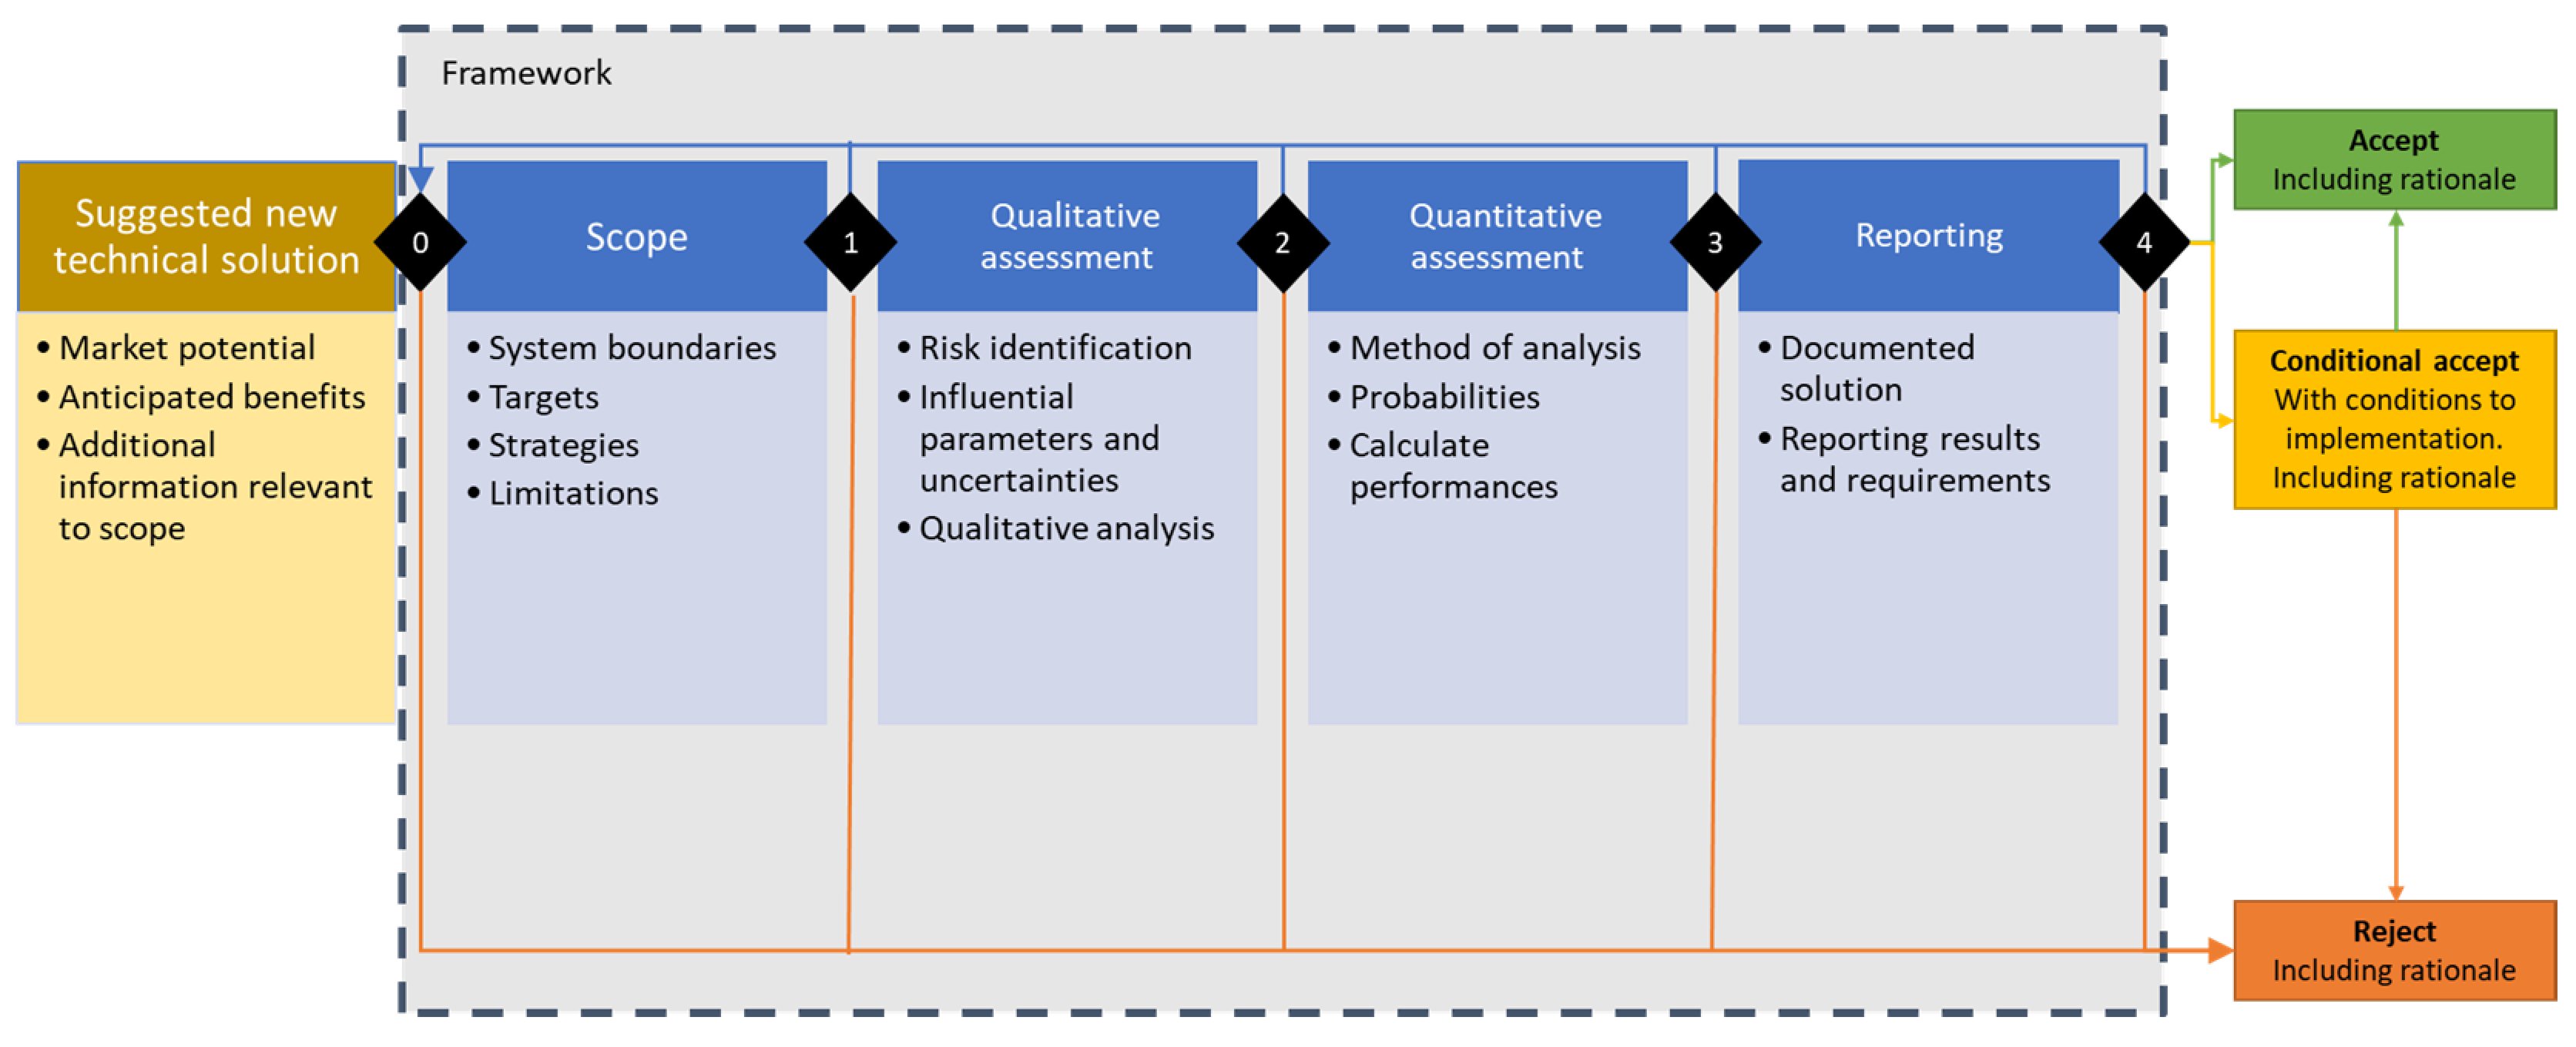
  • Scope. The scope is a specification of the new technical solution to be assessed and is important for mutual understanding of what is being assessed. Important stakeholders should also be identified. The scope should comprise a thorough description divided into four parts:
    • System boundaries. Defining the system to be studied, e.g., spatial scale and time phase.
    • Targets and consequences. Targets define which functional requirements are studied. Also, the consequences of not meeting functional requirements should be identified.
    • Strategies. The design and constraints are identified. If there are several options to design, this should be noted.
    • Limitations and assumptions. Limitations of the assessment as well as assumptions are documented.
In Tollgate 1, the scope describing the new technical solution is assessed. If it is accepted, the decision makers agree on the scope as described, and the process proceeds to a qualitative assessment. The scope can also be rejected or revised. If the scope is incomplete or not meeting the expectations of the steering group, the scope is revised (blue arrow). If the scope is considered not viable, the scope is rejected (red arrow). For all decisions, the rationale for the decision is added to the documentation.
  • Qualitative assessment. The qualitative assessment includes risk identification combined with addressing influential factors and their corresponding uncertainties. In this step, the expert workshop is an important tool together with literature. Factors of concern can be identified for study in a quantitative assessment. The qualitative analysis should guide decisions on how to proceed.
    In Tollgate 2, the process pathway is decided on. The case could either proceed to reporting or a quantitative assessment. If the qualitative assessment is incomplete or not meeting the expectations of the steering group, the qualitative assessment or scope is revised (blue arrow). If the solution is considered unviable, the solution is rejected (orange arrow). For all decisions, the rationale for the decision is added to the documentation.
  • Quantitative assessment. Based on the identified critical factors and unknowns related to the fulfilment of the targets defined in the scope, simulations are performed. Important steps are identification of a suitable method of analysis, identifying probabilities and calculating performance of the solution.
    In Tollgate 3, the current direction of the process is considered. The case could be accepted to proceed to reporting. If the quantitative assessment is either incomplete or not meeting the expectation of the steering group, the quantitative assessment or earlier steps are revised (blue arrow). If the solution is considered unviable, the solution is rejected (orange arrow). For all decisions, the rationale for the decision is added to the documentation.
  • Evaluation reporting. The input and results of the assessments are compiled, and recommendations and a relevant specification of requirements are established (again, from a design-build contractors’ perspective) to serve as the basis of decisions. Verification and risk mitigation are suggested. The reporting is essential to create a common understanding of assessment.
    In Tollgate 4, the full results are assessed. The case could be accepted based on what was required in the scope (green arrow), or conditionally accepted before implementation (yellow arrow). The conditions could concern evaluation during construction and operation. If the solution is considered not viable, the solution is rejected (red arrow). For all decisions, the rationale for the decision is added to the documentation.

3. Results from Applying Framework on Case Study

The framework was applied to the case study; the results are presented according to the steps in the framework. Between each main step of the process, the findings are summarized for the tollgate. If the process is iterated, new information might be added to the iterated step, and a new summary of findings provided. To explore the potential of an elaborated framework for risk assessment for implementation of new technical solutions, the framework was applied to a new technical solution in a real-life case study. The new technical solution was selected by a design-build contractor who was building a multifamily dwelling with a cross-laminated timber structure.
Cross-laminated timber was selected as a study case as it is an example of a recently introduced technical solution with strong market potential; thus, it is of interest to the design-build contractor. The anticipated benefits are mainly environmental, with an expected potential to not only significantly lower greenhouse gas emissions for the building structure, but also increase the use of renewable materials. Other potential benefits are lighter structures, shorter construction time, and possibilities of offsite production and good workability onsite. At the same time, the solution is based on a material that historically was associated with moisture issues; issues of moisture conditions during construction of cross-laminated timber buildings in particular are controversial in both the construction industry and the research community, e.g., [6,22]. The technical solution cannot be considered a documented, well-proven solution according to Swedish building regulations [23], and therefore, the design-build contractor should be concerned with a risk assessment of the new technical solution.
Based on this, the decision to initiate an assessment was made. The case is elaborately described in the structure of the assessment in Section 3.1.

3.1. Scope

The first step in the process is establishing the scope to create a mutual understanding of the case, described as system, targets and consequences, strategies, and limitations of the scope.
System. The case is defined as a cross-laminated timber structure used for a multi-dwelling building. The structure comprises structural elements and interconnections. During the progress of the risk assessment, the system was delimited to moisture safety in the construction phase. Several stakeholders were identified, and a brief information scan was performed to identify relevant sources of information. As the focus is on the construction phase, primarily stakeholders involved in the construction should be part of the assessment. Stakeholders identified to be involved were developer/client, architect, designing engineers, suppliers, contractors, and estimator. Other identified but not involved stakeholders are governmental institutions, subcontractors, and insurance companies. Academic researchers were also represented, however. Relevant sources of information identified were suppliers’ documentation, handbooks from trade organizations, experiences of individuals, and scientific publications.
Targets and consequences. The focus of the case study is functional requirements on moisture safety, derived from the Swedish building regulations. No additional requirements on moisture safety are anticipated from client or other actors. Only moisture issues are addressed. After the qualitative assessment, the targets were revisited and further elaborated with the findings. The first target is defined from the Swedish building regulations, and the second from current commonly applied guidance documents in the Swedish construction industry with the aim of complying with Swedish building regulations. The targets are valid both on the structural and detailing levels.
  • Not to exceed critical moisture condition in the CLT structure during construction phase. Critical moisture conditions often refer to microbial growth, but other unacceptable conditions should also be considered, such as other biological processes, chemical reactions, moisture-related dimensional changes, or mechanical or thermal properties [23]. As the suppliers do not provide quantitative data on critical moisture conditions, the analysis must include this. Consequences of not fulfilling the target include having to physically remove mold growth onsite.
  • Not to exceed moisture content at the time of built-in or at time-of-operation conditions. Current guidance documents in the trade [24] indicate a moisture content of below 16% MC, with a surface moisture content below 18% MC. This target is set to comply with moisture safety design in operation according to the building regulations. Consequence of not fulfilling the target is having to dry out materials at site.
Strategies. The studied case is a six-story, multidwelling building with 18 apartments, using a cross-laminated timber structure (as illustrated in Figure 2a). The CLT wall is externally insulated onsite, and a ventilated façade is mounted. Bottom floor is a concrete slab, exterior and interior walls, intermediate floors, and balconies are CLT panels. The roof is assumed to be of a timber frame construction. The floor height is 3 m (room height 2.5 m). The building was chosen to be representative in size and type for a new Swedish multidwelling building. The building is representative of newly built Swedish multi-dwelling buildings where four to six storys are common [25]. The CLT wall and floor panels are assumed to be five-layer panels of different dimensions (as illustrated in Figure 2b).
The building is assembled on site. The components are transported and stored in outdoor climate, usually protected by plastic wrapping for a period of 1–4 weeks. After a slab on the ground is casted, the CLT structure is mounted, floor-by-floor, ending with the roof construction and roofing membrane. Joints between panels are sealed on the outside with tape material as they are mounted. Afterwards, the windows are installed and the outside of the CLT panels are insulated before installing the façade. The anticipated time schedule for the construction phase of a six-story multifamily dwelling is shown in Table 1.
Production methods also include onsite protective and remedial actions to mitigate the effects of precipitation. Protection of the structure can be arranged using full weather protection to hinder precipitation from reaching the structure, which is further explored in Section 3.2.3, and also local solutions, e.g., membranes, tape, plastic covers, and other temporary solutions, to hinder precipitation from affecting specific details; however, these might need to be combined with different remedial methods during construction, including raking, wet vacuum, dehumidifiers, and other ways of mitigating the effects of precipitation on the structure. Consequences of not meeting the targets might be costly. Replacing materials or drying materials, as well as treating surfaces mechanically and chemically, come with costs for materials, work, and possibly effects on third parties. However, neither production costs for handling moisture issues onsite nor for not meeting the moisture targets are well explored in literature, but there are indications from the Swedish construction industry on cost benefits of using weather protection if it is also used to increase productivity, for example [26].
Limitations and assumptions. The assessment only considers an assessment of the solution concerning the identified targets during the construction phase. The assessment does not amount to a full risk assessment when applying the technical solution in a construction project. Other performance criteria and operating phase requirements should also be fulfilled. Legal or contractual issues are not handled. Followup of the solution in a construction project is not handled. Only the CLT structure is included in the assessment.

Tollgate 1

A clear scope with well-defined target was agreed on. There are substantial consequences for the design-build contractor if the targets are not fulfilled. However, there are no indications of obvious unacceptable obstacles when setting up the scope. Based on the findings, it is recommended to the management steering group to accept the scope and proceed with a qualitative assessment concerning building multifamily dwelling with a cross-laminated timber structure.

3.2. Qualitative Assessment

The qualitative assessment comprises risk identification and addressing influential factors, uncertainties, and correlations.

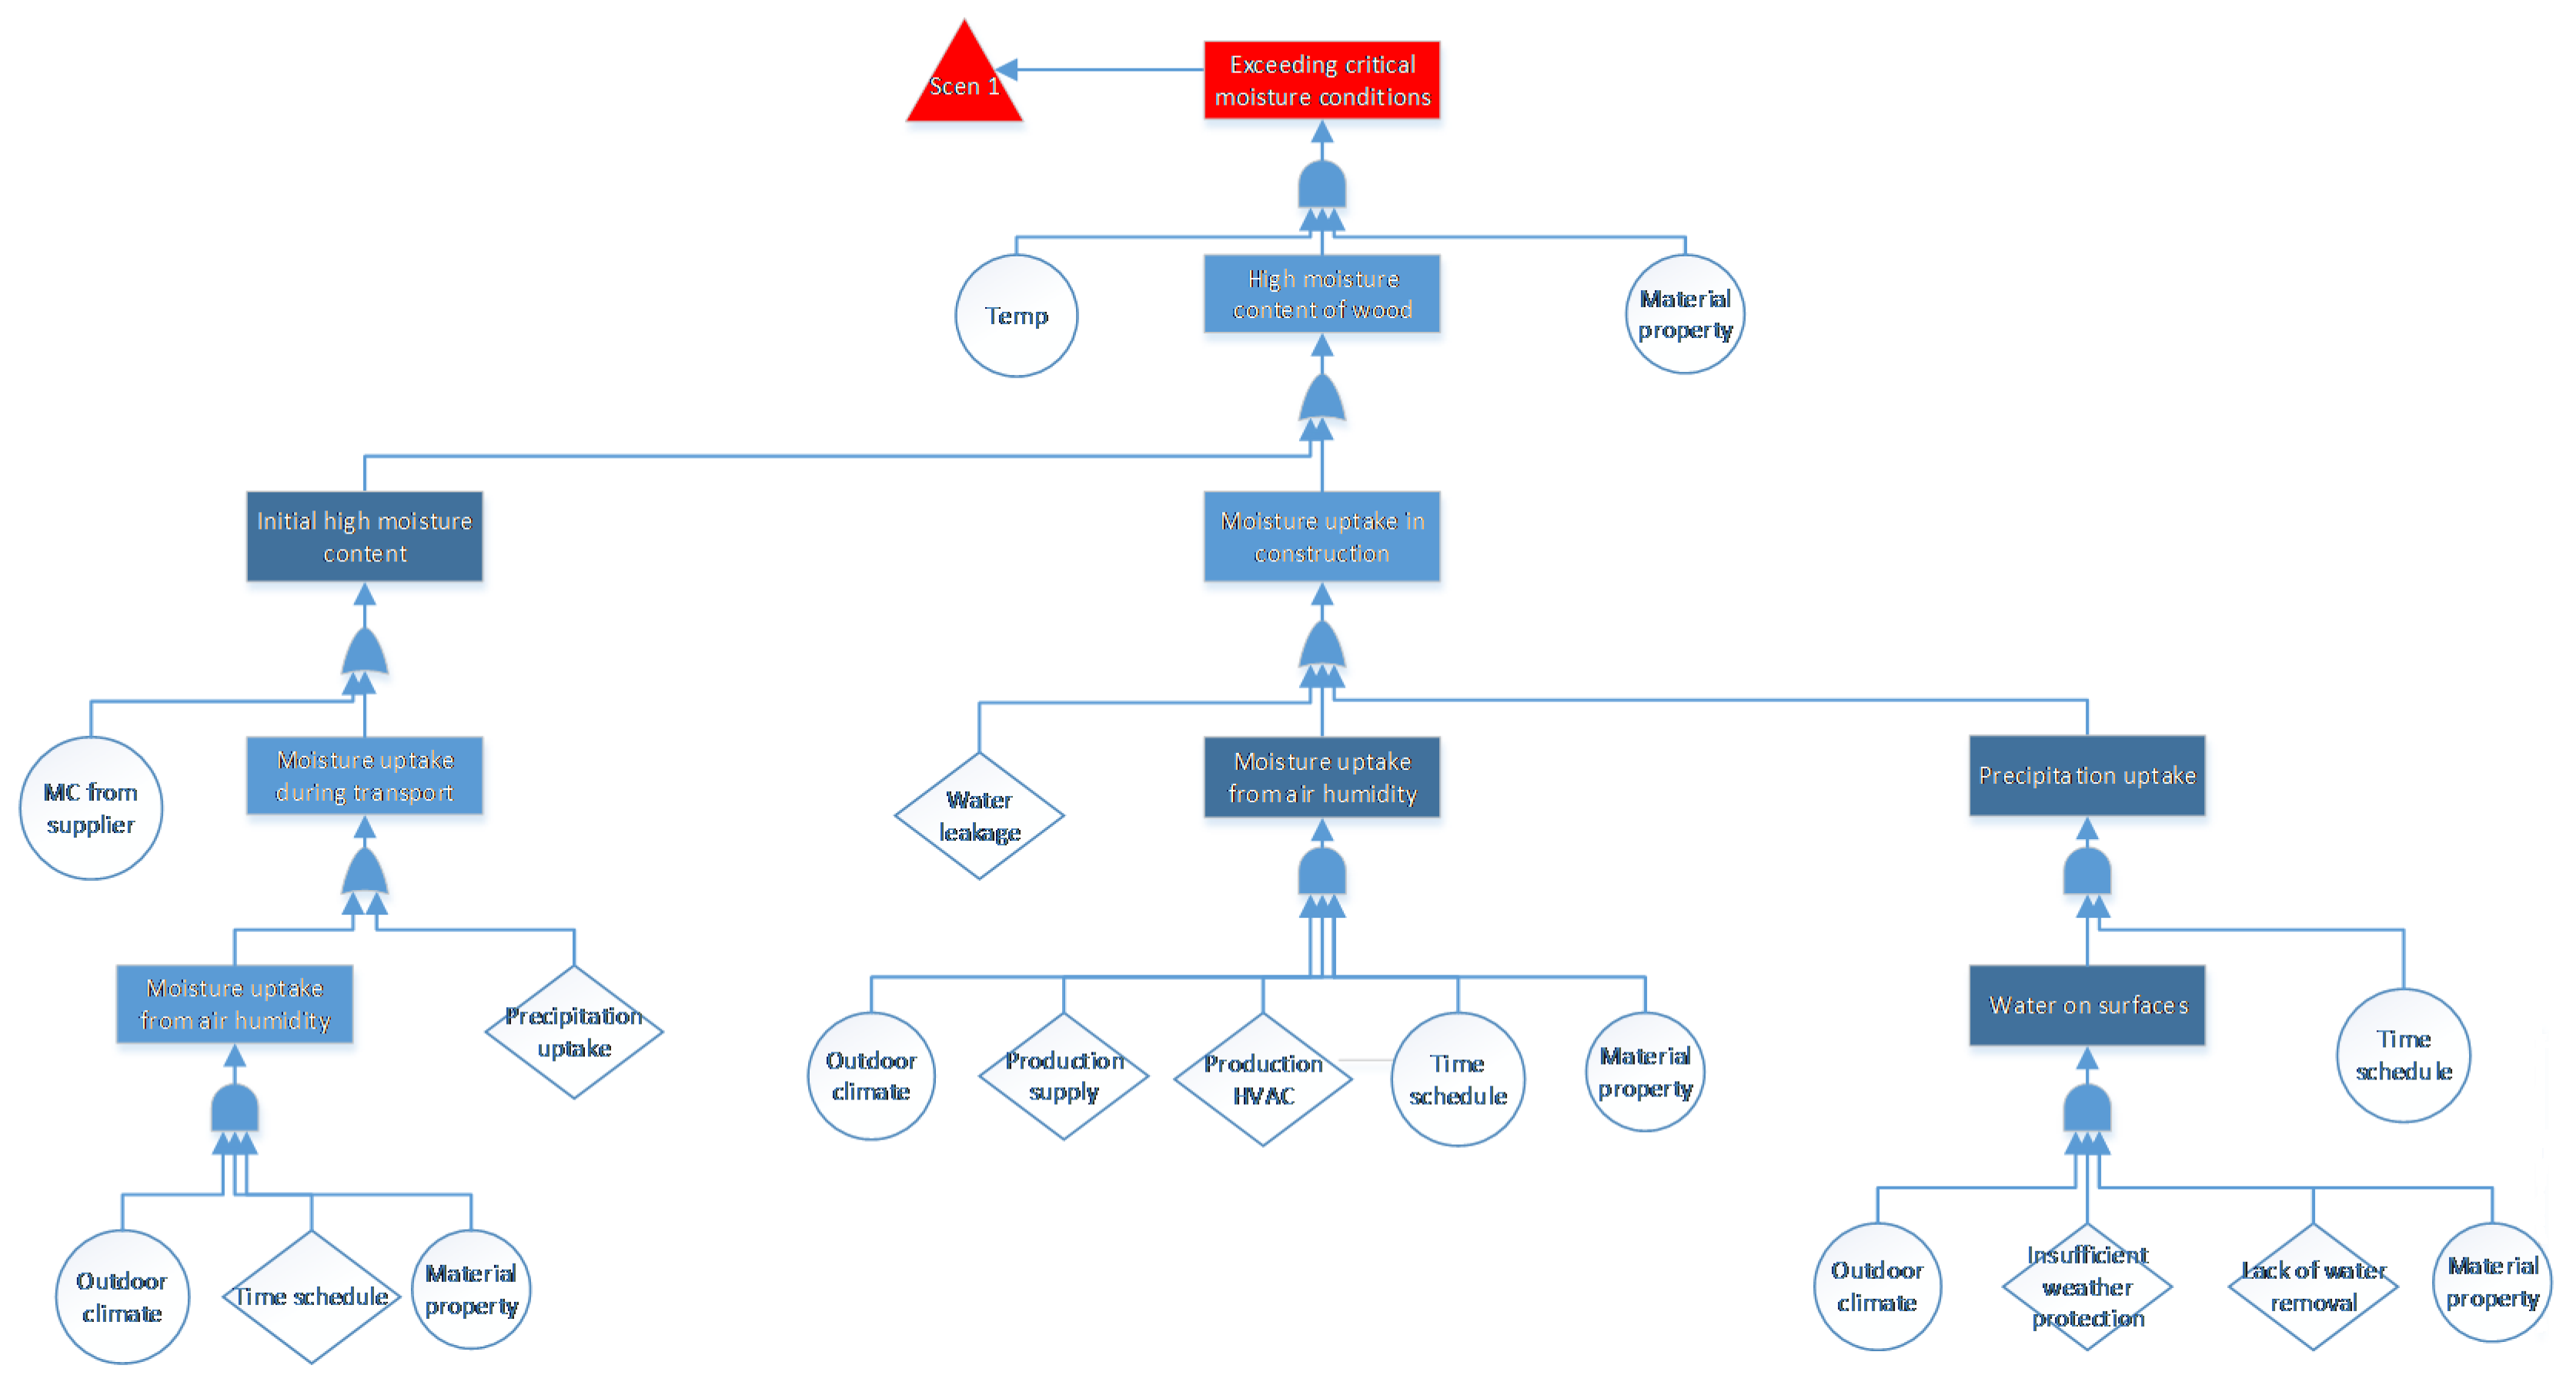
3.2.1. Risk Identification

The risk identification is based on literature and on an initial expert workshop and is developed throughout the process.
A literature search identified several examples of monitoring CLT buildings during the construction, indicating a significant rise in moisture content in wood during construction [22,27,28,29,30,31]. Several of these studies give indication of significant rise in moisture content, especially in outer layer of CLT due to precipitation during construction. In general, the main concern in these studies was to investigate if a drying out process will take place during operation. Possible damage caused by exceeding critical moisture levels during construction is not in focus; thus, both targets are not fully covered. Only [22,32] provided documentation on the mold growth target from a case study, indicating mold growth due to precipitation during the construction phase. Common conclusion is the importance of moisture safety in design, with emphasis on the design of building components and detailing.
As for suppliers’ documentation, even though the suppliers did provide reference cases, these did not comprise any technical documentation, e.g., monitoring of moisture, mold growth, designs, or conditions at site or evaluation, and therefore, these were considered to be of little value in the qualitative assessment [12]. Furthermore, the suppliers set a target on maximum moisture content before built-in, but the onsite instructions were typically urging “to protect from weather conditions” or “…can come briefly into contact with water”, giving no guidance on how to fulfil the targets. Also, the Swedish CLT handbook [33] does not hold any information on how to achieve the targets, while the CLT handbook, US edition [34], lists measures to mitigate moisture at the construction site and pinpoints weak spots (end-grain and gaps between panel laminations).
The expert workshop on risk identification was performed, as described in [35]. The risk identification covered the two defined targets as defined in the scope: to not exceed critical moisture condition in the CLT structure during construction phase, nor to exceed moisture content of current trade guidance [24] at the time of built-in or at the time of operation conditions. At the workshop, the construction phase was confirmed as the most important issue by far, strengthening the choice of study case. The expert workshop was summarized in an overview of influential factors and their nature of uncertainty on the case, Figure 3.
Both precipitation and moisture (from air) were listed. Furthermore, several details were assessed to have an impact during construction as well as conditions for the material before entering construction site. From the risk identification and subsequent work, the assessed risks are pictured in Figure 4.

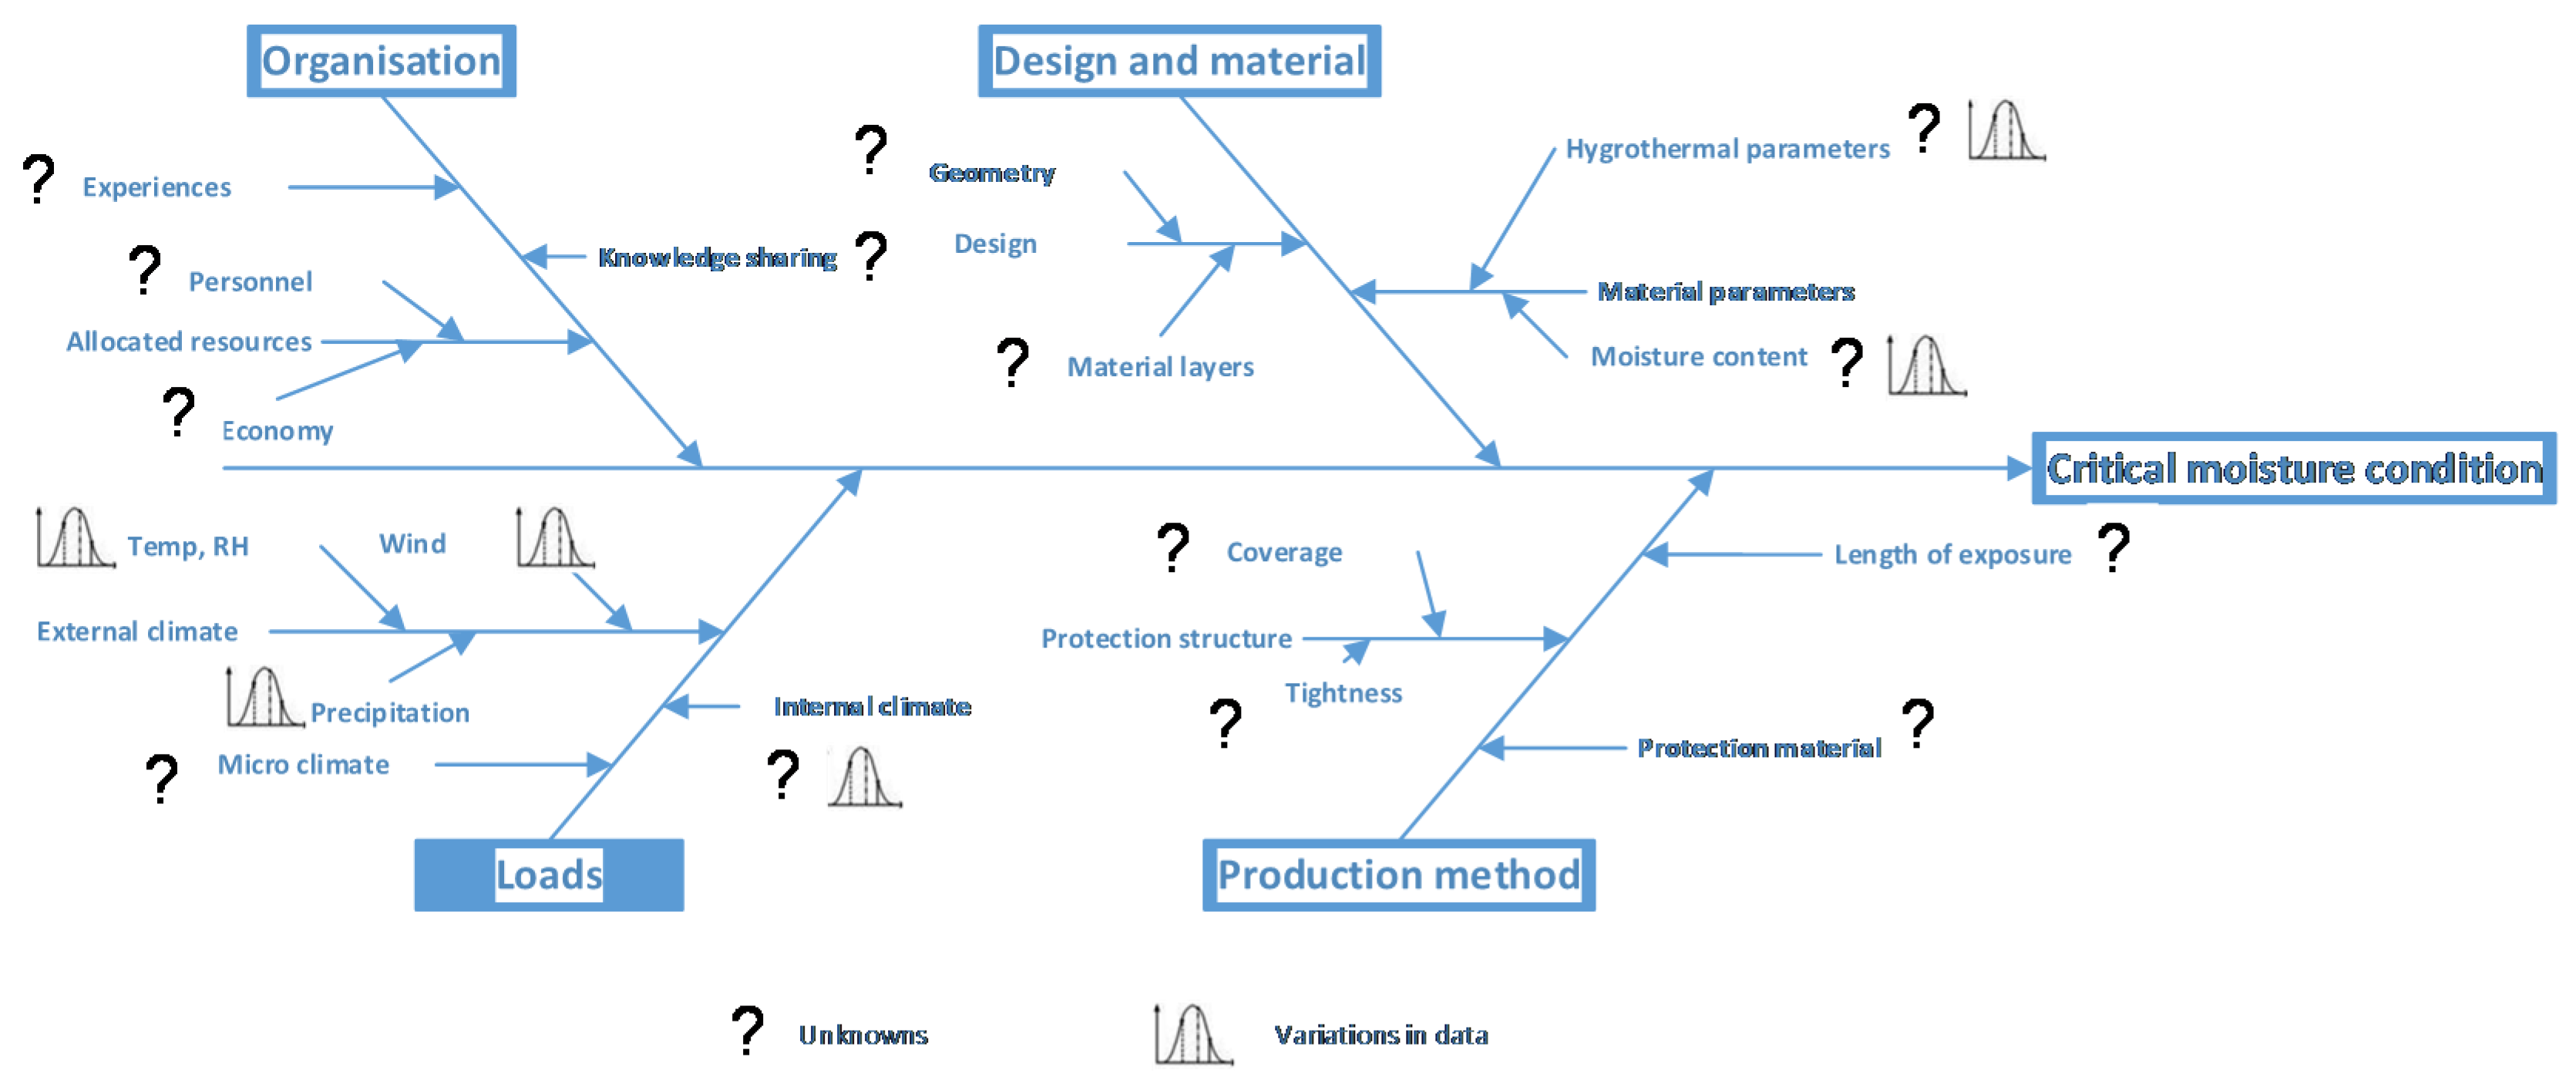
3.2.2. Influential Factors, Uncertainties and Correlations

From the risk identification workshop, influential factors were identified, as illustrated in Figure 5. The studied influential factors are listed in Appendix A with variations and uncertainties, as identified from suppliers and literature as described in [12]. The influential factors apply both to the 1-D case of the structure (plain walls and floors), and to 2D/3D cases (detailing, connections).

3.2.3. Tollgate 2

The qualitative analysis identified variations, uncertainties, and unknowns concerning moisture safety during the construction phase. It identified a substantial lack of verified solutions and documented reference cases that could be used to assess the moisture safety during the construction phase, especially precipitation on the structure and detailing. There was a recent increase of interest in academia in the construction phase of CLT structures; however, little focus on consequences of precipitation during construction, e.g., mold growth. However, there are no indications of obstacles impossible to mitigate within the scope of the risk assessment.
Therefore, after an update of the scope with further detailing of the targets according to the risk workshop, it is recommended to the management steering group to grant continuation to the identified scope to quantify precipitation loads for different mitigation strategies as well as their impact on the targets. It is suggested to proceed with a quantitative assessment, with a focus on the impact of climate conditions both on structure components and walls and floors as well as identified critical details.

3.3. Quantitative Assessment

The qualitative assessment comprises risk identification and addressing the earlier identified influential factors, uncertainties, and correlations.

3.3.1. Method of Analysis

The analysis was made in steps, starting with an analysis of the loads on the structure, followed by an analysis of the performances of system and details of importance.
The surface conditions, temperature, and relative humidity as well as the moisture content of the outer layer of the CLT panels were simulated using the 1-D hygrothermal calculation tool WUFI Pro [36]. The mold growth index was calculated according to the VTT-model [37] using the surface temperature and relative humidity from the WUFI simulations. Input data are given in Appendix A. The two targets are defined more precisely as:
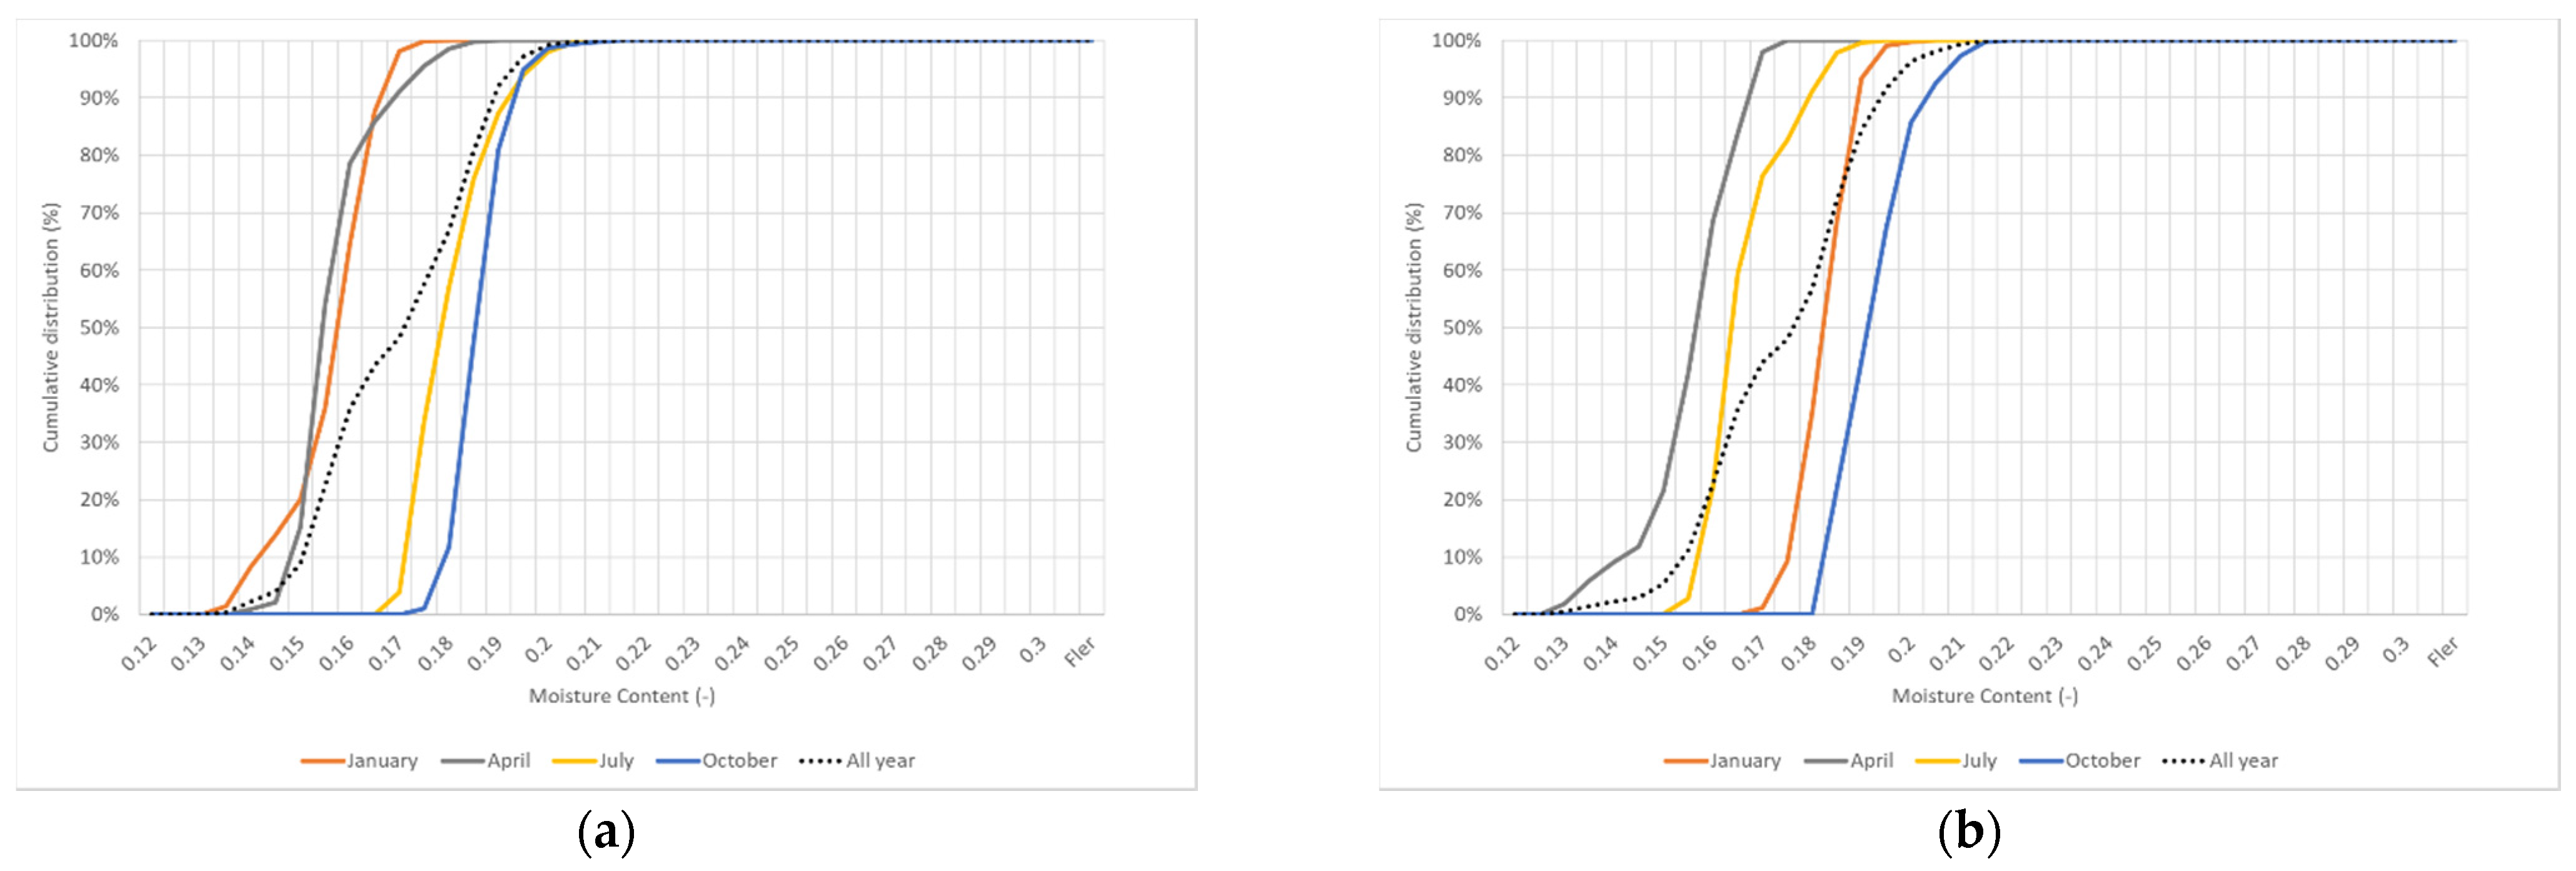
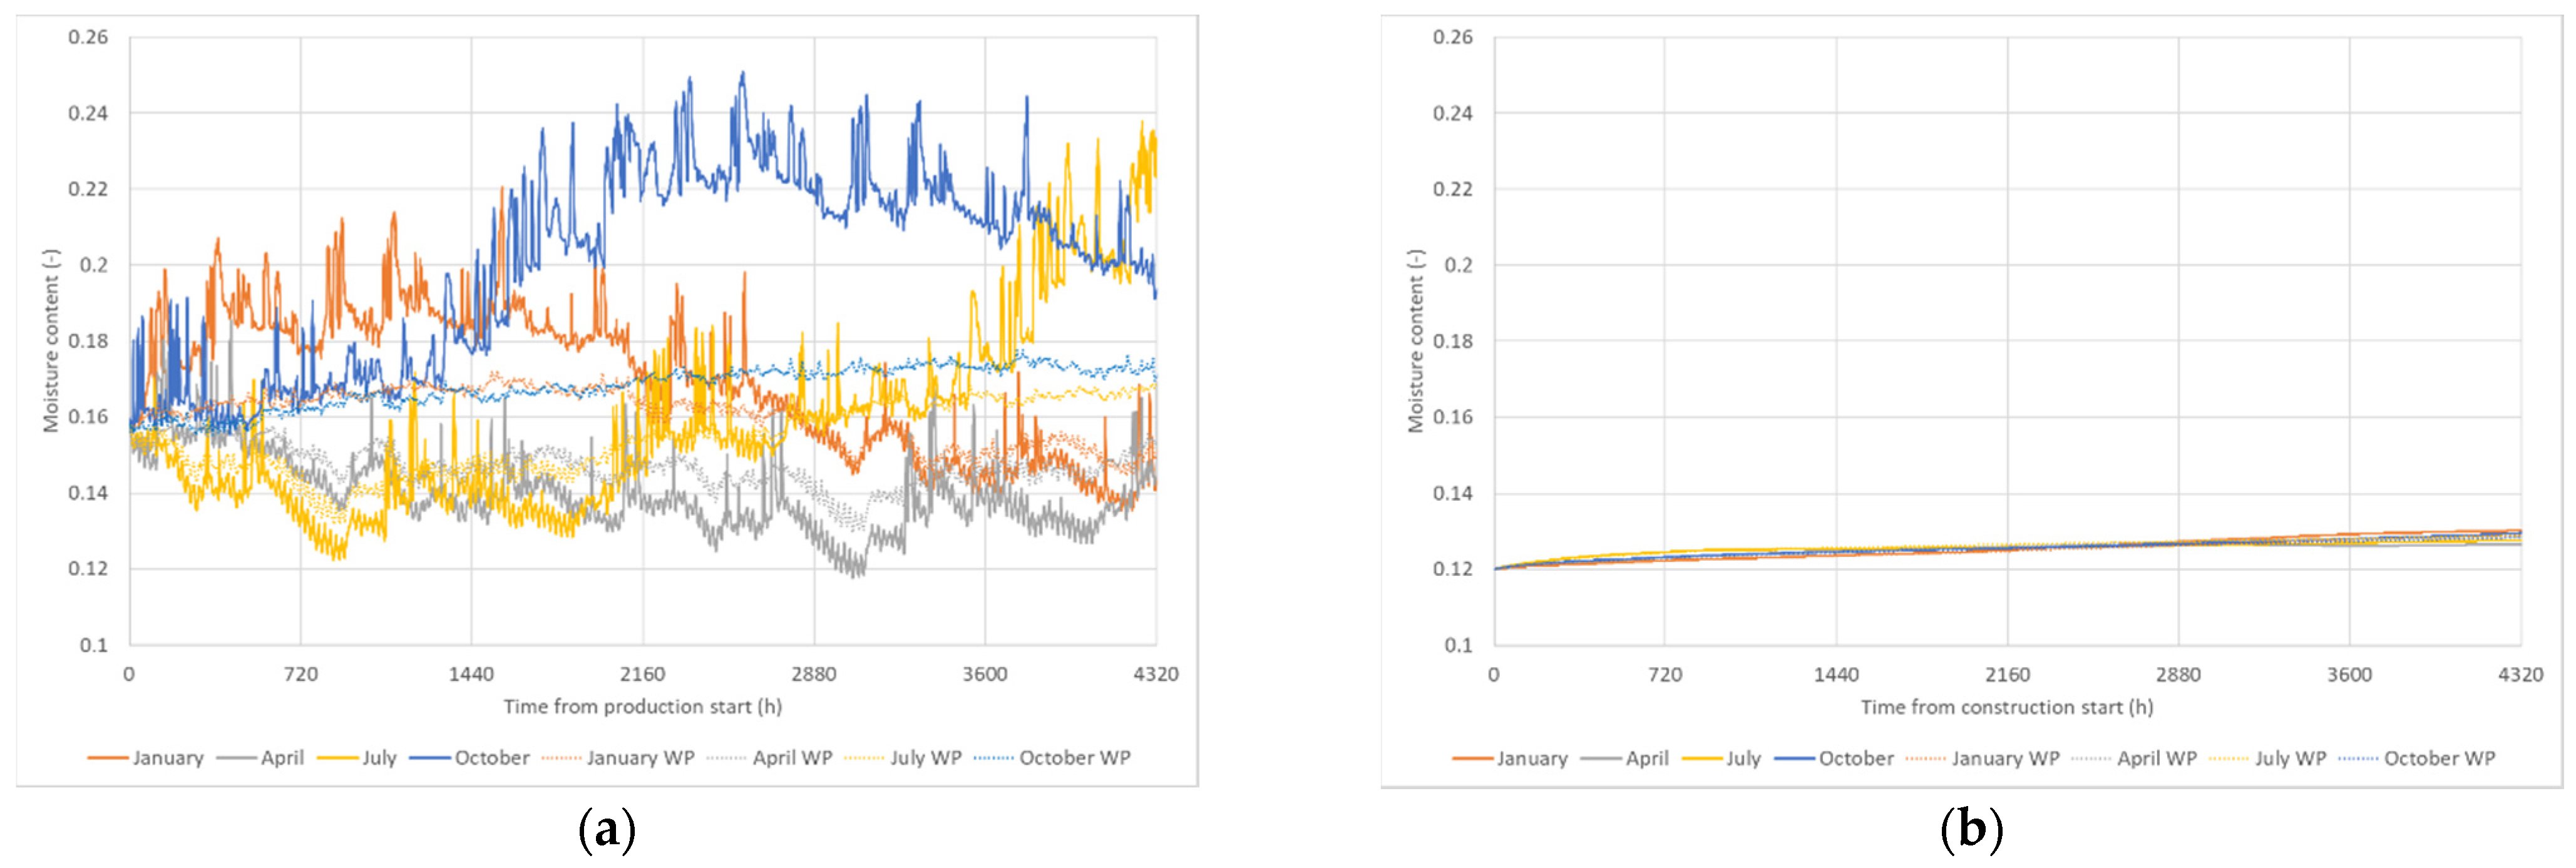
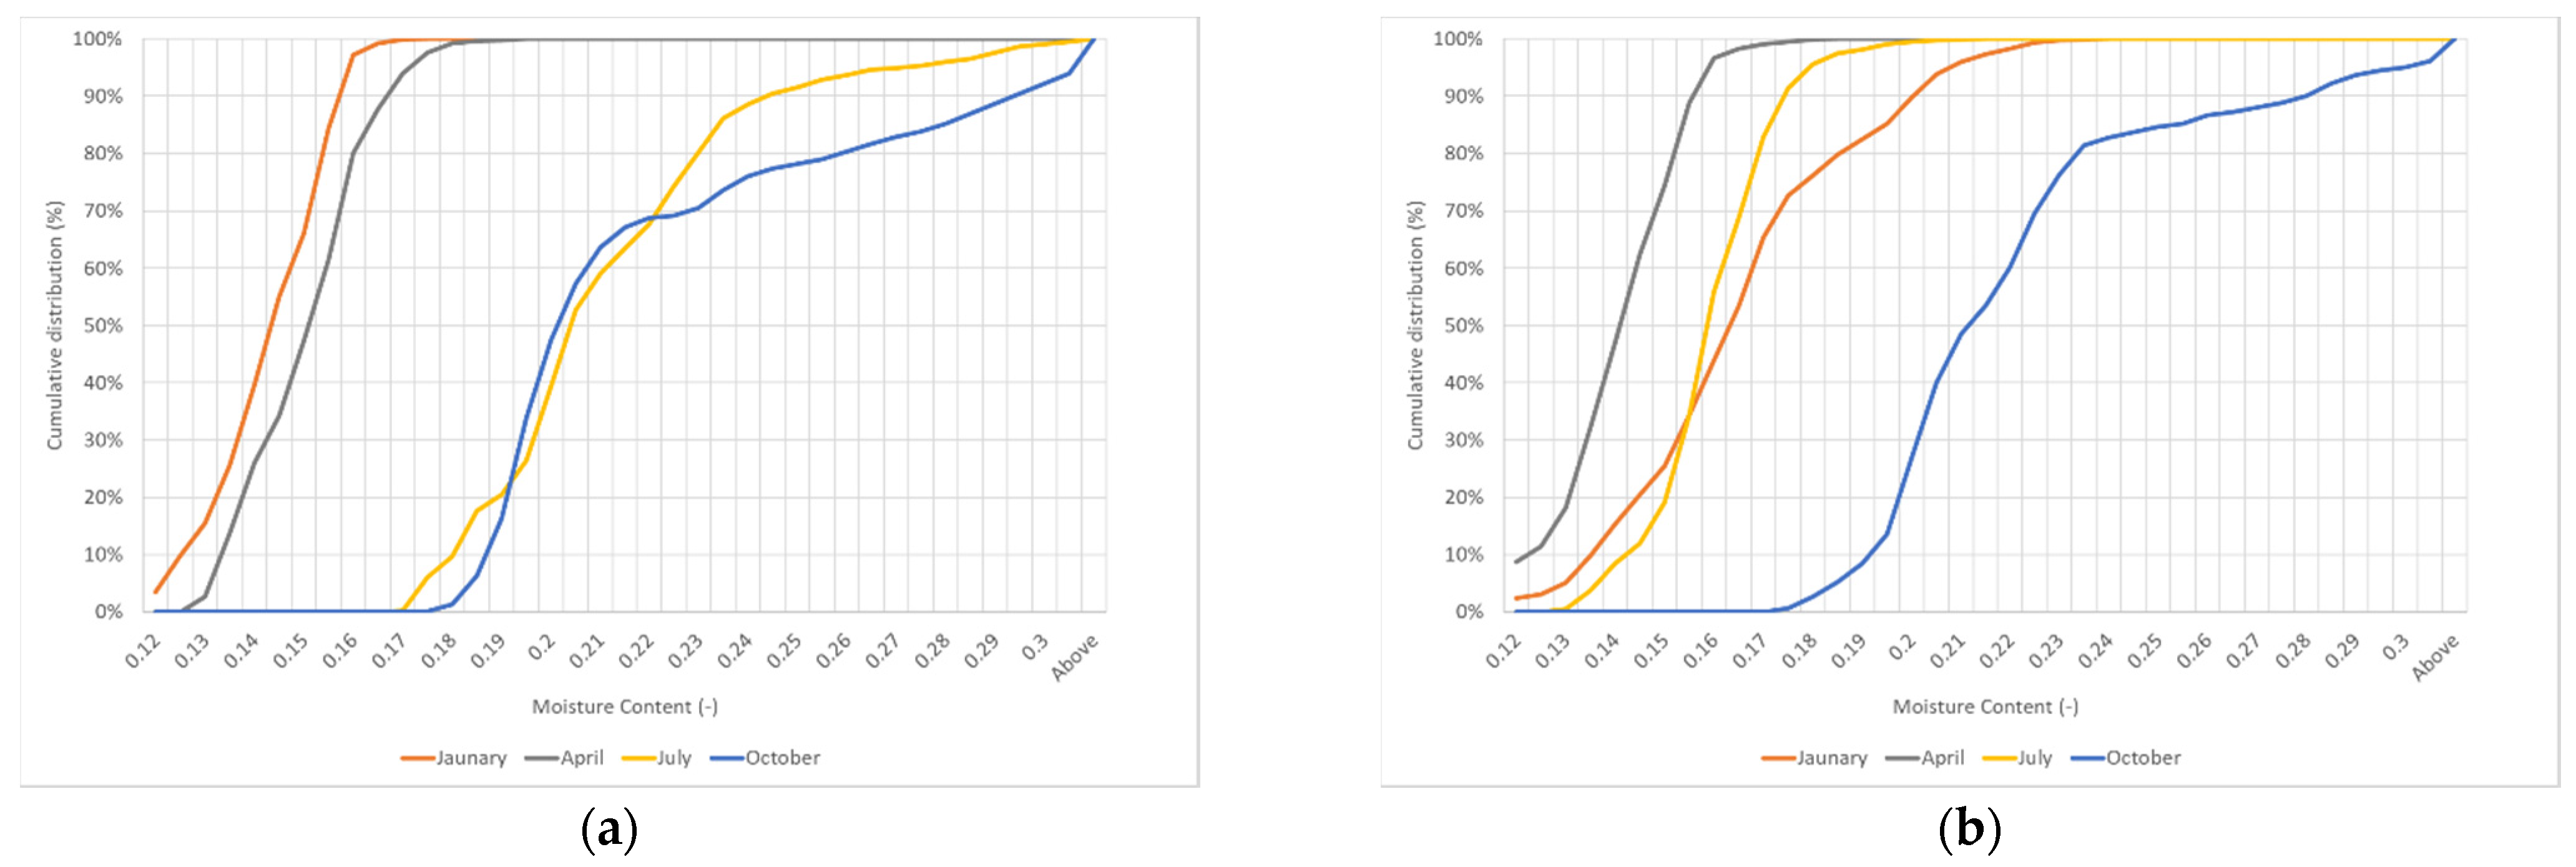
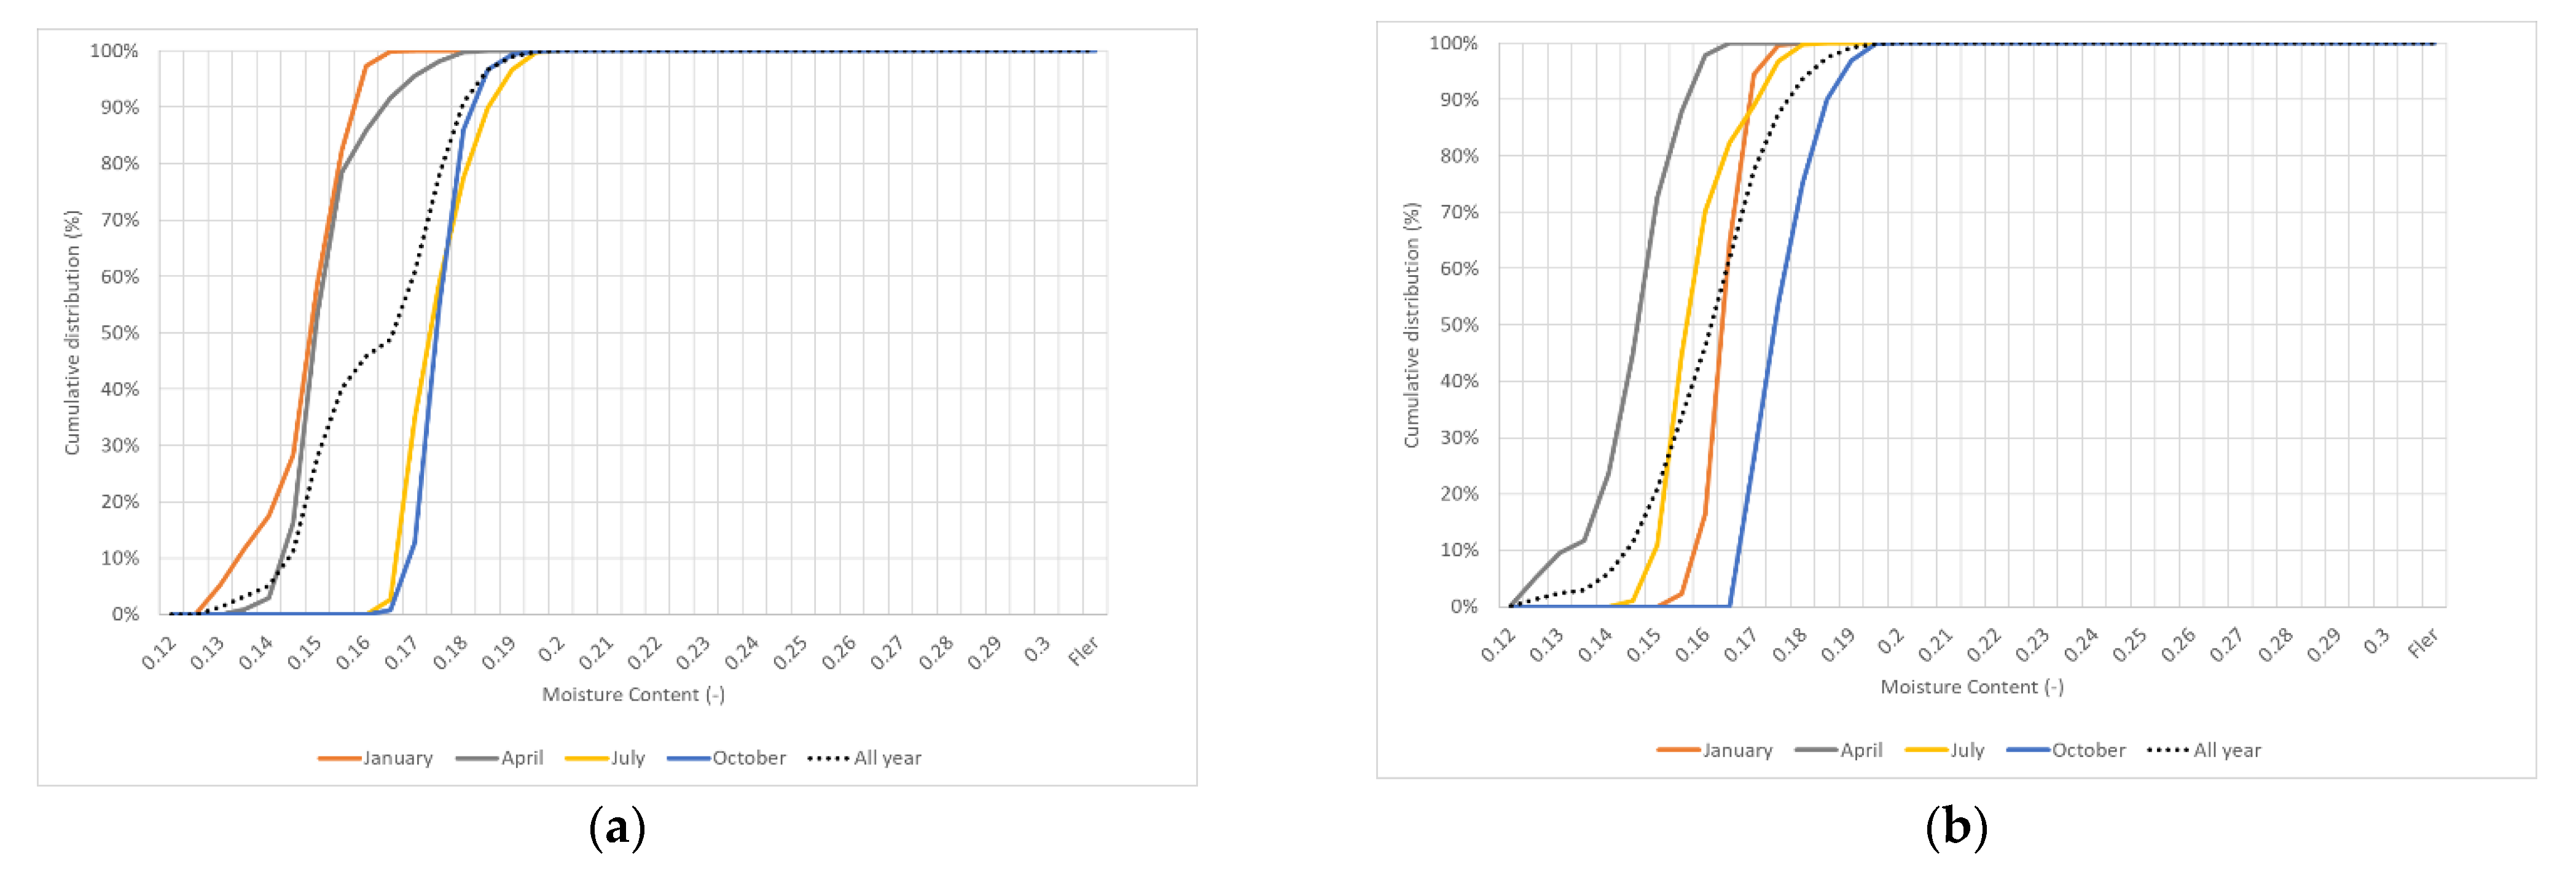
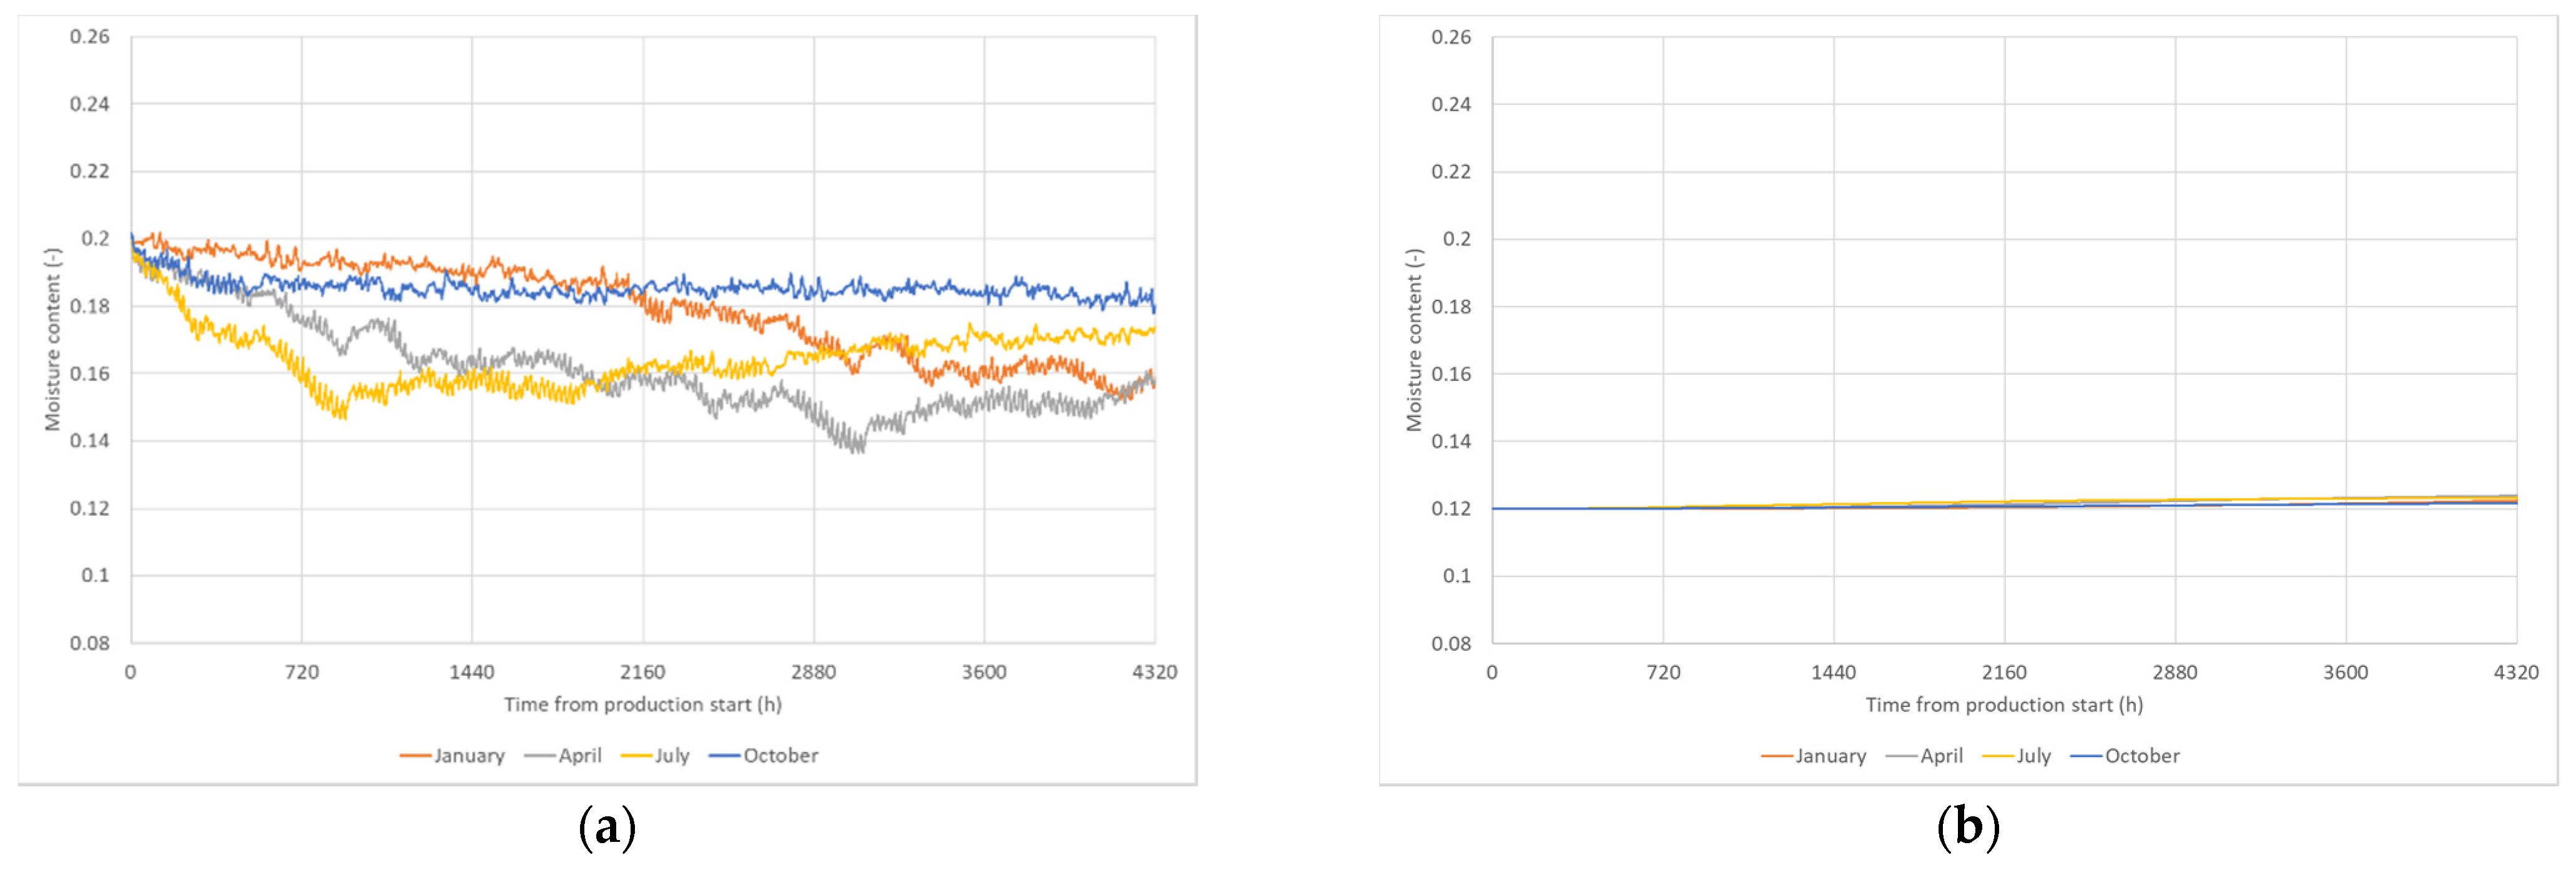
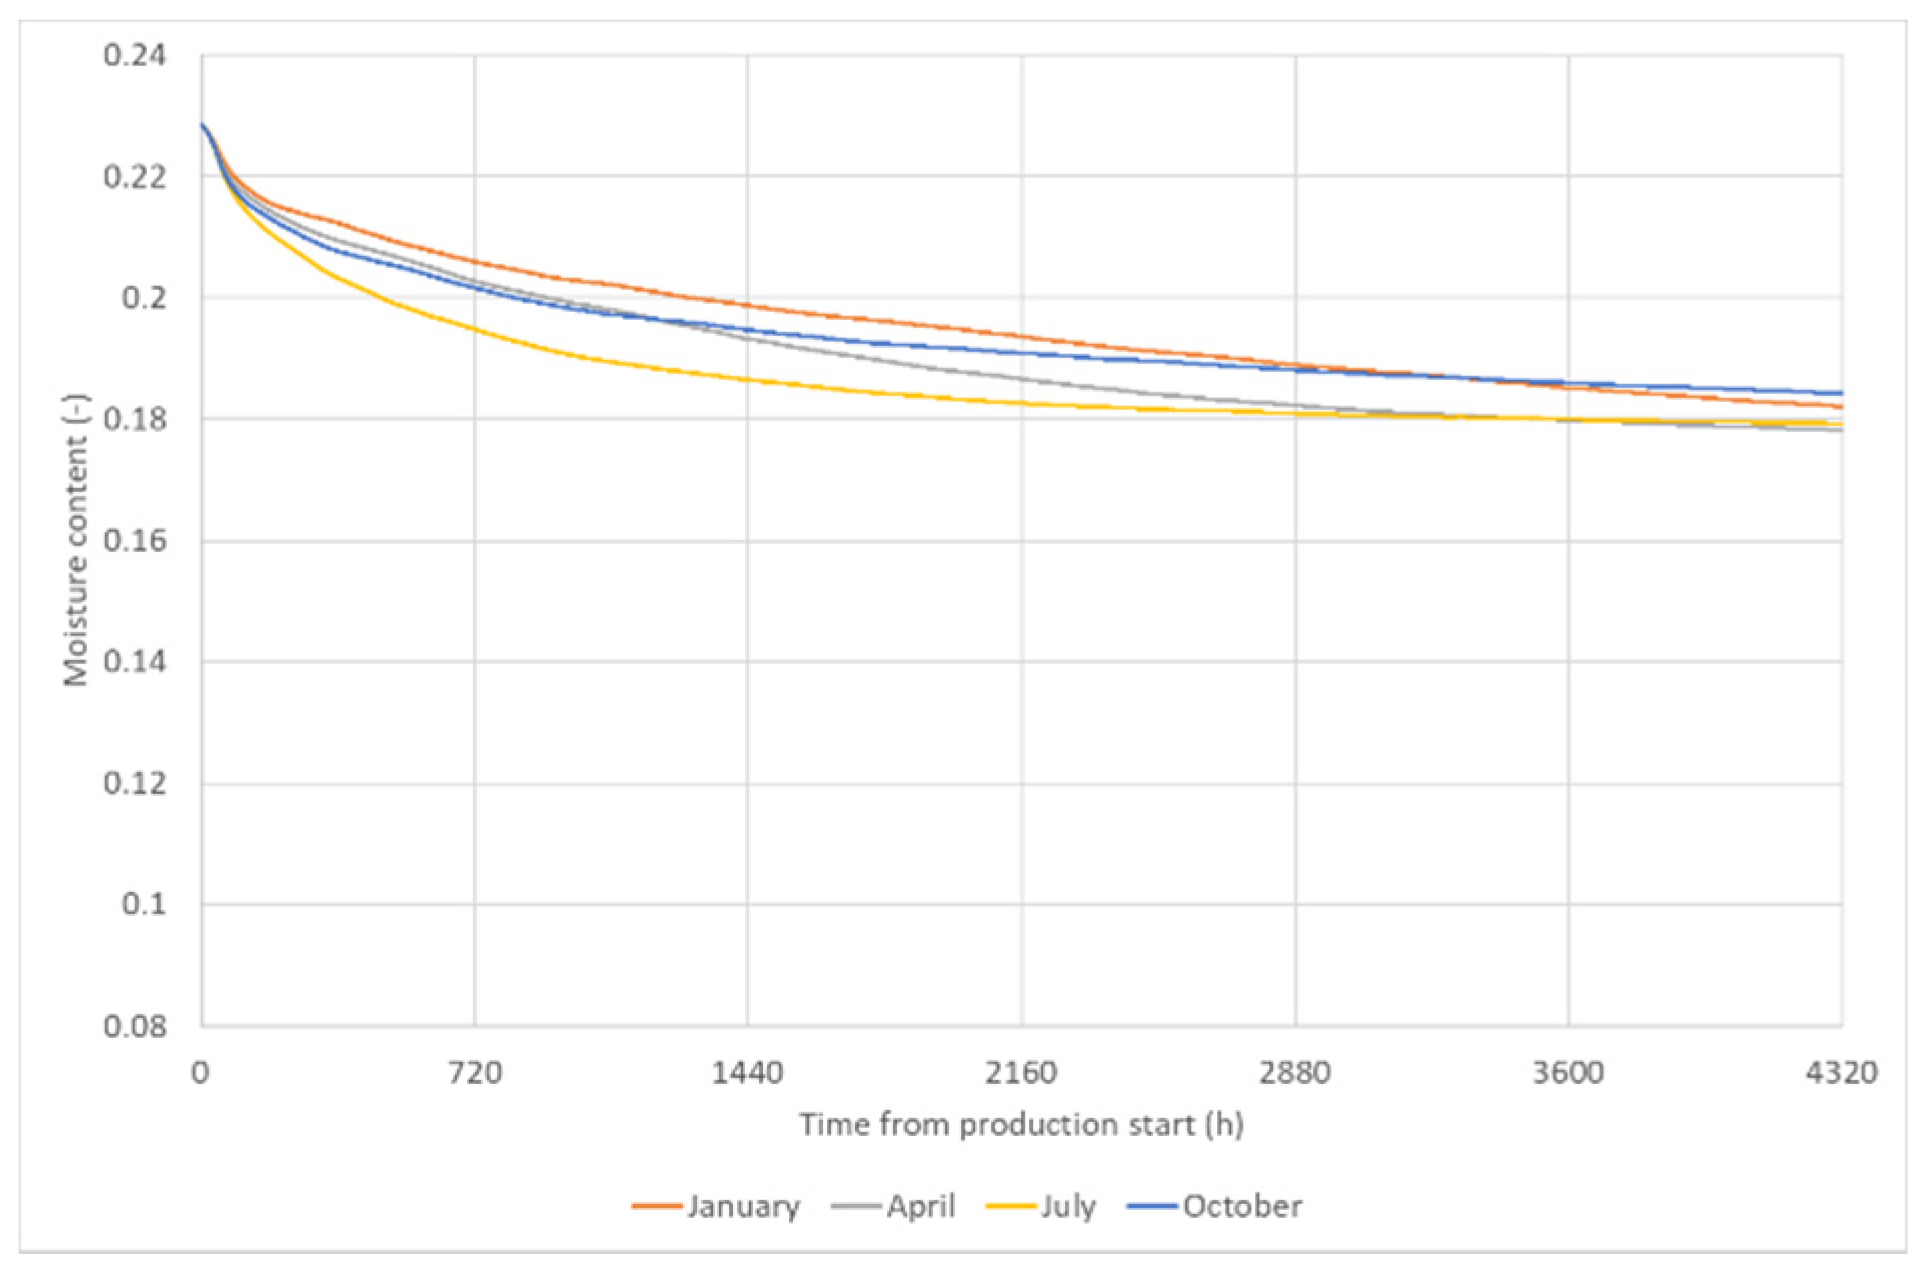
  • Moisture content in outer layer (0–20 mm) at time of built-in should not exceed 18% MC. The moisture content of construction is assessed using data of the last month of construction to capture variations in conditions.
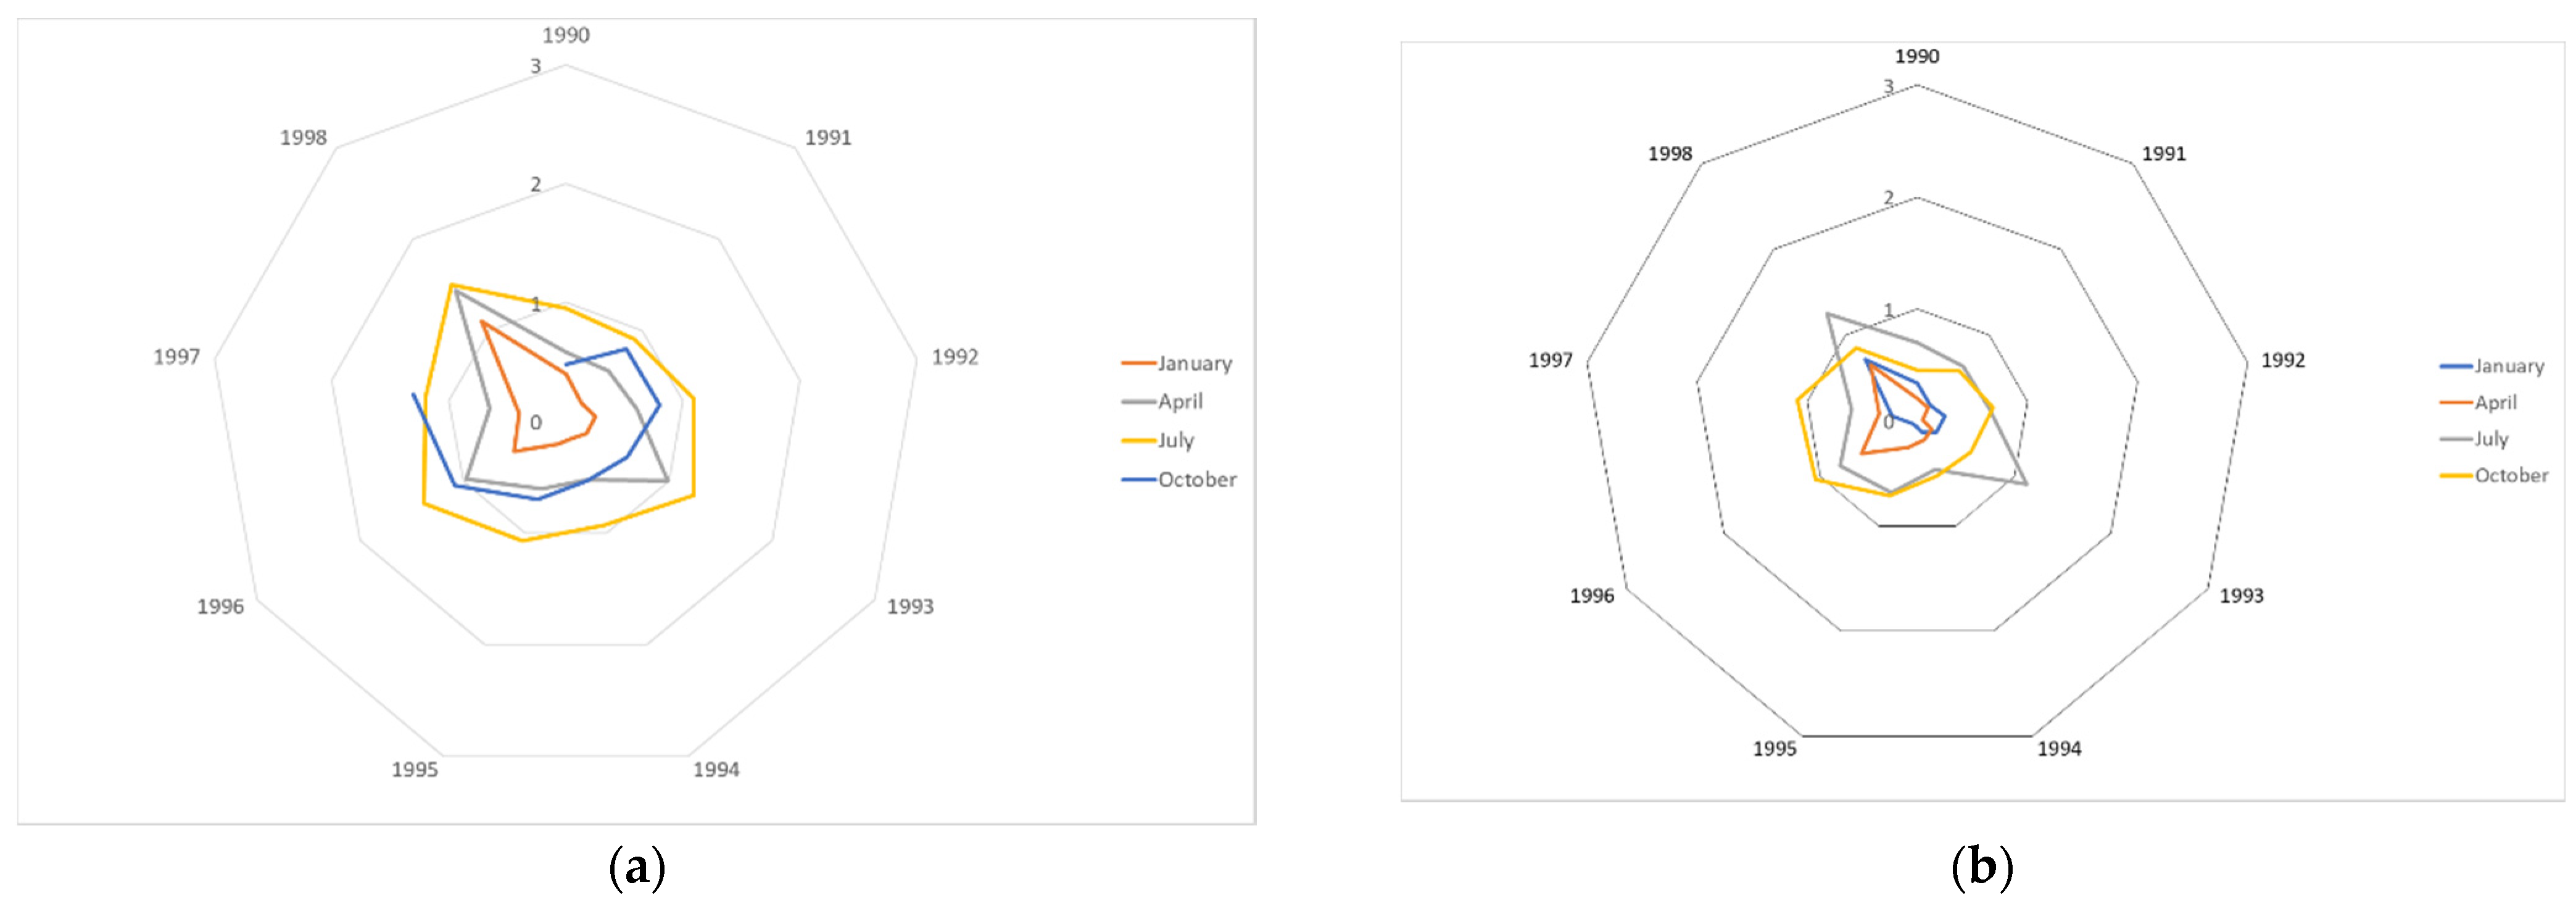
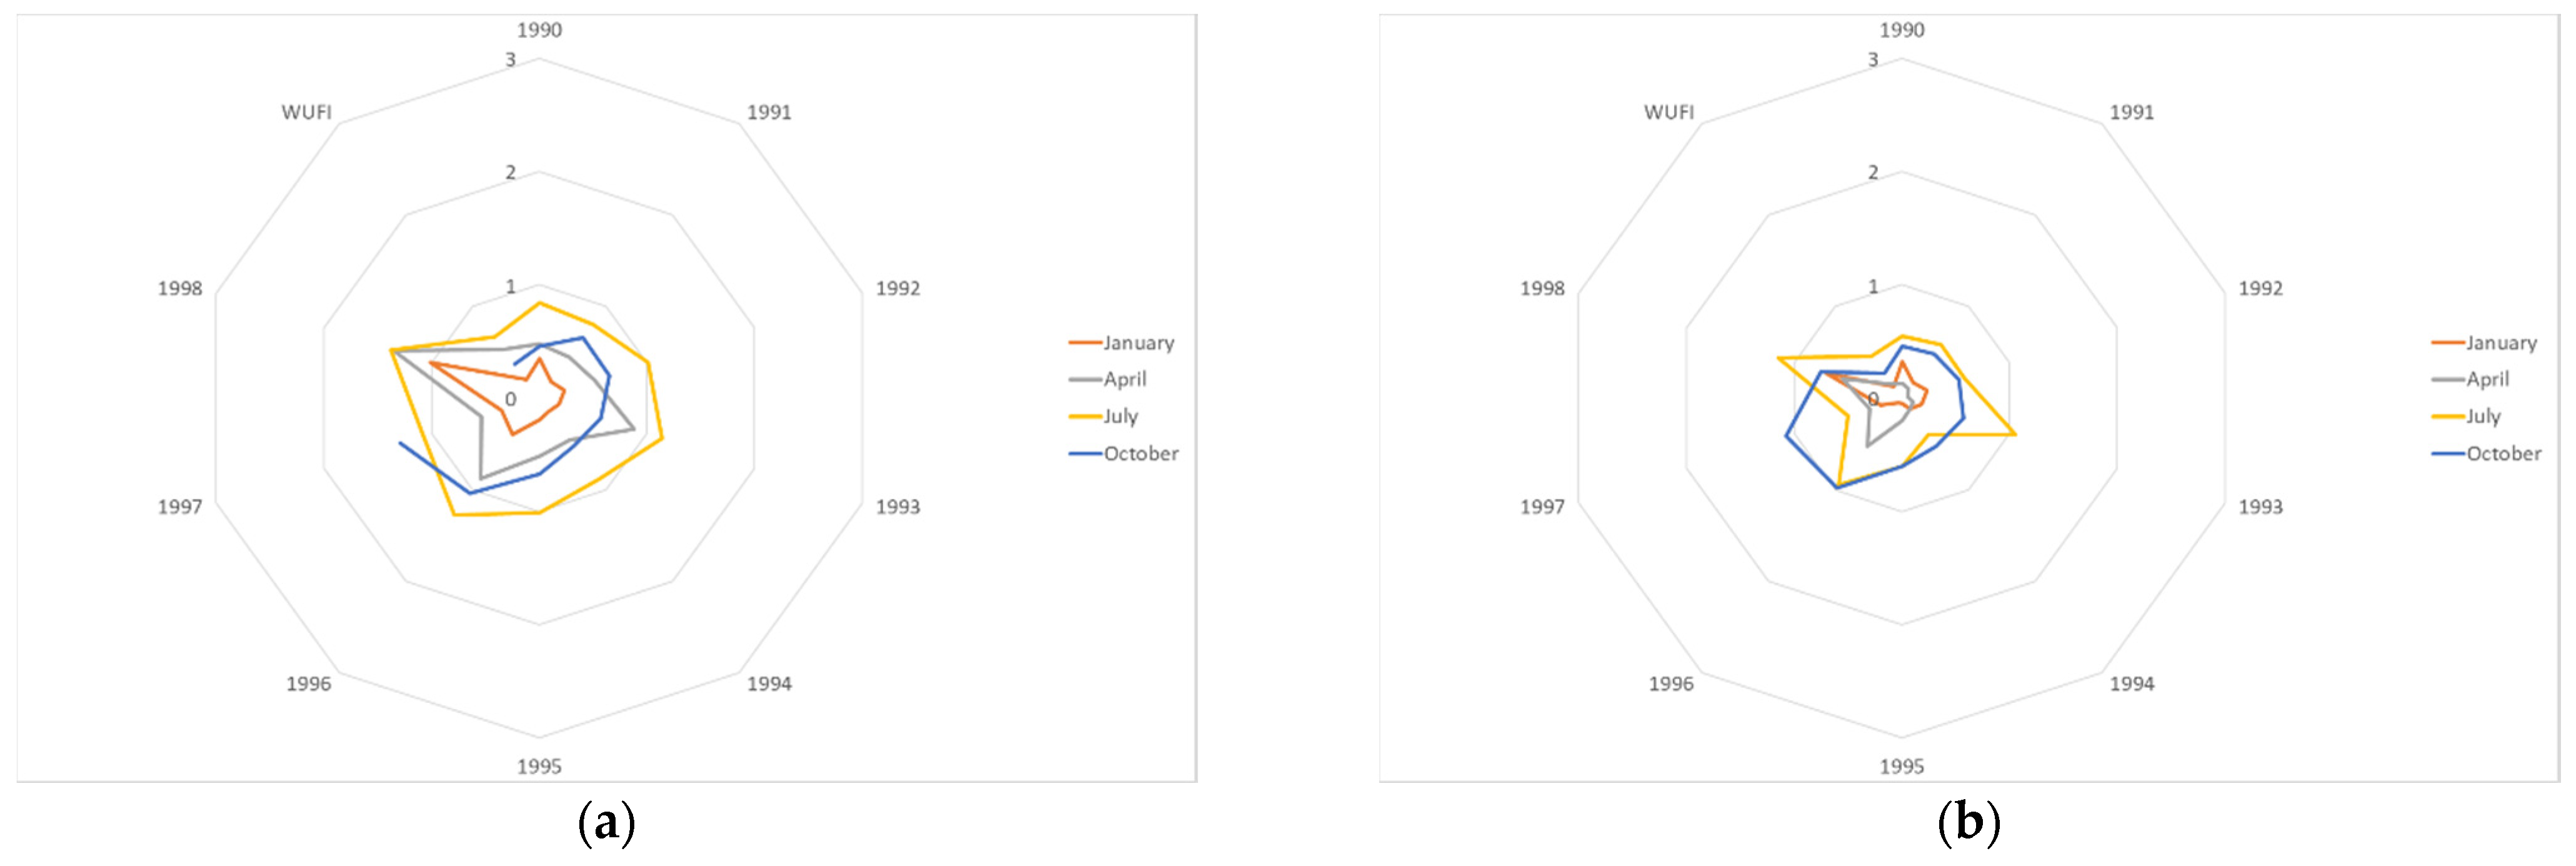
  • Level of mold growth is assessed at surface 0–6 according to the VTT scale [38]. Mold growth index >1 indicates initial stages of growth, mold growth index >3 indicates visible mold. The Swedish building regulations [23] state that the critical moisture level of a material should take into consideration when the growth of mold begins, without respect to visibility. Thus, the mold index exceeding 1 is chosen as the limit for the studied surfaces with a possible impact on the indoor environment [39].
Based on available material properties as investigated in [12], the CLT panels were simulated as layers of planed spruce separated by glue layers. Although the CLT panels are products where the suppliers have their own combinations of wooden materials and glues, the material properties are not explicit for each CLT product. Instead, the material properties suggested are often based on generic wood properties as well as formulated as homogenous material properties. This was discussed in [27,31,40,41,42], where differences between different materials and products were identified. Of course, the choice of material properties affects the results.
The target of mold growth is complex, as discussed in [43,44]. There are issues of estimating load and defining acceptable mold growth. Also, the resilience of CLT products are uncertain, as no critical moisture levels were given by suppliers [12] and generic data for wood have to be used. Furthermore, the simulations only cover the construction period, although the mold growth potential might be underestimated as the material is affected both before and after the construction period. Depending on the conditions in these phases, the resulting mold growth index might result in problems.

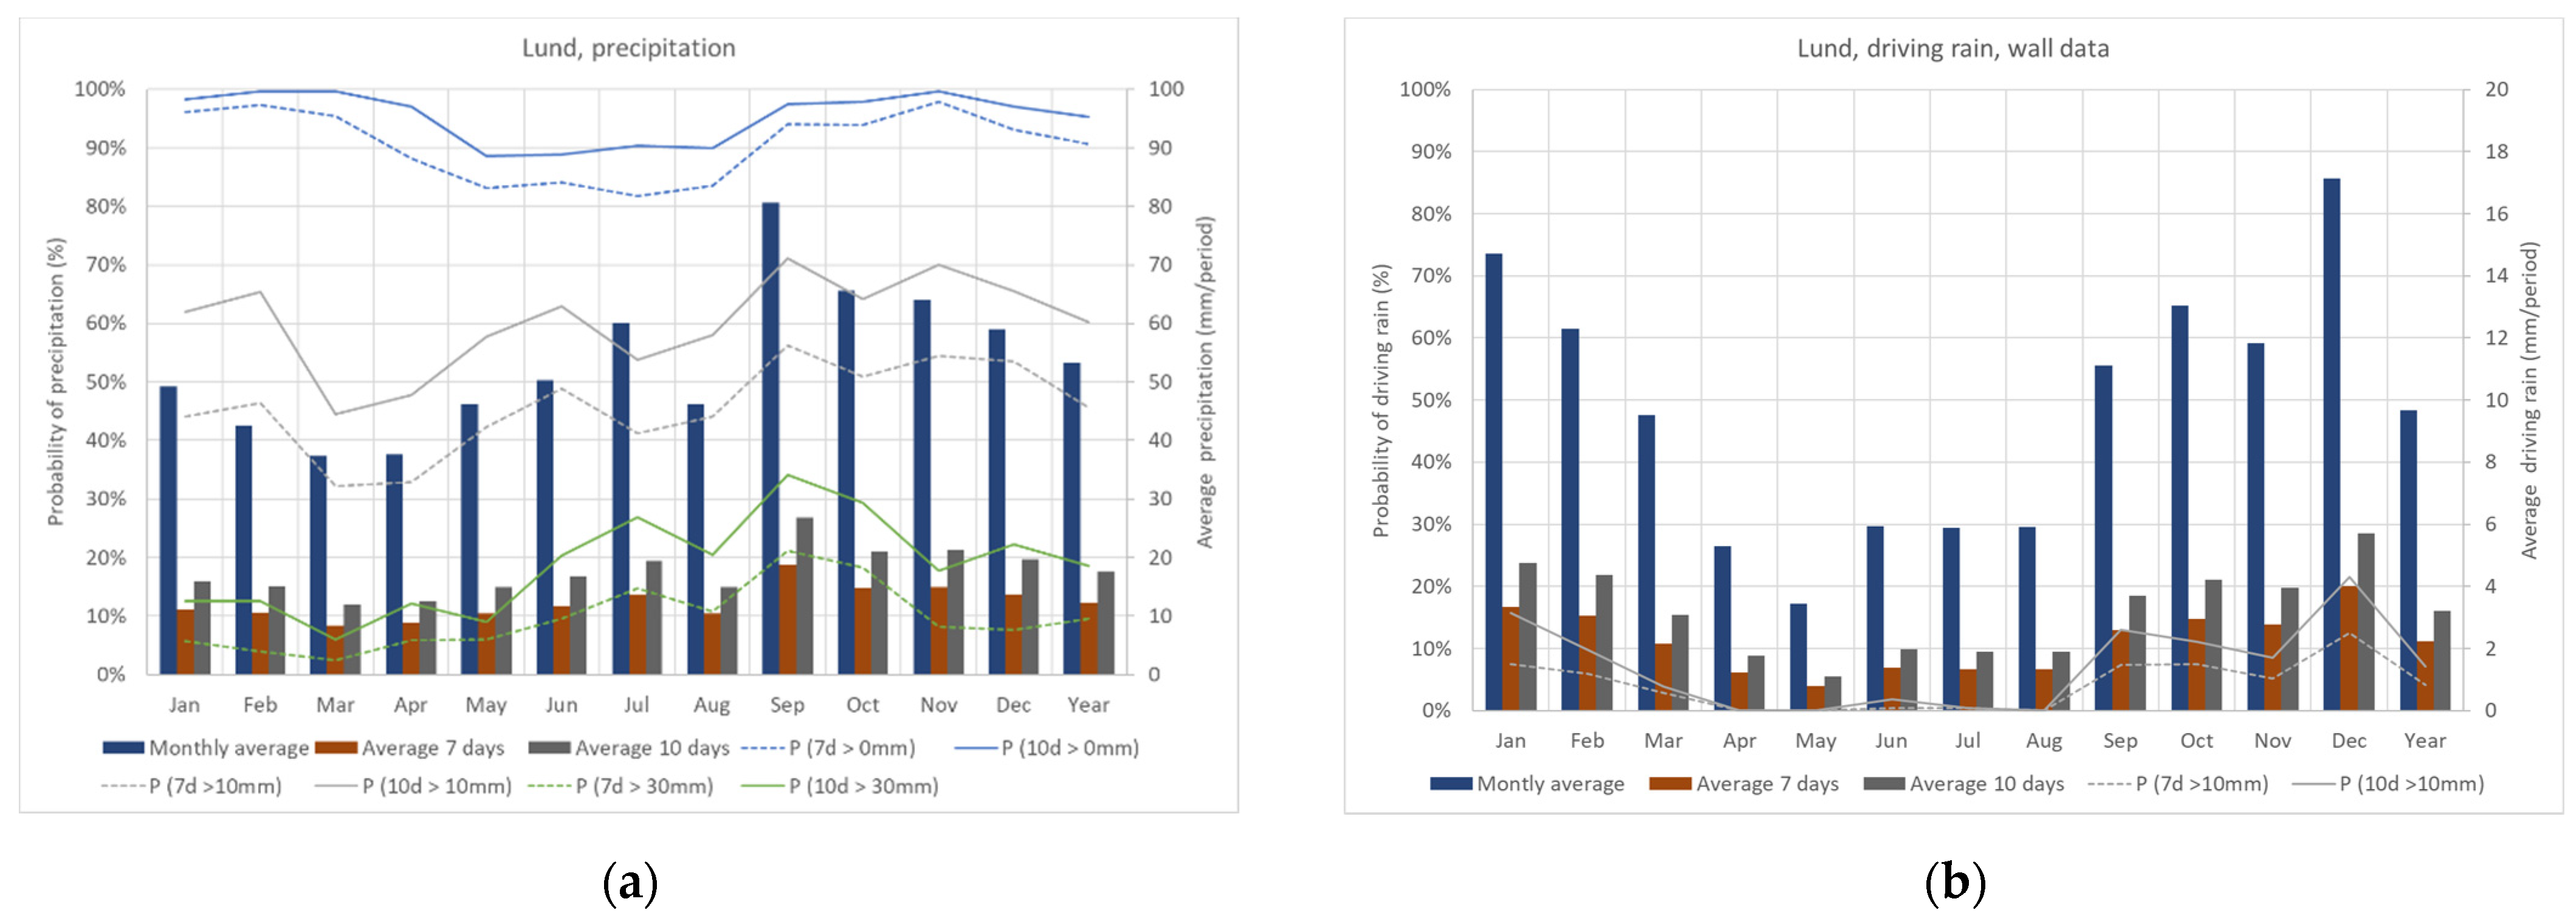
3.3.2. Analysis of Loads

Different data sets were used for representing outdoor climate. Hourly data were used, both from “normal year” in the WUFI database and from a dataset of nine consecutive years (1990–1998). An overview of used climate data is shown in Table 2.
Impact of outdoor air temperature and relative humidity: The potential of mold growth on wood depending on outdoor air temperature and humidity, without impact of radiation, wind, or precipitation, can also be illustrated using a mold prediction model. The climate of Lund was chosen for study based on Table 2. In Figure 6, the mold growth index for outdoor air temperature and humidity in Lund is shown, based on the VTT model [37]. The figure shows that the length of the exposure to outdoor climate is critical to mold growth even without the influence of precipitation; also, the variation is large. Depending on the time of the year the structure is exposed, a significant difference can be expected. The figures also show a significant difference between years. The variation of mold growth potential was also studied in [48], indicating the 90-percentile year to have a double mold growth potential compared to that of a normal year; thus, the authors argue for quantitative methods using probabilistic methods and reliability analysis when assessing the risk of onset of mold growth. Due to the relatively short construction period, the variations can be expected to have a stronger impact on the results and must be observed. The mold growth target might be exceeded by too long exposure to outdoor humidity and temperature, especially during autumn seasons (construction start in summer).
Precipitation: The loads on the structure during the construction phase are influenced by the exposure to precipitation and the time of the exposure. Based on the used climate files and an anticipated time schedule of construction, the expected precipitation during the construction period is given in Table 3 as mean values with standard deviation. If no weather protection is used, the structure will be exposed to the full rain loads. The exposure of the floor structure is then dependent on the speed of construction (as illustrated in Figure 7a). The precipitation on the floor panel averages from 12.3 mm to 17.5 mm, with a standard deviation in the same range. Regardless of the time of the year, it is likely (p > 0.8) that all floors will be exposed to some precipitation. During almost all year, it is likely (p > 0.5) at least one of the floors will be exposed to more than 30 mm rain during construction, even with a short construction period.
The exterior of the structure will be exposed to the full driving rain load until the façade is completed. The expected driving rain on an exterior wall in the most exposed direction during the construction period is given in Figure 7b. For a six-story building, the outside of the top floor wall is exposed to 9–18.5 weeks, whereas the base of the building is exposed to 14–26 weeks, assuming construction speed as in Table 1. The accumulated driving rain loads on the base of the building is, on average, 240 kg/m for a short construction period, and 480 kg/m for a long construction period for a six-story building. Depending on e.g., splashing, evaporation, intake in wood and in cracks, the actual amount hitting the base will be lower, and at the same time, water can also be expected to accumulate in specific points; it is therefore important that the detailing of the base can handle these loads.
The precipitation loads have a large variation at construction site depending on the time of the year, but there is also a significant variance in precipitation during the relatively short construction period. The probabilities of precipitation can be useful to inform site management on the importance of planning actions to protect the structure.
Mitigation: Use of weather protection. To protect the structure from precipitation, a full weather protection cover might be used. Weather protection solutions on the market are usually membranes on a metal structure or scaffolding. These is usually a lack of options to provide climate control due to the great volume and the lack of insulation and air tightness of the weather protection cover. If the weather protection is openable, it is reasonable to assume it is only opened when there is no precipitation. A lack of data on climate conditions within this kind of structure was identified, and to estimate the indoor climate in a weather protection, measurements from a construction project were analyzed [49]. From five months’ hourly measurements of temperature and air humidity inside the weather protection, as well as outside the weather protection while constructing a CLT structure, a slight increase in average temperatures within the weather protection while the average moisture supply was slightly below zero was noted. There was also an indication that the inertia of the structure resulted in a slight lag for a few hours in the conditions of the weather protection. As a conclusion, a conservative assumption as to critical hygrothermal conditions is that the climate inside the weather protection is assumed to be equivalent to that of outdoors.

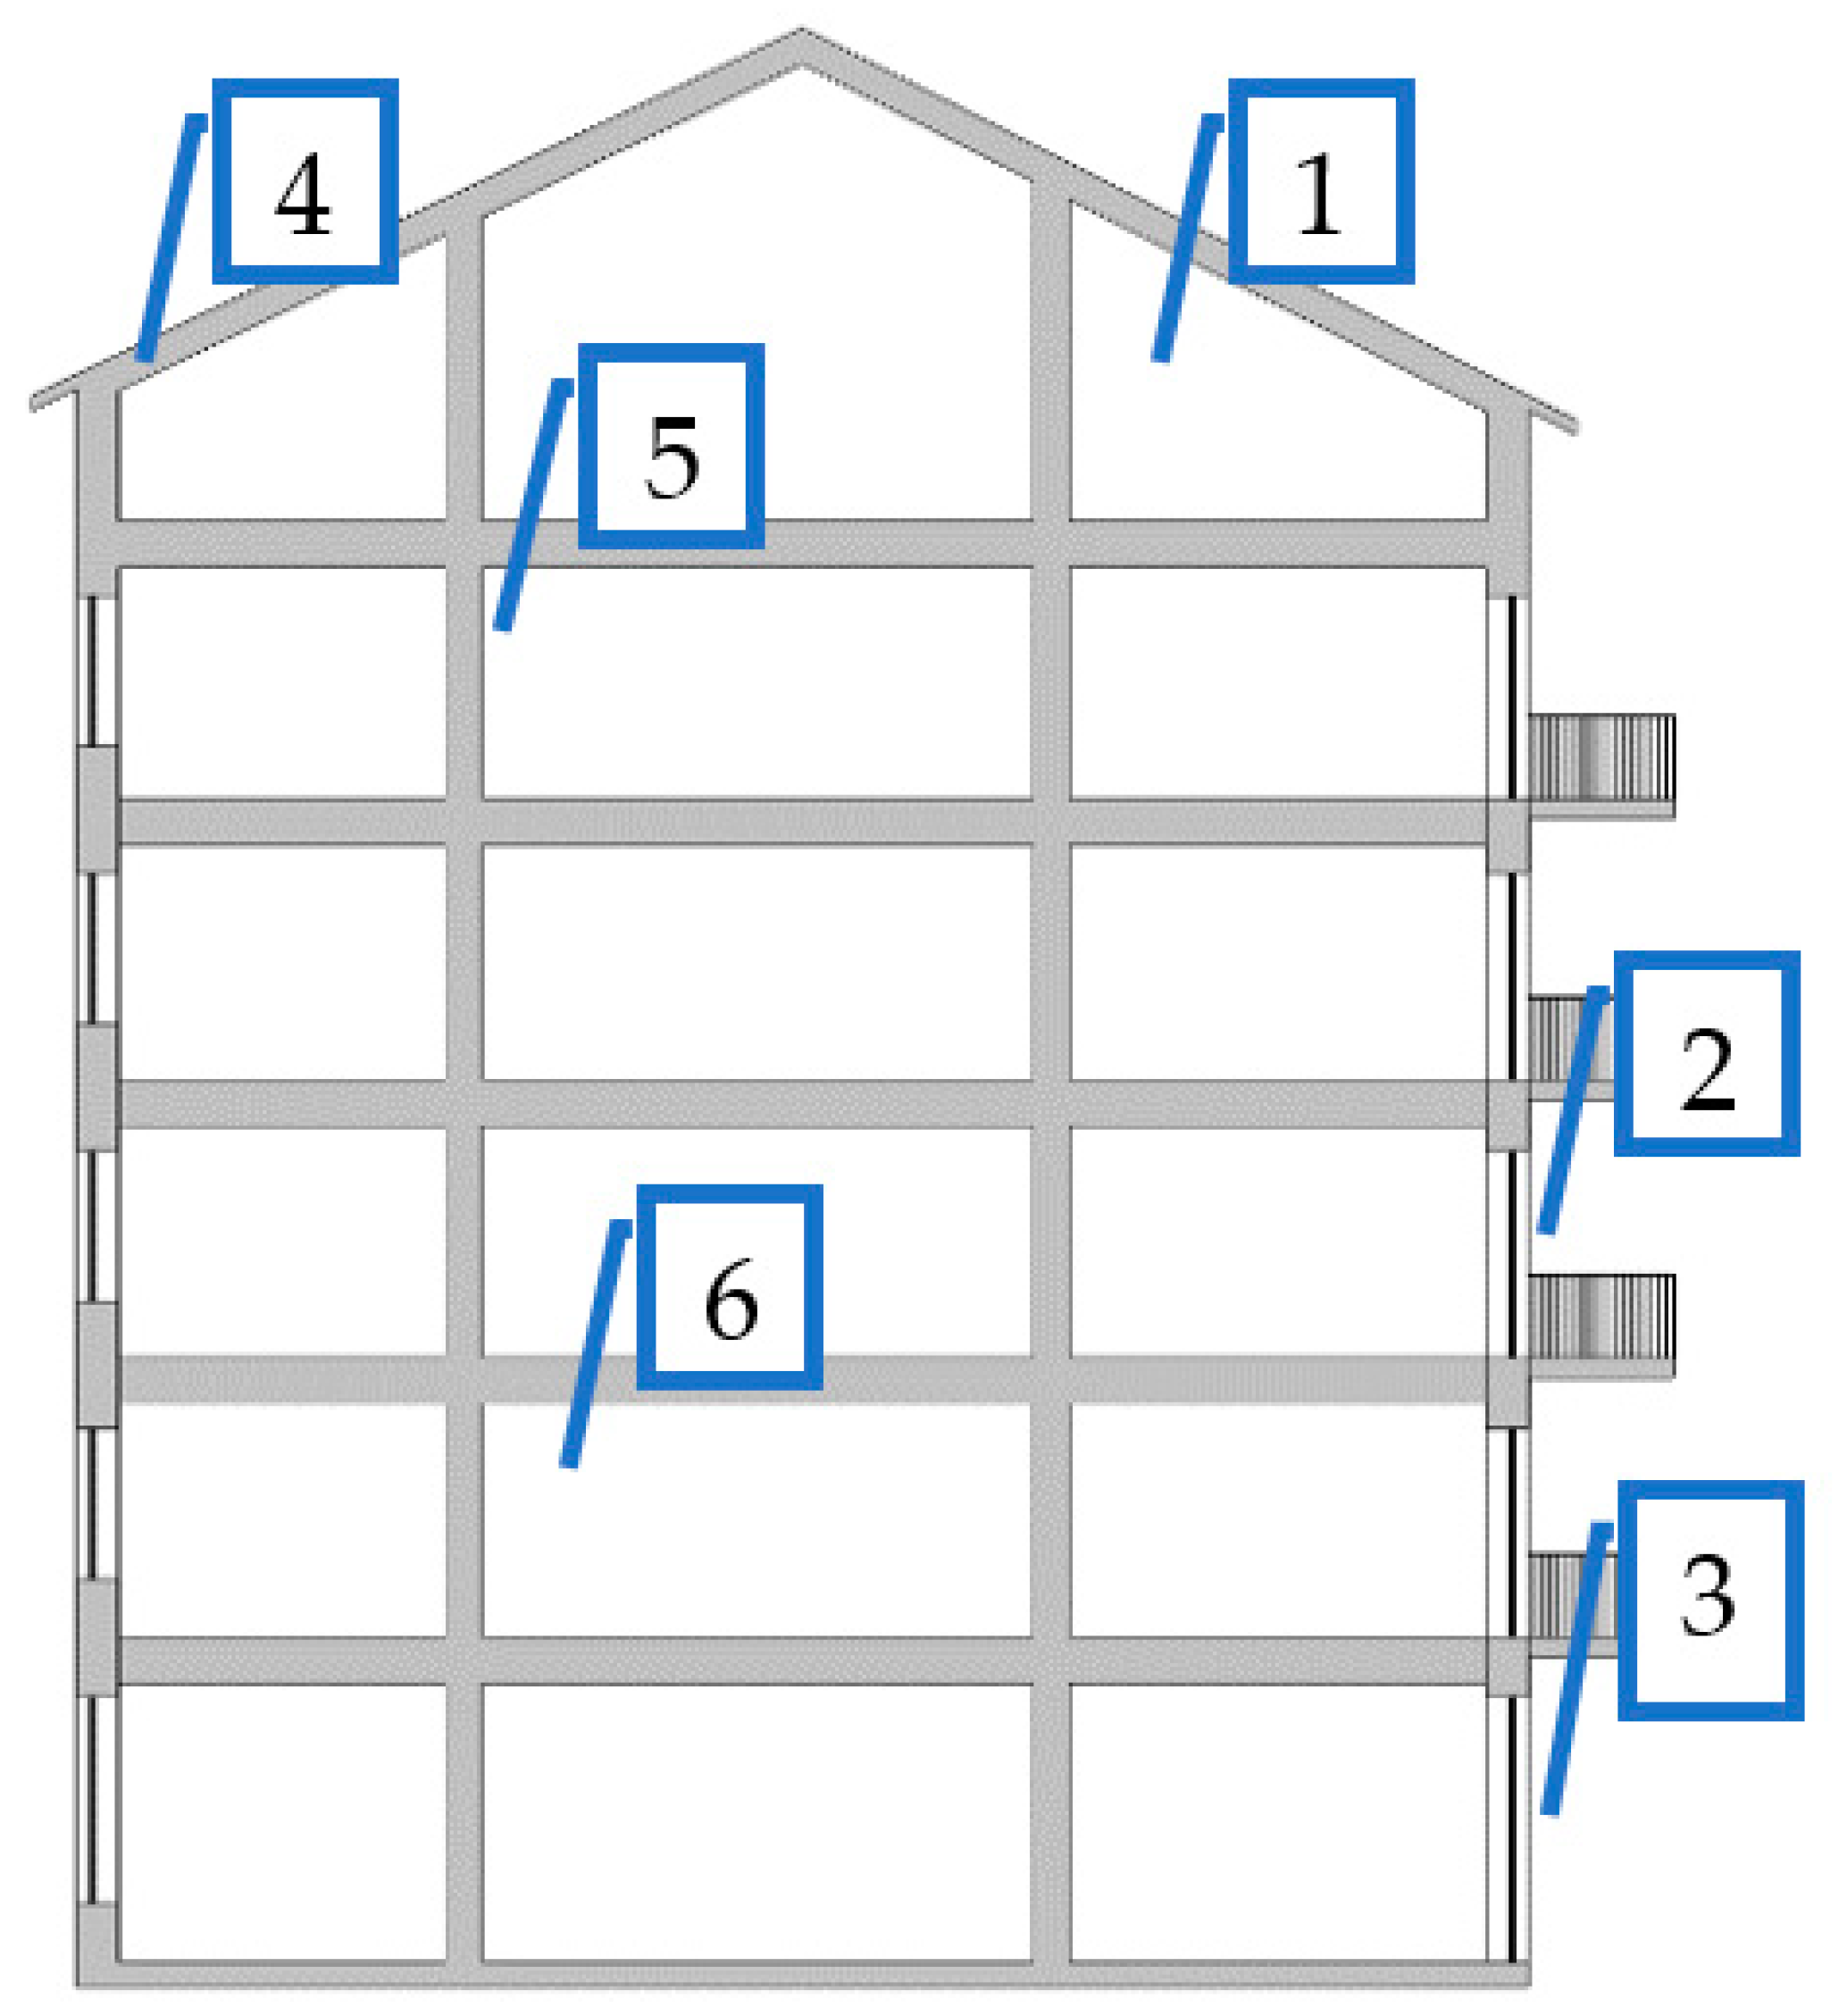
3.3.3. Structure Analysis: Exterior Walls

The studied wall is facing the most driving rain exposed direction for the location, south–southwest.
Target moisture content: The first target with the criteria for moisture content relates to the moisture content of the surface when built-in, and the conditions in the surface layer is simulated. As the criteria relate to the built-in moisture content, cumulative distributions of moisture content in the outer layer during the last month of construction period are studied, indicating significant differences between seasons. Simulation results are given in Appendix B. Occasionally, the moisture content in the outer layer of the CLT panels is very high, up to 35% if exposed to precipitation. These high levels of moisture content for CLT panels during construction was also indicated for floor panels at building site by other researchers in [50]. For the studied case, the target of a surface moisture content below 18% MC at time of built-in, cannot be expected to be met with adequate confidence if construction ends in June or September without weather protection. Using a weather protection, the moisture content is significantly lower all year, less dependent on climate variations and only occasionally higher moisture content is expected. For the case without weather protection, the solar radiation affects the moisture content in the wall, indicating a relatively low moisture content during summer in the wall facing south-southwest. The moisture content might be higher for other orientations with less driving rain, as these also are exposed to less solar radiation.
Target mold growth: The second target with the criteria for mold growth relates to the potential of mold growth depending on conditions of the surface layer during the construction period. As the mold growth potential on unprotected exterior surfaces is affected by rain, frost and radiation, current mold growth models are not recommended to be applied to the case without weather protection, i.e., exposed conditions [39]. However, because of the high moisture content of the surface material and the prevailing outdoor temperatures, there is a potential of initiated mold growth that needs to be investigated. In Figure 8, the anticipated mold growth potential with weather protection is pictured for each season using the VTT-model using WUFI climate with and without weather protection. The mold growth potential increases over time for most cases, and if the construction period is prolonged, a low mold growth potential can be anticipated, even with a weather protection. As mold modeling is very complex, with high uncertainty, the mold growth potential of the exterior surfaces should be further validated onsite.
For the case using a weather protection, simulations with the VTT model give the variation of mold growth index of the surface during the construction period for different years are shown in Figure 9. The results show a significant difference between different seasons and different years. By using a normal year, the mold growth index seems to be underestimated. For construction starting in July and October, the normal year even returned the lowest value. A faster construction speed will reduce the higher incidents significantly, especially if the critical period (late autumn and winter) can be avoided.

3.3.4. Structure Analysis: Intermediate Floor

The studied intermediate floor is assumed to be protected from precipitation after the initial installation period. The case of local exposure is handled in Section 3.3.5.
Target moisture content. The first target with the criteria for moisture content relates to the moisture content of the surface when built in. For a CLT panel, only the surface layer is typically significantly affected by the outdoor climate during the construction period, and the variation between different seasons and years is large. Simulations results are given in Appendix B. The resulting moisture content depends to some extent on the initial precipitation, especially for the shorter construction time, but also on the surrounding conditions during the construction period. For the studied case, the target of a surface moisture content below 18% MC at time of built-in cannot be expected to be met with adequate confidence if construction ends in June or September without weather protection for both construction lengths. For the case with weather protection, the moisture content is lower all year, less dependent on climate variations, and only occasionally higher moisture content is expected.
Target mold growth. The second criteria, the criteria for mold growth, relate to the potential of mold growth depending on conditions of the surface layer during the construction period. The variation of mold growth index of the floor surface does not deviate significantly from mold growth index for wall panels when using a full weather protection. Even the mold growth index of the floor surface exposed to 30 mm initial rain differs only slightly from the mold growth index of wall panels with weather protection if water is removed on an hourly basis after rain and no water is trapped in cracks. The initial higher moisture content in this advantageous case will in most cases dry out without significantly affecting the mold growth index compared to that of unexposed panels. This assumes that the panels are exposed to surrounding air and are not built-in during the studied period, and, more importantly, it could be questioned if panels are without water trapping cracks.

3.3.5. Detail Analysis: Shafts and Other Leakage

CLT panels in connection to shafts and other leakage are assumed to be exposed to full horizontal precipitation during the construction period if no weather protection is applied. These conditions are assumed to be true for a limited area of the intermediate floor, a perimeter around shafts, and other openings. If a weather protection is used, the shaft is not an issue as all construction is assumed to be fully protected.
Target moisture content. The moisture content due to exposure of leakage, typically from a shaft where there is no overlaying floor to protect the structure, is simulated based on normal year. For all seasons, the moisture content is significantly higher for all the surrounding floors comparable to that of the external walls. Except for construction start in April, there is a significant potential of exceeding the target depending on the length of exposure. These results can be applied to material in, and close to, shafts. Simulations results are given in Appendix B.
Target mold growth. The shafts or other leakage are assumed to expose the structure to precipitation during the construction period, resulting in higher moisture content and a greater mold growth potential, see Figure 10. Except for construction start in January, it is a high potential of exceeding the mold growth target. Note the relatively low mold growth potential of the normal year in comparison to that of other years.

3.3.6. Detail Analysis: Water Trapping

Several details in the structure result in a potential for water trapping. In the studied construction interior walls, exterior wall to floor and to socket are identified. The assumption of heavy rains during the part of the construction period where the interior wall is exposed to precipitation (7–10 days) results in approximately 30 mm of rain in the gap between CLT panels that must dry out through the panels. This has a high probability to occur for at least some internal walls, according to Figure 7, resulting in high moisture content during a long period and potential for mold growth. As it is built-in after the rainfall with a moisture content over 18% MC, the target is not reached by the criteria for the target. The drying out within the wall for a normal year also shows a slow process. Simulation results are given in Appendix B. The mold growth potential is less clear during the winter period when the temperature is too low to be favorable to mold growth during construction. However, as the moisture content is high when built-in, the mold growth potential will be high when heating of the building is started, and this solution should be avoided if no weather protection is used.

3.3.7. Tollgate 3

The quantitative analysis identified values and probabilities for meeting the targets to complement the qualitative analysis. The assessment identified a need for precautions when implementing the solution. However, there are no indications for obstacles impossible to mitigate within the scope. It is recommended to the management steering group to grant continuation of the identified scope and to report results together with suitable requirements for using the solution, including recommendations for weather protection.

3.4. Evaluation Reporting

Based on documentation of scope, together with documented qualitative and quantitative assessment, the evaluation reporting comprises a summary of requirements and recommendations.
Overall, the results indicate moisture uptake with a potential of high moisture content during the construction phase when exposing CLT structures to precipitation. The moisture content results are in line with previous studies, where several field measurements were reported [22,27,28,29,30,31]. The analysis also indicates mold growth mainly driven by exposing material to precipitation. Studies on mold growth during construction phase are less common, but results are in line with [22,32]. However, the importance of the construction period, together with the impact of variations in weather conditions and future climate, seems to be underestimated in the industry.
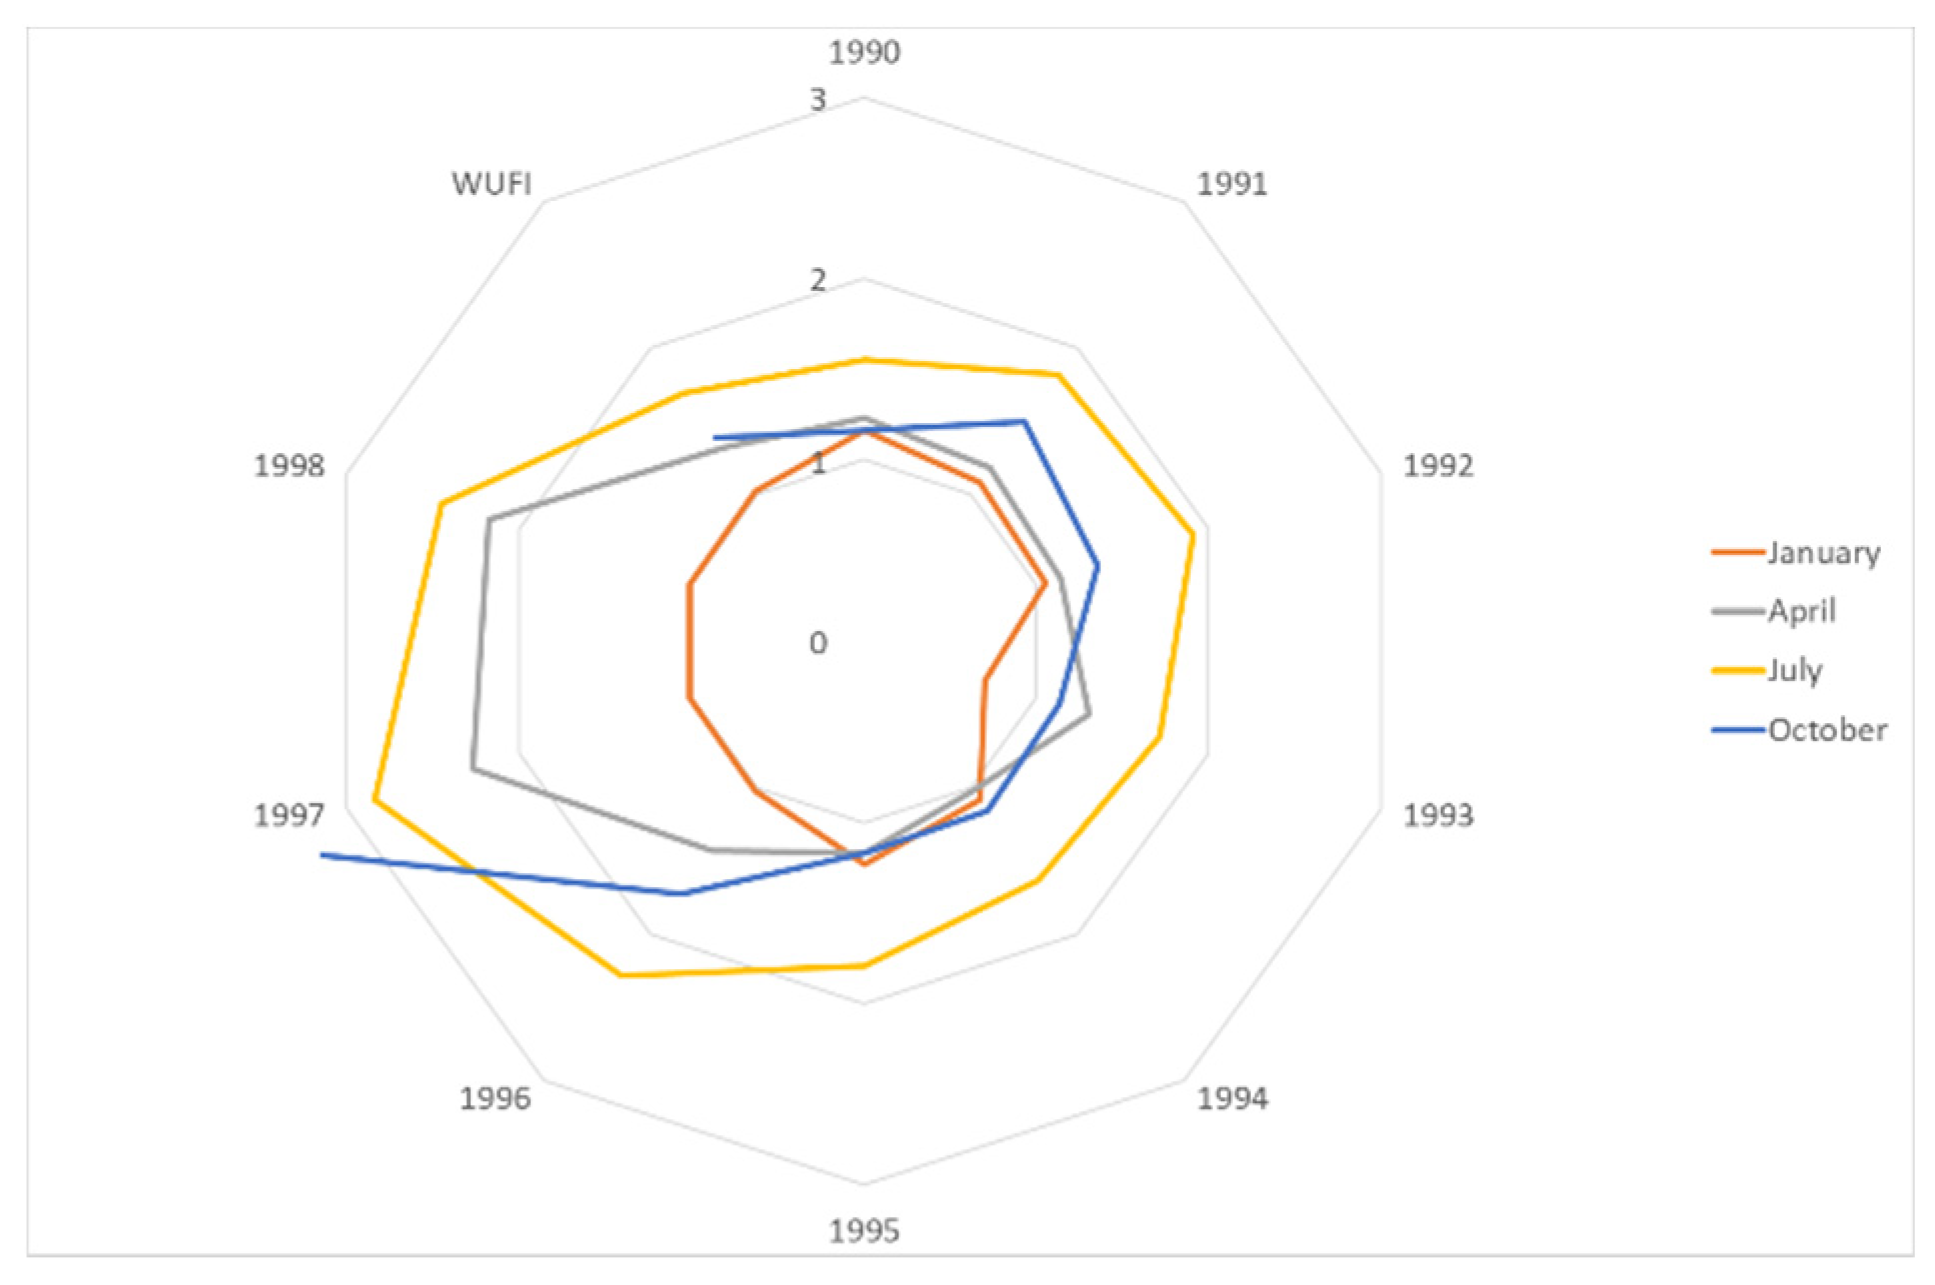
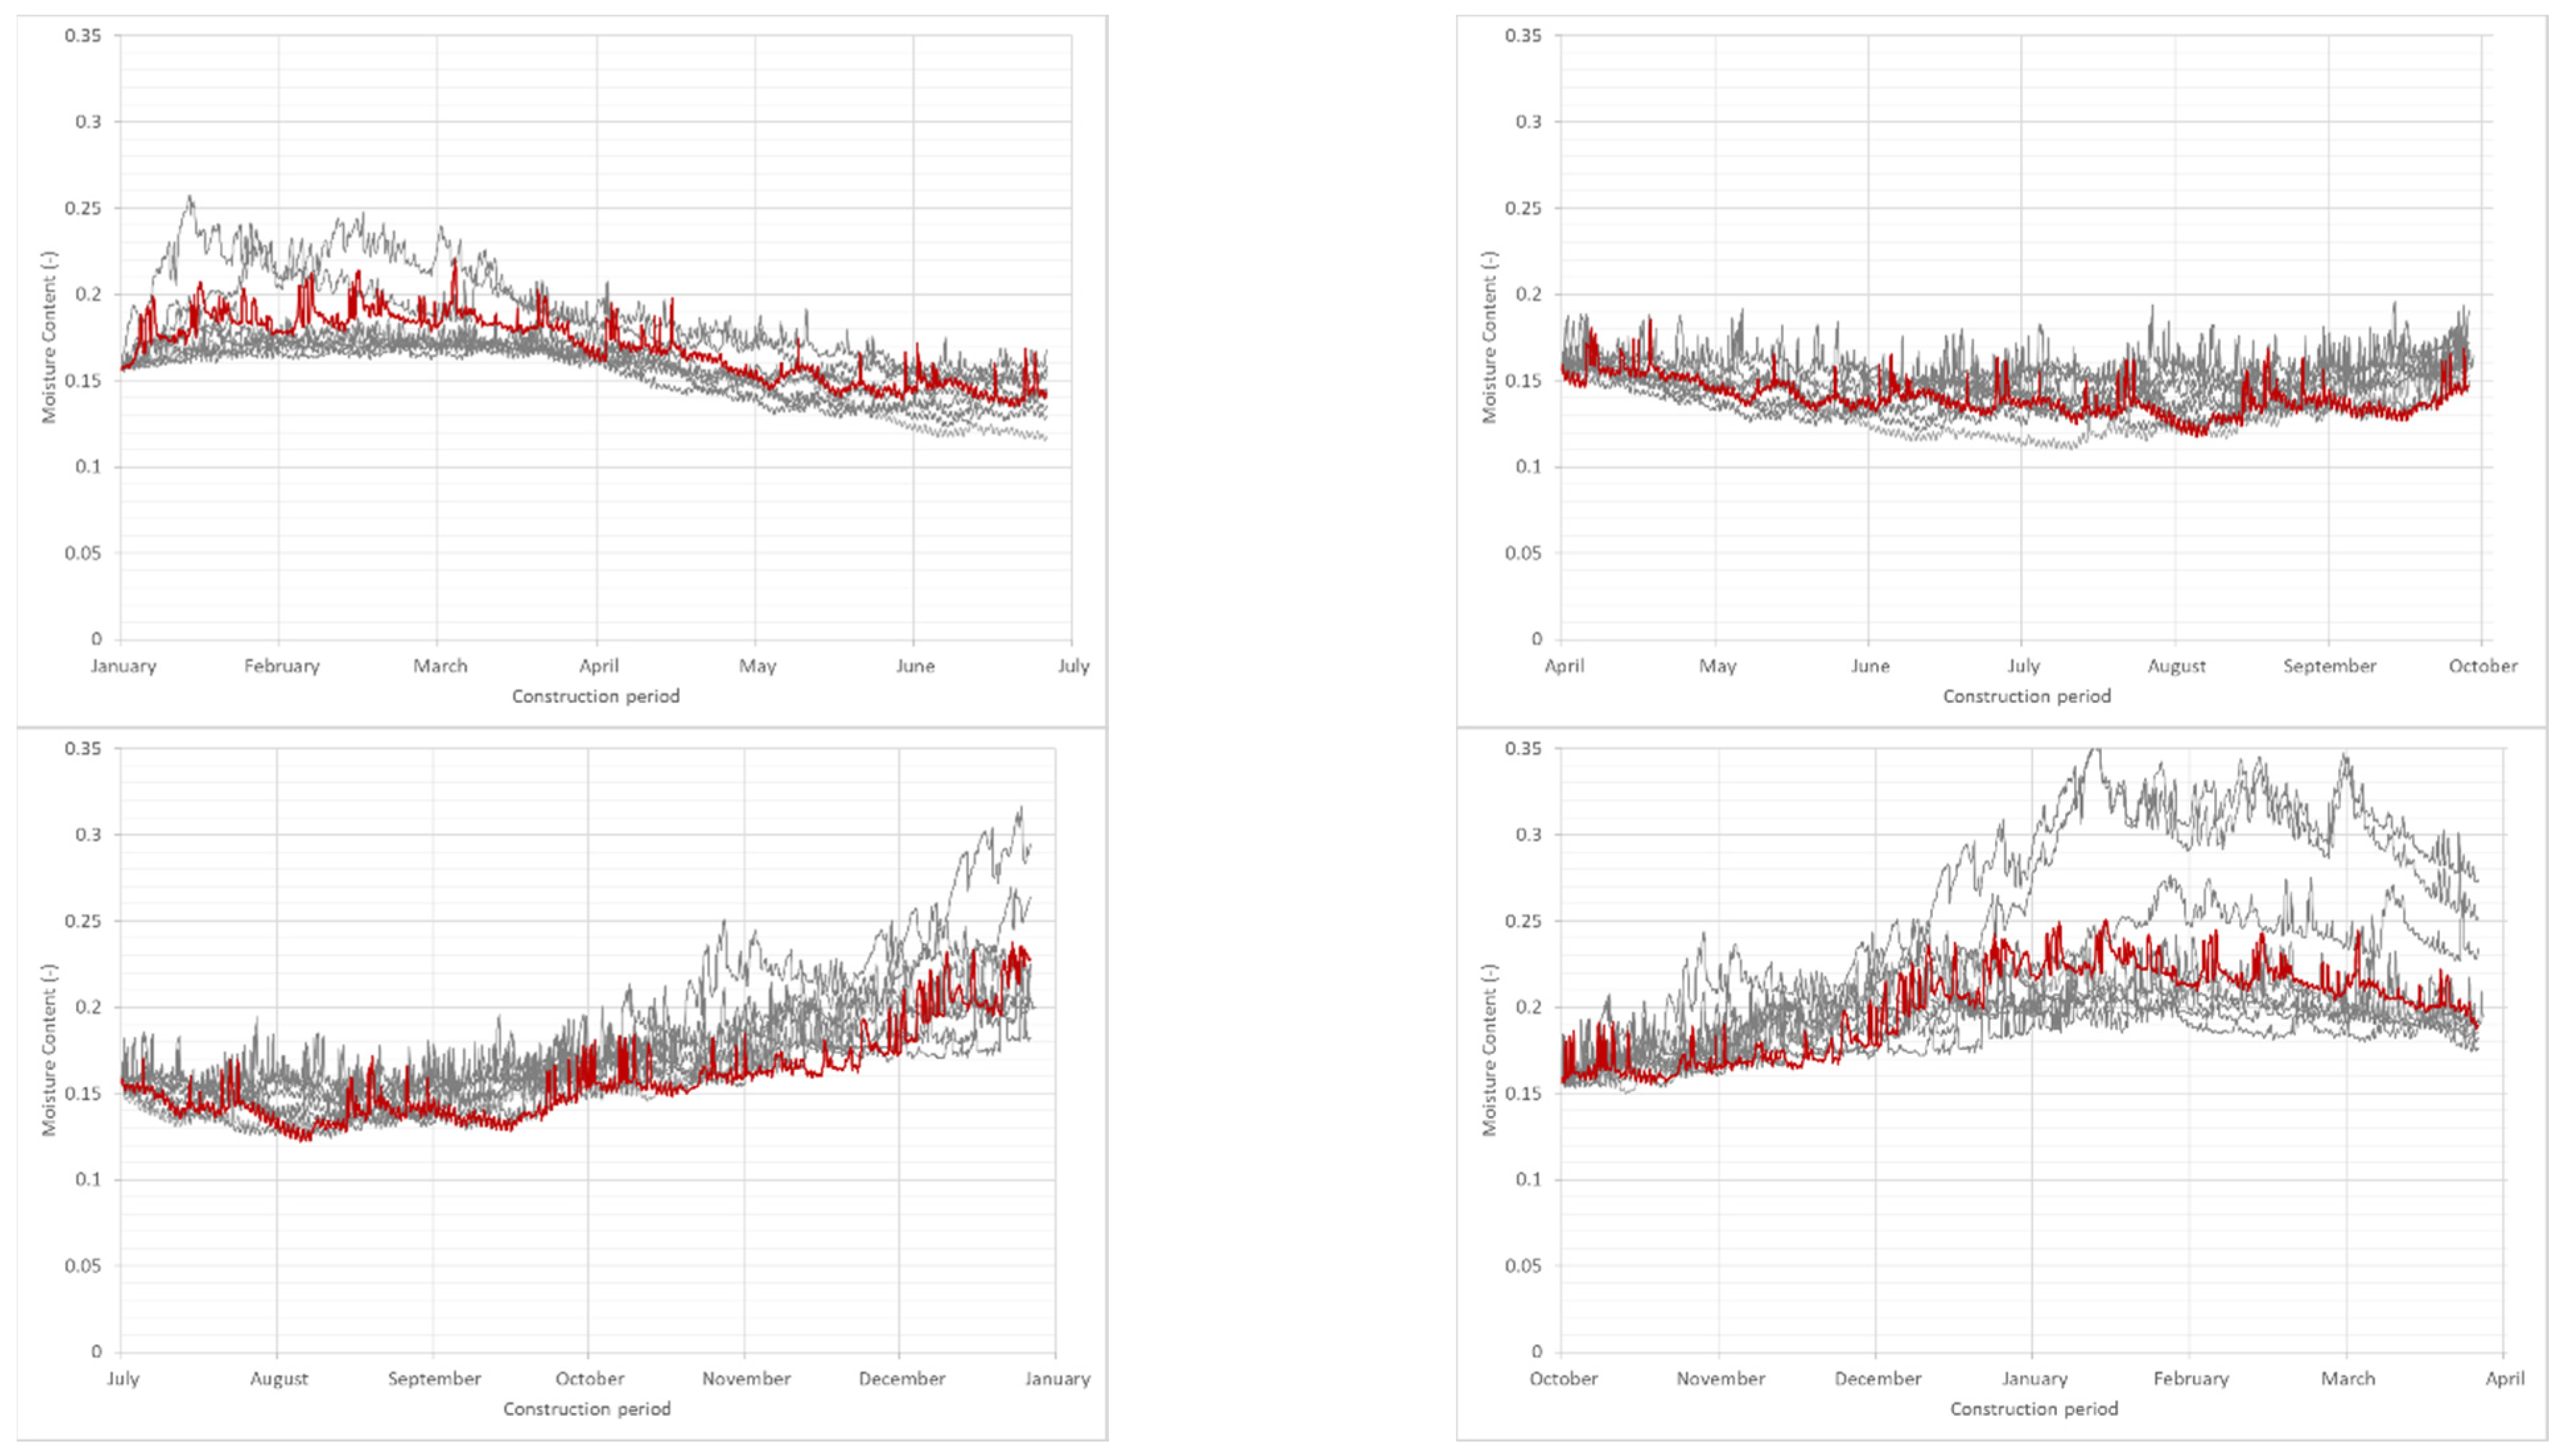
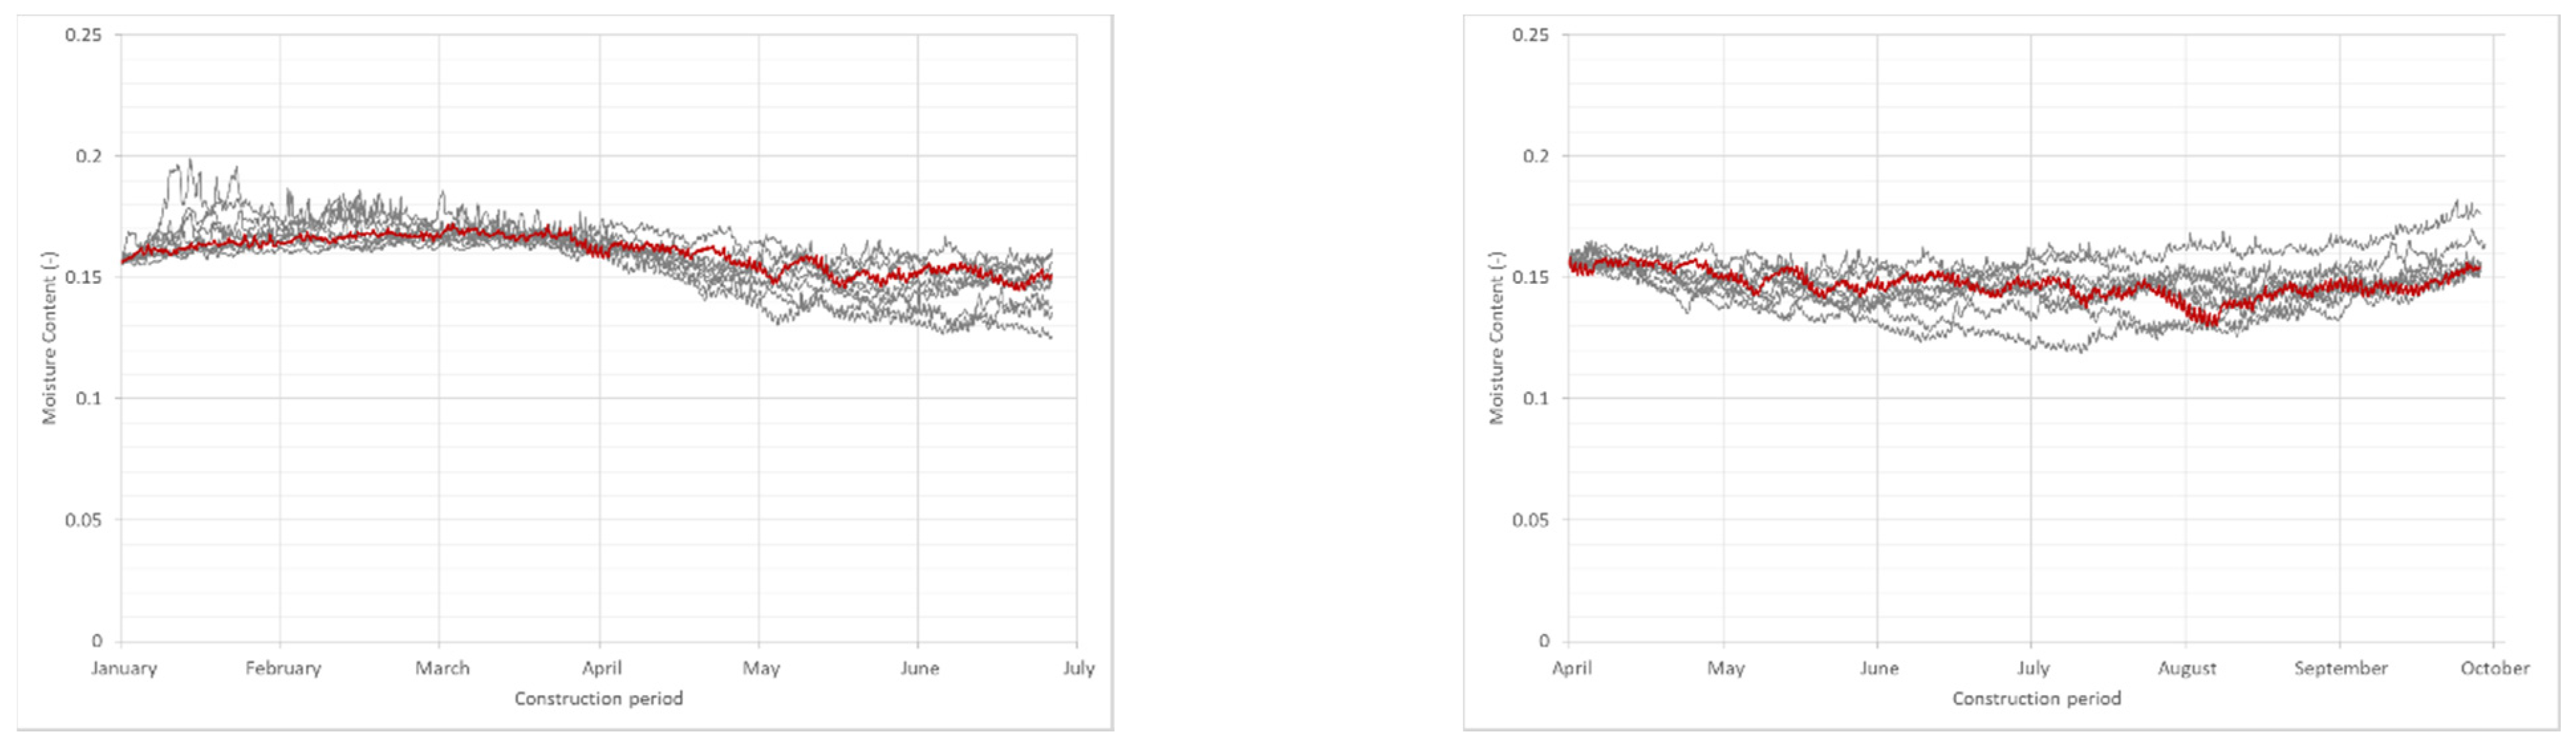
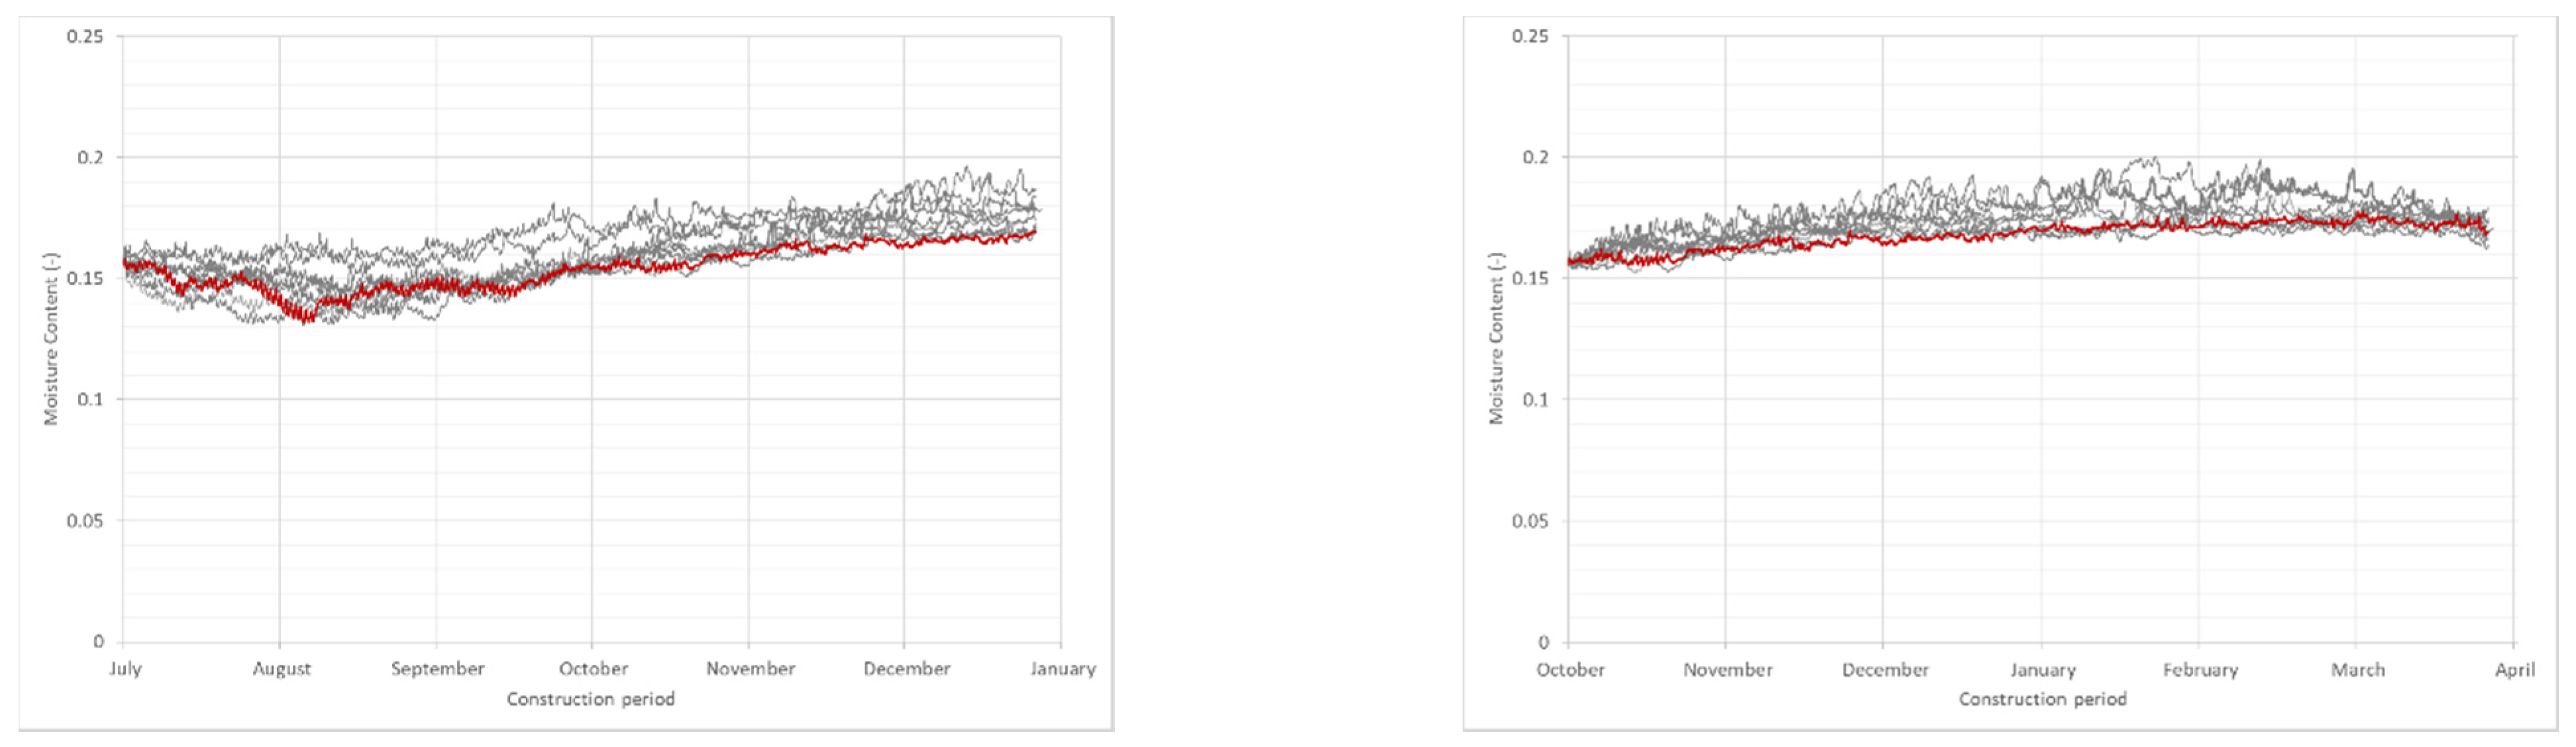
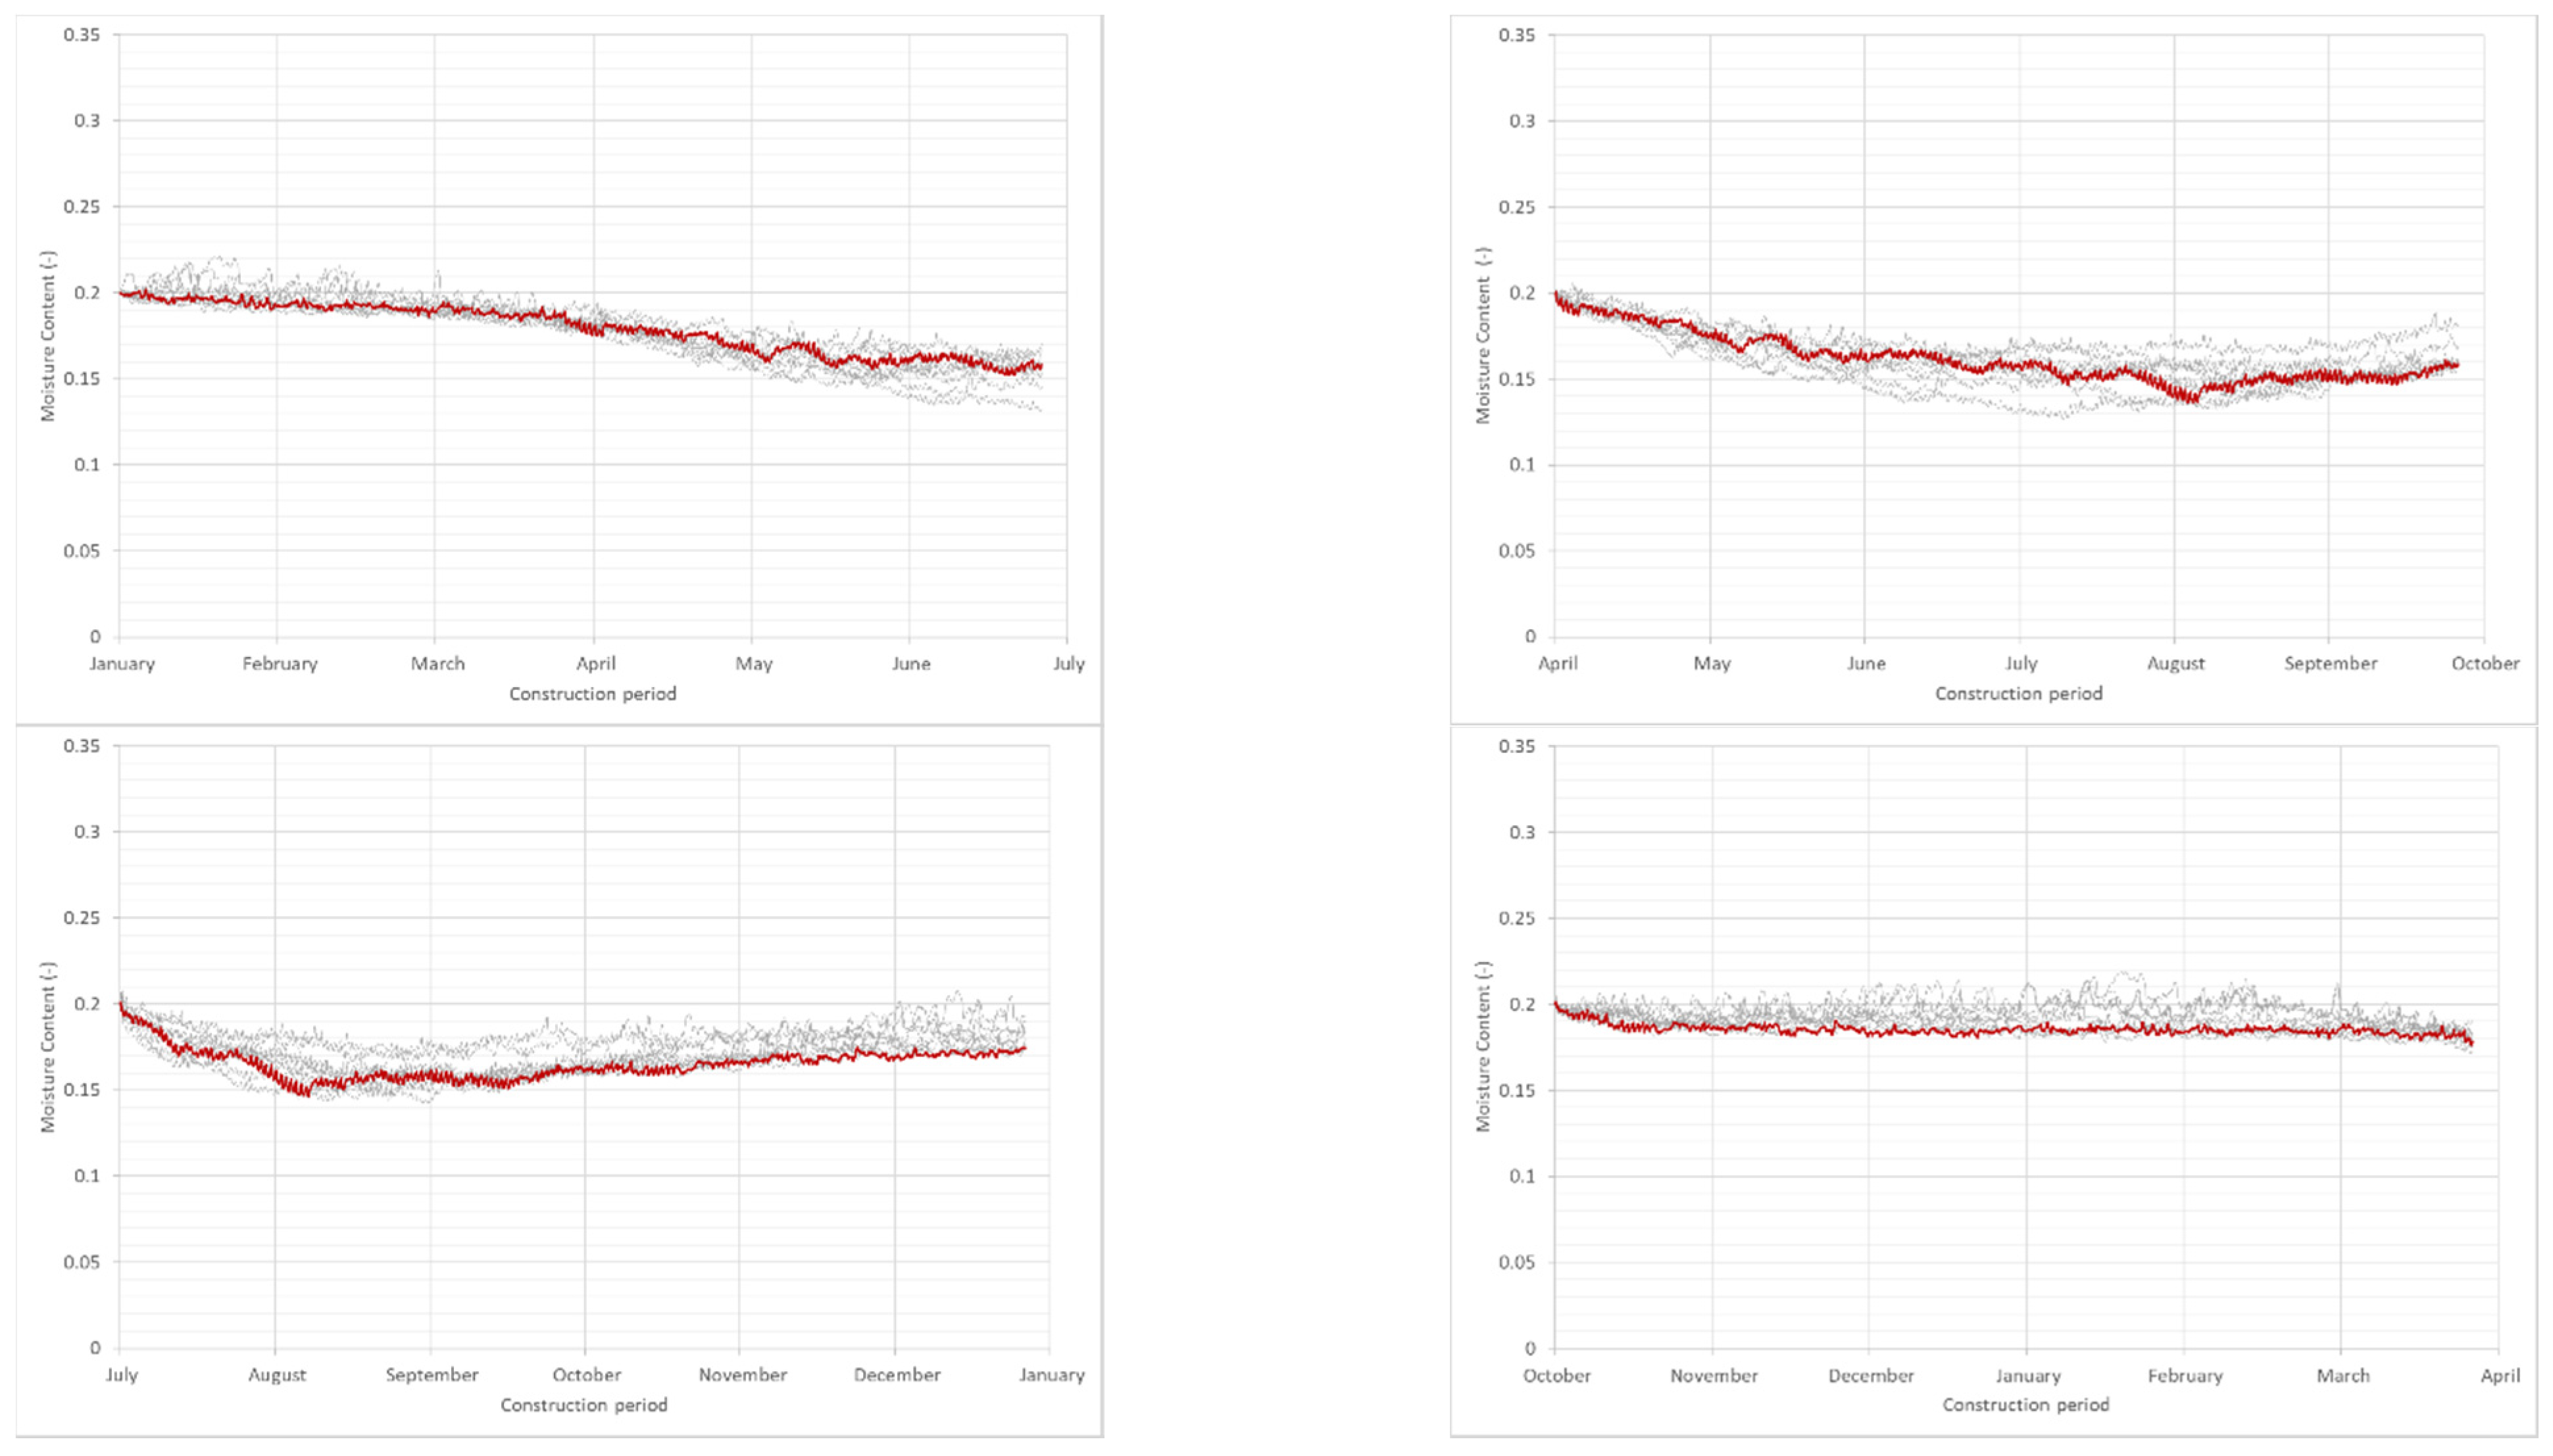
  • The variation in outcome is large due the relatively short duration of the construction period, where climate variations have great impact. This should be considered when evaluating results or reference cases from suppliers or literature. Average years clearly underestimate especially the mold growth potential and should be avoided. Also, climate change should be considered in evaluation.
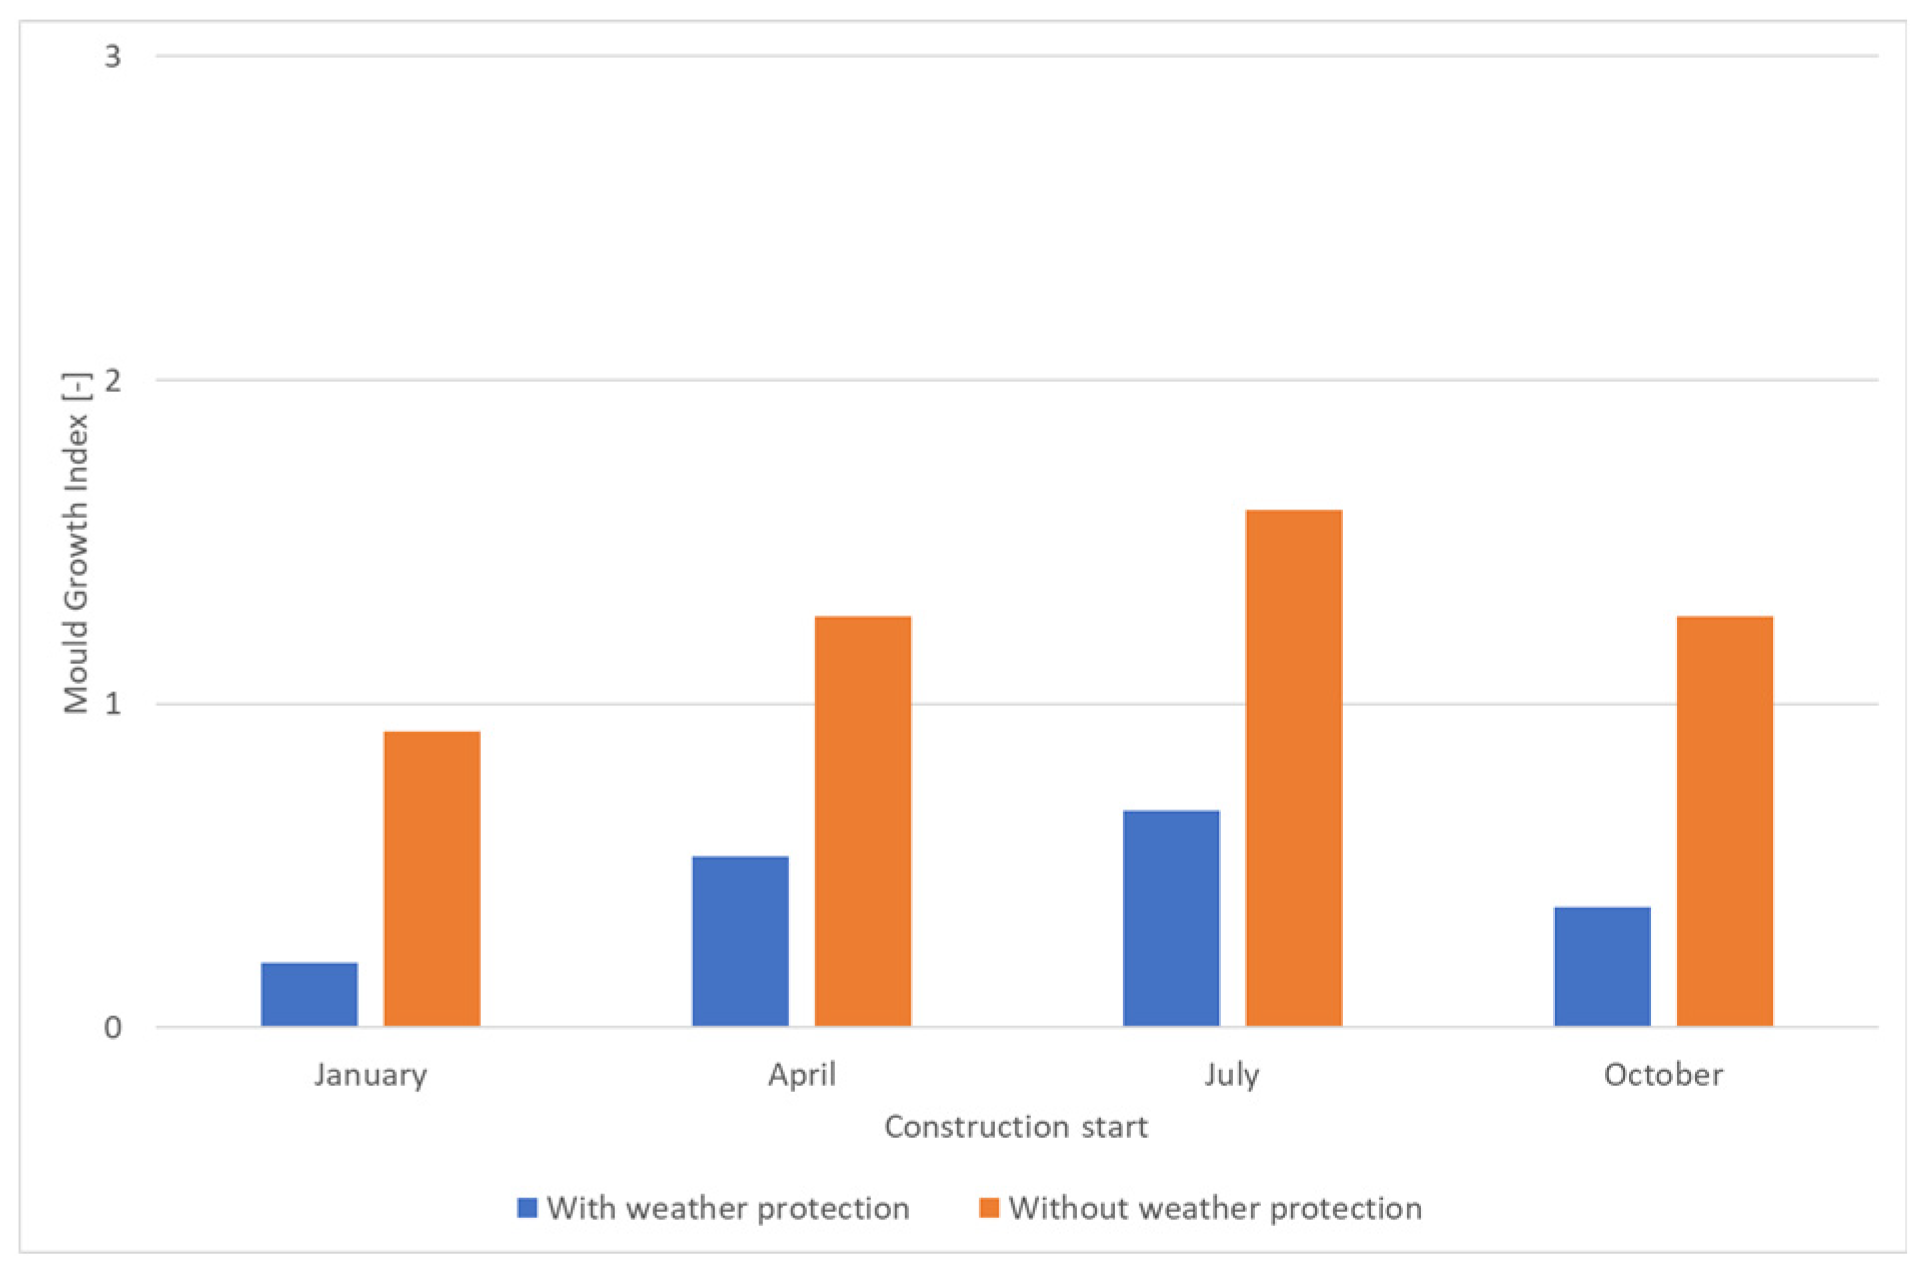
  • The season of construction has a significant effect on the set targets. For the chosen location, completing the building envelope in summer or early autumn is usually more favorable for meeting the targets, while winter construction is less favorable. The completion period is sometimes impossible to determine at the design stage.
  • A short construction period, i.e., short exposure to outdoor climate, is more favorable for meeting the target of mold growth.
  • Details should always be examined, as water trapping is identified as weak spot. All details should be qualitatively assessed.
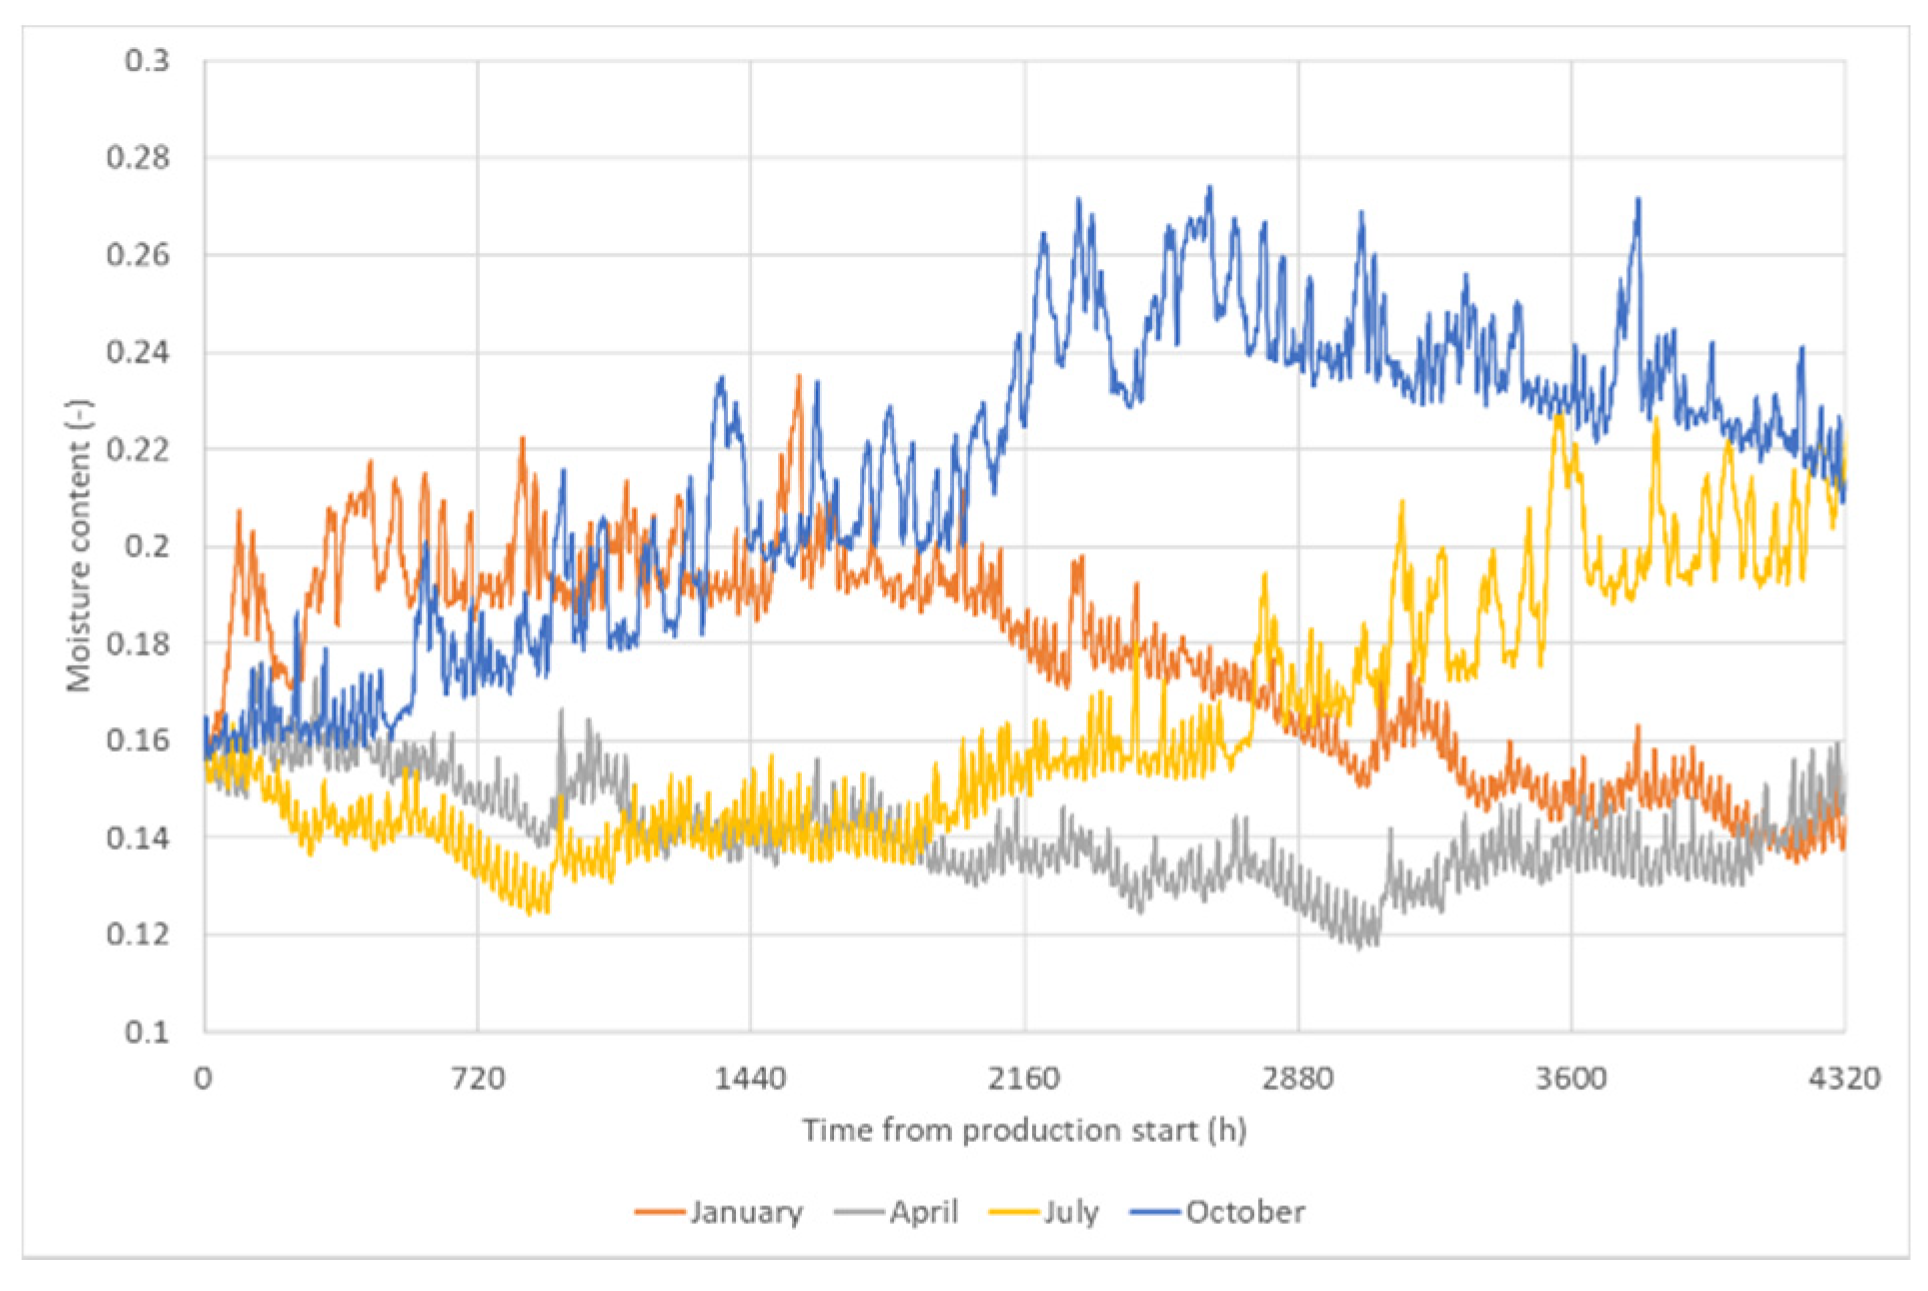
  • It is highly likely that the structure will be exposed to precipitation if not using weather protection. Protecting the construction from water will have a significant effect on the possibilities of meeting the targets. This is especially evident during the winter/spring period. For panels with a potential of water trapping, it is always important to protect from precipitation. Water trapping will result in exceeding the target of moisture content, and subsequently, also in exceeding the target of mold growth. For free surfaces, without trapping potential, the effect is smaller. However, the studied CLT structure provides several vulnerable details with respect to exposure and trapping, and thus, even if free surfaces are not damaged by the exposure during construction, the system is no stronger than its weakest details.
These conclusions are valid for the studied location and if conditions in Appendix A are fulfilled. In each construction project using the technical solution, verifying these conditions should also be addressed.
The assessment indicates the targets of the assessment are possible to reach, and thus implementation of the new technical solution is possible within the defined scope and with the defined prerequisites.
Project scope and project specific data should be required from the suppliers according to Appendix A before implementing in a construction project. If changes to the scope are made in a construction project, these should be evaluated by the assessment expert group. Suggestions on requirements to be in focus of projects are time schedule of construction phase and detailing.
The results of the study can be communicated to projects using Table 4 and Table 5 together with factors of influence in Appendix A.
A suggestion is to broaden the scope by further exploring the uncertainties in Appendix A. By using supplementary probabilistic simulations, such as studies of impact of different geographical locations and orientation of walls, further focus on future climate, protection strategies during transport, and construction as well as remedies, the applicability of the results can increase. Pilot projects should be documented concerning moisture safety during construction to further explore the uncertainties.

Tollgate 4

The evaluation reporting contains a summary of findings and recommendations based on the risk assessment. If the actual construction period cannot be predicted, it is recommended to use the least favorable period. As there are significant uncertainties in predicting mold growth, especially based on short periods of outdoor climate, it is recommended to sample at site.
From the evaluation, it is recommended to the management steering group to allow the identified scope using weather protection and prerequisites according to Appendix A to be used in construction projects. As there are remaining uncertainties and a lack of reference cases, it is also recommended to document projects according to Appendix A and to monitor onsite experiences regarding targets.

4. Experiences and Conclusions from Using the Framework

Throughout the process, experiences of applying the risk assessment framework were noted. For the first step in the framework, setting up the scope, the main concerns were to define and to find adequate detailing of the scope. By selecting a typical building relevant to the current market and creating clear targets, the strategies for the building could be well defined. By delimiting the scope, the resources for assessment could also be focused for cost-efficiency. However, a more specific case study narrows the applicability of the study and should be considered when defining the scope. For this reason, the tollgate 1 was perceived as useful, since consensus on scope and its limitations were created before engaging in more thorough assessment. It also enabled an estimation of resources needed for qualitative assessment.
For the qualitative assessment identifying risks and influencing factors with related uncertainties were in focus. An expert workshop with stakeholders was used as the main tool for risk identification, together with an information search in literature and suppliers’ information. Thorough preparations for the workshop and a careful selection of stakeholders/workshop participants covering all involved competencies were perceived as the basis of a fruitful workshop and a key to identifying risks. A potential for improving the results by repeating the workshop with an increased level of detail was suggested, as the scope was perceived as broad rather than defined. In this study, only one workshop was held, and thus, the detailed design was not fully explored. The risk identification and identification of factors and related uncertainties were appreciated; however, it was perceived by the experts as difficult to assess likelihood and consequences of failure for a new technical solution. A side effect of the expert workshop was an increase in knowledge and new insights for the participants, which were highly appreciated by participants. The qualitative assessment resulted in a clear recommendation in tollgate 2 on proceeding with a quantitative assessment. However, the task of adequately estimating the resources needed for the quantitative assessment was perceived as difficult.
The quantitative assessment aimed at quantifying the selected anticipated risks. As a starting point, several test simulations were performed to identify an adequate method for the analysis, as well as further determining resources needed. In the studied case, several uncertainties were identified in the detailing. Preparing material for tollgate 3, the quantitative assessment was finished on a sufficient level of detailing for decision making, but with a suggestion that possible further assessments to mitigate the limitations could be required to cover a broader scope. Also, a longer climate file could be used to get a better representation of variations in climate, and other locations could be studied. The decision regarding which level would be adequate was taken by the project manager of the assessment; however, this decision was also made in tollgate 3.
The reporting’s purpose is not only to summarize the work, but also to provide recommendations and a specification of requirements if implementation is suggested, or reasons for rejection. Visualizing the results using tables with traffic light colors was perceived as useful, both for the management decision in tollgate 4 and for the management’s communication of the decision. The importance of applying the design-build contractor’s perspective was identified, especially which verification of requirements should be requested if the solution was to be implemented in a construction project. In tollgate 4, the recommendations form the basis of a management decision to accept or reject. Here it was also noted that all documentation should be compiled and stored, preferably in a data base, for possible future use.
The use of tollgates has the potential for creating understanding between the design-build contractor and the risk assessment project manager concerning the adequate scope and available resources for the assessment. Using a set of questions to answer for each tollgate, the management could have a good understanding of the case in each tollgate. Through ongoing communication, the design-build contractor is also better prepared for the final step and possible implementation or rejection.
As the design-build contractor might lack in-house competence to perform the assessment of a suggested new technical solution, the framework including tollgates also serves as a tool to aid defining the assessment procedure as well as the adequate resources needed for an external assessment project manager.
Finally, the findings and experiences of using the framework was used in a SWOT analysis performed for the framework from the design-build contractor’s perspective (as illustrated in Table 6).
The chosen framework was successful in a design-build contractor context, structuring the process and identifying difficulties in achieving the functional requirements concerning moisture. Three success factors were found to be:
Documentation and communication. All steps should be carefully documented and filed for possible future use, while the communication material preferably uses clear visual elements.
Experts’ involvement. Engaging relevant experts with different perspectives in a structured workshop to identify factors of concern should be studied. As the solutions are new, a full identification of risk exploration is crucial.
Tollgates. Using tollgates to achieve a structured communication between the design-build contractor and the project manager of the assessment of the new technical solution to achieve an adequate assessment and communication of results.
Three prioritized suggestions for future work were found to be:
Other case study. Apply the risk assessment framework to a new technical solution of different characteristics to explore the potential of the framework in a different setting.
Tollgates. Further explore the tollgates establishing generic questions to be answered at the different stages. This would facilitate the process for the design-build contractor, and thus, potentially increase the use of the framework and reduce serial failures.
Reference cases. Develop an assessment of a reference case to define different levels of adequate documentation for reference cases to serve in qualitative assessment.

Author Contributions

Conceptualization, methodology, formal analysis, investigation, and writing were performed by C.S.T. Review and editing and supervision by C.-E.H. All authors have read and agreed to the published version of the manuscript.

Funding

The work is partly funded by SBUF, the Swedish Construction industry’s organization for research and development: grant number 13535.

Informed Consent Statement

Not applicable.

Data Availability Statement

Not applicable.

Acknowledgments

The authors thank the fieldworkers for their important role in data collection.

Conflicts of Interest

The authors declare no conflict of interest.

Appendix A. Factors of Influence

ParameterFactorsVariationUnknownIn Data
ConditionsMaterial propertyCritical moisture conditionsNatural variations of wood are known to be significant. Critical moisture condition not given by suppliers.Assumed to be equivalent to values of spruce in VTT-model.
TemperatureTemperature of surfaceVariations depending on outdoor temperature and protection strategy. Unknown effect of weather protection on climate.Field measurements used to estimate effect of weather protection.
Initial Moisture ContentMoisture content supplierMoisture content, from supplierAllowed variations are defined in standard. Initial moisture content set to average, 12% MC.
Moisture uptake between supplier and mountingOutdoor climate parametersVariations between locations and seasons. Variations between years. Use monthly average for actual location to predict moisture content at site. Normal year given in WUFI/real measured data from a series of years.
Duration, time from supplier to siteTime depending on supplier. A common spread between 1–4 weeks given suggested by supplier. Often not defined by contractor.Time between supplier and mounting is set to four weeks.
Material properties, CLT panelsNatural variations of wood are known to be significant.Material properties of product partly unknown. Often generic or homogenous material data given by supplier. Partly unknown effect of glue layers. Initial calculations show parameter has influence, indicating homogenous material data underestimate MC in outer layer. Deterministic generic data from WUFI “Spruce radial” used. Glue approximated from data from ETH to μ = 333 (d = 1 mm).
Protection strategies Protection strategies often not defined by contractor. Unknown effect of wrapping.Assuming protected from precipitation but exposed to outdoor humidity.
Moisture Uptake from Air HumidityOutdoor climateGeographical location, seasonVariations between locations, seasons, and years.Normal year typically lack extreme periods.For each location, climate in WUFI and real measured data from a series of years from LTH. Four seasons.
Indoor climateOnsite moisture production Moisture production at site usually unknown in amounts and time. Assume onsite moisture production is lower than air flow rates can handle.
Production: dehumidifiers, air flows, and heating The effect of dehumidifiers and heaters on site often unknown. Air flows on site not known to contractor.No dehumidifier or heating assumed. Assume air flow rate is high and the surrounding air temperature and humidity to be equivalent to outdoor conditions.
Duration of exposureTime scheduleConstruction time schedule perceived to have a common spread between 13 and 26 weeks, as suggested by suppliers. Delays may occur.Use two different time schedules, normal speed 26 weeks, fast 13 weeks.
Material propertiesMaterial properties, CLT panels, and designNatural variations of wood are known to be significant. Product properties partly unknown. Generic or homogenous material data given by supplier. Surfaces can be order treated. Surfaces might be soiled. Surfaces assumed planed, untreated, and clean. Other properties as above.
Moisture Uptake from PrecipitationOutdoor climateGeographical location and seasonAs aboveAs aboveAs above
Weather protectionEffect and duration of weather protectionRanges from no weather protection to full weather protection.The effect of full weather protection is not fully understood, e.g., degree of protection. The use of weather protection is decided by contractor. The weather protection provides 100% protection from precipitation. If used it is assumed to be operating from day 1 of mounting of structure to building envelope is sealed.
Water removalTime of water on surface Ranges from no water removal to a 24/7 call removal. Structure and inclination of surface varies with design, partly depending on workmanship. The use and the effect of reactive measures, runoff, and water trapping are partly unknown. The water removal remedies are decided by contractor.Water is assumed to be removed every hour from surfaces. Water is assumed to have the potential to runoff, except for specifically studied water trapping details.
Material propertiesMaterial properties, CLT panels, and designAs aboveThe effect of precipitation to surfaces is not fully known.
Other uncertainties as above.
Driving rain is assumed to be 0.1*rain*wind velocity, using most exposed direction. 30% of driving rain assumed to bounce off. Rain at floor is all horizontal rain. Other properties as above.

Appendix B. Results from Simulations

Figure A1. Moisture content in layers of wall panel. Four different seasons using WUFI normal year for Lund. (a) Moisture content in outer layer (0–20 mm of 120 mm). (b) Moisture content in second layer (20–50 mm of 120 mm). Dotted lines are simulations corresponding to weather protection.
Buildings 11 00247 g0a1
Figure A2. Moisture content in outer layer of wall panel for four different seasons (January, April, July, October). Lund. Structure exposed to rain. Grey lines different years (1990–1998); red line reference year in WUFI.
Buildings 11 00247 g0a2
Figure A3. Moisture content in outer layer of panel for four different seasons (January, April, July, October). Lund. Structure protected from rain and radiation corresponding to weather protection. Grey lines different years (1990–1998); red line reference year in WUFI.
Buildings 11 00247 g0a3aBuildings 11 00247 g0a3b
Figure A4. Cumulative distribution of moisture content in outer layer of panel during last month of construction phase for four different seasons (January, April, July, October). Lund. Structure exposed to rain. (a) Normal construction time (6 months). (b) Short construction time (3.5 months).
Buildings 11 00247 g0a4
Figure A5. Cumulative distribution for moisture content in outer layer of panel during last month of construction phase for four different seasons (January, April, July, October). Lund. Full weather protection. (a) Normal construction time (6 months). (b) Short construction time (3.5 months).
Buildings 11 00247 g0a5
Figure A6. Moisture content in layers of floor panel. Four different seasons using WUFI normal year for Lund. (a) Moisture content in outer layer (0–20 mm of 200 mm panel). (b) Moisture content in second layer (40–80 mm of 200 mm panel). After first week, floor is protected by overlying floors. Moisture content for cases of using a weather protection or not is converging as construction time proceed, as material slowly dries out. After six months, differences are usually in range of a few percent moisture content.
Buildings 11 00247 g0a6
Figure A7. Moisture content in outer layer of floor panel for four different seasons (January, April, July, October). Lund. Grey lines different years (1990–1998); red line reference year in WUFI. After first week, floor is protected by overlying floors.
Buildings 11 00247 g0a7
Figure A8. Cumulative distribution for moisture content in outer layer of floor panel during last month of construction phase for all year and four different seasons (January, April, July, October). Lund. After first week, floor is protected by overlying floors. (a) Normal construction time (6 months). (b) Short construction time (3.5 months).
Buildings 11 00247 g0a8
Figure A9. Moisture content in outer layer of floor panel (0–20 mm of 200 mm panel). Four different seasons using WUFI normal year for Lund. Structure exposed to precipitation.
Buildings 11 00247 g0a9
Figure A10. Moisture content in outer layer of panel facing mineral wool in interior wall. Four different seasons (January, April, July, October). Lund. WUFI climate is used.
Buildings 11 00247 g0a10

References

  1. Bröchner, J. Innovation in Construction. In The Handbook of Innovation and Services: A Multi-Disciplinary Perspective; Gallouj, F., Djellal, F., Eds.; Edward Elgar: Cheltenham, UK, 2010; pp. 743–767. [Google Scholar]
  2. Svensson Tengberg, C.; Hagentoft, C.-E. Introducing New Technical Solutions in the Swedish Construction Industry—Interviews with Key Actors. In Proceedings of the ASHRAE Thermal Performance of the Exterior Envelopes of Whole Buildings XIV International Conference, Clearwater, FL, USA, 9–12 December 2019; ASHRAE: Atlanta, GA, USA, 2019; pp. 810–817. [Google Scholar]
  3. Svensson, C. Evaluation of actions taken to eliminate mould problems in houses with crawl-space. In Proceedings of the 5th Nordic Symposium on Building Physics in the Nordic Countries, Göteborg, Sweden, 24–26 August 1999; ISBN 91-71-97-795-3. [Google Scholar]
  4. Samuelson, I.; Jansson, A. Putsade Regelväggar. SP Rapport 2009:16 (External Thermal Insulation Composite System Walls); SBUF/SP Technical Research Institute of Sweden: Borås, Sweden, 2009; ISBN 978-91-86319-00-7. [Google Scholar]
  5. Hansen, K.; Bunch-Nielsen, T.; Grelk, B.; Rode, C. Magnesium-oxide boards cause moisture damage inside facades in new Danish buildings. In International RILEM Conference on Materials, Systems and Structures in Civil Engineering 2016: Segment on Moisture in Materials and Structures; Technical University of Denmark: Kgs Lyngby, Denmark, 2016; pp. 151–161. [Google Scholar]
  6. Boverket. Kartläggning av fel, brister och skador inom byggsektorn. Rapport 2018:36 (Survey on faults, defects and damage in the building sector); The Swedish National Board of Housing, Building and Planning: Karlskrona, Sweden, 2018; ISBN 978-91-7563-612-2.
  7. Högsta Domstolen (The Supreme Court). Case Number T916-13; Högsta Domstolen: Stockholm, Sweden, 2015. [Google Scholar]
  8. Ulrich, K.T.; Eppinger, S.D. Product Design and Development, 5th ed.; McGraw-Hill/Irwin: New York, NY, USA, 2011. [Google Scholar]
  9. ISO 31000:2018. Risk Management—Guidelines; ISO 31000:2018, IDT; International Organization for Standardization: Geneva, Switzerland, 2018. [Google Scholar]
  10. Project Management Institute. Guide to the Project Management Body of Knowledge; Project Management Institute, Inc.: Newtown Square, PA, USA, 2017. [Google Scholar]
  11. Siraj, N.B.; Fayek, A.R. Risk Identification and Common Risks in Construction: Literature Review and Content Analysis. J. Constr. Eng. Manag. 2019, 145, 03119004. [Google Scholar] [CrossRef]
  12. Svensson Tengberg, C.; Hagentoft, C.-E. Relying on reference cases when evaluating new technical solutions? Evaluation of technical documentation in a case. In Proceedings of the 12th Nordic Symposium on Building Physics (NSB 2020) E3S Web Conf., Tallinn, Estonia, 7–9 September 2020; Volume 172. [Google Scholar] [CrossRef]
  13. ISO13823. General Principles on the Design of Structures for Durability; International Organization for Standardization: Geneva, Switzerland, 2008. [Google Scholar]
  14. Lacasse, M.A.; Ge, H.; Hegel, M.; Jutras, R.; Laouadi, A.; Sturgeon, G.; Wells, J. Guideline on Design for Durability of Building Envelopes; National Research Council Canada: Ottawa, ON, Canada, 2018. [CrossRef]
  15. Gradeci, K.; Berardi, U. Application of probabilistic approaches to the performance evaluation of building envelopes to withstand mould growth. J. Build. Phys. 2019, 43, 187–207. [Google Scholar] [CrossRef]
  16. De Place Hansen, E.J.; Møller, E.B.; Ørsager, M. Guidelines for internal Insulation of historic Buildings. E3S Web Conf. 2020, 172, 01004. [Google Scholar] [CrossRef]
  17. Tietze, A.; Ott, S.; Boulet, S.; Gradeci, K.; Labonnote, N.; Grynning, S.; Noreen, J.; Pousette, A. TallFacades Identification of Cost-Effective and Resilient Envelopes for Wood Constructions; Technical University Munich: Munich, Germany, 2017. [Google Scholar]
  18. Boudreaux, P.; Pallin, S.; Accawi, G.; DesJarlais, A.; Jackson, R.; Senecal, D. A rule-based expert system applied to moisture durability of building envelopes. J. Build. Phys. 2018, 42, 416–437. [Google Scholar] [CrossRef]
  19. Mjörnell, K.; Arfvidsson, J.; Sikander, E. A Method for Including Moisture Safety in the Building Process. Indoor Built Environ. 2012, 21, 583–594. [Google Scholar] [CrossRef]
  20. Sasic Kalagasidis, A.; Rode, C. Annex 55 RAP-RETRO. Framework for Probabilistic Assessment of Performance of Retrofitted Building Envelopes; Department of Civil and Environmental Engineering, Chalmers University of Technology: Göteborg, Sweden, 2015; ISSN 1652-9162. [Google Scholar]
  21. Bednar, T.; Hagentoft, C.-E. IEA Annex 55 Reliability of Energy Efficient Building Retrofitting—Probability Assessment of Performance and Cost (RAP-RETRO); Risk Management by Probabilistic Assessment. Development of Guidelines for Practice; Chalmers University of Technology: Gothenburg, Sweden, 2015. [Google Scholar]
  22. Olsson, L. Fuktsäkerhet vid KL-Träbyggande utan Väderskydd (SBUF 13548); RISE/SBUF: Stockholm, Sweden, 2019. [Google Scholar]
  23. Boverket. Boverket’s Mandatory Provisions and General Recommendations; BFS 2011:6 with Amendments up to BFS 2018:4; Boverket: Karlskrona, Sweden, 2018. [Google Scholar]
  24. SvenskByggtjänst. AMA (Guidance for the Preparation of Particular Conditions for Building and Civil Engineering Works and Building Services Contracts); Svensk Byggtjänst: Stockholm, Sweden, 2018. [Google Scholar]
  25. SCB. Statistical Database. From Dwellings in Newly Constructed Conventional Multi-Dwelling Buildings by Number of Storeys in the Building 2007–2017. Available online: http://www.statistikdatabasen.scb.se/pxweb/en/ssd/ (accessed on 10 October 2019).
  26. Brycke, E.; Martinsson, L. Väderskydd. En lathund för Entreprenören; The Construction Industry’s Organisation for Research and Development SBUF: Stockholm, Sweden, 2018. (In Swedish) [Google Scholar]
  27. McClung, R.; Ge, H.; Straube, J.; Wang, J. Hygrothermal performance of cross-laminated timber wall assemblies with built-in moisture: Field measurements and simulations. Build. Environ. 2014, 71, 95–110. [Google Scholar] [CrossRef]
  28. Wang, J. Wetting and drying performance of wood-based assemblies related to on-site moisture management. In Proceedings of the World conference on Timber Engineering, Austria, Vienna, 22–25 August 2016. [Google Scholar]
  29. Mustapha, G.; Khondoker, K.; Higgins, J. Moisture Performance and Vertical Movement Monitoring of Pre-Fabricated Cross Laminate Timber—Featured Case Study: Ubc Tallwood House. In Proceedings of the CCBST 15th Canadian Confererence on Building Science and Technology, Vancouver, BC, Canada, 6–8 November 2017; p. 88. [Google Scholar]
  30. Kordziel, S.; Pei, S.; Glass, S.V.; Zelinka, S.; Tabares-Velasco, P.C. Structure Moisture Monitoring of an 8-Story Mass Timber Building in the Pacific Northwest. J. Arch. Eng. 2019, 25, 04019019. [Google Scholar] [CrossRef]
  31. Schmidt, E.; Riggio, M. Monitoring Moisture Performance of Cross-Laminated Timber Building Elements during Construction. Buildings 2019, 9, 144. [Google Scholar] [CrossRef] [Green Version]
  32. Austigard, M.S.; Mattsson, J. Fungal damages in Norwegian massive timber elements—A case study. Wood Mater. Sci. Eng. 2020, 15, 326–334. [Google Scholar] [CrossRef]
  33. Svenskt Trä. KL-Trähandboken. Fakta och Projektering av KL-Träkonstruktioner (CLT Hand Book); Svenskt Trä: Stockholm, Sweden, 2017. [Google Scholar]
  34. Karacabeyli, E.; Douglas, B. Hand Book cross Laminated Timber; US Edition; FP Innovations: Point-Claire, QC, Canada, 2013. [Google Scholar]
  35. Svensson Tengberg, C.; Hagentoft, C.-E. Implementing a Framework for Qualitative Assessment of New Technical Solutions: A Case Study on CLT. In Proceedings of the XV International Conference on Durability of Building Materials and Components DBMC 2020, Barcelona, Spain, 30 June–3 July 2020. [Google Scholar]
  36. Fraunhofer IBP. WUFI, WUFI Pro 5 Manual. 2020. Available online: https://wufi.de/en/ (accessed on 20 May 2020).
  37. Viitanen, H.; Paajanen, L.; Iitti, H.; Ojanen, T.; Peuhkuri, R.; Vinha, J.; Lähdesmäki, K.; Salminen, K.; Strander, T. Development of an improved model for mould growth: Modelling. In Proceedings of the 8th Symposium of Building Physics in the Nordic Countries NSB 2008, Copenhagen, Denmark, 16–18 June 2008; pp. 927–934. [Google Scholar]
  38. Viitanen, H.; Ritschkoff, A.-C. Mould Growth in Pine and Spruce Sapwood in Relation to Air Humidity and Temperature; Sveriges Lantbruksuniversitet: Uppsala, Sweden, 1991. [Google Scholar]
  39. Viitanen, H.; Krus, M.; Ojanen, T.; Eitner, V.; Zirkelbach, D. Mold Risk Classification Based on Comparative Evaluation of Two Established Growth Models. Energy Procedia 2015, 78, 1425–1430. [Google Scholar] [CrossRef]
  40. Lepage, R.T.M. Moisture Response of Wall Assemblies of Cross—Laminated Timber Construction in Cold Canadian Climates. Master’s Thesis, University of Waterloo, Waterloo, ON, Canada, 2012. [Google Scholar]
  41. Öberg, J.; Wiege, E. Moisture Risks with CLT-Panels Subjected to Outdoor Climate during Construction-Focus on Mould and Wetting Processes; KTH: Stockholm, Sweden, 2018. [Google Scholar]
  42. Yoo, J.; Chang, S.J.; Lee, J.; Wi, S.; Kim, S. Numerical analysis of hygrothermal properties and behavior of Korean based cross-laminated timber (CLT) wall system to deduce optimal assemblies. J. Clean. Prod. 2019, 213, 1217–1227. [Google Scholar] [CrossRef]
  43. Vereecken, E.; Roels, S. Review of Mould Prediction Models and Their Influence on Mould Risk Evaluation. Build. Environ. 2012, 51, 296–310. [Google Scholar] [CrossRef] [Green Version]
  44. Gradeci, K.; Labonnote, N.; Köhler, J.; Time, B. Mould Models Applicable to Wood-Based Materials—A Generic Framework. Energy Procedia 2017, 132, 177–182. [Google Scholar] [CrossRef]
  45. Nik, V.M. Climate Simulation of an Attic Using Future Weather Data Sets—Statistical Methods for Data Processing and Analysis; Chalmers University of Technology: Gothenburg, Sweden, 2010. [Google Scholar]
  46. Nik, V.M. Hygrothermal Simulations of Buildings Concerning Uncertainties of the Future Climate; Chalmers University of Technology: Gothenburg, Sweden, 2012. [Google Scholar]
  47. Fuktcentrum, Lund 1990–1998. Available online: https://www.fuktcentrum.lth.se/verktyg-och-hjaelpmedel/klimatdatafiler-foer-fyra-svenska-staeder/ (accessed on 20 May 2020).
  48. Häglund, M.; Isaksson, T.; Thelandersson, S. Onset of mould growth—The effect of climate variability and different geographic locations. In Proceedings of the 41st Annual Meeting of the International Research Group on Wood Protection, Biarritz, France, 9–13 May 2010; p. 9. [Google Scholar]
  49. Bolmsvik, Å.; Svensson Tengberg, C. Hygrothermal conditions and mould growth potential in a weather protection. ICBP 2021 2021. submitted. [Google Scholar]
  50. Kordziel, S.; Glass, S.V.; Pei, S.; Zelinka, S.L.; Tabares-Velasco, P.C. Moisture monitoring and modeling of mass timber building systems. In Proceedings of the WCTE 2018—World Conference on Timber Engineering, Seoul, Korea, 20–23 August 2018; Korean Institute of Forest Science: Seoul, Korea, 2018. [Google Scholar]
Figure 1. Workflow, adapted from IEA Annex 55 [21]. Steps in framework can be iterated as work proceeds. Suggested toll gates are 0: decision to initiate assessment; 1: decision to accept scope; 2: decision to proceed with assessment; 3: decision to proceed with assessment, and 4: decision to proceed to implementation. Each tollgate corresponds to a steering group decision to proceed, revise, or to not proceed.
Buildings 11 00247 g001
Figure 2. (a) Principal design of CLT structure in studied building. Bottom floor is a concrete slab; exterior and interior walls and intermediate floors are CLT panels with external insulation and ventilated façade. (b) Studied wall and floor panels; wall panel with a thickness of 120 mm, individual layers are 20–30–20–30–20 mm. Single panel is used in exterior walls, and double panels (2 × 120 mm) with 110 mm insulation between are used in apartment separating walls. Floor panel with a thickness of 200 mm; individual layers are 40 mm each.
Buildings 11 00247 g002
Figure 3. Overview of qualitative analysis using structure of Ishikawa graph. Influencing factors for the case: “not to exceed critical moisture conditions during construction” Reprinted from [35].
Buildings 11 00247 g003
Figure 4. Identified critical design and detailing. Structural level: 1. Intermediate floor, upper side, 2. Exterior wall, exterior. Detailing level: 3. Exterior wall to base connection, 4. Inside of exterior wall to floor connection, 5. Apartment separating wall. 6. Shafts.
Buildings 11 00247 g004
Figure 5. Illustration of correlations between factors of influence. Corresponding variations, uncertainties, and properties are listed in Appendix A.
Buildings 11 00247 g005
Figure 6. Maximum mold growth index during period (using the VTT-model) of a CLT panel for construction start during four different seasons (starting January, April, July, October). No consideration to precipitation, wind, or radiation. Lund. Based on weather data from 1990–1998 [47]. (a) Exposure time 6 months. (b) Exposure time 3.5 months. Circles not closed as no data for 1999 was used.
Buildings 11 00247 g006
Figure 7. Expected precipitation. Lund. (a) Probabilities of precipitation (> 0 mm, 10 mm, 30 mm) for 7 and 10 days, respectively, and average horizontal precipitation for 7 days, 10 days, and monthly average value. (b) Probabilities of driving rain exceeding 10 mm for 7 and 10 days, respectively. Average driving rain for 7 days, 10 days, and monthly average value. Wall is perpendicular to the prevailing driving rain direction. Based on weather data from 1990–1998 [47].
Buildings 11 00247 g007
Figure 8. Maximum mold growth (according to the VTT model) of wall panel for four different seasons (January, April, July, October) with and without weather protection. Lund. Reference year in WUFI.
Buildings 11 00247 g008
Figure 9. Maximum mold growth index (using the VTT model) of wall panel for four different seasons (January, April, July, October). Weather protection. Lund. (a) Normal construction time (6 months). (b) Fast production speed (3.5 months). Circles not closed as no data for 1999 was used.
Buildings 11 00247 g009
Figure 10. Maximum mold growth (according to the VTT-model) from leakage for four different seasons (January, April, July, October). Lund. Circles not closed as no data for 1999 was used.
Buildings 11 00247 g010
Table 1. Typical time schedule for construction phase of a six-story multifamily dwelling. Estimations on transport/storage based on discussions with a supplier of CLT-products (Martinsons in March 2020); all other estimations based on [22,26].
ShortLongSpanApplication
Transport/Storage1 w4 w1–4 wMaterial, offsite
Mounting/Floors1 w by 6 fl = 6 w1.5 w by 6 fl = 9 w6–9 wAll surfaces
Mounting/Roof2 w4 w2–4 wAll surfaces
Facades6 w13 w6–12 wOuter surfaces
Total time15 w30 w15–30 w
Table 2. Climate data. Overview of yearly averages for three different locations. T=Temperature and RH=Relative Humidity 1 Yearly average values calculated data 1990–1998 [45,46] 2 Yearly average values 1990–1998 [47] 3 “Normal year” WUFI/LTH.
T
(°C)
RH
(%)
Global Radiation
(kWh/m2/y)
Diffuse Radiation
(kWh/m2/y)
Longwave Radiation
(W/m2)
Rainfall
(mm/y)
Wind Direct
(Degree)
Windspeed
(m/s)
Göteborg 16.383.5961534301.78831953.1
Göteborg 38.874 1074 3.0
Stockholm 27.176.9945462305.95601883.0
Stockholm 36.379 639 3.1
Lund 28.481.1988522304.86381953.2
Lund 39.281 818 3.5
Table 3. Horizontal precipitation and driving rain. Yearly mean value and standard deviation for precipitation in Lund. Depending on the time of year, amounts vary. (Based on SS-EN ISO 15927-3:2009).
Precipitation onEach FloorEach FloorRoofExterior Wall
Time period7 days10 days30 days90 days
(mm)(mm)(mm)(mm)
Lund. Horizontal mean *12.317.552.5155.8
Lund. Horizontal std deviation12.815.929.654.5
Lund. Driving rain mean **2.23.19.4 ***27.8
Lund. Driving rain std deviation3.13.98.0 ***16.8
* On a horizontal surface ** On a vertical surface in predominant wind direction *** Not relevant for roof.
Table 4. Summary of assessment concerning moisture target for structure exposed respectively protected by weather protection. Color assessment of risk related to moisture target, as defined in Section 3.1. Scope (green = low, yellow = medium, orange = high, red = very high).
Normal Construction TimeShort Construction Time
StartJanAprilJulyOctJanAprilJulyOct
Exposed summary
Exterior wall
Intermediate floor
Shafts/leakages
Water trapping
Protected summary
Exterior wall
Intermediate floor
Table 5. Summary of assessment concerning mold target for structure exposed respectively protected by weather protection. Colors: assessment risk related to mold target defined in Section 3.1. Scope (green = low, yellow = medium, orange = high, red = very high).
Normal Construction TimeShort Construction Time
StartJanAprilJulyOctJanAprilJulyOct
Exposed summary
Exterior wall *
Intermediate floor
Shafts/leakages
Water trapping
Protected summary
Exterior wall
Intermediate floor
* Values estimated as VTT model are not applicable to exposed conditions.
Table 6. SWOT analysis for framework from design-build contractor’s perspective.
Strengths:
  • An explicit framework with well-defined tollgates facilitates an adequate evaluation.
  • Tollgates with management decision enable involvement and a structured communication and focus on design-build contractor perspective, including definition of scope and adequate level of evaluation.
  • The expert workshop set up for risk identification has the potential of reducing unknown risks, and there is a possibility of repeating expert workshops to increase the level of detailing.
  • Adequate assessment is facilitated by lifting issues from project level, enabling allocation of time, resources, and competence.
  • Potential of further elaboration of tollgates to support design-build contractor’s involvement and perspective.
Weaknesses:
Aspects on how to choose the solutions to be evaluated based on market potential and anticipated benefits are not explicit.Only moisture issues addressed in this case study.The results are on company level and must be adequately interpreted when implemented in a building project.
Opportunities:
  • Cost for failures due to introduction of new technical solutions are expected to be reduced with adequate evaluation.
  • Well-documented evaluation has the potential of being reused and updated if new knowledge becomes available.
  • Assessment could also be used for existing technical solutions in new conditions, e.g., due to climate change
Threats:
Business as usual with inadequate ad hoc assessment or checklists might be perceived as faster and with less (initial) cost.Lack of available input, e.g., documented material properties and documented reference cases can compromise the results.There is a difficulty in choosing the right solutions for evaluation.
Publisher’s Note: MDPI stays neutral with regard to jurisdictional claims in published maps and institutional affiliations.

