Article

Takt Production Monitoring and Control in Apartment Renovation Projects

Faculty of Built Environment, Tampere University, 33720 Tampere, Finland
*
Author to whom correspondence should be addressed.
Buildings 2021, 11(3), 92; https://doi.org/10.3390/buildings11030092
Submission received: 9 December 2020 / Revised: 14 February 2021 / Accepted: 24 February 2021 / Published: 2 March 2021
(This article belongs to the Section Construction Management, and Computers & Digitization)

Abstract

:
Construction production is steered with the help of monitoring task progressions and comparing them to the schedule. Construction monitoring is often imprecise. Especially in takt production, more detailed and systematic monitoring methods should be pursued. In takt production, production must be monitored frequently to make sure that the production follows the takt schedule. However, takt production monitoring methods have not been discussed in literature. In this study, a digital monitoring solution for takt production is developed and tested in a case apartment renovation project in Finland. At first, the production monitoring in the case project was done in paper format. This monitoring form was then developed into a digital monitoring application. The progression of production tasks was entered into the application manually. These entries were then automatically compared with a digital takt schedule. As a result, production status can be analyzed automatically and provide diverse information for the construction foremen. This information can be automatically visualized and used as a detailed status report for site meetings. Gathered information can also be revisited afterwards for development or reclamation purposes, for example.

1. Introduction

The use of takt production in the construction industry, internationally, has begun roughly in the last 15 years [1]. Because takt production is a new phenomenon, there are few publications regarding it, and there are clear research gaps in the literature. One of these research gaps concerns takt production management, of which there is only infrequent and scattered published information, with the exception of the studies by Dlouhy et al. [2] and Binninger et al. [3]. Studies and journal articles concerning takt production applied to refurbishment are particularly few.
The main principle in construction production management is that construction production is steered with the help of a schedule to which production realization is compared. If the realization differs from the schedule, production is steered back to follow the schedule. In practice, however, construction scheduling is often rough and schedule changes are frequent [4]. Furthermore, the monitoring of production realization is often imprecise, and the production status is unclear [5]. This is particularly problematic in takt production, which is an exceptionally systematic production method planned in detail [1]. That is why the application of takt production requires monitoring production realization at a higher level of detail. Because takt production requires rapid reactions (e.g., [6]) and revising the takt schedule during production is challenging [6,7], it must be monitored closely and in detail [8].
Construction production is often monitored through site walk-arounds and a so-called monitoring vignette (presented in Figure 1) [9]. During a site walk-around, the foreman observes how different tasks have advanced between the walk-arounds. The monitoring vignette is created based on the schedule, and thus filling out the vignette produces a comparison of the production plan and the implementation [9].
Takt production is planned by breaking down production into recurring and detailed planned work packages and takt areas [2]. Such a detailed division is appropriate from the point of view of production monitoring, as there is less ambiguity in establishing the production status [7].
In rapid takt production, production must be monitored daily or at least at takt time intervals to make sure that the production follows the takt schedule [10]. Documenting and monitoring the situation daily takes up a significant share of the foreman’s time. It must therefore be made sure that performing and documenting the monitoring can be done with as little effort as possible and that it brings as much benefit as possible. According to Frandson et al. [11], communicating the production plan to the worker level is the biggest challenge in takt production. Digital information can help with this communication.
The objective of this article is to present viewpoints that should be considered in the monitoring and control of takt production. The research method is action research, in which the main author of the article has participated in the development of takt production management of the case site. In the literature review, the currently used methods of construction production monitoring are determined and their suitability for takt projects such as the case site is considered. After that, the methods of establishing the takt production status developed and tested in the case site are described in the results section. Finally, in the discussion section, the suitability of these methods for the monitoring of takt production sites such as the case site is considered and a flow chart for systematic and digital monitoring and control of takt production, drafted based on the case site, is presented.

2. Theoretical Background

2.1. Construction Production Monitoring and Control

Irrespective of the industry, production planning, plan updating, production realization, and production monitoring and controlling take place in projects [12,13]. Comprehensive production planning and scheduling of a construction project alone are not enough to guarantee a successful project, as schedules are always predictions of the future [4]. During production, it is inevitable that there will be uncontrolled events that will affect the implementation of production in a way that deviates from what was planned. If production is not steered back to following the schedule or changes are not made to the schedule, production is managed either based on outdated plans or in a partly or totally unplanned manner.
The realization of construction production is monitored and compared to plans as a continuous process. When a deviation is observed between the schedule and the realization, the primary target is to crash the schedule, in order to bring the project back on schedule through various steering measures [5]. If it is not possible to return to the production schedule, or faulty assumptions have been made in planning the schedule, changes are made in the production plans in order to be able to continue production in a planned manner [13].
Mubarak [4] proposes that production management is the most important use for schedules. According to Pierce [5], foremen must have methods for monitoring and documenting production realization. A project and its schedules are steered by comparing the production situation (as-built) to the production schedule (as-planned) and taking necessary steering actions to fix schedule deviations [4]. According to Pierce [5], the comparison of planned production and realized production is usually done by entering production realization data in a Gantt chart or other similar presentation. The presentation should be such that the differences between the production realization and the production plan are clearly visible. Also, the presentation must not be too complex, so that there is no overload of information to the observer. The amount of digitally collected data is often so large that it must be “filtered” to keep the presentation clear. For example, if necessary, only schedule deviations may be presented in the site status, as they require actions from foremen [5].
In addition to the current status of production, it is important to know how the current status will affect the implementation of upcoming tasks. According to Pierce [5], production may seem to be roughly on schedule but if the right details are not monitored, it may in reality still be on a path of being completed behind schedule. In construction production, for example the critical path method is used together with production realization data to predict delays in production [5].
Other as-built data that help production management include resource data, actual costs, used work methods, quality management related data, as well as written and oral communication [14]. Ideally, the documented as-built data shows how the construction production was executed and what factors caused changes in production [15]. Currently this information is documented in construction sites sporadically and in different formats [15]. Baldwin & Bordoli [16] argue, however, that a comprehensive documentation system is needed in construction production. According to Sears et al. [15], periodic revision of the as-built schedule of a construction project is important, because it is the only document that records and models production realization for subsequent reviews. In addition to production management, this information can be used, at least, in processing reclamations and as a tool for development [15,16].
According to Mubarak [4], schedule updating is considered to include both status documentation and schedule modification. In this article, establishing the production status and schedule modifications are separated to reduce misunderstandings. As for the frequency of documenting the implementation of the schedule, there is no one right answer. In most cases, the production status is established for possible schedule changes every one or two weeks (e.g., [4,5,15]). According to Pierce [5], however, it may even be necessary to monitor adherence to the schedule daily. Project management must recognize that both too frequent and too infrequent production status reporting have negative effects [4]. A suitable frequency for reporting is such that it does not overly strain the resources of the main contractor and, on the other hand, does not cause overly long information breakdowns for workers [4]. As a counter argument, Eriksson & Westerberg [17] warn that production that is monitored too closely may increase opportunism among contractors and reduce cooperation and initiative. Thus, according to Eriksson & Westerberg [17], the aim in production monitoring should be site inspections based on subcontractors’ self-control, which would allow for early detection of defects. As a result, one extensive final inspection might not even be necessary [17].
Production progress can be described with various indicators. Such indicators include, for example, work completed, key performance indicators, technical performance measures, start and finish dates of schedule activities, number of change requests, number of defects, actual costs and actual durations [13]. In construction production, indicators such as units done, percent completed, remaining duration, and expected finish date are often used [4,5,18]. According to Pierce [5], calculating the actual realized amount of work in construction production is sometimes difficult, for example if some of the work takes place outside of the construction zone or the construction zone is difficult to quantify, such as a supported excavation. Thus, it is sometimes difficult to estimate the progress of a construction zone in percentage, for example [4].
For some reason, it seems that tools for traditional construction progress monitoring have rarely been discussed in detail in literature. One example of production monitoring can be found in the Location-Based Management System by Kenley & Seppänen [19]. According to them, actual start and finish dates of each location, interruptions, actual quantities, actual resources, and actual shift lengths and days off are the basis for production monitoring. It is possible to show the status of locations and tasks in a status matrix or a flowline diagram if the actual start and finish dates are documented [19]. Documented interruptions provide a metric for evaluating workflow [19]. Documented quantities help detect measurement errors and estimate future workloads [19]. Resource monitoring can be utilized to detect and solve root causes of deviations [19].

Digital Production Control

Monitoring production and collecting as-built information manually is inaccurate and arduous (e.g., [14,20]). Automation of the collection and processing of production monitoring data reduces the time used for both processing and collecting data. The automation of the evaluation of construction project progress is, indeed, a much-researched subject and a large number of research articles regarding the topic have been published [21].
Automatic systems have been developed for both collecting and analyzing data. According to Deng et al. [21], the automatic data collection and management methods used today can be divided into three categories: (1) bar code or radio-frequency identification (RFID), (2) laser scanning, and (3) computer vision. The bar code and RFID are suitable for indoor and outdoor use and they are relatively cost-effective locating technologies [20,22], with which the movement of materials and workers on a construction site can be monitored and documented automatically.
Laser scanning creates three-dimensional images of the surroundings of the scanner. With laser scanning, objects can be identified and dimensional changes in the surroundings observed, for example [20]. Laser scanning can be used to define the production situation by comparing a building information model (BIM) with scanned work areas [23]. In order to be able to scan the site status automatically, a laser scanner must be installed in a permanent place in every work area.
The third category of automatic data collection and processing is computer vision [20,21]. Computer vision refers to computerized automatic pattern recognition where a computer recognizes objects that are seen on video or in images [20]. According to Deng et al. [21], production monitoring done with the help of computer vision is currently based on comparing an as-planned BIM model and images taken on the construction site or an as-built 3D model produced of the construction site. Cameras are installed in permanent places in work areas, which generates comparable images [21].

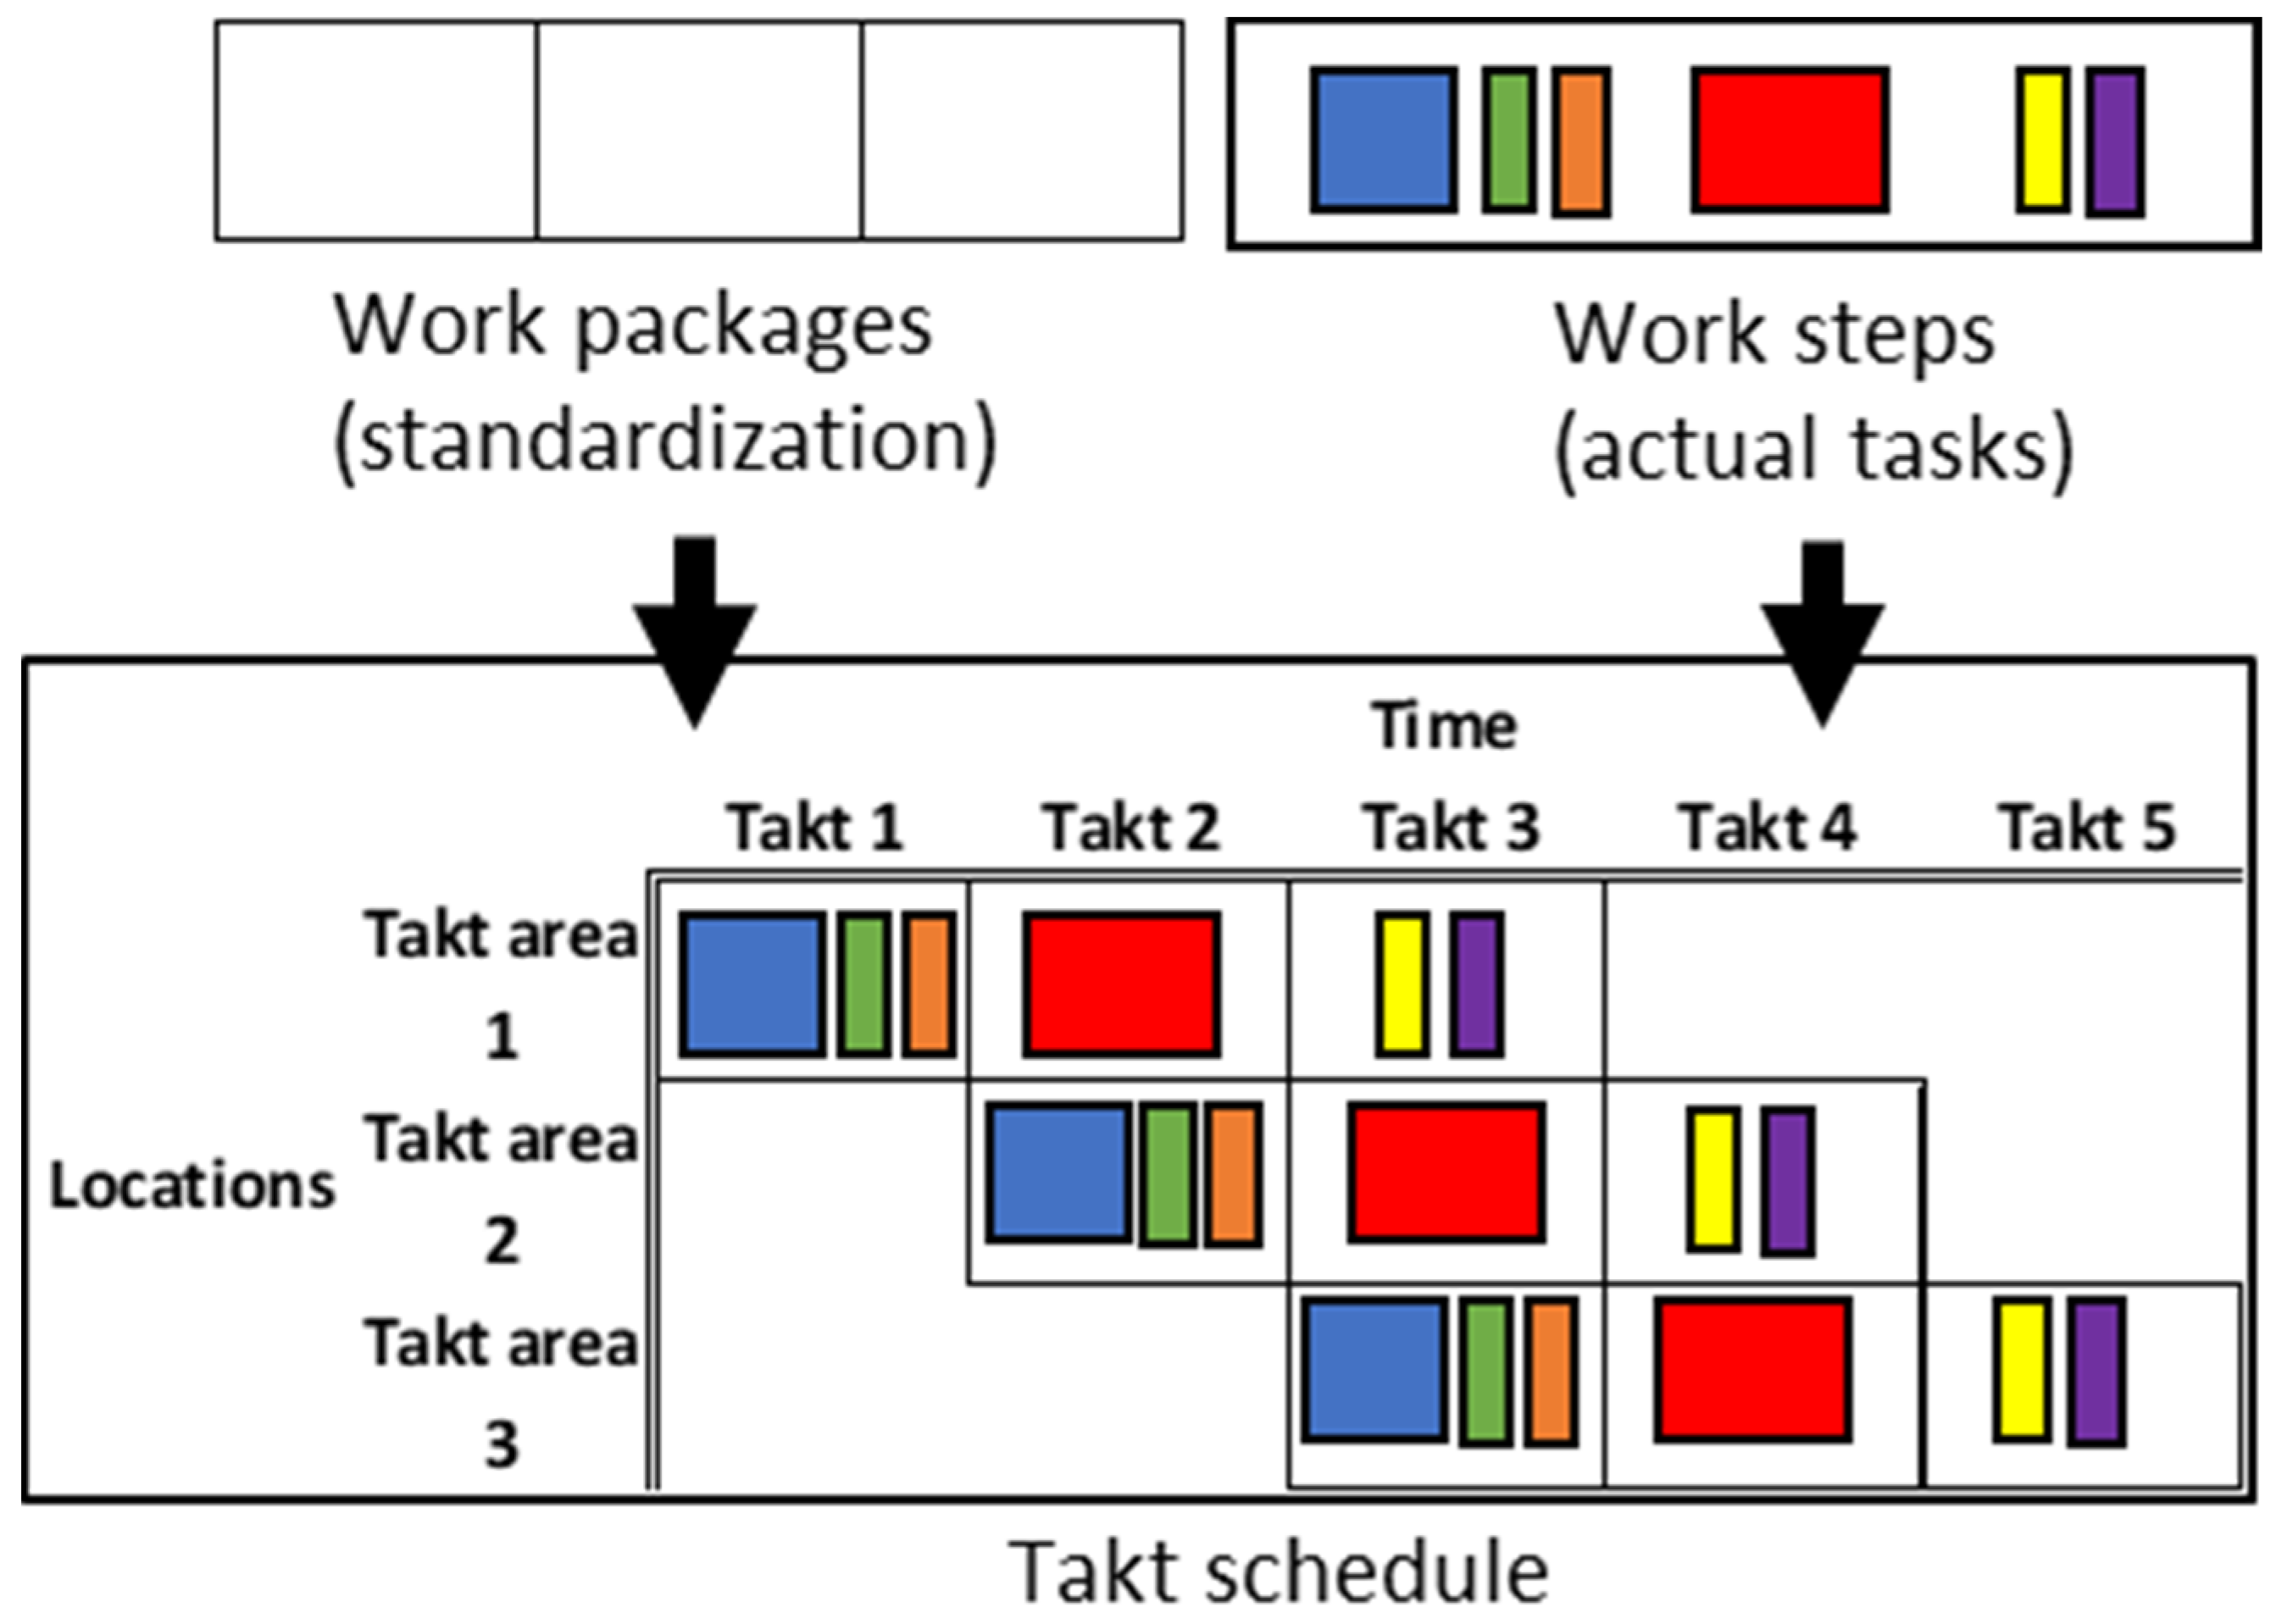
2.2. Takt Production Monitoring and Control

It is easier to monitor the progress of construction production if the production can be broken down into clearly identifiable subsections [24]. By steering the production in small and controlled sections, feedback loops can be constructed to help steer and develop the production in a controlled manner [24]. This is just the kind of production that is pursued in takt production (e.g., [2]).
The two ways to break down construction production are to break down the production based on the total scope of work into a hierarchical work breakdown structure [13], or to divide the production based on locations into a location breakdown structure [19]. Similarly, scheduling is often done with an emphasis on either tasks (activity-based scheduling) or locations (location-based scheduling) [19,25]. The most detailed level of the work breakdown structure contains so-called work packages that are used to group activities for scheduling, estimating, monitoring, and management [13]. The level of work breakdown detail depends on how precise a division project management is required to be [13]. Kenley & Harfield [25] claim that, from the point of view of construction production breakdown, location is a more suitable unit of analysis than work. On the other hand, Kenley & Harfield [25] add that using both WBS (work breakdown structure) and LBS (location breakdown structure) together may increase the productivity of construction production.
Takt production is considered a location-based method [26]. However, takt schedules can be created based on both LBS and WBS. According to Dlouhy et al. [2], in takt production, the area division is designed by dividing the production into the smallest possible replicable areas, standard space units, of which takt areas are then combined. The definition of takt areas resembles a location breakdown structure. In addition, tasks in takt production are broken down into work packages of equal proportion that are completed in one takt area during one takt time. Each work package includes one or several smaller work steps [2]. This detailed itemization of work resembles a work breakdown structure. This separates a takt schedule from location-based scheduling. To define work packages, the production is broken down into detailed chains of activities, according to which work is then assorted into work packages of equal proportion (e.g., [2]).
When defining the work sequence in takt production, it is vital to clearly state which work steps are to be completed during which takt in which takt area [7]. Thus, there will be no ambiguity in the takt plan. Figure 2 presents the philosophy of allocating work packages and work steps in a takt schedule. Each color represents a unique work step within a work package.

3. Materials and Methods

The research method utilized in this study was action research. Action research was originally formulated as a research method “to help the practitioners” [28], by involving the researcher and other actors (e.g., site managers) in solving a practical problem from the inside of an organization or a process [29]. Action research not only studies a phenomenon, it also tries to affect it. According to Lewin [28], action research includes setting a certain objective for the executed action, observing the results of the action, and planning a new objective accordingly. Such a process can be then repeated numerous times cyclically to further affect and study the phenomenon [28].
Action research recognizes and integrates the influence of the environment into the enquiry process [30]. According to Ottosson [29], without participatory action research, only a fraction of potential information and knowledge can be achieved. This is partly because in many cases someone researching an organization from the outside only receives discrete, fragmented, and filtered or adjusted information [29]. Furthermore, important unspoken information and minor day-to-day decisions are impossible to catch and understand from the outside [29].
Action research was chosen for this study, since the study was based on a case renovation project of a student housing apartment building, where takt production was going to be piloted. The case site was located in Helsinki, Finland. The main author of this article participated in the planning and development of the takt production of the case site in cooperation with the main contractor’s foremen during 2019, which further made action research the logical method of choice. The authors had opportunity to affect the production plans, however in the end the foremen were accountable for the success of the project and therefore had the final decision. However, a consensus was quite easily reached between the parties during the project and therefore the roles and responsibilities were not perceived to affect the study.
The production was studied in-situ all the way throughout the project by the main author. Documented actualized work package and takt area-specific task duration data was collected from the site by the research group daily during the entire project, except for a few days, and the production model was developed based on the gathered information.
The case site consisted of the renovation of five buildings (Figure 3) and altogether approximately 200 apartments, in which indoor surfaces, bathrooms, kitchen fixtures, and all building services systems (such as water and plumbing, ventilation, and electrical systems) were renewed. The roofing of the buildings was renewed as well, and renovation in the outdoor areas were also carried out, including the renewal of sub-surface drains.
Nearly all residential floors in the buildings were identical. A residential floor had four shared apartments, each of which had three rooms, a bathroom, and a shared kitchen. In addition, there were one two-room apartment and two one-room apartments on each floor. Prior to the renovation, instead of the one-room apartments there was another two-room apartment that was divided into two one-room apartments. The floor plan of the case site is shown in Figure 4.
The content of the takted portion of the renovation is specified in more detail in Table 1. The renovation began in December 2018 and was finished in January 2020. Takt production was utilized in the interior renovation of the apartments but not in the renewal of building service risers. Other renovation work was not carried out as takt production, i.e., the progress of this work was not equalized to fit the progress rate of the takt production.
In order to document the daily status of the site, monitoring tools were developed for this purpose. These tools are described in detail in the following Results section.

4. Results

4.1. Takt Production Monitoring—Monitoring Procedures in Paper and Digital Form

The objective in the case site of this study was to develop a replicable approach to the takt production model. The basis of the study was that a clear situational picture of the production and adequate information regarding its implementation are needed to develop the takt production model. The collected status data could be utilized in task management conducted by foremen, as the data helps in visualizing the status of the production and in developing the takt schedule. Because of the aforementioned factors, the decision was made to collect comprehensive data regarding production realization in the case project.
As there was no known procedure available for the collection of task status data in such a comprehensive form for the case site, a prototype for this was developed in this study. The development of the realization data collection method is discussed in the following subchapters.

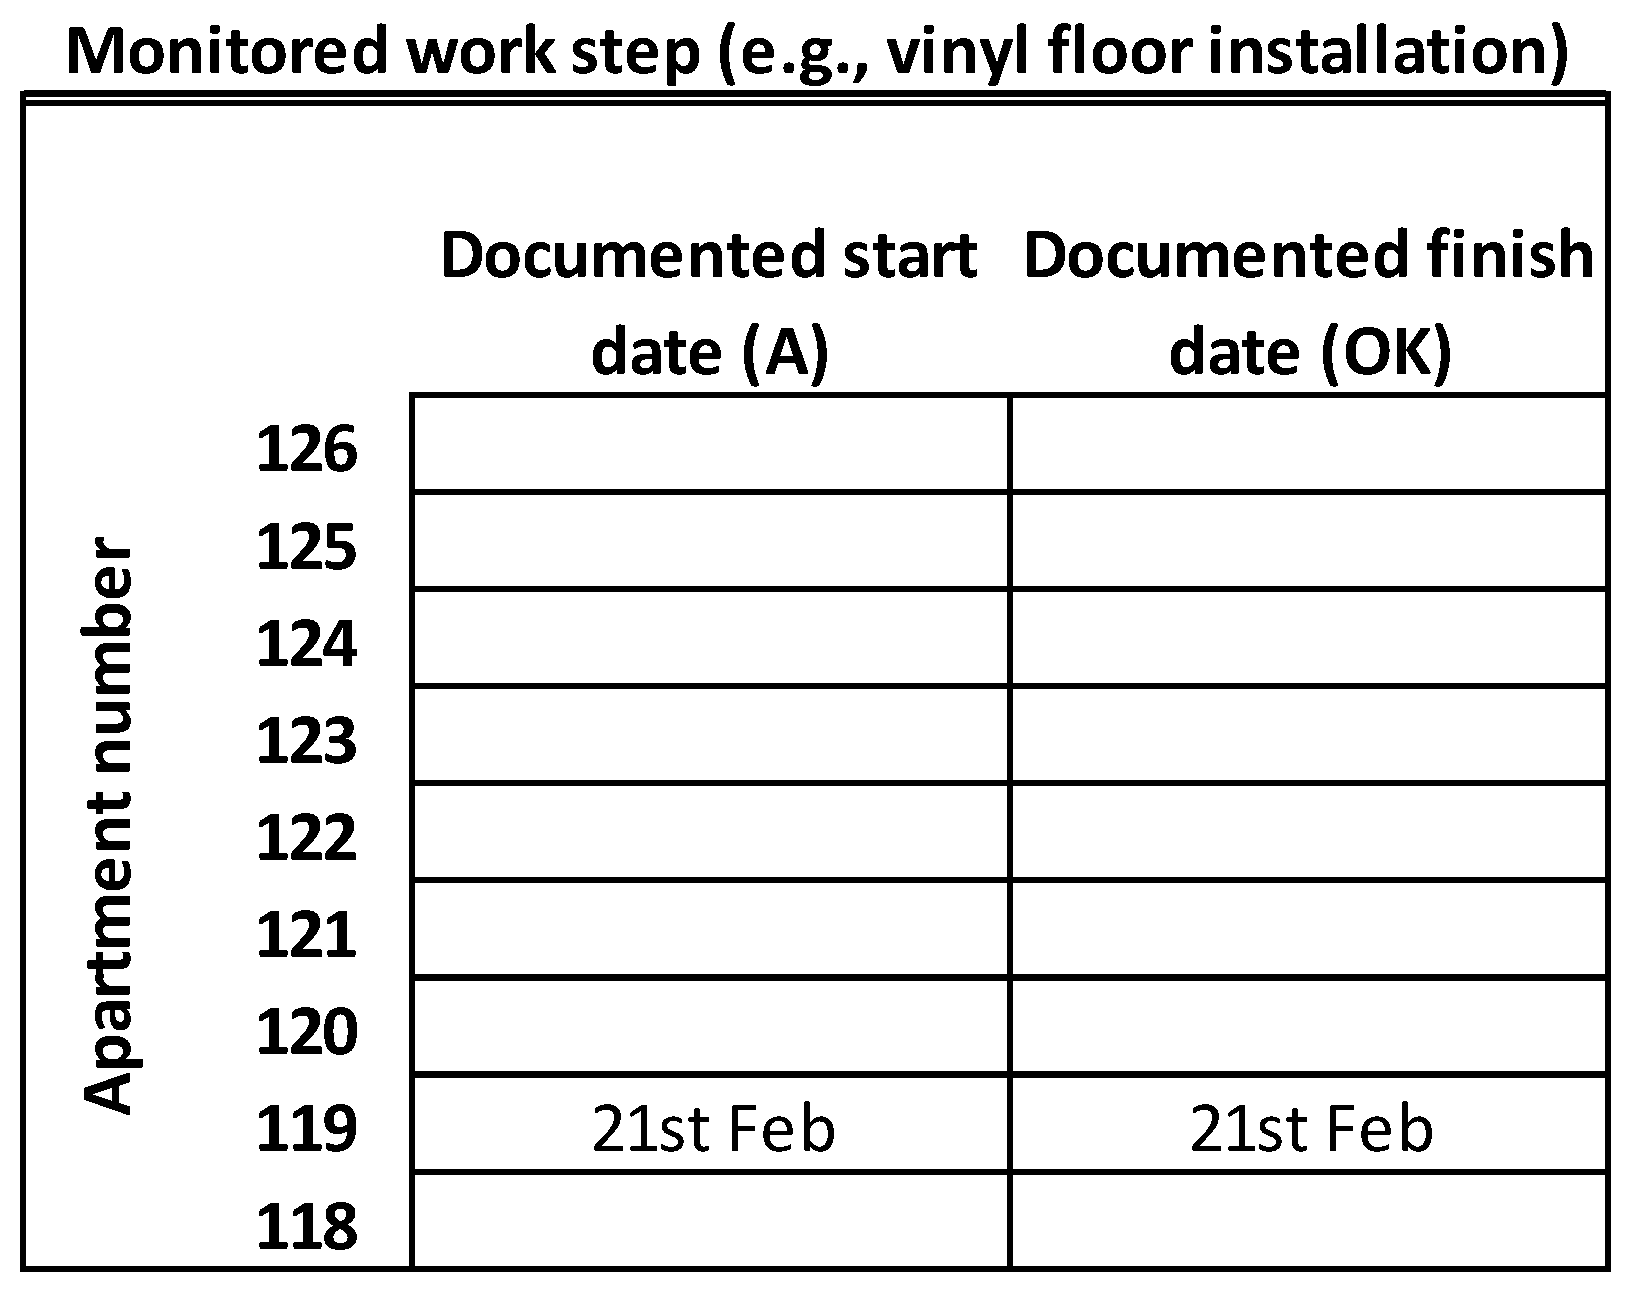
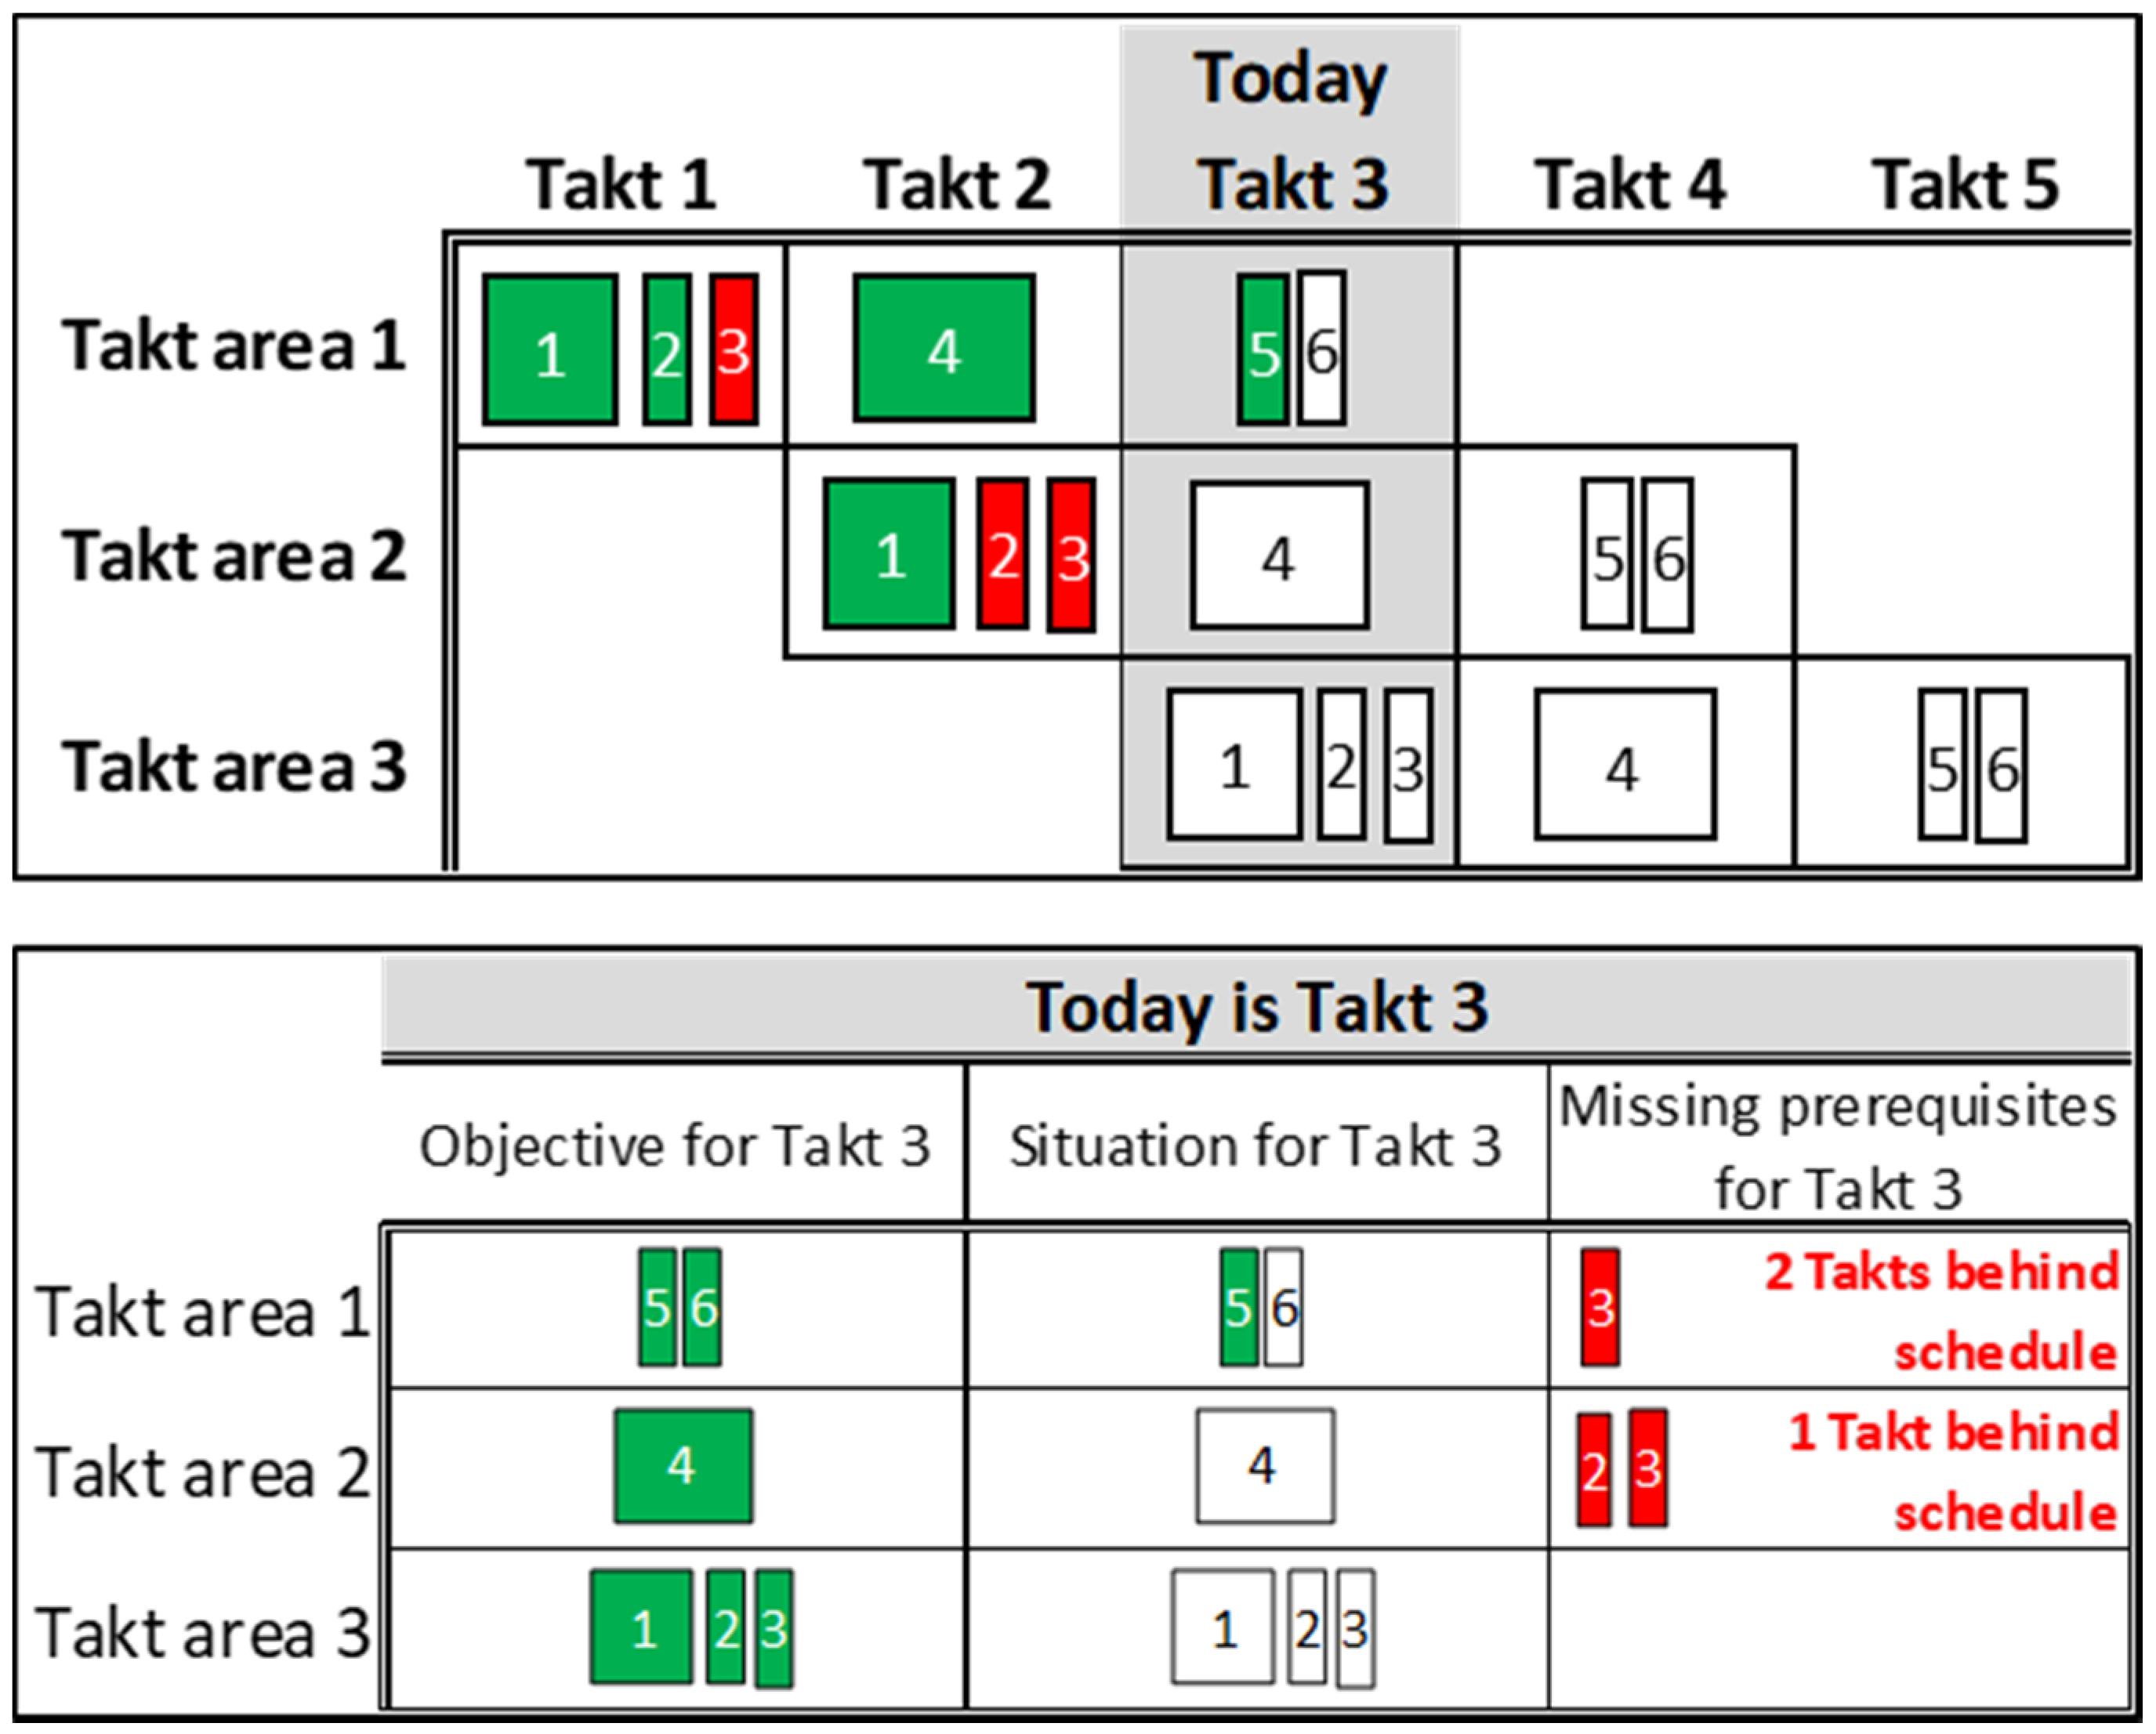
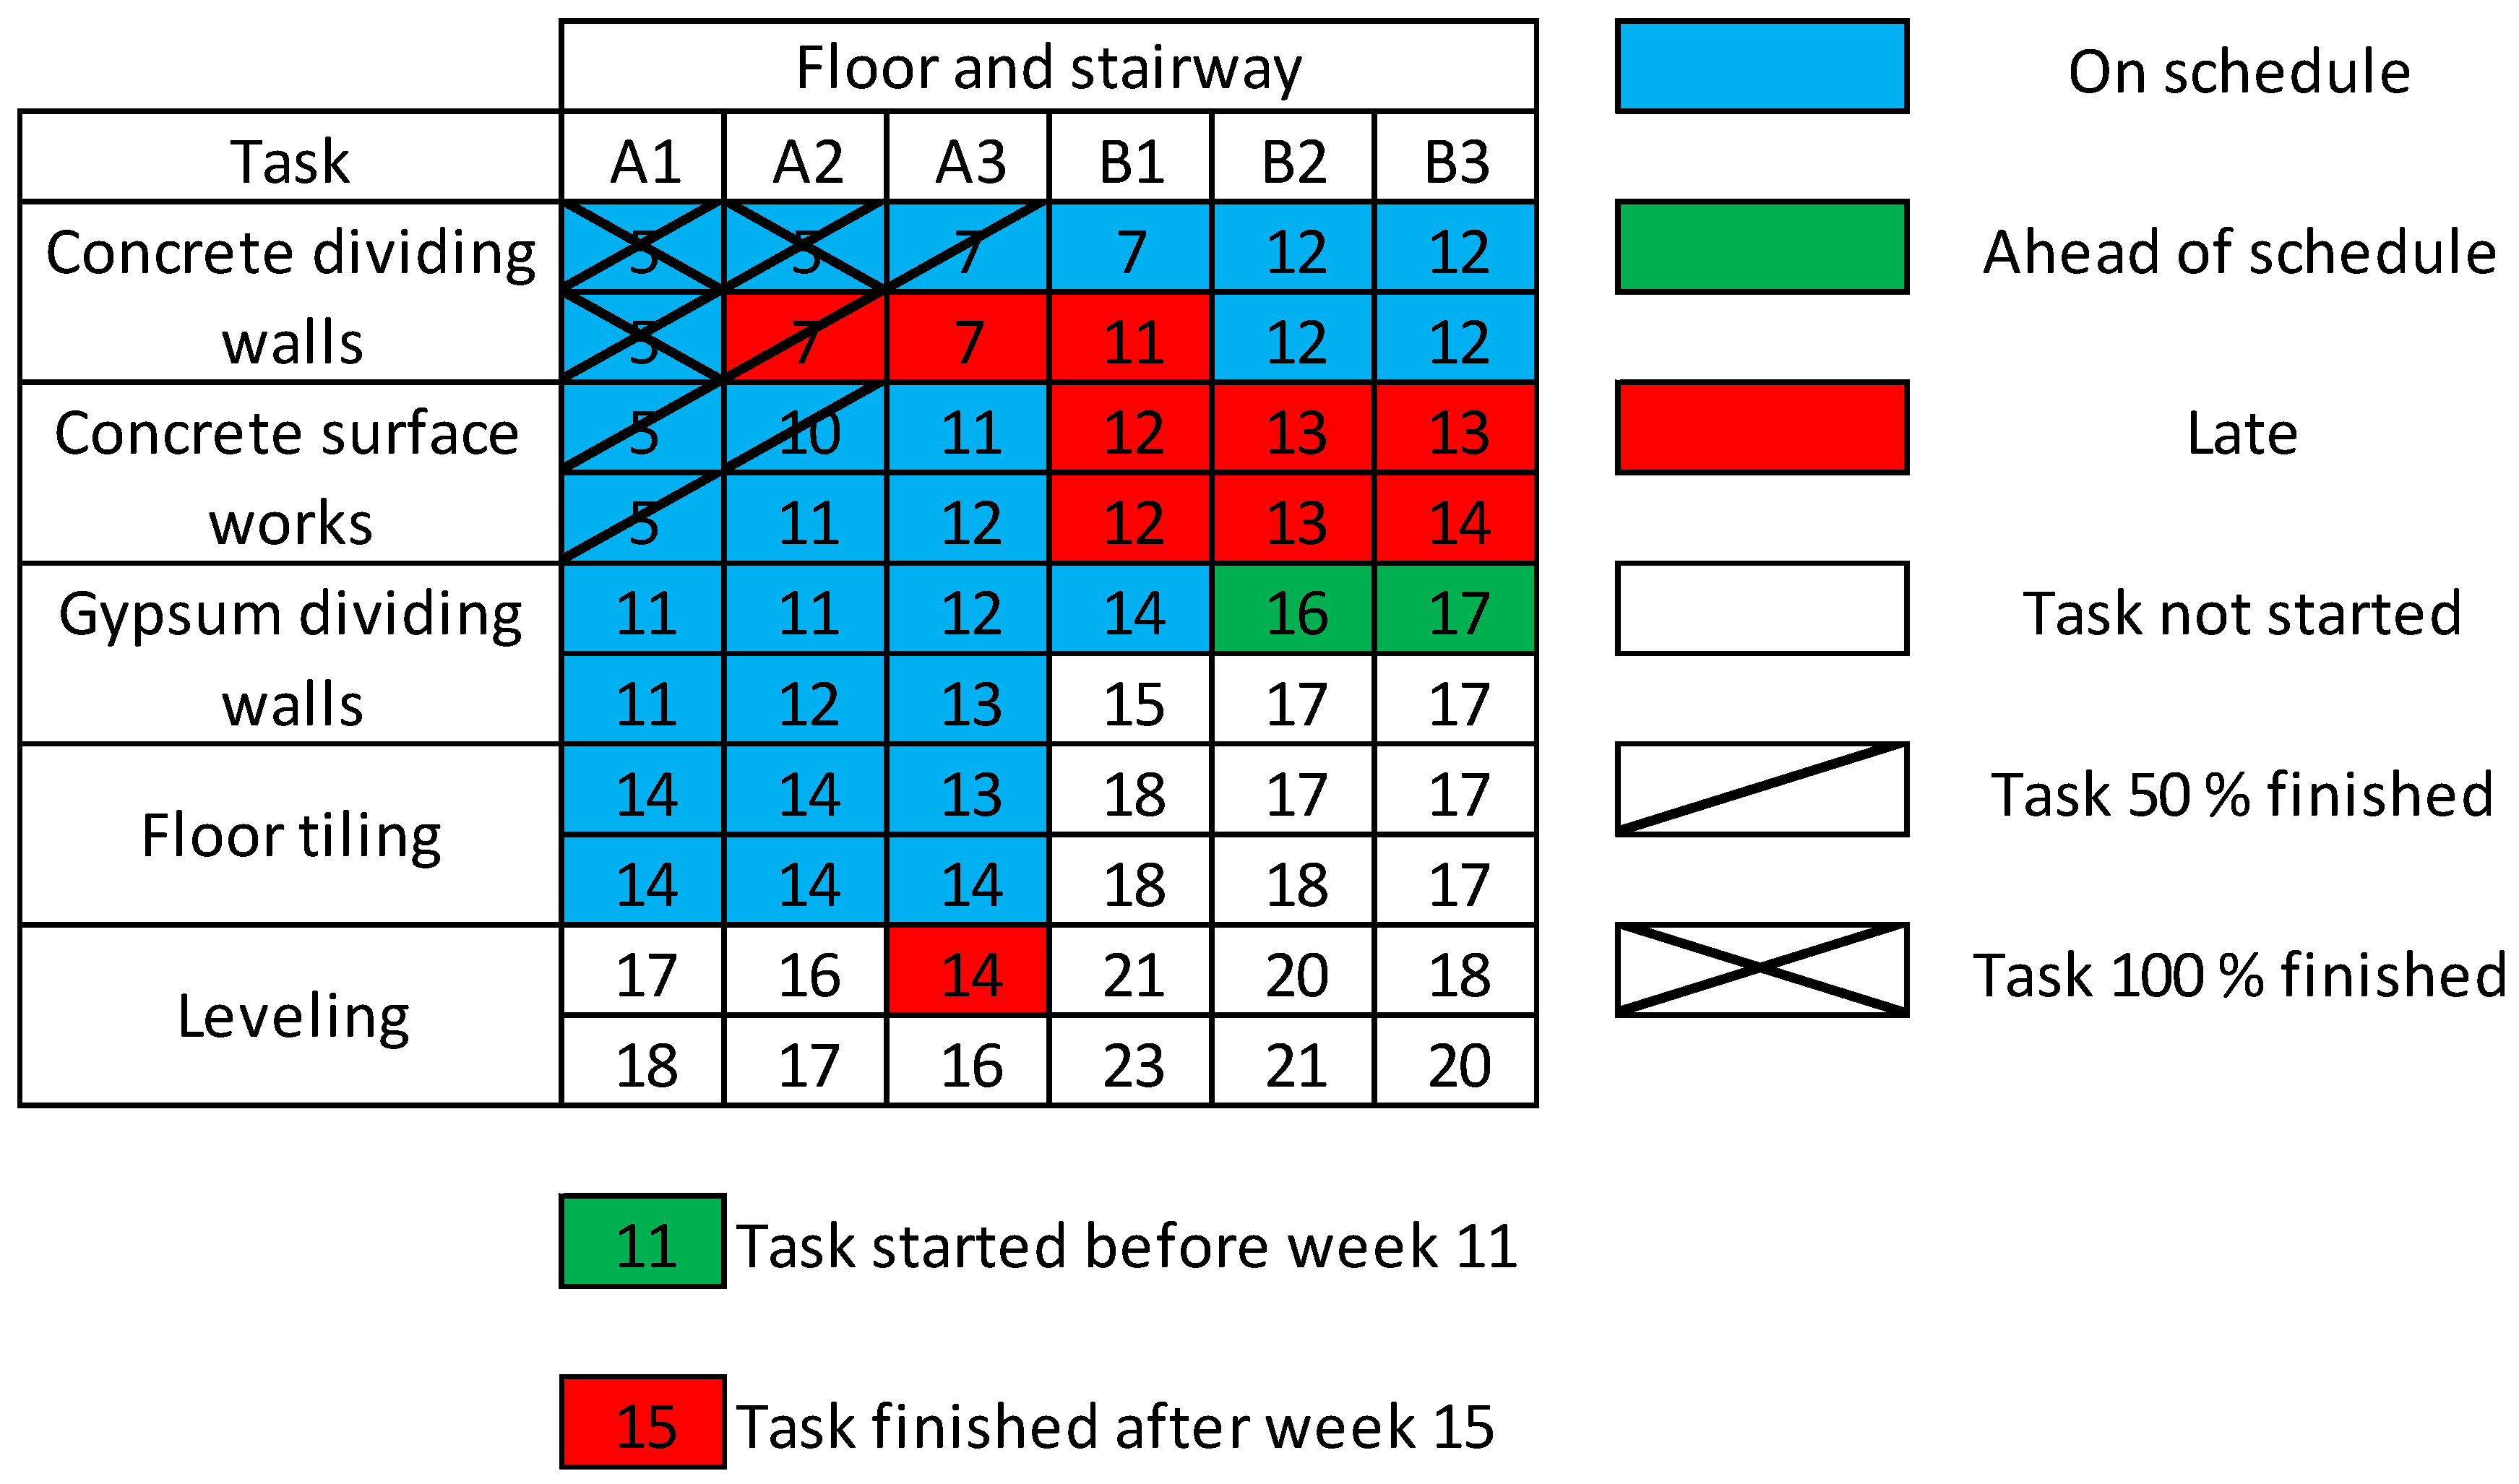
4.1.1. Paper Monitoring Form

In the first building of the case site, printed monitoring forms were used to document the realization of tasks included in the takt production. Because the takt time was set at two days, the production status had to be documented at least every other day in order for it to be possible to compare the realization with the takt schedule. However, the decision was made to document the production status daily, as that made the examination of production realization afterwards clearer. As documenting and processing the production manually on a daily basis would have been a significant burden to the foreman, a specific person was recruited to document the status of the takted tasks daily. In addition to comprehensive production monitoring, this made it possible to document the reasons for disturbances and deviations, as the person monitoring the production was always observing things and discussing with construction workers in the construction zones.
In the paper form monitoring, there was a separate form for each work step (each work package includes one or multiple work steps), such as bathroom seaming. The work steps were monitored individually in each apartment, and thus each apartment number was stated on every form. The start (“A” columns in Figure 5) and finish dates (“OK” columns in Figure 5) of each work step for each apartment were recorded on the form. Figure 5 presents the monitoring entries for the dry room vinyl floor installation work step in the format described above.
A digital spreadsheet was created to complement the paper form, into which the form entries were copied manually, at first. Initially, the only purpose for the spreadsheet was to compare the realization of tasks in work packages with targets set in the takt schedule. With this comparison, it was possible to illustrate, work step by work step, the status of the production compared to the target. The spreadsheet file consisted of four separate tables: one for documenting takt schedule-based targets by work step, one for documenting collected work step realization data, a section for analysis, and a visual presentation of the analysis.
Figure 6 presents a comparison of the targets according to the schedule and the realization data. The floors and apartments in the building are the vertical variable in the figure. The horizontal variable is time in work days. The target dates based on the schedule are marked in gray. The red cells are work steps completed late, blue ones are early, and green ones on time.
The monitoring method using the paper form proved to be very arduous and required vigilance. Filling out the monitoring form by going around the work site took approximately an hour for a 40-apartment building. However, the time needed varied significantly from walk-around to walk-around due to the large number of forms and ambiguities regarding the entries. For example, sometimes it was difficult to specify, whether a minor installation belonged to a certain work step or not.
In paper form documentation, each entry was, in practice, recorded twice: first on paper and then in the spreadsheet. It was faster to fill out the spreadsheet than the paper form, as the filling involved simply copying the entry data from the forms into the spreadsheet. Still, copying the entries manually was frustrating and mistakes were easily made in the process. Just before the halfway point in the project, the decision was made to get rid of this duplication of work and manual analysis of data by getting a tablet-based digital monitoring application developed.

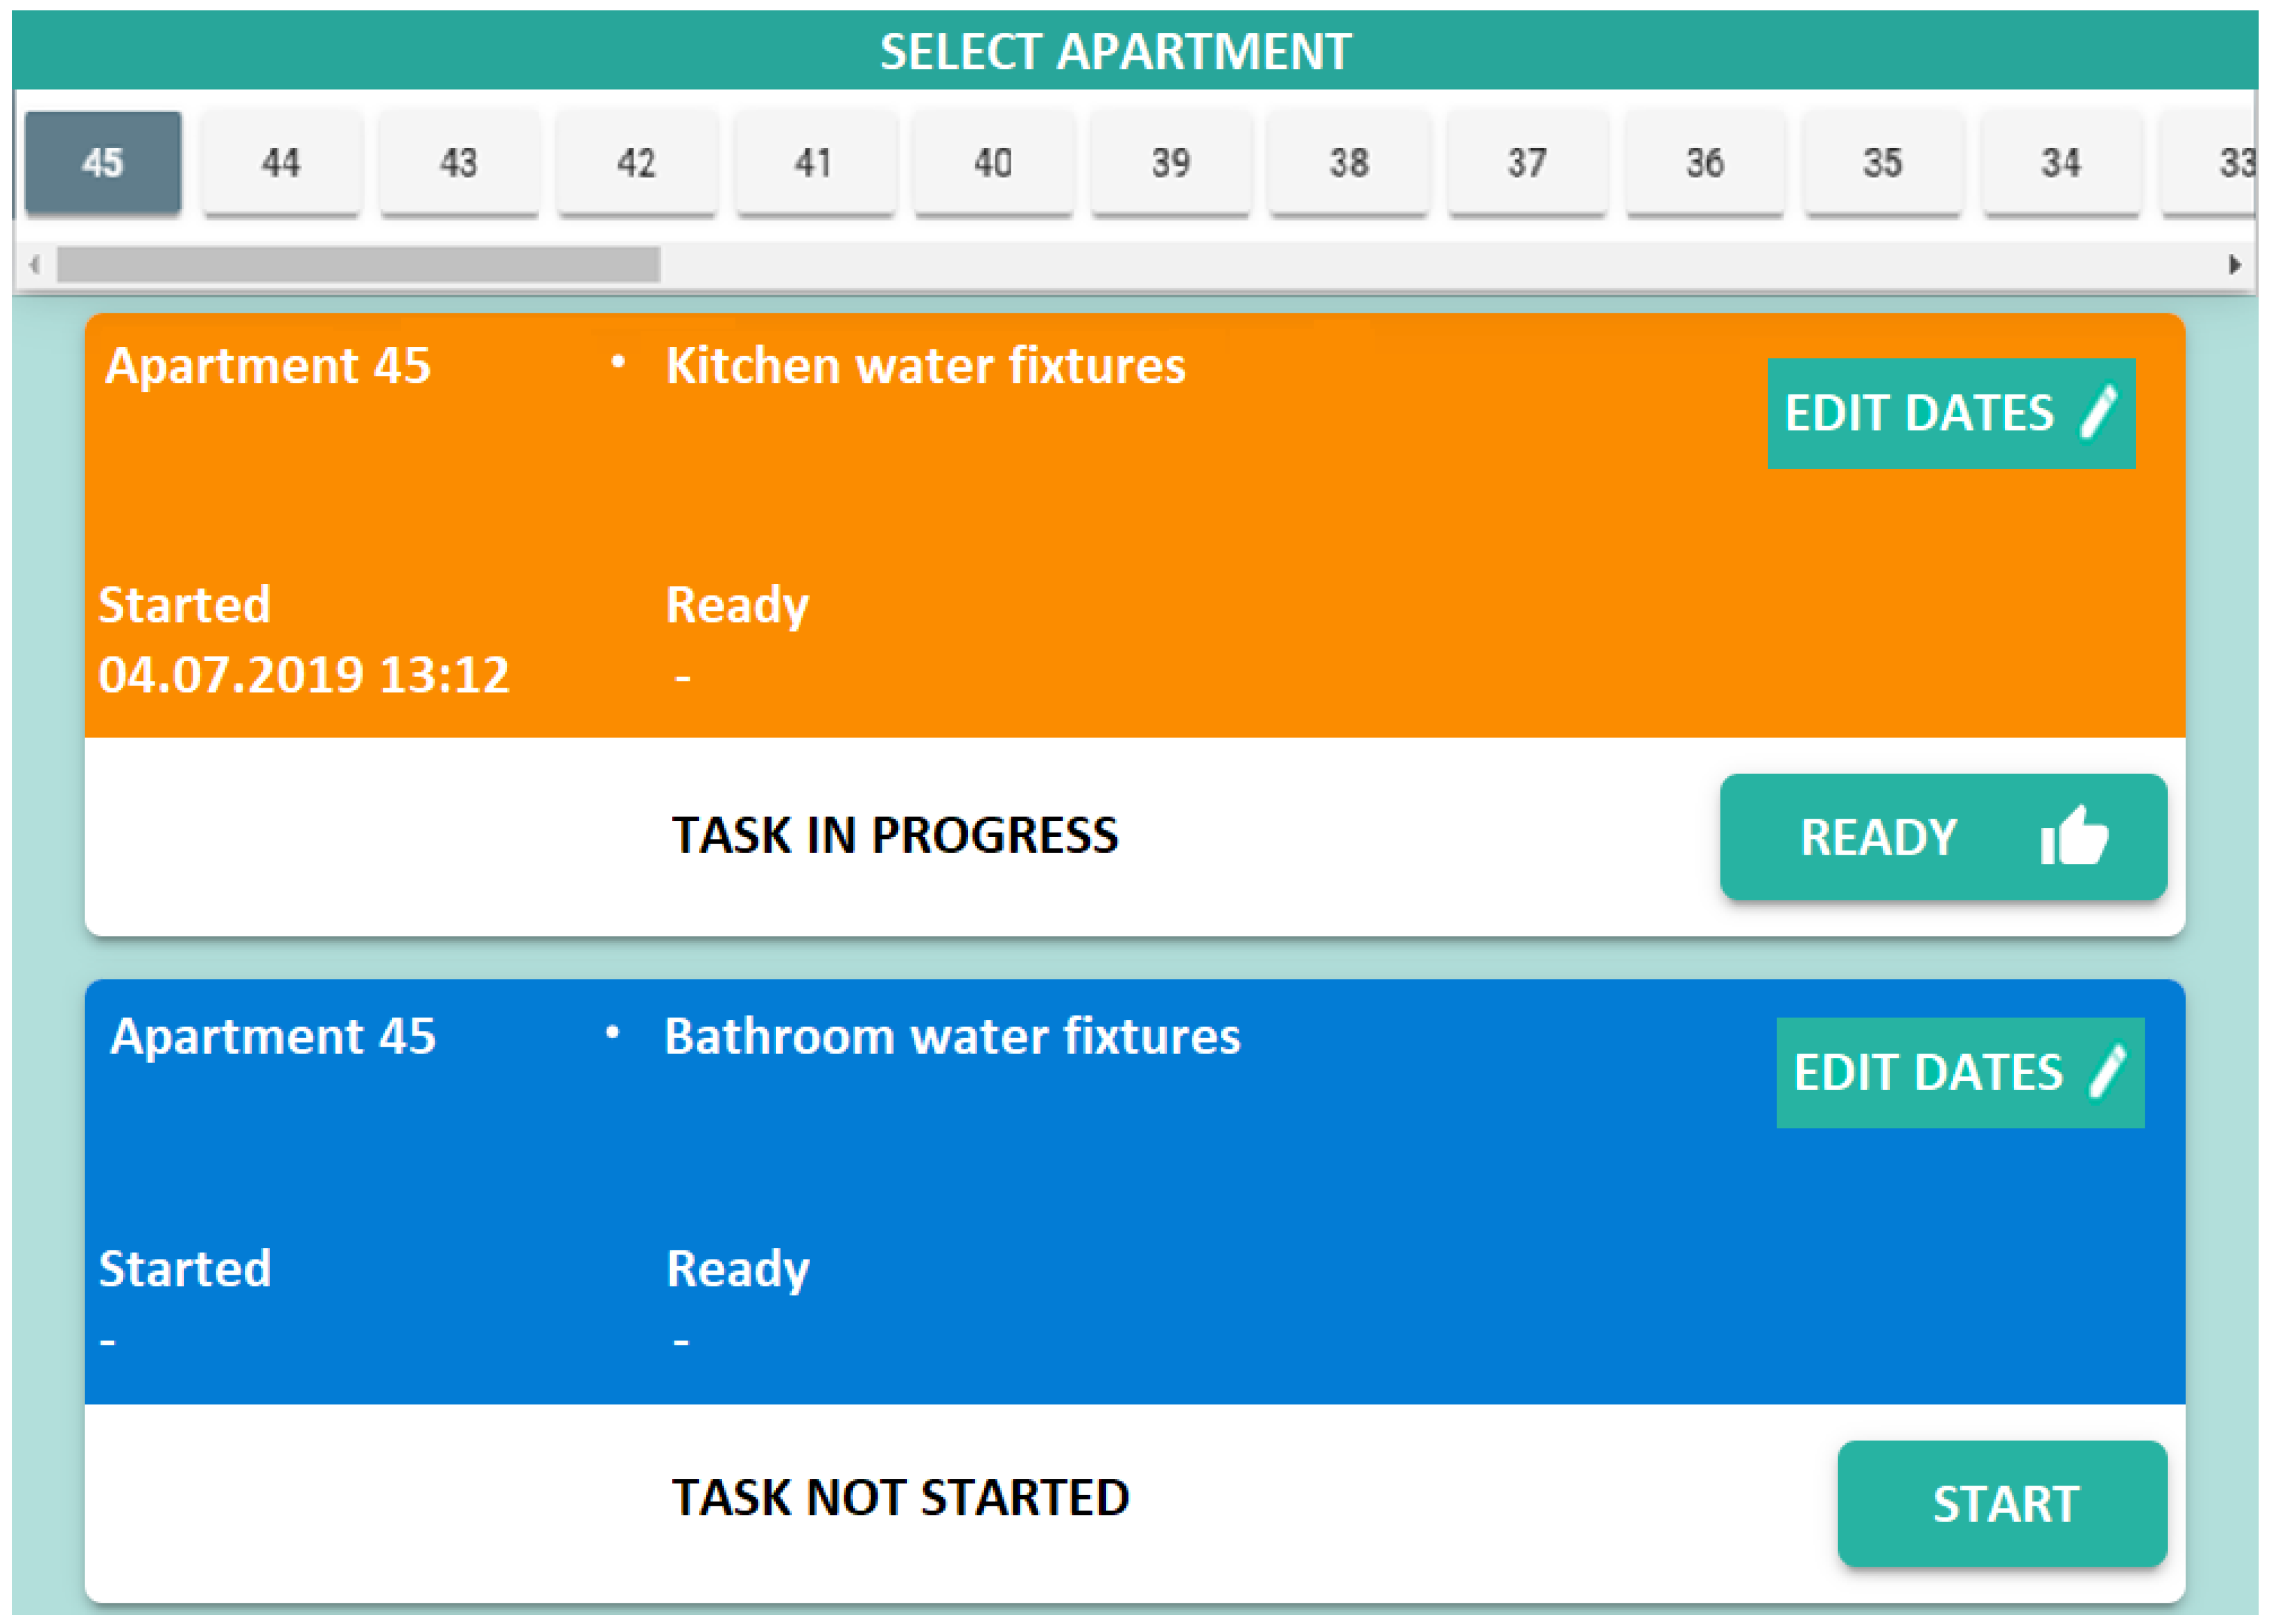
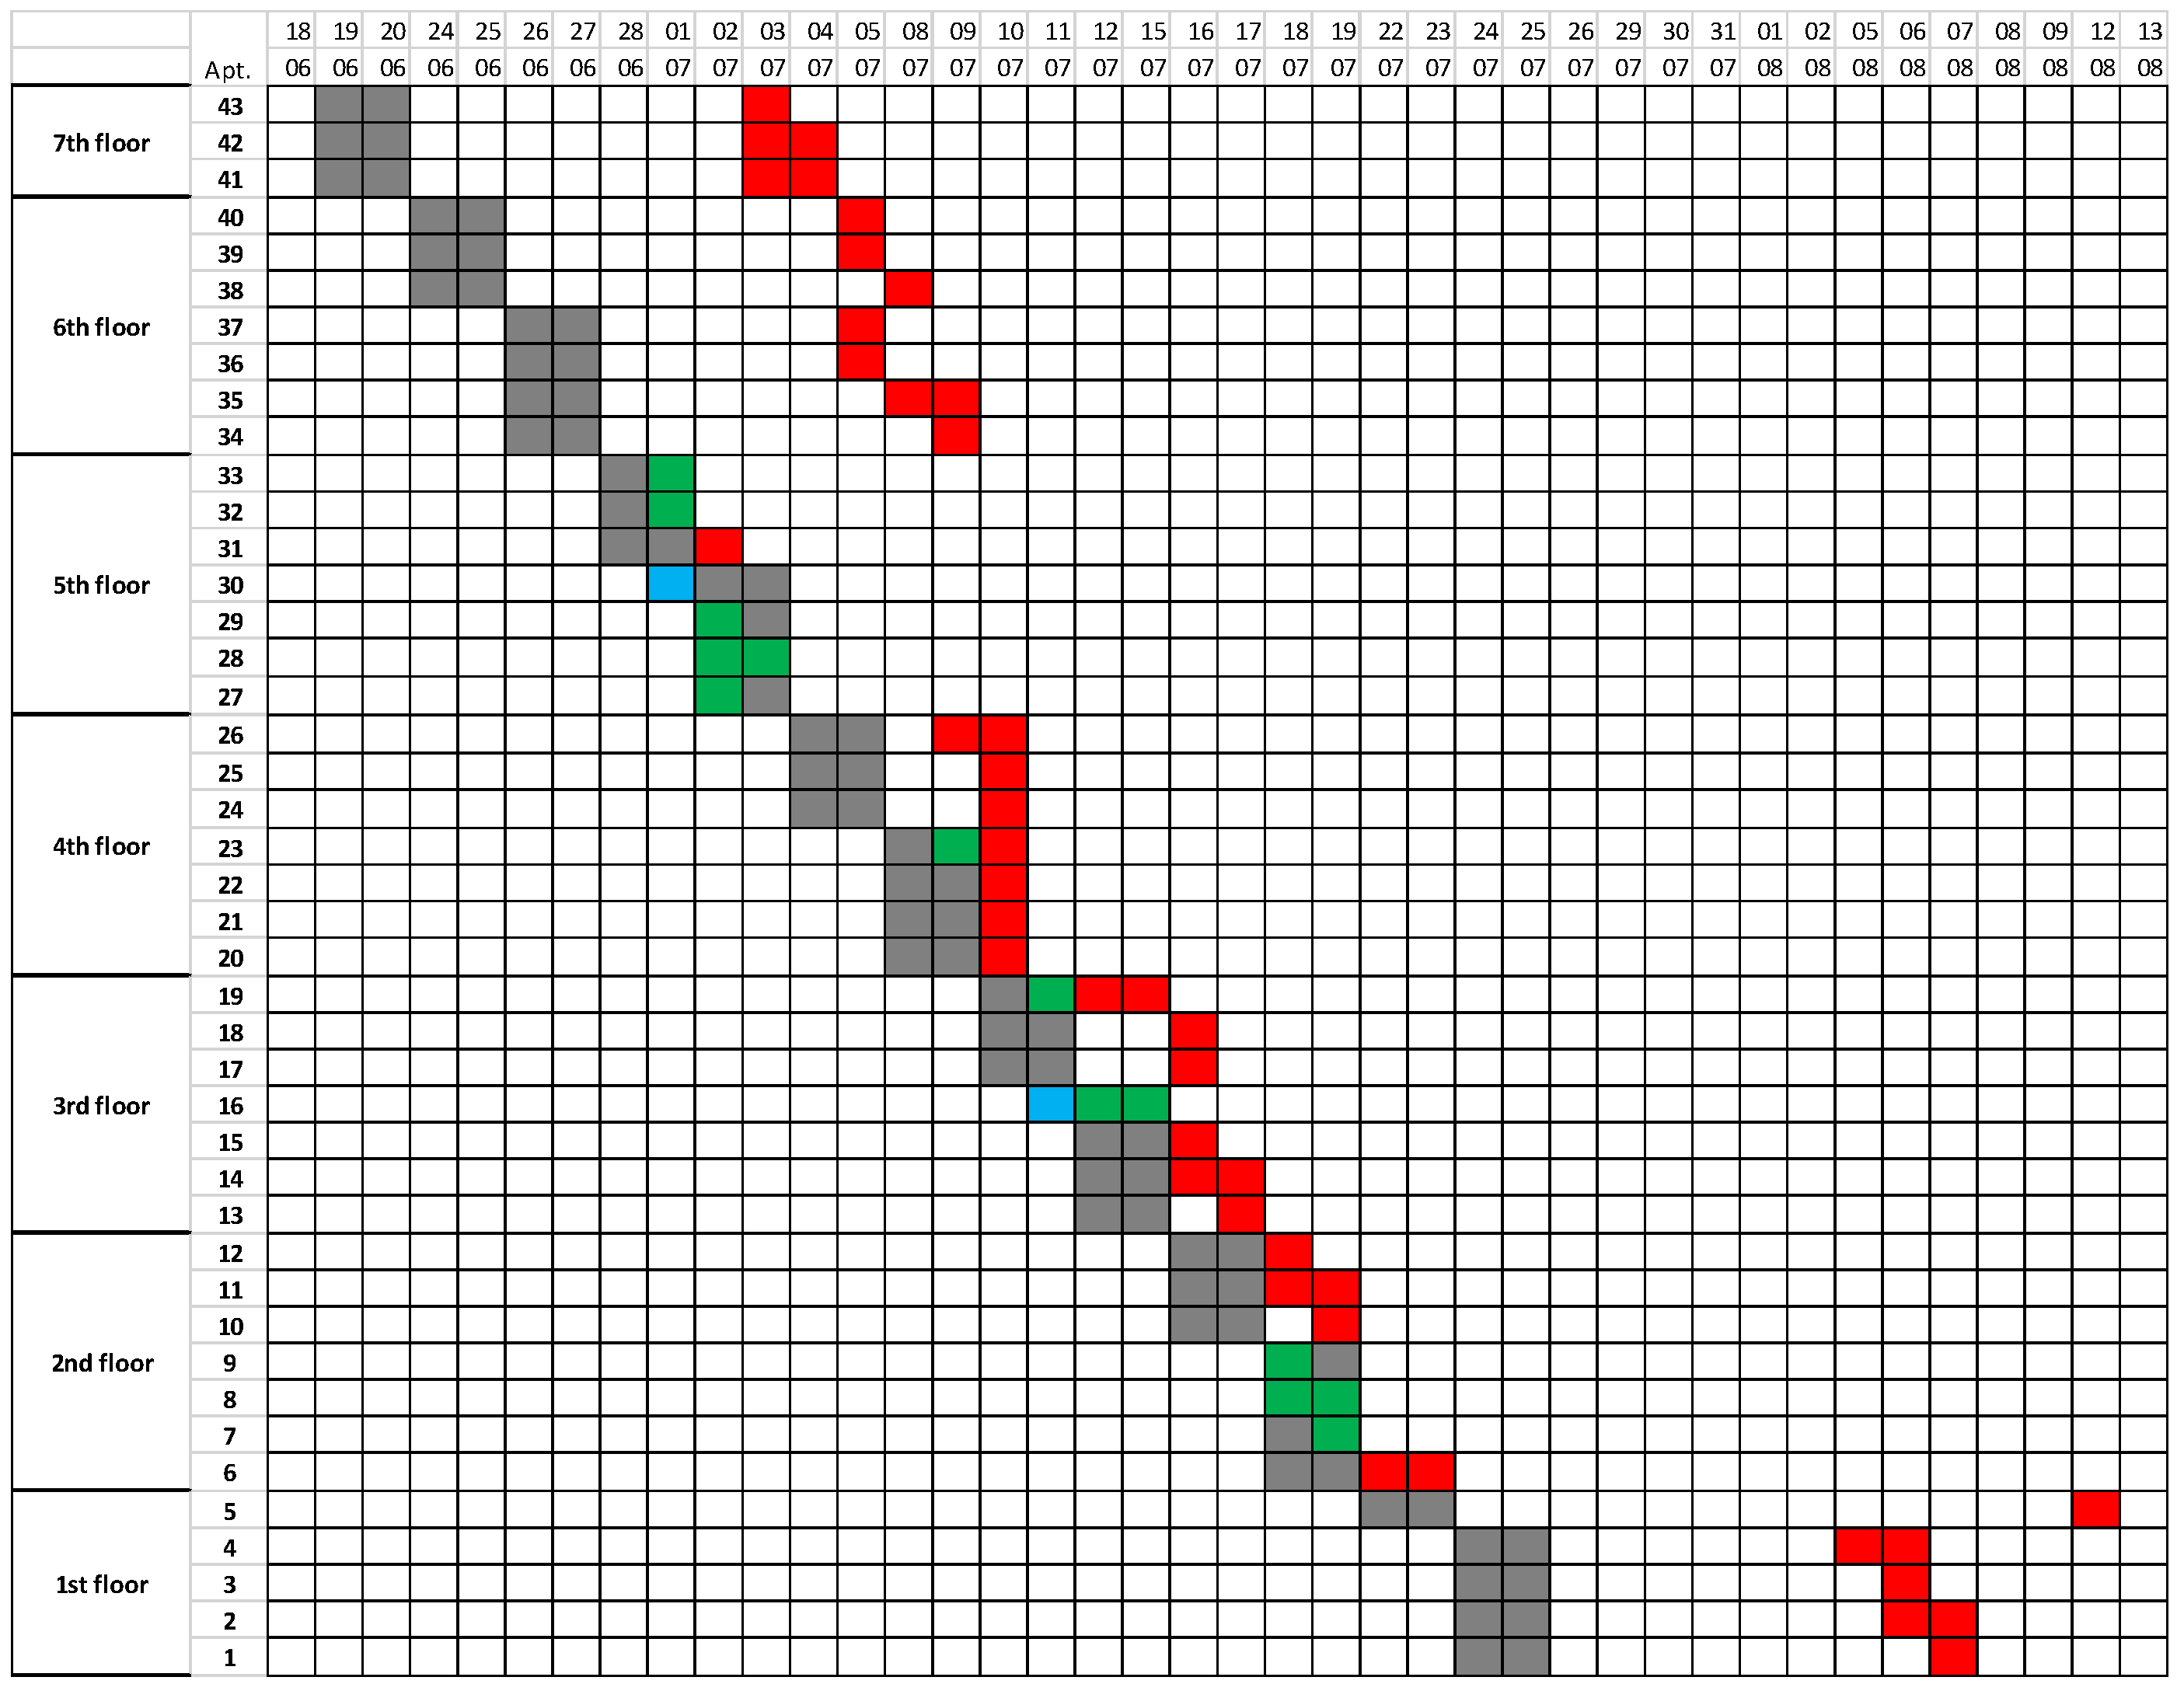
4.1.2. Digital Monitoring Form

The digital monitoring form was visually nearly identical to the paper version. The digital monitoring application was developed together with a software company and the application was tested and utilized by the researcher in the case construction site. In the manual model, the work step specific monitoring forms were in a physical file, whereas, with monitoring in digital form, the apartment and work step for the entry were selected in the application, which is shown in Figure 7. Each work step in the application had two buttons. One button was for editing incorrectly documented start and finish dates. The other button was for changing the status of the work step from not started to in-progress to finished. In the digital model, changing the status of a work step to incomplete or finished automatically recorded the time when the change was made in the spreadsheet. This innovation made as-built to as-planned comparison in the spreadsheet possible.
The digital monitoring form was faster to use than the paper form and the automatically updating spreadsheet made it possible to instantly analyze monitoring data for the needs of task management. Also, eliminating double manual entries (paper and spreadsheet) reduced the possibility of mistakes. Digital data collection also clearly demonstrated that the implementation of the takt production was not proceeding fully as planned and, for example, some work steps were deviating from the schedule and some work steps did not follow the planned order of progression.
Because there were a lot of small rooms in the site, automatic collection of realization data would have required hundreds of cameras positioned in static places. This would have been expensive considering the size of the project, and it would have required negotiations with workers regarding the placement of static cameras everywhere in the working environment. Hence the collection of data was not automated in the digital model either.

5. Discussion

The methods developed in the case site for the monitoring of the takt production model are considered in this discussion section. Based on the case project, establishing a takt production status can be achieved by digital takt scheduling and manually filling out a digital monitoring form, both in the same format. This method allows for the comparison of the takt schedule and the realization data, which also makes it possible to automatically analyze data in a clear form for the needs of takt production task management. The digital method is particularly suited for projects with a lot of repetition, as is takt production per se [1]. The method is most suitable for repetitive projects, since then there is no need to define separate work packages and work steps for each construction zone, but a chain of highly-detailed work steps designed for one construction zone can be copied to other similar construction zones. Creating a detailed digital takt plan can also create a template for digital takt monitoring. This finding of utilizing digital takt monitoring in this manner adds to the notion by Dlouhy et al. [7], that detailed takt production planning simplifies progress monitoring during execution.

5.1. The Takt Production Model Requires Systematic Production Monitoring

In takt production planning, the production is distinctly divided into takt areas and work packages (e.g., [2]). It is thus suitable to monitor takt production based on these divisions. Breaking down takt production into both locations and work packages makes it possible to compare the takt schedule and production realization by both construction zone and work package. According to Pierce [5] and Mubarak [4], one challenge in monitoring construction production progress is often the ambiguity of the progress status of tasks. Based on the case project, precisely defined work packages and takt areas offer two clearly monitorable units of analysis for monitoring the progress of takt production.
Illustrating takt production progress in percentages is simple, if the work steps in work packages have been clearly defined in the schedule. In such cases, the progress of the takt production is examined by comparing the number of work packages that have been completed acceptably with the total number of work packages in the plan. Clearly defined work packages make task progressions comparable, which simplifies the systematic documentation and quantification of the progress of takt areas. The progress of the takt production can be reviewed, on the same basis, by takt areas, by work packages or for the entire takt production. When presented like this, each takt area, the work steps included in each takt, and each work package can be examined through actualized percentages (Figure 8). This finding provides an alternative, innovative solution to the one introduced by Dlouhy et al. [2] that during daily takt meetings construction progress should be documented on detailed level. This approach is novel and could potentially be utilized as a part of the Last Planner System’s Percent Plan Complete plan reliability indicator in takt production projects.
This comparison permits, for example, innovatively highlighting task by task those construction zones that are most late or most critical, as shown in Figure 9. In Figure 9, each work package contains one or more work step, the progress of which is monitored in takt production. The work steps included in the work packages are numbered 1 to 6. The green work steps have been completed. The red work steps have not been completed and are late. The white work steps will be completed in the present takt or in the future. The lower half of the figure visualizes the objective, the status, and the missing prerequisite work steps for the current date (takt 3). This procedure helps foremen to recognize the most critical jobs and areas on that particular day and pay particular attention to them. In addition, digital analysis enables for example the examination of the realization of task prerequisites trade by trade. Thus, the foreman can inspect in which construction zones work can begin immediately. Based on the literature review, a takt production monitoring and control model like this has not been previously developed. However, Alhava et al. [32] have somewhat similarly recommended utilizing a matrix to visualize the current status of the tasks in takt production monitoring. Furthermore, in non-takted construction, Kenley & Seppänen [19], have similarly proposed documenting the progression of tasks and locations in a matrix form. In different situations, there may be different needs for visualized information. Figure 9 is a rough example of such illustration, but may need further refinement. As long as the data is available in a digital form, there are numerous ways to filter and visualize it for different situations.

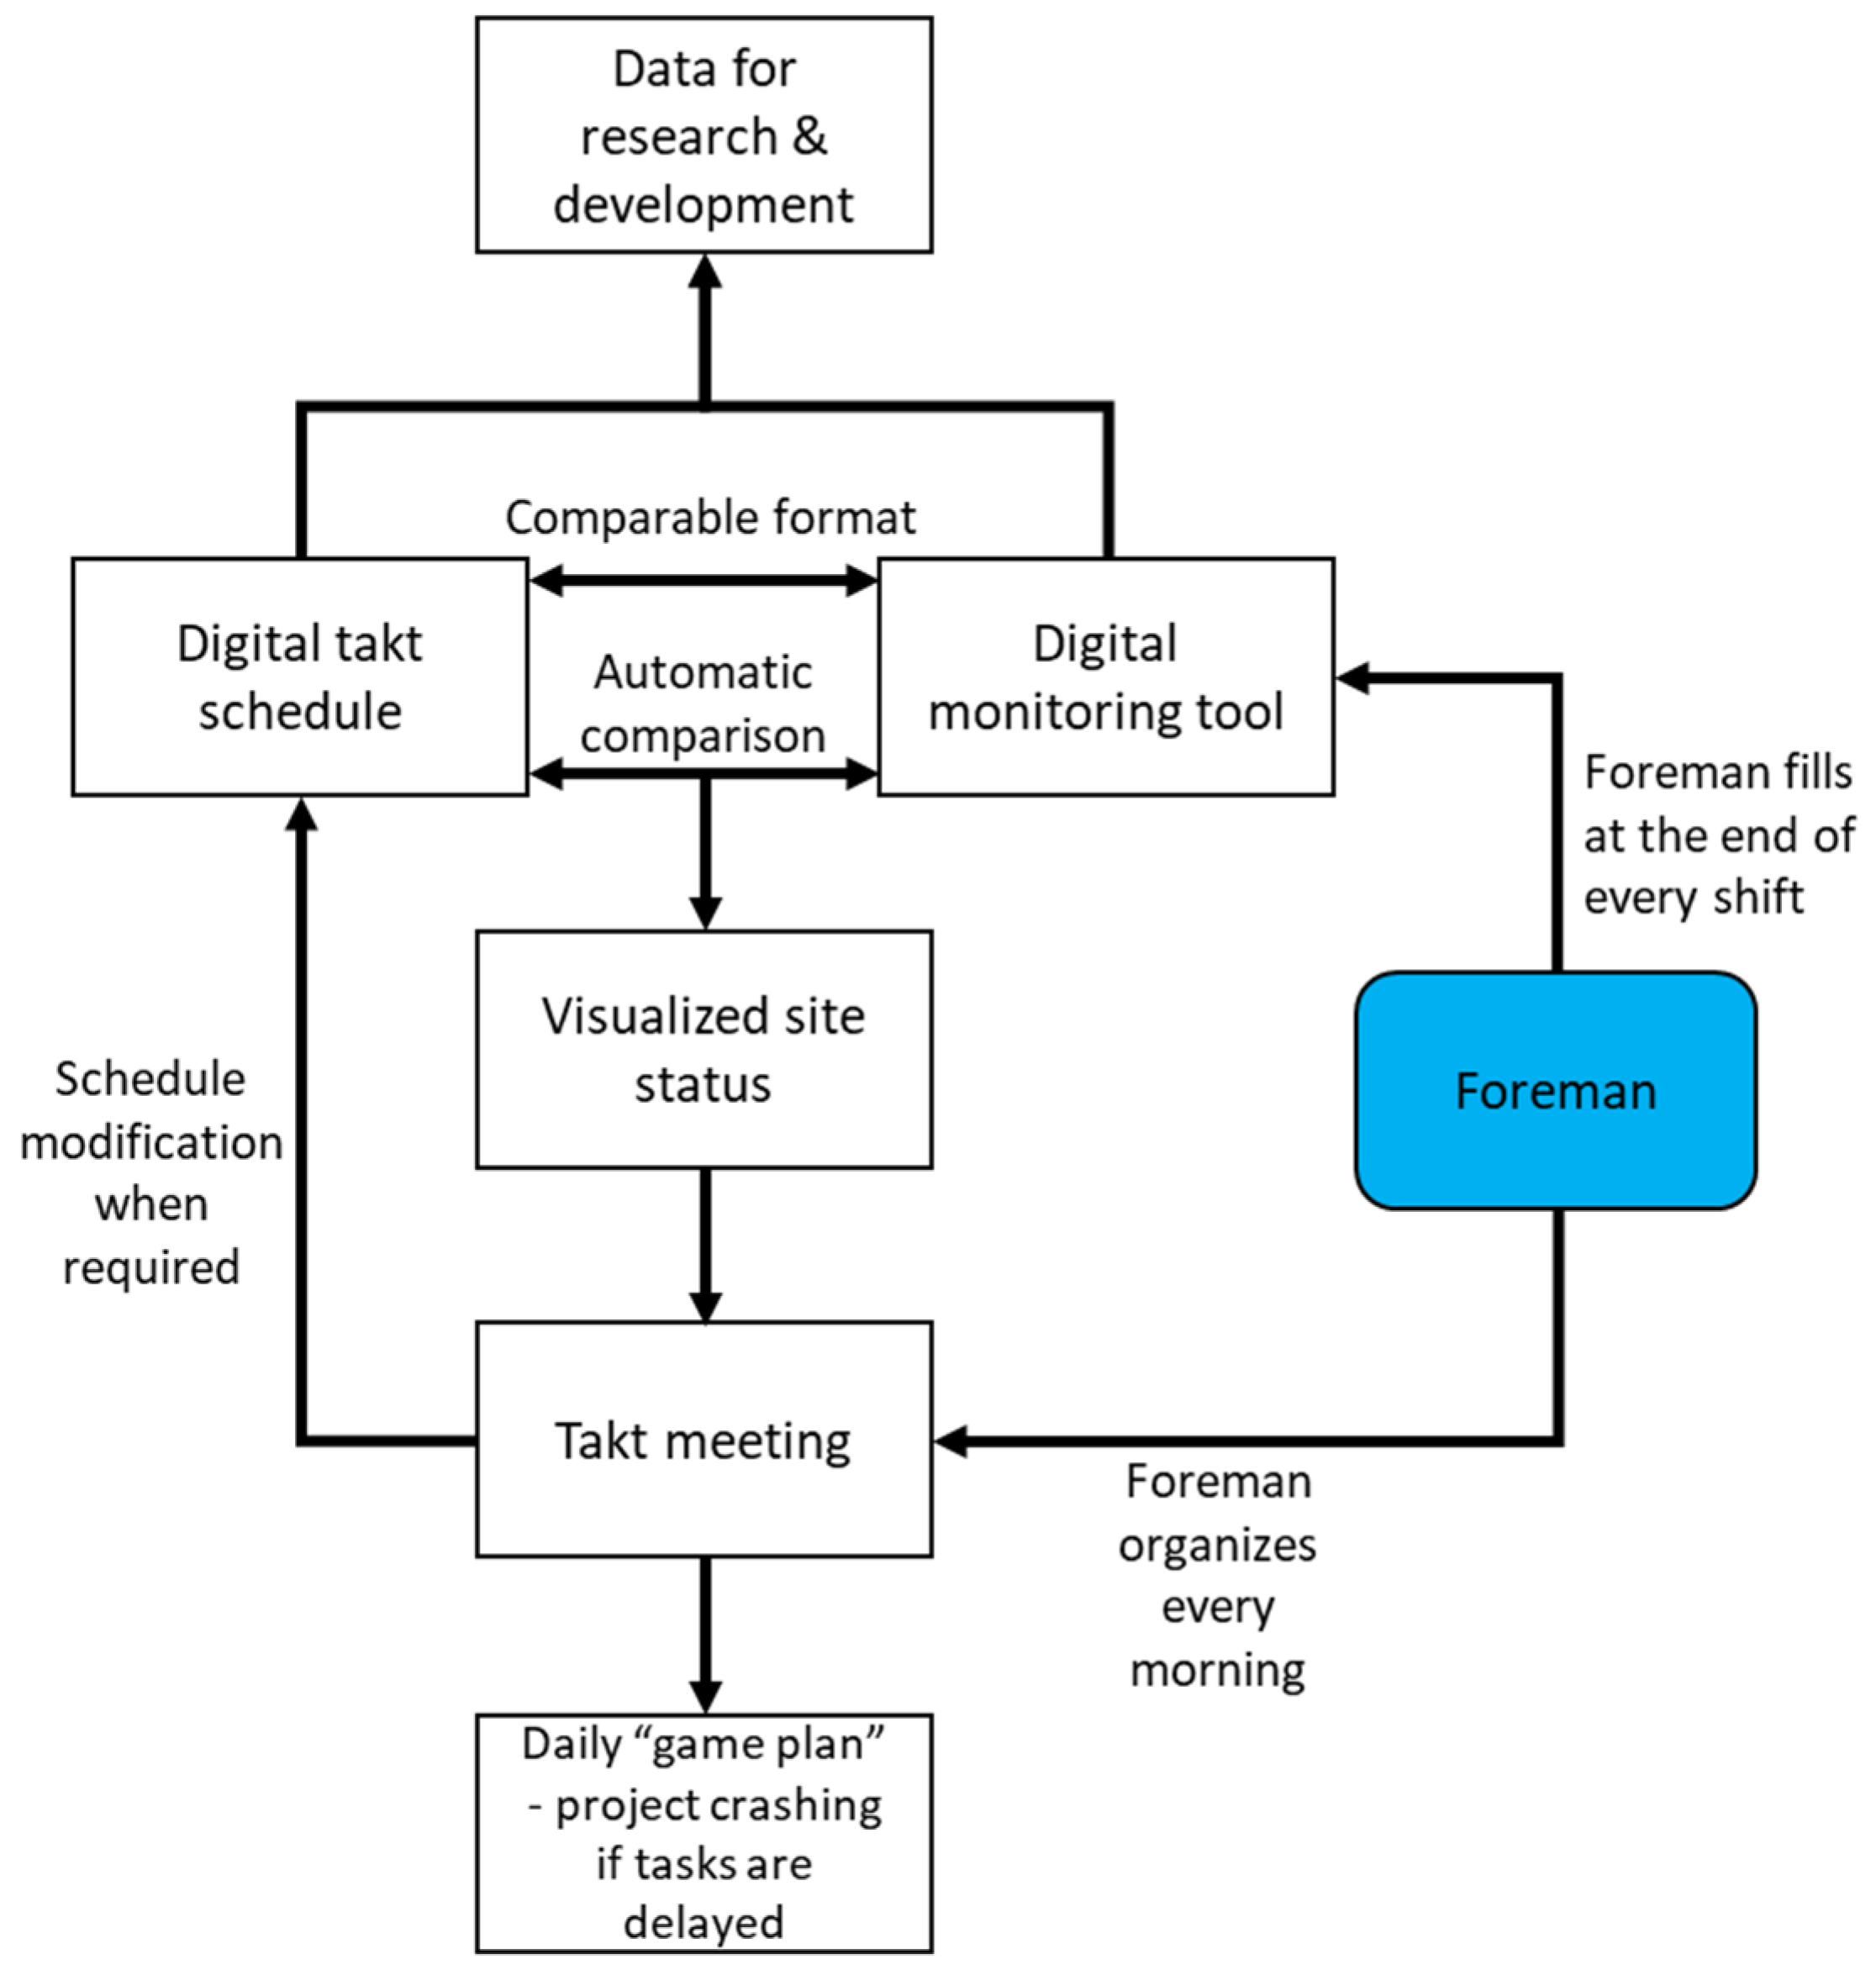
5.2. A Semi-Automatic Takt Production Monitoring Model

There was no attempt to automate the collection of the realization data in the case site, particularly as a 3D model had not been drawn up of the project. Based on the experiences gained in the case site, the monitoring and control of a work site should be organized so that the processing of collected production realization data is done automatically, but the collection of realization data is done by the main contractor’s foremen with a mobile device, such as a tablet. This is a novel finding based on the literature.
Alhava et al. [32] have somewhat similarly proposed that the collection of the takt production realization data should be carried out by the trade partners’ foremen and workers with a mobile application. However, according to Alhava et al. [32], the utilization rate for the application has been very low in their case project. Based on the case of this study, the data collection is recommended to be carried out by the main contractor’s foremen. This way, the foremen are motivated to go and see the construction site often and to pay attention to the task progressions in detail, while documenting the progression. Furthermore, this helps the foremen detect errors in the takt plan.
Based on the case site of this study, managing takt production with a short takt time requires more active production management. In takt production, there is little time to react to production disturbances, as certain work packages must be completed during each takt. Similar results have been presented by Andersen & Fyhn [33] and Lehtovaara et al. [6]. Furthermore, according to Lehtovaara et al. [26], an increased amount of effort in planning, control, continuous improvement, and management of the supporting conditions are needed for takt production to succeed.
Because of this, daily management of takt production is recommended. This daily management needs to be based on a visualized and realistic status of the work site and handing over work packages from trade to trade in a controlled way. Similar claims have been made by Frandson et al. [10]. Daily production monitoring keeps takt production manageable, as disturbances and production progress documentation are not allowed to accumulate into unmanageable magnitude. This supports Mubarak’s [4] observations regarding the challenges caused by general construction production monitoring done too infrequently.
Based on the comprehensive production monitoring implemented in the case site of this study, the progress monitoring should be done digitally with a mobile device, if automatic monitoring is not viable. Thus, the collected realization data from the takt areas can be automatically analyzed and data management does not strain the foreman too much. With the collected realization data, the site status and daily plan of operation can be demonstrated in the takt meetings that are held with workers every morning. Status data based on realization must be presented in a clear and simplified form, as showing all information at once is too straining [5].
The literature review presents ways of automated data collection, for example with the help of RFID or the comparison of a 3D model and actual snapshots [20]. Based on the case site of this study, it is difficult to say how well the current methods of automated data collection work in apartment renovation projects like the case site, where the majority of works is interior work in apartments and there are hundreds of apartments and rooms to monitor.
One benefit from comprehensive documentation of work realization is that it makes it possible to examine the implementation of the takt production plan afterwards. Subsequent examination enables the development of the production model, for example. Based on the results from the case site of this study, far too little information is currently collected from production for it to be possible to truly develop the takt production model based on data. In the context of production realization, the development is almost solely based on recollections, conversations between people, and opinions, though conversations are, indeed, an important part of production management and can help with the development to an extent. Based on the literature, this is a novel finding in the context of takt production.
The method for production monitoring and control presented and proposed in this discussion section is summed up in Figure 10. In the model, the foreman does a site walk-around at the end of each work day and documents the situation of the work steps into a digital application. The application compares the entries and the schedule automatically and produces analyzed data for production management and the development of production in an easily comprehensible format. The application contains the work steps of each work package on such a level of detail that they can be unambiguously seen and understood from the application. The takt schedule has been drafted on the same level of detail by defining the order of each work package and work step in the takt production work sequence, i.e., the takt production chain of work packages. This way the digital monitoring form and the drafted takt schedule contain the same work steps for uniform analysis.
Even if the processing of production realization monitoring data was automated, from the point of view of task management it is still essential that foremen do site walk-arounds. Active communication in the site is an important part of production management. Monitoring the realization of the production alone is not enough. A foreman cannot get a clear picture of the current state of the production without speaking with those carrying out the work. Production monitoring may show where production challenges appear, but it does not automatically diagnose problems. By being on the work site, the foreman can observe the quality of work in a more versatile manner than from a digital 3D model (e.g., filling in small dents in walls or testing adequate tensile strength). In the end, it is the worker level that does the corrective actions, but workers are not necessarily motivated to solve problems, particularly if they are not included in decision-making [5]. The observations made in the case site of this study support these findings. Regardless, even a fully automated method would require the presence of the foreman.

6. Limitations

This study examined takt production in construction, which is a new phenomenon in the field, based on a literature review and one case site. As the topic is a new one and there was just one case, this study has clear limitations. Because of the novelty of the subject, little information has been published regarding takt production in construction, and an even smaller share of it is peer-reviewed. The majority of publications concerning takt production in construction are conference papers and information in them is somewhat scattered. Similarly, a broader, comprehensive work on the monitoring and control of takt production is lacking. This caused challenges in comparing the matters observed in the case site of this study to information in literature, especially in the context of takt production.
The results of this study are based on one case site. The methods of forming a situation picture in a takt production were developed in the study from scratch during the case site production and partly retrospectively. Thus, it has not yet been possible to try out the methods at full capacity. Also, the case site production did not adhere completely according to the takt schedule, which complicated the piloting of the monitoring and control method particularly suitable for takt production.
The focus of this study was the interior phase of a medium-sized apartment building project, the likes of which can contain several hundreds of apartments and rooms, due to which automated image-based monitoring is difficult to implement. The results of the study can partly be applied also to new housing construction.

7. Conclusions

Based on this study, it can be said that there are clear information gaps regarding the monitoring and control of takt production in construction. This study has sought solutions to them. In the monitoring and control of medium-sized renovation projects, and particularly in projects where small spaces are refurbished, a fully automated model cannot be used. Instead, realization data must be collected manually. The collection of data regarding production realization must be done manually, as based on the literary review, automated data collection requires building information modeling (BIM), and placing cameras in hundreds of rooms is not a realistic solution. In addition, the foreman must go around the site in any case to observe the status of the production. The foreman cannot get a clear picture of the current state of the production without personally making observations and speaking with those carrying out the work. The use of a digital application installed on a mobile device is recommended for manually collecting production realization data. Data processing should be done automatically. To be able to automatically process manually collected data, the collected data and the schedule must be comparable in content and form. For this reason, also takt planning should be done digitally.
Based on literature, a standardized, detailed, and repetitive takt plan provides the foundation for a well-flowing construction project. Based on this study, a standardized, digitalized, and highly frequent takt monitoring process provides a realistic method for adhering to and developing the demanding takted processes. Innovative means to document, visualize, and quantify the highly repetitive and detailed takt production status was provided in this study, as well as a method for realistically keeping the status updated daily by the foremen. The proposed method innovatively optimizes the takt monitoring process, by automating the data processing and visualization and encouraging the foremen to visit and inspect the construction site often.
Documenting production realization data digitally offers more possibilities for takt production steering. An automatically analyzed, visualized, and detailed status makes it possible to discuss problematic aspects of the production in site meetings. This helps the foremen make decisions based on actual detailed site status rather than relying on memory. This status information can also be shared with subcontractors and workers via mobile phone or e-mail. It also motivates the foremen to visit and inspect the construction site in detail daily. In addition, comprehensive realization data enables the development of the takt production model afterwards, for example, by a separate development team. Digital data collection demonstrated that the takt production in the studied case site had not been implemented fully as planned. Comprehensive realization data can also be useful for reclamations and identifying root causes for deviations. Furthermore, it can be utilized as a status report for the client. In summary, the proposed takt production monitoring method provides a versatile structure for data-based management and continuous process improvement in practice.
The proposed method of digital monitoring system should be developed further, for example, by investigating the production management needs of the foremen in takt production projects. More uses for the gathered digital information should be introduced. For example, status visualizations, information transfer, and key performance indicators could be further considered. Based on the challenges in the case site of this study, studying just a digital tool is not enough: a construction production system suitable for takt production must be researched and developed comprehensively. Further research is needed regarding, for example, a subcontracting process and subcontracting agreements suitable for takt planning, the takt production planning process, and takt production management.

Author Contributions

Conceptualization, K.K., A.S. and J.-M.J.; methodology, K.K. and A.S.; validation, K.K.; formal analysis, K.K.; investigation, K.K.; data curation, K.K.; writing—original draft preparation, K.K.; writing—review and editing, K.K., A.S. and J.-M.J.; visualization, K.K.; supervision, A.S.; project administration, A.S. All authors have read and agreed to the published version of the manuscript.

Funding

This research was funded by European Social Fund, Programme for sustainable growth and jobs 2014-2020, EURA 2014/4288/09 02 01 01/2016/HÄMELY (RAKSAVIRTAA Project).

Informed Consent Statement

Not Applicable.

Data Availability Statement

The data are not publicly available due to data confidentiality resulting from the requirements of the accreditation.

Conflicts of Interest

The authors declare no conflict of interest.

References

  1. Haghsheno, S.; Binninger, M.; Dlouhy, J.; Sterlike, S. History and theoretical foundations of takt planning and takt control. In Proceedings of the 24th Annual Conference of the International Group for Lean Construction (IGLC 24), Boston, MA, USA, 20–22 July 2016. [Google Scholar]
  2. Dlouhy, J.; Binninger, M.; Oprach, S.; Haghsheno, S. Three-level method of Takt planning and Takt control—A new approach for designing production systems in construction. In Proceedings of the 24th Annual Conference of the International Group for Lean Construction, Boston, MA, USA, 20–22 July 2016. [Google Scholar]
  3. Binninger, M.; Dlouhy, J.; Haghsheno, S. Technical takt planning and takt control in construction. In Proceedings of the 25th Annual Conference of the International Group for Lean Construction, Heraklion, Greece, 9–12 July 2017. [Google Scholar]
  4. Mubarak, S.A. Schedule Updating and Project Control. In Construction Project Scheduling and Control, 3rd ed.; John Wiley & Sons: Hoboken, NJ, USA, 2015. [Google Scholar]
  5. Pierce, D.R., Jr. Monitoring and Controlling the project. In Project Scheduling and Management for Construction; John Wiley & Sons: Hoboken, NJ, USA, 2013. [Google Scholar]
  6. Lehtovaara, J.; Mustonen, I.; Peuronen, P.; Seppänen, O.; Peltokorpi, A. Implementing Takt Planning and Takt Control into Residential Construction. In Proceedings of the Annual Conference of the International Group for Lean Construction, Dublin, Ireland, 3–5 July 2019. [Google Scholar]
  7. Dlouhy, J.; Oprach, S.; Binninger, M.; Richter, T.; Haghsheno, S. Using takt planning and takt control in production projects–comparision of construction and equipment phases. In Proceedings of the 26th Annual Conference of the International Group for Lean Construction, Chennai, India, 18–20 July 2018. [Google Scholar]
  8. Keskiniva, K.; Saari, A.; Junnonen, J.-M.J. Takt planning in apartment building renovation projects. Buildings 2020, 10, 226. [Google Scholar] [CrossRef]
  9. Toimiva Työmaa—Hyvät Käytännöt. Available online: https://www.rakennusteollisuus.fi/globalassets/julkaisuja/toimiva_tyomaa_2014.pdf (accessed on 22 August 2020).
  10. Frandson, A.G.; Seppänen, O.; Tommelein, I.D. Comparison between location based management and takt time planning. In Proceedings of the 23rd Annual Conference of the International Group for Lean Construction, Perth, Australia, 29–31 July 2015. [Google Scholar]
  11. Frandson, A.; Berghede, K.; Tommelein, I.D. Takt time planning for construction of exterior cladding. In Proceedings of the 21st Annual Conference of the International Group for Lean Construction (IGLC 21), Fortaleza, Brazil, 31 July–2 August 2013. [Google Scholar]
  12. Harris, F.; McCaffer, R. Modern Construction Management, 7th ed.; John Wiley & Sons: Hoboken, NJ, USA, 2013. [Google Scholar]
  13. Project Management Institute. A Guide to the Project Management Body of Knowledge (PMBOK® Guide), 5th ed.; Project Management Institute: Newton Square, PA, USA, 2013. [Google Scholar]
  14. Hegazy, T.; Abdel-Monem, M.; Saad, D.A. Framework for enhanced progress tracking and control of linear projects. Eng. Constr. Arch. Manag. 2014, 21, 94–110. [Google Scholar] [CrossRef]
  15. Sears, S.K.; Sears, G.A.; Clough, R.H.; Rounds, J.L.; Segner, R.O. Project scheduling applications. In Construction Project Management—A Practical Guide to Field Construction Management, 6th ed.; John Wiley & Sons: Hoboken, NJ, USA, 2015. [Google Scholar]
  16. Baldwin, A.; Bordoli, D. Planning and Scheduling Practices. In Handbook for Construction Planning and Scheduling; John Wiley & Sons: Hoboken, NJ, USA, 2014. [Google Scholar]
  17. Eriksson, P.E.; Westerberg, M. Effects of cooperative procurement procedures on construction project performance: A conceptual framework. Int. J. Proj. Manag. 2011, 29, 197–208. [Google Scholar] [CrossRef]
  18. Chan, A.P.; Chan, A.P. Key performance indicators for measuring construction success. Benchmarking Int. J. 2004, 11, 203–221. [Google Scholar] [CrossRef]
  19. Kenley, R.; Seppänen, O. Location-Based Management for Construction: Planning, Scheduling and Control; Routledge: London, UK, 2010. [Google Scholar]
  20. Navon, R.; Sacks, R. Assessing research issues in automated project performance control (APPC). Autom. Constr. 2007, 16, 474–484. [Google Scholar] [CrossRef]
  21. Deng, H.; Hong, H.; Luo, D.; Deng, Y.; Su, C. Automatic Indoor Construction Process Monitoring for Tiles Based on BIM and Computer Vision. J. Constr. Eng. Manag. 2020, 146, 04019095. [Google Scholar] [CrossRef]
  22. Fang, Y.; Cho, Y.K.; Zhang, S.; Perez, E. Case study of BIM and cloud–enabled real-time RFID indoor localization for construction management applications. J. Constr. Eng. Manag. 2016, 142, 05016003. [Google Scholar] [CrossRef]
  23. Omar, T.; Nehdi, M.L. Data acquisition technologies for construction progress tracking. Autom. Constr. 2016, 70, 143–155. [Google Scholar] [CrossRef]
  24. Binninger, M.; Dlouhy, J.; Oprach, S.; Haghsheno, S. Methods for production leveling–transfer from Lean Production to Lean Construction. In Proceedings of the 24th Annual Conference of the International Group for Lean Construction, Boston, MA, USA, 20–22 July 2016. [Google Scholar]
  25. Kenley, R.; Harfield, T. Location Breakdown Structure (LBS): A solution for construction project management data redundancy. In Proceedings of the International Conference on Construction in a Changing World, Kandalama, Sri Lanka, 4–7 May 2014; pp. 4–7. [Google Scholar]
  26. Lehtovaara, J.; Seppänen, O.; Peltokorpi, A.; Kujansuu, P.; Grönvall, M. How takt production contributes to construction production flow: A theoretical model. Constr. Manag. Econ. 2021, 39, 73–95. [Google Scholar] [CrossRef]
  27. Dlouhy, J.; Binninger, M.; Oprach, S.; Haghsheno, S. Mastering complexity in takt planning and takt control—Using the three level model to increase efficiency and performance in construction projects. In Proceedings of the 26th Annual Conference of the International Group for Lean Construction, Chennai, India, 18–20 July 2018. [Google Scholar]
  28. Lewin, K. Action Research and Minority Problems. J. Soc. Issues 1946, 2, 34–46. [Google Scholar] [CrossRef]
  29. Ottosson, S. Participation action research—A key to improved knowledge of management. Technovation 2003, 23, 87–94. [Google Scholar] [CrossRef]
  30. Stephens, J.; Barton, J.; Haslett, T. Action Research: Its History and Relationship to Scientific Methodology. Syst. Pract. Action Res. 2009, 22, 463–474. [Google Scholar] [CrossRef]
  31. Customized Takt Production Monitoring Software for the Case Project; Alpha Version of the Mobile Application Software; Not Available Publicly; Mestamaster, Inc.: Turku, Finland, 2019.
  32. Alhava, O.; Rinne, V.; Laine, E.; Koskela, L. Can a Takt Plan Ever Survive Beyond the First Contact with the Trades On-Site? In Proceedings of the Annual Conference of the International Group for Lean Construction, Dublin, Ireland, 3–5 July 2019. [Google Scholar]
  33. Andersen, L.; Fyhn, H. Organisational and cultural preconditions for extending the use of takt time planning. In Proceedings of the Annual Conference of the International Group for Lean Construction, Dublin, Ireland, 3–5 July 2019. [Google Scholar]
Figure 1. An example of a vignette used in site monitoring [9].
Buildings 11 00092 g001
Figure 2. A takt schedule consists of takt areas, work packages and work steps included in the work packages (adapted from [27]).
Buildings 11 00092 g002
Figure 3. Layout of the studied case area. The case site included five apartment buildings that were refurbished in the order indicated by the blue boxes.
Buildings 11 00092 g003
Figure 4. Floor plan of a residential floor of the case site.
Buildings 11 00092 g004
Figure 5. Paper monitoring form used in the first building of the case project.
Buildings 11 00092 g005
Figure 6. Actual documented realization of the installation of water pipes in each bathroom in the third building compared to the takt schedule. The red cells are work steps completed late, blue ones are early, and green ones on time.
Buildings 11 00092 g006
Figure 7. The digital monitoring application used in the case project, translated from Finnish to English [31].
Buildings 11 00092 g007
Figure 8. The realization of the takt schedule can be examined by takt (vertically), by takt area (horizontally) and by wagons (diagonally). The green work steps in the work packages have been completed acceptably. The red work steps have not yet been completed.
Buildings 11 00092 g008
Figure 9. An example of illustrating late work packages and work steps in takt production.
Buildings 11 00092 g009
Figure 10. The takt production monitoring and control flow chart drafted based on observations in the case site of this study.
Buildings 11 00092 g010
Table 1. Takt work in the apartments in the case site.
Inside Apartments: Wet Room RenovationInside Apartments: Dry Room Renovation
DemolitionDemolition
Diamond drilling & cuttingDiamond drilling & cutting
Floor drain installationKitchen-living room plumbing, ventilation
Mesh reinforcement, floor heating & floor castRough concrete wall repair
Wall levelingLeveling
Bathroom riser duct encasementPainting
Water proofing & tilingLowered ceiling installation
Exposed water pipes installationFloor surface installation
(plumbing & ventilation)Door frames & doors installation
Suspended ceiling panelingBaseboard installation
Fitting & fixturesFittings & fixtures installation
Inside Apartments: Building Services Systems
Electrical casing & wiring (surface installation)
Electrical fixtures
Horizontal water pipes
Drainage: riser & horizontal installations (kitchen & bathroom)
Ventilation riser & horizontal installations (kitchen & bathroom)
Original radiators: detachment, flushing, painting, reattachment
Publisher’s Note: MDPI stays neutral with regard to jurisdictional claims in published maps and institutional affiliations.

