1. Introduction
Buildings are responsible for about 40% of global energy use, and usage is predicted to continuously grow further [
1]. For countries in which fossil fuels dominate energy supply, use in buildings directly leads to carbon emissions. In Kuwait, primary energy is almost entirely sourced from oil and gas reserves [
2]. With a hot desert climate, the energy demand for cooling dominates the country’s energy requirements due to extreme temperatures in summer [
3]. Air conditioning (AC) accounts for more than 60% residential energy use and more than 85% of peak load [
4]. Kuwait’s per capita energy consumption is among the highest globally; in 2014 for instance, the country’s per capita energy consumption was 15,591 kWh [
5], with buildings accounting for a massive 90% of the country’s electricity demand. Peak demand has also grown rapidly, and approximately doubled since 2000, to over 14 GW in 2020 [
6,
7]. Thus, it becomes very important to reduce energy consumption in buildings whilst providing comfortable and healthy indoor conditions. For this purpose, the Kuwaiti government has set a target to reduce buildings energy demand by 15% by 2030 [
8].
According to the Kuwaiti Ministry of Energy, in 2017 Kuwait had approximately 382,817 school students and 949 schools, which is the building type modelled in this paper [
9]. The average classroom is occupied by approximately 45 students. The classrooms are cooled by split systems, which provide cooling but no fresh air, relying on infiltration and windows for ventilation. This results in poor indoor air quality and high CO
2 levels [
10]. If the air change rate is increased by opening windows, then the air-conditioning system will consume considerably more electricity during peak summer conditions—an undesired consequence. A review of literature reveals that such a space conditioning strategy may be detrimental to the children’s health and educational performance.
A study by Myhrvold and Olesen [
11] investigated the ability of students to concentrate in 35 classrooms in Norway by measuring the students’ reaction times under various rates of ventilation. The study showed that by lowering the rate of ventilation per person from 12 to 4 L/s, students’ reaction times slowed by 5.4%. In Japan, it was established that by raising the rate of ventilation from 0.6 to 6 L/s, the students’ performance was enhanced by 5.5% [
12]. Furthermore, Wargocki et al. [
13] and Wargocki et al. [
14] investigated how the rate of ventilation affects the performance of ten-year-old school children carrying out similar tasks. They established that by raising the ventilation rate to 10 L/s from 5 L/s, there was a 15% improvement in the school’s work performance and an identifiable improvement in the learning and performance of individual children. While there have been several studies on classrooms in hot climates, almost all of these have been in hot humid (tropical and subtropical) climates, which are not particularly relevant [
15] with few exceptions; for instance Al-Rashidi et al., [
16] found discrepancies between various comfort model predictions and actual sensations in mixed-mode classrooms with cooling.
Achieving high levels of comfort, energy efficiency and adequate ventilation in such climates is challenging, and these objectives are often compromised in practice [
17]. A study of different cooling approaches [
18] found that night ventilation could be effective, but had limitations compared to mechanical systems even in European climates.
This study focuses on thermal comfort, energy efficiency and indoor air quality (in terms of CO2) in Kuwaiti classrooms. Specifically, a wind tower solution is investigated in this work using computer simulation, with and without evaporative cooling and compared with the existing system for a case study classroom.
2. Wind Catchers
Natural ventilation designs can increase internal air speeds to improve thermal comfort in warm conditions, whilst also improving indoor air quality. Additionally, natural ventilation is passive with no direct energy demand. For centuries, traditional passive cooling wind catchers (also called wind towers, or badgirs in Iran) have been employed in hot areas of Eastern Asia and Middle East [
19,
20,
21]. It is called a wind catcher since it catches wind-driven air from outside a building from a higher elevation and forces it downwards into an indoor space. In this strategy a vertical shaft of height ranging between 2 and 20 m above the roof level of a building is utilized with openings inside the building level and at the top of the shaft [
22]. Traditional wind tower systems used both stack and wind forces to capture fresher air with minimal dust at a high level.
This strategy is proposed for hot and arid climatic regions that experience large daily temperature variation; high temperatures during the day and low temperatures at night [
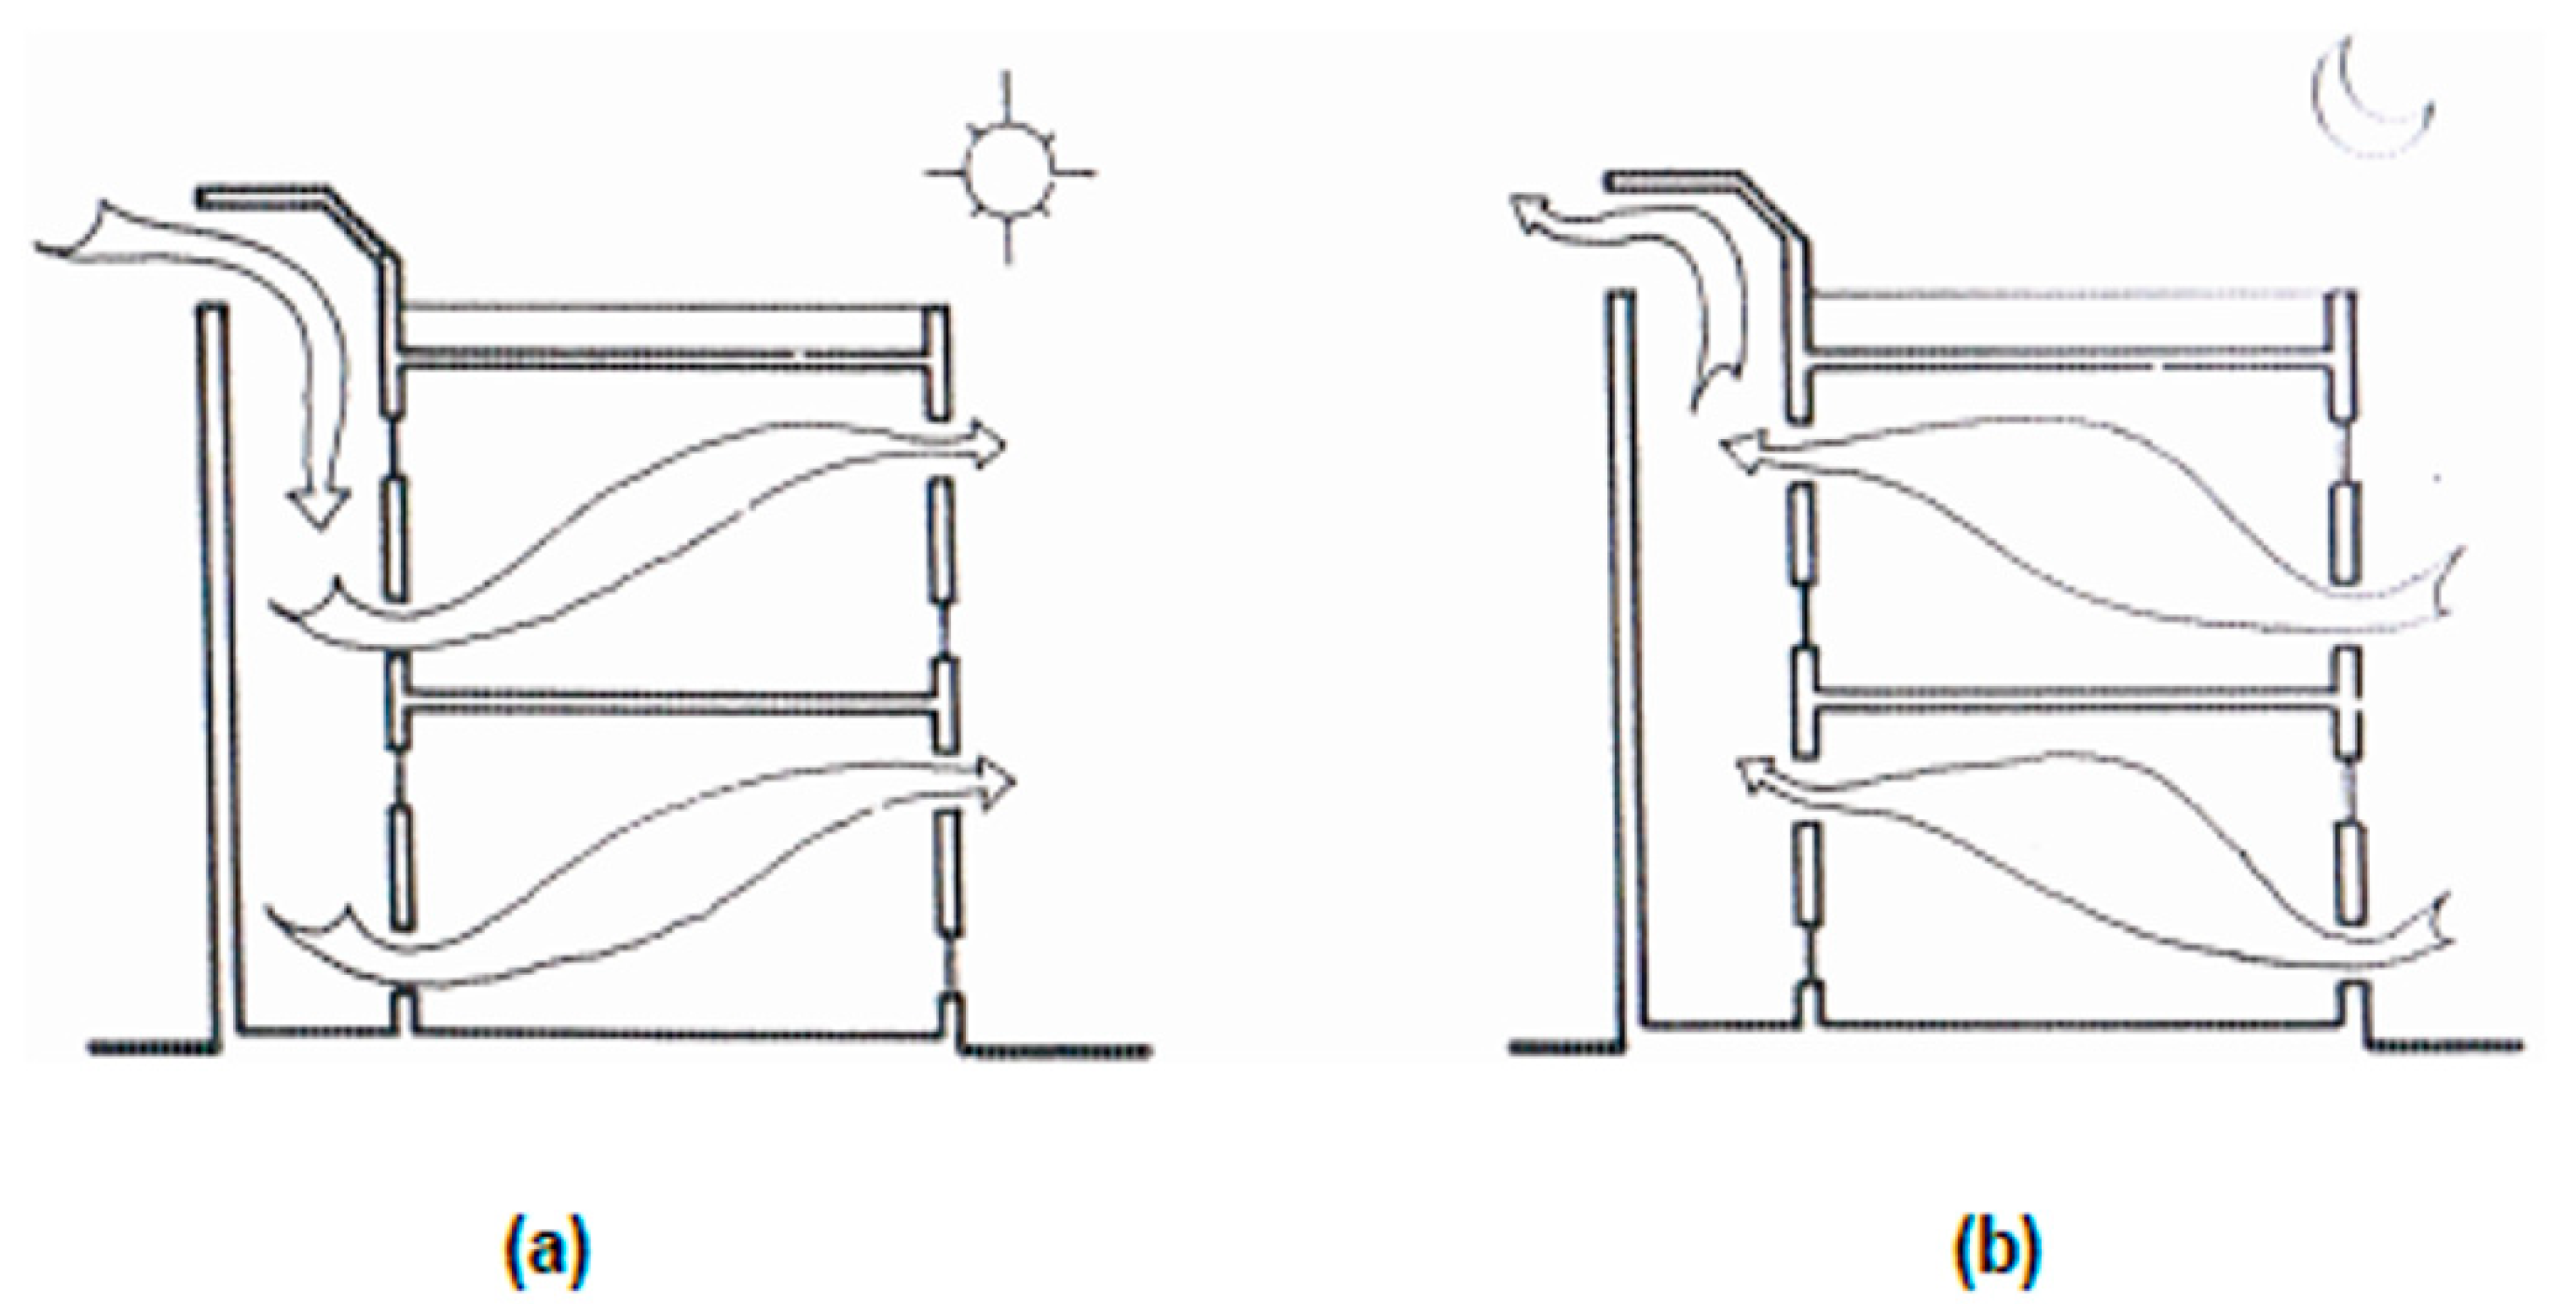
23]. There are many designs and configurations, which have evolved over centuries, as a result of local climate and needs. Larger buildings and even some houses have multiple wind catchers. In one configuration, a downward current is created in the morning when the walls of the catchers are still cool (reverse stack effect), so the air moves down and into the building (see
Figure 1a). Air is then expelled via the building outlet openings that may be found in the tower or may be positioned at the building level to promote air circulation [
23,
24]. At night-time, the tower and the now warm walls heat the indoor air, which rises by buoyancy [
25] and is expelled via the top openings in the tower [
23]; this is illustrated in
Figure 1b. Some wind catchers draw air through an underground tunnel, and include evaporative cooling [
21].
According to previous studies, factors that influence the performance of wind catchers include: (i) wind angle of incidence at the openings [
24]; (ii) location and size of the openings [
11] and finally (iii) the geometry of the tower; its height, shape and cross-sectional area [
27,
28]. For example, Elmualim et al. [
29] and Kolokotroni et al. [
30] showed that the performance of a wind catcher system is dependent on the direction and speed of the wind. They also showed that to achieve a maximum rate of air flow, the wind catcher design that has a single opening facing the direction of the wind was most effective. A computer simulation study was made for a house in Dubai with wind catchers [
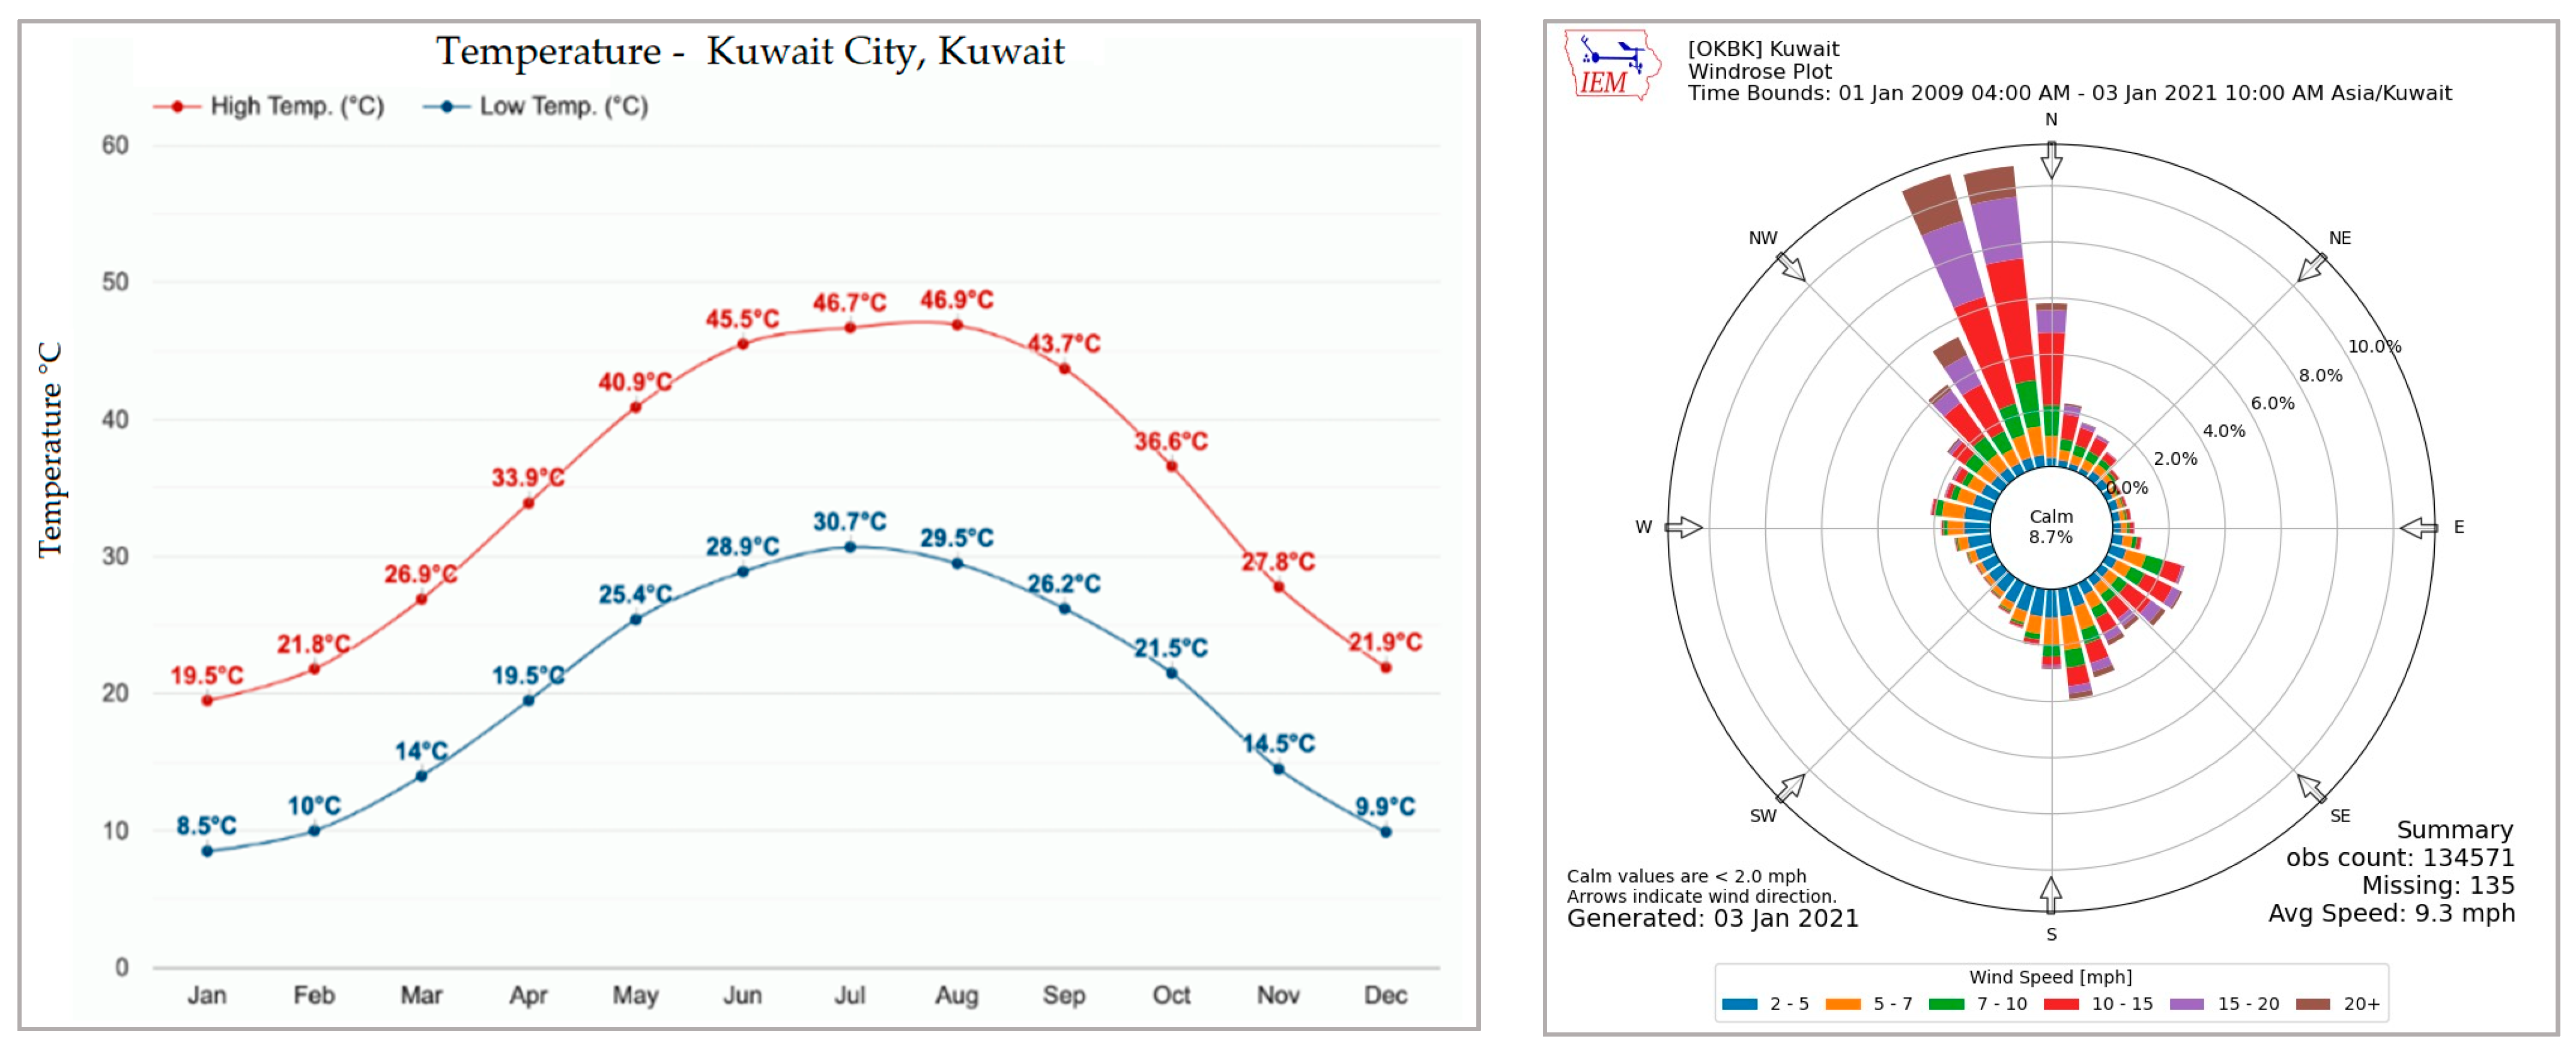
31]. Dubai is about 890 km south-east of Kuwait; it has slightly lower summer temperatures, but much higher humidity. This found that the height and cross-sectional area of the towers significantly affected air flows but had a small effect on internal temperatures. The authors found that adaptive comfort could almost be achieved, and noted “Each of the [three] towers works in at least six modes that provide more or less air in or out of the bases of the wind tower shafts…”, which illustrates the complexity involved. For Kuwait, the annual Windrose diagram is shown in Figure 2 (right). Clearly wind speeds in excess of 10 mph are observed in a consistent direction—indicating that wind driven ventilation designs (such as the wind catcher) may be employed in this part of the world.
Additionally, several technological improvements to the wind catcher can be made to provide improved thermal comfort [
24]. For instance, modern advanced wind catchers may include; (i) evaporative coolers like evaporative cooler pads at the tower top, wetted surfaces and columns in the tower [
22,
32] and at the bottom a pool [
27] intended to lower the temperature of indoor air and to raise the relative humidity of indoor air especially in hot areas; (ii) solar chimneys or collectors [
33], which enhance ventilation due to stack effect during periods of low winds and (iii) additional devices to increase airflow and hence air velocity in the space; for example fans powered by photovoltaic modules [
33]. Several experimental studies have reviewed the effectiveness of wind-towers and the results showed that they were effective at inducing indoor air movement [
34,
35,
36]. In addition, Sadafi et al. [
25] investigated the performance of wind tower strategy using Venturi-shaped roof in Malaysia, a hot and humid climate; they found that the system effectively induced air change rate and extraction flow rate in the room used for the experiment.
From the above-mentioned technological supplements to the wind catcher, evaporative cooling is perhaps the most common that allows providing much improved thermal comfort at the expense of some additional electricity. A downside is the reduced effectiveness of evaporative cooling as humidity increases. Additionally, the water evaporated may also increase humidity that can cause serious health concerns, such as the risk of Legionella. Therefore, for the geographic locations where humidity is high, or if the humidity is high at a certain time of the year, the evaporative cooling process will be ineffective. However, Kuwait has a hot and dry climate, thus making evaporative cooling a suitable technology to be considered.
There are numerous applications for direct evaporative cooling. For instance, Wachenfeldt et al. [
37] presented a passive downdraught evaporative cooling system with multiple wind catchers equipped with a water/vapour supply at the top of one wind catcher. While maintaining conditions near saturation along its entire length, consistent droplets of water fall down through the tower, allowing cool air to descend the tower. With successive differences in the density of air and within a local thermal imbalance, in this process, the water droplets evaporate. Consequently, the air moves from the top of the tower, from the high-pressure zone where the air is less dense and hot to the bottom of the tower, to a lower pressure zone where the air is denser and colder, with increased humidity.
Natural ventilation strategies based on wind force can provide well distributed and controllable indoor air movement with increased speed necessary in creating a cooling effect and hence human comfort indoors. Though not widely used in modern buildings or suitable for some types (such as high-rise), wind catchers can provide large volumes of air flow and hence high air changes. This is advantageous in providing safer internal environments with respect to the Covid-19 coronavirus, although the airflow pattern is also important [
38]. The next section provides a short background on suitable thermal comfort metric to assess naturally ventilated and air-conditioned buildings.
3. Thermal Comfort
How building occupants perceive comfort varies between individuals and how the building is operated. According to ASHRAE 55 2004 [
39], “Thermal comfort is the condition of mind that expresses satisfaction with the thermal environment and is assessed by subjective evaluation”. The most important parameters determining comfort are air and radiant temperatures, air velocity, metabolic rate and clothing, but there is large variation between individuals. Many different models have been devised to assess thermal comfort [
40,
41] however the most commonly used ones are the Fanger’s model, and the adaptive ANSI/ASHRAE standard 55 2017, and these were used in this study.
The Fanger model [
42] has two comfort indices, the predicted mean vote (PMV) and the predicted percentage of dissatisfied occupants (PPD). The PMV is the average vote of a group of occupants predicted by the model, based on the well-known ASHRAE seven-point vote scale from hot (3) through neutral (0) to cold (−3) [
39]. While widely used, this model is not applicable to buildings with natural ventilation systems, as in such buildings, the occupants can adapt to their environment [
43]. De Dear et al. [
44] show that occupants may physiologically adapt to their thermal environment resulting in the development of adaptive models, incorporated into the ANSI/ASHRAE standard 55 in 2004 [
43]. The expected indoor thermal comfort temperature that adapts to the outdoor dry bulb temperature is calculated using a linear relationship as follows (Equation (1)),
where
Tc is the predicted indoor thermal comfort temperature,
To is the outdoor reference temperature, a is the slope of the function, proportional to the degree of adaptation and b is the y-intercept.
The constants “a” and “b”, depend on empirical data gathered within a specific context, and related to the climatic conditions and cultural background, etc. The outdoor reference temperature is defined in the ANSI/ASHRAE 55 2017 standard [
45], as “prevailing mean outdoor air temperature”, defined by Equation (2) as:
where α is a constant (<1) and
Te(d−1),
Te(d−2), etc. are the daily mean external temperatures for yesterday, the day before, and so on. Since α < 1, this series puts greater weight on the temperature for days closer to the current day (a value of 0 produces just yesterday’s temperature, the “history” increases with α). A value of 0.8 is often used based on empirical studies, but the appropriate value depends on the variability of the climate. Lower values are used with more variable climate (corresponding to a more rapidly varying weighted mean), according to ASHRAE 55 Informative Appendix J, although this is not formally part of the standard. As Kuwait has a consistent summer climate with little day to day variation, a higher value of α would be more appropriate.
Within Kuwait, the above equation can be used to calculate the variation in prevailing mean outdoor air temperature. This is important as it would provide information on whether the ASHRAE standard is applicable for these weather conditions.
Figure 2 (left) shows the daily average maximum and minimum temperatures by month in Kuwait City, Kuwait. The monthly mean outdoor air temperatures range from 14 °C in January to 38.7 °C in July. Therefore, any adaptive model used should have a prevailing mean temperature that covers this range. In case of the ASHRAE adaptive model, the upper limit for the prevailing outdoor temperature limit is 33.5 °C. However, in Kuwait, from June to September the outdoor reference temperature is above this limit making the ASHRAE standard unsuitable for application in these hot months. Principally, for natural ventilation-based systems where the running mean temperature exceeds 33.5 °C, neither the Fanger PMV model, nor the ASHRAE adaptive model is eligible for application. Advisory Appendix J of the Standard states that “no specific guidance for such conditions is included in this standard”. The adaptive model is used here for the natural ventilation-based scenarios despite violation of the 33.5 °C limit. This is because there is evidence from field visits in other similar hot climates, which the comfortable indoor temperature may have a much larger acceptable range than what is acceptable according to the Fanger’s model. An example of this is the Indian IMAC model for adaptive comfort, which predicts comfortable indoor conditions even when Fanger’s PPD% is as high as 75% [
46]. For these reasons, and for the lack of a better choice, the adaptive model is used. Therefore, the results of this work must be considered with this limitation in mind. This does indeed highlight a knowledge gap that needs to be addressed for good building design in hot climates, especially considering that our world would be hotter towards the end of this century.
4. Methodology
The performance of various systems is measured in terms of thermal comfort and energy requirements. This is done using hourly building energy simulation with the DesignBuilder and EnergyPlus software, versions 5.4 and 9.1 respectively [
48]. The following scenarios are compared:
Scenario 1: Baseline, cooling with split unit, fresh air from windows only (typical current setup).
Scenario 2: Wind catcher based natural ventilation only, no cooling.
Scenario 3: Wind catcher with evaporative cooling.
In the above scenarios, the baseline captures the real-world typical conditions currently found in Kuwaiti classrooms. Scenario 2 replaces the AC with the wind catcher, but as it is not expected to fulfil the thermal comfort requirements in the extreme hot climate of Kuwait, Scenario 3 includes evaporative cooling as well. It should be noted that the scope of this study is limited to climatically similar locations as Kuwait. Thus, the engineering designs presented in this paper are applicable within this climatic scope, i.e., hot climate, varying humidity at different times of the year, high winds speeds throughout the year, with extreme hot temperatures during the summer season.
4.1. Baseline Modelling
The school studied is representative of schools in Kuwait and located in Ahmadi province in the Fahad-Alahmad Area, approximately 2.7 km east of the coast in the southern part of Kuwait City. The building consists of 24 classrooms, 4 teaching department offices and the principal’s office, with a total area of approximately 2500 m
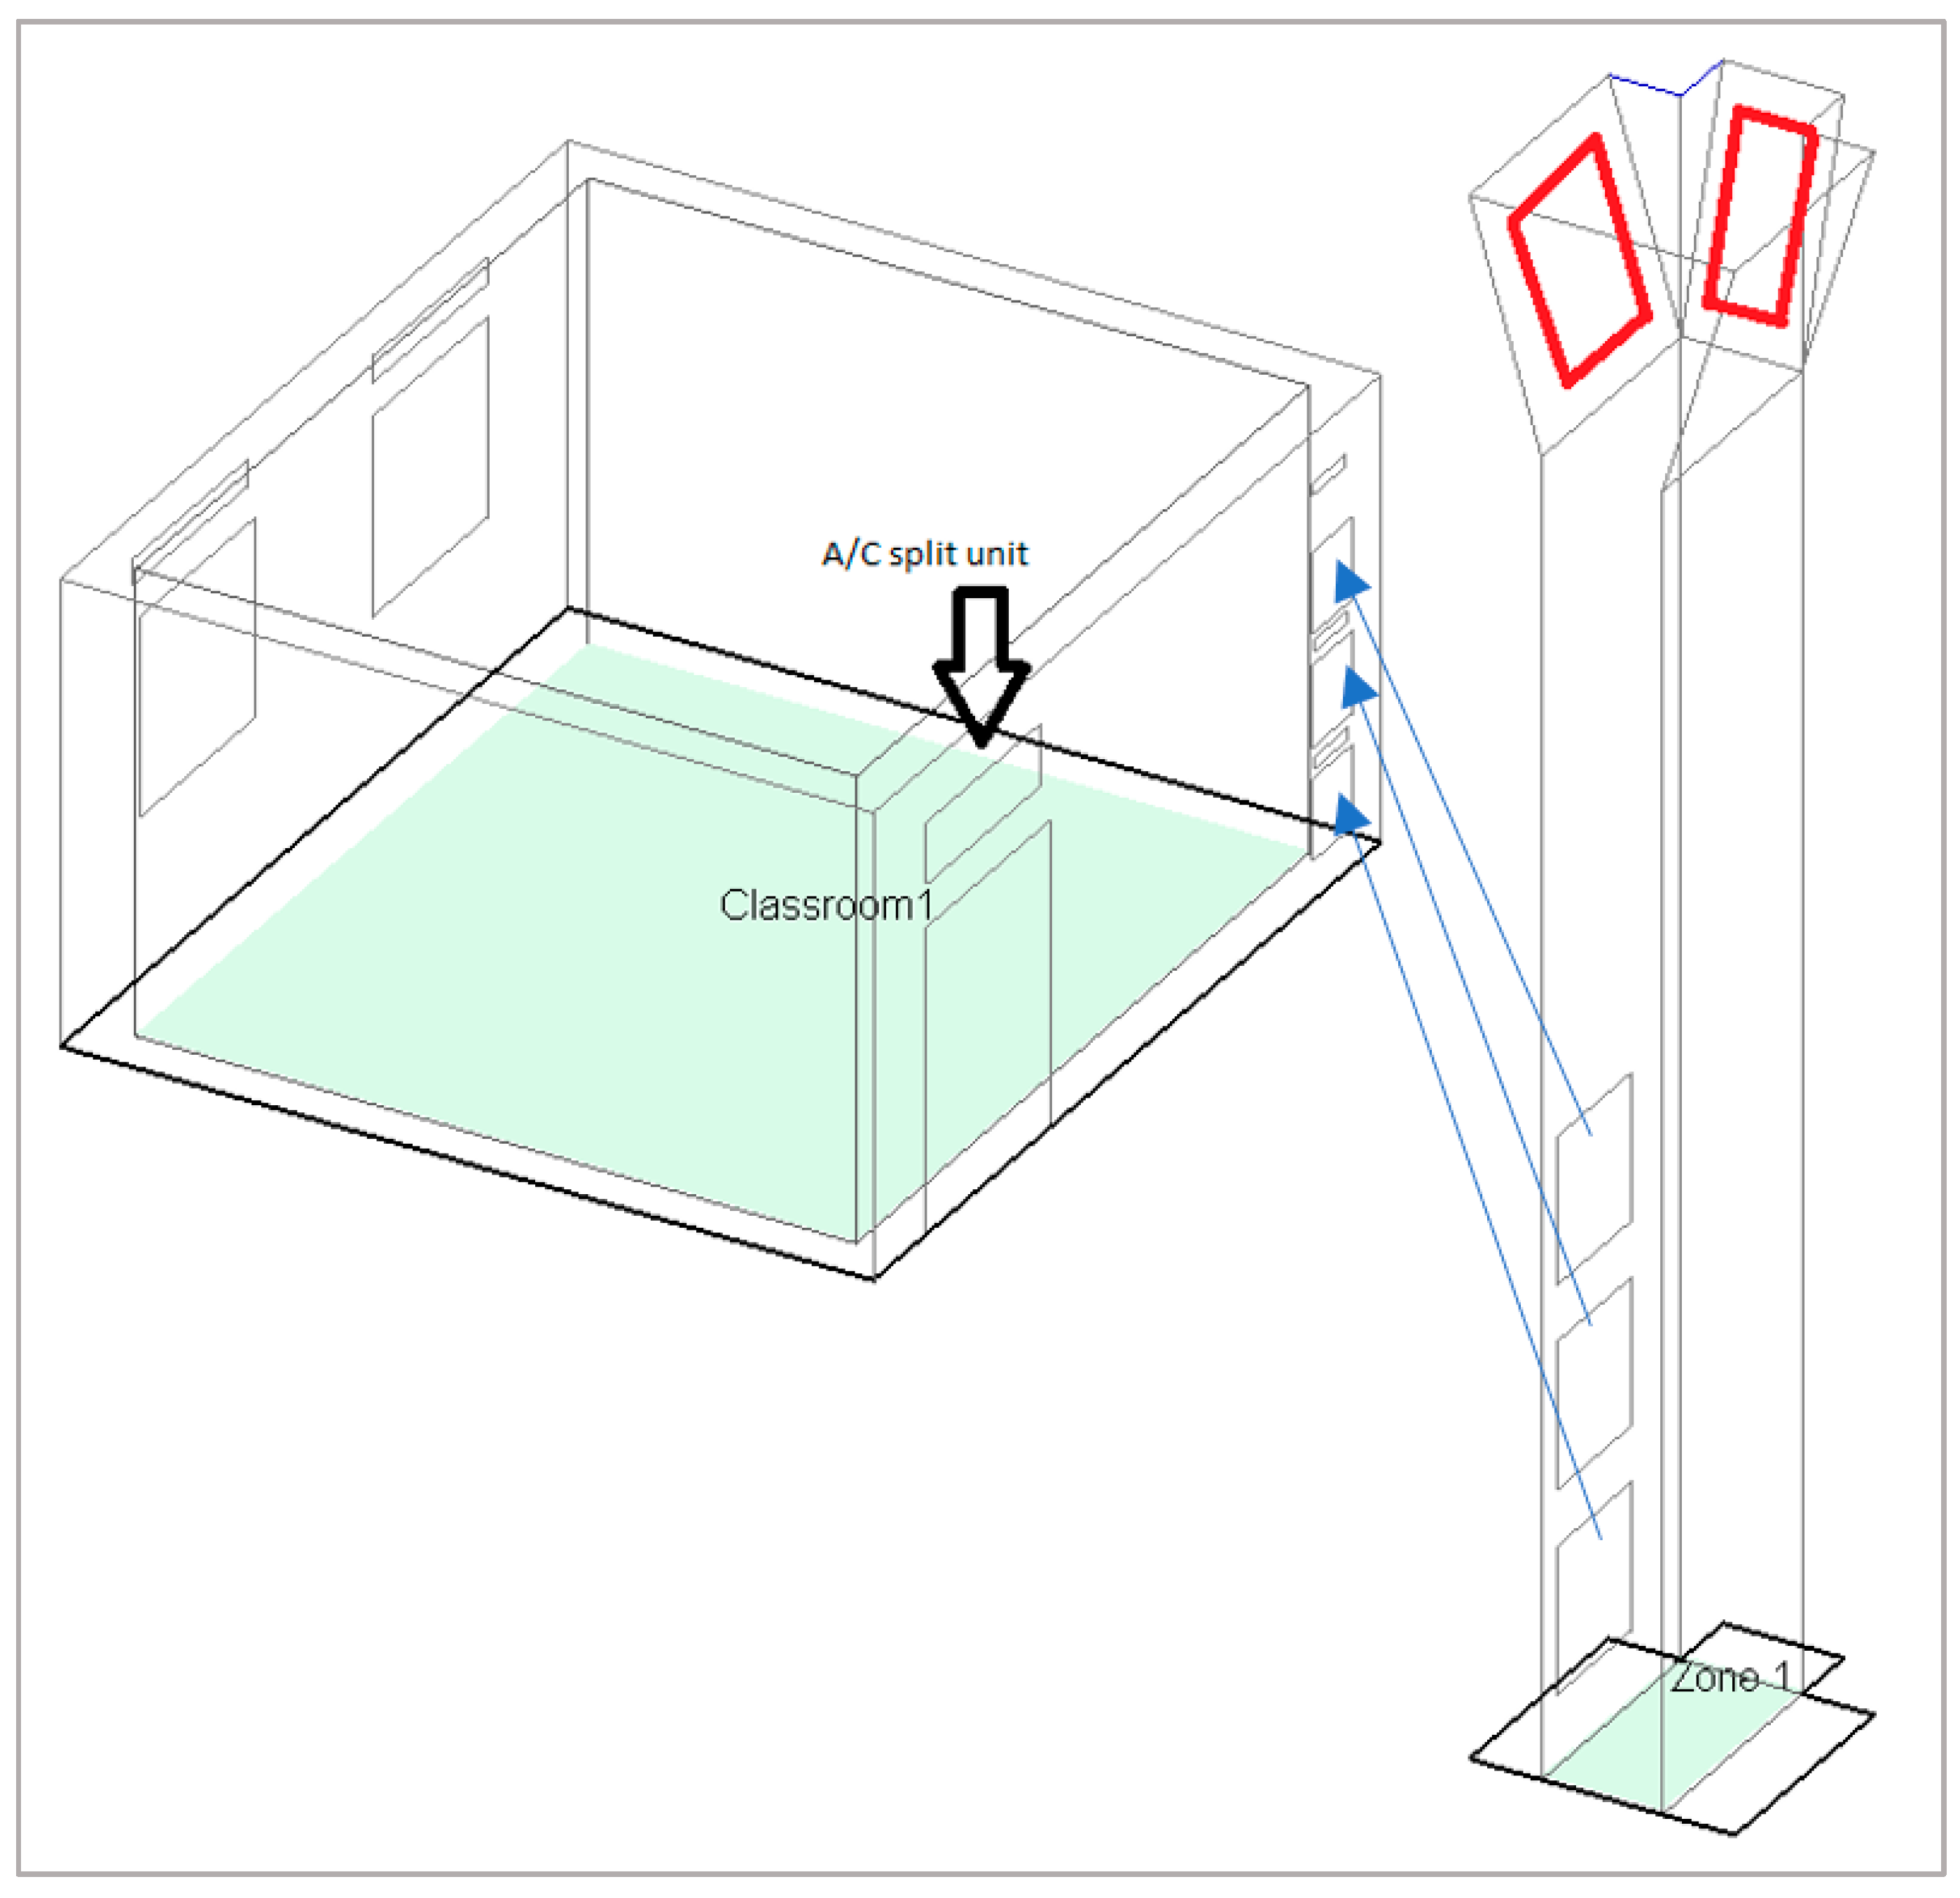
2. Due to confidentiality, the school plans were not available for the research. However, access was provided to a single classroom, which was used for modelling and simulation. The classroom was 5.5 m wide and 6 m long, and had single-sided ventilation (
Figure 3). It was noted during field visits that the windows were partially opened at certain times depending on the teacher’s view of maintaining comfortable and healthy indoor conditions.
The modelling of a building requires the knowledge of the building characteristics, operational profiles, occupancy profiles, and weather data. The building characteristics, lighting and HVAC information was acquired through a field visit and are provided in
Table 1.
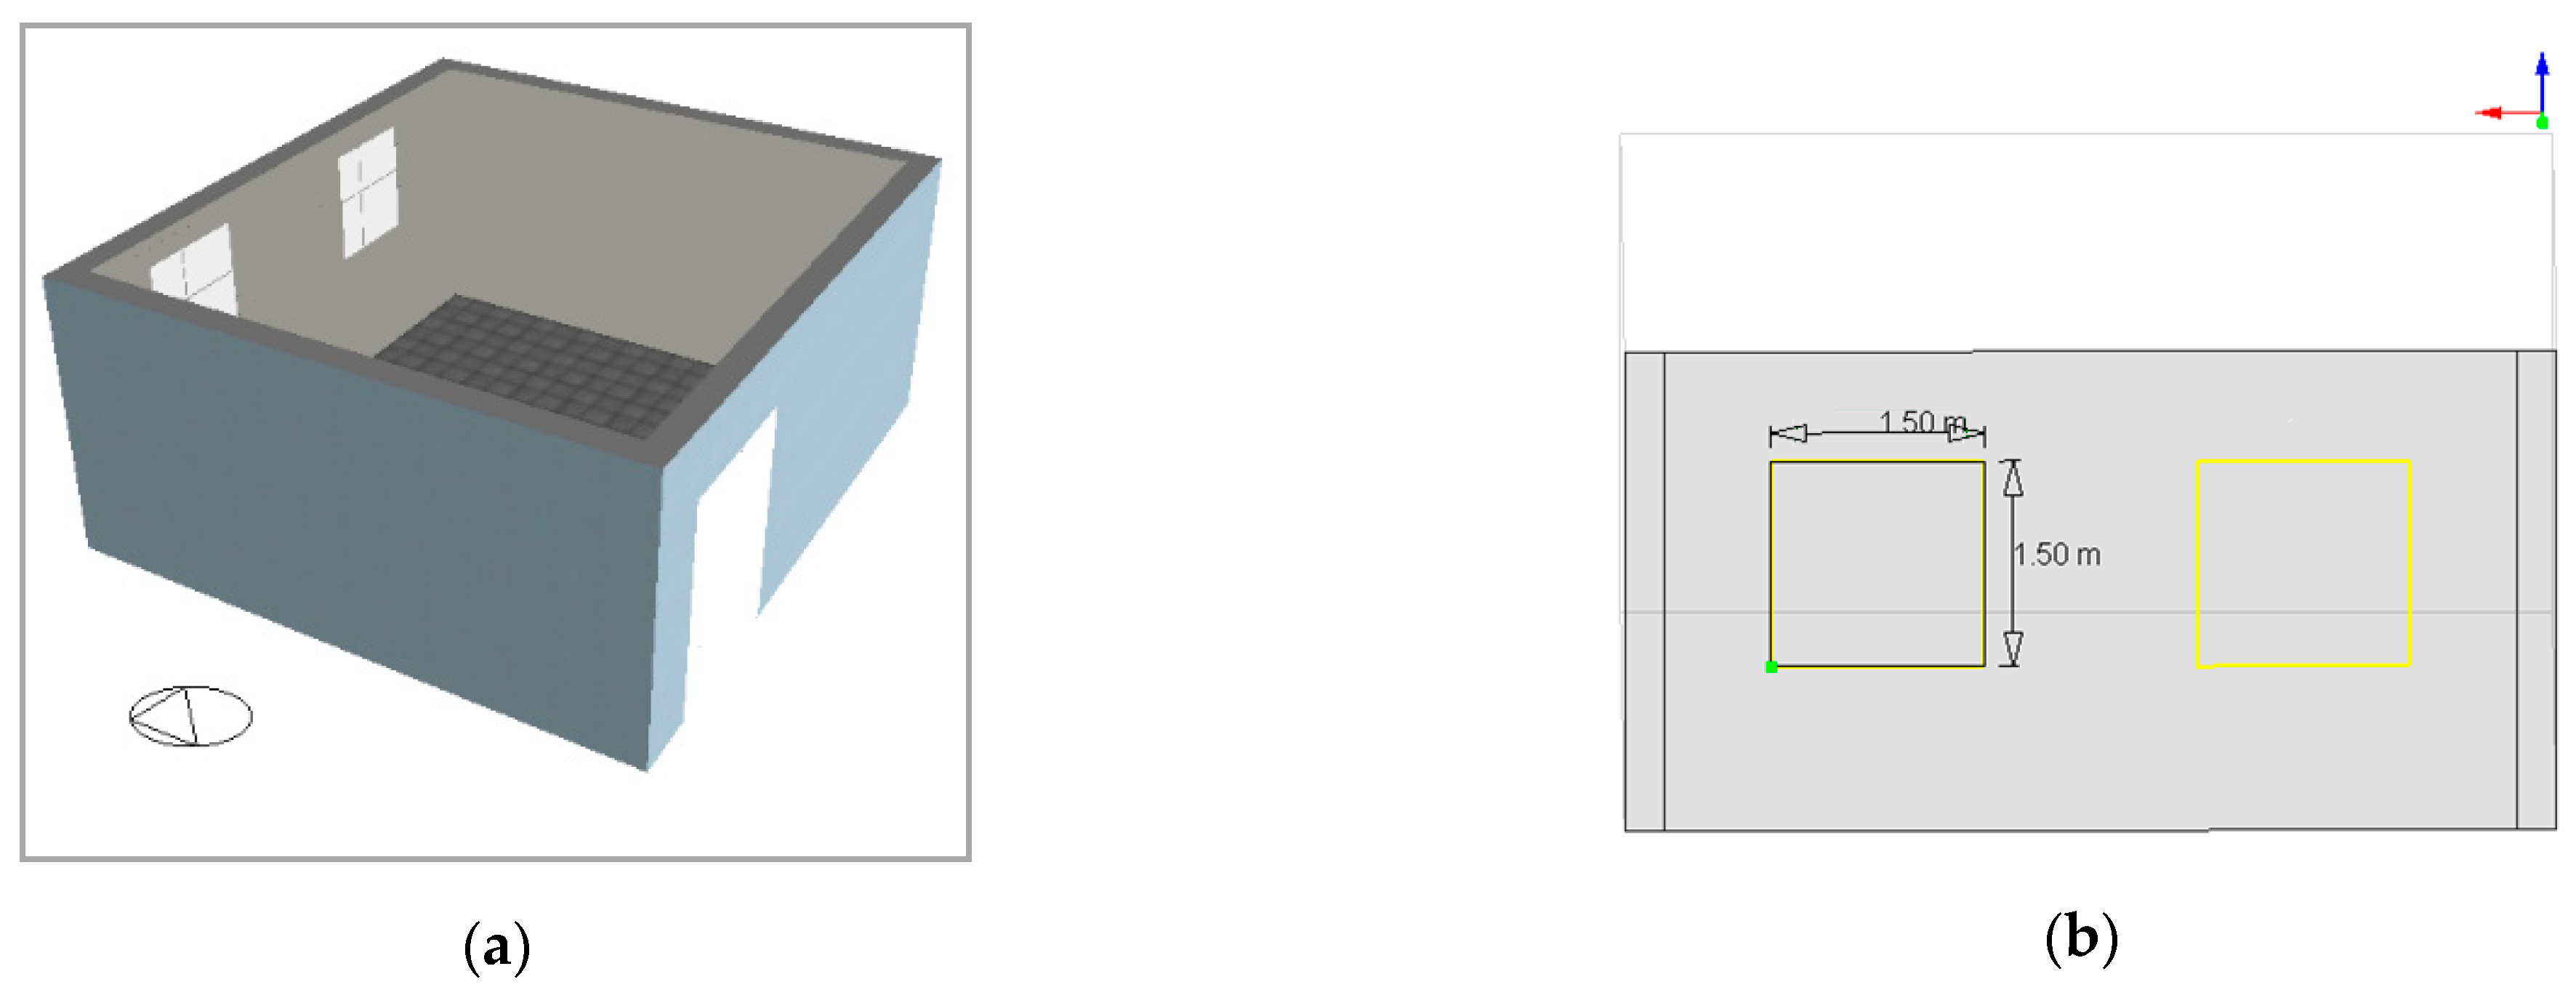
The classroom had two single glazed windows on the longer side of 1.5 m height and 2 m length each with a total area of 3 m
2, and one entrance door (see
Figure 4). The windows had aluminium frames with single 6 mm glazing.
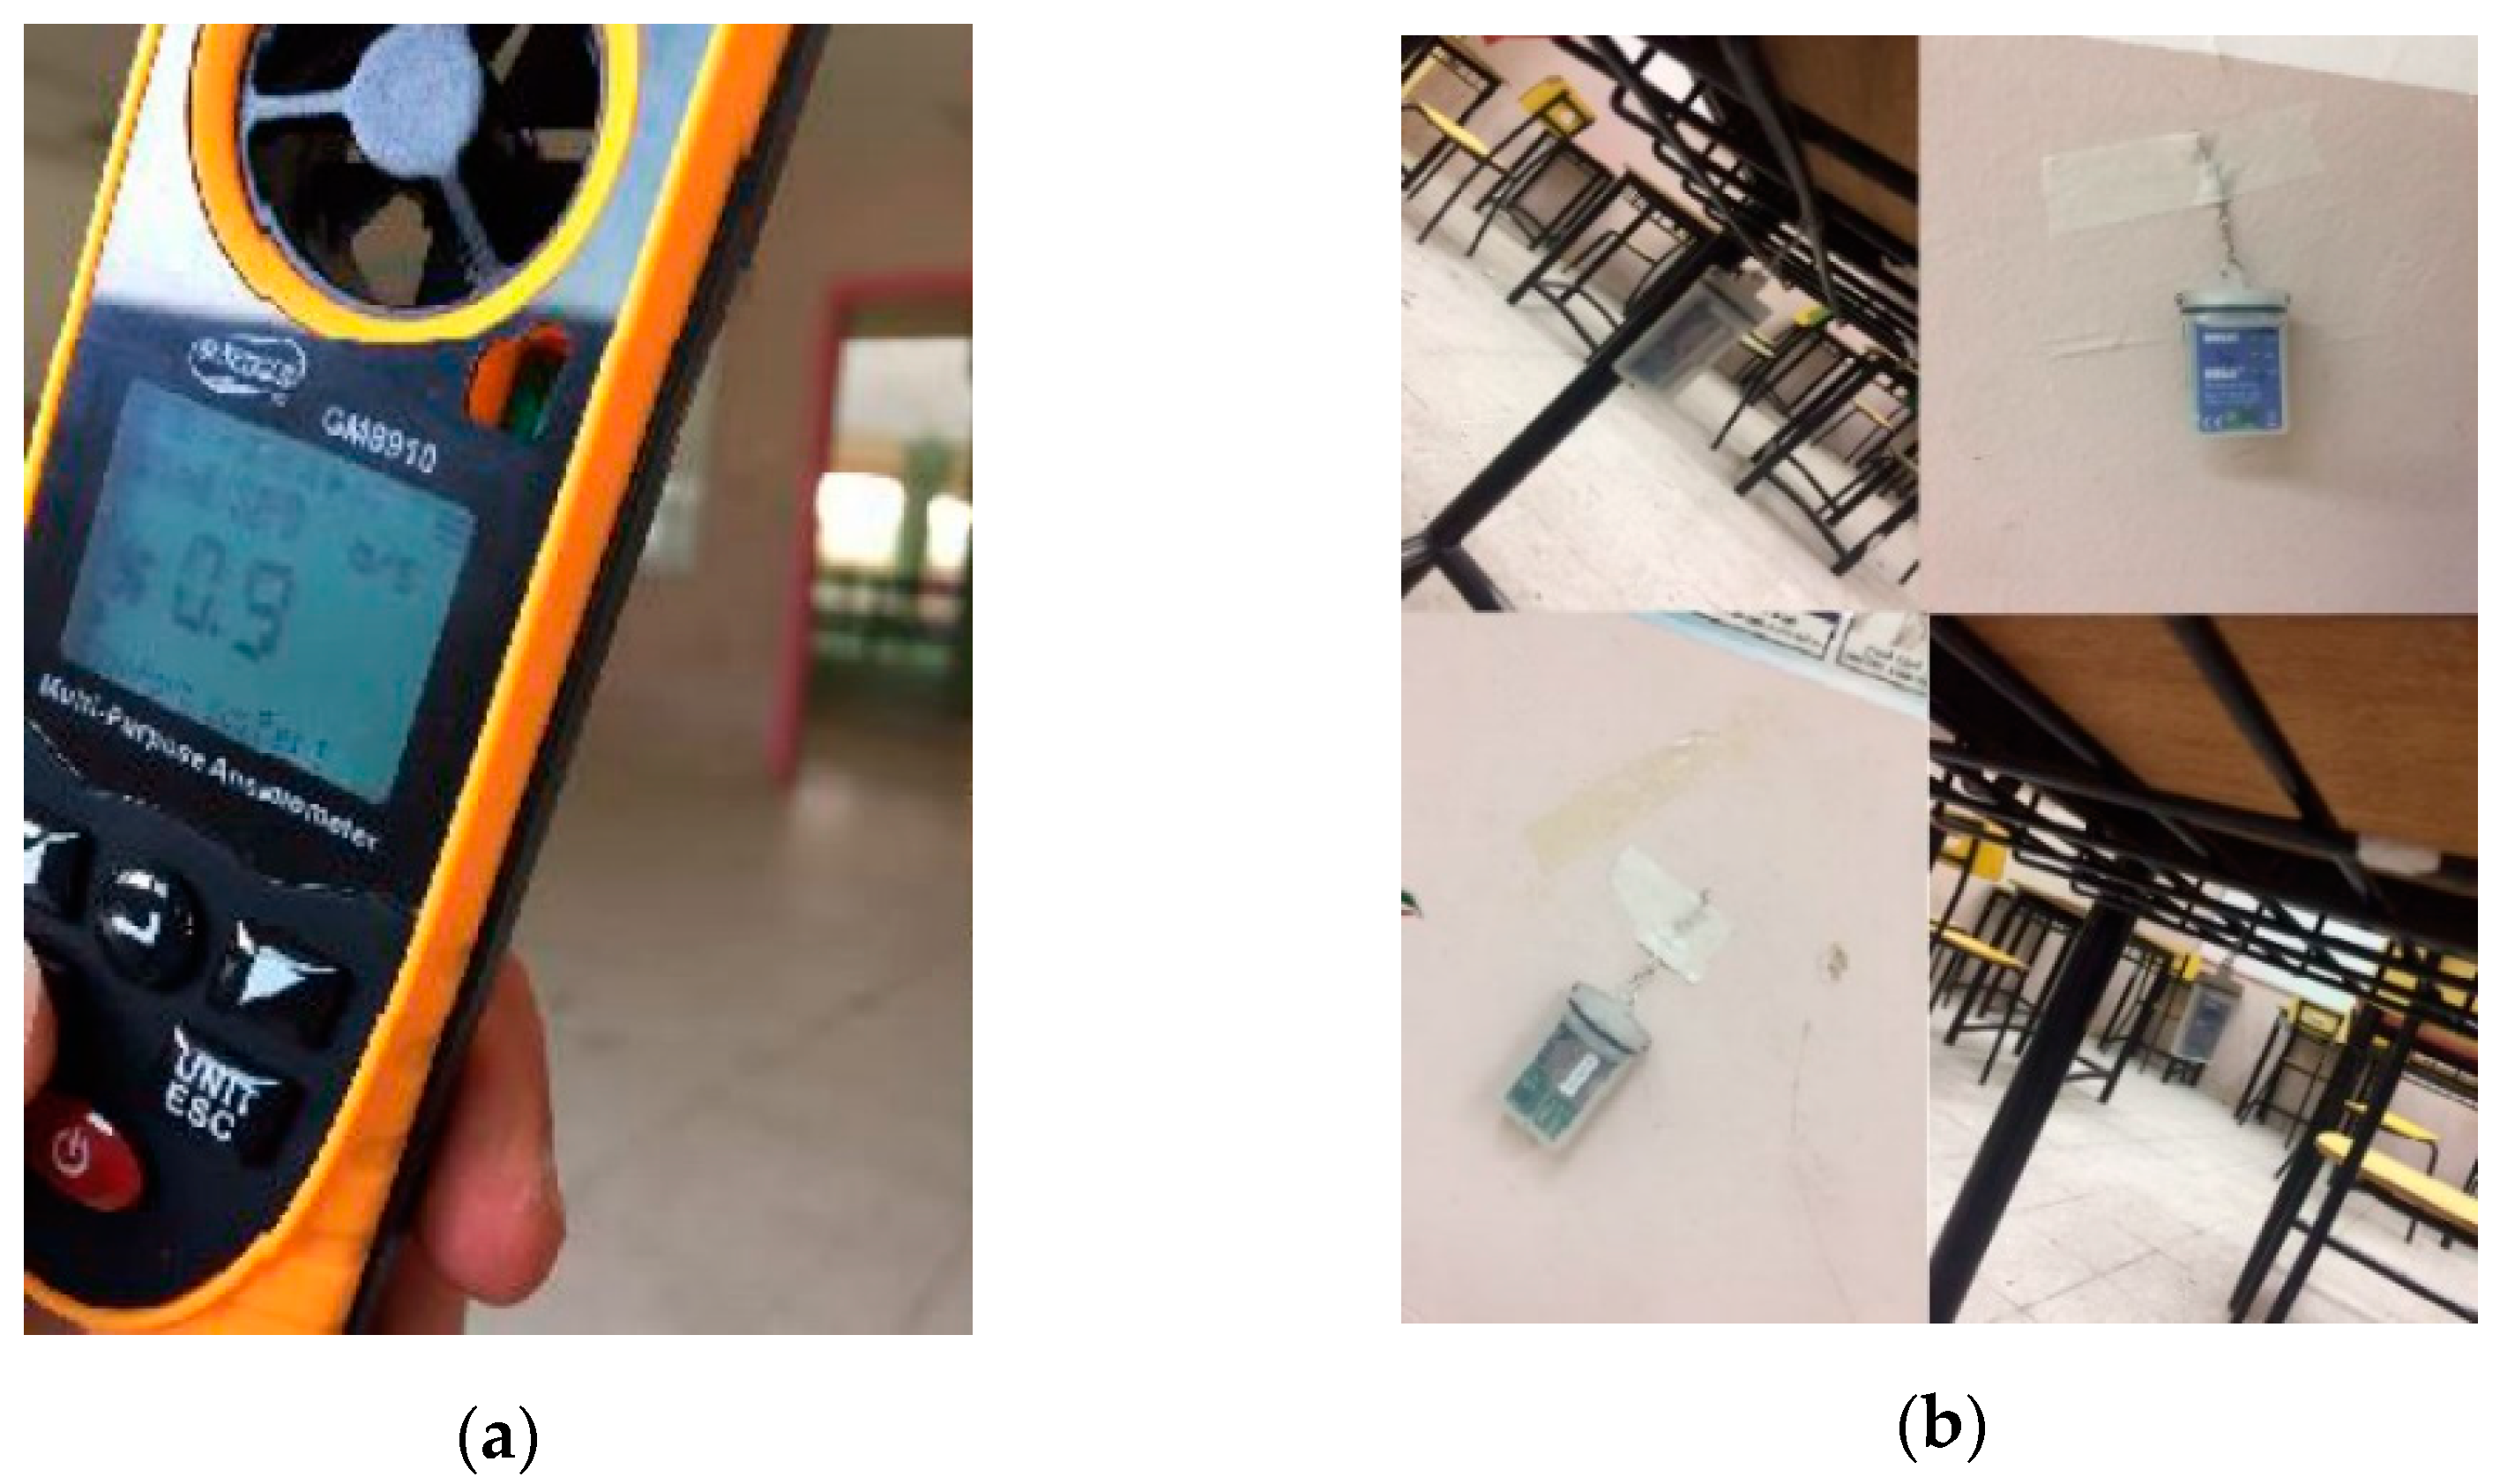
The classroom was typically occupied by 29 students plus the teacher and was furnished with wood and aluminium tables and chairs. Due to short and mild winters, no heating is required. For cooling, the classroom had a 5.28 kW AC split unit supplying the cooling effect for the occupants with recirculated air; it did not supply any fresh air. The AC setpoint was 28 °C, the operating schedule was created in the model based on the teacher’s actions for the daily usage as these reflect the actual use. The lighting schedule reflected actual daily usage, aligned with the school opening hours (building occupancy during 7 am to 4 pm). The lighting was on 50% 07–09.00, 100% 09–16.00 and weekdays only in term-time (September–December, January–June). The modelled windows were usually closed in AC operation but opened periodically to 20% of their area as this was observed in field visits. The handheld anemometer GM8910 [
49] was used to measure the wind speed at different points in the room (
Figure 5, left), and the building structure was inspected based on which an average infiltration rate of 0.9 air changes per hour was chosen, suggesting a leaky structure by modern standards.
The baseline model was verified against data collected from field visits. Eight HOBO loggers [
50] were placed at different locations in the classroom to collect temperature data at 30-min intervals for the hottest summer period (June–July) (
Figure 5, right). Additionally, the yearly electricity use data for the facility was collected (1,105,160 kWh/year). It can be assumed that about 60% of this electricity is used for cooling [
51,
52], which would be 663,096 per year, or 265 kWh/m
2/year (2500 m
2 facility), which is high in comparison with similar schools reported in literature [
53].
The simulation was done using Design Builder V5.4 [
48]. A modified DesignBuilder weather file for Kuwait International Airport was used with its corresponding latitude and longitude (29° 14 N, 47° 59 E), approximately 18 km north-west of the school. The elevation above sea level was 55 m while the square classroom building was oriented 36 degrees east of north. The dry bulb temperature, wind speed and solar radiation data in the weather file were replaced with real data available from [
54,
55], for the year 2017 (the year in which data was recorded).
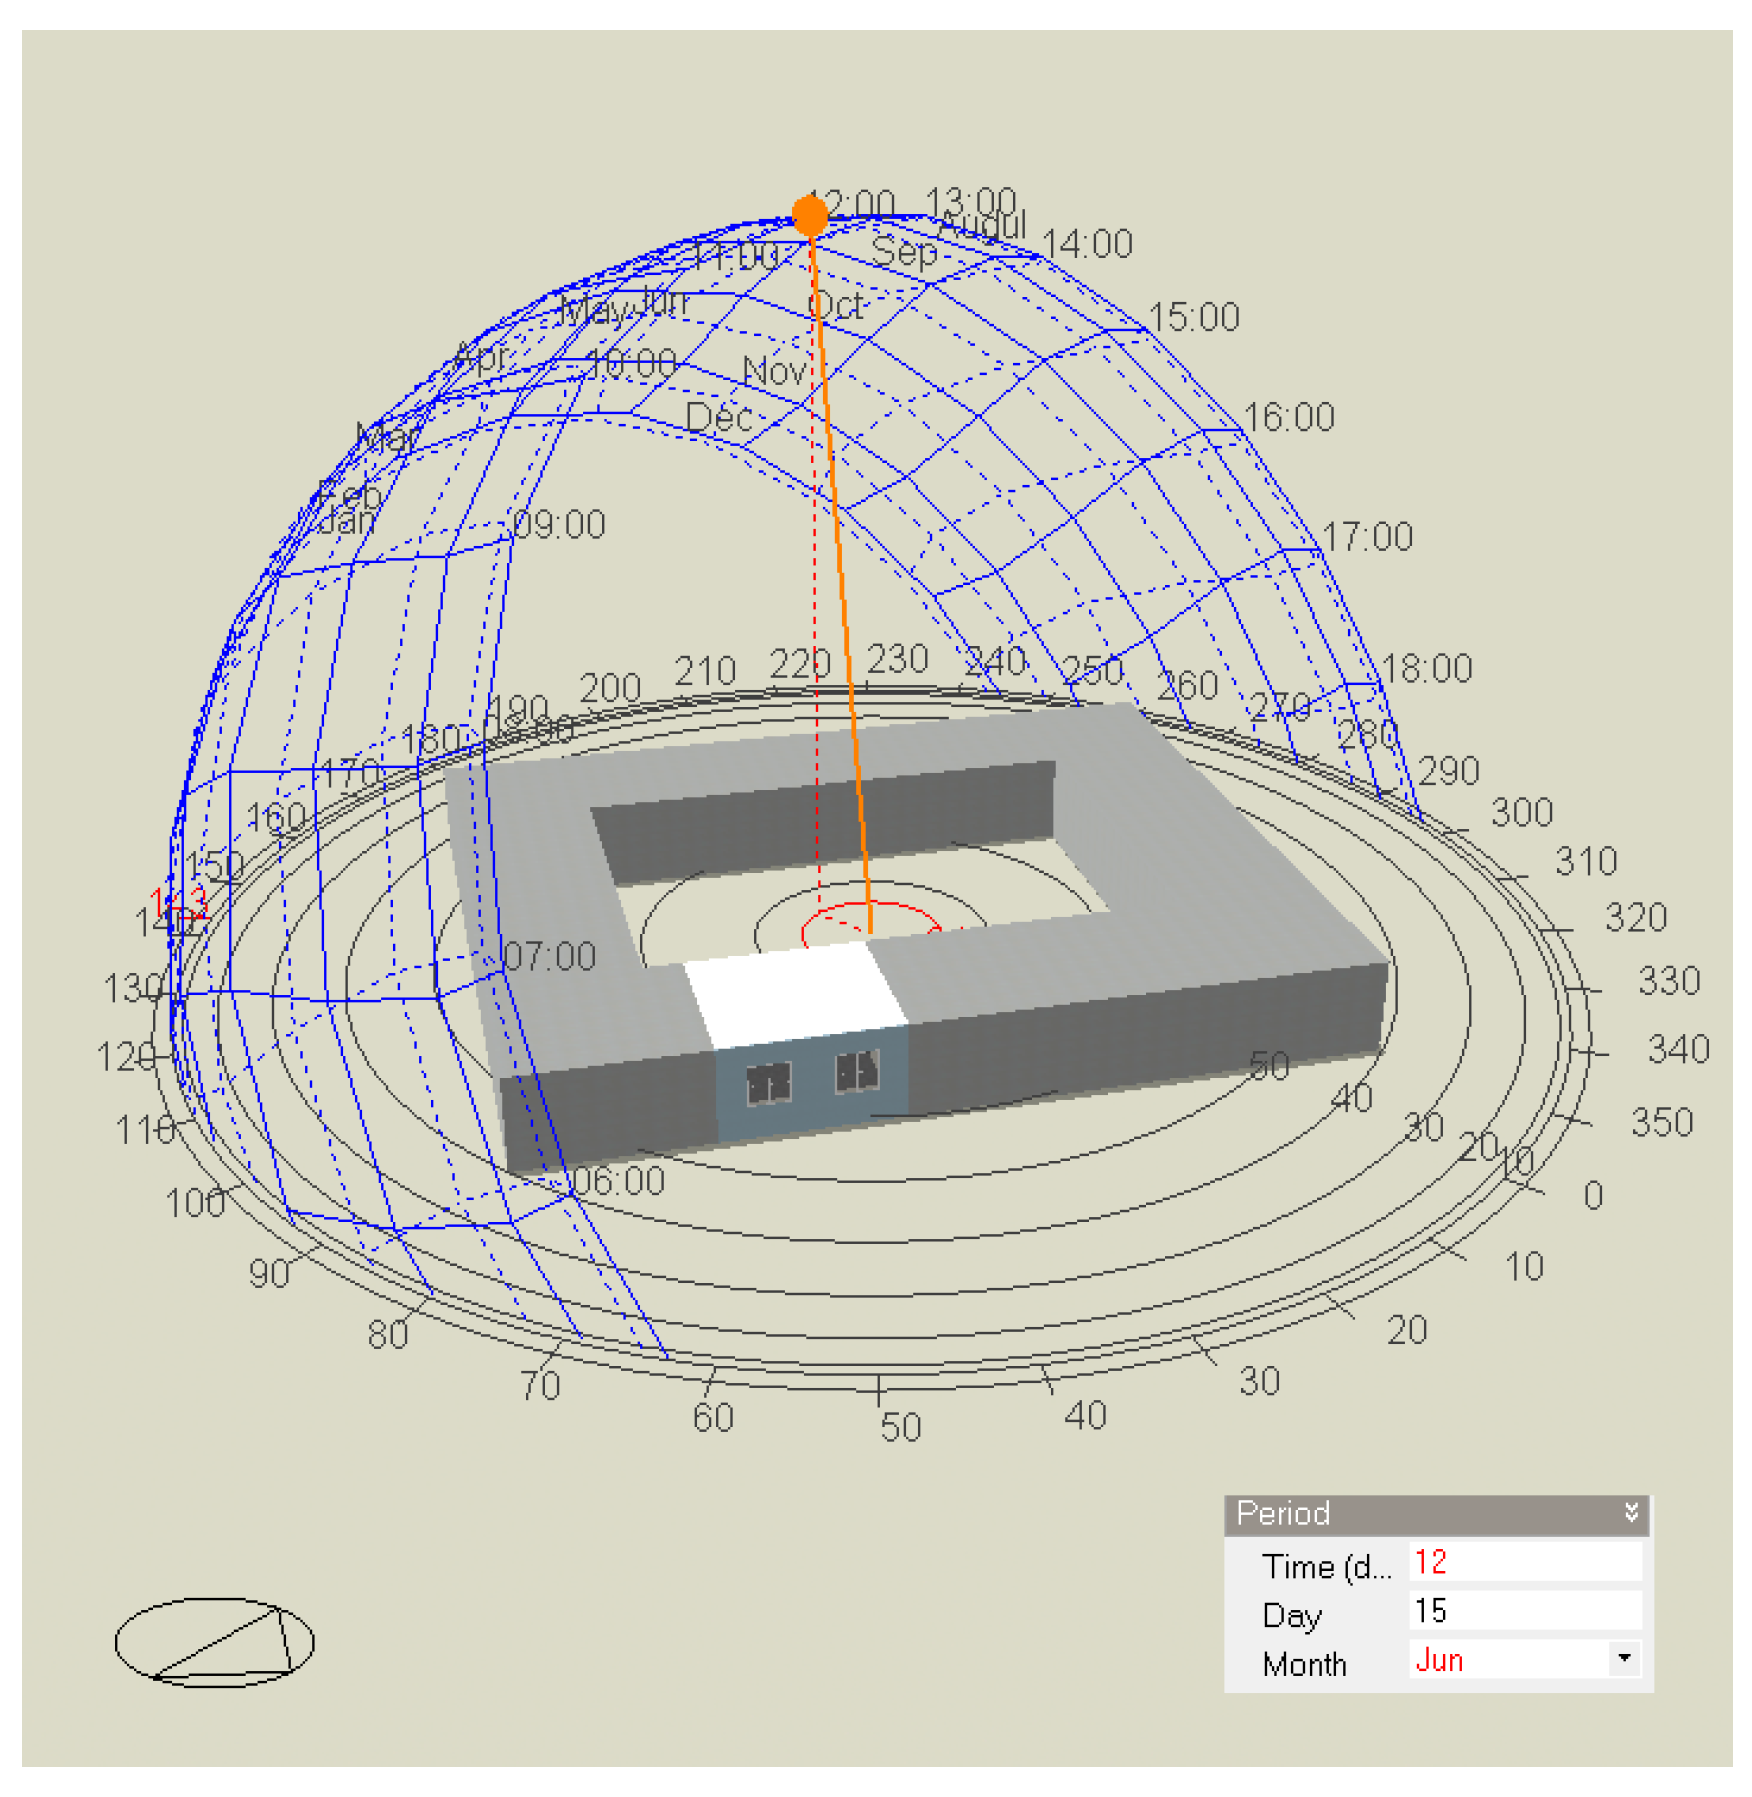
Figure 6 depicts the perspective view of the modelled classroom within the whole school, showing the orientation and the sun path.
4.2. Scenario 1—Baseline Validation
In this baseline scenario, the school classroom is cooled using air conditioning only, which was simulated for a year. To validate the model, the recorded indoor temperature for 16 days in June is compared with the simulated data (see
Figure 7). This timeframe was chosen because (i) it is representative of peak summer conditions and (ii) data was collected for this period. The root mean square error (RMSE) between the two data was 1.1 and the correlation coefficient (R) was 0.75. Energy data could not be collected, but the simulated annual energy demand of 117 kW/m
2/year was comparable to what has been reported for similar schools in Kuwait (69–149 kW/m
2/year as reported by [
53]).
Figure 7 shows that without exception, the classroom air temperature goes beyond 28 °C every afternoon. Therefore, it is expected that the indoor thermal comfort will be poor in this baseline scenario, which represents the current situation in practice. To address this issue in an energy efficient manner, the following scenarios introduce natural ventilation-based designs to solve this problem.
4.3. Scenario Two: Wind Catcher Based Natural Ventilation Only
This scenario includes an integrated wind catcher system, with a wind supply terminal and an air extract that uses natural draught. The wind catcher system is simulated with clay conduits mounted inside the device to enhance heat and mass transfer. This design is based on the results of several studies from reviewed literature, which suggests the wind catcher height needs to be at least 2 m in addition to the roof height [
27,
28]. For this work, the wind catcher design is shown in
Figure 8, which has a height of 3 m above the roof (2 m shaft and 1 m head). It is rectangular in cross-section and has four openings to allow the inflow of air from any direction. The wind catcher head measures 1 m × 1 m with the vents dimensioned as 0.7 m × 0.8 m in area. In DesignBuilder, the wind-driven ventilation is modelled as bulk air flow [
56], driven by the outdoor wind speed data (based on actual KISR metrological data). The vents on the catcher were open all throughout the cooling period, while the classroom windows modulated corresponding to the occupancy schedule with a 20% free open aperture.
4.4. Scenario Three: Wind Catcher with Evaporative Cooling Included
The direct evaporative cooling system was modelled by adding water pads to cool the air coming from the outside environment to the inside of the wind catcher, to pass it to the classroom. The wind catcher is linked to the classroom through the vents and a convector unit with wetted clay walls and water spray for cooling air. Incoming air first passes through the convector unit and is cooled before flowing to occupied indoor spaces. In
Table 2 the specifications of the evaporative pad are provided, chosen with respect to the size and outline of the wind catcher integrated to the classroom.
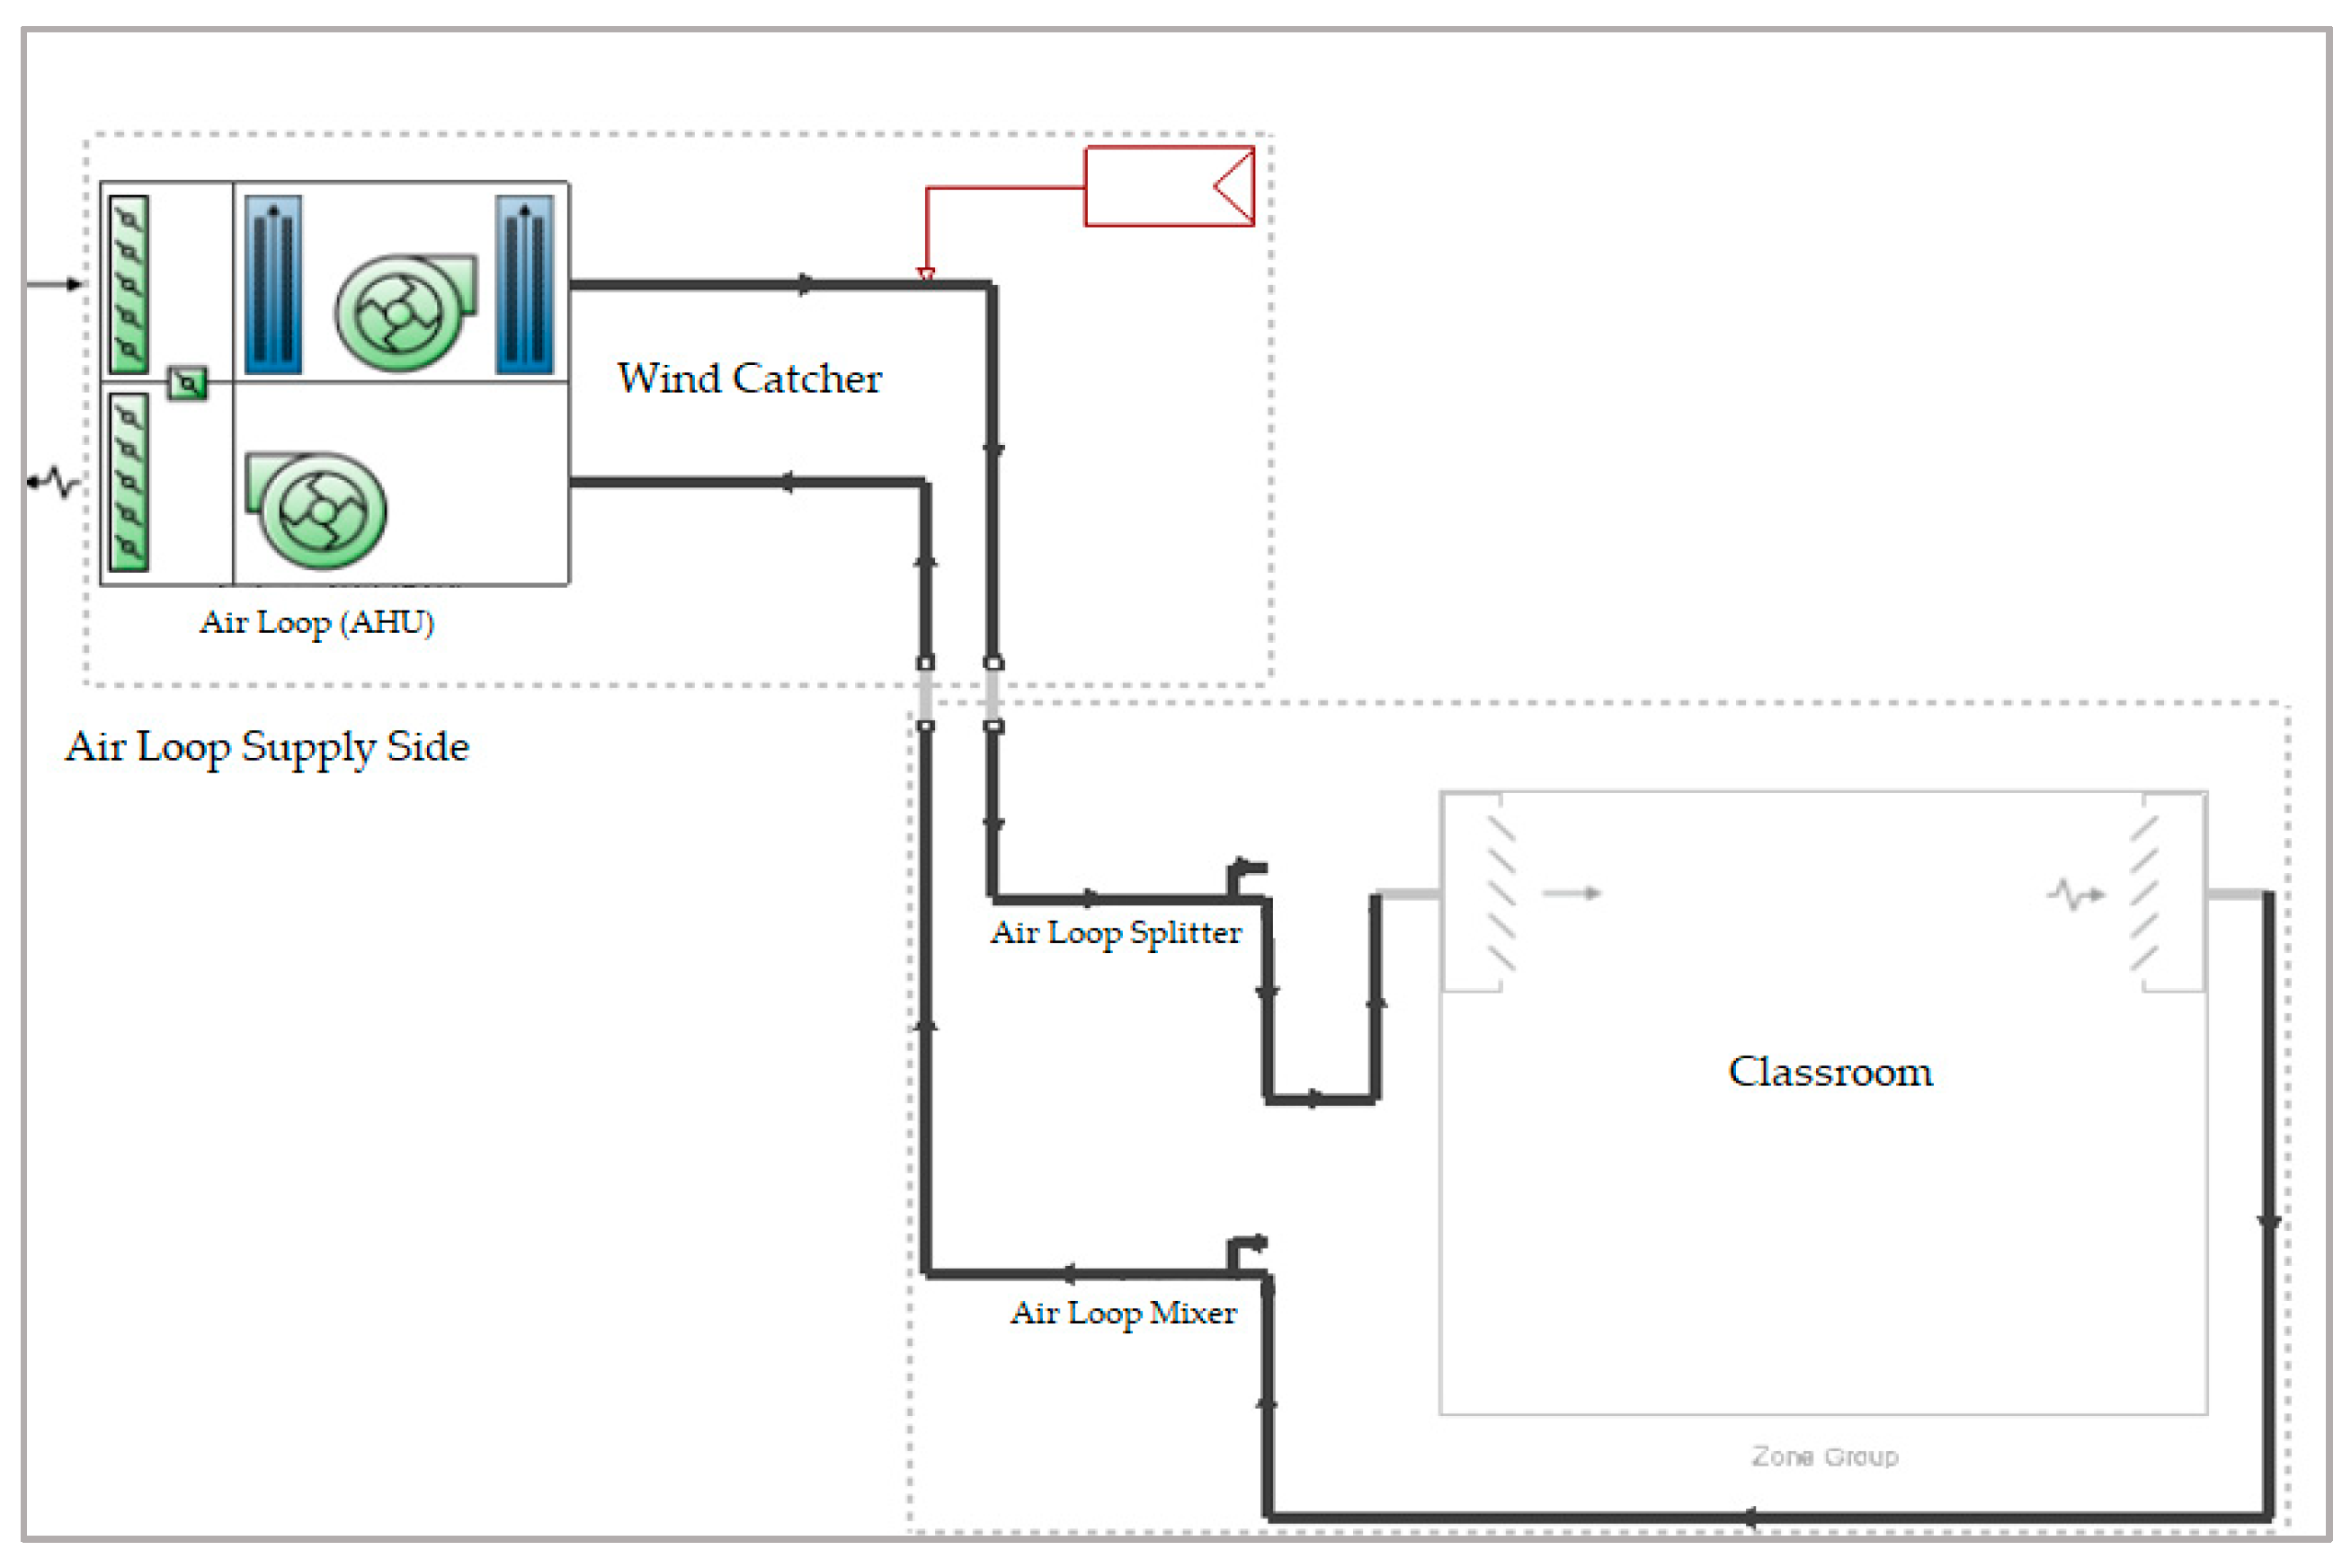
Figure 9 illustrates the HVAC detailed system modelled in Design-Builder to act as the wind catcher plus evaporative cooling system. It consists of direct evaporative cooling with water pads. The fan in the system operates in natural ventilation mode using the outside wind speed-based inflow through the wind catcher as supply air. The vents on the wind catcher head and the windows in the classroom operate similarly to scenario two.
5. Results and Discussion
As the main objective of this work was to develop an improved cooling design, April–June was selected as the period of analysis. The building was cooled from April onwards, with June being the hottest summer month when the school was open. July and August were omitted as the school was closed during this period. In this section, for each of the scenarios defined, the thermal comfort, indoor air quality, relative humidity, ventilation and energy use results from the DesignBuilder V5.4/EnergyPlus V9.1 are presented. A comparison of these results between the considered scenarios is then presented in
Section 5.4.
5.1. Scenario 1: Baseilne—AC Based Cooling Only
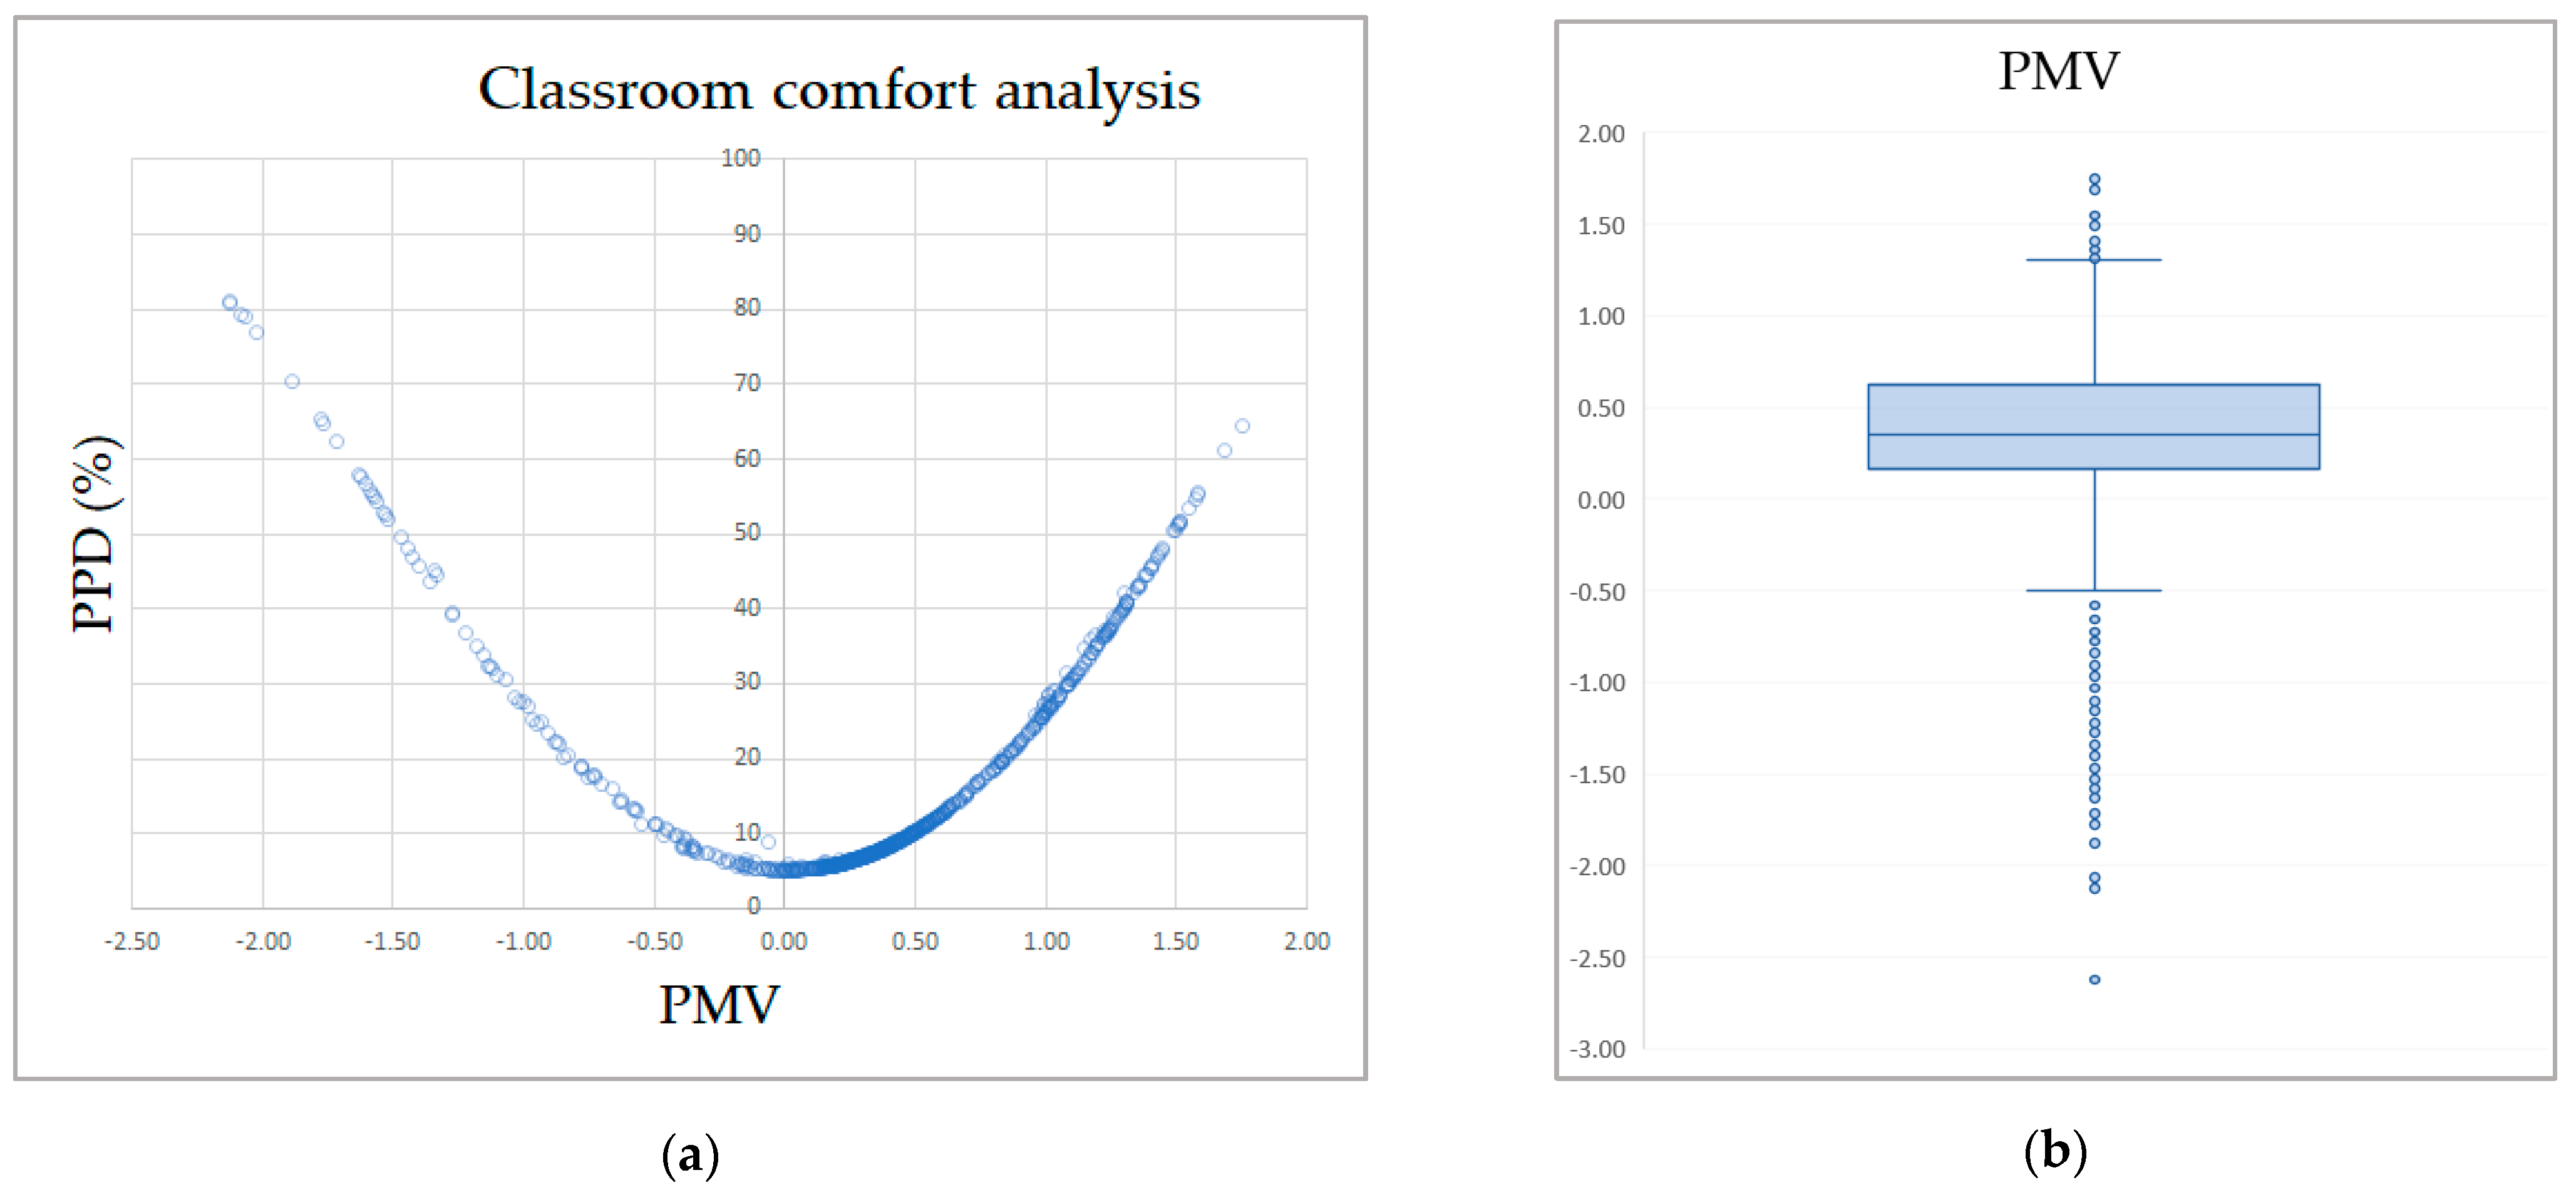
As the baseline scenario is an AC cooled operation, without any kind of natural ventilation intervention, Fanger’s PMV is a suitable thermal comfort indicator. The PMV is calculated within the software, which has internal values of radiant temperature, etc., to calculate PMV. For example, the clo summer value was 0.5, which is representative of light summer clothing.
Figure 10 (left) shows the comfort curve over the three months. The ASHRAE 80% comfort criteria correspond to a PMV of ±0.85. While most points lie within this range, significant hours lie in the overheating region (PMV > 0.85). While there are some overcooled hours, these are relatively few. The PMV box plot in
Figure 10 (right) shows that the overcooled hours (PMV < −0.85) were outliers within the dataset. A temporal analysis of the data revealed that these overcooling hours occurred in either early morning or late afternoon. This is because (i) the outdoor conditions were cooler during these times and (ii) the AC was kept ON 24/7 from April onwards, which was the actual practice at the school.
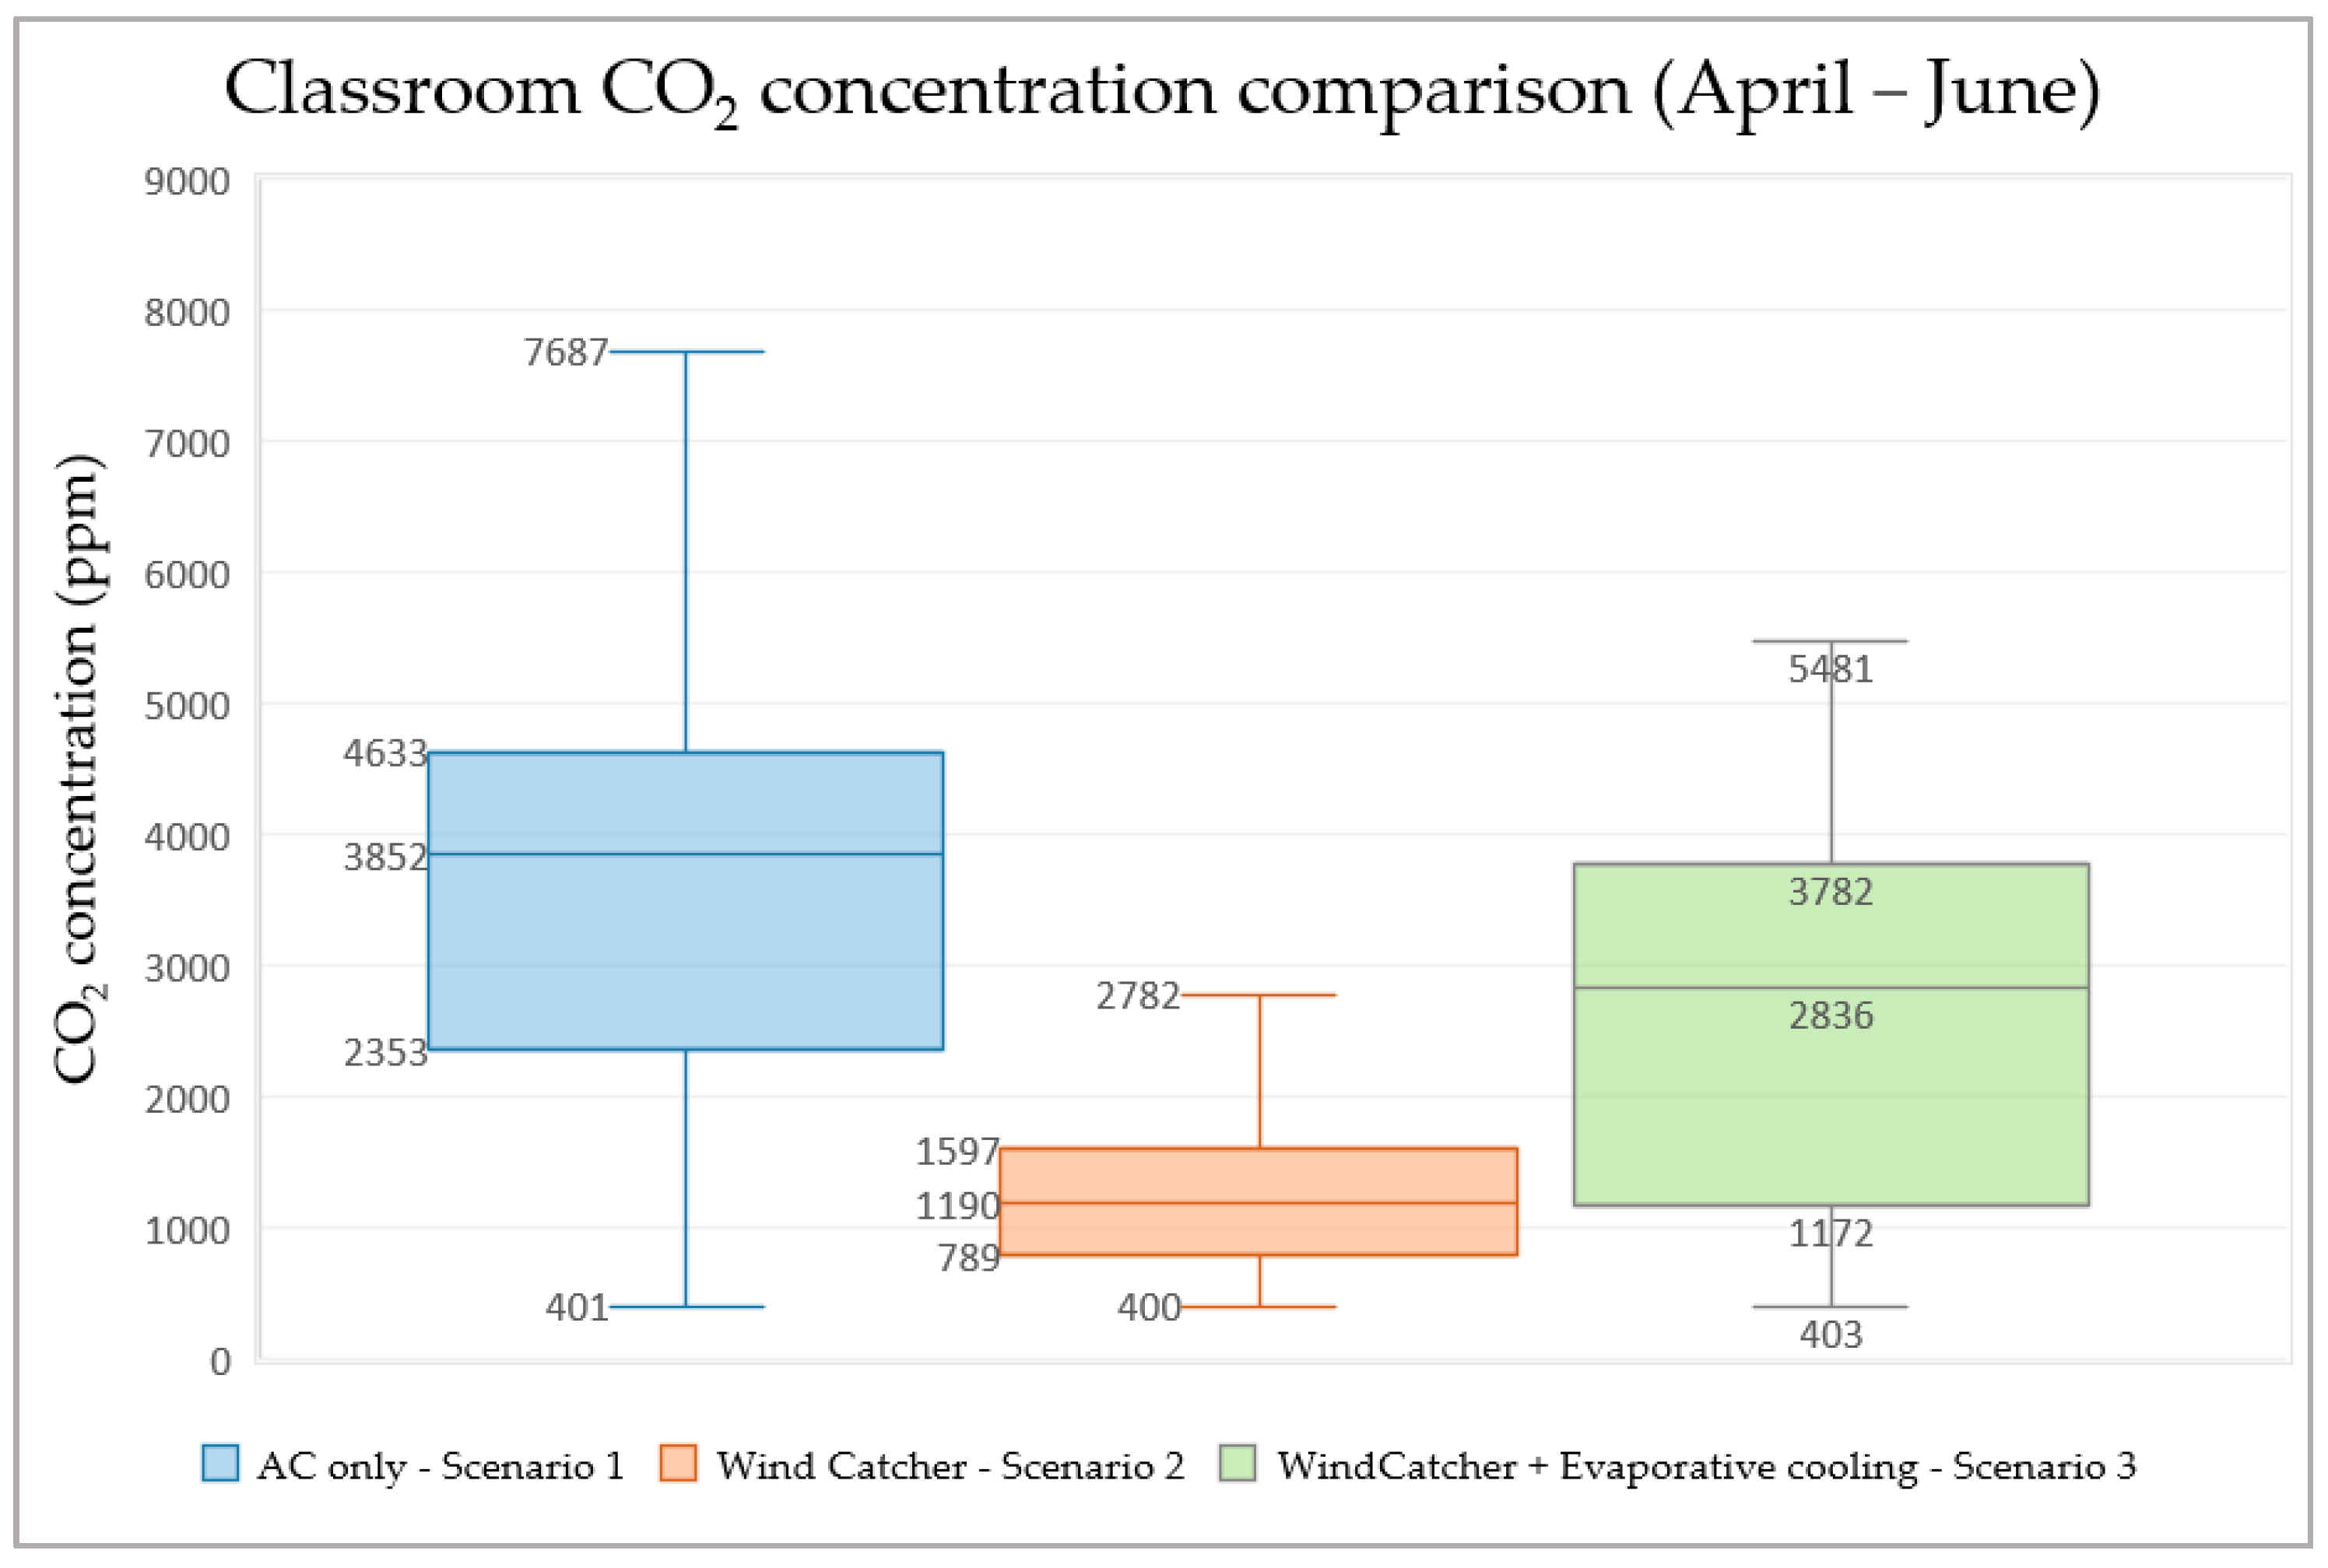
Specifically, 204 h had PPD% greater than 20%, which corresponded to 26% of the total occupied hours. The lower and upper quartiles of the PMV were 0.17 and 0.63 respectively, from which one might say that most of the time the occupants were comfortable. For air quality, only 11% of the occupied hours (88 h) had a CO2 concentration below the 1100 ppm threshold (ASHRAE stipulated that CO2 concentration should be at most 700 ppm above the outdoor). Here, the CO2 concentration was based on the carbon dioxide generation rate per person as calculated by the software using the number of occupants, their schedule and activity had a fixed CO2 generation rate of 3.82 × 10⁻⁸ m3/s-W (obtained from ASHRAE standard 62.1-2007 value at 0.0084 cfm/met/person over the general adult population).
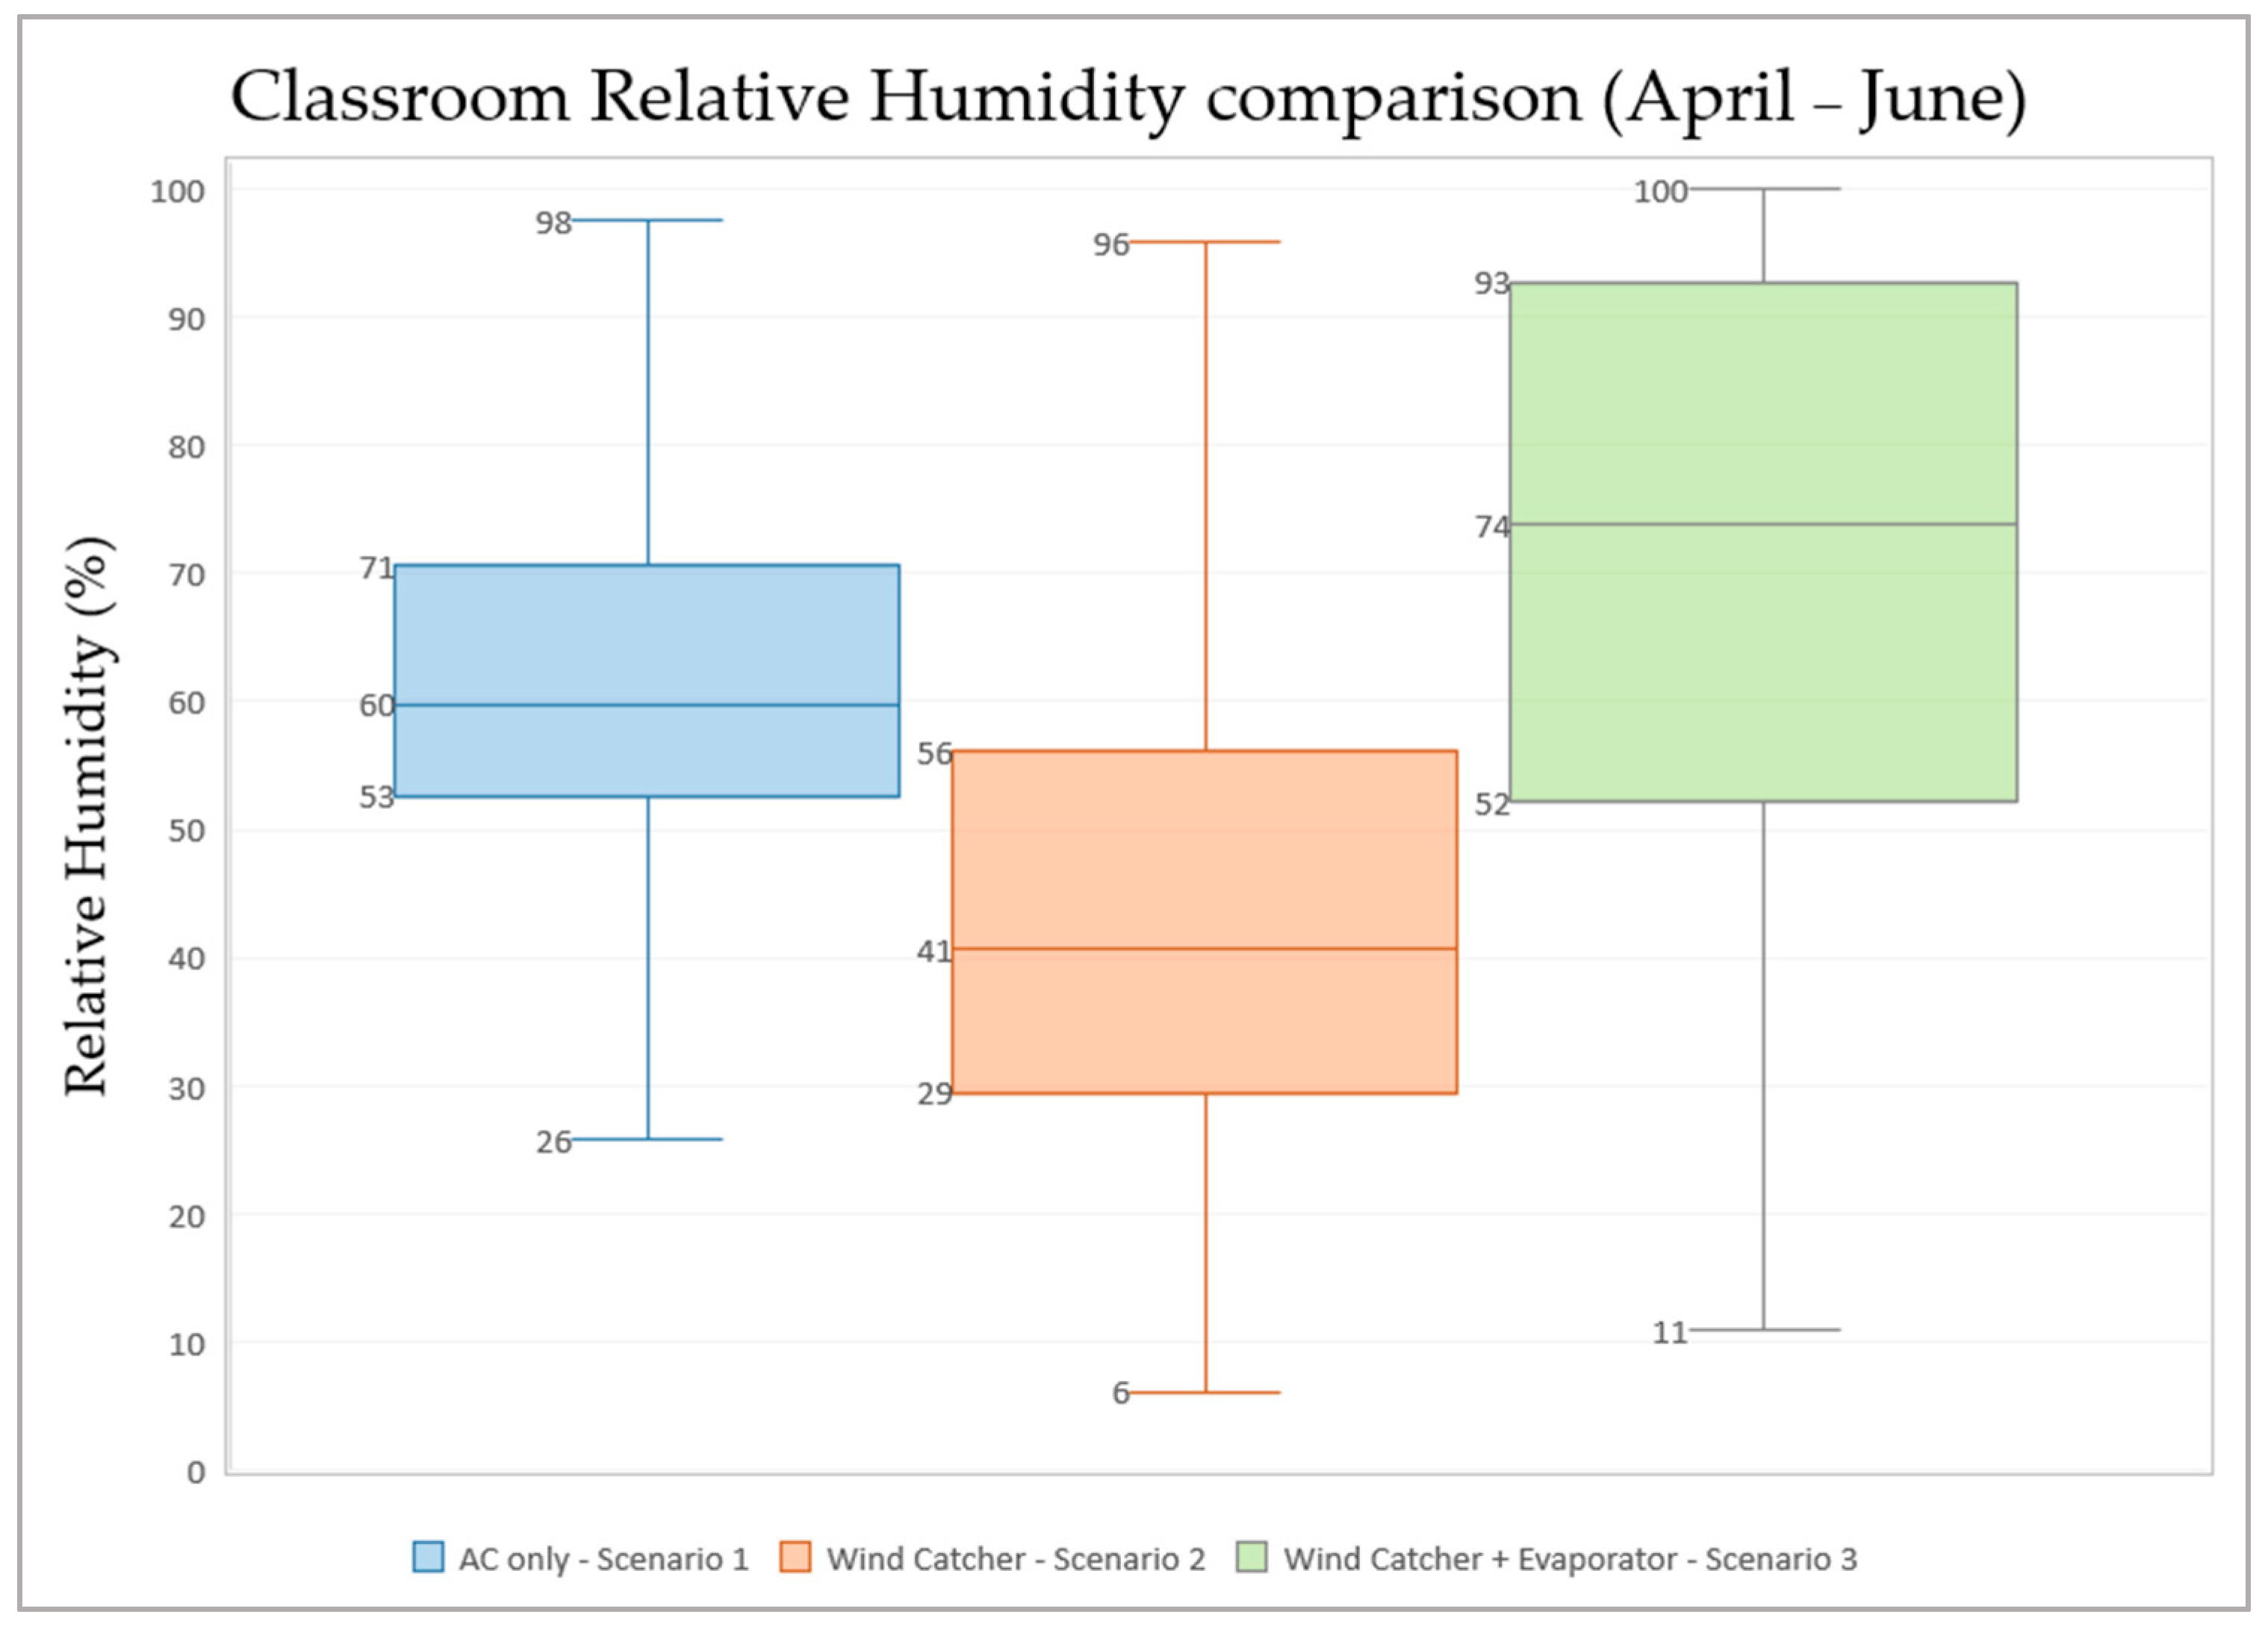
The median relative humidity (RH) within the classroom within the occupied period was 60%, with the interquartile RH% ranging from 53 to 71%. The median air change rate during occupied hours was 0.56, with the interquartile values ranging from 0.41 to 0.65. Finally, the energy use for these three summer months was 38 kWh/m2.
In summary, the baseline scenario had somewhat comfortable conditions with about a quarter of the time exceeding the ASHRAE 80% comfort criteria but had unacceptable CO2 concentration levels.
5.2. Scenario Two: Wind Catcher Based Natural Ventilation Only
As the building is naturally ventilated in this case, the thermal comfort was analysed using the ASHRAE adaptive thermal comfort model (with the caveat of the 33.5 °C limit as already discussed).
The air change rate was higher than the baseline as expected from this natural ventilation-based design, with a median 2.35 ach for the occupied hours. The interquartile range was between 1.29 and 3.29 ach, indicating a much greater amount of fresh air flow into the classroom. This translated into improved air quality, but the median CO2 concentration was 1190 ppm, still above the 1100 ppm stipulated threshold for good indoor air quality. The energy use was only a fraction of the baseline, at 7.6 kWh/m2, only 20% of the baseline. On the downside, the indoor conditions were not thermally comfortable, as 44% occupied hours were uncomfortable according to the ASHRAE 55 adaptive thermal comfort metric.
In summary, with the wind catcher operating in only the ventilation mode, thermally comfortable conditions could not be reached in the hot desert summer, although large energy reductions and IAQ (indoor air quality) improvements were achieved.
5.3. Scenario Three: Wind Catcher with Evaporative Cooling Included
In this scenario, an evaporative cooler was added to the wind catcher to improve thermal comfort performance. As this approach also employs natural ventilation, thermal comfort was assessed through the ASHRAE 55 adaptive thermal comfort model. The evaporative cooler certainly made an improvement in this regard, as no hours were predicted to be uncomfortable. The energy use was 18.1 kWh/m2, which was less than half (47.6%) of the baseline energy consumption. The air change rate was also better than the baseline, averaging at 0.87 ach during occupied hours. Compared to the baseline, this also improved the indoor air quality, as the median CO2 concentration was simulated to be 2836 ppm, which was unfortunately still much above the 1100 ppm threshold. These improvements upon the baseline came at the cost of using 0.12 m3 of water in the evaporative cooler, leading to higher humidity levels. The median relative humidity in the classroom was simulated to be 74%, with the interquartile values ranging from 52% to 92%. Despite this higher humidity, the conditions were predicted to be comfortable for all occupied hours.
In summary, this scenario resulted in a drastic improvement in energy use and thermal comfort, at the cost of higher relative humidity, but could not sufficiently improve the CO2 concentration levels. Now, the three scenarios were compared as follows.
5.4. Scenarios Comparison
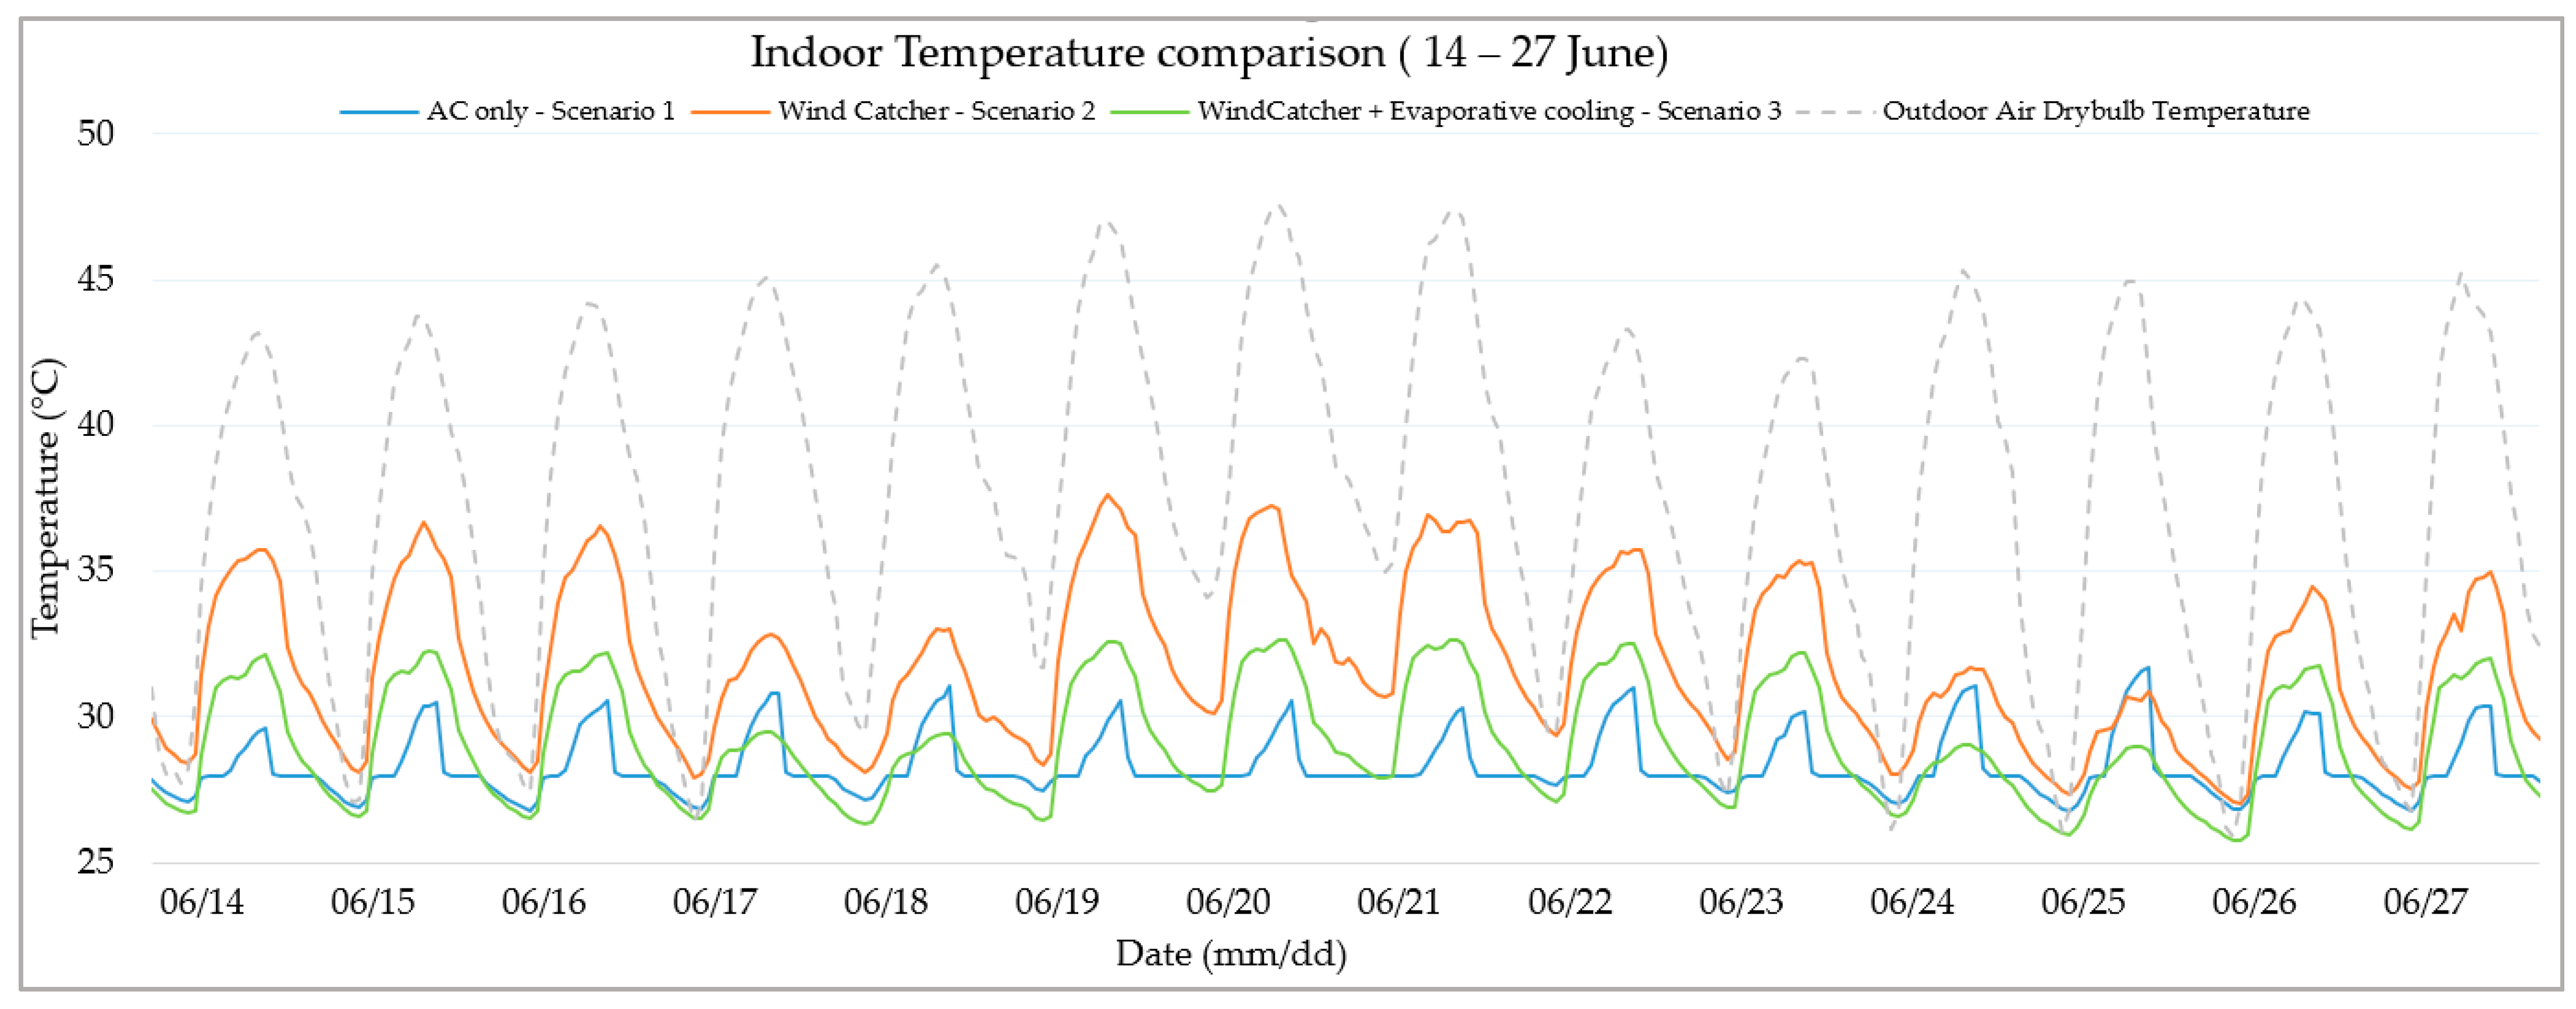
Figure 11 depicts the indoor air temperature for two weeks in June (the hottest month of analysis), from which the cooling effect of scenario 3 was clearly evident. In addition to lower daytime temperature peak, the operation of the wind catcher and evaporative cooling purges heat from the building at nighttime, as evident from the troughs in the temperature profile.
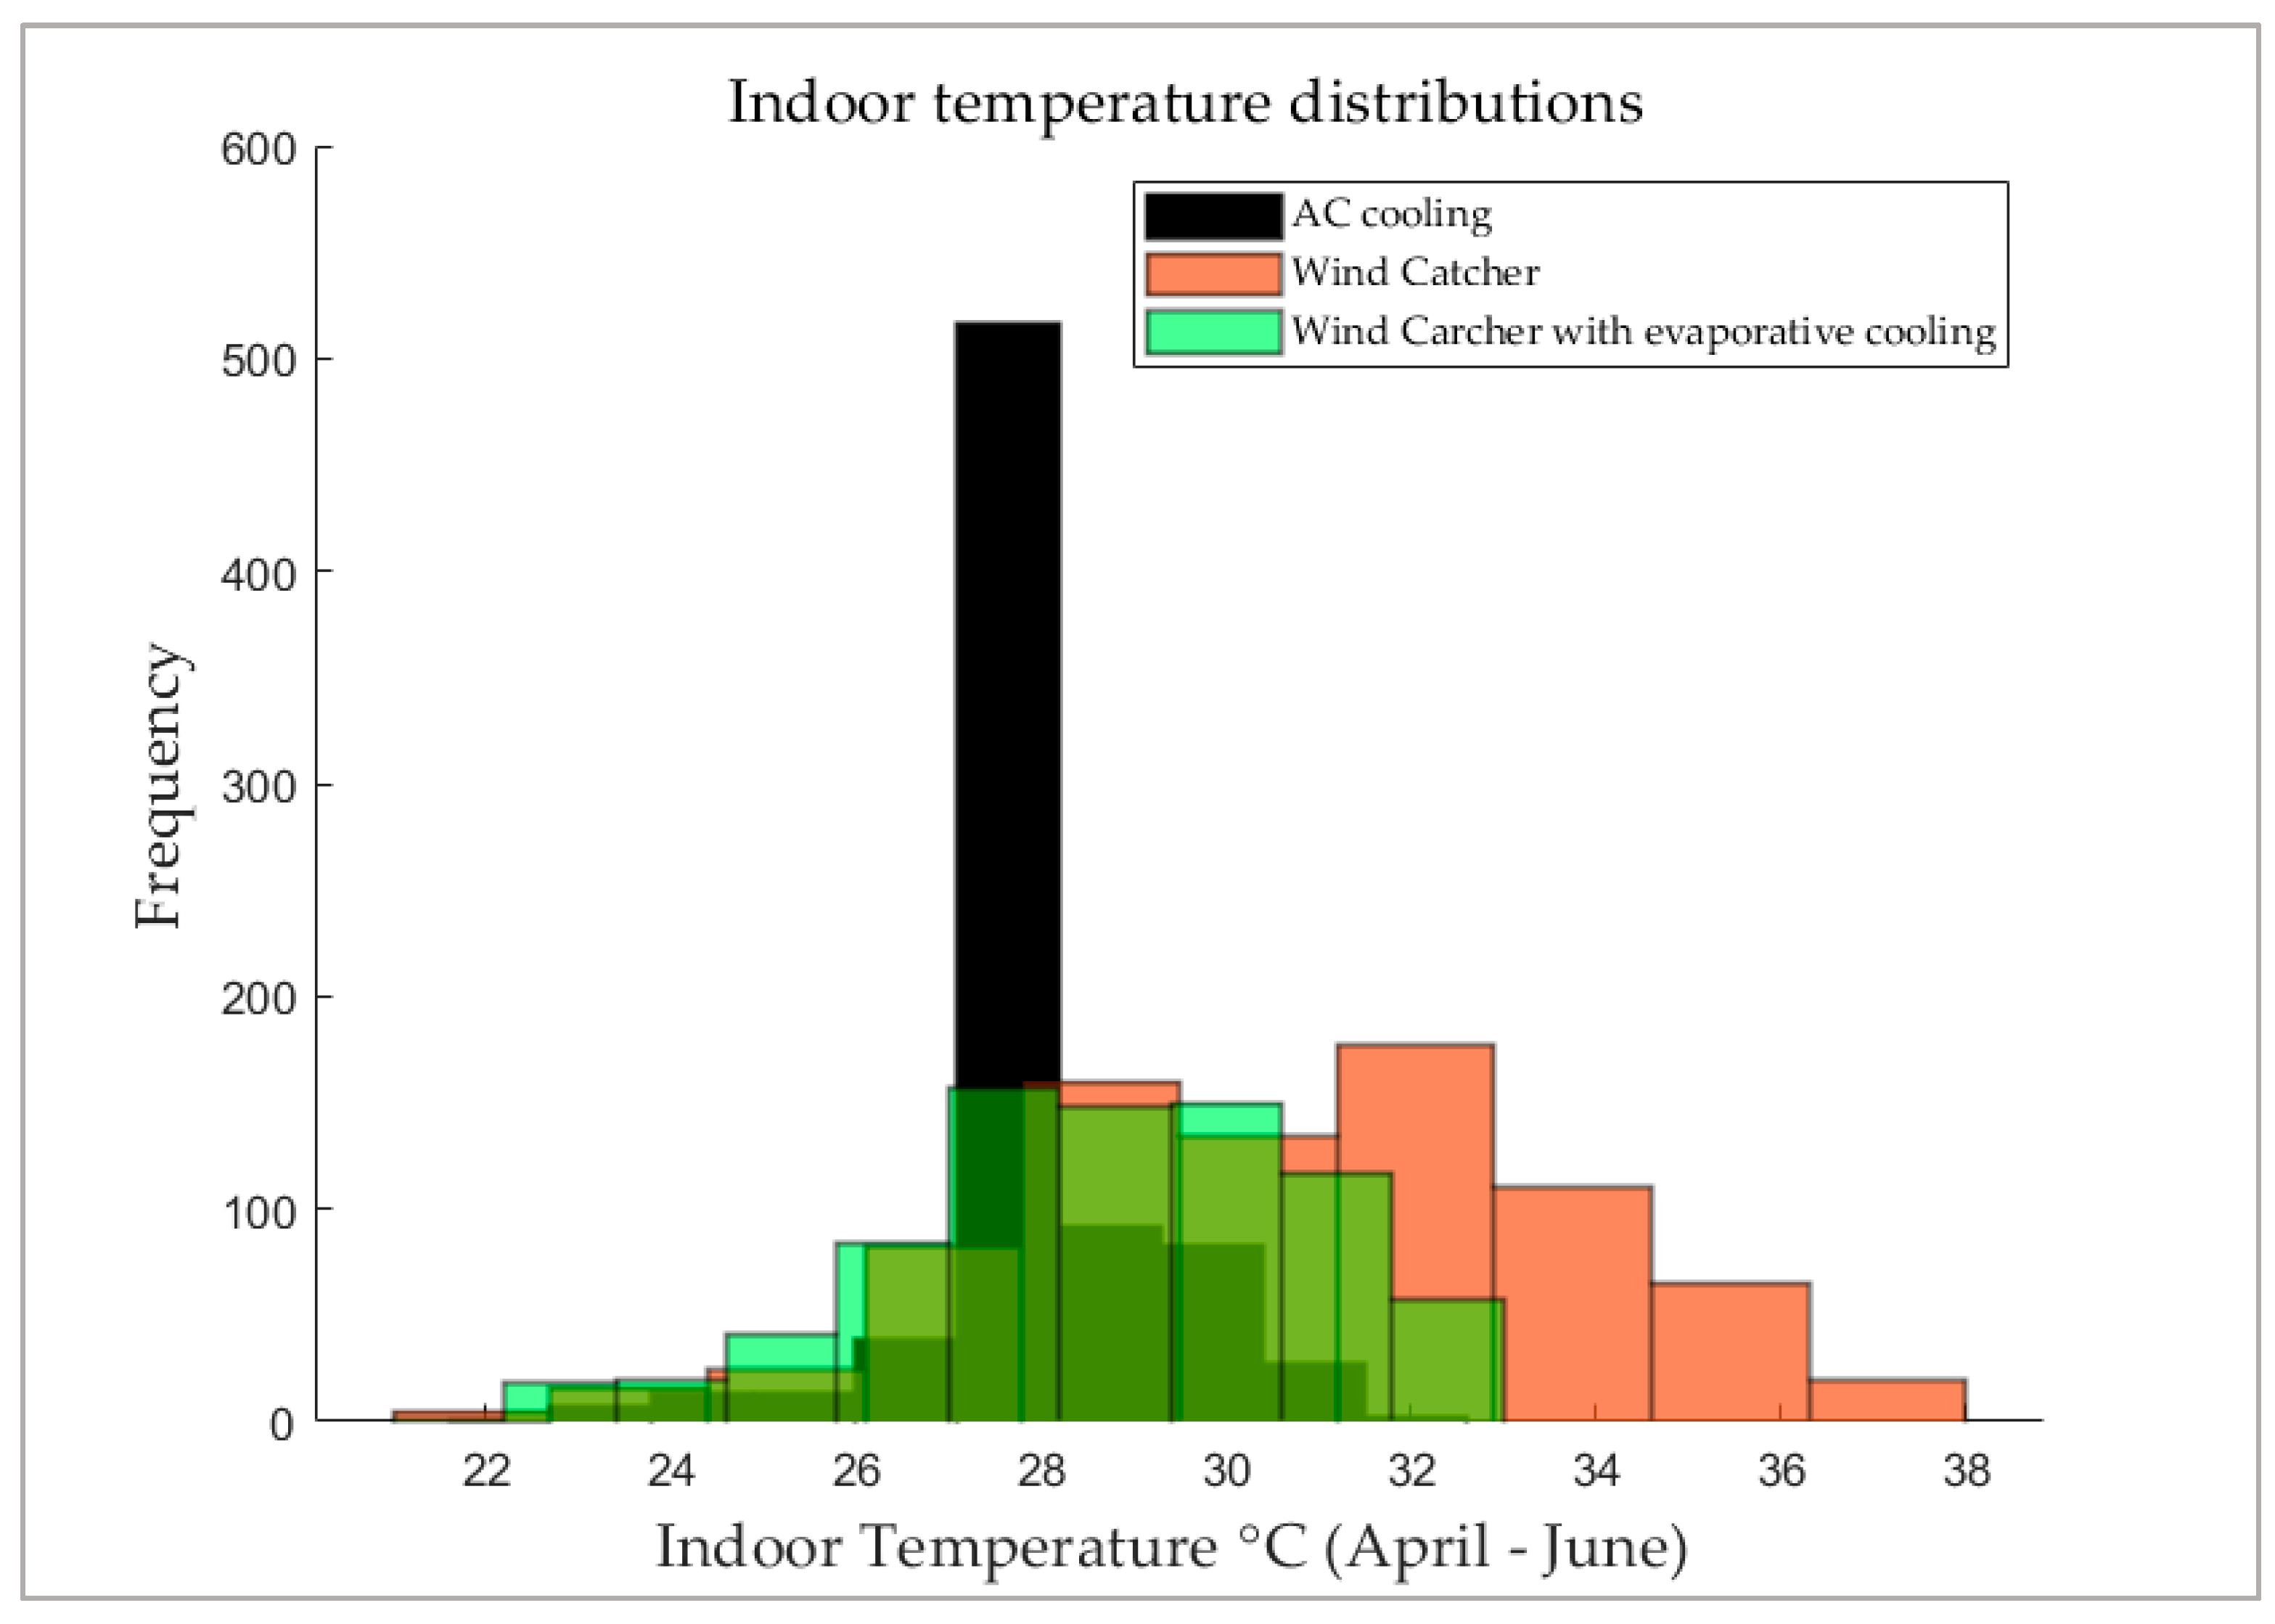
A comparison of the temperature distributions over the analysis period (April–June) is presented in
Figure 12. The effect of evaporative cooling on the windcatcher for improved indoor air temperature is evident from the figure, as the temperature distribution for Scenario 3 is markedly more to the left than that of Scenario 2. The mean values are 28.1 °C, 30.7 °C and 28.4 °C for the Scenarios 1, 2 and 3 respectively. The utilization of evaporative cooling together with the wind catcher not only brings the average indoor temperature much closer to the baseline, but is also a natural ventilation scenario, thus allowing the building occupants to adapt to their surroundings, and to achieve thermal comfort at higher indoor air temperatures as compared to mechanical air-conditioning only. The result is a completely thermally comfortable environment, as already discussed in
Section 5.1,
Section 5.2 and
Section 5.3.
As mentioned previously, this improvement in thermal comfort comes at the cost of increased humidity as presented in
Figure 13. The box plots clearly show this, as both the median and the spread of relative humidity results were the highest in Scenario 3. This was expected as evaporative cooling directly adds moisture to the classroom environment, thus increasing humidity. However, this did not affect the comfort as the ASHRAE adaptive comfort indicator results in a prediction of 100% comfortable occupied hours. Here, the limited applicability of this adaptive comfort metric had already been discussed, and that this comfort analysis should be understood with this limitation in mind.
Figure 14 is a similar plot for carbon dioxide concentration; while the wind catcher achieved the lowest values here, thermal comfort was very poor.
It is interesting that none of the scenarios could deliver satisfactory indoor air quality. Even in the complete natural ventilation case, the wind catcher without evaporative cooling that delivers unsatisfactory thermal comfort, also had a median CO
2 concentration above the 1100 ppm ASHRAE stipulated threshold. Clearly, the issue of indoor air quality is a challenge, which is in agreement with similar studies on schools in literature [
57].
The summary table to conclude this analysis is presented in
Table 3. The baseline operates at the highest energy use amongst the three scenarios, but also suffers from poor air quality and mediocre thermal comfort. The wind catcher only design uses a fifth of the AC’s energy, somewhat improves the air quality but leads to a prediction of unacceptable thermal comfort result. The addition of the evaporative cooler to the wind catcher was simulated to deliver 100% comfortable hours, at 47.6% energy use of the baseline, but at higher humidity levels in the classroom and a small water use amount.
Costs were not considered here. Clearly, installing a wind catcher involves cost; adding evaporative cooling adds further capital and maintenance costs; the cost of water is small. While it would be possible to retrofit to existing schools, it would be easier and cheaper to include in new build or major refurbishment projects. Costs will be offset by much reduced energy cost, and replacement and maintenance of mechanical cooling systems. A much greater benefit however will come from the improvement in comfort and IAQ and—according to the literature—better educational outcomes. These are very hard to quantify, but likely to far outweigh system costs. A detailed cost analysis, preferably on a real building, would be useful exercise.
6. Conclusions
In this paper, a natural ventilation design, the wind catcher was assessed that could provide thermal comfort in educational buildings in Kuwait, whilst reducing the cooling energy demand and indoor CO2 levels. Compared to air-conditioning only, the wind catcher with evaporative cooling was found to be the best option that resulted in a reduction of energy use by 52.4%, and improved thermal comfort with the percentage comfortable hours increasing from 74% to 100%. While the indoor CO2 levels improved as well, in all three scenarios the CO2 concentration was above the ASHRAE stipulated limit for a large portion of the occupied hours. In summary, this study established that within the climatic scope of this work, the recommended strategy of the wind catcher with evaporative cooling is a highly energy efficient option that can successfully provide thermal comfort, but slightly improved indoor air quality. The key findings from this work were as follows:
Using only a split room cooling system with single sided window ventilation to provide thermal comfort in Kuwaiti classrooms led to high energy use, considerable discomfort and poor indoor air quality.
In this case, the wind catcher supplemented by the evaporative cooler was the best design solution, resulting in highly comfortable conditions in the summer (zero uncomfortable hours) accompanied by a drastic reduction in energy use (52.4% reduction) but a slight improvement in indoor air quality, at the cost of increased humidity levels.
While the energy savings and improved thermal comfort is promising, the challenge of improving indoor air quality in schools still remains—at least with this design. These results are subject to the limitations in the modelling work and the unavailability of a suitable thermal comfort metric for naturally ventilated buildings in such hot climatic conditions. For the lack of a better choice and because developing a suitable adaptive thermal model was beyond the scope of this paper, the ASHRAE adaptive model was used here, despite the fact that the outdoor running mean prevailing temperature exceeded the 33.5 °C limit for significant parts of the summer. Additionally, costs were not analysed, although they were briefly discussed. In view of these limitations and the previously presented conclusions, several avenues for future work are suggested as follows,
The airflow modelling in this paper was based on wind pressure coefficients (Cp) in lookup tables using the DesignBuilder V5.4 software, having limited accuracy for natural ventilation-based designs such as wind catchers. Future investigations can utilize computational fluid dynamics (CFD) where more accurate wind pressure coefficients (Cp) can be calculated for more reliable simulations.
The sizing of the wind catcher system in this work was based on recommendations from the literature [
58]. However, this work can be extended to conduct an optimization of the wind catcher design for the buildings considered, within the considered climates.
The scope of application of this wind catcher based design can be expanded to more humid climates by considering desiccant evaporative cooling.
To build on the predicted improvement potential using the wind catcher plus evaporative cooler design, a practical demonstration activity for different building archetypes is suggested. This would help highlight any unforeseen inefficiencies in the proposed design while demonstrating its utility in practice and provide data for the validation of future models. It should be noted that such a demonstration activity in Kuwait has not been documented in literature to date.
In the hot Kuwaiti summer, to promote energy efficiency, buildings may by subject to low air change rates, which can lead to adverse health impacts with an associated economic cost. The proposed wind catcher based design may help address these issues, but it has not been explored in this work and may be worthy of investigation.
Review of thermal comfort indicators within the context of hot desert climates such as Kuwait (where prevailing mean temperature go beyond 33.5 °C, the ASHRAE 55 upper limit) highlighted the limited applicability of currently available international adaptive comfort models. The applicability of the widely used thermal comfort models for extreme hot climates should be investigated—especially as our world is predicted to be hotter by the end of the century.
Building a fully instrumented classroom with wind catcher to test out the system in practice.


