
Evaluation of Seismic Vulnerability of Hospitals in the Tehran Metropolitan Area


Abstract
1. Introduction
2. Building Taxonomy of Hospitals in Tehran
3. Discussion and Comparisons of Fragility Curves for Seismic Vulnerability Investigations of the Tehran Metropolitan Area
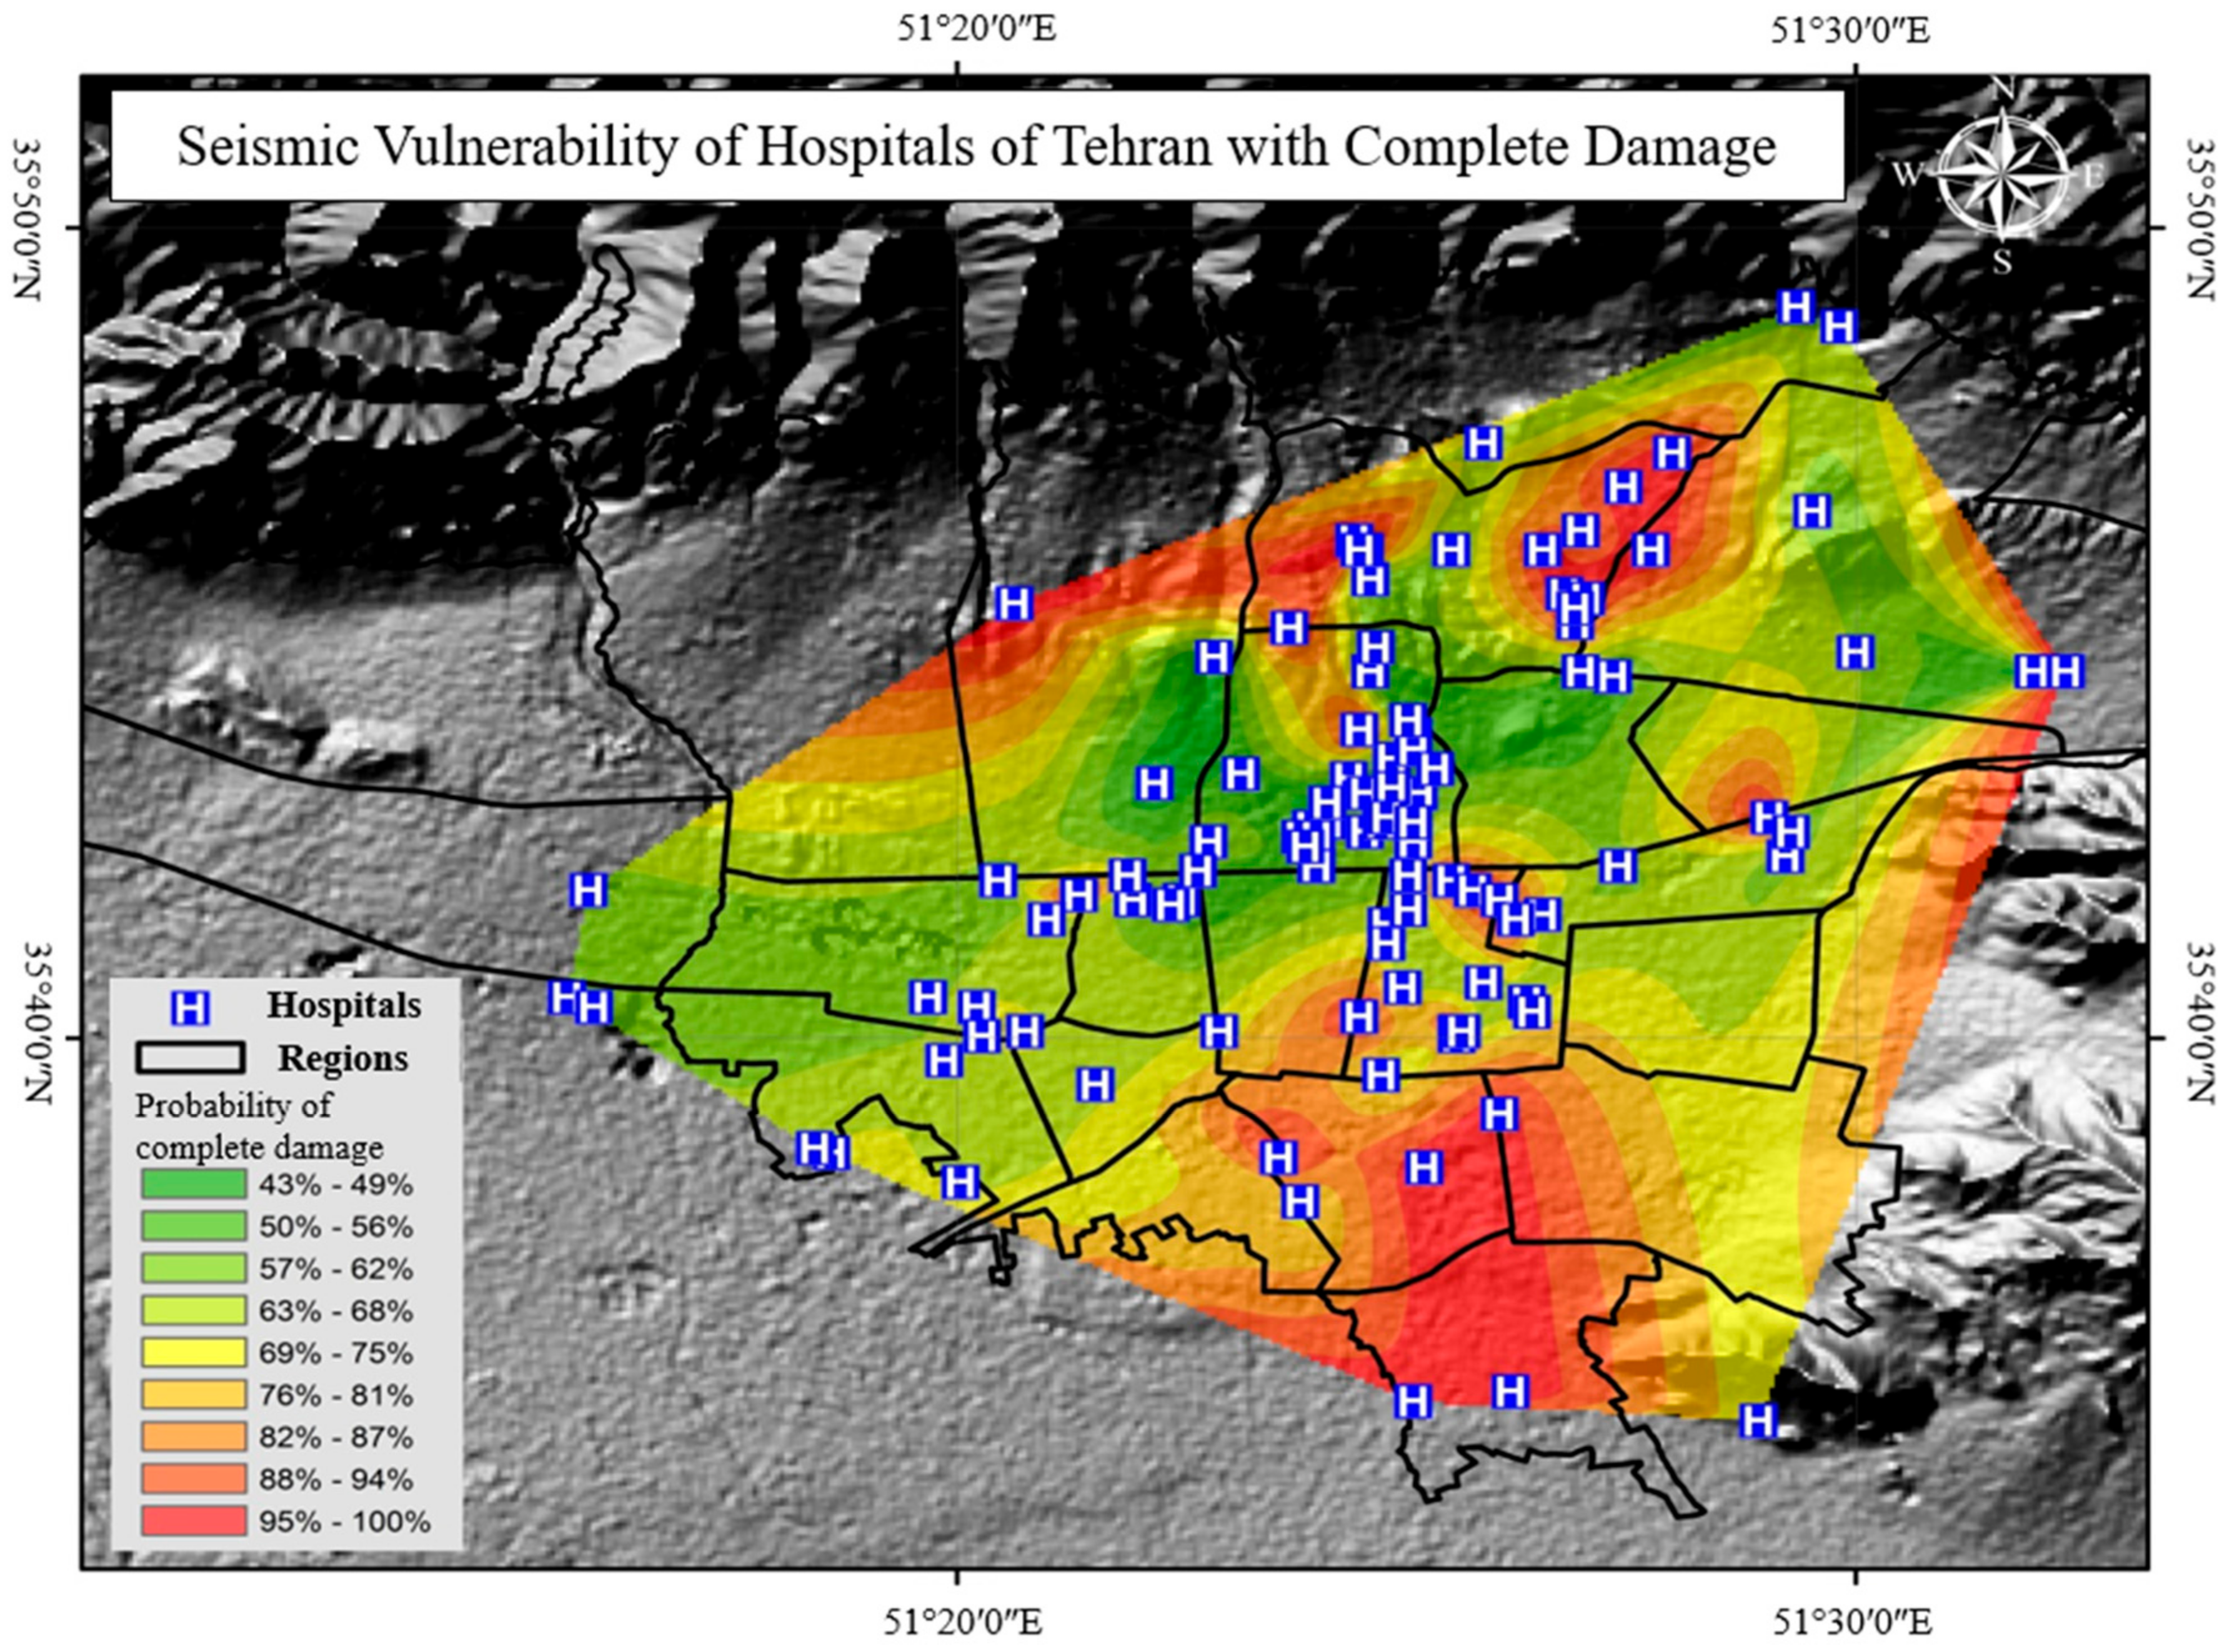
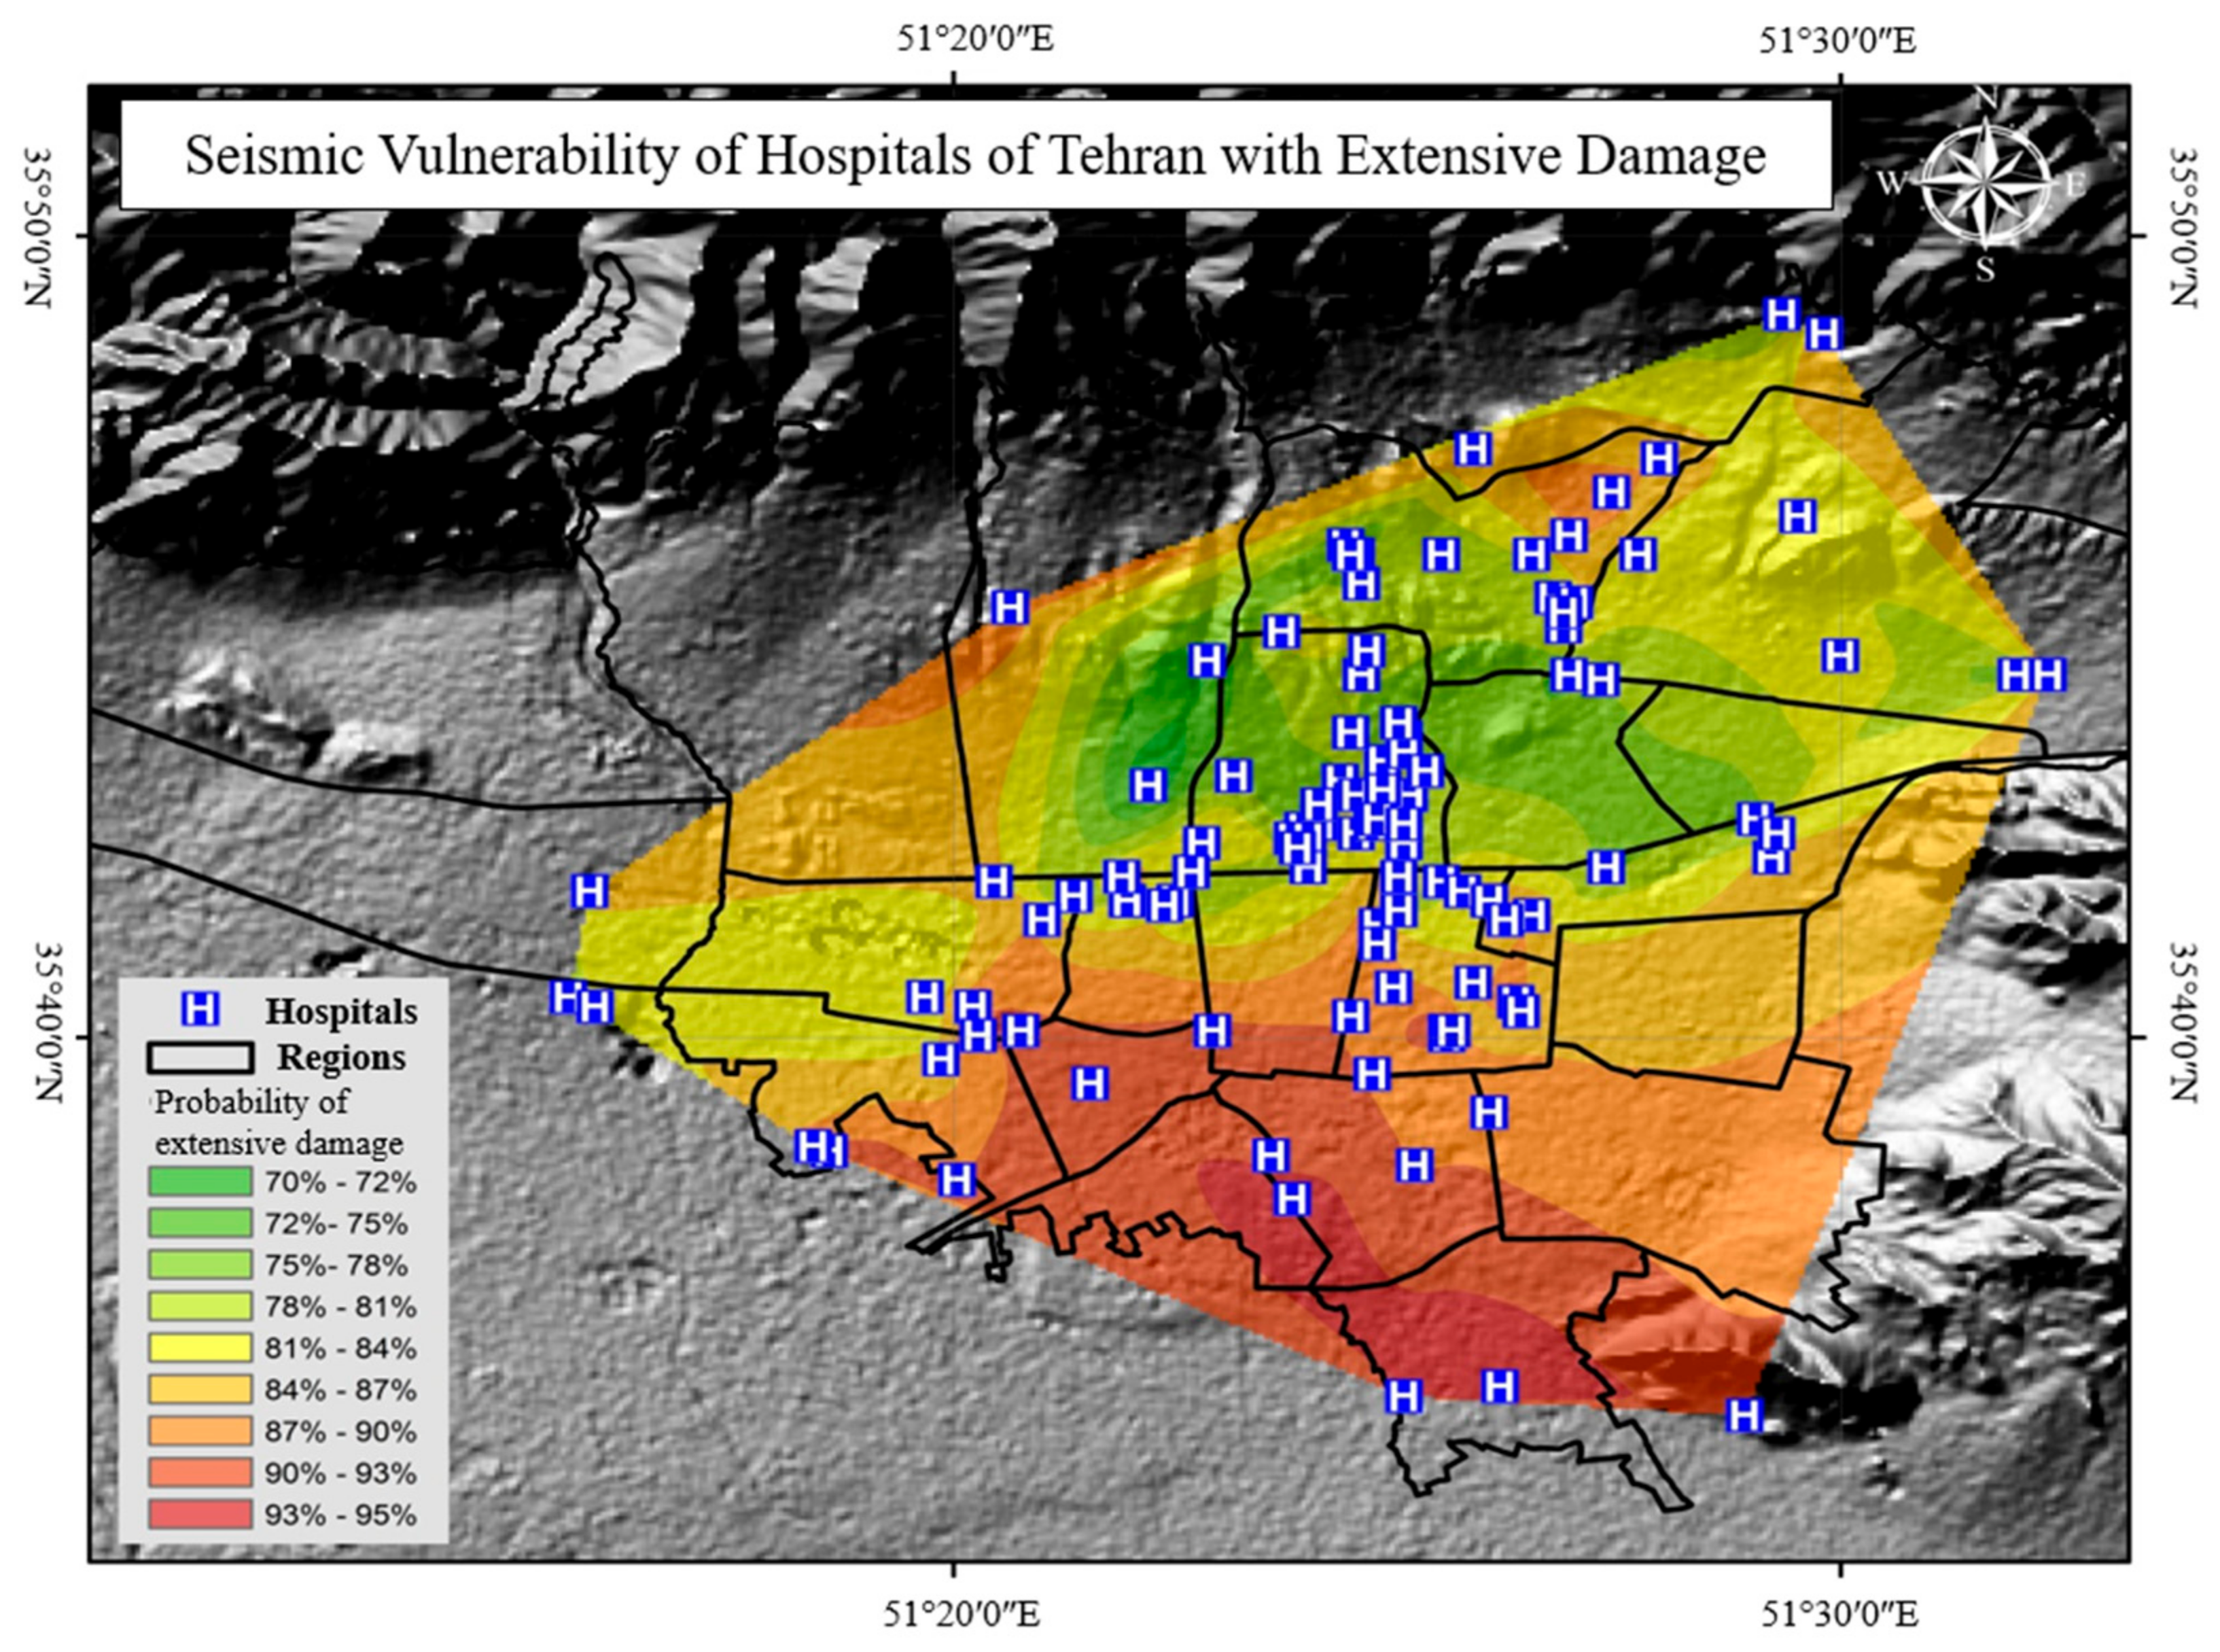
4. Developing Seismic Vulnerability Zoning Maps Based on the Inverse Distance Squared Weighted Interpolation
5. Observations and Discussions
6. Conclusions
Author Contributions
Funding
Data Availability Statement
Acknowledgments
Conflicts of Interest
References
- USGS, Earthquake Statistics. Available online: https://www.statista.com/statistics/263108/global-death-toll-due-to-earthquakes-since-2000/ (accessed on 24 July 2020).
- Kenny, C. Why Do People Die in Earthquakes? The Costs, Benefits and Institutions of Disaster Risk Reduction in Developing Countries; Policy Research Working Papers; The World Bank: Washington, DC, USA, 2009; pp. 3–10. [Google Scholar]
- Nag, O.S. The World’s 10 Most Earthquake Prone Countries, Worldatlas. 2019. Available online: https://www.worldatlas.com/articles/the-world-s-10-most-earthquake-prone-countries.html (accessed on 24 July 2020).
- USGS, Which Country Has the Most Earthquakes? Available online: https://www.usgs.gov/faqs/which-country-has-most-earthquakes?qt-news_science_products=0#qt-news_science_products (accessed on 24 July 2020).
- OECD. Financial Management of Earthquake Risk; Organisation for Economic Co-operation and Development: Paris, France, 2018; Available online: https://www.oecd.org/finance/insurance/Financial-management-of-earthquake-risk.pdf (accessed on 24 July 2020).
- Silva, V.; Amo-Oduro, D.; Calderon, A.; Costa, C.; Dabbeek, J.; Despotaki, V.; Martins, L.; Pagani, M.; Rao, A. Development of a global seismic risk model. Earthq. Spectra 2020, 36, 372–394. [Google Scholar] [CrossRef]
- Kamranzad, F.; Memarian, H.; Zare, M. Earthquake Risk Assessment for Tehran, Iran. Int. J. Geo. Inf. 2020, 9, 430. [Google Scholar] [CrossRef]
- Moinfar, A.; Mahdavian, A.; Maleki, E. Historical and Instrumental Earthquake Data Collection of Iran; Cultural Fairs Institute: Tehran, Iran, 1994; p. 446. [Google Scholar]
- Farzampour, A.; Khatibinia, M.; Mansouri, I. Shape optimization of butterfly-shaped shear links using grey wolf algorithm. Ing. Sismica 2019, 36, 27–41. [Google Scholar]
- Farzampour, A.; Eatherton, M.R. Parametric study on butterfly-shaped shear links with various geometries. In Proceedings of the 11th National Conference on Earthquake Engineering, Los Angeles, CA, USA, 25–29 June 2018. [Google Scholar]
- Farzampour, A.; Kamali-Asl, A.; Hu, J.W. Unsupervised identification of arbitrarily-damped structures using time-scale independent component analysis: Part I. J. Mech. Sci. Technol. 2018, 32, 567–577. [Google Scholar] [CrossRef]
- Hamzehloo, H.; Alikhanzadeh, A.; Rahmani, M. Seismic Hazard Maps of Iran. In Proceedings of the 15th World Conference on Earthquake Engineering (15WCCEE), Lisbon, Portugal, 24–28 September 2012. [Google Scholar]
- Farzampour, A.; Mansouri, I.; Dehghani, H. Incremental Dynamic Analysis for Estimating Seismic Performance of Multi-Story Buildings with Butterfly-Shaped Structural Dampers. Buildings 2019, 9, 78. [Google Scholar] [CrossRef]
- Farzampour, A.; Eatherton, M.R. Parametric computational study on butterfly-shaped hysteretic dampers. Front. Struct. Civ. Eng. 2019, 13, 1214–1226. [Google Scholar] [CrossRef]
- Sadeghi, M.; Ghafory-Ashtiany, M.; Pakdel-Lahiji, N. Developing seismic vulnerability curves for typical Iranian buildings. J. Risk Reliab. 2015, 229, 627–640. [Google Scholar] [CrossRef]
- Whitman, R.V.; Reed, J.W.; Hong, S.T. Earthquake damage probability matrices. In Proceedings of the Fifth World Conference on Earthquake Engineering, Rome, Italy, 25–29 June 1973. [Google Scholar]
- Biglari, M.; Formisano, A. Damage Probability Matrices and Empirical Fragility Curves from Damage Data on Masonry Buildings After Sarpol-e-zahab and Bam Earthquakes of Iran. Front. Built. Environ. 2020, 6, 2297–3362. [Google Scholar] [CrossRef]
- Eleftheriadou, A.K.; Karabinis, A.I. Damage probability matrices derived from earthquake statistical data. In Proceedings of the 14th World Conference on Earthquake Engineering, Beijing, China, 12–17 October 2008. [Google Scholar]
- Tavakoli, B.; Tavakoli, S. Estimating the vulnerability and loss functions of residential buildings. Nat. Hazards 1993, 7, 155–171. [Google Scholar] [CrossRef]
- JICA, The Study on Seismic Microzoning of the Greater Tehran Area in the Islamic Republic of Iran, Tokyo, Japan. 2000. Available online: https://openjicareport.jica.go.jp/pdf/11611753_01.pdf (accessed on 25 July 2020).
- Jalalian, M. Deriving of Empirical Vulnerability Functions for Iran. Master’s Thesis, Sharif University of Technology, Tehran, Iran, 2006. [Google Scholar]
- Dare-zereshki, M.; Gafory-Ashtiany, M.; Mansori, B. Developing Fragility Curves for Unreinforced Masonry Buildings of Tehran via Simplified Non-Linear Static Analysis. Master’s Thesis, International Institute of Earthquake Engineering and Seismology (IIEES), Tehran, Iran, 2008. [Google Scholar]
- Kazemi, H.; Ghafory-Ashtiany, M.; Azarbakht, A. Effect of epsilon-based record selection on fragility curves of typical irregular steel frames with concrete shear walls in Mashhad city. Int. J. Adv. Struct. Eng. 2013, 5, 1–11. [Google Scholar] [CrossRef]
- Farzampour, A.; Mansouri, I.; Mortazavi, S.J.; Hu, J.W. Force–Displacement Relationship of the Butterfly-Shaped Beams Based on Gene Expression Programming. Int. J. Steel Struct. 2020, 20. [Google Scholar] [CrossRef]
- Clementi, F.; Ferrante, A.; Giordano, E.; Dubois, F.; Lenci, S. Damage assessment of ancient masonry churches stroked by the Central Italy earthquakes of 2016 by the non-smooth contact dynamics method. Bull. Earthq. Eng. 2020, 18, 455–486. [Google Scholar] [CrossRef]
- Esteghamati, M.Z.; Farzampour, A. Probabilistic seismic performance and loss evaluation of a multi-story steel building equipped with butterfly-shaped fuses. J. Constr. Steel Res. 2020, 172, 106187. [Google Scholar] [CrossRef]
- Farzampour, A. Compressive Behavior of Concrete under Environmental Effects. In Compressive Strength of Concrete; Kryvenko, P., Ed.; IntechOpen: London, UK, 2019. [Google Scholar]
- Formisano, A. Seismic damage assessment of school buildings after 2012 Emilia Romagna earthquake. Ing. Sismica 2012, 29, 72–86. [Google Scholar]
- Ribilotta, E.; Giordano, E.; Ferrante, A.; Clementi, F.; Lenci, S. Tracking modal parameter evolution of different cultural heritage structures damaged by central Italy earthquake of 2016. Key Eng. Mater. 2019, 817, 334–341. [Google Scholar] [CrossRef]
- Formisano, A.; Di Lorenzo, G.; Landolfo, R. Non-linear analyses and fragility curves of European existing single-story steel buildings. Proc. AIP Conf. 2019, 2116, 260020. [Google Scholar]
- Poiani, M.; Gazzani, V.; Clementi, F.; Lenci, S. Aftershock fragility assessment of Italian cast–in–place RC industrial structures with precast vaults. J. Build. Eng. 2020, 29, 101206. [Google Scholar] [CrossRef]
- Applied Technology Council. ATC-13, Earthquake Damage Evaluation Data for California; Applied Technology Council (ATC): Redwood City, CA, USA, 1985. [Google Scholar]
- Department of Homeland Security; Federal Emergency Management Agency. HAZUS, Technical Manual: Multi-Hazard Loss Estimation Methodology (HAZUS_MH MR4); Federal Emergency Management Agency (FEMA): Washington, DC, USA, 2003. [Google Scholar]
- Poland, C.D.; Hill, J.; Sharpe, R.L.; Soulages, J. Vision 2000: Performance Based Seismic Engineering of Buildings; Structural Engineers Association of California: Sacramento, CA, USA, 1995. [Google Scholar]
- Applied Technology Council; Federal Emergency Management Agency. NEHRP Guidelines for the Seismic Rehabilitation of Buildings (FEMA Publication 273); Federal Emergency Management Agency (FEMA): Washington, DC, USA, 1997. [Google Scholar]
- Permanent committee of Revising the code of Practice for Seismic Resistant Design of Buildings. Iranian Code of Practice for Seismic Resistant Design of Buildings-Standard No. 2800, 1st ed.; Building and Housing Research Center (BHRC): Tehran, Iran, 1988. [Google Scholar]
- Permanent committee of Revising the code of Practice for Seismic Resistant Design of Buildings. BHRC, Code of Practice for Seismic Resistant Design of Buildings (Standard no. 2800 (IS 2800-05)) 3rd “Iranian”; Building and Housing Research Center (BHRC): Tehran, Iran, 2005. [Google Scholar]
- Statistical Center of Iran. Atlas of Selected Results of the 2011 National Population and Housing Census; Vice Presidency for Strategic Planning and Supervision: Tehran, Iran, 2014. [Google Scholar]
- Gholipour, Y.; Bozorgnia, Y.; Rahnama, M.; Berberian, M.; Shojataheri, J. Probabilistic Seismic Hazard Analysis, Phase I–Greater Tehran Regions; Faculty of Engineering, University of Tehran: Tehran, Iran, 2008. [Google Scholar]
- Zare, M. Seismic Hazard Zoning in Iran: A State-of-the-Art on the Studies during Four Decades. J. Seismol. Earthq. Eng. 2017, 19, 71–101. [Google Scholar]
- Zare, M.; Ghaychi Afrouz, S. Crisis management of Tohoku; Japan earthquake and tsunami, 11 March 2011. Iran. J. Public Health 2012, 41, 12. [Google Scholar]
- Farzampour, A.; Mansouri, I.; Hu, J.W. Seismic behavior investigation of the corrugated steel shear walls considering variations of corrugation geometrical characteristics. Int. J. Steel Str. 2018, 18, 1297–1305. [Google Scholar] [CrossRef]
- Paslar, N.; Farzampour, A.; Hatami, F. Infill plate interconnection effects on the structural behavior of steel plate shear walls. Thin-Walled Struct. 2020, 149, 106621. [Google Scholar] [CrossRef]
- Mansouri, I.; Arabzadeh, A.; Farzampour, A.; Hu, J.W. Seismic behavior investigation of the steel multi-story moment frames with steel plate shear walls. Steel Compos. Struct. 2020, 37, 91–98. [Google Scholar]
- Firuzi, E.; Ansari, A.; Hosseini, K.A.; Rashidabadi, M. Prbabilistic earthquake loss model for residential buildings in Tehran, Iran to quantify annualized earthquake loss. Bull. Earthq. Eng. 2019, 17, 2383–2406. [Google Scholar] [CrossRef]
- Hajibabaee, M.; Amini-Hosseini, K.; Ghayamghamian, M. Earthquake risk assessment in urban fabrics based on physical, socioeconomic and response capacity parameters (a case study: Tehran city). Nat. Hazards 2014, 74, 2229–2250. [Google Scholar] [CrossRef]


| FEMA273 1, ATC13 2, Vision2000, HAZUS | JICA 3 | Jalalian |
|---|---|---|
| Steel moment frame (S1) | Steel frame | - |
| Concrete moment frame (C1) | Reinforced concrete frame | Concrete frame |
| Unreinforced masonry bearing walls (URM) | Brick and steel or stone and steel 4 | Masonry |
| Districts | Hospitals per 1000 Hectares 1 | Population | Hospitals per 100,000 Population |
|---|---|---|---|
| North | 4.7 | 1,033,533 | 2.9 |
| East | 2.7 | 1,969,480 | 1.6 |
| West | 1.1 | 1,759,292 | 1.5 |
| Center | 16.9 | 1,403,828 | 8.5 |
| South | 3.9 | 2,145,766 | 2.2 |
| ATC13 | 0–1% | 1–10% | 10–30% | 30–60% | 60–100% | 100% |
| Slight | Light | Moderate | Heavy | Major | Destroyed | |
| FEMA | 0–1% | 1–10% | 10–30% | 30–100% | 100% | |
| Very Light | Light | Moderate | Severe | Complete | ||
| HAZUS | 0–2% | 0–10% | 10–50% | 50–100% | 100% | |
| None | Slight | Moderate | Extensive | Complete | ||
| VISION2000 | 0–2% | 0–10% | 10–50% | 50–100% | 100% | |
| Negligible | Light | Moderate | Severe | Complete | ||
| JICA | - | - | - | 100% | ||
| Complete | ||||||
| Jalalian 1 | 0–30% | 30–50% | 60–100% | - | ||
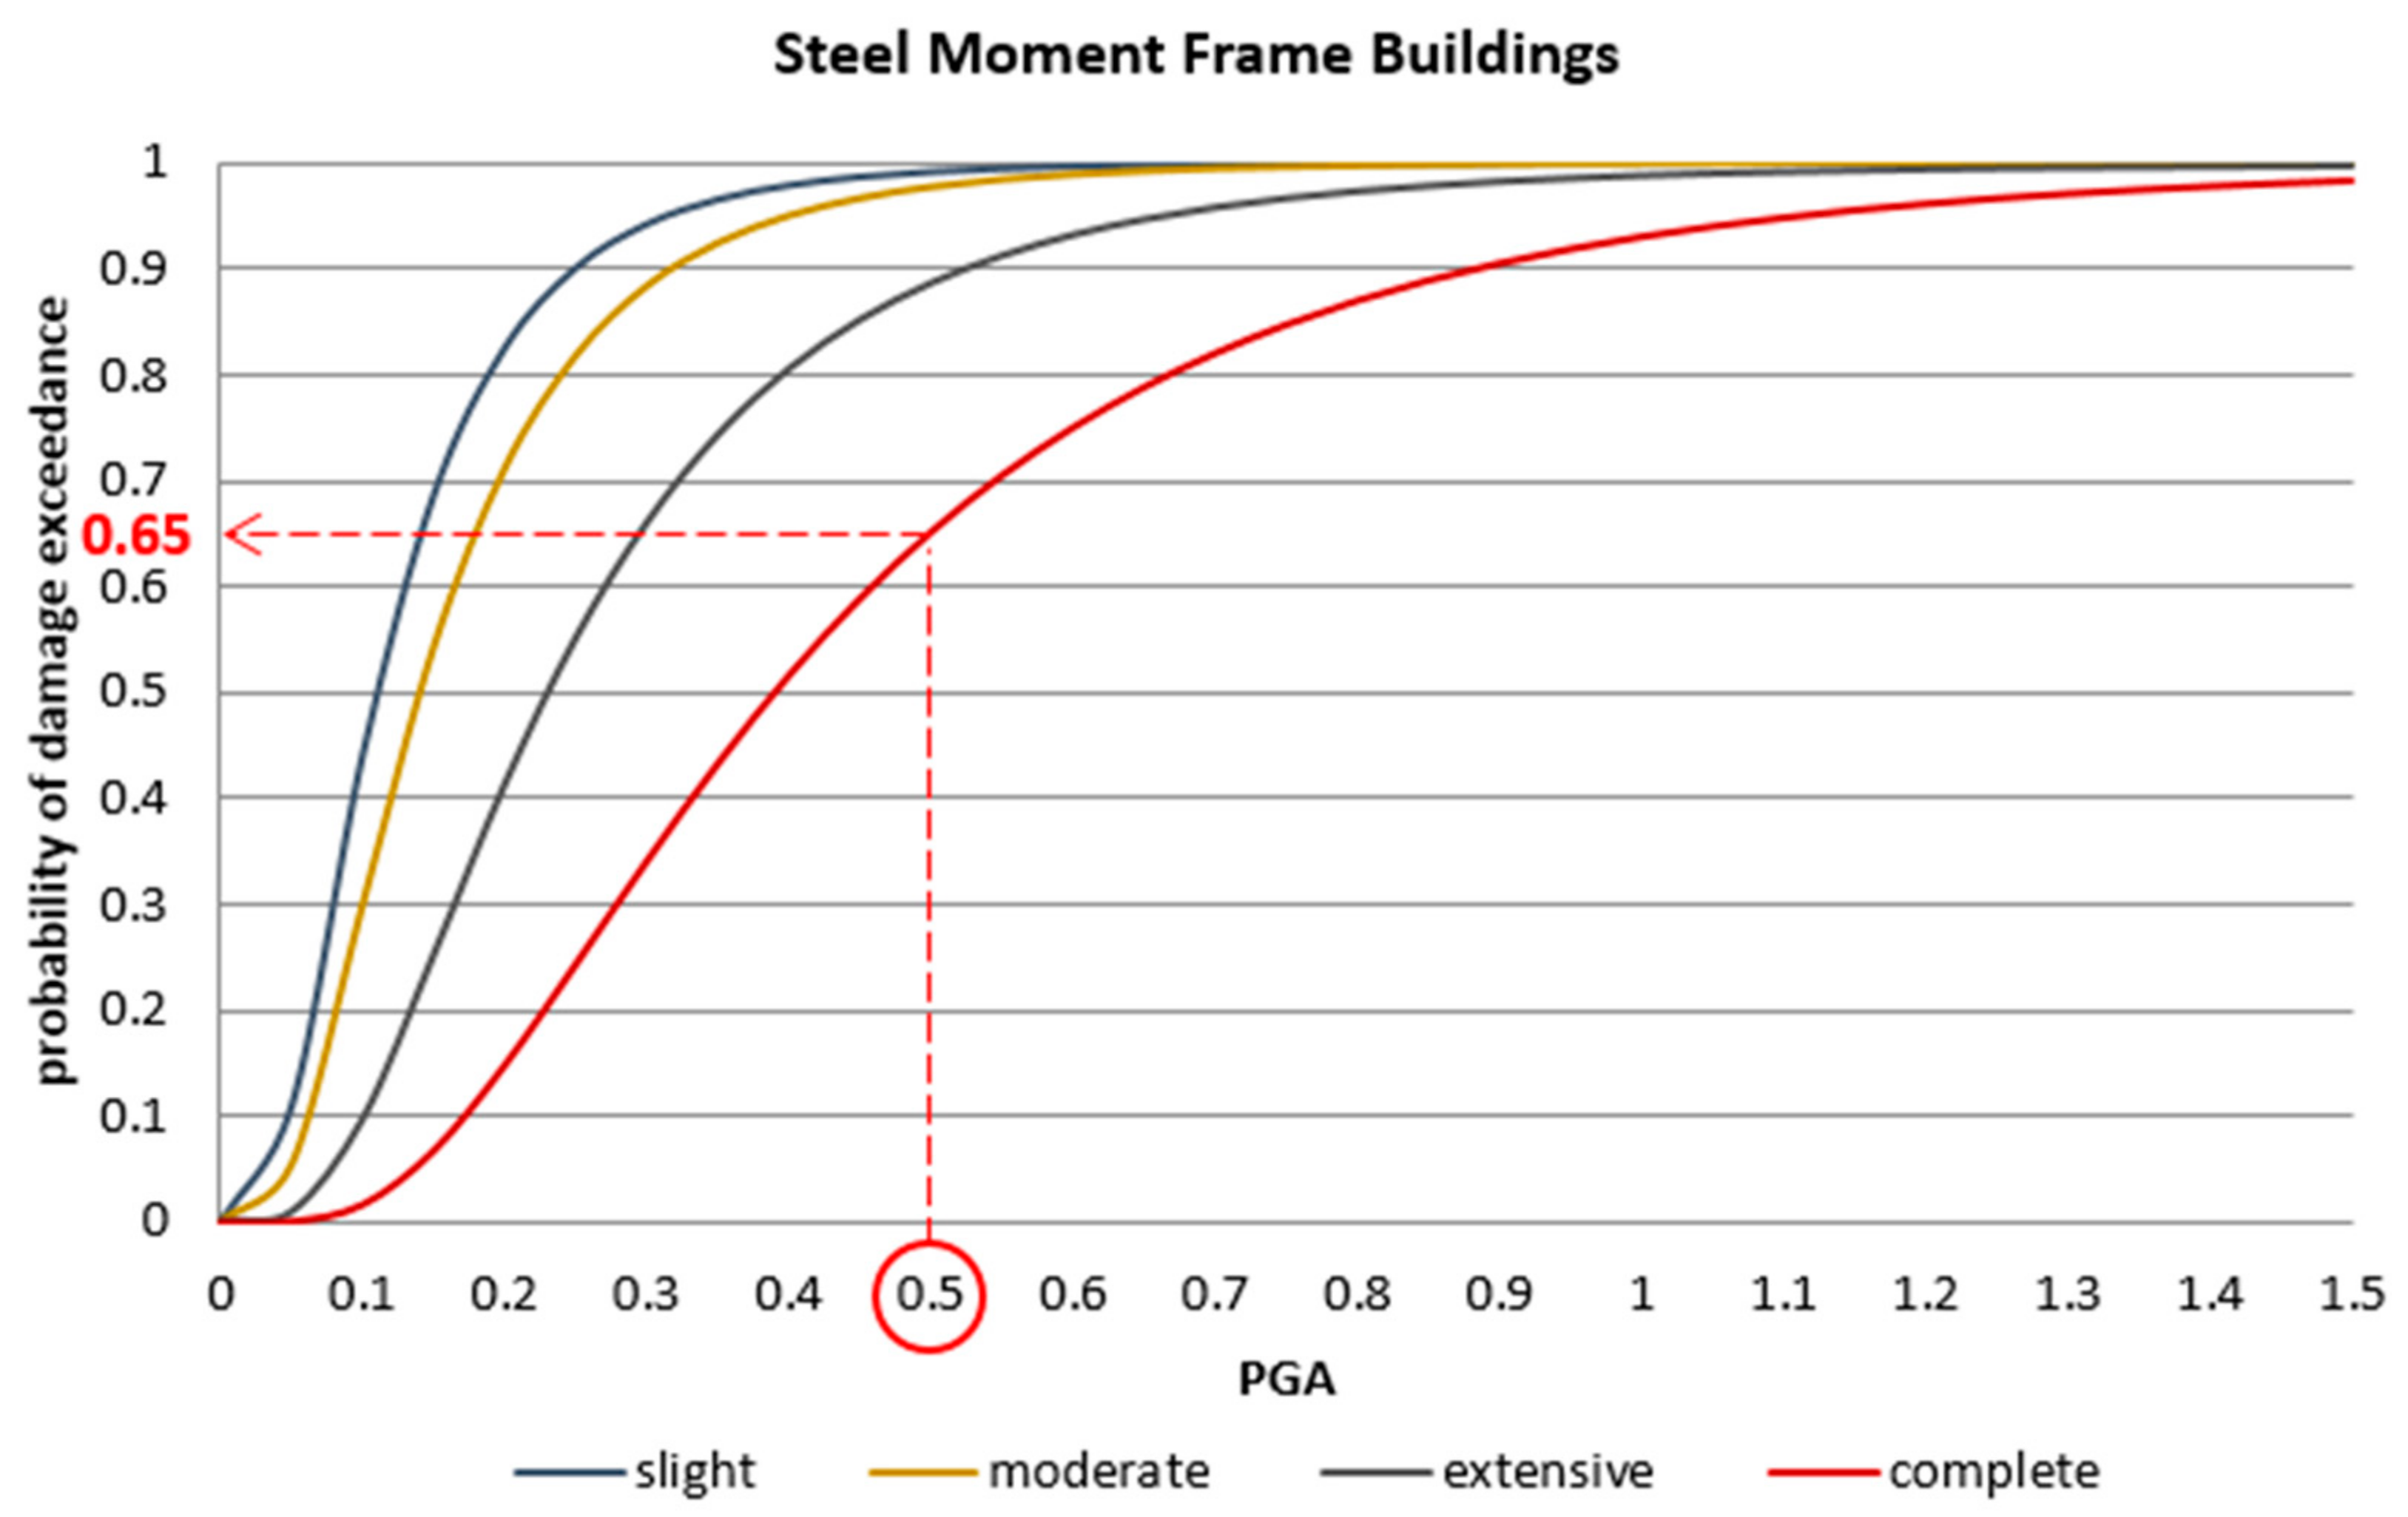
| Damage Probability of Steel Moment Frame Buildings | ||||||
|---|---|---|---|---|---|---|
| Slight | Moderate | Extensive | Complete | |||
| ATC13 | 53% | 35% | 27% | 21% | 19% | 18% |
| FEMA | - | - | - | - | - | - |
| HAZUS | 100% | 97% | 90% | 65% | ||
| VISION2000 | - | - | - | - | ||
| JICA | - | - | - | 57% | ||
| Jalalian | - | - | - | - | ||
| Damage Probability of Concrete Frame Buildings | ||||||
|---|---|---|---|---|---|---|
| Slight | Moderate | Extensive | Complete | |||
| ATC13 | 50% | 40% | 28% | 20% | 18% | 17% |
| FEMA | - | - | - | - | - | - |
| HAZUS | 100% | 97% | 84% | 58% | ||
| VISION2000 | 50% | 16% | 9% | 8% | ||
| JICA | - | - | - | 57% | ||
| Jalalian | 100% | - | 100% | - | ||
| Damage Probability of Masonry Bearing Wall Buildings | ||||||
|---|---|---|---|---|---|---|
| Slight | Moderate | Extensive | Complete | |||
| ATC13 | - | - | - | - | - | - |
| FEMA | - | - | - | - | - | - |
| HAZUS | 98% | 95% | 85% | 67% | ||
| VISION2000 | - | - | - | - | ||
| JICA | - | - | - | 83% | ||
| Jalalian | 85% | 75% | 48% | - | ||
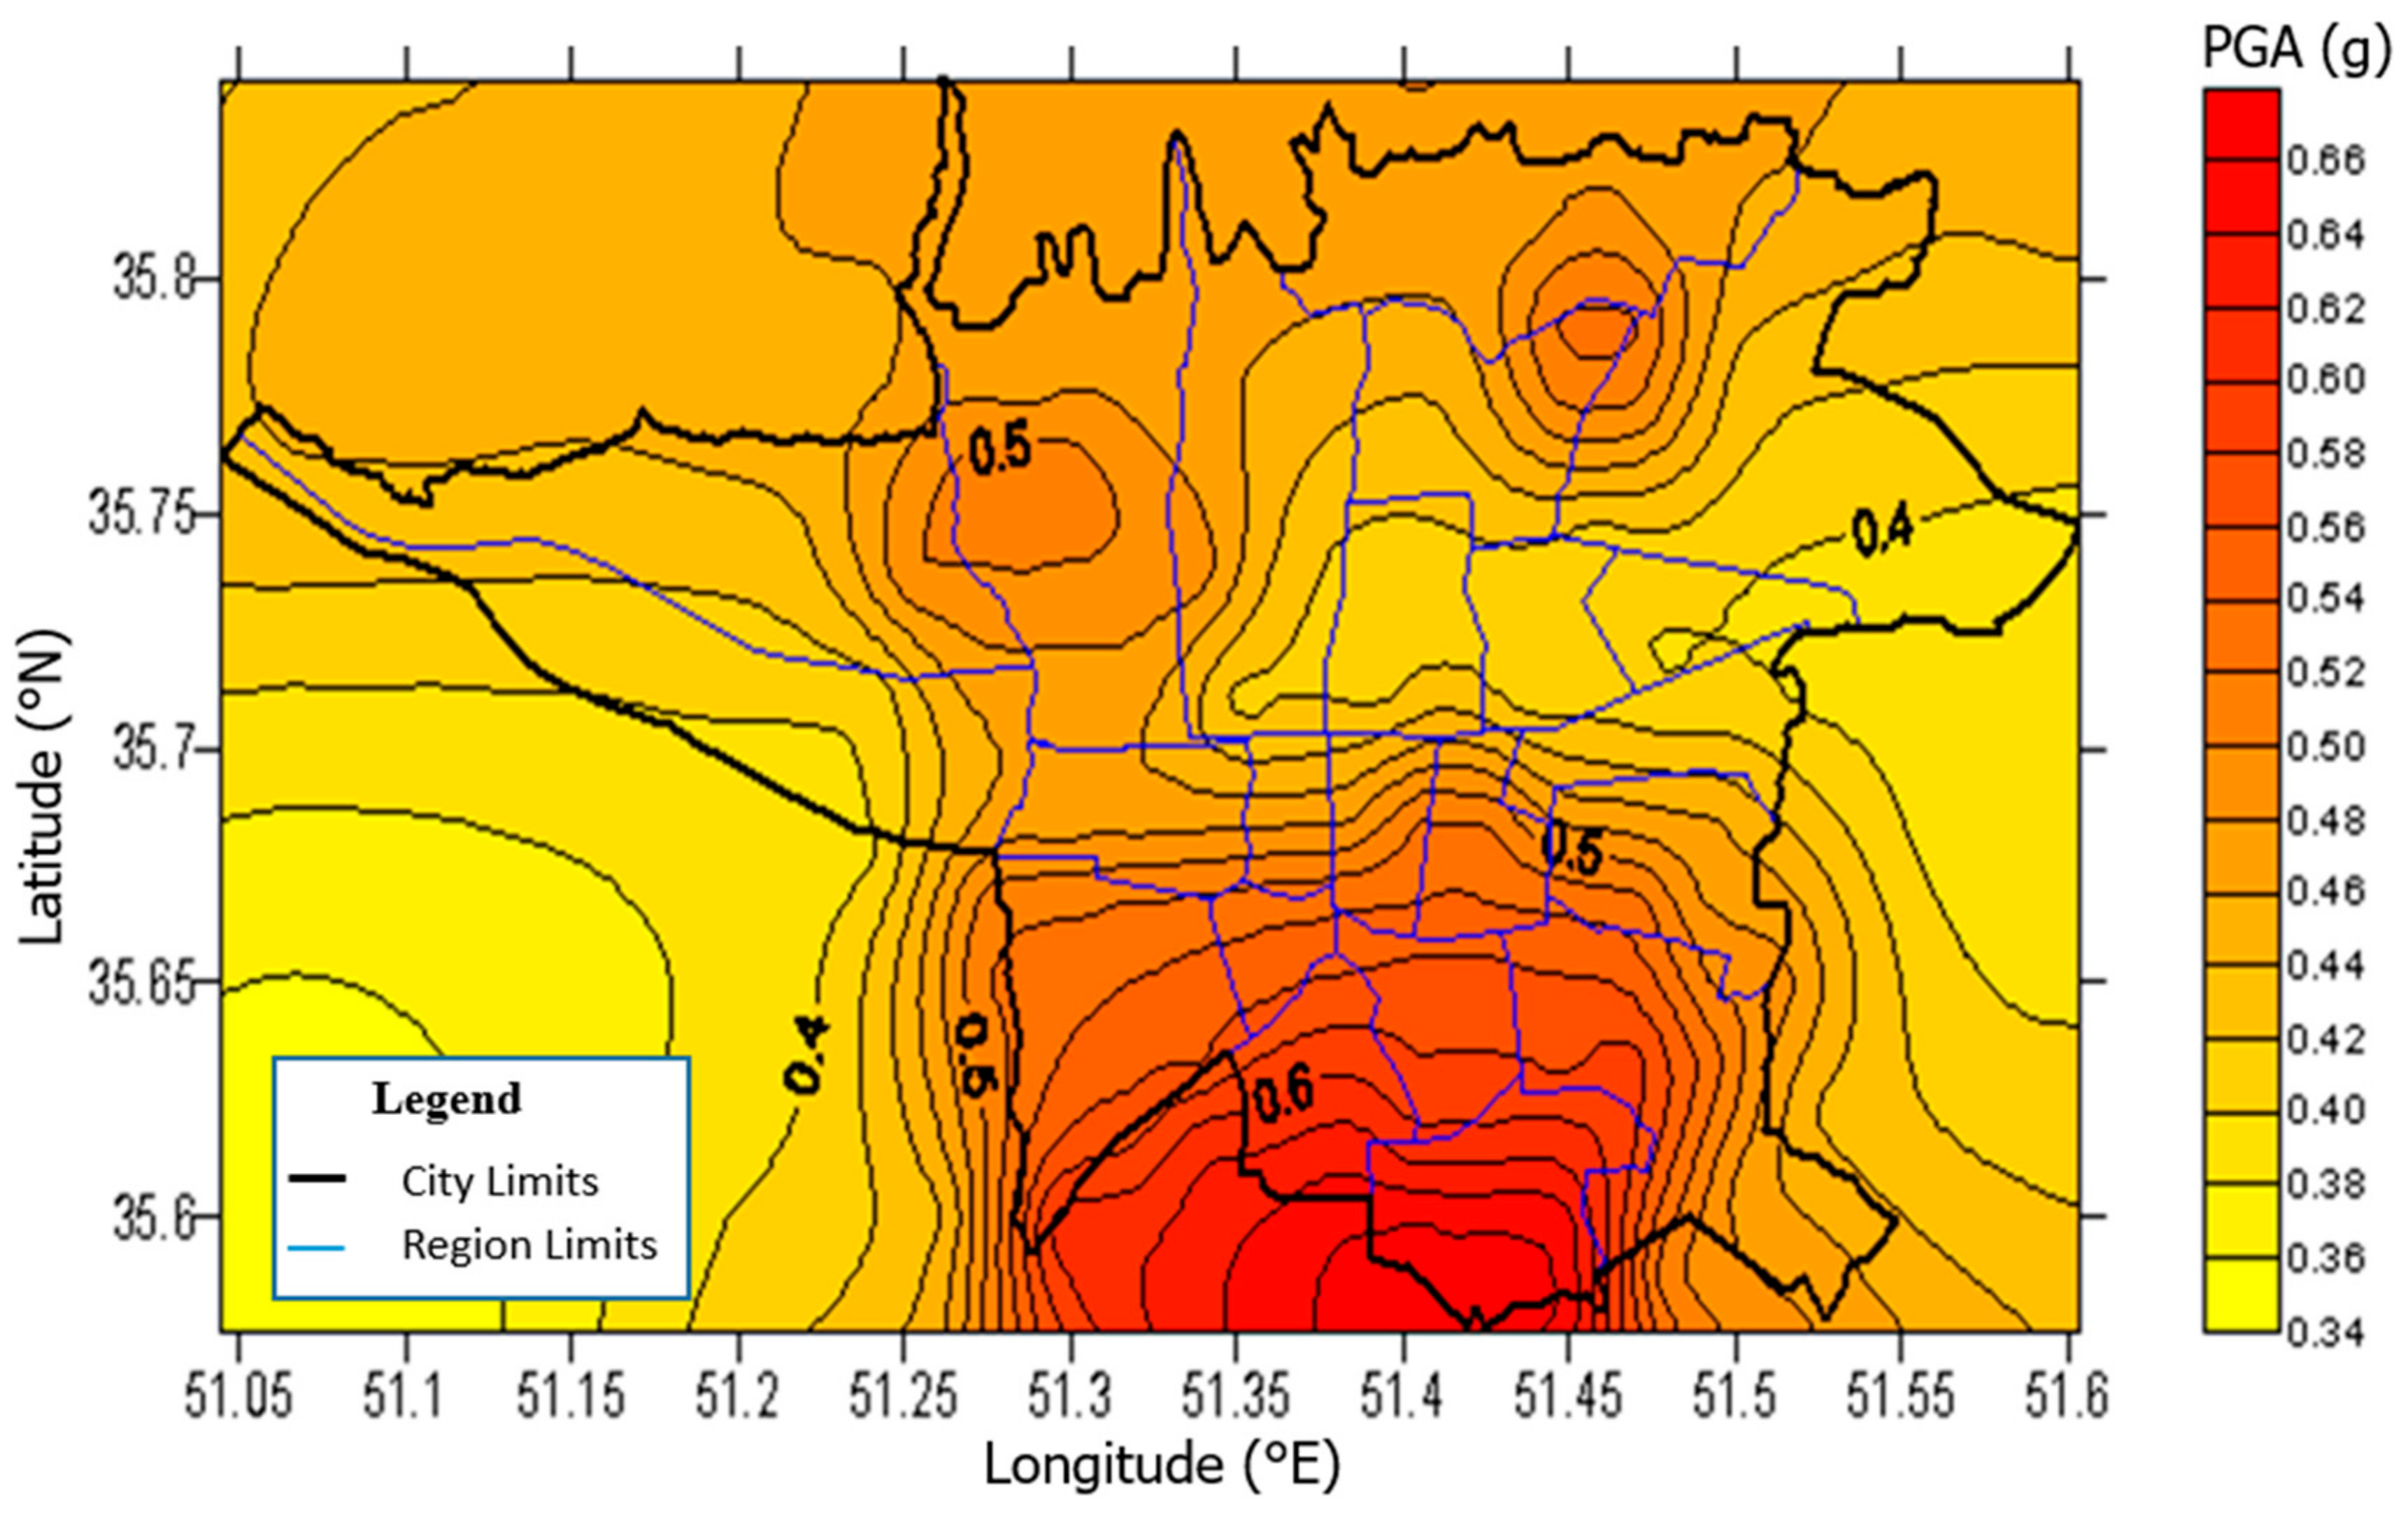
| Districts | Average PGA (g) | Hospitals per 1000 Hectares | Hospitals per 100,000 Population | Probability of Slight Damage | Probability of Moderate Damage | Probability of Extensive Damage | Probability of Complete Damage |
|---|---|---|---|---|---|---|---|
| North | 0.5 | 0.5 | 2.9 | 99% | 96% | 83% | 59% |
| East | 0.4 | 0.3 | 1.6 | 99% | 95% | 81% | 56% |
| West | 0.5 | 0.1 | 1.5 | 100% | 97% | 83% | 59% |
| Center | 0.5 | 1.7 | 8.5 | 100% | 97% | 85% | 60% |
| South | 0.6 | 0.4 | 2.2 | 100% | 99% | 91% | 72% |
Publisher’s Note: MDPI stays neutral with regard to jurisdictional claims in published maps and institutional affiliations. |
© 2021 by the authors. Licensee MDPI, Basel, Switzerland. This article is an open access article distributed under the terms and conditions of the Creative Commons Attribution (CC BY) license (http://creativecommons.org/licenses/by/4.0/).
Share and Cite
Ghaychi Afrouz, S.; Farzampour, A.; Hejazi, Z.; Mojarab, M. Evaluation of Seismic Vulnerability of Hospitals in the Tehran Metropolitan Area. Buildings 2021, 11, 54. https://doi.org/10.3390/buildings11020054
Ghaychi Afrouz S, Farzampour A, Hejazi Z, Mojarab M. Evaluation of Seismic Vulnerability of Hospitals in the Tehran Metropolitan Area. Buildings. 2021; 11(2):54. https://doi.org/10.3390/buildings11020054
Chicago/Turabian StyleGhaychi Afrouz, Setareh, Alireza Farzampour, Zahra Hejazi, and Masoud Mojarab. 2021. "Evaluation of Seismic Vulnerability of Hospitals in the Tehran Metropolitan Area" Buildings 11, no. 2: 54. https://doi.org/10.3390/buildings11020054
APA StyleGhaychi Afrouz, S., Farzampour, A., Hejazi, Z., & Mojarab, M. (2021). Evaluation of Seismic Vulnerability of Hospitals in the Tehran Metropolitan Area. Buildings, 11(2), 54. https://doi.org/10.3390/buildings11020054