Article

From Audits to Projects: Evaluating New York State Policy to Encourage Home Retrofit Projects

by
Elizabeth L. Hewitt
1,* and
Jean Léon Boucher
2
1
Department of Technology & Society, College of Engineering and Applied Sciences, Stony Brook University, Stony Brook, NY 11794, USA
2
School of Law and Government, Dublin City University, Dublin, Ireland
*
Author to whom correspondence should be addressed.
Buildings 2021, 11(12), 631; https://doi.org/10.3390/buildings11120631
Submission received: 10 November 2021 / Revised: 3 December 2021 / Accepted: 4 December 2021 / Published: 9 December 2021
(This article belongs to the Section Building Energy, Physics, Environment, and Systems)

Abstract

:
This research explores socio-spatial characteristics of home retrofit projects in New York State and their association with the state’s free home energy audit program. Prior work by the authors found that zip codes with more elder individuals and higher levels of education are more likely to undertake an energy audit; it was also found that higher incomes may be negatively correlated with audit decisions. Less understood is the follow-up decision after an audit to undertake a retrofit. From a policy and climate perspective, the actionable retrofit decision is far more impactful than the informational audit, making it an important area of further research. This work examines this understudied area using a combination of datasets, including census data, American Community Survey (ACS) data, and retrofits data provided by the New York State Energy Research and Development Authority (NYSERDA). Findings indicate that many of the same socioeconomic characteristics that predict audits are influential in retrofit projects as well (age, education, higher home values). A strong statistical relationship was found between audits per capita and subsequent retrofit projects, which is to be expected, as NYSERDA requires audits of residents desiring efficiency retrofits. However, this also indicates that the role of the audit in information transfers may be highly influential in encouraging home energy efficiency projects. This finding underscores the policy importance of offering low- or no-cost energy audit incentives to encourage greater participation in home retrofit programs.

1. Introduction

As global energy consumption continues its upward trajectory, the built environment remains a key target for policies, new technologies and innovations, and other actions to advance a global agenda for the sustainable production of energy on the supply side and its sustainable consumption by occupants on the demand side. Buildings remain a challenge because they have inherently long lifespans, which leads to the slow turnover of stock and resistance to transformative industry change [1,2]. In addition, the building and construction industry is highly fragmented, consisting of many small installers, contractors, and engineers located in various jurisdictions, complicating the policy landscape [3]. If clean energy schemes can be planned for early on in the design stage, sustainable consumption in buildings could advance considerably [4]. However, the built environment rarely affords designers and engineers the opportunity to work from a clean slate due to the large stock of existing buildings; existing buildings are therefore crucial targets in any initiative to reduce built environment energy consumption. Within existing buildings, cost savings from energy efficiency retrofits are often clear, but these economic drivers are often not convincing enough to encourage adoption among owners and developers [5]. Additionally, even when the economic value is clear, barriers such as information asymmetries or inaccurate assessments of future costs can prevent action [6,7,8]. Thus, in order to advance pathways to sustainable consumption in buildings, there is still a crucial need to better understand the factors that influence energy decision making, particularly in the residential sector.
To develop knowledge in this area, this present study focuses on the link between the energy audit and the home retrofit project in the State of New York. Energy audits provide a homeowner with an inspection by a trained auditor to assess areas of energy inefficiency in the home. Many states, including New York, offer a monetary incentive for audits tied to household income, thereby reducing or eliminating the cost for the homeowner. However, even if there might be high public participation rates in the audit incentive program in New York State (NYS), audits themselves do not lead to reduced energy consumption; audits serve only as a form of information transfer and require subsequent action post-audit to foster greenhouse gas and energy consumption reductions.
A retrofit in the context of this research refers to any home project, equipment installation, renovation, or significant alteration with the aim of reducing energy consumption [3,9]. Retrofits may or may not be large projects, and low-hanging fruit can be impactful. For example, weatherization and insulation can significantly reduce heating and cooling needs and increase the energy efficiency of a home while not placing a significant cost burden on the homeowner, especially if financial incentives are utilized [10,11].
Prior work by the authors [12] explored the initial decision to undertake a home energy audit in New York State; findings suggested that older, more educated homeowners were more likely to participate in audit programs. Findings also pointed to less participation among higher-income homeowners. Although these findings provide important context regarding who is undertaking audits and where they are located across New York State, little work has been conducted connecting the audit to subsequent projects or retrofits, indicating an important gap. This paper targets this gap. More specifically, this work explores the following research question: What can socioeconomic and spatial characteristics tell us about homeowners who undertake retrofit projects in New York State?
To answer this question, multiple datasets are merged and analyzed. Specifically, we focus on New York State data on home retrofit projects (both incidence and costs) in conjunction with other popularly available socioeconomic data at the zip code level. Our findings offer important directions for policy, as they contain information on the areas and populations in New York State that undertake home retrofit projects. The paper is organized as follows. First, background is provided on decision making and existing empirical work on retrofits, and hypotheses are provided for this work. Next, the methods and data are outlined. Finally, results and findings are discussed, along with policy implications and suggestions for future work.

1.1. Drivers and Barriers of Retrofits

Homeowners who make decisions to complete a home energy efficiency project may take action for a variety of reasons: cost savings, thermal comfort issues, desire to increase home value, or an inclination towards pro-environmental behavior [3,13]. Parsing these motivations is a complex undertaking. A deep assessment of individual behavioral or pro-environmental motivations is outside of the scope of this study, but may provide important directions for future qualitative research. Importantly, New York State has expressed interest in the relationship between audits and projects, which can provide important policy direction to advance statewide carbon emissions goals. In an effort to provide policy recommendations at various scales, it is fruitful to briefly discuss drivers and barriers of retrofits.
A number of factors drive or inhibit home retrofits. Importantly, physical building characteristics that impact occupant comfort often have a strong influence on homeowner decision making [13,14,15]. For example, it is widely reported that older homes are far less energy efficient than newer homes [10], and such inefficiencies due to age are likely to cause drafty home environments, hopefully providing the necessary “nudge” for homeowner action [15]. A number of researchers have also focused on the social context surrounding retrofit projects [3,9,16,17] and found that homeowners are more likely to undertake projects if the projects are presented in a context that is socially acceptable to the individual and based on everyday life. This requires a more comprehensive view of homeowners as a heterogenous and diverse group, with varying motivations [16], and of energy retrofits as a regular and routine part of home maintenance and ownership [17].
Despite such motivating factors, many researchers have found that even in the presence of a strong economic benefit individuals often fail to take action, and that retrofit uptake has been exceptionally slow given the pace of available technologies [6,7,10,15,16,18]. The paradox can be described as an unwillingness to invest in cost-effective equipment and upgrades that could decrease energy consumption and lower costs for the consumer, a seemingly backward decision-making logic [7]. Similarly, Thompson (1997) terms this the “efficiency gap”—explained as “the difference between existing energy efficiency and its apparent cost-effective potential” (p. 989). A number of factors are known to contribute to such a gap.
One intervening factor is the presence of information asymmetries, or instances when key decision-making criteria are unknown or unable to be obtained by the decision-maker, or when differences in information availability exist between principal and agent [19,20,21]. Such asymmetries are widely known to discourage energy efficiency investments, particularly in rental properties, when the incentive for investment is typically misaligned between tenant and landlord. However, evidence points to a willingness among both home buyers and renters to pay a price premium for increased energy efficiency [22]. Thus, one pathway to reducing this asymmetry is to mandate information provision and disclosure about energy performance during real estate transactions through some form of labeling or rating scale [23], but such schemes are not common or required in the United States housing market, especially for single family homes.
Individuals also often rely on inaccurate biases and “mental shortcuts” (heuristics) when making decisions about monetary investments and expected future returns, particularly when weighing high-cost, uncertain energy project decisions [24,25]. For example, individual consumers often do not have a clear picture of global energy trends and future price projections, so decisions are made based on today’s information, which may lead to missed opportunities in the future. Some researchers [26] point to a conceptual “experience-curve effect”, which attempts to capture the technological, production, and innovation gains that typically lead to better products at lower prices as goods become more established in the market. Such an experience-curve gives consumers an incentive to wait before purchasing in the hopes that they will gain an even higher rate of return on their investment in the future.
Others argue that consumers make personally rational decisions, which incorporate subjective components that traditional financial calculations do not include, such as transaction costs that may create demands on the consumer’s time and energy and real differences in preference choices for alternatives, all of which consumers implicitly give value to when weighing alternatives [27]. Other subjective and implicit decision-making tools can include habits [28,29,30] and lifestyle inertia, or “lock-in” [31,32,33]. Further, some point to the role of risk in influencing consumer discount rates, particularly given the uncertainty surrounding energy prices in the future [8,10,34]. Risk is found to be an even stronger factor in instances of a homeowner’s lack of access to expertise or easily accessible information [13]. Finally, there is strong evidence that some energy decisions, such as audits and retrofits, may be compounded by the existence of a “hassle factor”, in which individuals avoid decisions that may place too high of a burden on their time or effort [35,36]. Obtaining a better grasp on the barriers to action is important, but, as empirical studies show, the issue is not straightforward.

1.2. Role of Intermediaries

Although research on audits broadly and audits-to-retrofits more specifically is sparse, prior work by the authors found that the spatial distribution of audits correlated with the spatial distribution of auditors statewide [12], and other prior studies found the role of the auditor to have a strong influence on subsequent action [35,36]. Specifically, in instances where auditor expertise and mentored guidance—or an “energy advocate” in what Van de Grift & Schauer [37] refer to as a “A hand to hold”—were high, homeowner behavior was more likely to align with subsequent retrofit action. Thus, there is evidence that a focus on the characteristics and behavior of the auditor—such as leadership skills, friendliness, or their use of social norms to persuade—may offer important insights into more effective retrofit incentives.
This is well aligned with broader literature and empirical findings about the role of intermediaries in fostering sustainable transitions to more energy efficient choices [13,38,39,40,41,42,43]. An intermediary can be defined as a liaison or “middle man” between a homeowner and the local utility or government, helping the homeowner navigate government incentives, supplier and materials choices, and investment decisions [34,38]. Importantly, intermediaries may reduce transaction costs of large-project decisions [40] and can build trust, a crucial component in home retrofit decision making [44]. An auditor’s ability to serve as an advocate, leveraging leadership skills and expertise to build trust and nudge homeowners towards desired outcomes, may be a powerful ingredient in transitioning from an informational audit to an action-oriented retrofit.

1.3. Current Policy Landscape in New York State

Statewide, a number of incentives exist to reduce costs associated with building retrofits. While a number of these policies target mid-size or large multifamily buildings, programs do exist for single-family homeowners. Importantly, the New York State Energy Research and Development Authority (NYSERDA), the same entity that provides low- or no-cost audits, also offers a host of programs and incentives for energy efficiency retrofits, including rebates for certain equipment installations and loans for energy efficient home upgrades [45]. Moreover, a number of the low-interest financing options available through NYSERDA are bundled with a free audit; this illustrates how the audit is considered something of a gateway activity, forerunning other events. The provision of both the audit and subsequent retrofit dollars from the same agency may help streamline the information flow, making a retrofit decision easier and more accessible for homeowners. The State of New York also offers benefits for weatherization that are tied to household income through its Weatherization Assistance Program (WAP), which is funded through federal dollars [11]. In New York City, where the policy landscape for energy efficiency in buildings has been more ambitious, building owners of large properties face more stringent regulations for energy disclosure, lighting, and, most recently, carbon emissions [46,47]. However, because multifamily buildings with renter occupants dominate the housing landscape in the City, the policy structures are difficult to compare to those available for single family homeowners in other areas of the state.

1.4. Hypotheses

Considering this literature and our goal to learn more about the residents who participate in New York State’s audits and projects programs, we hypothesize that there will be a simultaneous association between the locations of the auditors, audits, retrofit projects, and other seemingly green behaviors, such as the incidence of solar panels or electric vehicles (EVs). We also expect that projects will have some association with more affluent homeowners (with affluence represented by higher incomes, education, home values, or the homeowner’s age), but that the relationship may be positive or negative. It intuitively can be assumed that higher income households might be more likely to undertake home improvement projects due to the availability of project capital, but empirical evidence indicates that the relationship between affluence and environmentalism is not straightforward, and wealthy homeowners can be less likely to participate in pro-environmental programs and initiatives [12,31,48,49]. Regarding the exploratory projects per-audit-ratio that we develop, we have no hypotheses but simply ask if they might be associated with a higher area penetration of audit contractors or perhaps the privileges of affluence such as income, education, or race, such as the area percentage of non-Hispanic Whites.

2. Materials and Methods

To operationalize this study, we rely on a number of datasets and with these we statistically examine the occurrence and costs of New York State-sponsored home retrofit projects from 2011 to 2016. NYSERDA provided the data on these projects and we tested this data for associations with other variables: demographic, socioeconomic, political, etc. [50]. The retrofit data came in the form of the number of projects and project costs per zip code. It was then merged with publicly available data: population figures from the U.S. 2010 Decennial Census and measures from the U.S. Census Bureau’s 2011–2015 American Community Survey 5-year Estimates [51].
We also use NYSERDA data on registered EVs and solar photovoltaic (PV) installations per zip code. This was used in combination with seven years of registry data from the NY Department of Motor Vehicles [52]. Data on both full battery electric and plug-in hybrid electric vehicles is used. PV installation data was queried from the record of state-assisted and completed PV installations during 2000–2016—a total of 60,056 installations.
Missing data issues were resolved by imputing county averages (e.g., median home value—no more than 5.5% of zip codes in any instance). Outlier zip codes were dropped, e.g., post office boxes that were simultaneously less than 300 people and smaller than two square miles. Using these criteria, 71 cases were eliminated and the final population size for the study was N = 1670 zip codes.

2.1. Research Site

The focus of this analysis is on New York State. New York is located in the northeastern United States, and has a population of approximately 19.3 million. The state is home to heavily populated regions of New York City and the surrounding metropolitan area as well as very rural areas in the upstate regions. The capital of the state is Albany, and the largest urban center is New York City. New York’s energy authorities and policymakers work with a public-private entity known as NYSERDA, mentioned previously. NYSERDA collects a small dollar amount from New York State residents on monthly energy bills called the system-benefits charge and uses this to fund energy efficiency initiatives state-wide. Although energy audits and retrofits are occurring across the United States, the existence of NYSERDA (which is a unique entity that not all states in the U.S. have) lends itself to particularly rich data in New York, and this data was made available to us through contacts at the Authority. Thus, we selected New York as the site for this work and the focus of this research. Future studies in other states—if they too collect similar data—would be interesting.

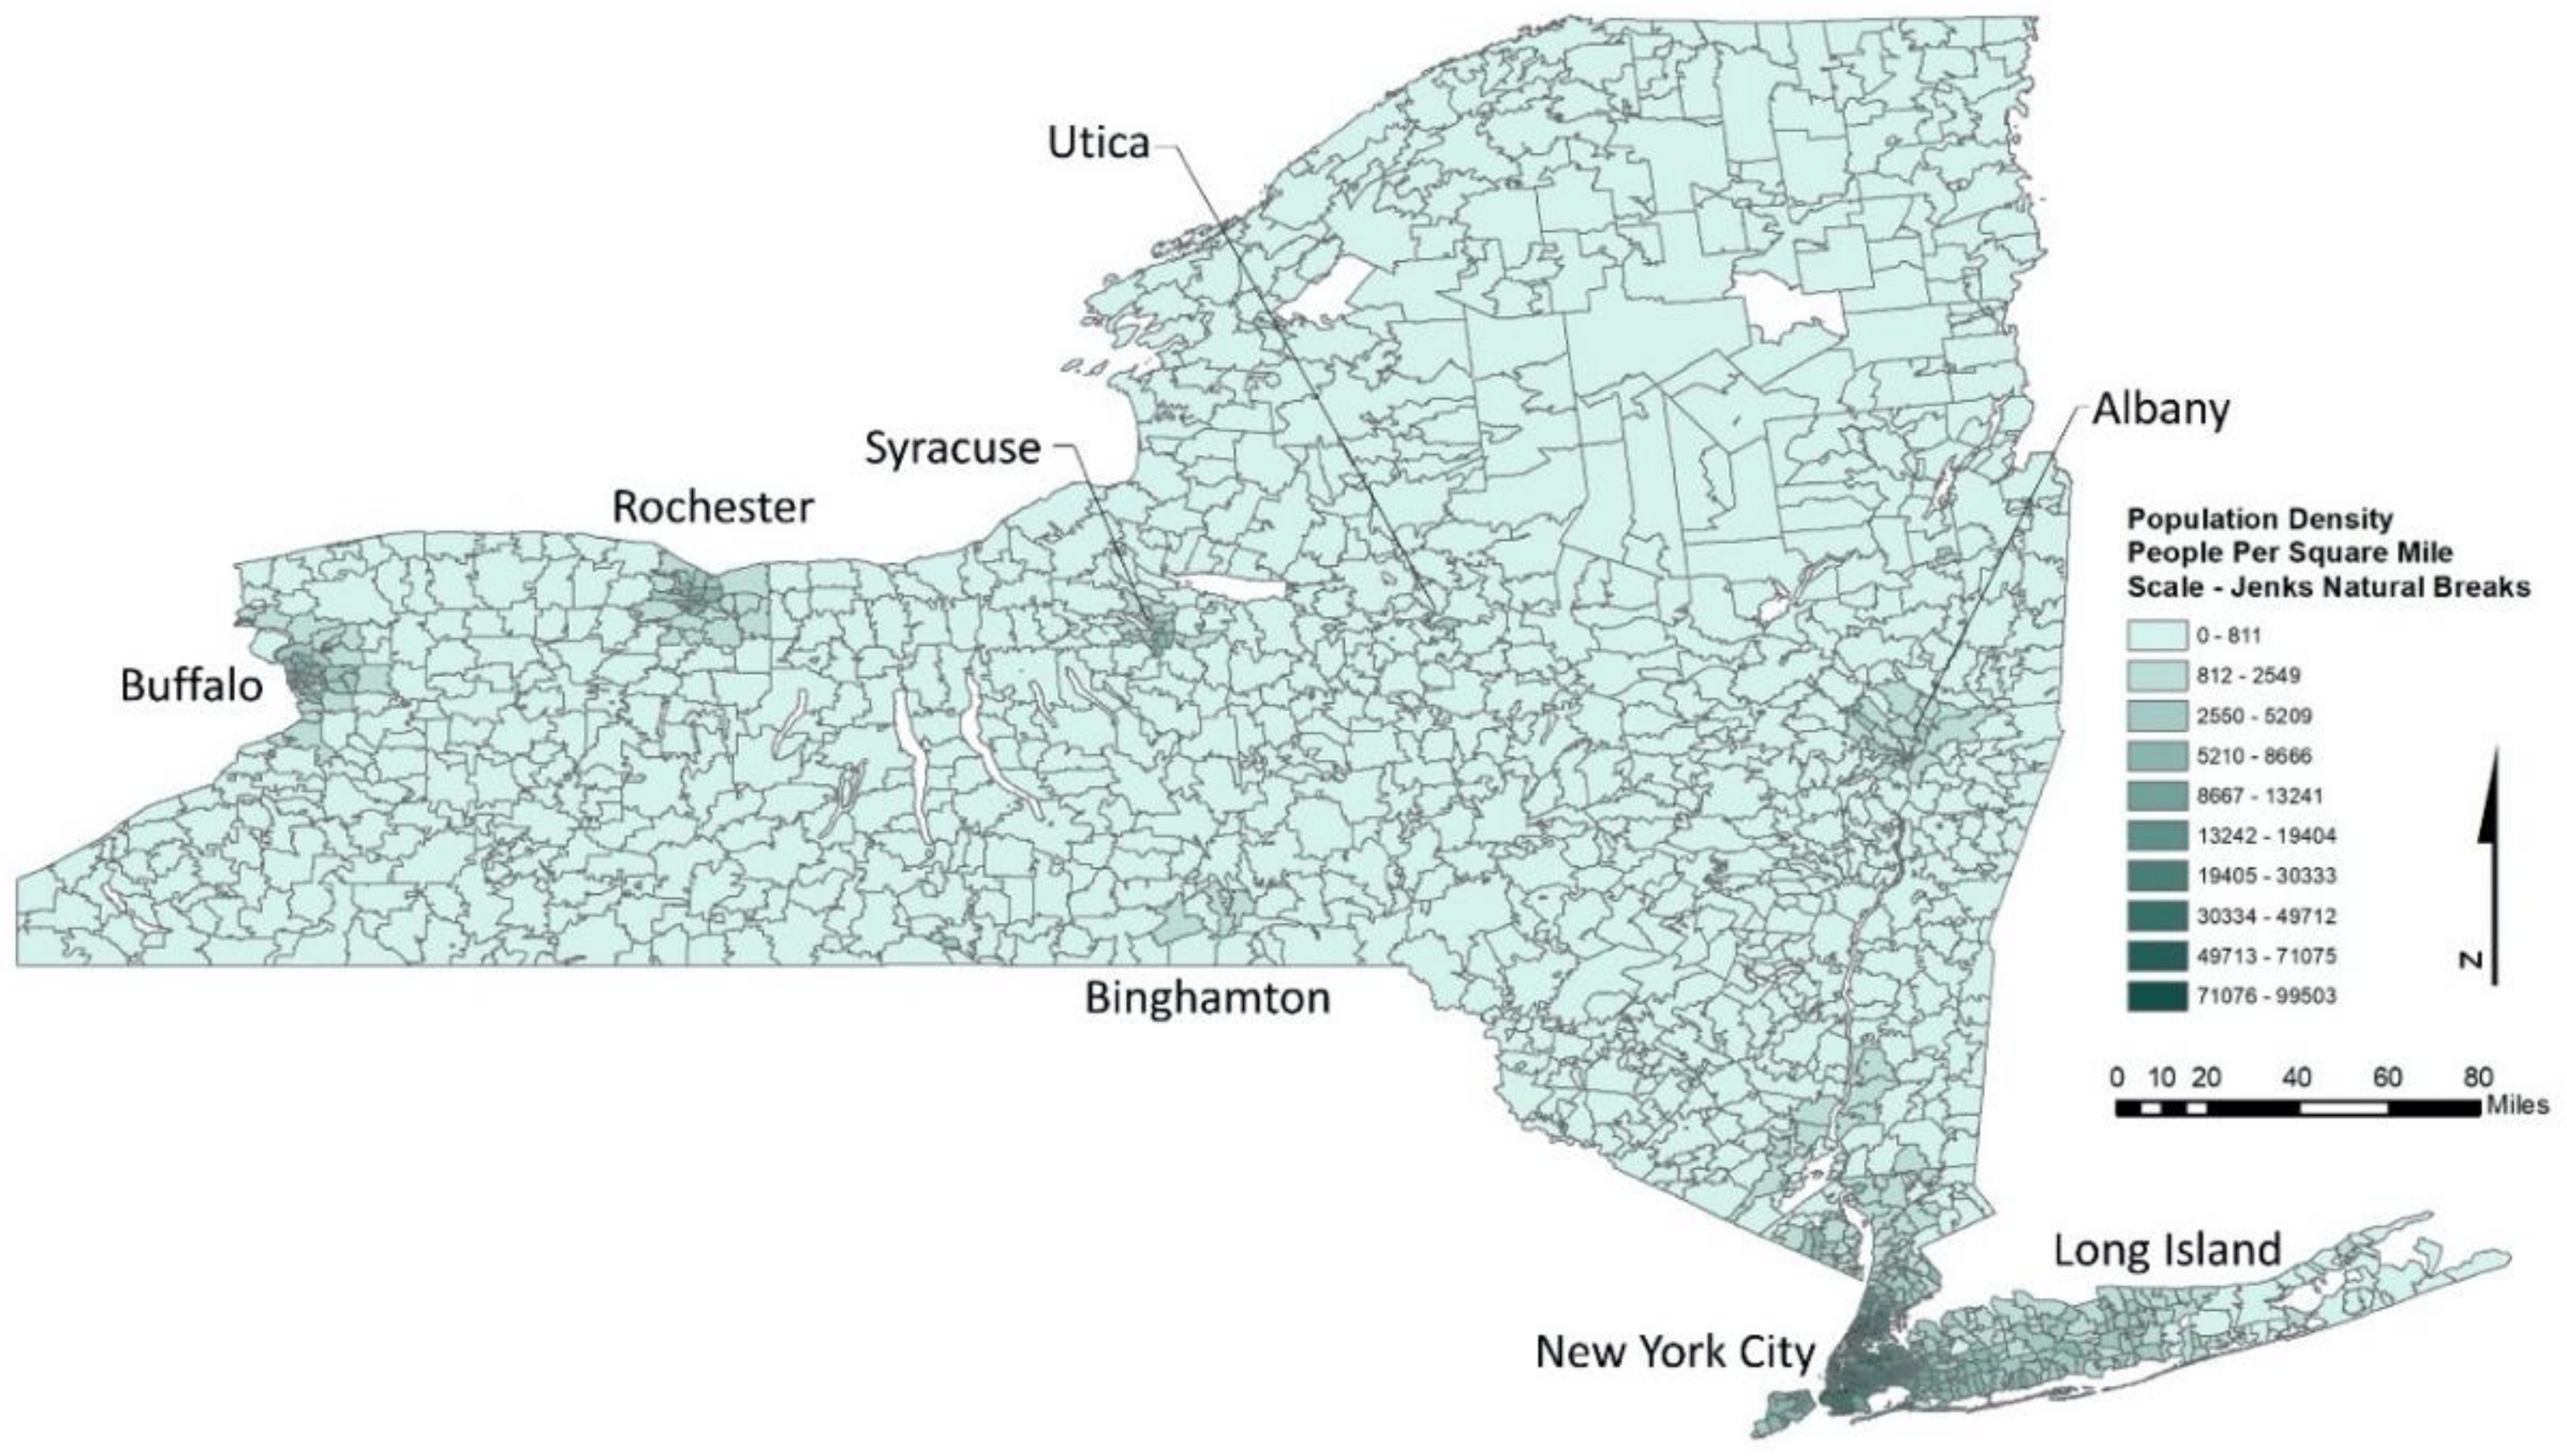
2.2. Key Variables and Descriptive Statistics

For this study, our primary dependent variables of interest are (i) the number of projects and their costs per capita and (ii) a projects-per-audit ratio and project costs-per-audit ratio. Both of these variables are measured at the per zip code level, e.g., projects per capita per zip code. The projects-to-audits ratio should help identify the characteristics of those zip codes with higher project returns from the NYSERDA audit to the projects program.
In order to test independent variable relationships to these dependent variables, we use a standard fair of demographic variables (at zip code level). All these variables can be seen in Table 1, descriptive statistics, and vary from a zip code population’s median age to population density, educational attainment, median income, race, home values, and other variables such as political affiliation—i.e., Democrats, Republicans, Undeclared, Greens, etc. [51,53]. We also include clean technology markers that might indicate a green lifestyle, such as EVs and the presence of PV systems, and, in the last few rows, the number of audits and home retrofit projects and projects per audit.
We note in Table 1 that average household size refers to the number of people living in a household. We also include the percentage of renter-occupied households as a possible marker of low incentive to apply a home retrofit project [54,55]. Moreover, we include the percentage of persons who speak limited English as an indicator of foreign origin—immigrant communities tend to cluster in common areas [56,57]—and with limited English skills they may be challenged to apply through a state website for an audit or retrofit project.
As we rely on zip codes to link our data sources together, there are shortcomings to this method, e.g., over time, new zip codes can be created by the postal service and others can spatially vary over time [58,59]. However, there are advantages to zip codes, as they are used in a breadth of data types and are thus amenable to linking various data. Notably, we conduct per capita analyses over per household analyses, as per capita measures are more relatable to other per capita-based measures such as the percentage of voters, population density, and educational attainment.

2.3. Analytic Strategy

To analyze our data, we conduct a cross-sectional ordinary least squares (OLS) analysis for all home retrofit projects and their costs from 2011 to 2016—all years aggregated together. This is not a longitudinal study. GeoDa [60] is used to examine geospatial autocorrelation—the tendency of zip codes that are near each other to have more similar characteristics—and multivariate regression analyses (using SPSS) are used to elucidate the dynamics between our different dependent and independent variables. For all OLS models, we use a similar collection of independent variables as was seen in Table 1. Additionally, in order to correct for skewness in all our dependent variables, we take the natural logarithm of the variable and—to achieve this—it was necessary to add a one (1) to each value in order to eliminate the zero (0) values (which are not amenable to the natural logarithmic function). In reporting our results, we only review the significant associations in our models and ignore any of the weak ones (i.e., less than 0.100). We also ran bivariate correlations, which are not reported in the main text, but can be found in Appendix A.

3. Results

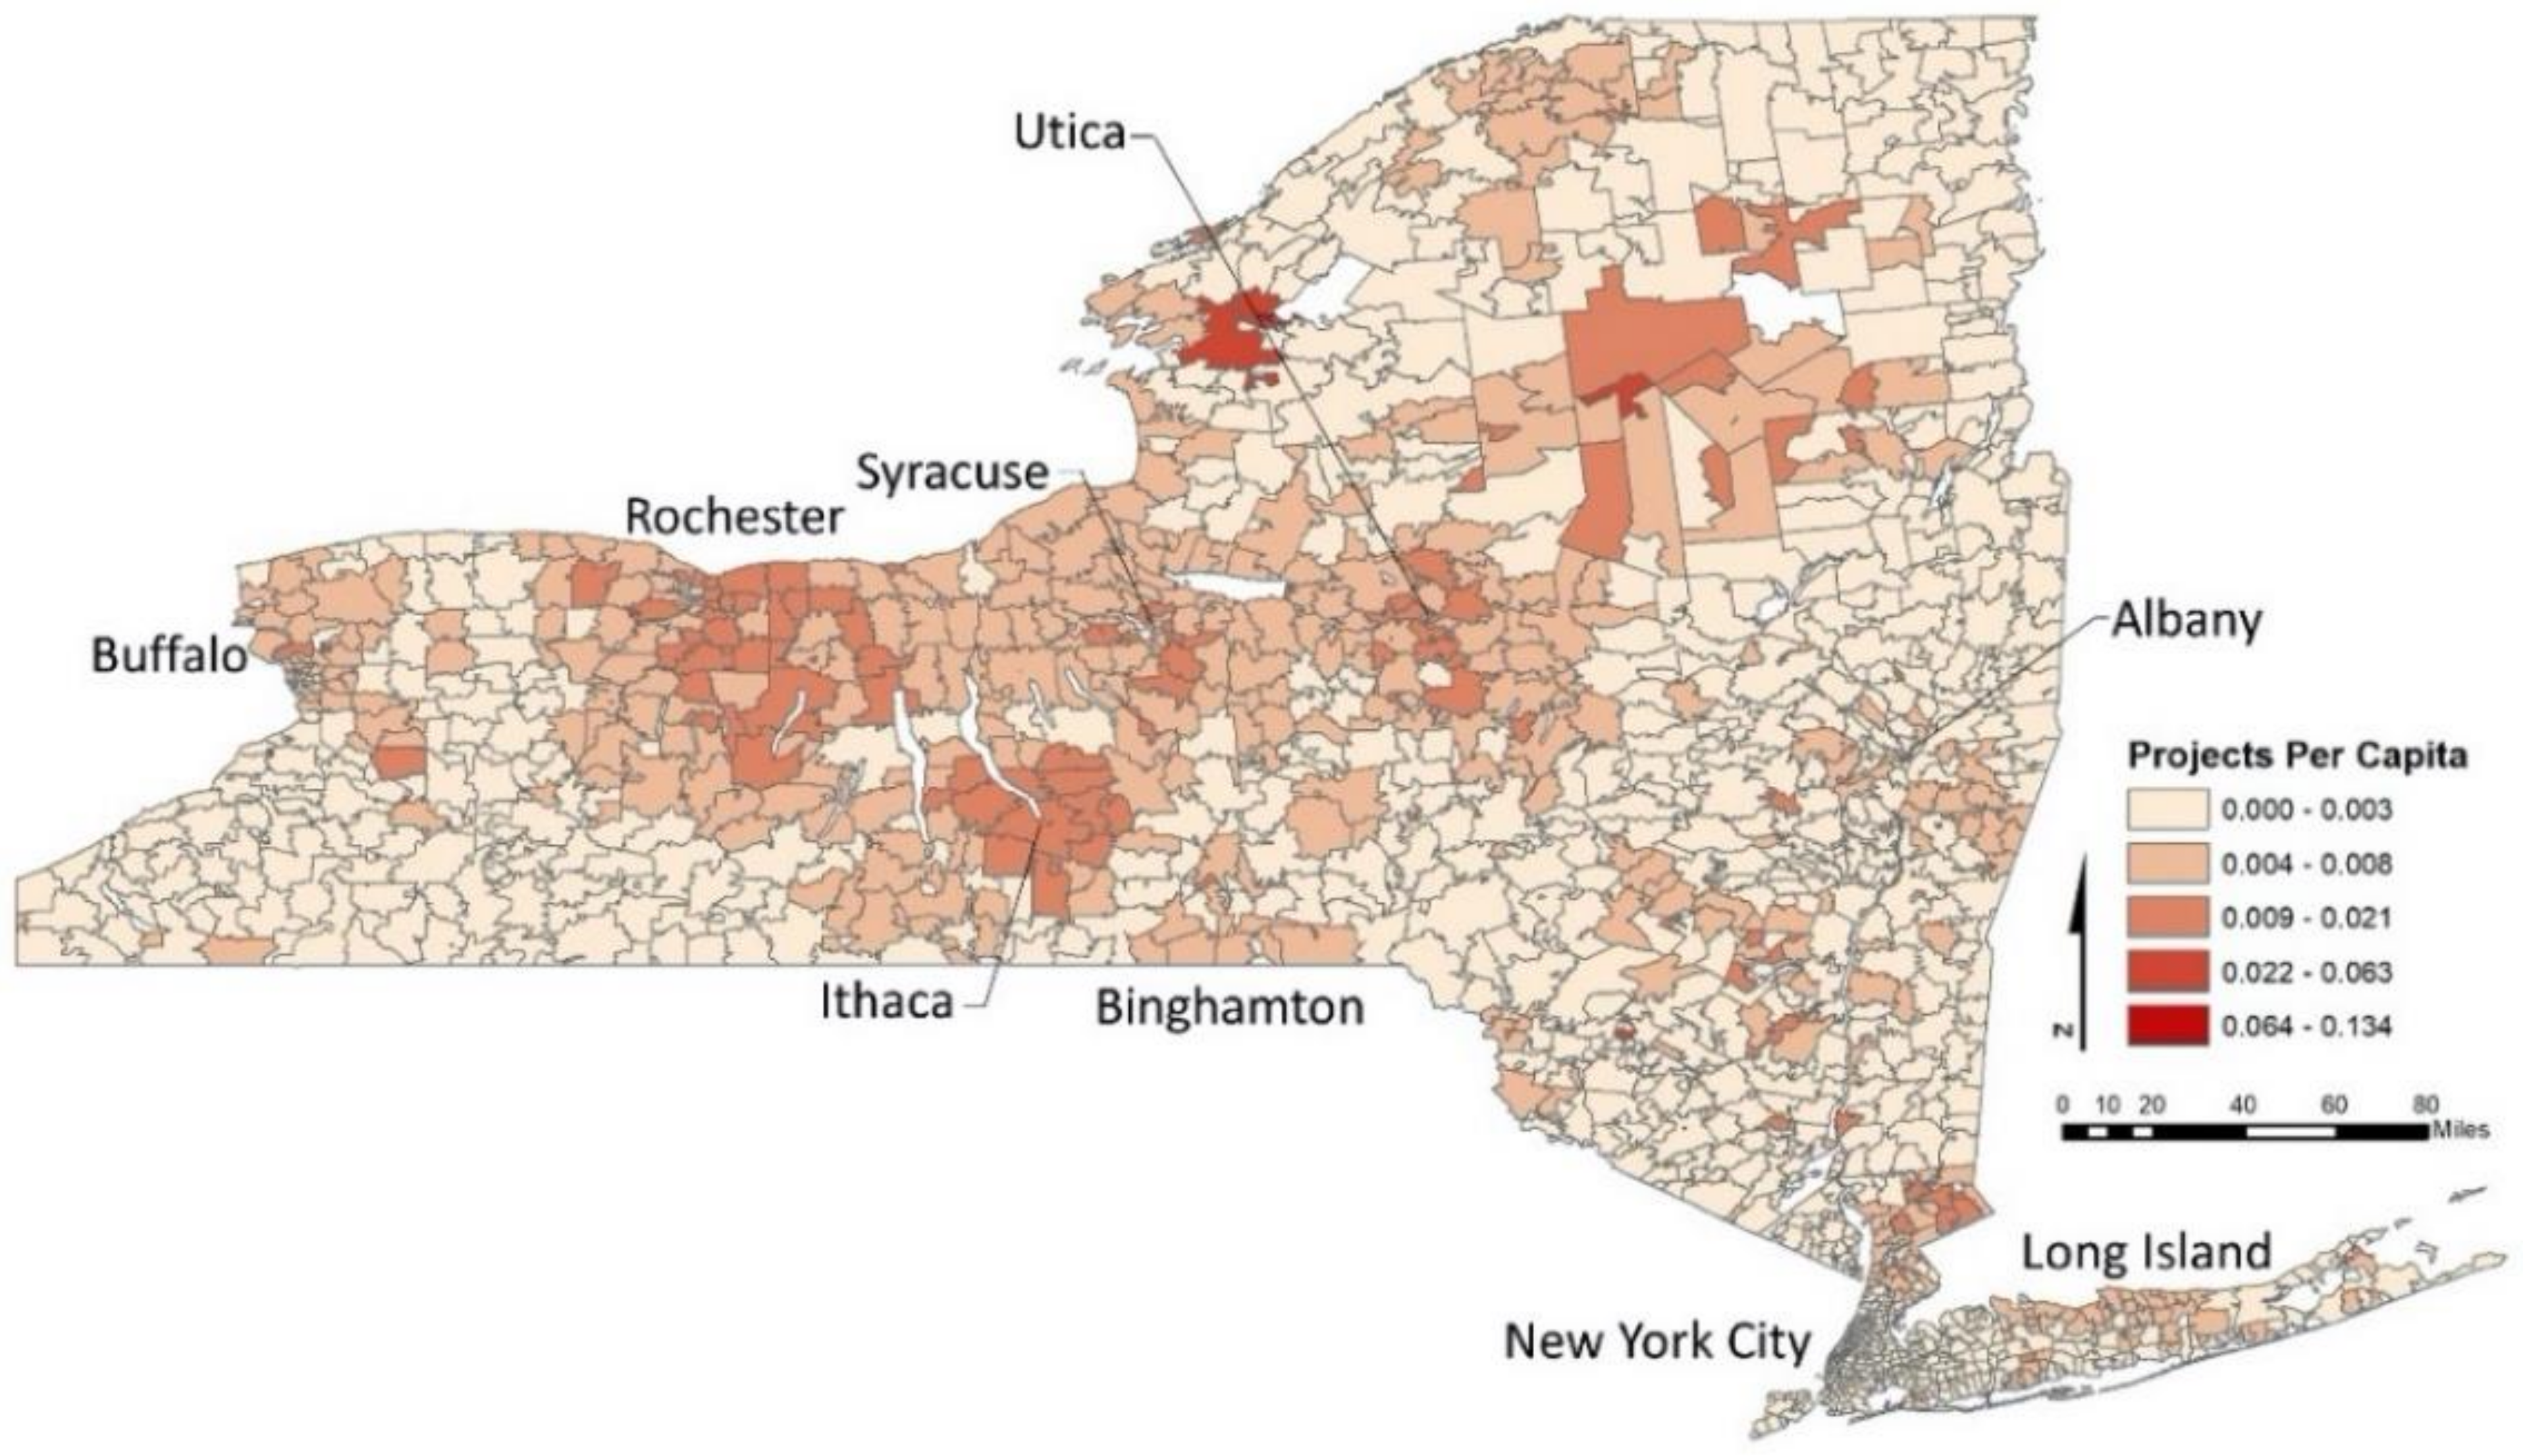
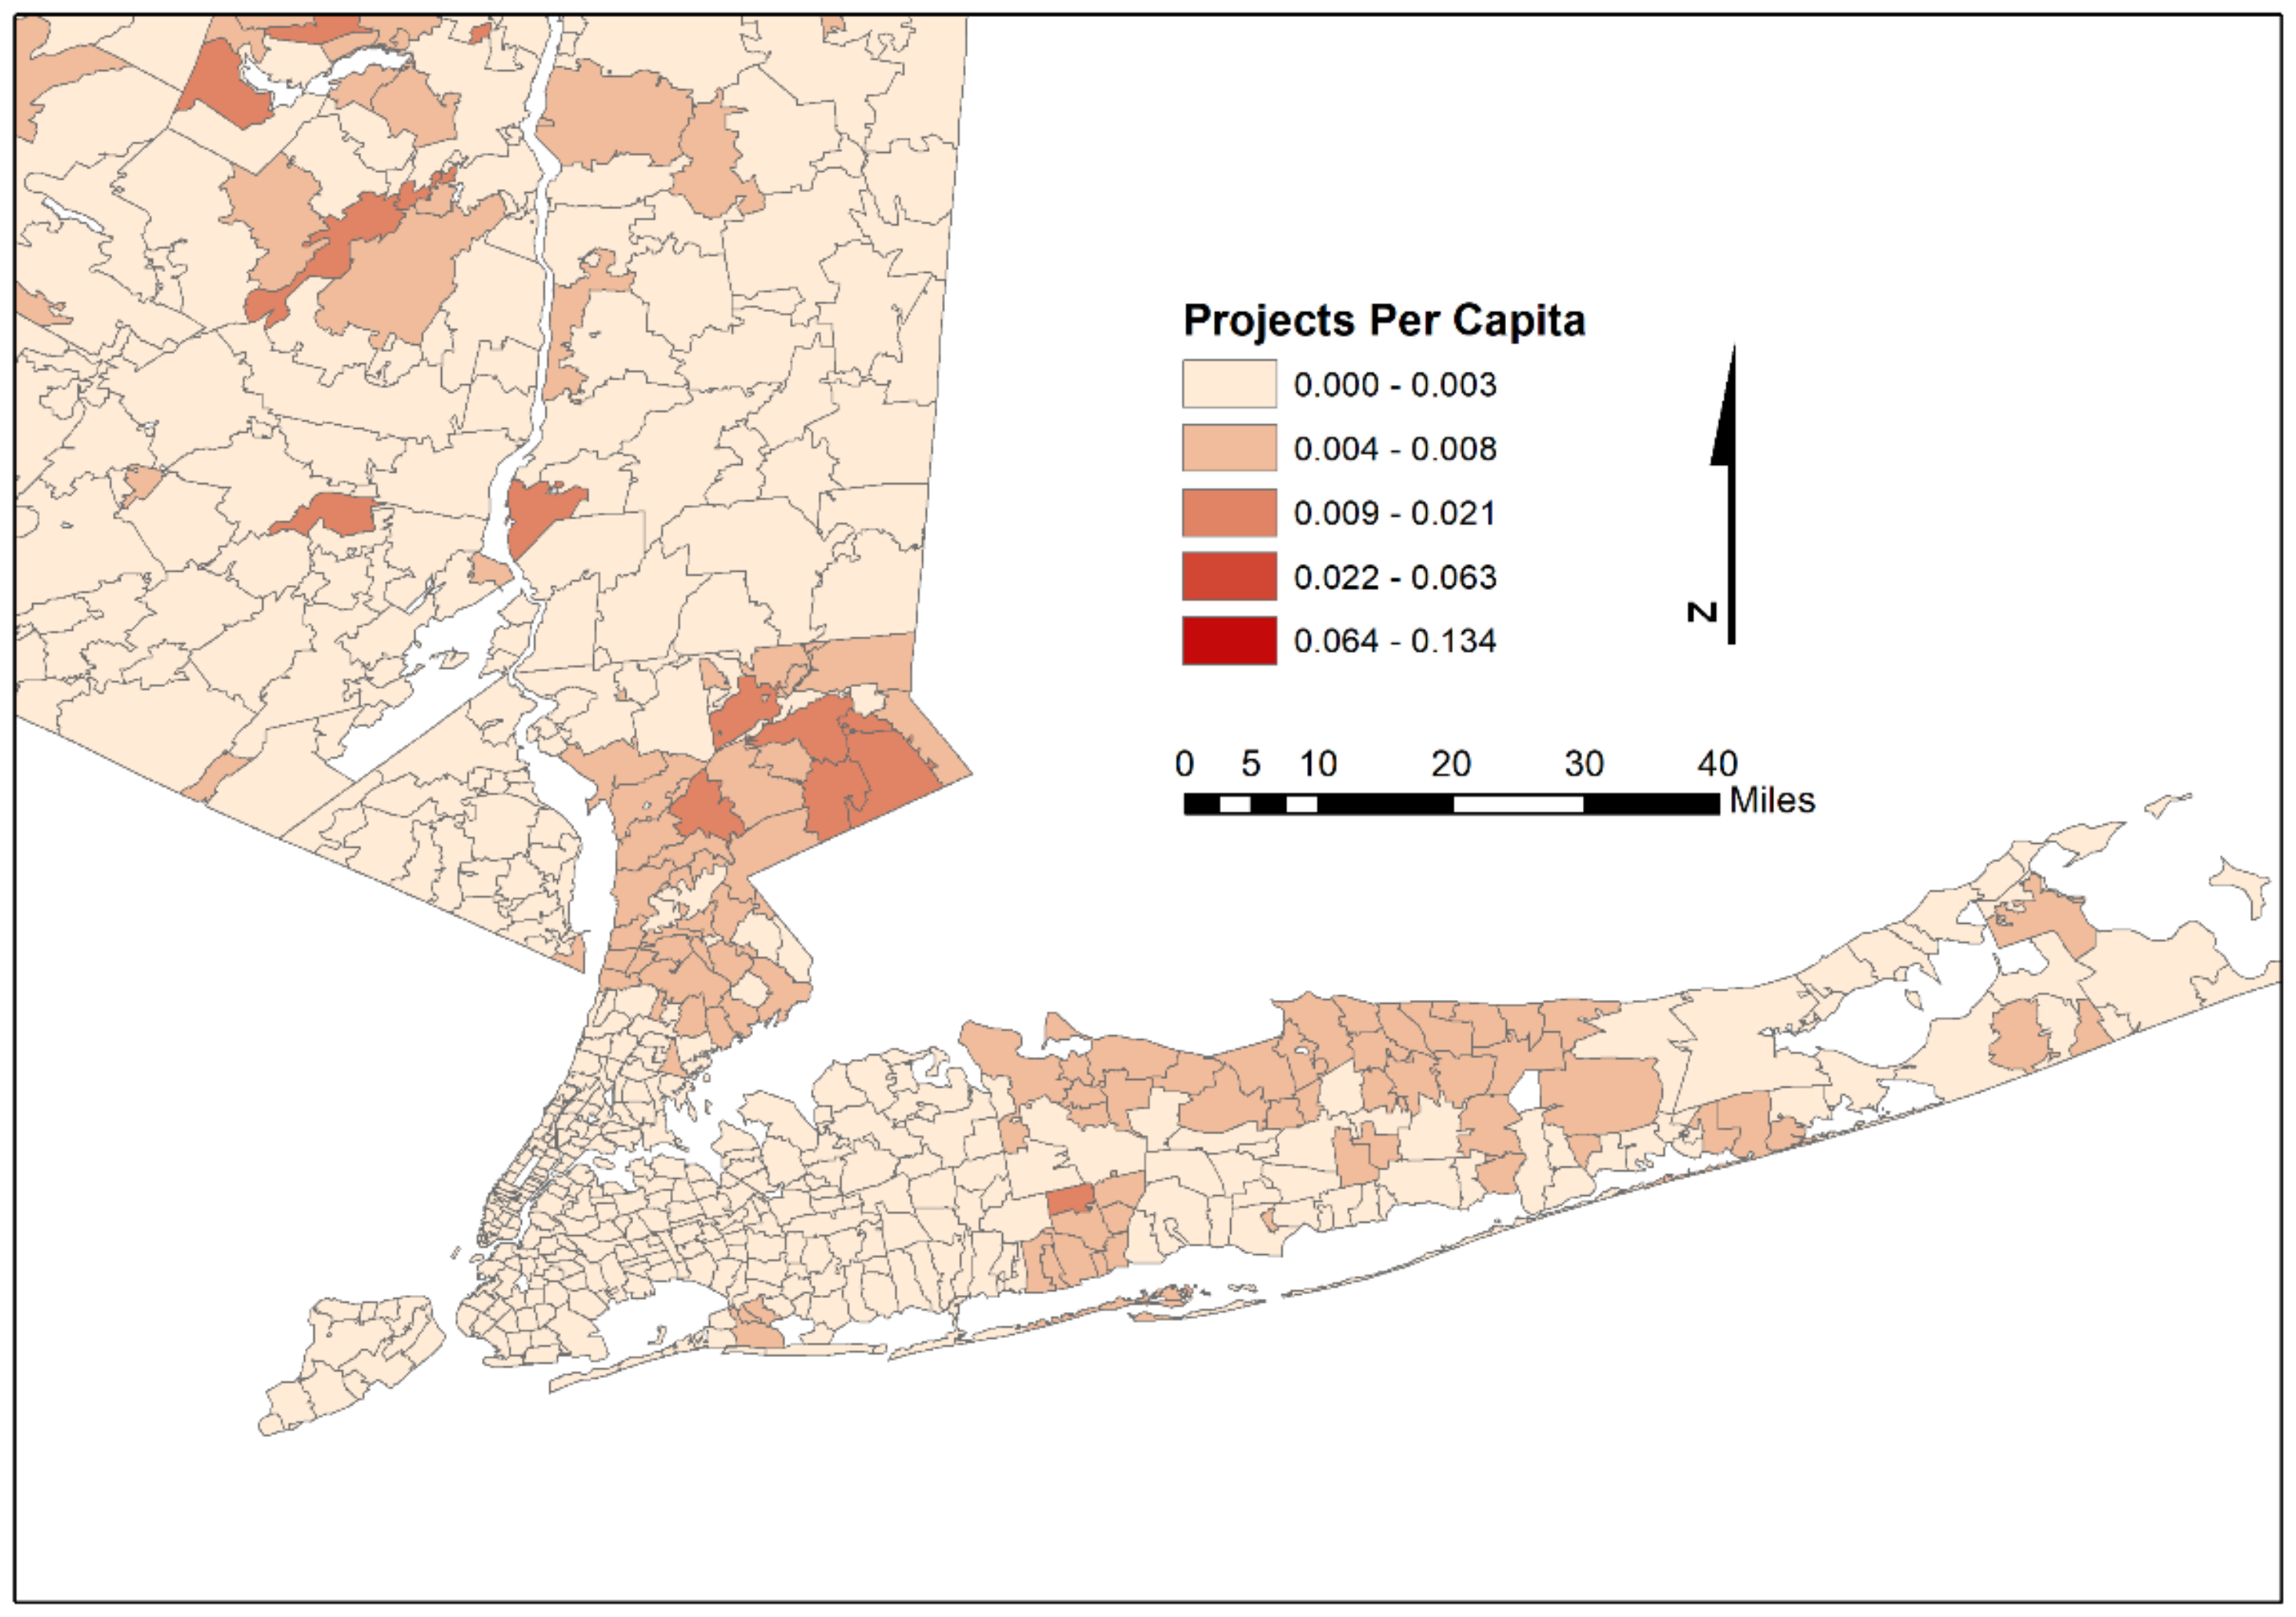
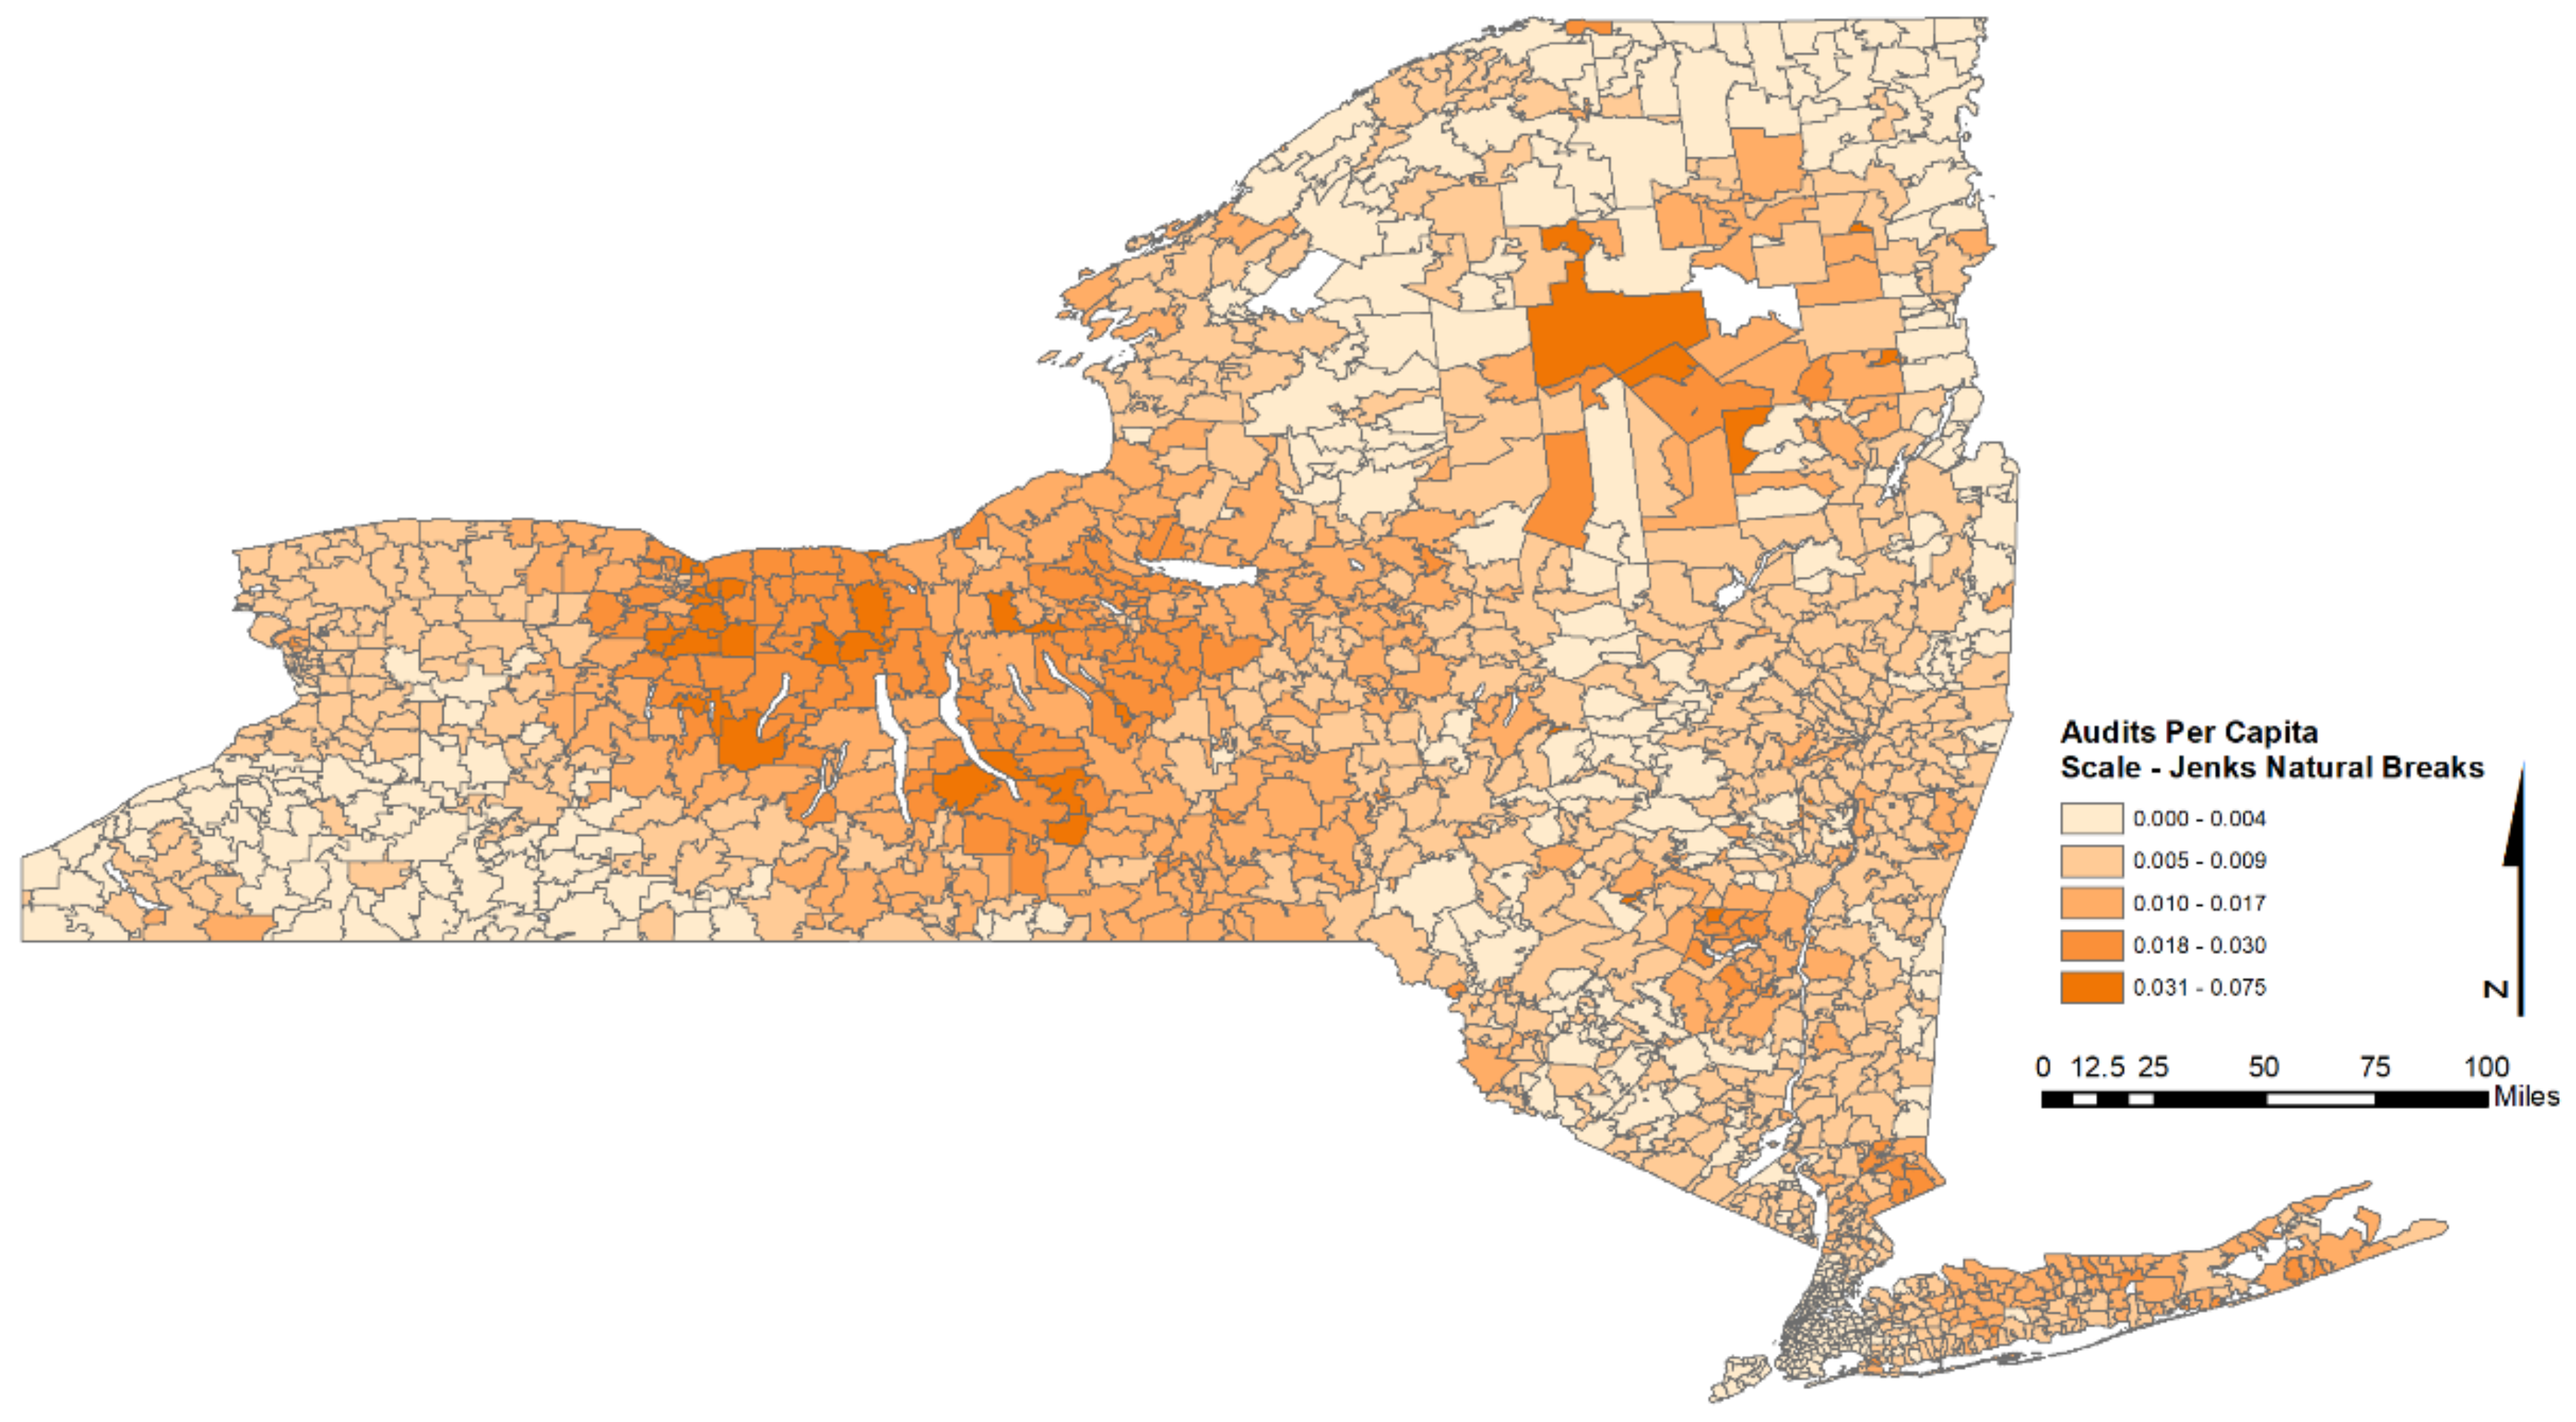
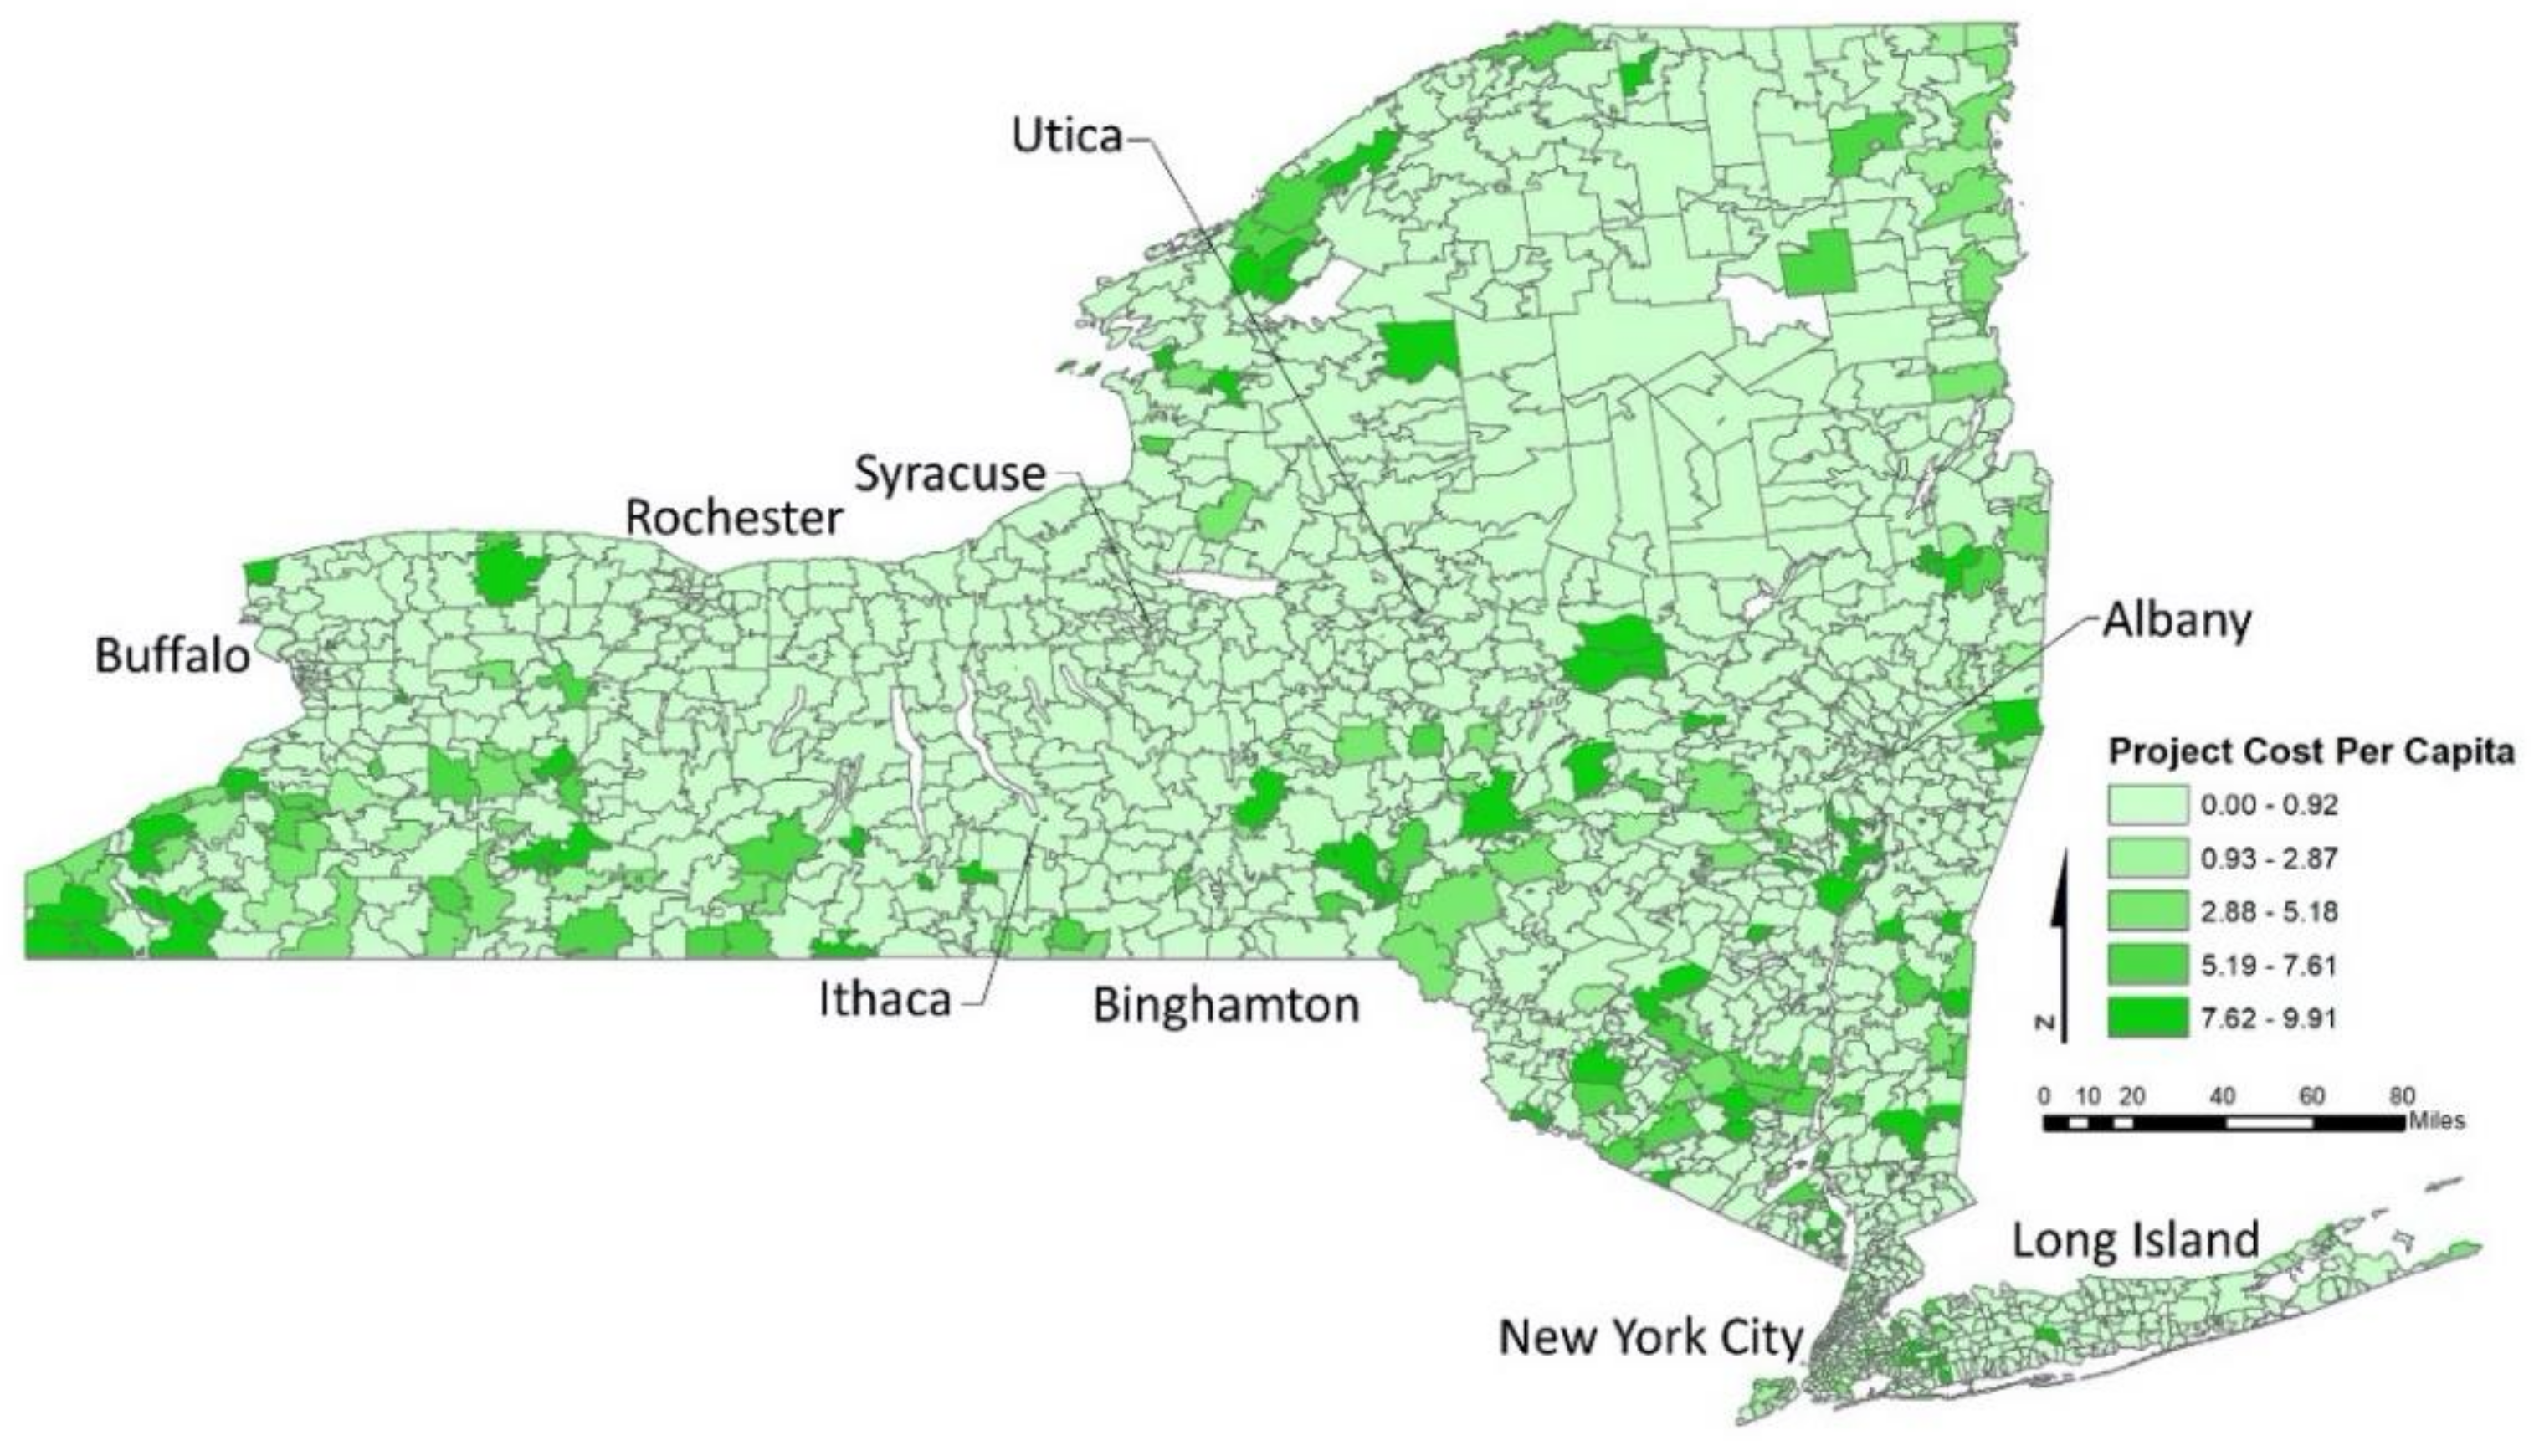
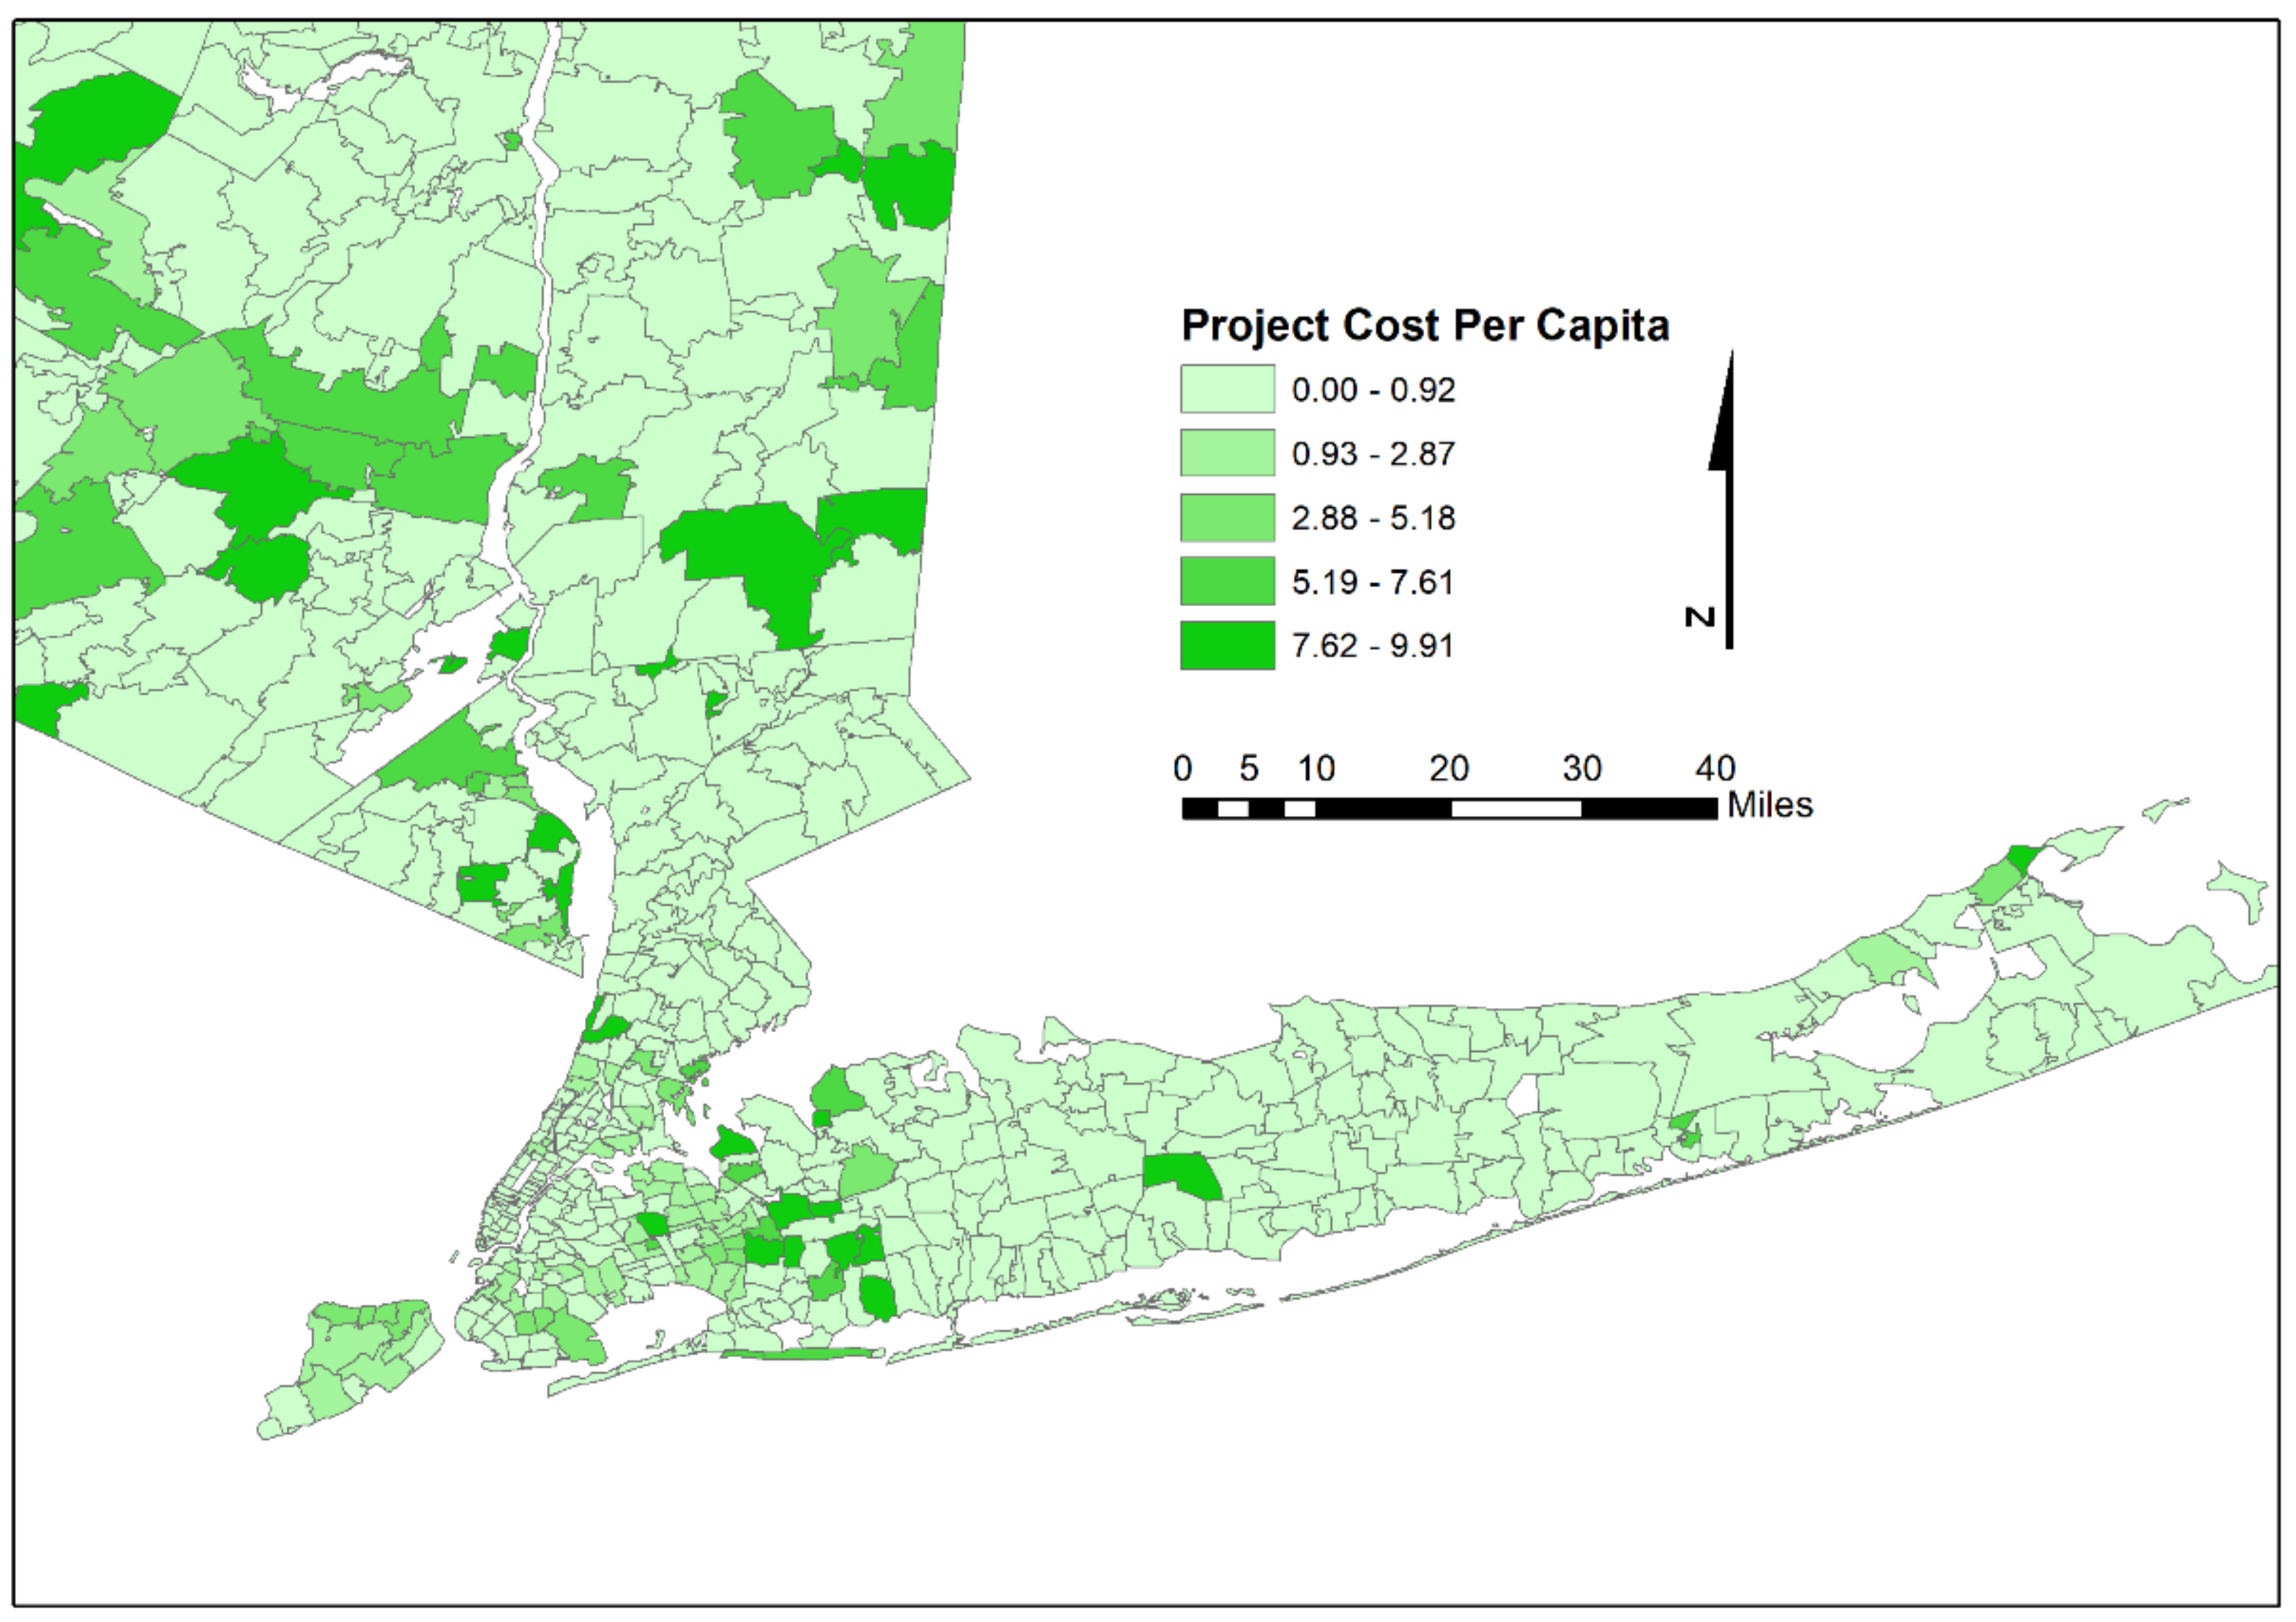
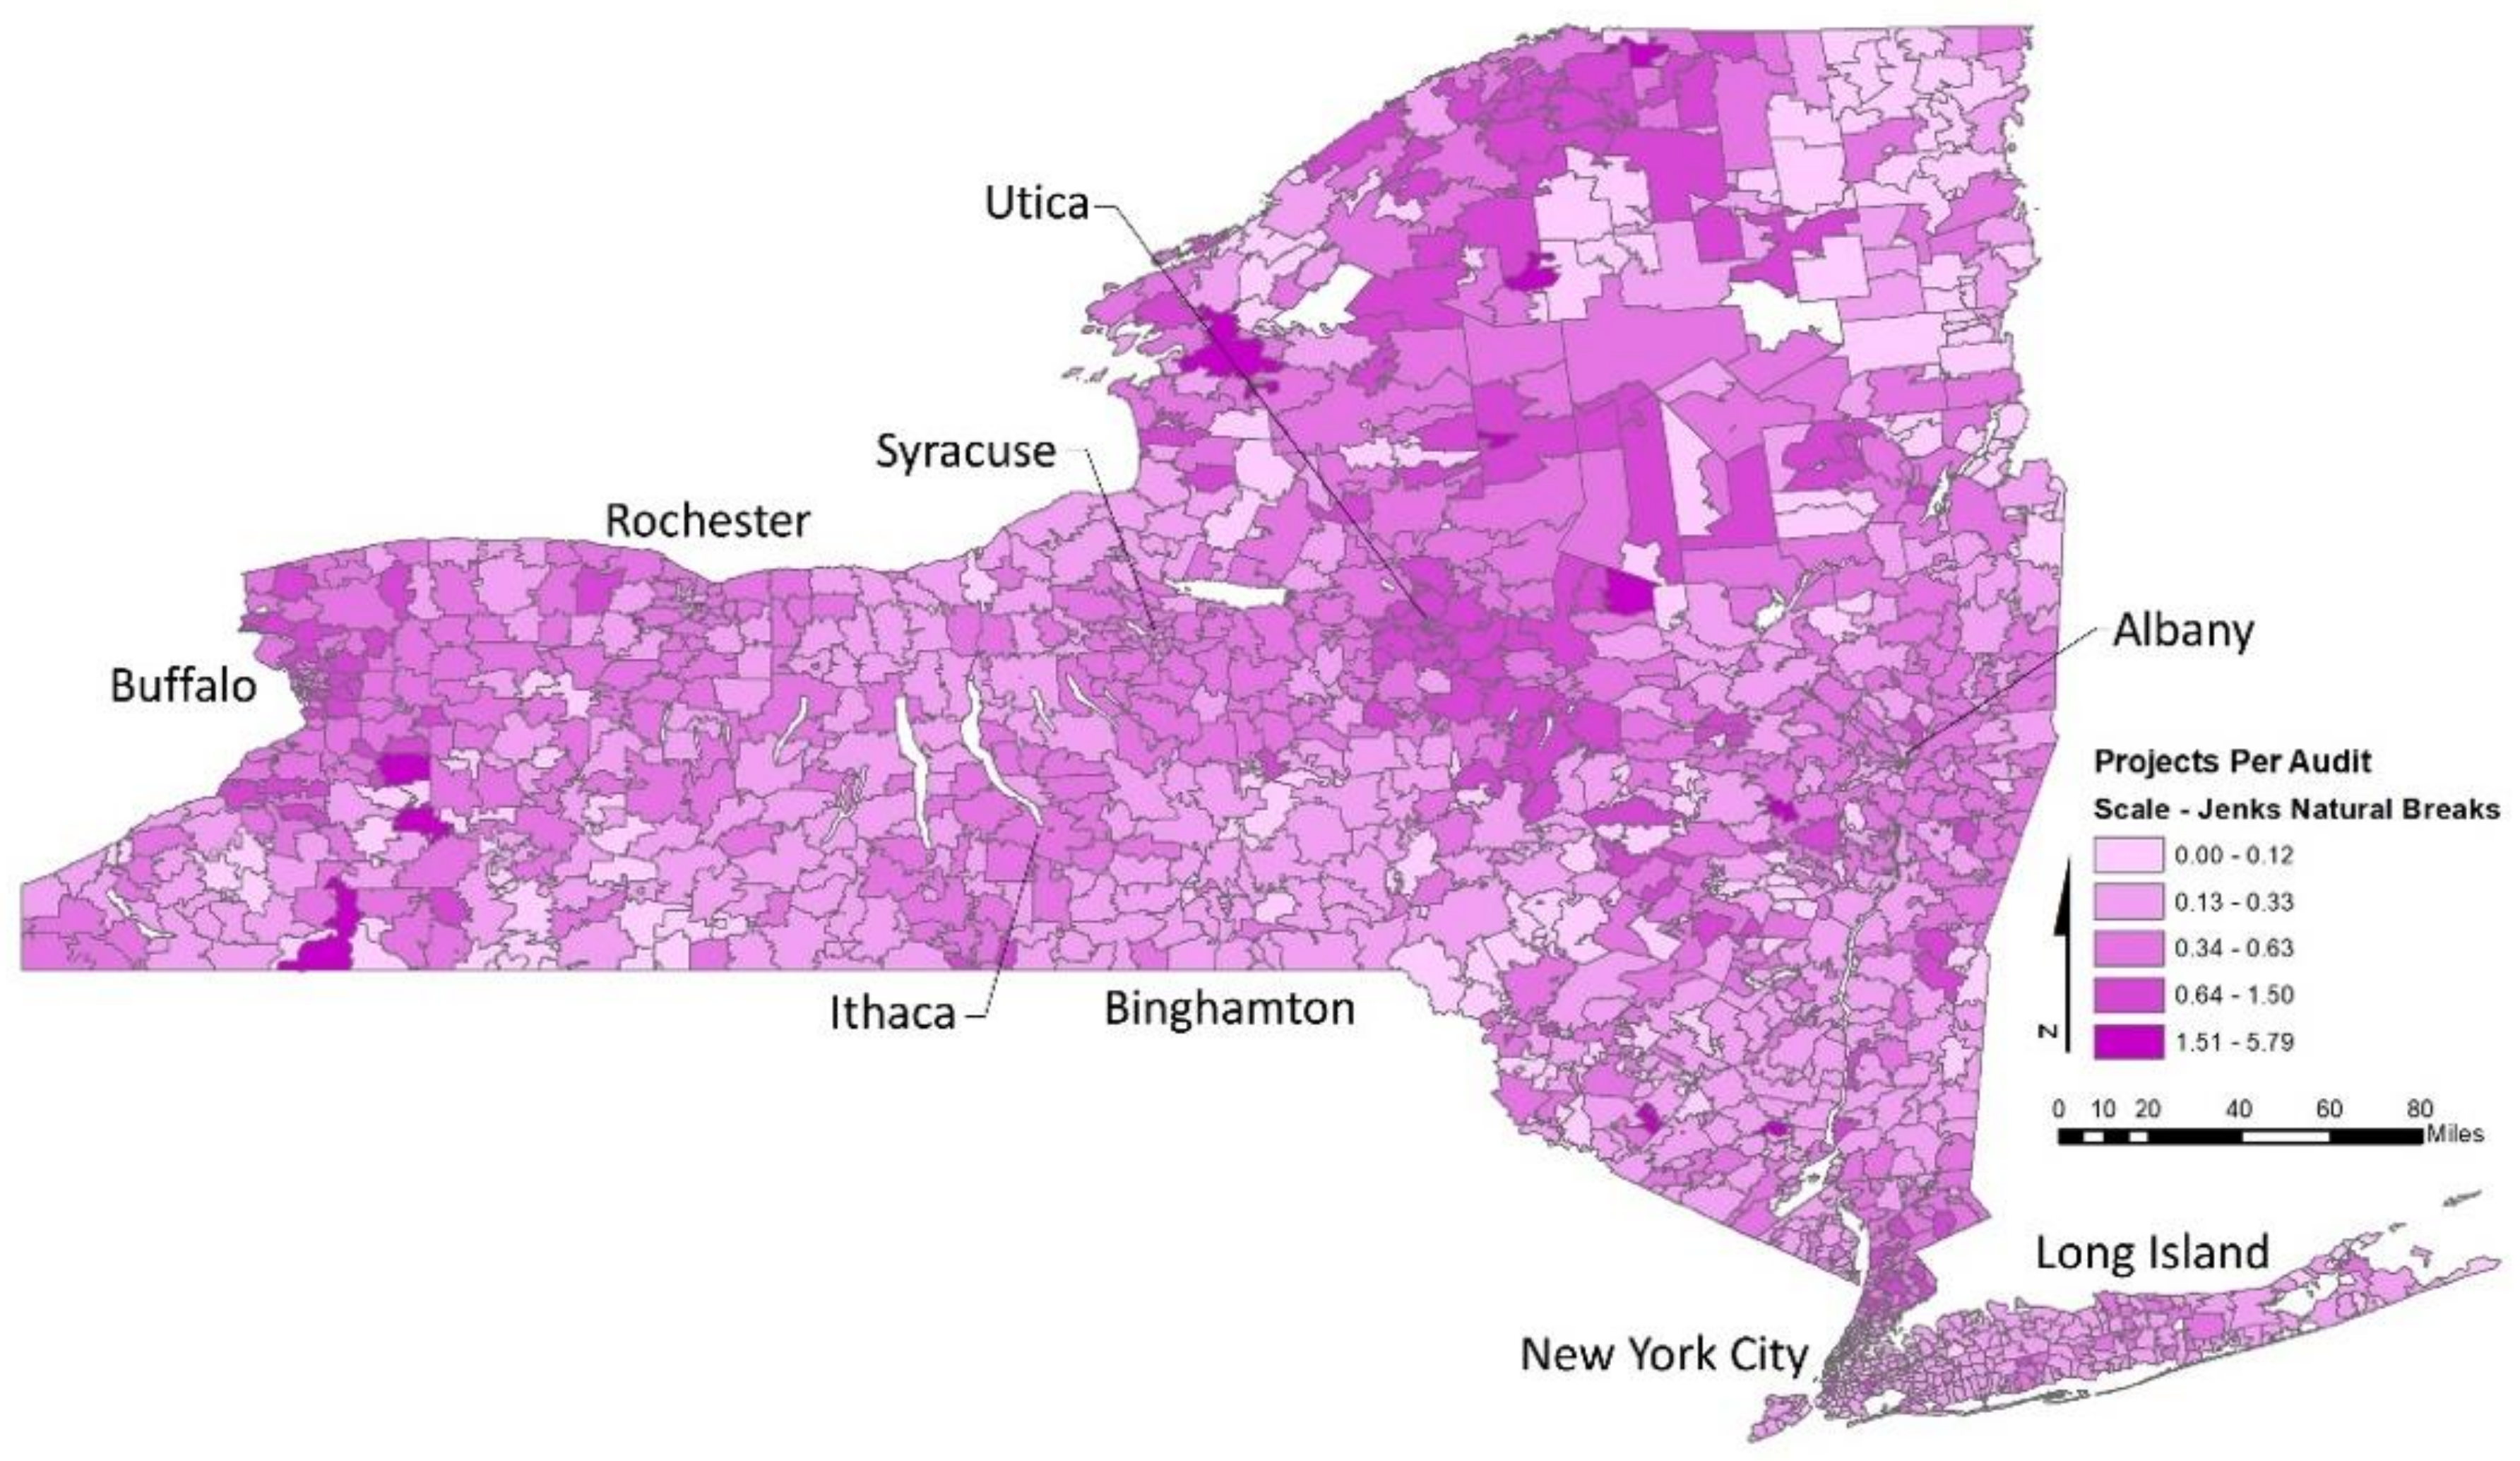
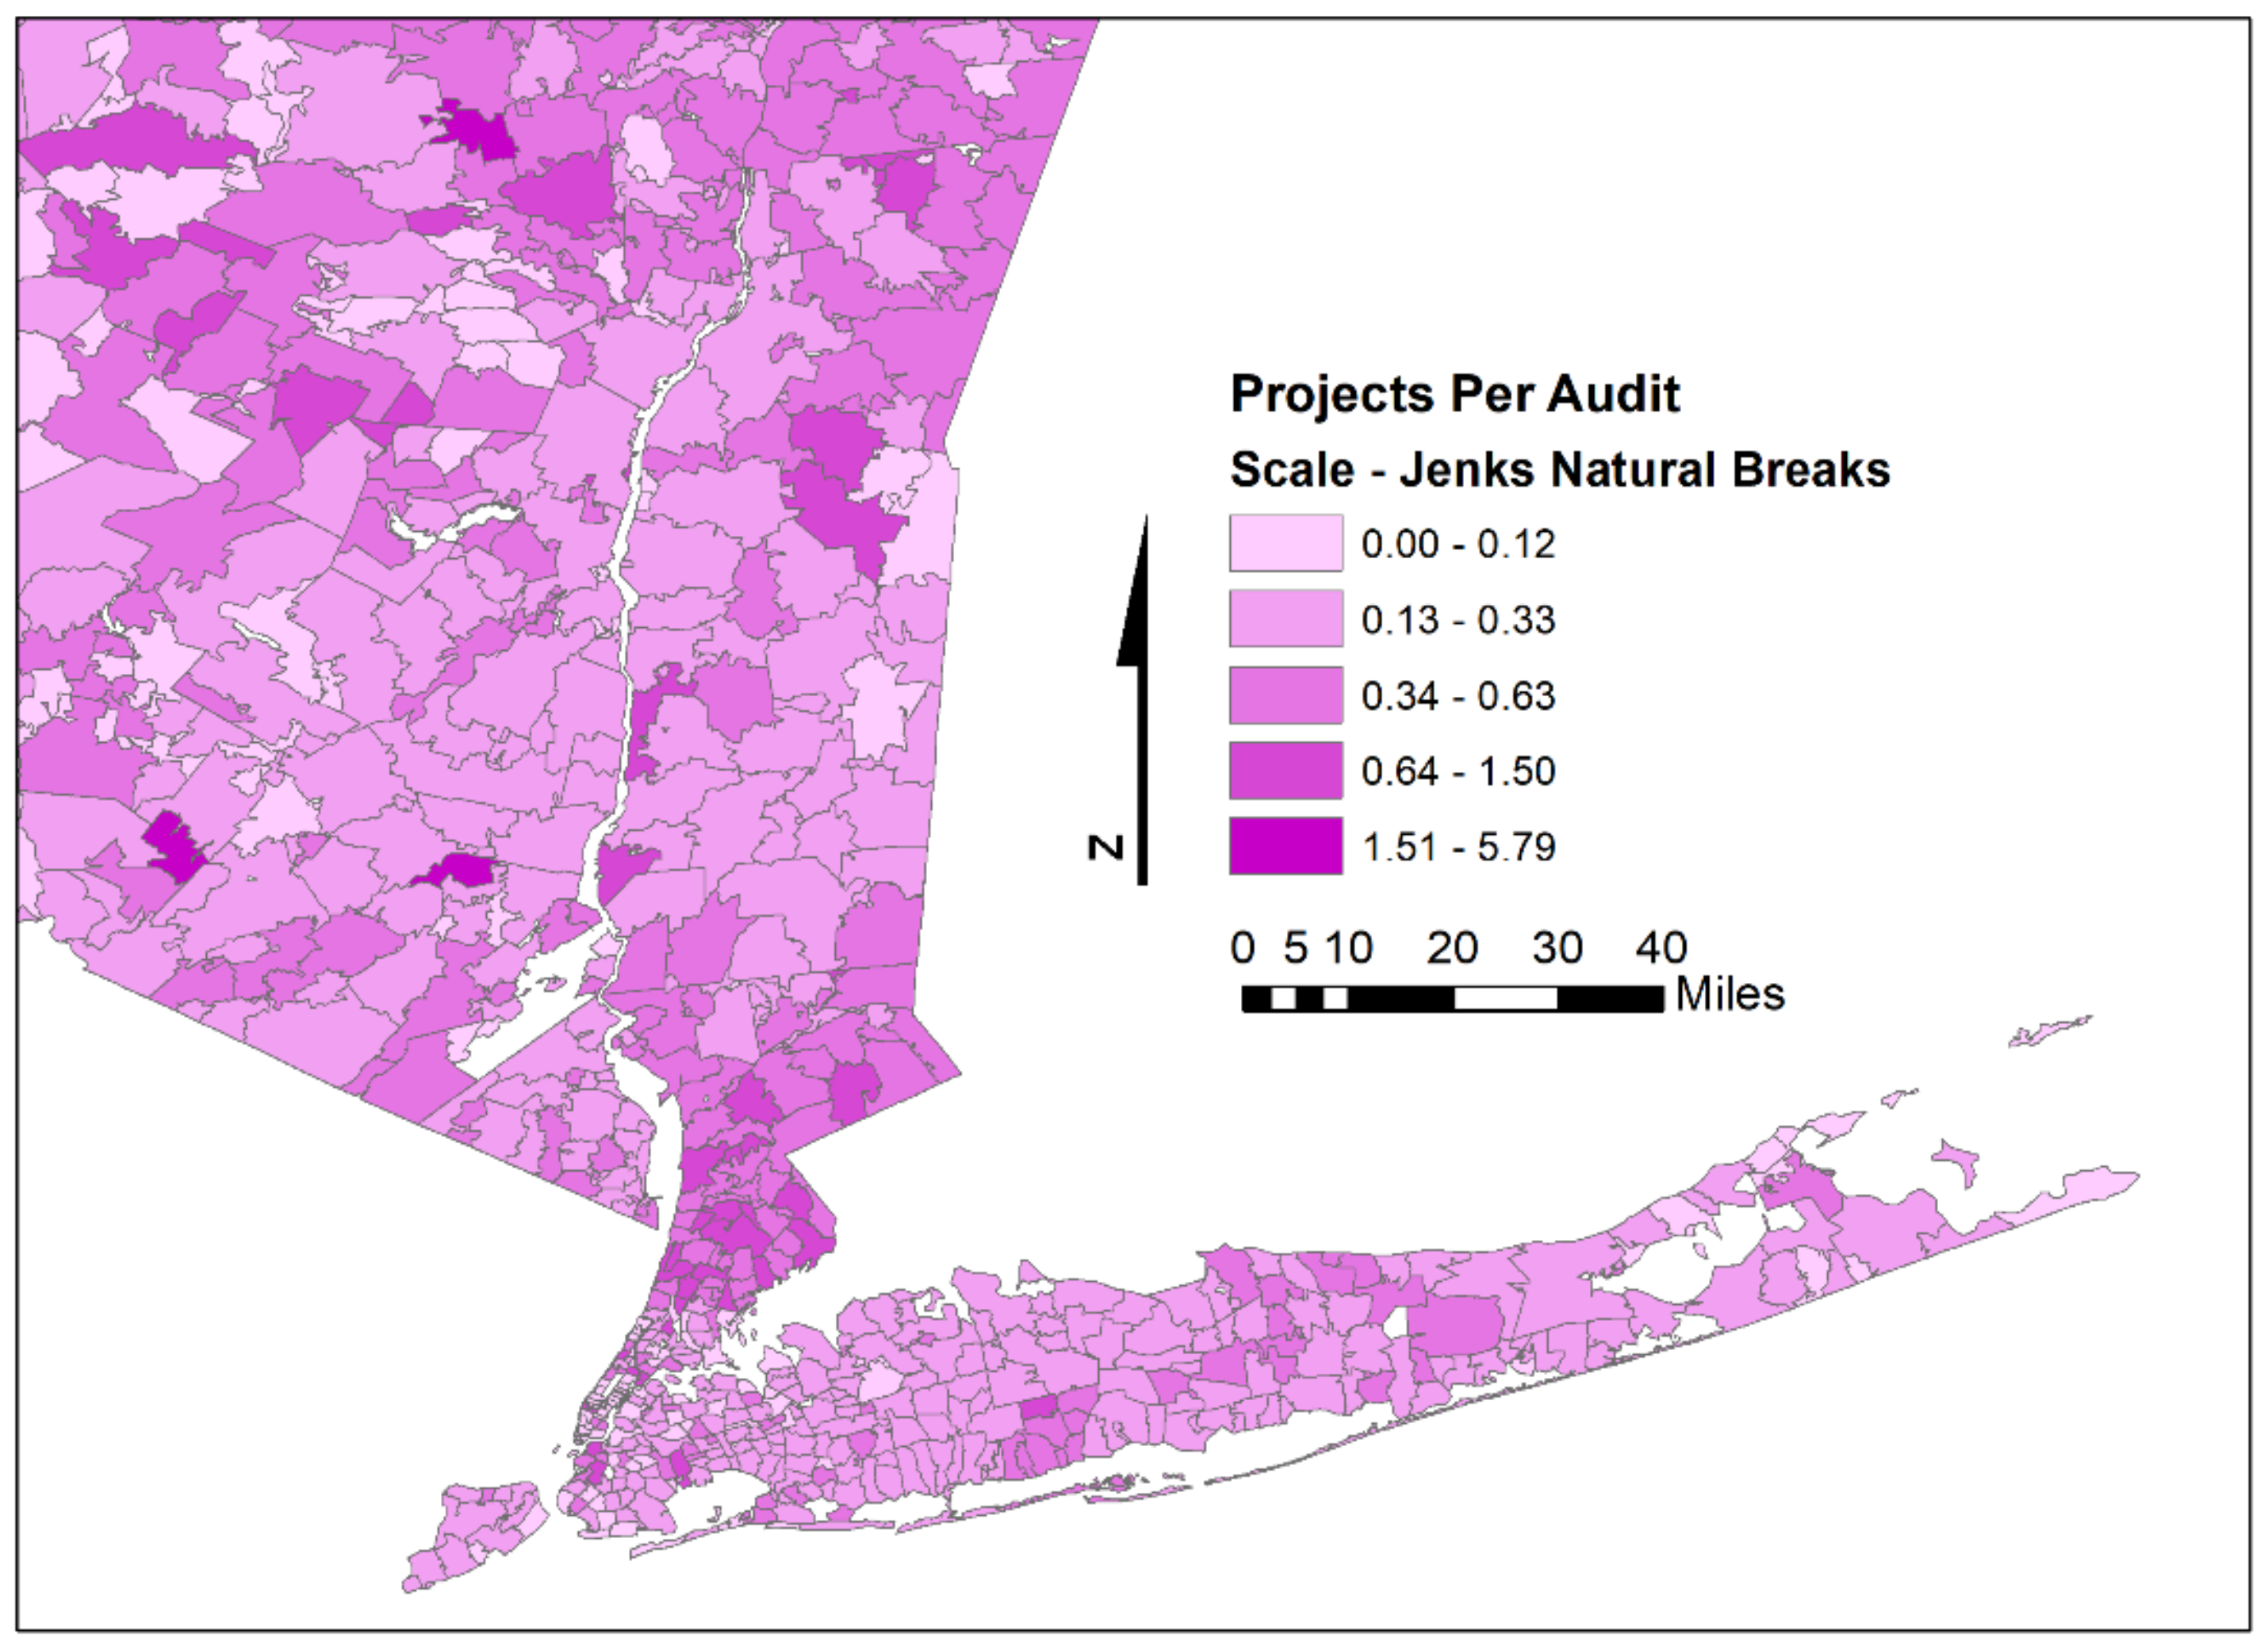
3.1. Descriptive Statistics

Zip code-level descriptive statistics for the state of New York (N = 1670) were presented in Table 1 (all the variables used in this study). Regarding political affiliation, besides the more popular affiliations of registered voters (by zip code proportion), we categorize “undeclared” as its own affiliation. Notably, there are slightly more registered Democrats (35.8%) than Republicans (33.7%), and combined they constitute about 70% of all registered voters. Undeclared voters make up 22.5% of all those registered.
We note that the mean number of projects per capita per zip code at 0.0029 has a high standard deviation of 0.0051, which suggests a skewed variance. This can also be said of project costs with a mean cost per capita per zip code of $26.80 and a standard deviation of $35.20. Note that these figures are over the five-year period of 2011–2016. When considering the mean of the projects-per-audit ratio at 0.354 (also seemingly skewed), we find that every audit returns about a third of a project or, alternatively, it takes about three audits to return one project in a zip code (on average). We note that the cost of projects-per-audit ratio is $3348.18 over the six-year period of 2011–2016.
Notably, the average population per zip code is 11,580 and also has a high standard deviation (17,716). The skewing of these variables is not surprising considering the variation of human settlements in New York State, with densely populated, geographically-small zip codes in New York City and the downstate region versus sparsely populated, with spatially-large zip codes in rural areas such as the Adirondacks—north of Albany and Utica (see Figure 1).
Regarding the skewing of projects, some of this can spatially be seen in Figure 2—a map of all state incentivized projects from 2011–2016—and the detailed Figure 3 (New York City and Long Island). (Note: as standardly provided by our GIS mapping software, we use a five-level Jenks, natural-breaks algorithm to display our data.) In very densely populated areas such as New York City, there are fewer project counts per capita, but in more suburban areas there are higher per capita counts of projects. Additionally, there is something of a projects-per-capita concentrated “belt-way” across the state, starting from the west near Buffalo to Rochester, Ithaca, Syracuse, and, finally, more easterly Utica. This beltway can also be seen as in the low-range of population densities of the state (see Figure 1).
Additionally, when considering the incidence of home energy audits in the state (in Figure 4), there appears to be an association between audits and home retrofit projects along the same “beltway”, but these apparent associations will be explored more quantitatively below.
For an illustration of the distribution of project costs in the state, see Figure 5 and Figure 6, which—absent the belt-way and a more sporadic distribution—are markedly different from Figure 2. It is, however, difficult to make summations from, at best, a two- or three-level variable analysis such as a distribution map. More will be revealed in the upcoming multivariate regressions. We also note that nearly 15.6% (n = 261) of all the zip codes in the state (N = 1670) have zero recorded retrofit projects.
Figure 7 and Figure 8 depict the ratio distribution of projects per audit across the state. Higher ratio values and therefore higher returns of projects per audit can be seen in the darker areas in the central to northern parts of the state. In the detail (Figure 8) of New York City, there is also a clustering of higher values a bit north of the city. We note that as this ratio value required a process of division, any zip codes that had either zero projects or zero audits were assigned a zero value; this amounted to 16.0 percent of the sample. We will also analyze this ratio through multivariate analyses further below. With respect to maps that illustrate the distribution of project-costs-per-audit in the state, we have not included them, as there was no coherent patterning to be discerned in them and they were therefore of little value.
Figure 9 depicts the annual count of incentivized energy audits in the state, and Figure 10 depicts their annual costs. Although we do not perform a deeper longitudinal examination of this data, these figures do show variations from year to year and ultimately an overall increase from 2011 to 2016.

3.2. Regression Results

Table 2 illustrates the results of an ordinary least squares (OLS) analysis where the natural logarithm—to accommodate skewness—of audits per capita (per zip code) is regressed on the zip code variables introduced above in Table 1. To achieve the logarithmic calculation, it was also necessary to add a one (1) to each value in order to eliminate all zero (0) values. Model 1 is a first iteration of this analysis and Model 2 is only different by its control for spatial autocorrelation via a Lambda variable. The sample size also declines from Model 1 to Model 2—from 1670 to 1667—as three isolated zip codes (islands) are dropped from the autocorrelation analysis. We note from the high R2 of both models (0.667, 0.817, respectively) that our power to explain is inordinately high and that the largest association can be seen in the spatial clustering variable, Lambda, in Model 2, bottom row (0.757 ***). We also note that the clustering measure, Moran’s I, is significant in both models, but much stronger and positive in Model 1 versus very weak and negative in Model 2. The reduction of the Akaike info criterion variable between Model 1 and 2 suggests that Model 2 is a better fit than Model 1.
We find that there are three ways to interpret Table 2: (i) examining Model 1, which has no controls for autocorrelation; (ii) examining Model 2, which has controls for autocorrelation; and (iii) examining the changes between Model 1 and Model 2. In Model 1, we find that the strongest associations (with the incidence of energy audits per zip code in New York State) are negative: in order of strength, they are population density, median home value, % renter occupied units, and % limited English. The strongest positive associations are % BA degree or higher, contractors per county population, and total adopted EVs per capita for 2017. Regarding Model 2, we again find that the strongest associations are negative: they are population density and then % renter occupied units. The strongest positive associations are contractors per county population and % BA degree or higher. Notably, compared to Model 1, both % non-Hispanic Whites and total installed solar (kW/capita) had a spike up to 0.098 ***, while median home value and total adopted EVs had a strong drop in associative strength. Though there are many unknowns as to why certain zip codes cluster with respect to energy audits, the differences between Model 1 and 2 suggest that—with respect to our independent variables—the strongest reasons for clustering are home values, population density, electric vehicles per capita, and % BA degree or higher.
Table 3 depicts the results of the OLS analysis of both the count of projects and their costs per capita (per zip code). Model 3 is the count of projects while Model 4 is the same except for its control for spatial autocorrelation (the Lambda variable). Similarly, Model 5 is the cost of projects while Model 6 has the Lambda controls. Like Table 2, the sample size between models declines from 1670 to 1667 as the three geographic isolates are dropped to conduct the autocorrelation analysis. We note from the R2 of the models that they are all strong; however, the count-of-projects analyses have nearly twice the associative strengths as the two costs models. We also note the Lambda for the project count, Model 4, is stronger than Model 6, suggesting that NYS zip codes are clustering more around the incidence of projects than their costs. Notably, and perhaps to be expected, the Akaike info criterion variable shows an improved fit for the models when spatial autocorrelation is controlled. Additionally, though the Moran’s I is significant in all the models, it is very weak when we control for autocorrelation in Models 4 and 6, suggesting an adequate control of spatial autocorrelation.
Like Table 2, we interpret these analyses in three ways: (1) base model, (2) the autocorrelation model, and (3) the difference between the two. In Model 3, we find that the strongest association (with the count of home retrofit projects per zip code in NYS) is positive and is the audits-per-capita variable. The other positive associations—in descending order of strength—are contractors per county population and median income. The strongest negative associations are population density, median home value, and % limited English. Regarding Model 4, the strongest association is the Lambda variable and is positive, and then there is audits per capita, % non-Hispanic Whites, and contractors per county population. Regarding the negative associations, they resemble Model 3 (in descending order): population density, median home value, and % limited English. When noting the differences between Models 3 and 4 (with Lambda controls), many of the variables that are most significant contribute to clustering, but we especially note how % non-Hispanic Whites has an increase in associative strength.
In Model 5, cost of projects, the strongest association is positive with the audits-per-capita variable, followed by median income and average household size. The strongest negative association is population density and then % non-Hispanic Whites and median home value. Regarding Model 6, the strongest association is with audits per capita and is positive, followed by the Lambda variable. Regarding the negative associations, like Model 5, they are population density, % non-Hispanic Whites, and median home value. When considering differences between Models 5 and 6, we again note that many of the most significant variables mentioned above contribute to zip code clustering. Interestingly, though contractors per county population was weak but significant in Model 5, it completely loses significance in Model 6.
Table 4 depicts the results of the OLS analyses of the count of projects and their costs per audit (per zip code). Model 7 is the count of projects per audit while Model 8 controls for spatial autocorrelation. Model 9 is the cost of projects per audit and Model 10 is the Lambda controls for autocorrelation. Again, due to dropped geographic isolates for the autocorrelation analyses, the sample sizes drop from 1670 to 1667. In contrast to the above analyses, the R2 of these models (7–10) are weak to moderate. We note that the inclusion of the Lambda variable improves the R2, the Moran’s I, and the Akaike info criterion variables in both these analyses (counts and costs).
In Model 7 (count of projects per audit), we see that the strongest variable association is negative with population density. The strongest positive associations are with contractors per county population and the Democratic margin. In Model 8, Lambda (clustering) is the strongest positive association followed by other positives: contractors per county population and Democratic margin (which increased slightly when controlling for clustering). The strongest negative association is population density followed by median home value (which also increases in strength from Models 7 to 8). When comparing these two models, contractors per county and % undeclared affiliation population appear to have the greatest association with clustering.
In Model 9 (cost of projects per audit), the strongest association is positive with audits per capita followed by % limited English (median age structures has a weak but first time showing in these models). The strongest negative association is % of non-Hispanic Whites followed by population density. In Model 10, Lambda is the strongest correlation and positive, followed by audits per capita and % limited English. The strongest negative association is (like Model 9) % of non-Hispanic Whites followed by population density. When comparing the differences between the two models, there are no great differences; Model 10 actually has the weakest Lambda of all the models, suggesting less clustering than the others—this can also be seen in Figure 9. We note, though, that average household size, median age of structures, and % of non-Hispanic Whites seems to have the greatest association with zip code clustering.

4. Discussion

Although there are many findings to discuss, we begin by reviewing our general hypotheses. First, we hypothesized that an association would be found between the location of audits, auditors, retrofit projects and the “green behaviors” we sought to operationalize. Generally, we confirm these findings, and they align with the findings by Boucher et al. [12], but relationships with green behaviors such as solar generation and incidence of EVs was weak, though, at times, significant. These findings, then, seem to highlight (1) the possible state-requirement of the audit, (2) the importance of access to auditors as a preliminary step to an audit or project, and (3) the seeming importance of information transfer (from audits to projects) that was possibly activated by the auditor—reminiscent of the Van de Grift & Schauer [37] reference to “a hand to hold”. From the perspective of the hassle factor, it is possible that simply obtaining the audit represents an initial step in surmounting the hassle or hurdle of doing something new, making the subsequent step of a project less of a burden. Access to information is recounted as one of the largest barriers to action in the implementation of energy efficiency projects [10]. It appears that audits may go a long way in bridging this gap between information and access and, perhaps, pushing through some resistant behavioral inertia. Additionally, there may be some form of information transfer or “hand holding” [37] occurring when individuals purchase EVs or solar in that their awareness of energy efficiency increases and retrofits seem less of a hurdle; however, it is not clear from these results the directionality of the influence (e.g., undertaking a retrofit encourages solar/EV adoption or vice versa).
Additionally, we asked whether our projects-per-audit ratio might be associated with a higher area penetration of auditors or the privileges of affluence such as income, education, or race, and we only found partial evidence for this, namely in significant relations between the count of projects per audit and the incidence of audit contractors. However, the moderate significant relationship between the count of projects per audit and the Democratic margin of win in 2016 suggests a political and cultural dimension to the success of New York’s “audits to projects” program with a leaning towards more Democratic zip codes. Regarding the cost of projects per audit, we found that the greater penetration of audits, in itself, had the highest association to higher project spending in relation to zip code audit incidence. Contrary to our speculations, project costs per audit is inclined towards what we might call a lesser-privileged population: higher zip code percentages of limited English and lesser percentages of non-Hispanic Whites. It seems then that these areas, with respect to project spending, are simply more responsive to audit incidence, or some other dynamic could be at play. For instance, do areas with more non-Hispanic Whites of stronger English have less project cost needs? Might this be the way privilege plays in these areas? This needs further and perhaps more qualitative exploration. We note that both count and cost per audit are significantly and negatively related to population density, which has been a stable association in all our models; neither audits nor projects nor their ratios positively associate as density increases. This makes sense, as renters are typically less likely to undertake energy efficiency projects (either due to principal/agent misalignments and lack of desire to invest in a property they do not own or due to prohibitions and lease restrictions that do not allow capital improvements in rentals), and, relatedly, renters are found in high-density areas. Thus, a clear negative association between the incidence and cost of projects and these two variables is expected.
We also expected some ambiguity or contradiction in the relationship between higher-income households and the likelihood of undertaking retrofits. They are more likely to have significant project capital, but prior empirical evidence showed that higher income households are often less likely to undertake pro-environmental behavior. In keeping with prior research, our data in this study also indicates that higher-value homeowners are less likely to undertake retrofit projects. Perhaps if higher-value homes are assumed to be newer or already heavily upgraded, their homeowners will be less likely to undertake retrofit projects as they may not be needed. This speculation does, however, require greater research.
Many of the models also returned coefficients that were statistically significant and negative between projects (per capita, per audit, and counts/costs of projects) and non-English speaking populations (significant in Models 1, 3, 4, 9, and 10). This indicates that there is a potentially overlooked population of New York State residents who may be willing and interested in undertaking home retrofit projects given more concerted effort to make materials accessible in other languages.

4.1. Policy Implications

The findings from this study lead to a number of policy implications and confirmations for New York State, with takeaways for other sub-regions.
First, the clear pathway from auditors to audits to subsequent projects is important. Auditors are the common link in both audits and projects, and this leads to multiple needs that must be met to support more audits and retrofits. First, there is a need for enough auditors overall, in well dispersed locations, ensuring access for jurisdictions across the state. This can be achieved by recruiting local contractors in underserved areas or creating incentives for auditors in other areas to market their services outside of their local geography. Second, local utilities should ensure that all auditors working on behalf of the state receive comprehensive and consistent training so that all auditors meet a minimum level of expertise and skills. Top-down training will allow a utility to give a clear directive to auditors to communicate both the economic value and the environmental benefit of audits and projects to customers and will also allow the utility to develop a strong organizational culture to support trustworthy and positive interactions between the auditor and homeowner. For instance, for a customer, a pleasant experience is interpreted as friendly, honest, and transparent. Further, both auditors and customers should be able to navigate the pathway from audit to project with ease. This can be achieved by providing the auditor with the appropriate tools, materials, and literature to assist the homeowner in making decisions about installations. Additionally, since most auditors are themselves contractors, statewide policies and incentives should be structured in such a way that the individual homeowner can plan a retrofit project with the same individual who conducted the audit, which can build trust and facilitate a seamless interaction.
Relatedly, this work provides evidence that materials and literature also need to be provided for households with primary languages other than English. This would reduce the hurdle of information access to those with limited English skills and perhaps open up an untapped market of willing participants. Similarly, any outreach programs should make a targeted effort to engage with and actively explain programs to non-English speaking households. This requires a policy focus on engaging bilingual staff, outreach individuals, and contractors.
Next, as the authors found an association between the distribution of audits, projects, and the clustering of green behaviors, there exists untapped policy potential to leverage other home installation actions to increase retrofits. For example, solar purchasers could be offered an incentive at the time of purchase to make an additional energy-related capital improvement, and solar installers could be provided incentives to advertise the statewide audit program. The State could also form partnerships with well-known real estate brokerage firms to help disseminate information on audit and retrofit programs at the time of home purchase. This would capitalize on the home buyer’s transition to a new residence when there is a likely opening for home improvement projects. Existing research has found that homeowners are much more willing to make significant home improvements if they are already undertaking a project, have just moved into their home, or are otherwise at a transition point [13]. Thus, there is strong precedent for the effectiveness of this type of policy mechanism.
Finally, it has been found here and in other studies [12,31,33,48,49,62] that high-income households are less likely to participate in pro-environmental programs and incentives, in part because the economic rationale for participation (e.g., electricity cost savings, rebates, etc.) is less appealing to this market segment given their high disposable income. Thus, it becomes increasingly important to craft policies for high-income homeowners that specifically target known market barriers, increasing convenience and reducing hassles and burdens on participants’ time and effort. This also strengthens the argument for future qualitative research to better parse the motivations of high-income individuals.
Accessing and processing information is one such barrier that can create significant demands on a homeowner’s time. One pathway to reducing information asymmetries is to mandate information provision and disclosure about energy performance during real estate transactions through some form of labeling or rating scale [23]. Such Energy Performance Certificates (EPCs) are mandatory in many places in the European Union, including Germany [19], but—beyond Leadership in Energy and Environmental Design (LEED) and EnergyStar, which are both voluntary—such schemes are not common or required in the United States housing market, especially for single family homes. New York State could craft a mechanism that would require homeowners to disclose key metrics about energy costs at the time of a home sale. By mandating such information provision, potential buyers would have a clearer understanding of the home’s energy strengths and weaknesses and, as outlined above, could receive information on audits from the real estate broker.
Home retrofit projects should also be carefully marketed to appeal to the high-income homeowners as luxury status goods. One relevant model is the electric vehicle (EV) market, where the luxury EV Tesla outpaced sales of Audi, BMW, and other luxury conventional vehicles through the end of 2019 [63], making inroads into a market segment that has been traditionally stagnant in its interest in EVs; they have done so by crafting a brand built on luxury, not on environmental concern. A takeaway for policy makers for the home retrofit market is to consider ways to make retrofit projects appealing from a “status symbol” or luxury/comfort perspective instead of an energy efficiency and cost-savings perspective. For instance, offering incentives to high-end contractors who can work with, install, and maintain projects in high home-value areas that deliver excellent energy performance as well as outstanding comfort and aesthetics may begin to target the high-end market.

4.2. Limitations and Future Work

It is important to discuss some limitations to the data and analysis conducted here. Most importantly, outcomes from this work rest on important assumptions about auditor characteristics and highlight a valuable link between auditors, audits, and subsequent projects. A better understanding of this area is outside of the scope of the data used for this work. An important follow-up study could involve the collection of qualitative research on auditor characteristics (a state-wide survey or a sample of in-depth interviews) to better understand contextual factors that contribute to auditor “hand-holding” behavior/leadership on energy efficiency [37]. In short, without more qualitative research, it is difficult to know the interpersonal dynamics between an individual homeowner and auditor when they meet, and there is likely to be a high degree of variability from household to household in how these actors interact, work together, and get along.
Similarly, it is difficult to parse the motivations behind home retrofits, and a more finely grained understanding is also outside of the scope of this analysis. A secondary study that follows up with a sample of homeowners who have completed retrofits to ask questions about environmental values, attitudes, and social norms would be necessary to gain a better understanding of homeowner motivations. Additionally, as is common with sampled data, there are errors inherent in the method.
Finally, it should be noted that the 2016 statewide data on home retrofits was the most recent data that could be obtained for this work. Although there is likely to be some change in the outcomes found in 2016 versus now, these changes are not likely to be significant. New York’s policy landscape for energy efficiency has remained largely the same over the prior five years. Although the COVID-19 pandemic has likely played a role in the incidence of projects since early 2020, that topic is outside of the scope of this work but presents an interesting focus for a separate study in the future.

5. Conclusions

This work provides new contributions to an understudied area of energy policy research: the pathway from audits to projects. A number of factors were explored, including socioeconomic, demographic, and spatial variables in New York State, and this analysis confirmed previous findings by the authors and others. Specifically, findings indicated that audits and projects are likely to be correlated with other clusters of “green” behaviors and tend to occur less frequently in areas of high density and high incomes. Policy recommendations include strong, clear support at the utility level for hiring and training of qualified and trustworthy auditors as well as more bilingual staff, stronger leveraging of possible synergies between retrofit projects and other green behavior clusters, and increased efforts to understand and parse the motivations of high-income individuals, including marketing of retrofits from a status or luxury perspective, instead of an environmental one. More qualitative work would be insightful in a number of these areas and provide an interesting direction for future work.

Author Contributions

Conceptualization, E.L.H. and J.L.B.; Formal analysis, J.L.B.; Investigation, E.L.H. and J.L.B.; Methodology, J.L.B.; Project administration, E.L.H.; Software, J.L.B.; Visualization, J.L.B.; Writing – original draft, E.L.H.; Writing – review & editing, E.L.H. and J.L.B. All authors have read and agreed to the published version of the manuscript.

Funding

This research received no external funding.

Institutional Review Board Statement

Not applicable.

Informed Consent Statement

Not applicable.

Data Availability Statement

Restrictions apply to the availability of these data. Data were obtained from the New York State Energy Research and Development Authority (NYSERDA) and are available from the authors with the permission of NYSERDA.

Conflicts of Interest

The authors declare no conflict of interest.

Appendix A

Table A1. Bivariate correlations; New York State zip codes (N = 1670). Correlations over 0.4 are arbitrarily shaded to highlight their strength.
VariableMedian AgeMedian Income% BA Degree or HigherPop. Density ppl/sq-mlAve. Household SizeMedian Home Value% Renter-Occupied UnitMedian Age of Structures% Non-Hispanic WhitesDemocratic Margin% Undeclared Affiliation% Limited EnglishAudits/cap × 10,000Projects/Capita
Median income0.068 **
% BA degree or higher0.0460.713 **
Pop. density ppl/sq-ml−0.273 **0.053 *0.276 **
Ave. household size−0.441 **0.241 **−0.100 **−0.020
Median home value−0.056 *0.668 **0.700 **0.486 **0.128 **
% Renter-occupied unit−0.513 **−0.263 **0.085 **0.633 **−0.068 **0.234 **
Median age of structures−0.162 **−0.152 **−0.0270.253 **−0.0430.054 *0.328 **
% Non-Hispanic Whites0.449 **0.047−0.064 **−0.531 **−0.288 **−0.342 **−0.660 **−0.305 **
Democratic margin−0.371 **0.0040.258 **0.581 **0.058 *0.404 **0.675 **0.361 **−0.807 **
% Undeclared affiliation0.0350.368 **0.253 **−0.191 **0.062 *0.198 **−0.200 **−0.197 **0.179 **−0.124 **
% Limited English−0.297 **−0.084 **0.063 *0.555 **0.245 **0.346 **0.578 **0.250 **−0.696 **0.592 **−0.078 **
Audits/cap × 10,0000.196 **0.082 **0.121 **−0.267 **−0.090 **−0.146 **−0.302 **−0.138 **0.278 **−0.212 **0.155 **−0.254 **
Projects/capita−0.0120.0140.037−0.155 **0.010−0.124 **−0.037−0.130 **0.112 **−0.094 **0.115 **−0.137 **0.462 **
Project costs/capita0.074 **0.114 **0.116 **−0.203 **0.007−0.086 **−0.155 **−0.095 **0.174 **−0.131 **0.102 **−0.167 **0.638 **0.790 **
**. Correlation is significant at the 0.01 level (2-tailed); *. Correlation is significant at the 0.05 level (2-tailed).

References

  1. Biggart, N.W. Constructing Green: The Social Structures of Sustainability; The MIT Press: Cambridge, MA, USA, 2013. [Google Scholar]
  2. Davis, H. The Culture of Building; Oxford University Press: Oxfordshire, UK, 2000. [Google Scholar]
  3. Karvonen, A. Towards systemic domestic retrofit: A social practices approach. Build. Res. Inf. 2013, 41, 563–574. [Google Scholar] [CrossRef] [Green Version]
  4. Arrigoni, A.; Zucchinelli, M.; Collatina, D.; Dotelli, G. Life cycle environmental benefits of a forward-thinking design phase for buildings: The case study of a temporary pavilion built for an international exhibition. J. Clean. Prod. 2018, 187, 974–983. [Google Scholar] [CrossRef]
  5. Zhang, L.; Wu, J.; Liu, H. Turning green into gold: A review on the economics of green buildings. J. Clean. Prod. 2018, 172, 2234–2245. [Google Scholar] [CrossRef]
  6. Hirst, E.; Brown, M. Closing the efficiency gap: Barriers to the efficient use of energy. Resour. Conserv. Recycl. 1990, 3, 267–281. [Google Scholar] [CrossRef]
  7. Jaffe, A.B.; Stavins, R.N. The energy paradox and the diffusion of conservation technology. Resour. Energy Econ. 1994, 16, 91–122. [Google Scholar] [CrossRef]
  8. Thompson, P.B. Evaluating energy efficiency investments: Accounting for risk in the discounting process. Energy Policy 1997, 25, 989–996. [Google Scholar] [CrossRef]
  9. Owen, A.; Mitchell, G. Outside influence–Some effects of retrofit installers and advisors on energy behaviours in households. Indoor Built Environ. 2015, 24, 925–936. [Google Scholar] [CrossRef] [Green Version]
  10. Bardhan, A.; Jaffee, D.; Kroll, C.; Wallace, N. Energy efficiency retrofits for U.S. housing: Removing the bottlenecks. Reg. Sci. Urban Econ. 2014, 47, 45–60. [Google Scholar] [CrossRef] [Green Version]
  11. New York State Homes and Community Renewal. Weatherization Assistance Program. New York State. Available online: https://hcr.ny.gov/weatherization-assistance-program-0 (accessed on 9 September 2021).
  12. Boucher, J.L.; Araújo, K.; Hewitt, E. Do education and income drive energy audits? A socio-spatial analysis of New York State. Resour. Conserv. Recycl. 2018, 136, 355–366. [Google Scholar] [CrossRef]
  13. Risholt, B.; Berker, T. Success for energy efficient renovation of dwellings—Learning from private homeowners. Energy Policy 2013, 61, 1022–1030. [Google Scholar] [CrossRef] [Green Version]
  14. Bjørneboe, M.G.; Svendsen, S.; Heller, A. Initiatives for the energy renovation of single-family houses in Denmark evaluated on the basis of barriers and motivators. Energy Build. 2018, 167, 347–358. [Google Scholar] [CrossRef]
  15. Wilson, C.; Pettifor, H.; Chryssochoidis, G. Quantitative modelling of why and how homeowners decide to renovate energy efficiently. Appl. Energy 2018, 212, 1333–1344. [Google Scholar] [CrossRef]
  16. Kerr, N.; Gouldson, A.; Barrett, J. Holistic narratives of the renovation experience: Using Q-methodology to improve understanding of domestic energy retrofits in the United Kingdom. Energy Res. Soc. Sci. 2018, 42, 90–99. [Google Scholar] [CrossRef]
  17. Wilson, C.; Crane, L.; Chryssochoidis, G. Why do homeowners renovate energy efficiently? Contrasting perspectives and implications for policy. Energy Res. Soc. Sci. 2015, 7, 12–22. [Google Scholar] [CrossRef] [Green Version]
  18. Jaffe, A.B.; Stavins, R.N. The energy-efficiency gap What does it mean? Energy Policy 1994, 22, 804–810. [Google Scholar] [CrossRef]
  19. Cajias, M.; Fuerst, F.; Bienert, S. Tearing down the information barrier: The price impacts of energy efficiency ratings for buildings in the German rental market. Energy Res. Soc. Sci. 2019, 47, 177–191. [Google Scholar] [CrossRef]
  20. Cuadrado-Ballesteros, B.; Martínez-Ferrero, J.; García-Sánchez, I.M. Mitigating information asymmetry through sustainability assurance: The role of accountants and levels of assurance. Int. Bus. Rev. 2017, 26, 1141–1156. [Google Scholar] [CrossRef]
  21. Phillips, Y. Landlords versus tenants: Information asymmetry and mismatched preferences for home energy efficiency. Energy Policy 2012, 45, 112–121. [Google Scholar] [CrossRef]
  22. Fuerst, F.; Warren-Myers, G. Does voluntary disclosure create a green lemon problem? Energy-efficiency ratings and house prices. Energy Econ. 2018, 74, 1–12. [Google Scholar] [CrossRef]
  23. Carroll, J.; Aravena, C.; Denny, E. Low energy efficiency in rental properties: Asymmetric information or low willingness-to-pay? Energy Policy 2016, 96, 617–629. [Google Scholar] [CrossRef]
  24. Cayla, J.-M.; Maizi, N.; Marchand, C. The role of income in energy consumption behaviour: Evidence from French households data. Energy Policy 2011, 39, 7874–7883. [Google Scholar] [CrossRef]
  25. Haq, G.; Weiss, M. Time preference and consumer discount rates-Insights for accelerating the adoption of efficient energy and transport technologies. Technol. Forecast. Soc. Chang. 2018, 137, 76–88. [Google Scholar] [CrossRef]
  26. Ansar, J.; Sparks, R. The experience curve, option value, and the energy paradox. Energy Policy 2009, 37, 1012–1020. [Google Scholar] [CrossRef]
  27. Awerbuch, S.; Deehan, W. Do consumers discount the future correctly? A market-based valuation of residential fuel switching. Energy Policy 1995, 23, 57–69. [Google Scholar] [CrossRef]
  28. Hewitt, E.L.; Andrews, C.J.; Senick, J.A.; Wener, R.E.; Krogmann, U.; Allacci, M.S. Distinguishing between green building occupants’ reasoned and unplanned behaviours. Build. Res. Inf. 2016, 44, 119–134. [Google Scholar] [CrossRef]
  29. Ouellette, J.A.; Wood, W. Habit and intention in everyday life: The multiple processes by which past behavior predicts future behavior. Psychol. Bull. 1998, 124, 54–74. [Google Scholar] [CrossRef]
  30. Verplanken, B.; Wood, W. Interventions to Break and Create Consumer Habits. J. Public Policy Mark. 2006, 25, 90–103. [Google Scholar] [CrossRef] [Green Version]
  31. Boucher, J.L. Culture, Carbon, and Climate Change: A Class Analysis of Climate Change Belief, Lifestyle Lock-in, and Personal Carbon Footprint. Soc. Ekol. 2016, 25, 53–80. [Google Scholar] [CrossRef] [Green Version]
  32. Druckman, A.; Jackson, T. The carbon footprint of UK households 1990–2004: A socio-economically disaggregated, quasi-multi-regional input–output model. Ecol. Econ. 2009, 68, 2066–2077. [Google Scholar] [CrossRef] [Green Version]
  33. Gatersleben, B.; Steg, L.; Vlek, C. Measurement and Determinants of Environmentally Significant Consumer Behavior. Environ. Behav. 2002, 34, 335–362. [Google Scholar] [CrossRef]
  34. Klöckner, C.A.; Nayum, A. Psychological and structural facilitators and barriers to energy upgrades of the privately owned building stock. Energy 2017, 140, 1005–1017. [Google Scholar] [CrossRef]
  35. Ingle, A.; Moezzi, M.; Lutzenhiser, L.; Hathaway, Z.L.; Lutzenhiser, S.; Van Clock, J.; Peters, J.; Smith, R.; Heslam, D.; Diamond, R. Behavioral Perspectives on Home Energy Audits: The Role of Auditors, Labels, Reports, and Audit Tools on Homeowner Decision-Making (LBNL-5715E); Lawrence Berkeley National Lab: Berkeley, CA, USA, 2012.
  36. Palmer, K.; Walls, M.; O’Keeffe, L. Putting information into action: What explains follow-up on home energy audits? Resour. Future Discuss. Pap. 2015, 15–34. [Google Scholar] [CrossRef]
  37. Van de Grift, S.; Schauer, L. A Hand to Hold: A Holistic Approach to Addressing Barriers in the Home Retrofit Market; ACEEE Summer Study on Energy Efficiency in Buildings: Washington, DC, USA, 2010; Available online: https://www.aceee.org/files/proceedings/2010/data/papers/2298.pdf (accessed on 22 March 2020).
  38. Aspeteg, J.; Mignon, I. Intermediation services and adopter expectations and demands during the implementation of renewable electricity innovation–Match or mismatch? J. Clean. Prod. 2019, 214, 837–847. [Google Scholar] [CrossRef]
  39. Gliedt, T.; Hoicka, C.E.; Jackson, N. Innovation intermediaries accelerating environmental sustainability transitions. J. Clean. Prod. 2018, 174, 1247–1261. [Google Scholar] [CrossRef]
  40. Kivimaa, P.; Boon, W.; Hyysalo, S.; Klerkx, L. Towards a typology of intermediaries in sustainability transitions: A systematic review and a research agenda. Res. Policy 2019, 48, 1062–1075. [Google Scholar] [CrossRef]
  41. Owen, A.; Mitchell, G.; Gouldson, A. Unseen influence—The role of low carbon retrofit advisers and installers in the adoption and use of domestic energy technology. Energy Policy 2014, 73, 169–179. [Google Scholar] [CrossRef]
  42. Wade, F.; Hitchings, R.; Shipworth, M. Understanding the missing middlemen of domestic heating: Installers as a community of professional practice in the United Kingdom. Energy Res. Soc. Sci. 2016, 19, 39–47. [Google Scholar] [CrossRef] [Green Version]
  43. Wade, F.; Shipworth, M.; Hitchings, R. Influencing the central heating technologies installed in homes: The role of social capital in supply chain networks. Energy Policy 2016, 95, 52–60. [Google Scholar] [CrossRef] [Green Version]
  44. De Wilde, M. The sustainable housing question: On the role of interpersonal, impersonal and professional trust in low-carbon retrofit decisions by homeowners. Energy Res. Soc. Sci. 2019, 51, 138–147. [Google Scholar] [CrossRef]
  45. NYSERDA. Homes and Residents. Albany, NY. 2019. Available online: https://www.nyserda.ny.gov/residents-and-homeowners (accessed on 9 September 2021).
  46. Neuman, W. Big Buildings Hurt the Climate. New York City Hopes to Change That. The New York Times. 17 April 2019. Available online: https://www.nytimes.com/2019/04/17/nyregion/nyc-energy-laws.html (accessed on 9 September 2021).
  47. New York City Mayor’s Office of Sustainability/ Greener, Greater Buildings Plan. 2018. Available online: http://www.nyc.gov/html/gbee/html/plan/plan.shtml (accessed on 9 September 2021).
  48. Burgess, M. Personal carbon allowances: A revised model to alleviate distributional issues. Ecol. Econ. 2016, 130, 316–327. [Google Scholar] [CrossRef]
  49. Wilson, J.; Tyedmers, P.; Spinney, J.E.L. An Exploration of the Relationship between Socioeconomic and Well-Being Variables and Household Greenhouse Gas Emissions. J. Ind. Ecol. 2013, 17, 880–891. [Google Scholar] [CrossRef]
  50. (NYSERDA) New York State Energy and Research Development Authority. Albany, NY, “Data,” 2017. Available online: https://www.nyserda.ny.gov/about/publications/program-planning-status-and-evaluation-reports/evaluation-contractor-reports/2017-reports (accessed on 9 September 2021).
  51. (American Community Survey) ACS. US Census Bureau, American Community Survey, 5-Year Estimates, 2011–2015. United States Census Bur. 2016. Available online: https://www.census.gov/programs-surveys/acs/technical-documentation/table-and-geography-changes/2015/5-year.html (accessed on 15 May 2019).
  52. (New York Department of Motor Vehicles) NYDMV. Vehicle, Snowmobile, and Boat Registrations | Open Data NY. Available online: https://data.ny.gov/Transportation/Vehicle-Snowmobile-and-Boat-Registrations/w4pv-hbkt (accessed on 2 January 2017).
  53. (New York State Board of Elections) NYSBE. Foil Requests. 2016. Available online: https://www.elections.ny.gov/FoilRequests.html (accessed on 25 July 2017).
  54. Gillingham, K.; Sweeney, J. Barriers to Implementing Low-Carbon Technologies. Clim. Chang. Econ. 2012, 3, 1. [Google Scholar] [CrossRef]
  55. Davis, L.W. Evaluating the Slow Adoption of Energy Efficient Investments: Are Renters Less Likely to have Energy Efficient Appliances? In The Design and Implementation of US Climate Policy; Fullerton, D., Wolfram, C., Eds.; University of Chicago Pres: Chicago, IL, USA, 2011; pp. 301–316. [Google Scholar]
  56. Portes, A. The Two Meanings of Social Capital. Sociol. Forum 2000, 15, 1. [Google Scholar] [CrossRef]
  57. Portes, A.; Sensenbrenner, J. Embeddedness and Immigration: Notes on the Social Determinants of Economic Action. Am. J. Sociol. 1993, 98, 1320–1350. [Google Scholar] [CrossRef]
  58. Grubesic, T.H. Zip codes and spatial analysis: Problems and prospects. Socioecon. Plann. Sci. 2008, 42, 129–149. [Google Scholar] [CrossRef]
  59. Grubesic, T.H.; Matisziw, T.C. On the use of ZIP codes and ZIP code tabulation areas (ZCTAs) for the spatial analysis of epidemiological data. Int. J. Health Geogr. 2006, 5, 58. [Google Scholar] [CrossRef] [PubMed] [Green Version]
  60. GeoDa. GeoDa: An Introduction to Spatial Data Analysis. GeoDa on Github. 2019. Available online: https://geodacenter.github.io/ (accessed on 28 November 2019).
  61. ACS. US Census Bureau, American Community Survey, 5-Year Estimates, 2006–2010, TIGER/Line® with Data. 2015. Available online: https://www.census.gov/geo/maps-data/data/tiger-data.html (accessed on 15 October 2014).
  62. Csutora, M. One More Awareness Gap? The Behaviour–Impact Gap Problem. J. Consum. Policy 2012, 35, 145–163. [Google Scholar] [CrossRef]
  63. Shahan, Z. Tesla Model 3 Outsold BMW, Mercedes, Audi, & Lexus Competitors In 2nd Quarter In USA—By A Landslide! CleanTechnica. 10 August 2019. Available online: https://cleantechnica.com/2019/08/10/tesla-model-3-outsold-bmw-mercedes-audi-lexus-competitors-in-2nd-quarter-in-usa-by-a-landslide/ (accessed on 22 October 2021).
Figure 1. Population density New York State, 5-year average, 2011–2015 [51] (N = 1670).
Buildings 11 00631 g001
Figure 2. New York State project count per capita; zip code level (N = 1670).
Buildings 11 00631 g002
Figure 3. New York City and Long Island project count per capita; zip code level (N = 1670).
Buildings 11 00631 g003
Figure 4. NY State, free home energy audit per capita, 2011–2016; zip code level (N = 1670).
Buildings 11 00631 g004
Figure 5. New York State project costs ($US) per capita; zip code level (N = 1670).
Buildings 11 00631 g005
Figure 6. New York City and Long Island project costs ($US) per capita; zip code level (N = 1670).
Buildings 11 00631 g006
Figure 7. New York State projects per audit; zip code level (N = 1670).
Buildings 11 00631 g007
Figure 8. New York City and Long Island projects per audit; zip code level (N = 1670).
Buildings 11 00631 g008
Figure 9. Annual count of incentivized projects, New York State, 2011–2016 (N = 1670).
Buildings 11 00631 g009
Figure 10. Annual cost of incentivized projects, New York State, 2011–2016 (N = 1670).
Buildings 11 00631 g010
Table 1. Zip code level descriptive statistics, New York (N = 1670).
VariableMeanStandard
Deviation
MinimumMaximum
Square miles28.036.50.0453.4
Population11,58017,71617109,931
Median age42.67.31682
% BA degree or higher29.517.10100
Median income ($US)64,10026,91110,675216,250
% Non-Hispanic Whites80.923.80.6100
% Hispanic7.811.8074.5
% Black5.812.9089.4
% Asian3.26.7073.3
% Other race2.23.7090.1
Pop. density people/sq-ml565716,8940.43146,388
Median home value253,859219,16128,2001,718,800
Avg. household size2.60.41.25.1
% Renter-occupied units28.220.80100
Median age of structures57.013.614.080.0
% Limited English2.85.6053.6
Democrat affiliation35.815.59.6100
Republican affiliation33.713.4075.0
Democratic margin2.128.3−58.1100
% Undeclared affiliation22.54.9045.4
% Green affiliation0.290.2803.8
% Other8.02.6022.9
Installed solar kW/capita × 10,000404718012,846.6
Registered Elec cars/cap × 10,0008.713.30146.3
# of audits/capita0.00780.007900.075
Contractors/county pop × 10,0000.150.1200.49
# of projects/capita0.00290.005100.134
Cost of projects/capita ($US)26.835.20465.9
Projects/audit ratio0.3540.664020.3
Cost of projects/audit ratio ($US)3348.182783.72069,180.58
Table 2. Natural logarithm of audits per capita (per zip code) regressed on zip code characteristics (standardized coefficients) 1.
VariablesModel 1
Zip Code Characteristics 2
Model 2
Zip Code and Autocorrelation 2
(Constant)-- ***-- ***
Median age0.050 **0.024
% BA degree or higher0.189 ***0.102 ***
Median income0.001−0.030
Population density ppl/sq-ml−0.404 ***−0.263 ***
Average household size0.055 **0.027
Median home value−0.268 ***−0.062 **
% Renter-occupied unit−0.192 ***−0.160 ***
Median age of structures0.053 ***0.046 ***
% Non-Hispanic Whites0.0110.098 ***
Democratic margin−0.0390.015
% Undeclared affiliation0.043 **−0.031 *
% Green affiliation0.048 ***−0.007
% Other−0.067 ***0.010
% Limited English−0.108 ***−0.045 **
Contractors/County Pop0.118 ***0.106 ***
Total installed solar kW/cap0.079 ***0.098 ***
Total adopted 2017 EV/cap0.104 ***0.009
Lambda 0.757 ***
R20.6670.817
Akaike info criterion2939.42189.9
Moran’s I0.444 ***−0.084 ***
Number of Observations16701667
1 Source: [50,51,52,53]. 2—indicates reference category, * p < 0.10, ** p < 0.05, *** p < 0.01.
Table 3. Natural logarithm of projects and project costs ($US) per capita per zip code in New York State regressed on zip code characteristics, audits per capita, and clean technologies (N = 1670; standardized coefficients) 1.
Count of Projects 2Cost of Projects 2
VariableModel 3
Base Model
Model 4
Spatial Auto-Correlation
Model 5
Base Model
Model 6
Spatial Auto-Correlation
(Constant)---- *----
Median age0.039 **0.039 **−0.026−0.017
% BA degree or higher0.0400.0020.0620.076 *
Median income0.105 ***0.065 **0.112 **0.094 **
Population density ppl/sq-ml−0.362 ***−0.303 ***−0.314 ***−0.279 ***
Average household size0.054 ***0.062 ***0.102 ***0.072 **
Median home value−0.183 ***−0.142 ***−0.121 ***−0.120 ***
% Renter-occupied unit0.046 *0.020−0.0160.000
Median age of structures0.053 ***0.040 ***0.058 **0.019 **
Audits/cap × 10,0000.381 ***0.339 ***0.355 ***0.334 ***
% Non-Hispanic Whites0.093 ***0.138 ***−0.193 ***−0.144 ***
Democratic margin0.0000.029−0.043−0.036
% Undeclared affiliation−0.026−0.0140.0390.054 *
% Green affiliation−0.029 **−0.026 **−0.017−0.017
% Other0.034 *0.035 *0.059 *0.048
% Limited English−0.148 ***−0.101 ***0.0310.053
Contractors/County Pop0.131 ***0.108 ***0.061 ***0.043
Total installed solar kW/cap0.0080.039 ***−0.030−0.041 *
Total adopted 2017 EV/cap0.042 ***0.0160.006−0.011
Lambda 0.523 *** 0.318 ***
R20.7350.7850.3200.361
Akaike info criterion2561.52311.64133.24061.9
Moran’s I0.258 ***−0.036 **0.129 ***−0.018 *
Number of Observations1670166716701667
1 Source: [50,51,52,53,61]. 2—indicates reference category, * p < 0.10, ** p < 0.05, *** p < 0.01.
Table 4. Natural logarithm of projects and project costs per audit (per zip code) regressed on zip code characteristics, audits per capita, and clean technologies (N = 1670; standardized coefficients) 1.
VariableCount of Projects per Audit 2Cost of Projects per Audit 2
Model 7
Base Model
Model 8
Spatial Auto-Correlation
Model 9
Base Model
Model 10
Spatial Auto-Correlation
(Constant)--------
Median age−0.091 ***−0.084 **−0.061 *−0.056
% BA degree or higher0.0730.0690.076 *0.093 **
Median income0.0390.0160.0770.062
Pop. density ppl/sq-ml−0.165 ***−0.144 ***−0.201 ***−0.179 ***
Ave. household size0.0350.0260.089 **0.057
Median home value−0.090 *−0.104 **−0.074−0.079
% Renter-occupied unit0.002−0.009−0.056−0.038
Median age of structures0.017−0.0010.063**0.028
Audits/cap × 10,0000.066 **0.060 **0.230 ***0.221 ***
% Non-Hispanic Whites−0.0020.013−0.219 ***−0.188 ***
Democratic margin0.102 **0.110 **−0.014−0.017
% Undeclared affiliation−0.076 ***−0.0460.0140.030
% Green affiliation−0.073 ***−0.058 **−0.024−0.025
% Other0.085 **0.0610.087 **0.066 *
% Limited English0.0340.0500.100 ***0.109 ***
Contractors/County Pop0.150 ***0.117 ***0.0380.020
Total installed solar kW/cap−0.081 ***−0.064 **−0.045 *−0.058 **
Total adopted 2017 EV/cap−0.002−0.008−0.008−0.020
Lambda 0.310 *** 0.276 ***
R20.0840.1440.1410.180
Akaike info criterion4629.34549.64523.24471.1
Moran’s I0.148 ***−0.0080.110 ***−0.013
Number of Observations1670166716701667
1 Source: [50,51,52,53,61]. 2—indicates reference category, * p < 0.10, ** p < 0.05, *** p < 0.01.
Publisher’s Note: MDPI stays neutral with regard to jurisdictional claims in published maps and institutional affiliations.

