Article

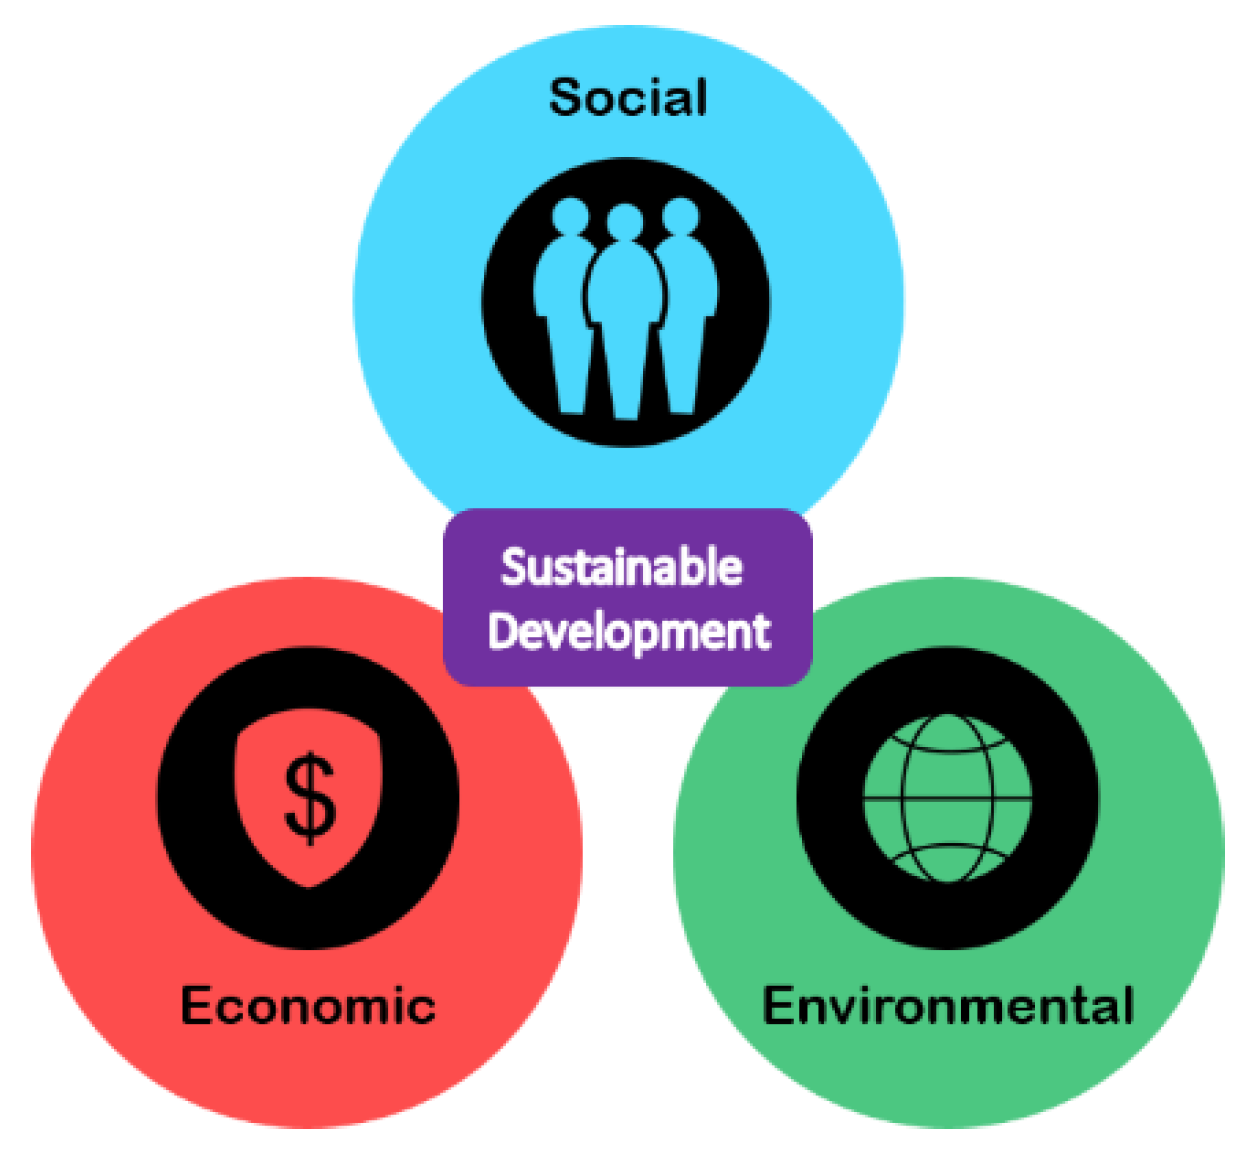
Sustainability Identification of Steel and Concrete Construction Frames with Respect to Triple Bottom Line

by
Amir Oladazimi
1,
Saeed Mansour
1,*,
Seyed Abbas Hosseinijou
2 and
Mohammad H. Majdfaghihi
3
1
Department of Industrial Engineering and Management Systems, Amirkabir University of Technology, Tehran 15916-34311, Iran
2
Department of Industrial Engineering, Faculty of Engineering, Golestan University, Gorgan 49138-15759, Iran
3
Department of Industrial and Entrepreneurial Engineering and Engineering Management, Western Michigan University, Kalamazoo, MI 49008, USA
*
Author to whom correspondence should be addressed.
Buildings 2021, 11(11), 565; https://doi.org/10.3390/buildings11110565
Submission received: 26 September 2021 / Revised: 17 November 2021 / Accepted: 18 November 2021 / Published: 22 November 2021
(This article belongs to the Section Construction Management, and Computers & Digitization)

Abstract

:
As one of the most prominent industries in developed and developing countries, the construction industry has had substantial impacts on different aspects of the environment, society, and economy. In recent years, sustainable construction has been introduced as an approach to evaluate the various construction phases based on environmental, economic, and social dimensions, also known as the triple bottom line (TBL). To conduct a sustainability analysis of the buildings in Tehran, the capital city of Iran, two conventional construction frames were selected, namely steel frame and concrete frame. In this research, three conventional approaches for the evaluation of the TBL, namely the life cycle assessment (LCA), life cycle cost (LCC), and social life cycle assessment (SLCA), were, respectively, used for the study of environmental, economic, and social impacts. The main results of the study are summarized as the following: Overall, based on the LCA results, the concrete frame led to almost 38% more environmental pollution than steel frame. In terms of the total prices of the buildings, considering their LCC and with respect to the present value (PV) method, the steel frame was almost 152,000 USD more expensive than the concrete frame. The quantified results of the social dimension by the SLCA method showed that concrete and steel buildings had a score of 0.199 and 0.189, respectively, which indicates that concrete had a slightly better social performance based on expert opinions. A multi-criteria assessment and sensitivity analysis of the results were conducted by a graphical tool, namely the mixing triangle, and showed that the overall preference of each alternative depends mainly on the importance weights given to each aspect of the assessment. However, one of the main findings of the research was that overall, giving a high importance weight to environmental dimension leads to sustainability preference of steel over concrete frame, while giving high importance weights to economic or social dimensions leads to sustainability preference of concrete over steel frame. Findings of the study are beneficial to decision-makers in the construction industry since they can decide on the best alternative among concrete and steel frames based on their strategies.

1. Introduction

The concept of sustainability—namely environmental, economic, and social dimensions—is among the key subjects in many industries. The life cycle sustainability assessment (LCSA) is defined as a method that combines the life cycle assessment (LCA), life cycle costs (LCC), and the social life cycle assessment (SLCA) [1]. Meanwhile, the building industry can be considered one of the most prominent in sustainable development since it can have an indispensable influence on each dimension of sustainability known as the Triple Bottom Line (TBL). Concerning environmental pollution, there are substantial studies discussing environmental degradations of the building industry. According to a UNEP [2] report, different stages during the life cycle of buildings and their long-term life span will affect greenhouse gases (GHG) emissions. Furthermore, buildings are responsible for almost one-third of such emissions and more than 40% of energy consumption worldwide. Moreover, it is estimated that the two phases of construction and end-of-life (EOL) of buildings account for 40% of a country’s waste. This rate would be equivalent to almost 123 million tonnes in the United States per annum [3]. Mavrokapnidis et al. [4] stated that buildings consume approximately 30 to 40% of energy globally and produce 40 to 50% of GHG emissions. However, as far as sustainability is concerned, the two other indexes, economic and social, are as important as environmental dimensions. Several studies have focused on either economic or social aspects of the construction industry. Balasbaneh et al. [5] selected wall and roofing materials from Malaysian residential houses using LCA and LCC methods to indicate their impacts on economy and environment. Val and Stewart [6] have used the LCC method to justify the use of stainless steel in reinforced concrete structures due to its corrosion-resistance feature. In their study, Lu et al. [7] have calculated environmental pollution and the cost of the materials used in multi-storey Australian apartments for five alternatives. Furthermore, the social dimension was discussed in numerous studies. However, most of such studies were conducted in areas other than the building industry. Hosseinijou et al. [8] employed the S-LCA method to compare social indicators of building materials in their comprehensive research on the social dimension. Although sustainability in buildings is defined as creating a balance between environmental, economic, and social aspects while running building projects, not many studies have done so [9]. Cabeza et al. [10] conducted a literature review in which most studies related to the building sector and building materials were collected and evaluated. In the majority of the research, only environmental issues were examined, and the two other aspects were almost neglected. However, a limited number of studies focused on either economic or social dimensions or their combination with the environmental aspect. Hence, most scholars in the field have paid less attention to the central concept of sustainability.
Table 1 shows various relevant studies in the building industry and their coverage of different aspects of sustainability. The most relevant studies to this research are the works by Reza et al. [11], Akadiri et al. [12], and Balasbaneh et al. [13]. Reza et al. [11] evaluated the sustainability of building elements with respect to TBL. An analytic hierarchy process (AHP) based life cycle analysis was implemented for a pair-wise comparison of concrete, clay, and polystyrene blocks as three alternative flooring systems. Final results in this study were shown on a ternary plot to facilitate the comparison between alternatives. In a similar study, Akadiri et al. [12] evaluated sustainable roofing options, using a fuzzy extended analytical hierarchy process (FEAHP) method to prioritize and assign weighting for six criteria of TBL. The most comprehensive study that is similar to the current study is the research by Balasbaneh et al. [13], where they considered all three sustainability dimensions for the assessment of building structures which indicated the impact of five different hybrid timber constructions on TBL. However, there are important differences between these two studies. First, as far as the LCA concerns, the study of Balasbaneh et al. [11] involves an assessment of five categories whereas the first stage of this study involves an assessment of all environmental categories in a standard LCA (eleven impact categories). Second, as for the SLCA, Balasbaneh et al. [13] performed an SLCA with two social impact categories. The main goal of the SLCA in their research was to analyze the stakeholder toward the contribution to economic development for the number of jobs created and their related amount of wage. In this research five social impact categories were included in the social assessment, namely “health and safety”, “fair salary”, ”local employment”, “local community acceptance”, and “extraction of material resources”. Hence, this research covers a broader range of social indicators than the research by Balasbaneh et al. [13]. Moreover, no quantitative method for SLCA was presented in Balasbaneh et al. [13] but in this study, a quantitative multi-criteria decision making (MCDM) method called Best Worst Method (BWM) is presented for the SLCA. Finally, Balasbaneh et al. [13] solely looked at each aspect of the TBL individually and failed to integrate them into the sustainability scores. In this research, a quantitative MCDM approach called mixing triangle is used to combine the environmental, economic, and social results into a sustainability score.
The main objective of this research is the sustainability comparison of steel and concrete construction frames. Overall, by reviewing the literature, it could be claimed that most scholars have not considered TBL for evaluating construction frames and, particularly in Iran, there is no research similar to this study. Although several studies aimed to compare such construction frames with respect to the environmental issues [3,6,14,15,35,36], the two other dimensions, i.e., economic and environmental, were almost neglected in many cases; therefore, our purpose is to fill this gap. The environmental issues of these two building frames have already been evaluated thoroughly in our previous study [37] using the LCA method and the results were shown in various impact factors. Hence, we have referred to the final results of our previous study for sensitivity analysis determinations. For the remaining two TBL indicators, LCC and SLCA methods were implemented step by step based on the standard guidelines [38,39] as the two most conventional approaches for social and economic assessments. Finally, to combine the environmental, economic, and social results, an MCDM approach called the mixing triangle was presented to assist stakeholders and architects in selecting sustainable building frames. Figure 1 shows the concept of the sustainable development based on the Elkington’s [40] definition.

2. Methodology and Case Study

2.1. Introducing Case Study

The case study of this research is same as the research presented in the previous work of the authors [37]. In fact, this research is a rational continuation of the previous study where only the environmental aspect of sustainability was assessed for the two construction frames. A detailed introduction of the two cases was provided in the previous paper [37] and included detailed plans, a bill of materials, and other necessary data for the LCA. Hence, authors recommend readers to refer to that paper in order to obtain complete information about the two studied cases. The methodology applied in this research is presented and necessary data for economic and social dimensions are provided. Furthermore, key results in three aspects, environmental, economic, and social, are discussed.
For the environmental evaluation of the two construction frames, the LCA method was conducted based on the framework presented by ISO 14040 and ISO 14044 [41], and a complete comparison between the frames was performed. Furthermore, the LCC method was selected for the economic assessment according to the fundamental processes of LCC in [42]. For social assessments, the S-LCA technique was considered based on the UNEP/SETAC [39] guidelines.

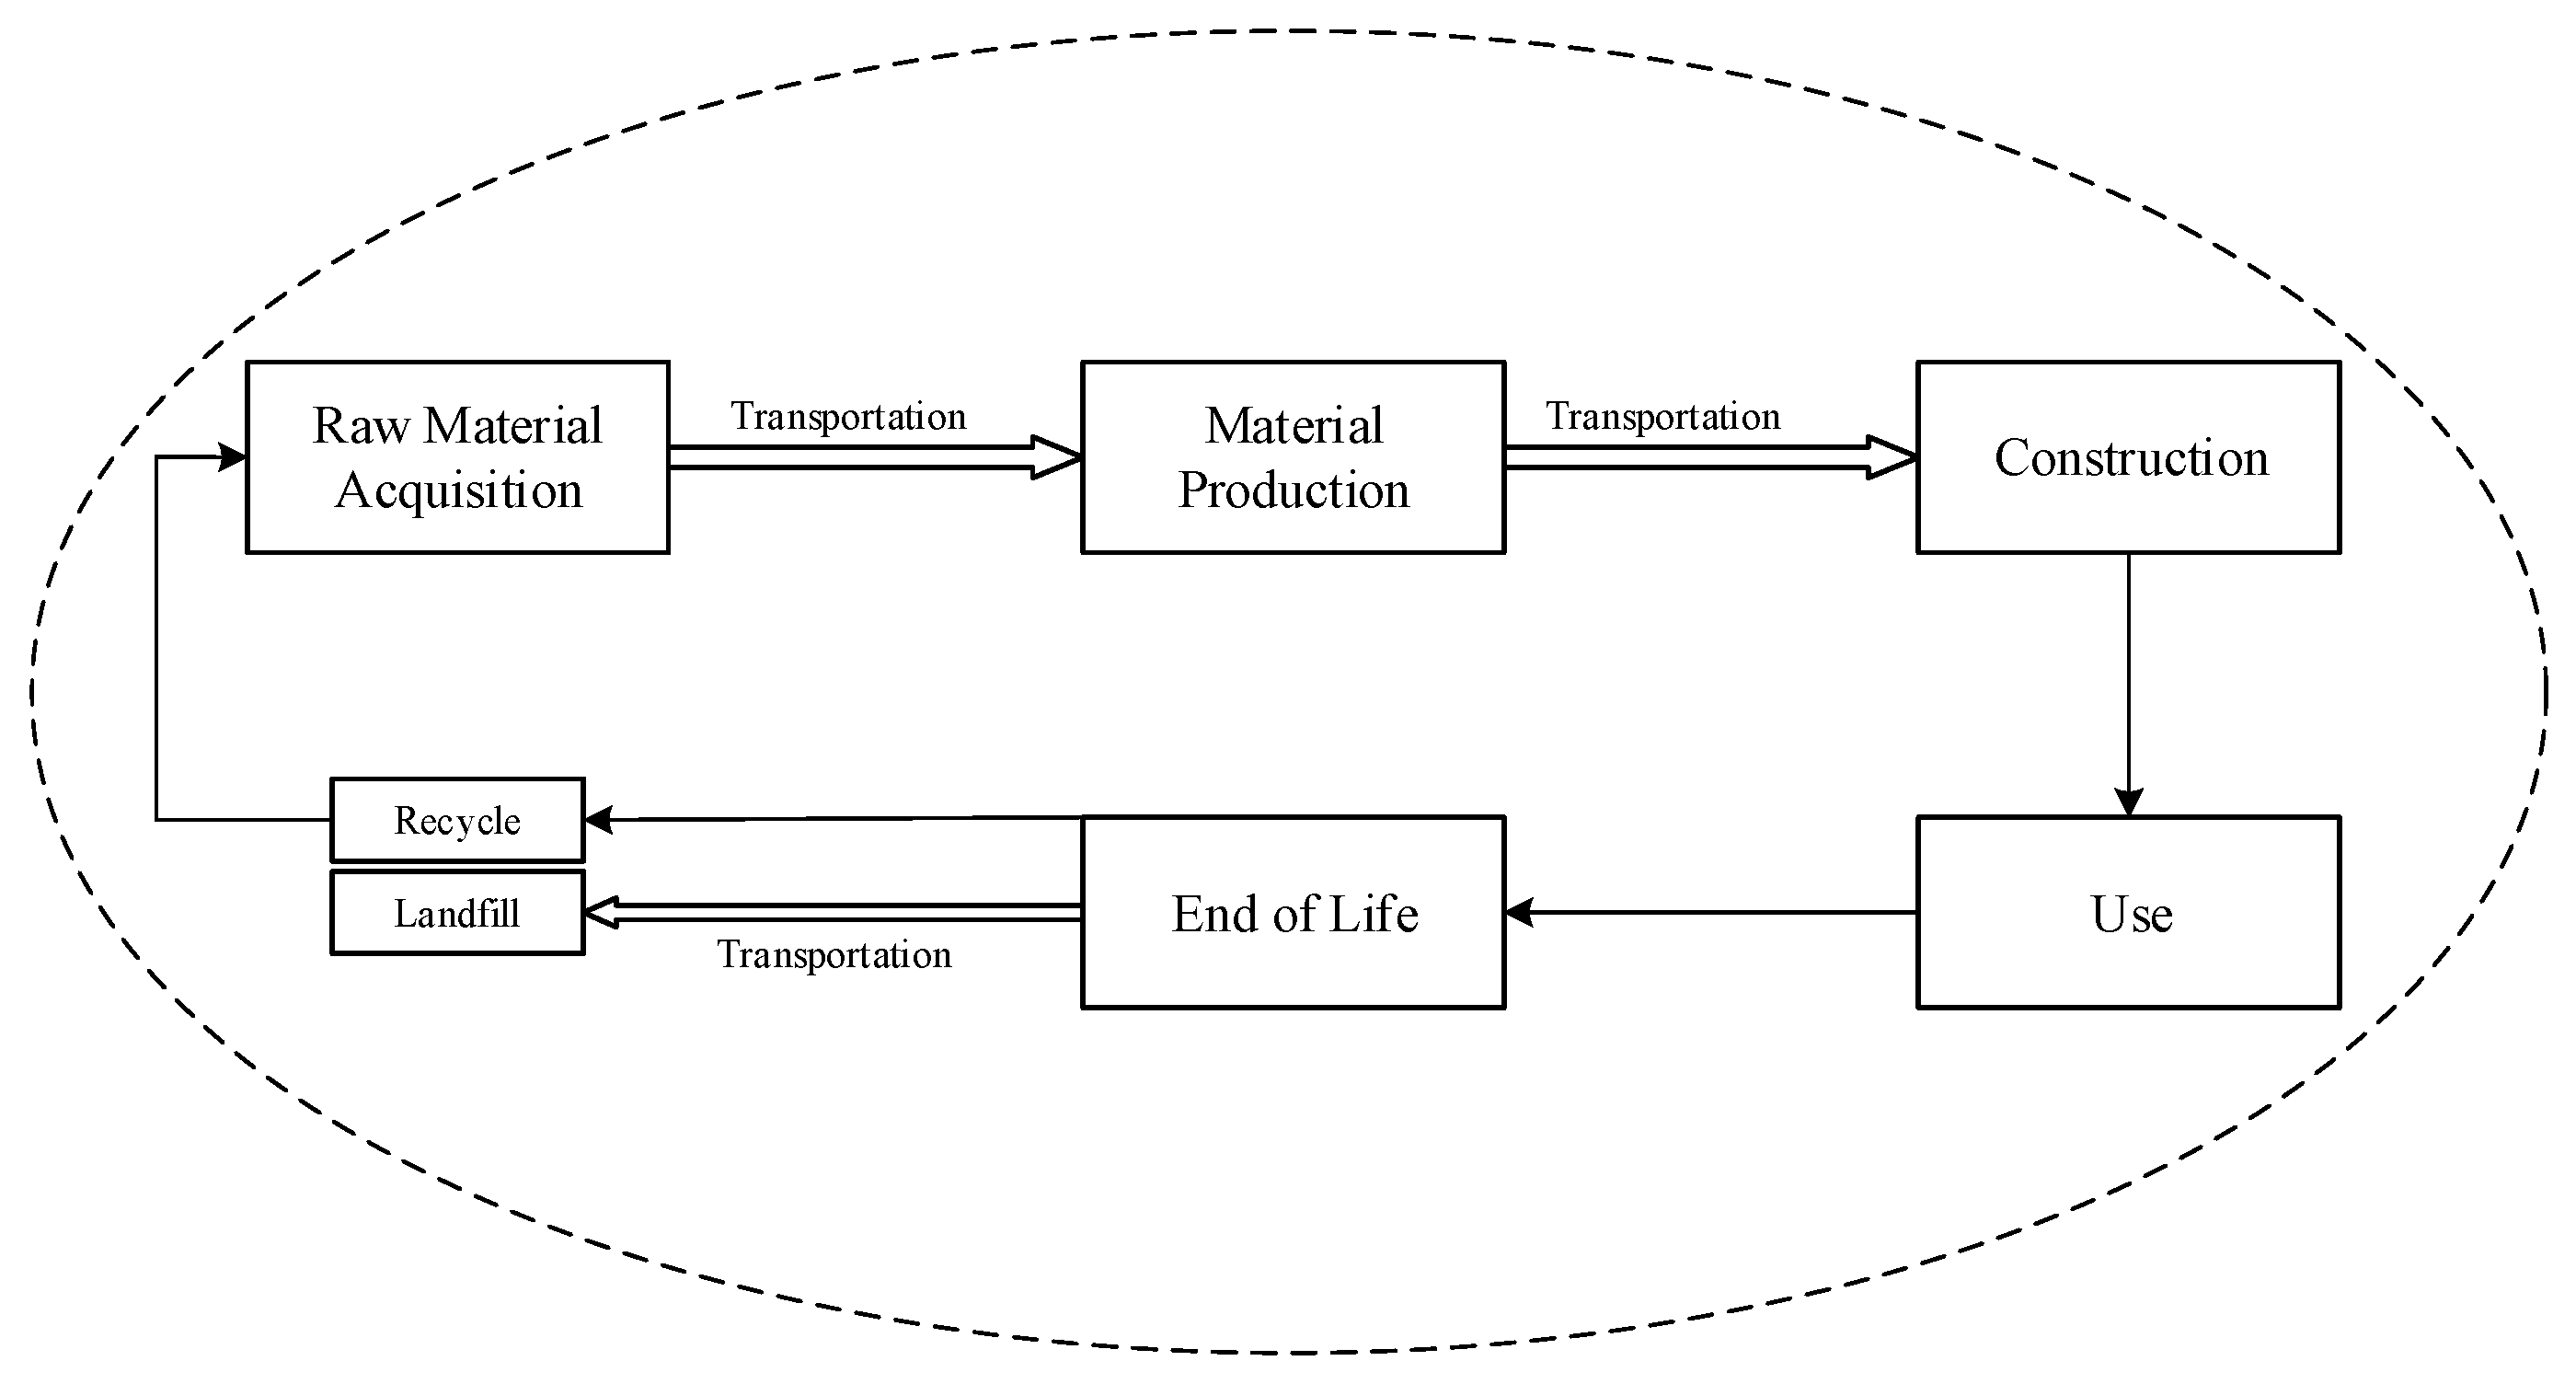
2.2. Life Cycle Assessment (LCA)

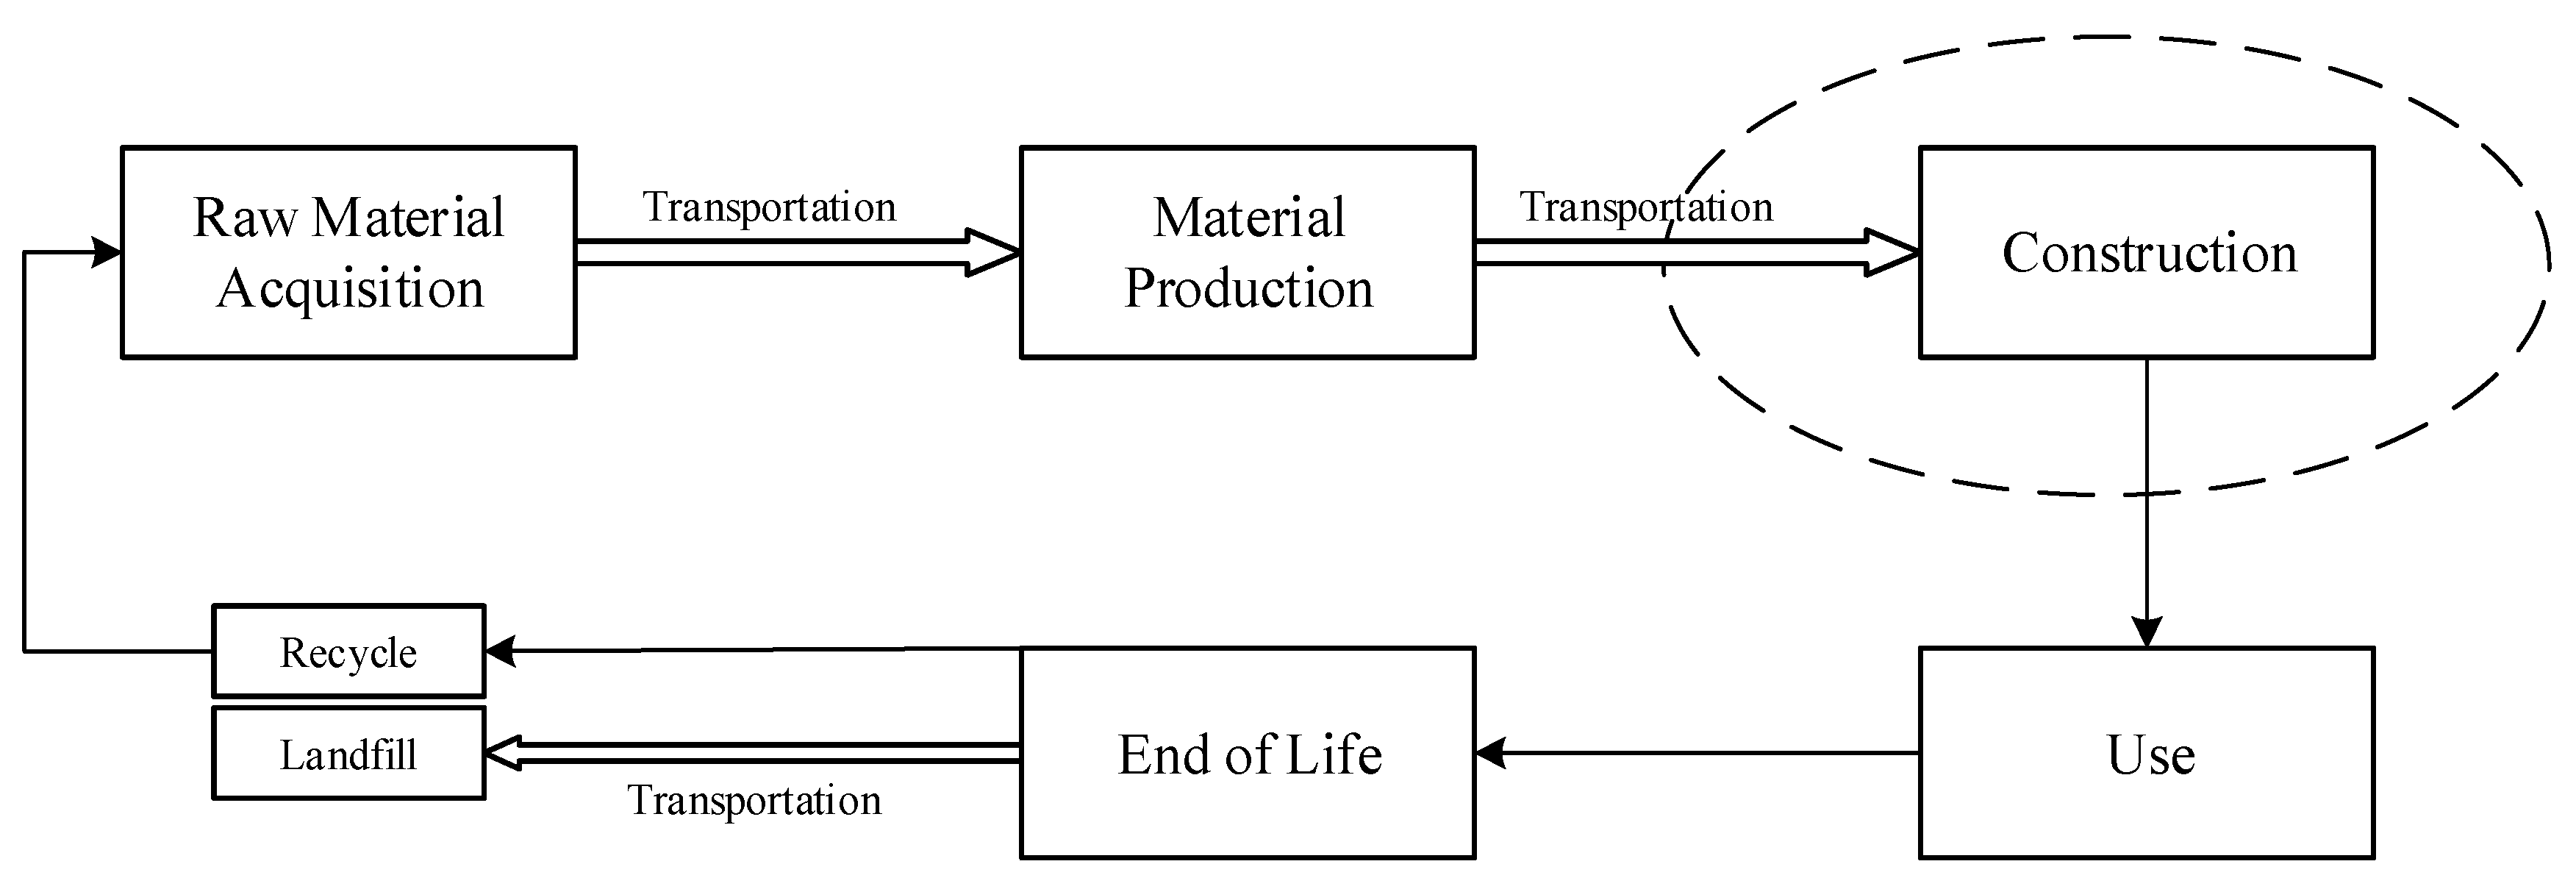
2.2.1. Goal and Scope Definition

In this phase, the primary objective is to calculate the environmental pollution of the two investigated construction frames. The concrete and steel buildings are two multi-storey residential buildings with similar heights and a floor area of approximately 4900 square meters in the northern part of Tehran, the capital city of Iran. The functional unit is defined as the total materials used in the aforementioned construction frames throughout their 50-year life span.

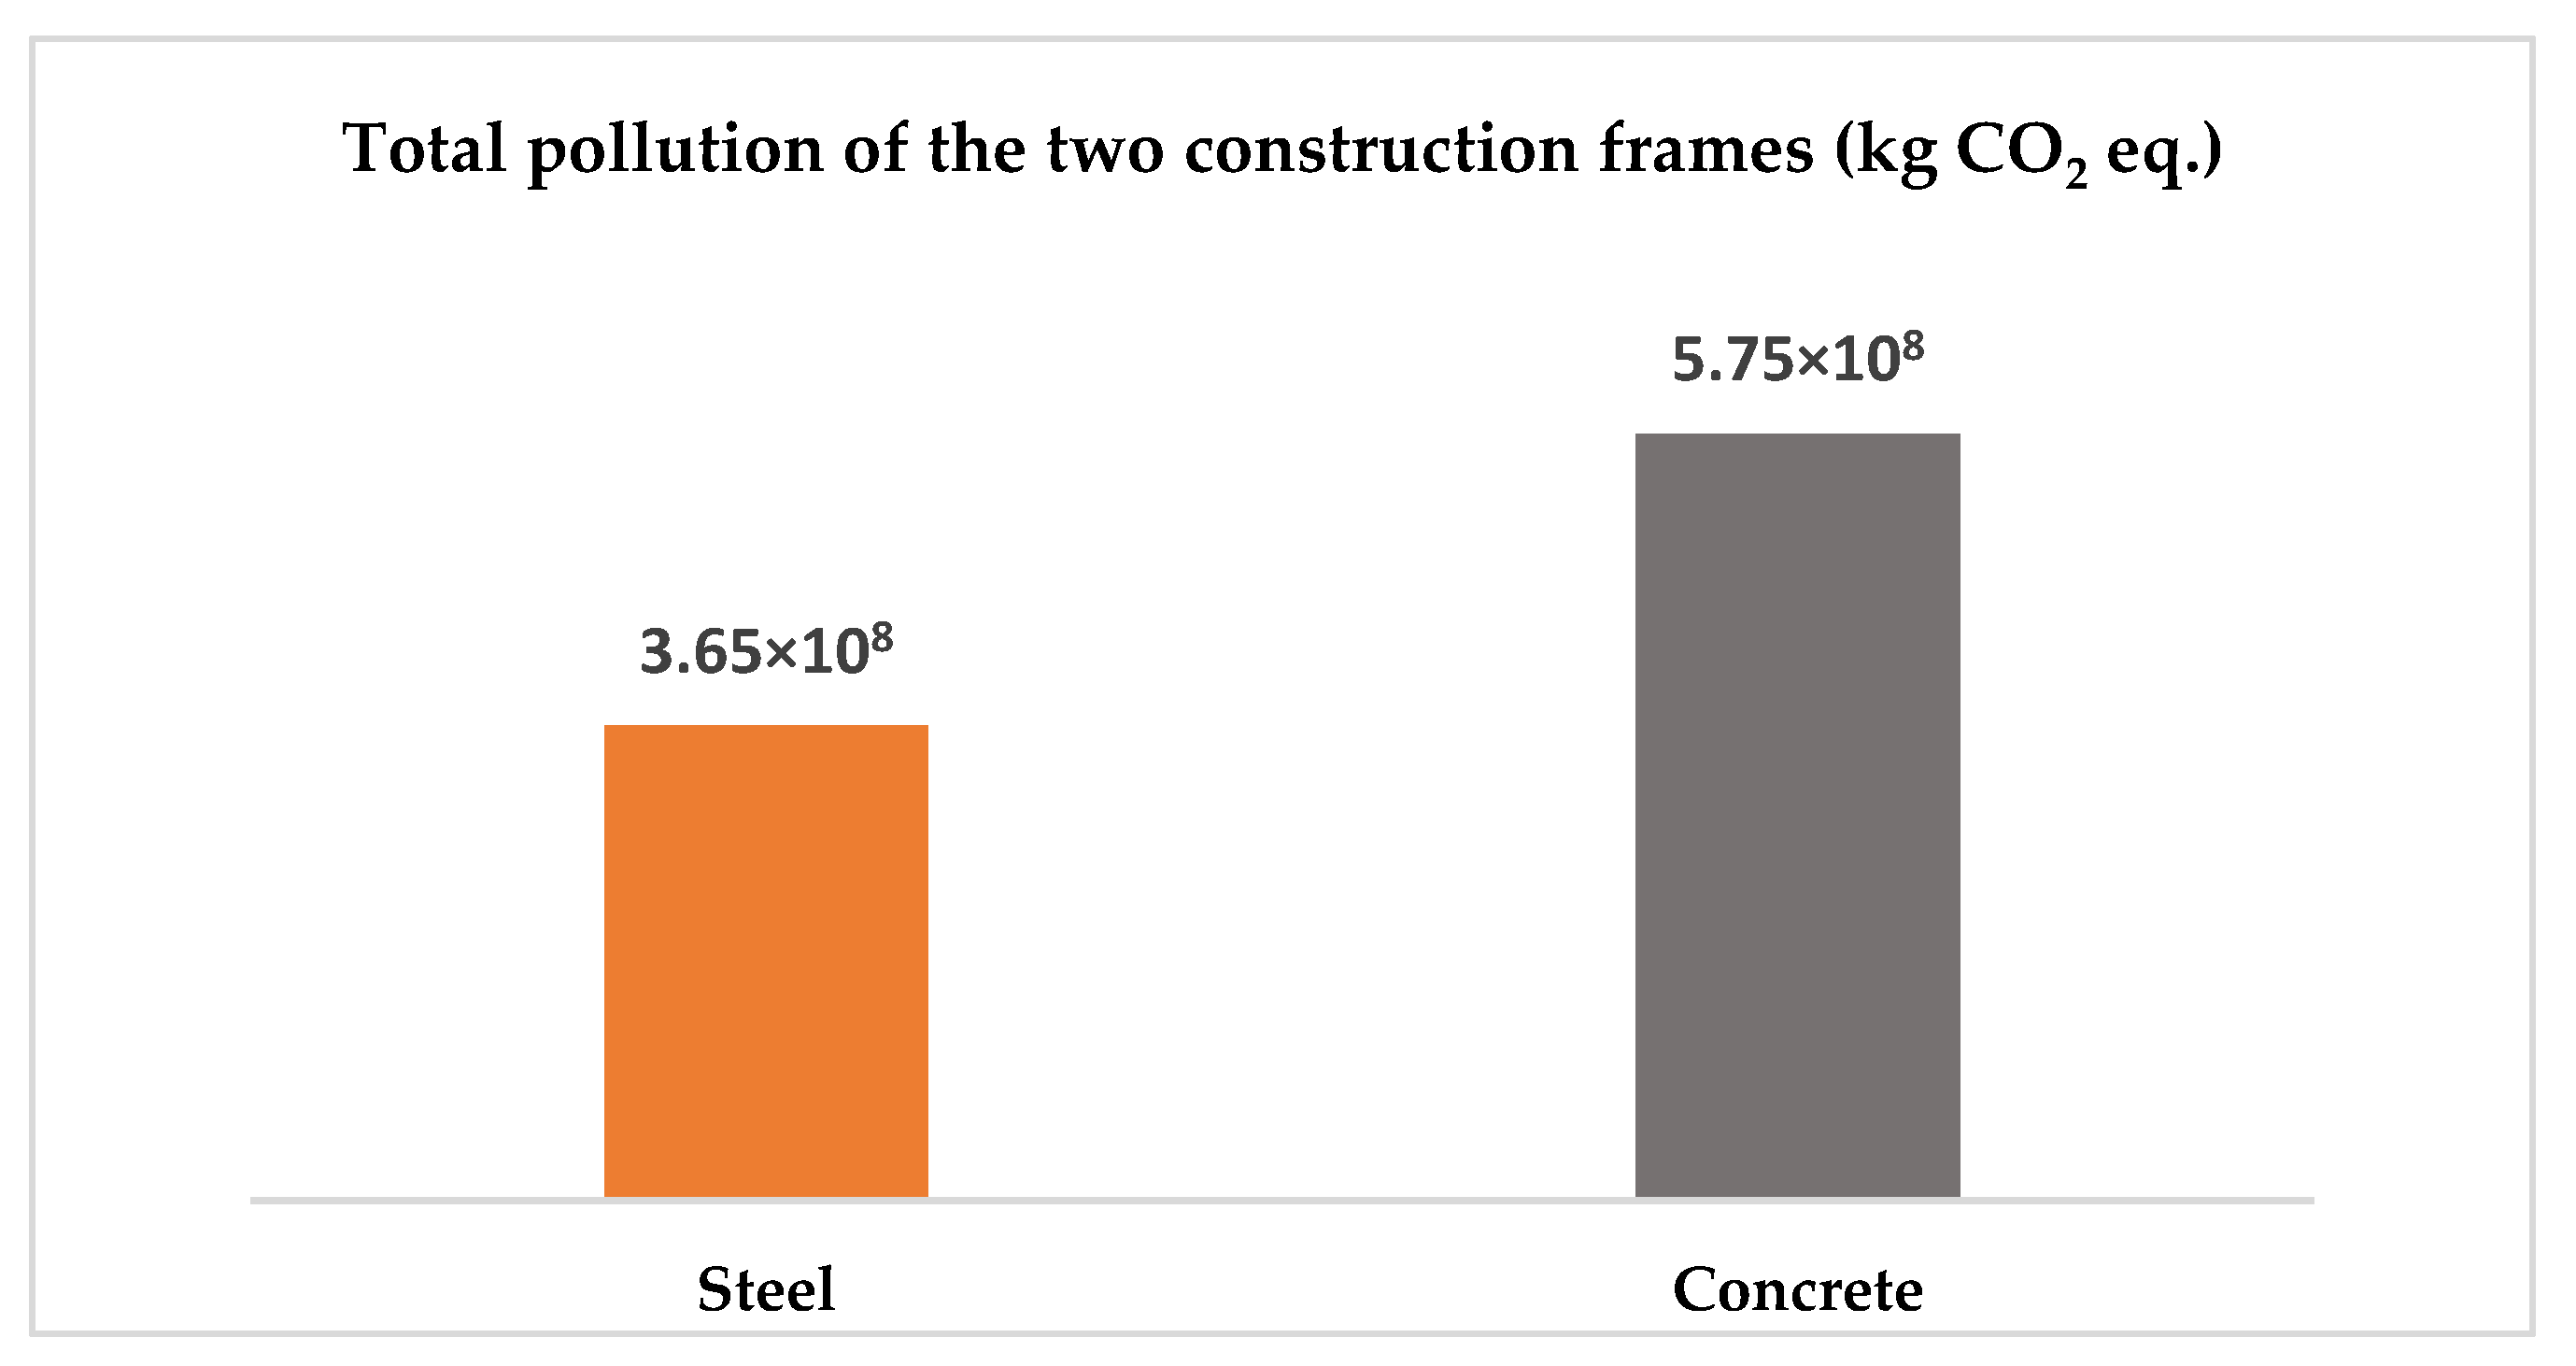
2.2.2. Results of Life Cycle Impacts

The demand for environmental assessment tools/software has increased noticeably during the past 20 years. Previously, most LCA based projects used to be conducted in spreadsheet models designed for calculating environmental pollution [23,43]. In recent years though, various environmental software packages have dominated the market and are currently popular among researchers. The best examples of such tools are GaBi, SimaPro, and OpenLCA, and it can be observed that GaBi and SimaPro are the most successful ones with the highest rate of market share globally [43]. Hence, we used GaBi for the environmental comparison of the two building frames. All the information regarding the LCA of the two construction frames, such as the bill of materials, different life cycle stages, Life Cycle Inventory (LCI), Life Cycle Impact Assessment (LCIA), and total pollution in various categories were assessed in the previous study by the authors [37]. Therefore, detailed descriptions related to the environmental aspect have been avoided in this section. We solely demonstrated the key results needed for the multi-criteria assessment and sensitivity analysis and the final decision on choosing a sustainable alternative frame. Figure 2 depicts the total pollution of the two construction frames throughout their life cycles.

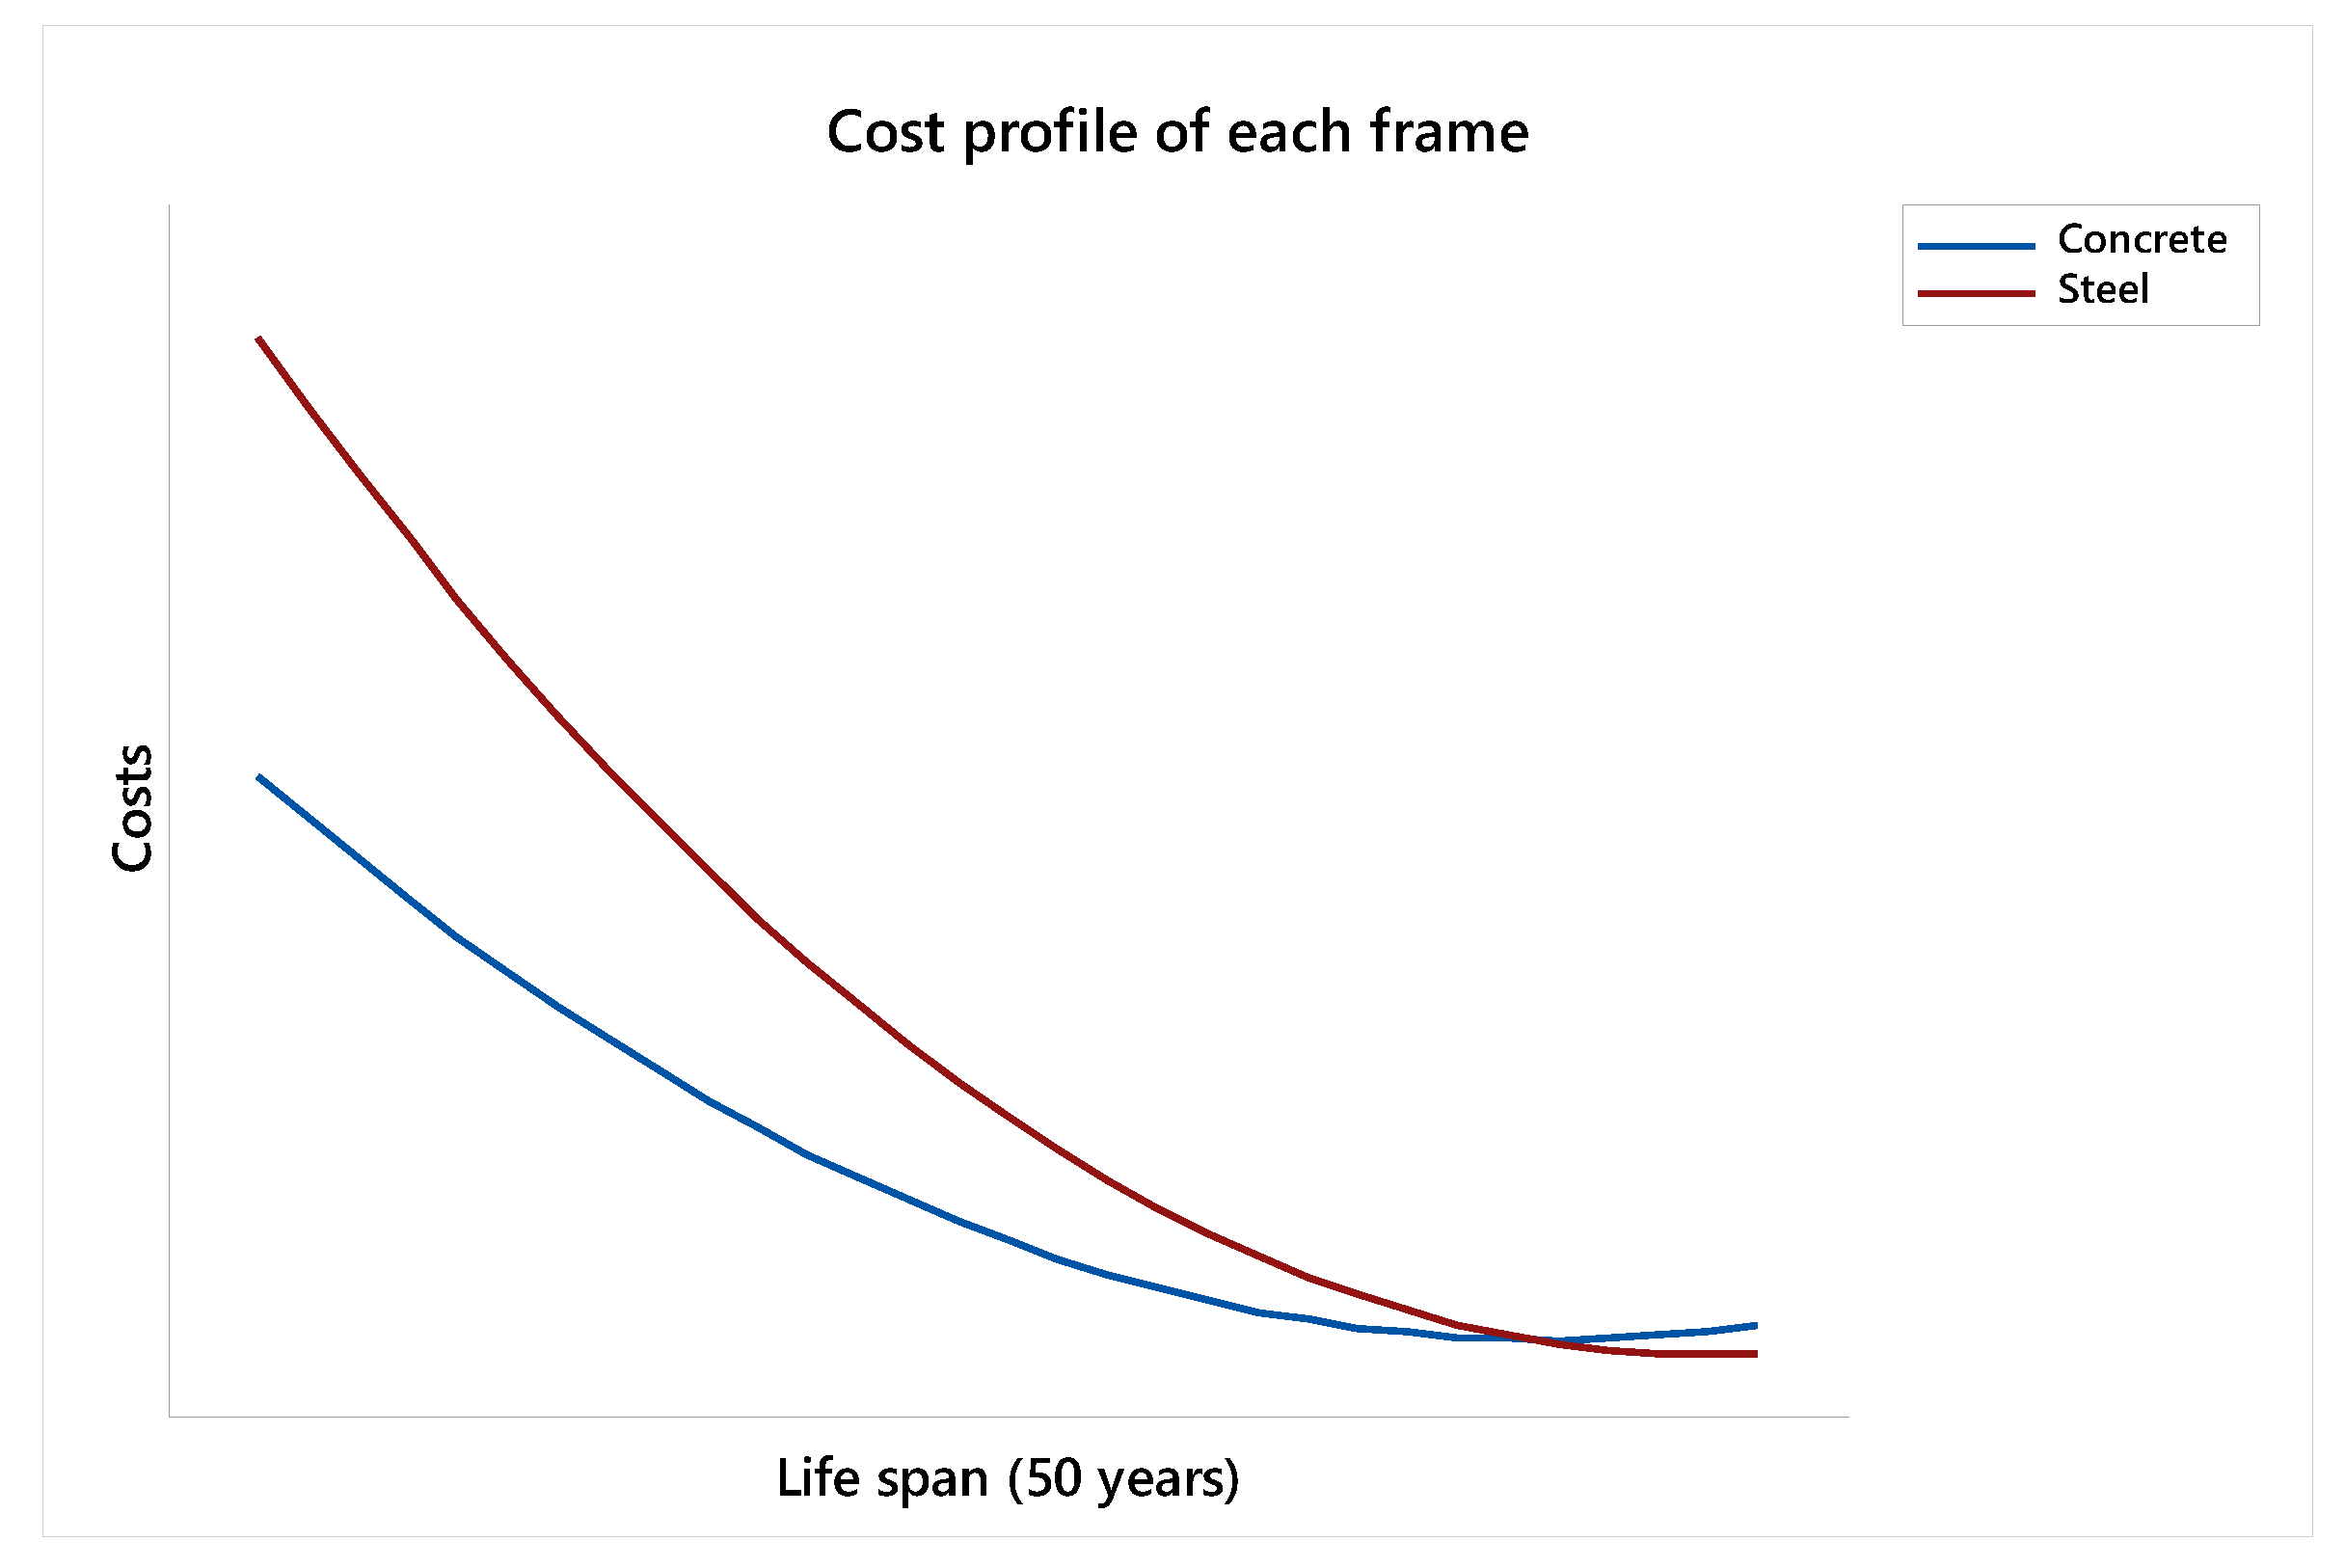
2.3. Life Cycle Cost (LCC) Analysis

According to the ISO 15686-5 [38] definition, “LCC is a valuable technique that is used for predicting and assessing the cost performance of constructed assets. Life-cycle costing is one form of analysis for determining whether a project meets the client’s performance requirements”. LCC presents a foundation for comparing initial investments with future costs over a particular period. To examine possible alternative strategies regarding the economic aspect, future costs are discounted back in time [44]. An indirect advantage of performing an LCC for a building could be the actual engagement in the analysis and activities such as data collection, future events estimation, and environmental aspects identification [45]. LCC comprises all the costs associated with the life cycles of the products. These costs are directly imposed by one or some of the components involved in the product life cycle. These components can include suppliers, constructors, consumers, and demolishers.
In some cases, indirect costs can be added to the LCC. Such costs could consist of those related to environmental damage imposed on the system in the future. So far, various regulations and manuals associated with LCC have been published. Kawauchi and Rausand [42], in their research, took advantage of several LCC studies and extracted some common LCC processes and eventually proposed a novel framework that is displayed in Figure 3.

2.3.1. Problem Definition

The first step in LCC is defining the scope and problems of the work. By identifying the scope, each phase related to the study is determined [42]. The goal of this section is to conduct a comparison between the costs associated with the two construction frames. Cost evaluation is always key in decision-making in this area. Similar to the environmental aspect, all the life cycle steps, cradle-to-grave, have been considered in the economic aspect. Therefore, costs related to raw material acquisition, transportation, material production, construction, demolition, reuse, and landfill have been discussed in this study. Figure 4 displays the scope of the economic aspect adapted in this research.

2.3.2. Cost Breakdown Analysis

Identifying all cost items or, in other terms, “cost elements” that noticeably impact the actual LCC of the system is essential [42]. It is recommended to determine cost elements regularly and to provide a summary of the costs during the LCC stages that make the cost comparisons more tangible. An international standard of the LCC (IEC 60300-3-3) recommends developing a Cost Breakdown Structure (CBS) to define the cost elements in the LCC analysis [42]. To determine each stage’s expense, the CBS is shown in Figure 5. Moreover, considering the steps and corresponding costs, the total costs’ net present value is calculated. Finally, each frame’s equivalent uniform annual cost is estimated in order to compare the two frames. The calculations are displayed in Table 2, which contains all the stages shown in the CBS.

2.3.3. System Modeling

Since the time value of money is not constant during the buildings’ life cycle, and all the expenses do not incur simultaneously, adding or subtracting these costs should not be implemented. The present equivalent of future costs, i.e., present value, can be considered the amount of money that needs to be invested now. In this case, the interest rate can be regarded as equal to the discount rate. The inflation rate could be added to make calculations more realistic [46]. For an LCC analysis, all future or present costs are converted into a uniform annual or present value. Therefore, all the costs related to the product’s life cycle stages, from the raw material acquisition to the end of life stage, will be transformed into the present and annual worth. Tax and interest rates are also considered in these calculations.
According to the task group 4 (TG4) report [47], an LCC is calculated as the present value of the summation of all future annual expenses during a building’s life span and displayed in Equation (1):
P V = t = 0 N C t ( 1 + r ) t
where:
  • Ct = The sum of total costs that occur in period t,
  • N = Number of periods under study,
  • r = discount rate (interest rate).

2.3.4. Data Collection

To predict the LCC more accurately, it is crucial to use accurate input data. Hence, collecting reliable data is necessary for an LCC analysis. However, if the actual information is not available, it is possible to estimate the non-available data [42]. In this paper, field research and official government resources were used to gather data for raw material acquisition, material production, and transportation. Furthermore, information on construction and demolishing costs were acquired through a meeting with the two buildings’ architecture.

2.3.5. Cost Estimates

In an LCC, it is essential to provide a prospective, which gives decision-makers and stakeholders a quick review of the costs of a project. Therefore, one of the main goals of LCC analysis is creating a cost profile that provides a summary of the various costs occurring throughout the life cycles of the products [42]. Figure 6 shows the cost profile of the two frames during their 50-year life span.
To achieve the cost profile, it is required to run the cost models using actual/estimated input data. It is possible to do the calculations manually or with relevant existing tools [42]. In this study, considering the costs of different life cycle stages shown in Figure 5; the net present value (NPV) and equivalent annual cost (EAC) were calculated using Excel spreadsheets for each stage and for the entire life cycle in order to enable readers to compare the LCC of the two frames. (All costs were converted to the US dollar based on the exchange rates when the buildings were constructed)

2.3.6. Evaluation

During the life spans of the investigated cases, repair and maintenance costs were not included since it is impossible to access construction frames after building a structure. In addition, all demolition costs were calculated post life span. Based on the results in Table 2, the concrete frame had better performance in this dimension, which seems reasonable due to the low price of the concrete’s raw materials in Iran. Many stakeholders and architects prefer to choose a concrete frame since it is more economical even though it has worse performance in resource depletion and environmental aspects. Outputs show that concrete frame’s initial costs are roughly 42% lower than its steel counterpart. The main reason for the difference in initial costs of the buildings could be due to raw materials such as Portland cement, which is much cheaper than steel components.
Regarding transportation, most of the raw materials for the concrete are produced in factories near Tehran. After meeting with the architect of the two frames and calculating the costs of different construction stages, it was concluded that constructing the steel frame is nearly twice as expensive as the concrete frame as shown in Table 2, with 11.2 and 5.8 thousand USD equivalent annual costs for the steel and concrete buildings, respectively. However, despite the previous stages, the concrete frame faced more expenses at the EOL stage. Reusing steel scraps after demolition results in a considerable decrease in costs at the EOL stage of the steel frame. Moreover, since there will be less concrete waste after the demolition of the steel frame, the waste transportation costs to specific places for landfills would be reduced. Hence, the EOL costs for the concrete frame is almost 56% higher than the steel frame. All in all, considering Table 2, the present value of the steel and concrete buildings are 380,000 and 228,000 USD, respectively. This 152,000 USD difference between the PVLCC of the two buildings was relatively considerable three years ago when the two buildings were constructed (due to the high inflation rate in Iran). Consequently, most conventional residential buildings in Tehran are built on concrete frame, as that has more economical benefits for builders.

2.4. Social Life Cycle Assessment (S-LCA)

The SLCA can be described as a method or procedure that leads to evaluating the social impacts of some steps of the product’s life cycle. Ignoring minor differences, the SLCA takes a similar approach to the environmental life cycle assessment (ELCA) in the majority of the research conducted in this area [48]. According to the guideline developed by the United Nations Environment Program/Society of Environmental Toxicology and Chemistry (UNEP/SETAC) [39], issues such as goal and scope definition, inventory analysis, impact assessment, and interpretation are included in the SLCA.

2.4.1. Goal, Scope, and System Boundary

This section’s main objective is primarily to identify some categories and sub-categories presented by UNEP/SETAC [39], which are most compatible with the country’s situation and eventually conduct a social assessment through face-to-face interviews with some experts in the field. Since a life cycle can be boundless, we will need to identify borders for our evaluation to have a more precise assessment [48]. There are two different approaches in this regard. Firstly, Méthot [49] and Dreyer et al. [50] conducted a method that only focuses on the parts of the life cycle that can be directly affected by the company performing the evaluation. Therefore, the company and its leading suppliers and distributors are evaluated. The second approach is to study the whole life cycle. However, it ignores the processes that do not significantly impact the study’s final results [48].
Contrary to the economic aspect where all the life cycle stages were discussed, the system boundary for the SLCA is gate-to-gate, and only the construction stage is considered. This decision was made since the interview was conducted by evaluating expert judgments, and not all the life cycle stages were assessable by experts. Hence, we have decided to provide a survey that simply evaluates the social factors in the most effective way. Figure 7 displays the scope and system boundary.

2.4.2. Inventory Analysis

In the first step, based on the frameworks presented in [8,39], general data was collected from the relevant national database, called the social hotspot database. Next, major factors such as life cycle, primary stakeholders, and main impact factors are identified by interviewing experts. The social hotspots are unit processes based on the potential risk or opportunity that they can cause [51]. After identifying major factors that were identified based on the functional unit, systems that are influential to the life cycle are evaluated and detailed data is collected.
Data collection Creating material flow analysis (MFA) of the two products is a major step to hotspot assessment. Given the life cycles of the steel and concrete, there is no complicit data for each stage in Iran. Moreover, most data associated with the material production and construction of the two products is out of date. In [8], the authors gathered comprehensive data for each stage of the life cycle of the products based on the existing information available at that time and some speculations which resulted in a reliable MFA of steel and concrete in Iran. Based on their presented MFA, four stages of the raw material acquisition, material production, construction, and EOL are the main stages for social hotspot analysis.
Expert interview A meeting was held with experts to have their opinions on the social factors of the two frames. We looked at the nature of our study as well as explored the most important social indicators regarding the norms of the country. As a result of field research and expert opinions, five impact factors were selected based on the agenda represented by UNEP/SETAC [39], including health and safety, fair salary, local employment, local community acceptance, and material resources extraction. The impact factors selected in this study are among the most practical ones and are useful because of Iran’s circumstances and its construction conventions and standards. In addition, these factors are sensible and measurable by experts. Among the four life cycle stages of the steel and concrete that were selected as the most significant based on the MFA presented by Hosseinijou et al. [8], only the construction phase has been used in this study for the social assessment. When it comes to social comparison of the building frames considering the five impact factors, it is crucial to have enough information in each life cycle stage to be able to compare the social aspect. There is not enough quantitative and qualitative data in Iran for operations such as raw material acquisition, material production, and the EOL of the selected materials to enable us to conduct a social assessment with respect to those stages. Therefore, since experts were considered the decision makers in this section of the research, the construction phase was chosen as the only stage for the social evaluation of the two building frames since the five impact factors could be more assessable throughout this stage.

2.4.3. Impact Assessment

The BWM and AHP were assumed as the popular methods among all the proposed methods implemented to assess the social dimension. Hosseinijou et al. [8] used AHP and the pairwise comparison matrix in their study to rank social measures in construction materials, namely steel and concrete frames. There are also other examples of such methods in the social assessment of the building materials [11,12,13]. In this study, however, BWM is used to assess the social impacts of each frame. Ahmadi et al. [52] applied this method to study the social aspects of their research. In this section, evaluating the social implications of these two frames was conducted by selecting and interviewing five civil engineers and five builders in Tehran. The affiliations of the experts are shown in Table 3.

Best Worst Method

Since the BWM is one of the deviations of MCDM, and because social sustainability consists of different factors, MCDM can be useful for the SLCA. It is preferred to a pairwise comparison matrix because it is not dependent on the pairwise comparison, and the results from the BWM are more reliable than other MCDM methods [51]. The BWM is used in various studies and was first presented by Rezaie [53]. He developed a framework for this method and predicted the highest level of satisfaction for suppliers.
The BWM framework includes the following steps:
  • Step 1: Selecting the decision criteria. In this step, a set of factors {c1, c2, c3,....., cn} is determined to be considered in decision making.
  • Step 2: The decision makers select the best/most significant and the worst/least significant criteria in this step.
  • Step 3: To select the best criteria and its preference over other factors, decision makers must assign a number between 1 and 9 to each measure. This step’s results are called Best-to-Others and are shown as AB = (aB1, aB2,...., aBn), where aBj shows the preference of the best criterion B over criterion j, and it could be concluded that aBB = 1.
  • Step 4: In this step, the worst criteria should be selected, and the preference of other factors over the worst criteria needs to be determined. Similar to step 3, assigning numbers between 1 and 9 should also be used in this step. The results in this step are called Others-to-Worst and shown as Aw = (a1w, a2w,....., anw)T, where ajw shows the preference of the criterion j over the worst criterion w, and it is evident that aww = 1.
  • Step 5: The optimal weights (w1*, w2*, w3*,....., wn*) should be calculated. The weight is optimal where for each pair of wB/wj and wj/ww, we have wB/wj = aBj and wj/ww = ajw. Therefore, to reach optimality, we need to minimize the maximum absolute differences of {|wB − aBjwj|, |wj − ajwww|}, which can be formulated as follows:
min maxj {|wB − aBjwj|, |wj − ajwww|}
Subject to
j w j = 1
w j 0 ,   for   all   j
where Equation (2) could be solved as the below linear programming problem:
min ξL
Subject to
|wB − aBjwj| ≤ ξL, for all j
|wj − ajwww| ≤ ξL, for all j
j w j = 1
wj ≥ 0 for all j.
After solving Equation (3), the optimal weights (w*) are identified. ξL* can be considered a measure to compare the two systems. The closer ξL* is to zero, the more consistent the system will be, and hence the more reliable the results would be.

Results

Various social factors were evaluated and discussed in different studies in the social dimension of sustainability [8,11,12,13,52]. In Section 2.4.2, we identified five impact factors that align with the direction of the study. Eventually, based on the experts’ opinions, the optimal weight for each factor of the two frames is calculated. Table 4 and Table 5 indicate the best and worst social indicators chosen by the experts for the two construction frames. (Significance of the five impact factors assumed to be equal).
After collecting all scores determined by the experts and using Equation (2), the optimal weights of social factors were calculated. Table 6 displays the final outputs of the two frames according to the selected social indicators.

2.4.4. Interpretation

Based on the final results, local community acceptance had the lowest significance regarding the concrete frame, with a score of 0.14. The rationale for this score could be due to the fact that this type of frame can be damaged by incidents such as earthquakes. Meanwhile, salary and local employment, with the scores of 0.282 and 0.231, were the concrete frame’s highest scores. Several jobs are involved in building a concrete frame, which might justify why these factors are the most significant. Since concrete frames are not considered safe by most experts, the health and safety factor had a relatively low score of 0.192. Moreover, since concrete consumes an excessive amount of water, the extraction of material resources factor had a score of 0.154, which is the second-worst factor.
As far as the steel frame is concerned, the fair salary has the highest significance among all the factors. During interviews with experts, all of them declared that the steel frame workers’ salary was ideal. This factor might be the advantage of steel frames compared to concrete ones. On the other hand, health and safety had the lowest score for this frame. According to the experts, this factor was the least important among all of the factors. Unlike the previous results, this one does not seem reasonable, and the main reason for this claim is the fact that, based on public opinion, it is known that the steel frame is safer than the concrete frame, particularly during disasters such as earthquakes. However, in this research, the five impact factors were compared, considering each construction frame separately, which might be the reason for the anomalous result. Local community acceptance, material resources extraction, and local employment were calculated as the second through fourth ranks. Figure 8 shows a visualized summary of the quantified scores in the five social impact factors.

2.5. Multi-Criteria Assessment and Sensitivity Analysis

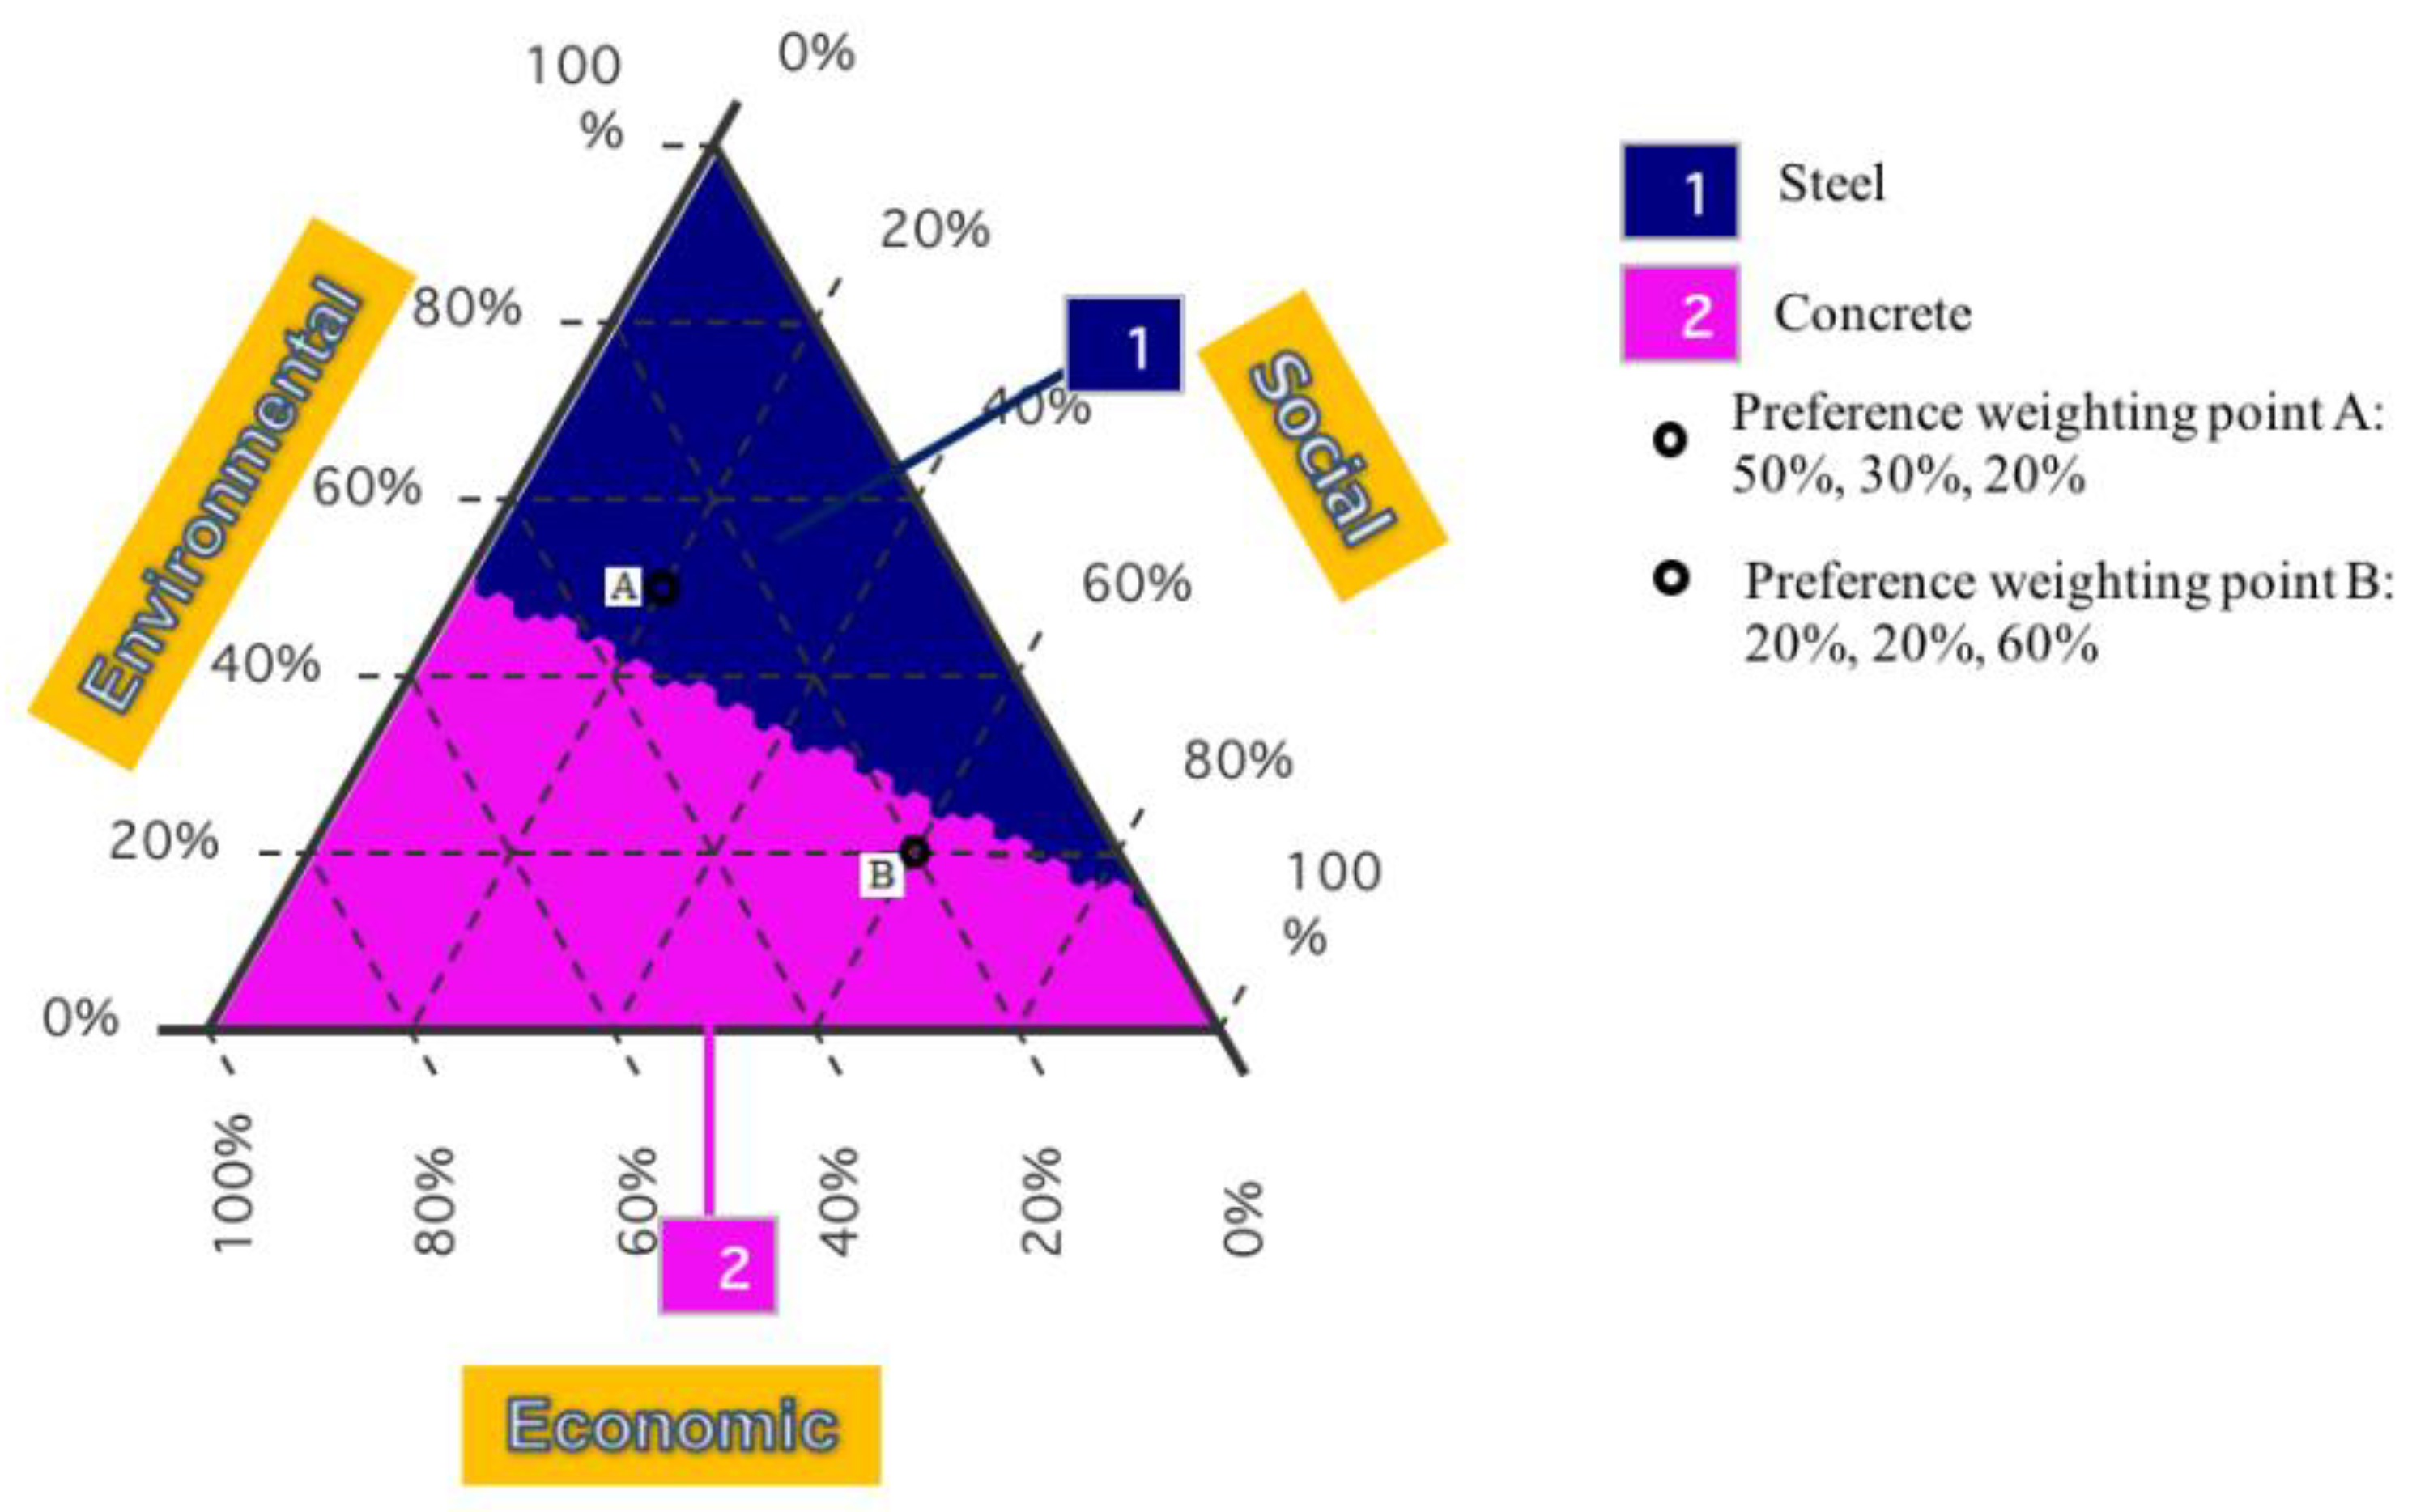
2.5.1. Triangle Graph

In this method, the triangle graph identifies the best option based on the set of assigned weights using a simple additive weighting method. Weights are designated as a percentage, and their summation is equal to 100. Weights are not accumulated for all the three aspects of sustainability but gathered for each factor and shown on a triangle’s side. Since it is critical and challenging to weigh each aspect, they are shown separately in this method. Strategic directions of an organization identify the set of weights. For instance, environmental strategies lead to having a higher weight on the environmental dimension, profiting strategies lead to assigning a greater weight to the economic aspect, and socially responsible policies pay more attention to the social aspect and assign a greater weight to it. This graph identifies the best option, and it also shows the range for the assigned weights. It can perform a sensitivity analysis to show the changes in the optimal solution.
The triangle graph was first introduced by Hofstetter [54] to analyze MCDM problems. This graph shows, in which weight combinations of given indicators, one choice is preferable over other alternatives. That is to say, it highlights those areas of the option (Dominance area) that stand out among others. In this case, the decision makers do not need to identify the weights precisely; they can determine each weight range. In other words, it makes a distinction of borderline dominance areas in weight combinations where the outstanding choices have stability points; namely, it reveals a line of indifference. Figure 9 displays an example of this graph. It is noteworthy to mention that this graph is only useful when there are only three criteria in the problem. Each side of the triangle is related to one aspect, and it shows the weight of that aspect as a percentage. Each point in the graph or on the sides indicates a weight combination. For instance, (50%, 30%, 20%) means the weight for the first factor is 50%, and the second and third factors are 30% and 20%, respectively.
According to the results shown in the Table 7, the environmental rankings are normalized, similar to economic and social rankings. The Triangle graph is designed based on factors with negative characteristics, which means the objective is to minimize these components. Among the three dimensions, the economic one is cost associated, and it is negative. The environmental aspect corresponds to damage; therefore, it has a negative aspect. However, the social dimension is related to relative preferences, and it has a positive connotation. Hence, to align the three dimensions, the minimum amount of social results was divided by the other outputs.

2.5.2. Results

Any organization or system can evaluate their products based on their strategies and goals using the triangle graph. Considering Figure 9, which displays the triangle graph for this study, the dark blue area corresponds to the areas where the steel frame is preferred over the concrete frame. Furthermore, the purple area is showing the region where the concrete frame is preferred. Two hypothetical A and B points are determined on the figure. For instance, point A can be an optimal solution where the weights for environmental, economic, and social aspects are 50%, 30%, and 20%, respectively, which means the steel frame has a better function in this point and based on the weights.
On the other hand, if a constructor aims to pay more attention to the social aspect of sustainability, point B can reflect this strategy. At this point, the concrete frame is chosen over the steel frame. This graph can be noticeably useful for constructors and decision makers. Based on the strategies, everyone can look at the weights differently. Whether the goal is to have more profit or have environmental concerns, this method can help adjust the graph based on the organization’s preferences. However, considering the recent concerns about sustainability issues, companies are not planning solely for profit. Organizations need to focus on all aspects of sustainability, not just the economic aspect, to be able to maintain their competitive advantage.
Table 8 shows sustainability scores of alternatives (in terms of load) for the weighting scheme of points A and B in Figure 9. Sustainability scores were calculated by a simple additive weighting method and indicate the sustainability load of each alternative. Therefore, a lower amount of this score is preferable from a sustainability perspective. As Table 8 shows, in the weighting scheme of point A, the steel frame has a sustainability score of 0.805, which is better (lower) than that of the concrete frame, and in the weighting scheme of point B, the concrete frame has a sustainability score of 0.884, which is better (lower) than the steel frame. Although the sustainability preference of each alternative numerically depends on the exact weighting of each point in Figure 9, we can see that overall, the dominance area of the steel frame placed at the schemes where high weights are assigned to environmental dimension. In contrast, the dominance area of the concrete frame placed at the schemes where high weights are assigned to economic or social dimension. Hence, one can conclude that considering more importance to environmental dimension leads to a sustainability preference of steel over the concrete frame, whereas assigning more importance to economic or social dimensions leads to a sustainability preference of concrete over the steel frame. Specifically, assigning 50% or more to the importance weight of the environmental dimension leads to a preference of steel over concrete regardless of the weightings of the two other dimensions. On the other hand, assigning 50% or more to importance weight of economic dimension leads to a preference of concrete over steel regardless of the weightings of the two other dimensions. Finally, assigning 85% or more to the importance weight of social dimension leads to a preference of concrete over steel regardless of weightings of the two other dimensions. This finding shows the imperative role of environmental and economic dimensions in this case study.

3. Discussion

The construction industry has been expanded and developed not only in Iran but also around the world. The impact of the industry is noticeable in other areas and fields. Therefore, it seemed necessary to evaluate the features of buildings by considering three dimensions of sustainability: environmental, economic, and social. Since frames are the main construction element and consume the most material, two of the most conventional frames, concrete and steel, were compared.
The following can be concluded based on relevant literature: most relevant studies have evaluated constructions as a whole, and among them, focusing on the environmental impacts had more priority compared to economic and social issues. However, some studies have discussed the social and economic impacts of the constructions. It is noteworthy that all of those studies have been conducted in different regions, and the results were area specific. Although most of such studies had similar results, it is clear that different factors such as ecosystem, climate, culture, and economy can affect the final results. Nevertheless, the circumstances of Iran have also been considered in this study. As a result, based on the information provided in previous sections related to each dimension, it is noticeable that the pollution generated by these two frames is concerningly high. However, choosing steel as a frame of a building is a major step towards reducing the emissions that lead to global warming by almost 25% [37]. Considering the two other factors besides the environmental factor, it is essential to view the construction of a building as a life cycle. Hence, the cost calculation of each life cycle stage needs to be completed in order to ensure a viable comparison of the two buildings. Moreover, in terms of social dimension, we decided to make constructors pay attention to factors such as salary, workers’ welfare, resources, and local community acceptance. This might help institutionalize moral and ethical criteria within the construction industry codes in Iran.
Results comparison Various comparative studies of steel and concrete buildings aimed to calculate the pollution of the two products in different impact factors. After reviewing them, it could be claimed that the environmental results of this study are compatible with most of those concluding that a concrete building creates more pollution [7,11,14,36]. As far as the economic dimension is concerned, few comparative LCC studies among the two types of frames have indicated quite different outcomes compared to this study. For example, ref [11] showed that building with a combination of concrete materials inside their structure costs more than its steel equivalents. In addition, refs [7,36] concluded that the total costs of concrete structures, considering all of the life cycle stages, were higher than those of steel structures. These contradictions between the current study and aforementioned papers have one major justification: the cheap price of cement in Iran. In addition, due to the unavailability of technologies for recycling concrete waste at the EOL period, all waste materials simply go to the landfill, and although it does not cost much, it could have devastating impacts on the ecosystem in Iran. Hence, the two stages of material production and the EOL are the reasons for selecting the concrete frame as the more economical one. Despite all those cases, examples of studies that have similar outcomes to this research could be found [15]. As for social dimension, ref [8] took advantage of the SLCA approach to compare concrete and steel as building materials. Their findings showed that choosing steel for construction could have more social benefits, which stands in opposition to the result of this study. Since the nature of the SLCA method is based on scores submitted by experts, different results can be expected from each study in this area. In [11], the researchers also used some social impact factors to evaluate five types of structures. However, their social assessment was not comprehensive and their comparisons between the structures lacked detail.

4. Conclusions

In this study, our objective was to conduct research to help the building industry move towards sustainable construction. To achieve this goal, two case study construction frames were selected in Tehran. The environmental issues have been evaluated in a separate study. Still, since sustainability is not solely limited to the environmental dimension, two other dimensions of sustainability, economic and social, were also discussed in detail in this study. Regarding the environmental aspect, overall, the concrete frame created 38% more pollution than the steel frame, and the main reason for this disparity was the two stages of raw material acquisition and the EOL [37]. All the expenses related to the various life cycle stages of the two frames, such as materials and transportation expenses, were identified to evaluate the economic aspect. Afterward, by applying the present net value and the equivalent uniform annual methods, the costs of the two frames were compared. Based on the estimated costs, constructing with a concrete frame is more economical in Iran due to the low price of its raw materials such as Portland cement and gravel. Therefore, building with the steel frame costs nearly 40% more than its concrete counterpart. To evaluate the social aspect, five most common factors suggested by the literature were selected and analyzed using the BWM. The rankings were identified by interviewing experts in the construction field. The average scores of these social factors for steel and concrete frames were 0.189 and 0.199, respectively, which shows that the concrete frame had slightly better performance in this dimension. However, since the nature of the S-LCA is based on expert opinions, outputs could not be completely reliable.
In conclusion, it was demonstrated which construction frame has a better performance in each one of the TBL indicators based on the circumstances in Iran. Builders can apply findings of this research on each aspect separately. However, we believe that looking at the sensitivity analysis proposed in Section 2.5.2 would be more logical since the mixing triangle graph provided a perspective for shareholders and decision makers to select the sustainable frame with respect to the environmental, economic, and social dimensions simultaneously. Moreover, in the mixing triangle graph we assumed the three dimensions have an equal significance, to follow the sustainability concept. One of the benefits of the represented method is that it is flexible, and decision-makers can assign various weights to each dimension based on their policy. One of the main findings of the research was that, overall, giving a high importance weight to environmental dimension leads to a sustainability preference of steel over the concrete frame, while giving a high importance weight to economic or social dimensions lead to a sustainability preference of concrete over the steel frame. This finding is beneficial to decision makers in the construction industry since they can decide on the best alternative among concrete and steel frames based on their strategies and mental preferences.

Author Contributions

Conceptualization, A.O., S.M. and S.A.H.; methodology, A.O., S.M. and S.A.H.; software, A.O.; validation, S.M. and S.A.H.; formal analysis, A.O., S.M. and S.A.H.; investigation, A.O.; resources, A.O.; data curation, S.M. and S.A.H.; writing—original draft preparation, A.O., M.H.M. and S.A.H.; writing—review and editing, A.O., S.M., S.A.H. and M.H.M.; visualization, A.O. and M.H.M.; supervision, S.M.; project administration, A.O. and S.M.; funding acquisition, A.O., S.M., S.A.H. and M.H.M. All authors have read and agreed to the published version of the manuscript.

Funding

This paper received no external funding.

Conflicts of Interest

The authors declare no conflict of interest.

References

  1. Klöpffer, W. Life cycle sustainability assessment of products. Int. J. Life Cycle Assess. 2008, 13, 89–95. [Google Scholar] [CrossRef]
  2. United Nations Environmental Programme, Sustainable Buildings and Climate Initiative. Buildings and Climate Change: Summary for Decision-Makers; United Nations Environmental Programme: Paris, France, 2009; pp. 1–62. [Google Scholar]
  3. Vieira, P.S.; Horvath, A. Assessing the End-Of-Life Impacts of Buildings; ACS Publications: Washington, DC, USA, 2008; pp. 4663–4669. [Google Scholar]
  4. Mavrokapnidis, D.; Mitropoulou, C.C.; Lagaros, N.D. Environmental assessment of cost optimized structural systems in tall buildings. J. Build. Eng. 2019, 24, 100730. [Google Scholar] [CrossRef] [Green Version]
  5. Balasbaneh, A.T.; Marsono AK, B.; Kermanshahi, E.K. Balancing of life cycle carbon and cost appraisal on alternative wall and roof design verification for residential building. Constr. Innov. 2018, 18, 274–300. [Google Scholar] [CrossRef]
  6. Val, D.V.; Stewart, M.G. Life-cycle cost analysis of reinforced concrete structures in marine environments. Struct. Saf. 2003, 25, 343–362. [Google Scholar] [CrossRef]
  7. Lu, H.R.; El Hanandeh, A.; Gilbert, B.P. A comparative life cycle study of alternative materials for Australian multi-storey apartment building frame constructions: Environmental and economic perspective. J. Clean. Prod. 2017, 166, 458–473. [Google Scholar] [CrossRef]
  8. Hosseinijou, S.A.; Mansour, S.; Shirazi, M.A. Social life cycle assessment for material selection: A case study of building materials. Int. J. Life Cycle Assess. 2014, 19, 620–645. [Google Scholar] [CrossRef]
  9. Akadiri, P.O.; Chinyio, E.A.; Olomolaiye, P.O. Design of a sustainable building: A conceptual framework for implementing sustainability in the building sector. Buildings 2012, 2, 126–152. [Google Scholar] [CrossRef] [Green Version]
  10. Cabeza, L.F.; Rincón, L.; Vilariño, V.; Pérez, G.; Castell, A. Life cycle assessment (LCA) and life cycle energy analysis (LCEA) of buildings and the building sector: A review. Renew. Sustain. Energy Rev. 2014, 29, 394–416. [Google Scholar] [CrossRef]
  11. Reza, B.; Sadiq, R.; Hewage, K. Sustainability assessment of flooring systems in the city of Tehran: An AHP-based life cycle analysis. Constr. Build. Mater. 2011, 25, 2053–2066. [Google Scholar] [CrossRef]
  12. Akadiri, P.O.; Olomolaiye, P.O.; Chinyio, E.A. Multi-criteria evaluation model for the selection of sustainable materials for building projects. Autom. Constr. 2013, 30, 113–125. [Google Scholar] [CrossRef]
  13. Balasbaneh, A.T.; Marsono AK, B.; Khaleghi, S.J. Sustainability choice of different hybrid timber structure for low medium cost single-story residential building: Environmental, economic and social assessment. J. Build. Eng. 2018, 20, 235–247. [Google Scholar] [CrossRef]
  14. Xing, S.; Xu, Z.; Jun, G. Inventory analysis of LCA on steel-and concrete-construction office buildings. Energy Build. 2008, 40, 1188–1193. [Google Scholar] [CrossRef]
  15. Kim, S.; Moon, J.H.; Shin, Y.; Kim, G.H.; Seo, D.S. Life comparative analysis of energy consumption and CO2 emissions of different building structural frame types. Sci. World J. 2013, 2013, 175702. [Google Scholar] [CrossRef] [Green Version]
  16. Robertson, A.B.; Lam, F.C.; Cole, R.J. A comparative cradle-to-gate life cycle assessment of mid-rise office building construction alternatives: Laminated timber or reinforced concrete. Buildings 2012, 2, 245–270. [Google Scholar] [CrossRef]
  17. Dimoudi, A.; Tompa, C. Energy and environmental indicators related to construction of office buildings. Resour. Conserv. Recycl. 2008, 53, 86–95. [Google Scholar] [CrossRef]
  18. Junnila, S.; Horvath, A.; Guggemos, A.A. Life-cycle assessment of office buildings in Europe and the United States. J. Infrastruct. Syst. 2006, 12, 10–17. [Google Scholar] [CrossRef]
  19. Kahhat, R.; Crittenden, J.; Sharif, F.; Fonseca, E.; Li, K.; Sawhney, A.; Zhang, P. Environmental impacts over the life cycle of residential buildings using different exterior wall systems. J. Infrastruct. Syst. 2009, 15, 211–221. [Google Scholar] [CrossRef]
  20. Ge, J.; Yan, Y.; Lu, J.; Wang, J. Chinese energy/CO2 intensities based on 2002 input-output table and Life Cycle Assessment of residential building by accumulative method. Lowl. Technol. Int. 2010, 12, 14–22. [Google Scholar]
  21. Utama, A.; Gheewala, S.H. Indonesian residential high rise buildings: A life cycle energy assessment. Energy Build. 2009, 41, 1263–1268. [Google Scholar] [CrossRef]
  22. Broun, R.; Menzies, G.F. Life cycle energy and environmental analysis of partition wall systems in the UK. Procedia Eng. 2011, 21, 864–873. [Google Scholar] [CrossRef] [Green Version]
  23. Sinha, R.; Lennartsson, M.; Frostell, B. Environmental footprint assessment of building structures: A comparative study. Build. Environ. 2016, 104, 162–171. [Google Scholar] [CrossRef]
  24. Emami, N.; Heinonen, J.; Marteinsson, B.; Säynäjoki, A.; Junnonen, J.M.; Laine, J.; Junnila, S. A life cycle assessment of two residential buildings using two different LCA database-software combinations: Recognizing uniformities and inconsistencies. Buildings 2019, 9, 20. [Google Scholar] [CrossRef] [Green Version]
  25. Asdrubali, F.; Baldassarri, C.; Fthenakis, V. Life cycle analysis in the construction sector: Guiding the optimization of conventional Italian buildings. Energy Build. 2013, 64, 73–89. [Google Scholar] [CrossRef]
  26. Ximenes, F.A.; Grant, T. Quantifying the greenhouse benefits of the use of wood products in two popular house designs in Sydney, Australia. Int. J. Life Cycle Assess. 2013, 18, 891–908. [Google Scholar] [CrossRef]
  27. Babaizadeh, H.; Hassan, M. Life cycle assessment of nano-sized titanium dioxide coating on residential windows. Constr. Build. Mater. 2013, 40, 314–321. [Google Scholar] [CrossRef]
  28. Kofoworola, O.F.; Gheewala, S.H. Life cycle energy assessment of a typical office building in Thailand. Energy Build. 2009, 41, 1076–1083. [Google Scholar] [CrossRef]
  29. Scheuer, C.; Keoleian, G.A.; Reppe, P. Life cycle energy and environmental performance of a new university building: Modeling challenges and design implications. Energy Build. 2003, 35, 1049–1064. [Google Scholar] [CrossRef]
  30. Cole, R.J. Energy and greenhouse gas emissions associated with the construction of alternative structural systems. Build. Environ. 1998, 34, 335–348. [Google Scholar] [CrossRef]
  31. Mithraratne, N.; Vale, B. Life cycle analysis model for New Zealand houses. Build. Environ. 2004, 39, 483–492. [Google Scholar] [CrossRef]
  32. Reddy, B.V.; Jagadish, K.S. Embodied energy of common and alternative building materials and technologies. Energy Build. 2003, 35, 129–137. [Google Scholar] [CrossRef]
  33. Thormark, C. Environmental analysis of a building with reused building materials. Int. J. Low Energy Sustain. Build. 2000, 1, 1–19. [Google Scholar]
  34. Nässén, J.; Hedenus, F.; Karlsson, S.; Holmberg, J. Concrete vs. wood in buildings—An energy system approach. Build. Environ. 2012, 51, 361–369. [Google Scholar] [CrossRef]
  35. Balasbaneh, A.T.; Ramli, M.Z. A comparative life cycle assessment (LCA) of concrete and steel-prefabricated prefinished volumetric construction structures in Malaysia. Environ. Sci. Pollut. Res. 2020, 27, 43186–43201. [Google Scholar] [CrossRef]
  36. Gervasio, H. Comparative Housing Case Study (Steel vs. Concrete) through a Quantitative Life Cycle Approach, 2nd ed.; World Steel Construction Council: Brussels, Belgium, 2007. [Google Scholar]
  37. Oladazimi, A.; Mansour, S.; Hosseinijou, S.A. Comparative Life Cycle Assessment of Steel and Concrete Construction Frames: A Case Study of Two Residential Buildings in Iran. Buildings 2020, 10, 54. [Google Scholar] [CrossRef] [Green Version]
  38. ISO. DIS 15686-5 Buildings and Constructed Assets-Service Life Planning; International Organization for Standardization: Geneva, Switzerland, 2017. [Google Scholar]
  39. UNEP. Guidelines for Social Life Cycle Assessment of Products; United Nations Environment Programme (UNEP) and Society of Environmental Toxicology and Chemistry (SETAC): Brussels, Belgium, 2009. [Google Scholar]
  40. Elkington, J. Partnerships from cannibals with forks: The triple bottom line of 21st-century business. Environ. Qual. Manag. 1998, 8, 37–51. [Google Scholar] [CrossRef]
  41. International Organization for Standardization. ISO 14044-Environmental management—Life Cycle Assessment—Principle and Framework. 2006. Available online: https://www.iso.org/standard/38498.html (accessed on 26 September 2021).
  42. Kawauchi, Y.; Rausand, M. Life Cycle Cost (LCC) Analysis in Oil and Chemical Process Industries; Toyo Engineering Corp: Chiba, Japan, 1999. [Google Scholar]
  43. Ciroth, A. Software for life cycle assessment. In Life Cycle Assessment Handbook; John Wiley & Sons, Inc.: Hoboken, NJ, USA, 2012; pp. 143–157. [Google Scholar]
  44. Cole, R.J.; Sterner, E. Reconciling theory and practice of life-cycle costing. Build. Res. Inf. 2000, 28, 368–375. [Google Scholar] [CrossRef]
  45. Gluch, P.; Baumann, H. The life cycle costing (LCC) approach: A conceptual discussion of its usefulness for environmental decision-making. Build. Environ. 2004, 39, 571–580. [Google Scholar] [CrossRef] [Green Version]
  46. Langdon, D. Life Cycle Costing (LCC) as a Contribution to Sustainable Construction: A Common Methodology; Literature Review; Davis Langdon Management Consulting: London, UK, 2007. [Google Scholar]
  47. Task Group 4 (TG4) Report of Task Group 4: Life Cycle Costs in Construction, the European Commission. 2003. Available online: http://ec.europa.eu/enterprise/construction/suscon/tgs/tg4/lccreport.pdf (accessed on 26 September 2021).
  48. Jørgensen, A. Developing the Social Life Cycle Assessment: Addressing Issues of Validity and Usability; DTU Management: Kongens Lyngby, Denmark, 2010. [Google Scholar]
  49. Méthot, A. FIDD: A green and socially responsible venture capital fund. In Proceedings of the Life Cycle Approaches for Green Investment—26th LCA Swiss Discussion Forum, Lausanne, Switzerland, 7 June 2005. [Google Scholar]
  50. Dreyer, L.; Hauschild, M.; Schierbeck, J. A framework for social life cycle impact assessment (10 pp). Int. J. Life Cycle Assess. 2006, 11, 88–97. [Google Scholar] [CrossRef]
  51. Benoît, C.; Norris, G.A.; Valdivia, S.; Ciroth, A.; Moberg, A.; Bos, U.; Prakash, S.; Ugaya, C.; Beck, T. The guidelines for social life cycle assessment of products: Just in time! Int. J. Life Cycle Assess. 2010, 15, 156–163. [Google Scholar] [CrossRef]
  52. Ahmadi, H.B.; Kusi-Sarpong, S.; Rezaei, J. Assessing the social sustainability of supply chains using Best Worst Method. Resour. Conserv. Recycl. 2017, 126, 99–106. [Google Scholar] [CrossRef]
  53. Rezaei, J. Best-worst multi-criteria decision-making method: Some properties and a linear model. Omega 2016, 64, 126–130. [Google Scholar] [CrossRef]
  54. Hofstetter, P.; Braunschweig, A.; Mettier, T.; Müller-Wenk, R.; Tietje, O. The mixing triangle: Correlation and graphical decision support for LCA-based comparisons. J. Ind. Ecol. 1999, 3, 97–115. [Google Scholar] [CrossRef]
Figure 1. Triple Bottom Line [40].
Buildings 11 00565 g001
Figure 2. Total environmental pollution [37].
Buildings 11 00565 g002
Figure 3. LCC framework [42].
Buildings 11 00565 g003
Figure 4. System boundary for LCC.
Buildings 11 00565 g004
Figure 5. Cost Breakdown Structure.
Buildings 11 00565 g005
Figure 6. Cost profile.
Buildings 11 00565 g006
Figure 7. System boundary for SLCA.
Buildings 11 00565 g007
Figure 8. Final results of social sustainability assessment for the two frames (w1: Health and safety, w2: Fair salary, w3: Local employment, w4: Local community acceptance, w5: Extraction of material resources).
Buildings 11 00565 g008
Figure 9. Dominance area of the two frames in mixing triangle.
Buildings 11 00565 g009
Table 1. Comparison of this research with most relevant studies.
AuthorsCase StudyDimensions/MethodologyMulti-Criteria Assessment
CountryAlternative MaterialsStructuresEnvironmentalEconomicSocial
Vieira et al. (2008) [3]USAConcreteOffice buildingLCA------
Balasbaneh et al. (2018) [5]MalaysiaWood, Steel, Brick, ConcreteSingle-storey buildingLCALCC----
Val et al. (2003) [6]AustraliaReinforced ConcreteResidential building--LCC----
Lu et al. (2017) [7]AustraliaConcrete, Steel, Laminated Veneer LumberMulti-storey apartmentLCALCC----
Hosseinijou et al. (2014) [8]IranConcrete, SteelBuilding materials----S-LCA--
Reza el al (2011) [11]IranConcrete, Clay, expanded polystyreneBuilding materials, flooring systemsAHP based LCAAHPAHPAHP
Akadiri et al. (2013) [12]UKTimberOffice buildingFEAHPFEAHPFEAHP--
Balasbaneh et al. (2018) [13]MalaysiaConcrete, Steel, TimberResidential buildingLCALCCS-LCA
(no quantitative method)
--
Xing et al. (2008) [14]ChinaConcrete, SteelOffice buildingLCA------
Kim et al. (2013) [15]Republic of KoreaReinforced Concrete, SteelConstruction materialsInput/output analysis------
Robertson et al. (2012) [16]CanadaLaminated Timber, Reinforced ConcreteOffice buildingLCA------
Dimoudi et al. (2008) [17]GreeceConcrete, Reinforcement steelOffice buildingLCA------
Junnila et al. (2006) [18]USA, FinlandMiscellaneous building materialsOffice buildingLCA------
Kahhat et al. (2009) [19]USAConcrete, Block, Wood, SteelResidential buildingLCA------
Ge et al. (2010) [20]ChinaConcrete, SteelResidential buildingLCA------
Utama et al. (2009) [21]IndonesiaDouble and Single WallsTall buildingsLCA------
Broun et al. (2011) [22]UKBrick, Clay, Concrete, TimberPartition wallsLCA------
Sinha et al. (2016) [23]SwedenConcrete, WoodResidential buildingLCA------
Emami et al. (2019) [24]FinlandConcrete, WoodResidential buildingLCA------
Asdrubali et al. (2013) [25]ItalyReinforced ConcreteResidential house and office buildingLCA------
Ximenes et al. (2013) [26]AustraliaMiscellaneous building materialsDomestic houseLCA------
Babaizadeh et al. (2013) [27]USATitanium Dioxide CoatingBuilding materialsLCA------
Kofoworola et al. (2009) [28]ThailandMiscellaneous building materialsOffice buildingLCA------
Scheuer et al. (2003) [29]USAMiscellaneous building materialsUniversity buildingLCA------
Cole (1998) [30]CanadaConcrete, Steel, WoodConstruction materialsLCA------
Mithraratne et al. (2004) [31]New ZealandMiscellaneous building materialsLight-weight timber framed house and concrete timber houseLCALCC----
Venkatarama et al. (2003) [32]IndiaMiscellaneous building materialsBuilding materialsLCA------
Thormark (2000) [33]SwedenMiscellaneous building materialsSingle dwellingLCA------
Nässén et al. (2012) [34]SwedenConcrete, WoodFour-storey buildingcarbon balancesNet present cost----
This studyIranSteel, ConcreteBuilding framesLCALCCSLCAMixing Triangle
Table 2. NPV and EAC of the two frames during life cycle stages.
TitleVariableSteelConcrete
Discount ratei15%15%
life span (Year)Ln5050
Initial Costs (USD Thousands)
Raw Material AcquisitionMA10070
Material ProductionMP257127
TransportationTi52.3
Present Value of Initial CostsPVIC301174
Annual Value of Initial CostsAVIC4526
Construction Costs (USD Thousands)
TransportationTC4.22
ConstructionC9047
UseU
Present Value of Construction CostsPVCC7539
Annual Value of Construction CostsAVCC11.25.8
End-of-Life Costs (USD Thousands)
DemolitionD2.811
TransportationTEOL5.37.2
Present Value of End-of-Life CostsPVEOLC6.414.6
Annual Value of End-of-Life CostsAVEOLC12.1
Present Value of Life Cycle CostsPVLCC380228
Annual Value of Life Cycle CostsAVLCC57.234.1
Table 3. Experts’ affiliations.
Expert’s NumberProfession
E-01Architect
E-02Architect
E-03Architect
E-04Architect
E-05Architect
E-06Structural Engineer
E-07Structural Engineer
E-08Structural Engineer
E-09Earthquake Engineer
E-10Structural Engineer
Table 4. Best and Worst criteria for the concrete frame.
Social Impact FactorsSelected as Best by ExpertsSelected as Worst by Experts
Health and Safety (w1)E-06, E-09E-07, E-10
Fair salary (w2)E-02, E-04, E-07, E-10E-08
Local employment (w3)E-03, E-05
Local community acceptance (w4)E-08E-01, E-03, E-05, E-06
Extraction of material resources (w5)E-01E-02, E-04, E-09
Table 5. Best and Worst criteria for the steel frame.
Social Impact FactorsSelected as Best by ExpertsSelected as Worst by Experts
Health and Safety (w1)E-06, E-08, E-09
Fair salary (w2)E-02, E-03, E-05, E-07, E-08, E-10
Local employment (w3)E-04, E-05
Local community acceptance (w4)E-01, E-04E-03, E-07, E-10
Extraction of material resources (w5)E-06, E-09E-01, E-02
Table 6. Optimal weights for five social indicators.
Social Sustainability CriteriaConcreteSteel
Means.d.Means.d.
Health and safety (w1)0.1920.1580.110.046
Fair salary (w2)0.2820.1580.3070.162
Local employment (w3)0.2310.1440.1530.067
Local community acceptance (w4)0.140.1190.1810.176
Extraction of material resources (w5)0.1540.1160.1940.163
Overall Mean0.199 0.189
Average consistency, ξL*0.108 0.101
Table 7. Non-normalized and normalized un-weighted scores for final outputs in each dimension.
Non-NormalizedNormalized (in Terms of Sustainability Load)
OptionsEnvironmental
(kg CO2 eq.)
Economic
(USD Thousands)
SocialEnvironmentalEconomicSocial
Steel frame3.56 E+ 083800.1890.611.001.00
Concrete frame5.75 E+ 082280.1991.000.600.94
Table 8. Sustainability scores of alternatives (in terms of load) for weighting scheme of points A and B in Figure 9.
EnvironmentalEconomicSocialSustainability Scores (Point A)Sustainability Scores (Point B)
Weights (Point A)
Weights (Point B)
Options
50%
20%
30%
20%
20%
60%
Steel frame0.611.001.000.8050.922
Concrete frame1.000.600.940.8680.884
Publisher’s Note: MDPI stays neutral with regard to jurisdictional claims in published maps and institutional affiliations.

