Article

Assessment of Color Discrimination of Different Light Sources

Instituto Universitario de Arquitectura y Ciencias de la Construcción, Universidad de Sevilla, 41004 Sevilla, Spain
*
Author to whom correspondence should be addressed.
Buildings 2021, 11(11), 527; https://doi.org/10.3390/buildings11110527
Submission received: 11 October 2021 / Revised: 31 October 2021 / Accepted: 1 November 2021 / Published: 8 November 2021
(This article belongs to the Topic New Perspectives on Lighting)

Abstract

:
Light quality is a key parameter of building design, which is mainly defined by the perceived luminance and the color rendering. Nowadays, there is a wide variety of metrics that do not converge in the color rendition evaluation of current light sources. The obsolescence of the Color Rendering Index promoted the rise of new procedures to provide an accurate evaluation. However, the score provided by most of these metrics does not distinguish between color deviation and hue discrimination, giving a single value to assess the overall color perception allowed by a light source. In this context, a new study is proposed, based on the evaluation of seven different light sources, comparing the results of the most recent color rendering metrics and those observed using a Farnsworth–Munsell trial carried out with 115 participants. The results obtained show that there is a notable divergence between color rendition and hue discrimination, although there is a clear proportionality between both. Moreover, a clear relationship is observed between color discrimination and the correlative color temperature of light sources, providing a better hue distinction with cool light sources, even though the psychological preferences of the participants do not coincide with the optimal scenario for color discrimination.

1. Introduction and Objectives

1.1. Background

At present, lighting technology is rapidly improving the energy efficiency of LED lamps, focusing on the reduction of energy consumption and the equivalent CO2 emission [1]. However, in most cases, this development does not consider the implications of the current luminaires in color perception [2] and in human health [3,4] and well-being [5]. As argued by several researchers, urban and architectural lighting should take into account not only the quantity and distribution of light but also its quality [6,7,8] in providing a comfortable environment for users. In addition, the spectral distribution of the light sources is crucial for giving a safe environment in roadways and pedestrians areas, allowing a suitable color perception and hue discrimination [9,10].
Most of the luminaires currently on the market are based on LED technology, whose lamps generate a different spectral distribution compared to the older sodium-vapor, incandescent, halogen and fluorescent lamps, producing a noticeable variation in color perception. Specifically, LED lamps produce a notable variation in their chromatic perception depending on the short-wavelength spectrum [11]. LED light sources are affordable and produce a higher luminous flux with a lower energy consumption compared to the previous models. This shows the need for an accurate evaluation of the effects promoted by these new lamps in the field of color rendition [12].
Nowadays, the Color Rendering Index (CRI) is the most widespread metric for determining the hue deviation of any light source. This concept, presented in 1974 [13] and subsequently recognized by the Commission internationale de l’eclairage (CIE) [14], was proposed as a method for quantifying the color performance attained by fluorescent lamps. Based on the deviation of eight color samples in the CIE diagram, CRI uses a variable light source reference with a theoretically perfect rendition to determine the performance of the lamp under study. However, some inaccuracies can be observed in the CRI calculation, mostly in the non-uniform color distribution of the color space [15], the low saturation of the color sample selected for evaluating the hue deviation [16] and the choice of the light source of reference [17]. Considering these limitations, this metric was updated in 1999 to include six new illuminants [18], although it did not provide a satisfactory description of the color rendition of LED lamps.
Subsequently, in 2010, the Color Quality Scale (CQS) [19] was proposed in order to provide an accurate calculation of color rendition for LED lamps. This new concept establishes 15 new color samples with a higher saturation than in previous metrics, an updated color space based on a CIE lab and a new Chromatic Adaptation Transform (CAT) recommended by the Color Measurement Committee (CMC), CMCCAT2000. This metric arose from the need to answer several issues related to color performance, among them the higher levels of naturalness and attractiveness provided by LED lamps in comparison with halogen light sources, despite the CRI score suggesting otherwise [20].
Two years later, Smet et al. determined an update of the CRI called CRI2012 [21], articulated in 210 real samples and on the colorimetric color appearance model (CAM) CRI-CAM02UCS uniform color space (UCS) [22]. This metric shows more accurate results than the original definition of CRI.
One of the most recent procedures for providing a full description of the color perception allowed by a light source is TM-30-20, developed by the Illuminating Engineering Society (IES) [23]. This procedure compares the results for 99 samples from the CIE color space and establishes a continuous illuminant reference which varies depending on the color temperature of the light source under study. IES is currently promoting the use of this new procedure among luminaire manufacturers [24]. After the first proposal of this metric, TM-30-15 [25], in 2015 and prior to the previous update in 2018, the CIE developed the Color Fidelity Index (CIE 2017) [26] based on an optimized version of the color sample proposed by the IES aiming to improve the results obtained by the CRI. This new metric does not address an extensive analysis as in the case of TM-30-20, although it provides a more accurate calculation of color fidelity.
Most of the metrics are based on the analysis of the sample deviation in a color space, but this is not the case with the Daylight Spectrum Index (DSI) [27]. This new concept, developed by Acosta et al., determines the color affinity of a studied lamp with daylighting, comparing the Spectral Power Distribution (SPD) of both sources according to the color sensitivity functions f(L), f(M) and f(S). Therefore, the aim of this definition is to determine the similarity of the color perception produced by a light source to that generated by daylighting, considering the natural source as the sole reference for producing a perfect rendition.
In order to design luminaires with optimal color discrimination, an accurate measurement procedure is required. Accordingly, Thornton proposed the Color Discrimination Index (CDI), defined as the area enclosed by the eight CRI samples and normalized according to CIE Illuminant C [28]. Subsequent research by Boyce et al. [29] and Rea et al. [30] converge with Thornton’s proposal, although neither CRI nor CDI provide acceptable results for determining color discrimination.
In an attempt to improve the understanding of the color discrimination allowed by a light source, Rea et al. identified the Gamut Area Index (GAI) [31] which is determined as the ratio between the surfaces limited by the eight color samples defined by CRI for the studied lamp and a reference, usually defined as daylighting. This metric is interesting, since the accuracy of the results obtained by means of GAI were tested using the Farnsworth-Munsell 100 Hue Test (FM-100) [32], determining better results than CRI with respect to color discrimination [33].
Given this context, it can be concluded that the gamut indices do not provide a suitable prediction of the ability of a light source to discretize colors. Previous studies warn of this concern especially for highly composed spectra [34], which are of particular relevance since LED lamps usually produce this type of spectral distribution.
Moreover, color performance is not the only variable to consider for a lighting design. Depending on the context, chromatic preference can vary, so the color rendition can be affected by boundary conditions [35]. According to this statement, Schanda et al. [36] assessed color fidelity for a picture gallery, selecting a multi-light-emitting diode for this particular case. For the same context, Feltrin et al. [37] concluded that the Correlated Color Temperature (CCT) has a noticeable impact on the perceived brightness of the artworks and is more decisive than the overall hue content or the color of the background. In a different scenario, Szabó et al. [38] analyzed the color preference for a shop, defining the suitable SPD for LED luminaires. Most recently, color preference was analyzed for a retail display, a supermarket and a restaurant by Lin et al. [2], with each case study obtaining different results. The research by Royer et al. [39] should also be noted, as they evaluate color preference with 25 participants. The results of this study conclude that the current color rendition metrics do not meet the criteria for color preference but can be predictable according to calculation models based on the metrics defined by TM-30-20; the Fidelity Index (Rf) and the Gamut Index (Rg).
The best way to determine the accuracy of the color rendition metrics relies on the assessment of surveys and objective trials, as deduced from the following studies: Houser et al. [40] carried out in-depth research, analyzing 40 surveys to evaluate whiteness perception under different LED lamps, confirming that very short-wavelength light is necessary to induce whiteness. Jost-Boissard et al. [20] evaluated the color quality promoted by LED lamps, analyzing a wide range of warm and cool light sources from over 80 surveys. At the same time, Dangol et al. [41] studied the accuracy of CRI, CQS and CRI2012 by means of 20 surveys using different LED lamps with a CCT from warm to cool. The authors established a high correlation between the metrics studied. One of the most recent examples is the study by Gu et al. [42], which analyzed several metrics using 10 surveys and concluded that CAM02-UCS color space is one of the best for the evaluation of hue deviation.
Considering the development of tests for determining the ability of a light source to discretize color, it is worth noting that the tests must provide an objective quantification of the results obtained [43]. Following this, the research by Esposito et al. [44] defined a novel measure of color discrimination, Rd, determining a score according to the numbers of transpositions carried out in the FM-100 trial. Therefore, an Rd close to 0 means that the light source provides almost perfect color discrimination, while a score greater than 16 represents a poor discrimination of hues.
As seen from the above, color rendition metrics are constantly evolving, given that there are no solid criteria for determining the chromatic performance of a light source [45]. Moreover, most of the metrics focus on the quantification of the color deviation [33], ignoring the need to distinguish colors with similar hues, brightness and saturation.

1.2. Aim and Objectives

Considering this general background, a new study is proposed based on the assessment of the color discrimination provided by seven light sources with different spectrometry, comparing the results of the most recent color rendering metrics and those observed according to a FM-100 trial carried out by 115 participants, totaling 805 surveys. The proposed test can determine the ability to distinguish different color ranges in an objective and quantifiable way.
The proposed research aims to determine the relationship between the color deviation defined by the current metrics and the color discrimination of three different hue ranges, considering other variables, such as the CCT and the color preferences of the participants.
Although this study follows a similar methodology to that of previous articles [27,31,46], it offers new nuances highlighting the novelty of the results described below:
  • Two recently proposed metrics are evaluated, TM-30-20 and DSI. The precision of these metrics had not previously been evaluated for color discrimination.
  • The study sample, made up of 805 surveys and color tests, is noticeable larger than in previous research [20,40,42,47], giving considerable accuracy for the conclusions obtained.
  • This study establishes a new quantification of the score provided by the FM-100 trial [43] in order to adapt the results to the proposed methodology, aiming to provide an objective assessment of the color discrimination, following the procedure established by Esposito et al. [44].
  • Finally, this research provides a relationship between the scores given by most of the current color rendering metrics and the ability to discretize the hues, considering other characteristics of the light source, such as CCT and SPD.
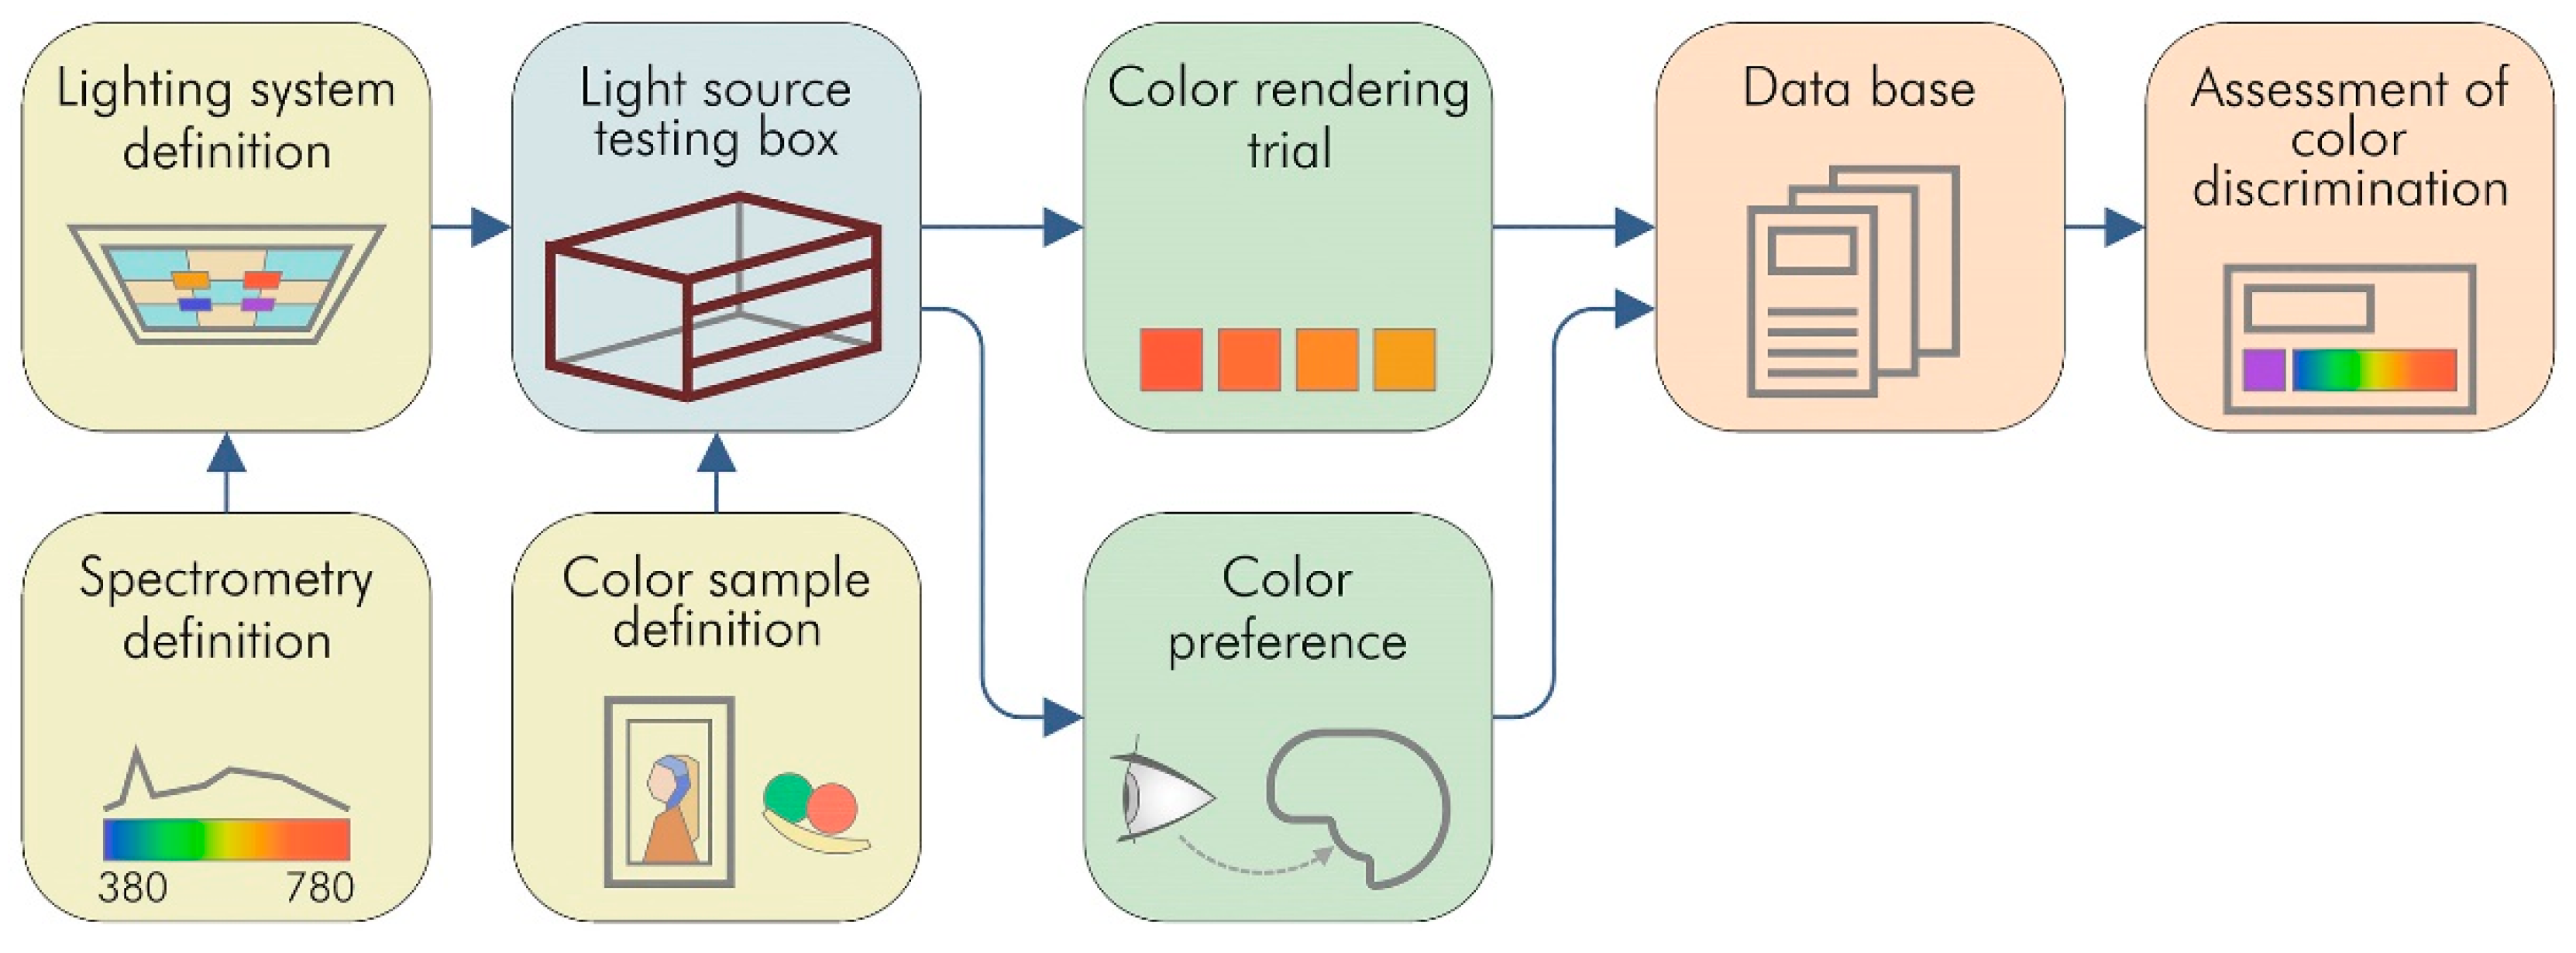
2. Methodology

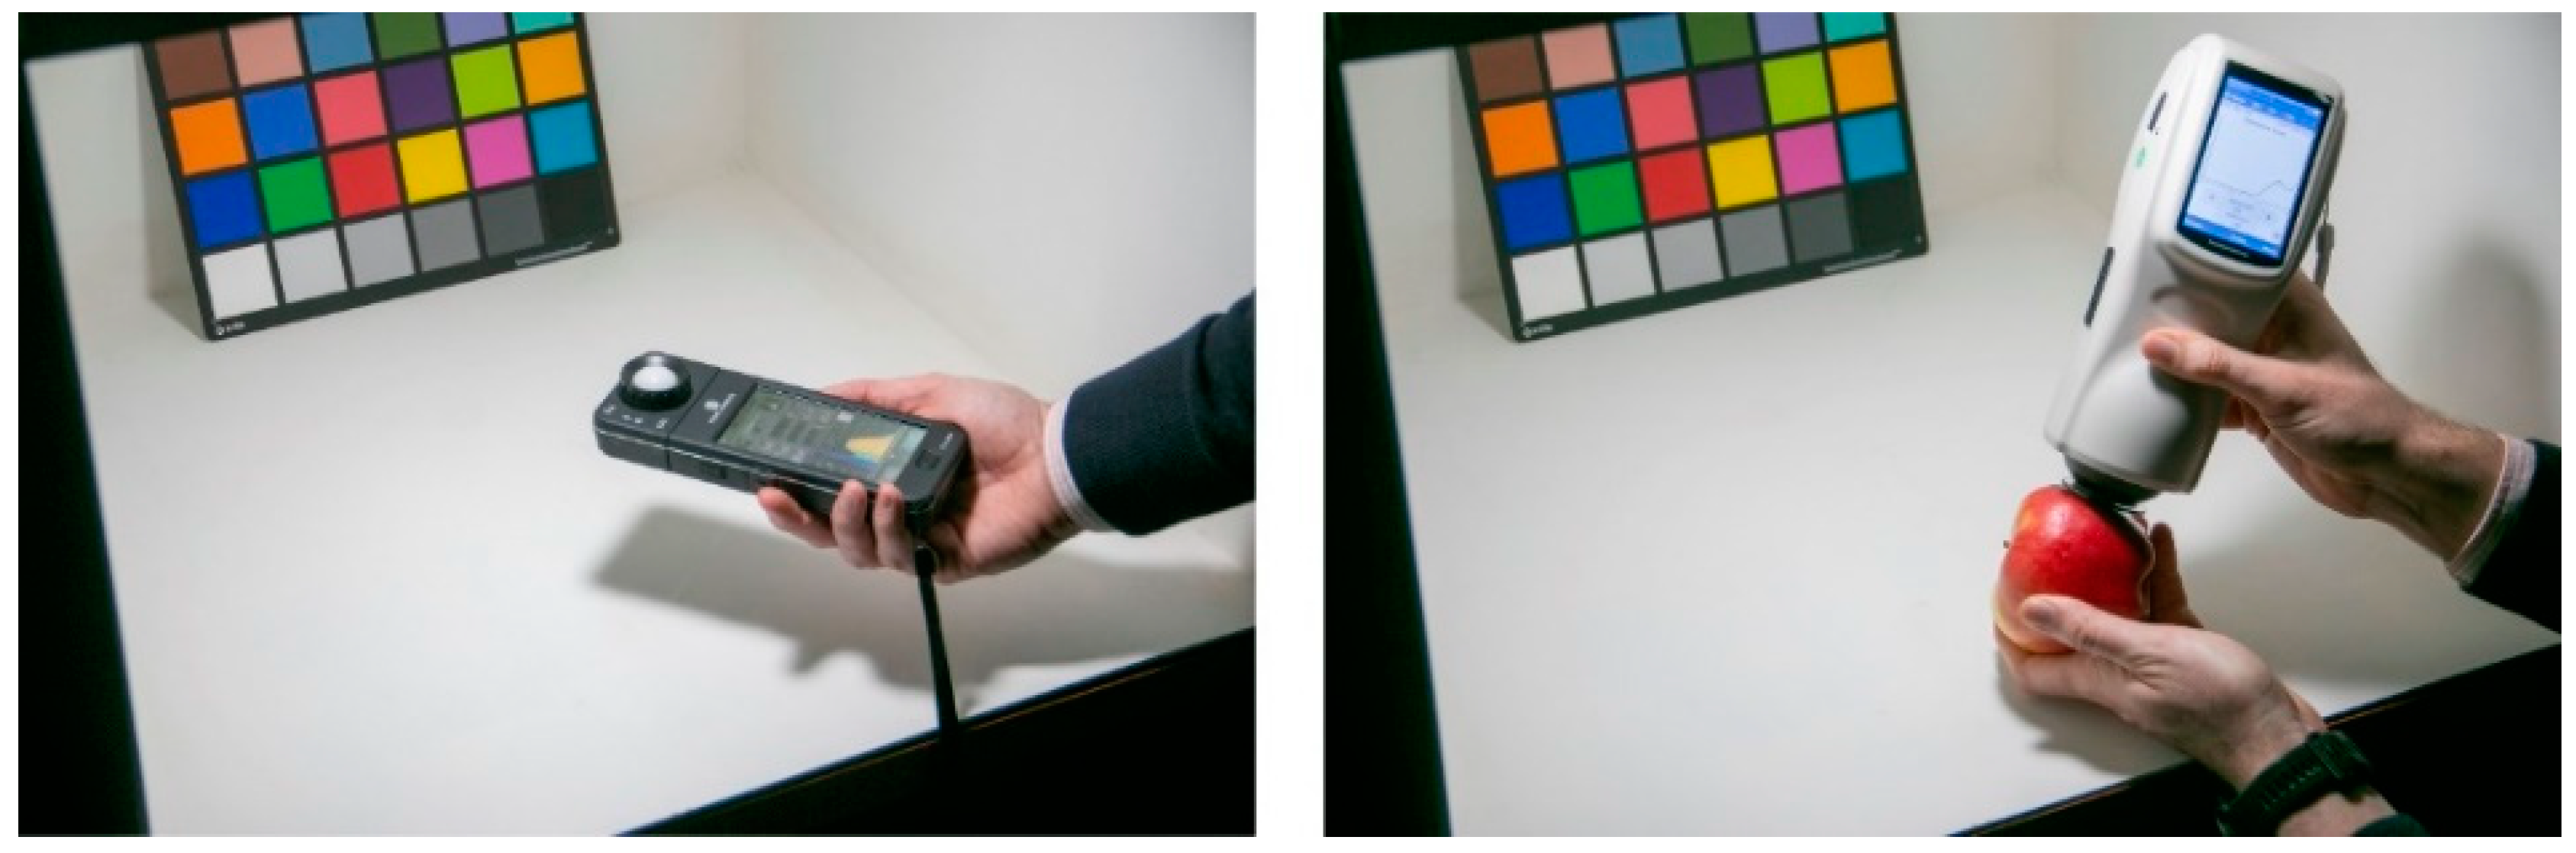
2.1. Light Source Testing Box

The assessment of the color discrimination is based on the analysis of 115 colorimetric surveys for 7 individual light sources, making a total of 805 surveys, where respondents answer questions on color rendition, color temperature perception, saturation of the samples and chromatic preference for two scenarios in a light source testing box. Figure 1 shows a flowchart that describes the methodology carried out in this research.
In addition, the participants also carry out a color discrimination exercise: the FM-100 trial, which consists in the arrangement of a selection of color samples based on similarity in hue. It measures the ability to isolate and organize color caps with small variations in the nuances of the hues. The color sample has constant values for luminosity and saturation, and the hues are selected from the Munsell color system. As described in the background, several previous studies [31,43] use the FM-100 trial to analyze the capability of a light source to render colors as well as the accuracy of proposed colorimetric metrics.
The survey sample is made up of 54 men and 61 women aged between 20 and 27 years old, all of them volunteer university students, since age significantly affects the decrease of the sensitivity of the short-wavelength photoreceptors [48]. Thus, it is assumed that the lens density of the retina is similar for all participants. Prior to the color discrimination test, the survey includes questions on visual impairment, confirming that all participants have suitably clear eyesight. To ensure there are no respondents suffering from color blindness, each survey includes a random Ishihara test [49,50], ensuring that all the analyzed surveys have been completed by participants with suitable color discrimination.
The light source testing box, seen in Figure 2, is made of white coated medium-density fiberboard (MDF) with inner dimensions of 60 cm wide by 60 cm deep by 60 cm high. The white paint has a constant reflectance of 89% from 700 to 430 nm, decreasing almost linearly from 430 to 400 nm up to a value close to 50%. The neutral appearance of the testing box aims to minimize the visual judgement closely related to the lit environment [51]. Six electric light sources are located in the top of the box, hidden by a white panel on the front of the box and an opal diffuser below the luminaire space. Therefore, avoiding any direct visualization of the lamp, a single-blind test can be developed to prevent any potential prejudice of the respondents. The lamps run along a guided tray in order to situate the analyzed light source exactly in the center of the testing box aided by magnetic stops. The luminous flux of the lamps is controlled by several dimmers in order to provide the same illuminance value in the testing box for all lamps, irrespective of their efficiency. Finally, the participants are placed in front of the test box, sitting 50 cm apart in natural daylight conditions or in an empty dark room with a constant temperature and humidity environment [52].

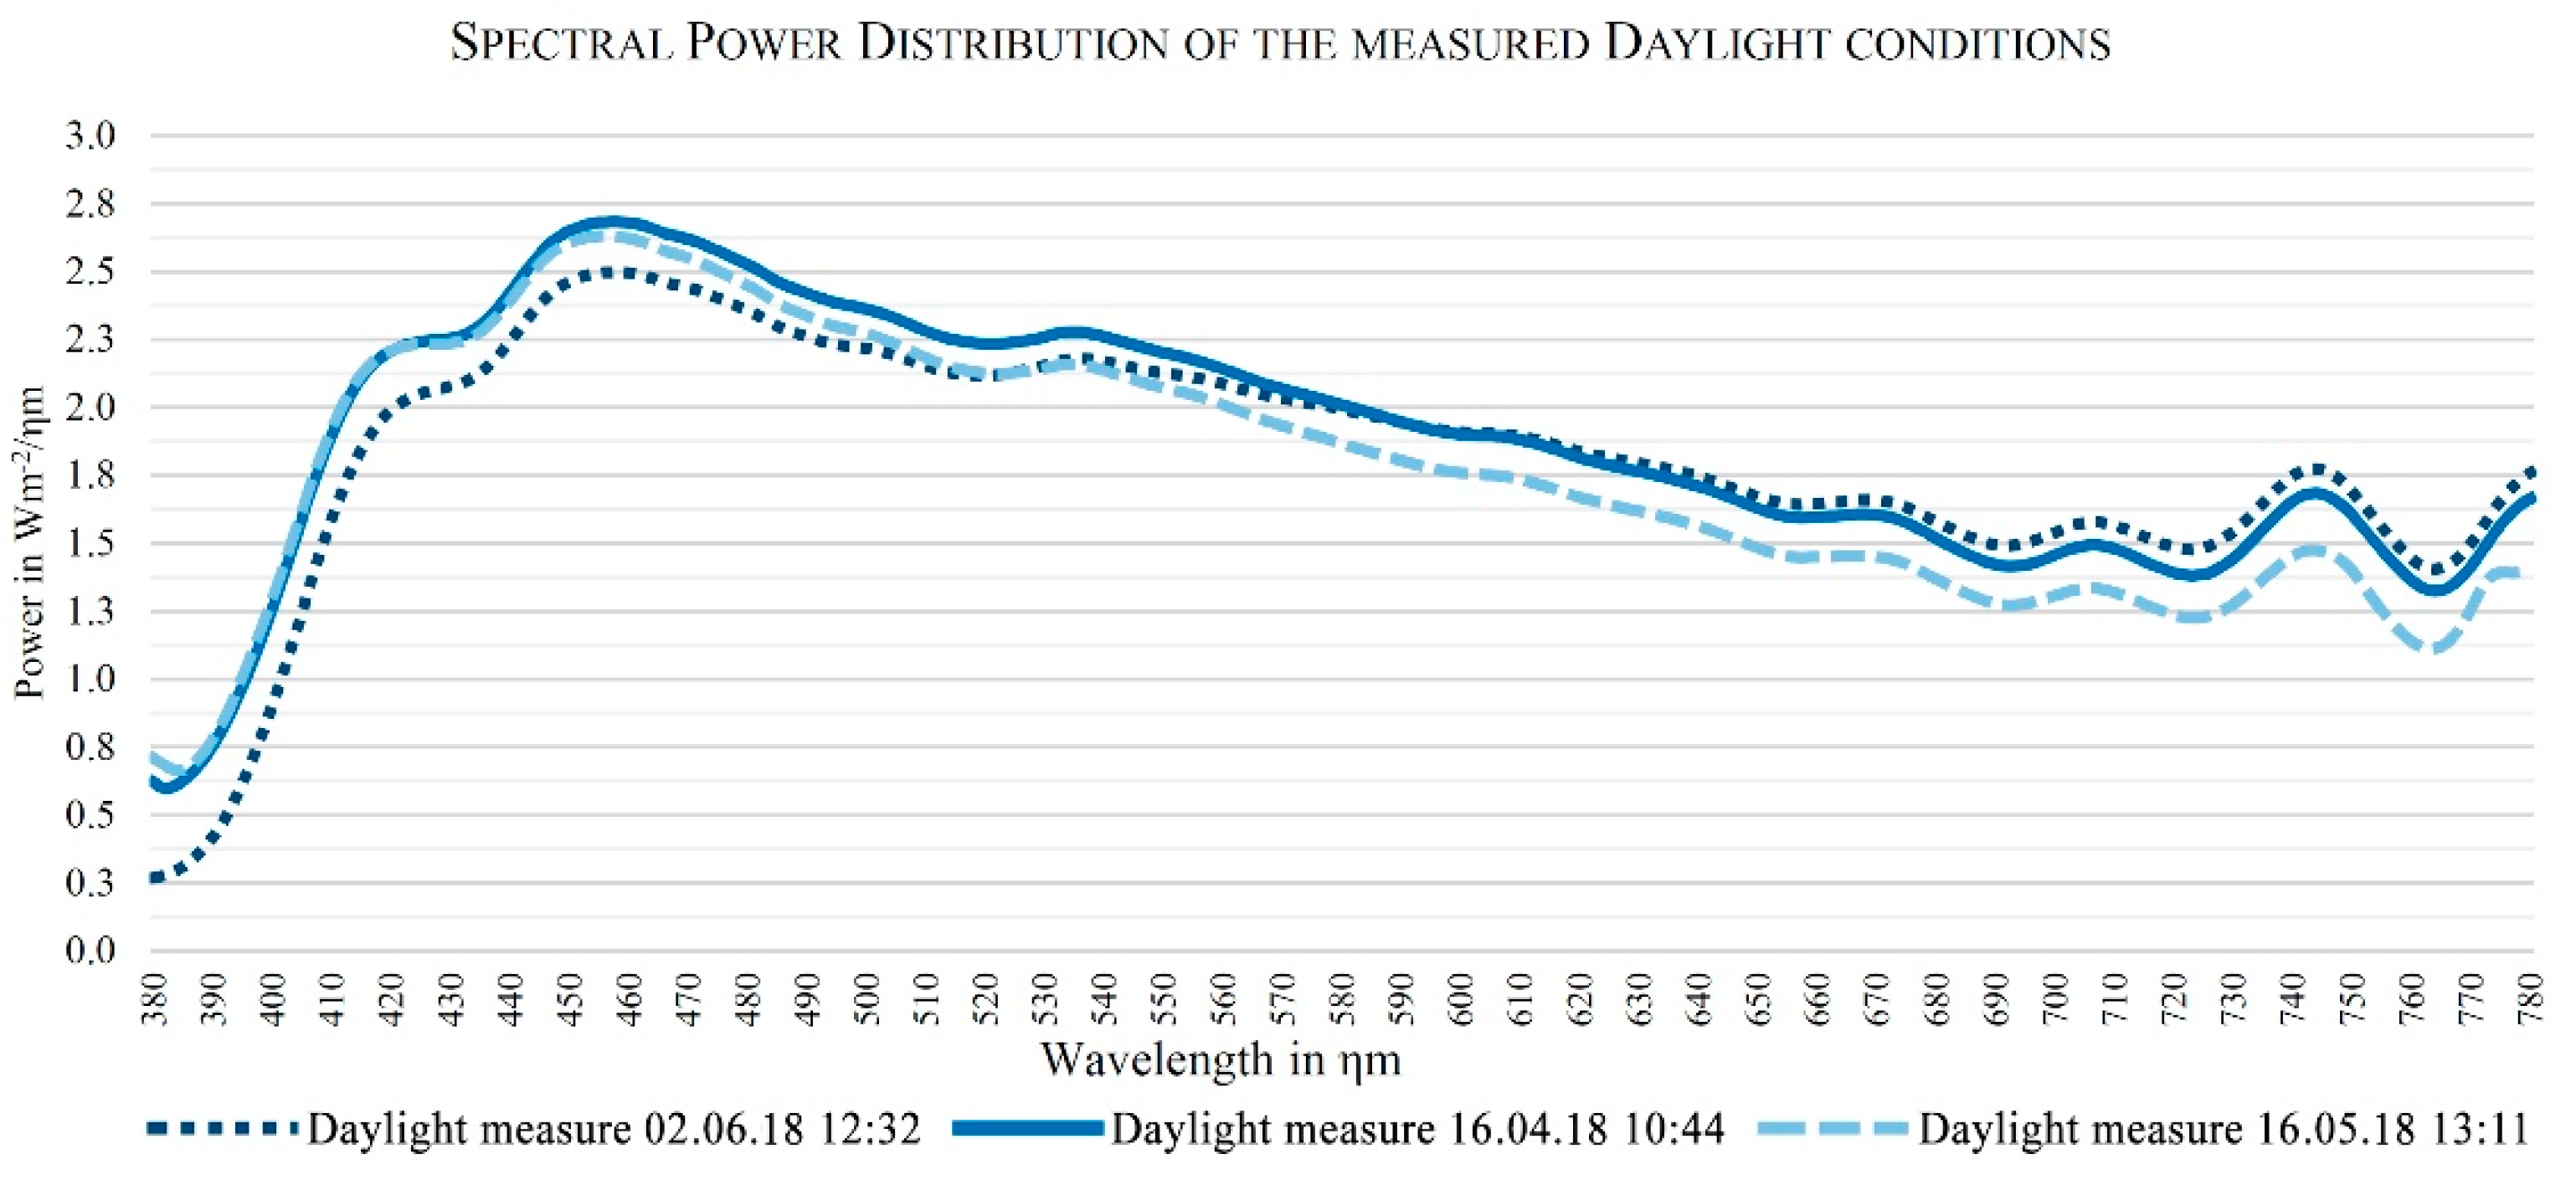
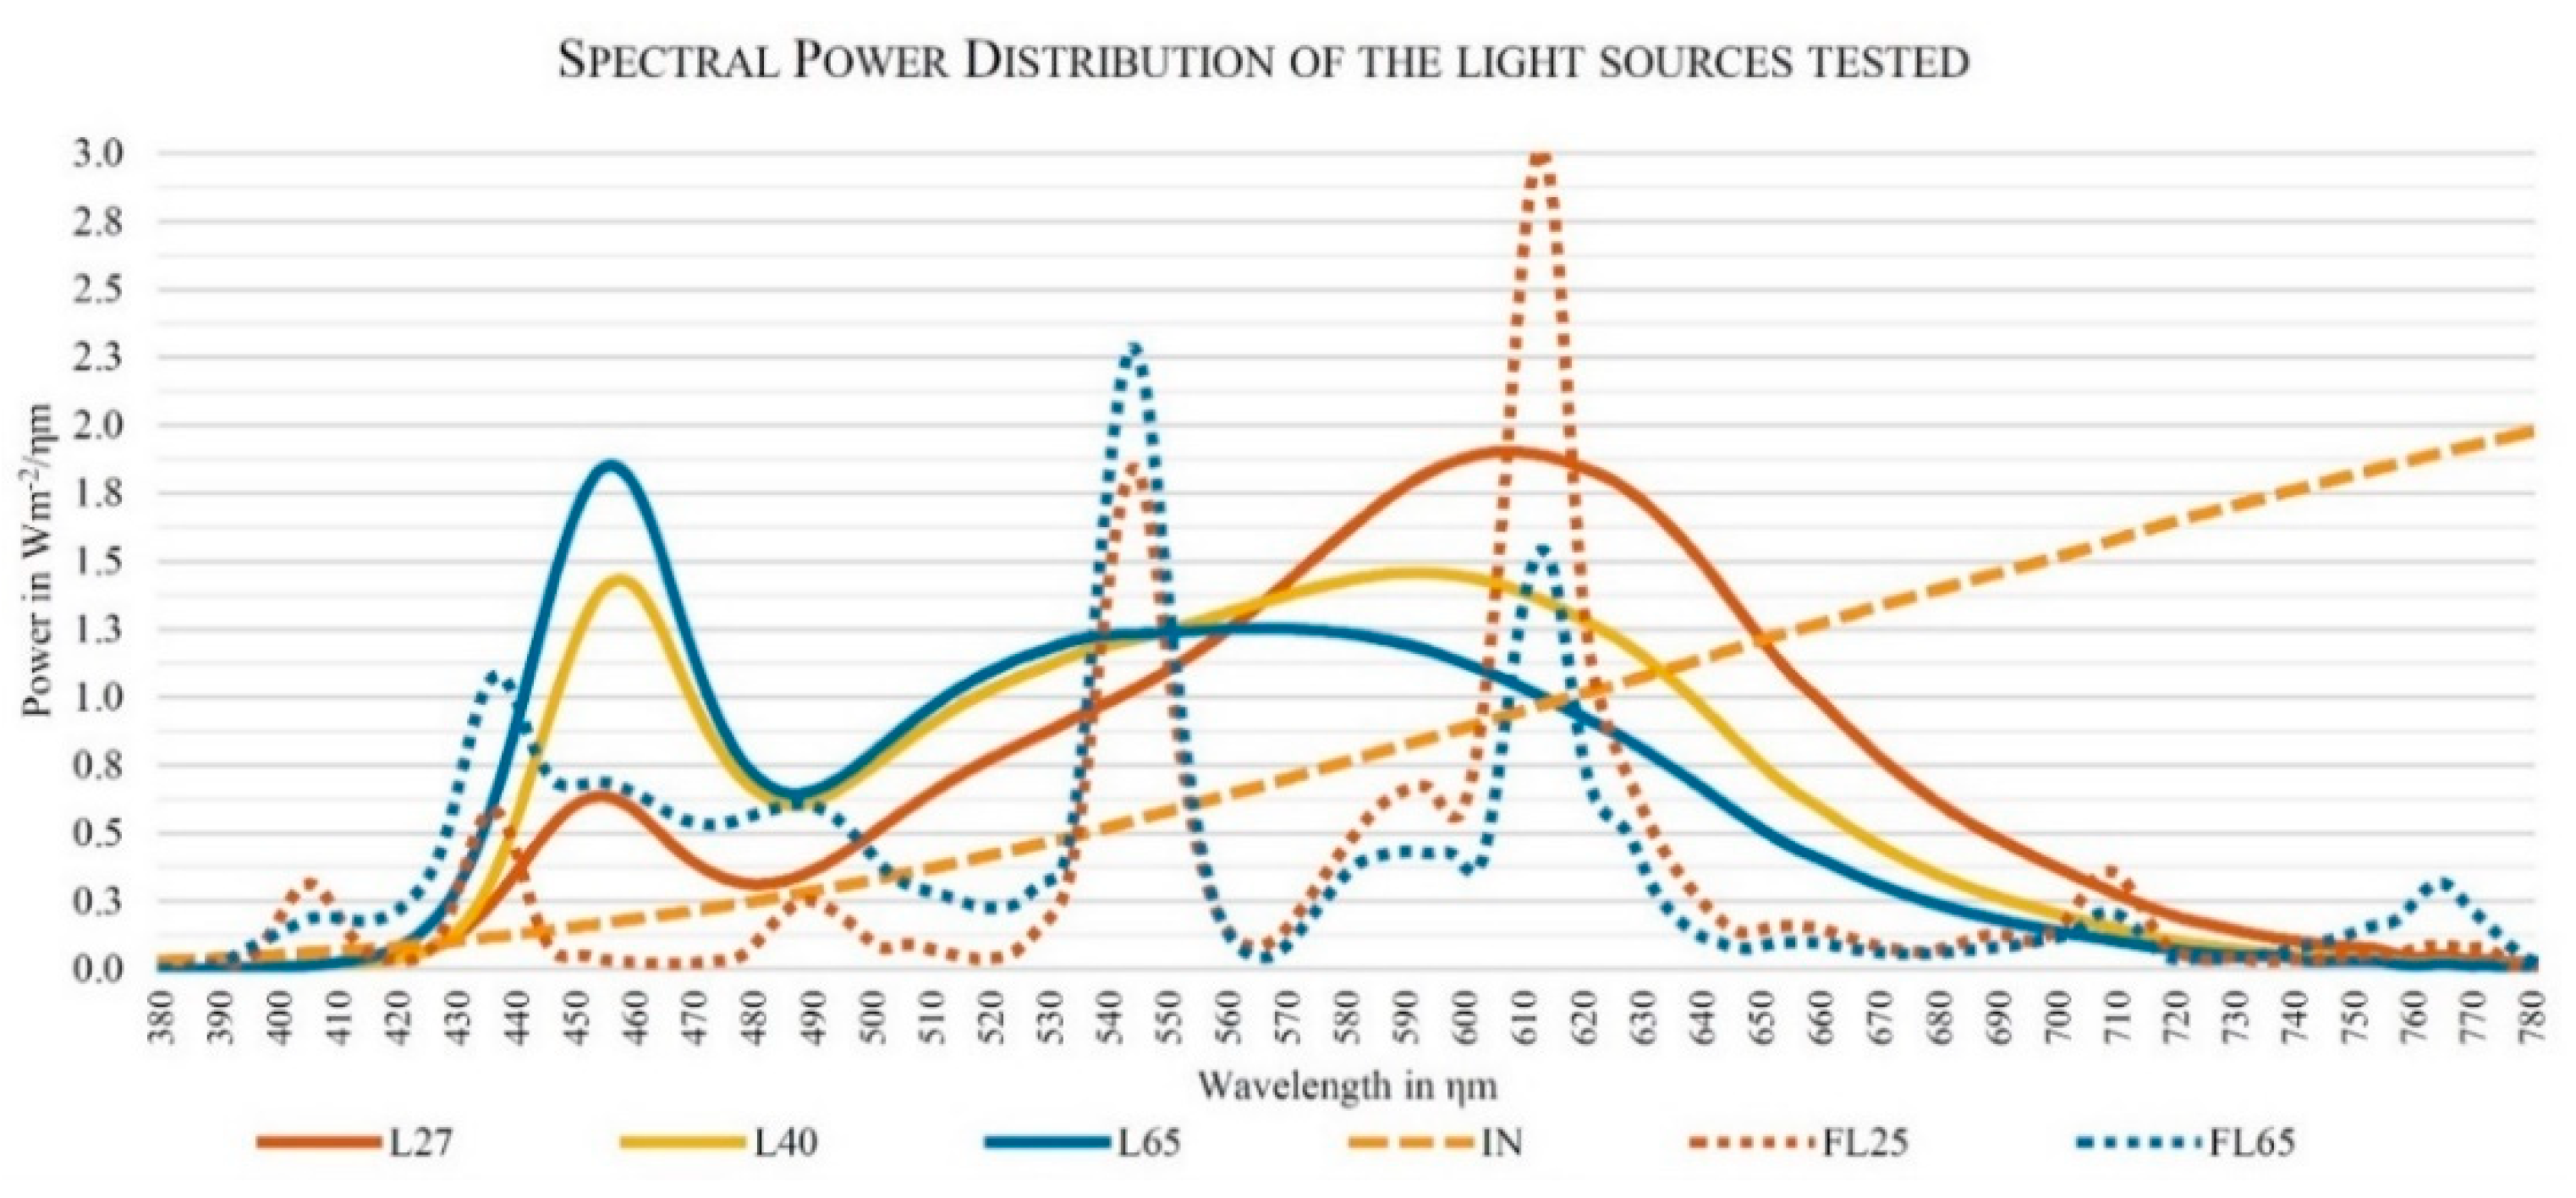
2.2. Light Sources Analyzed
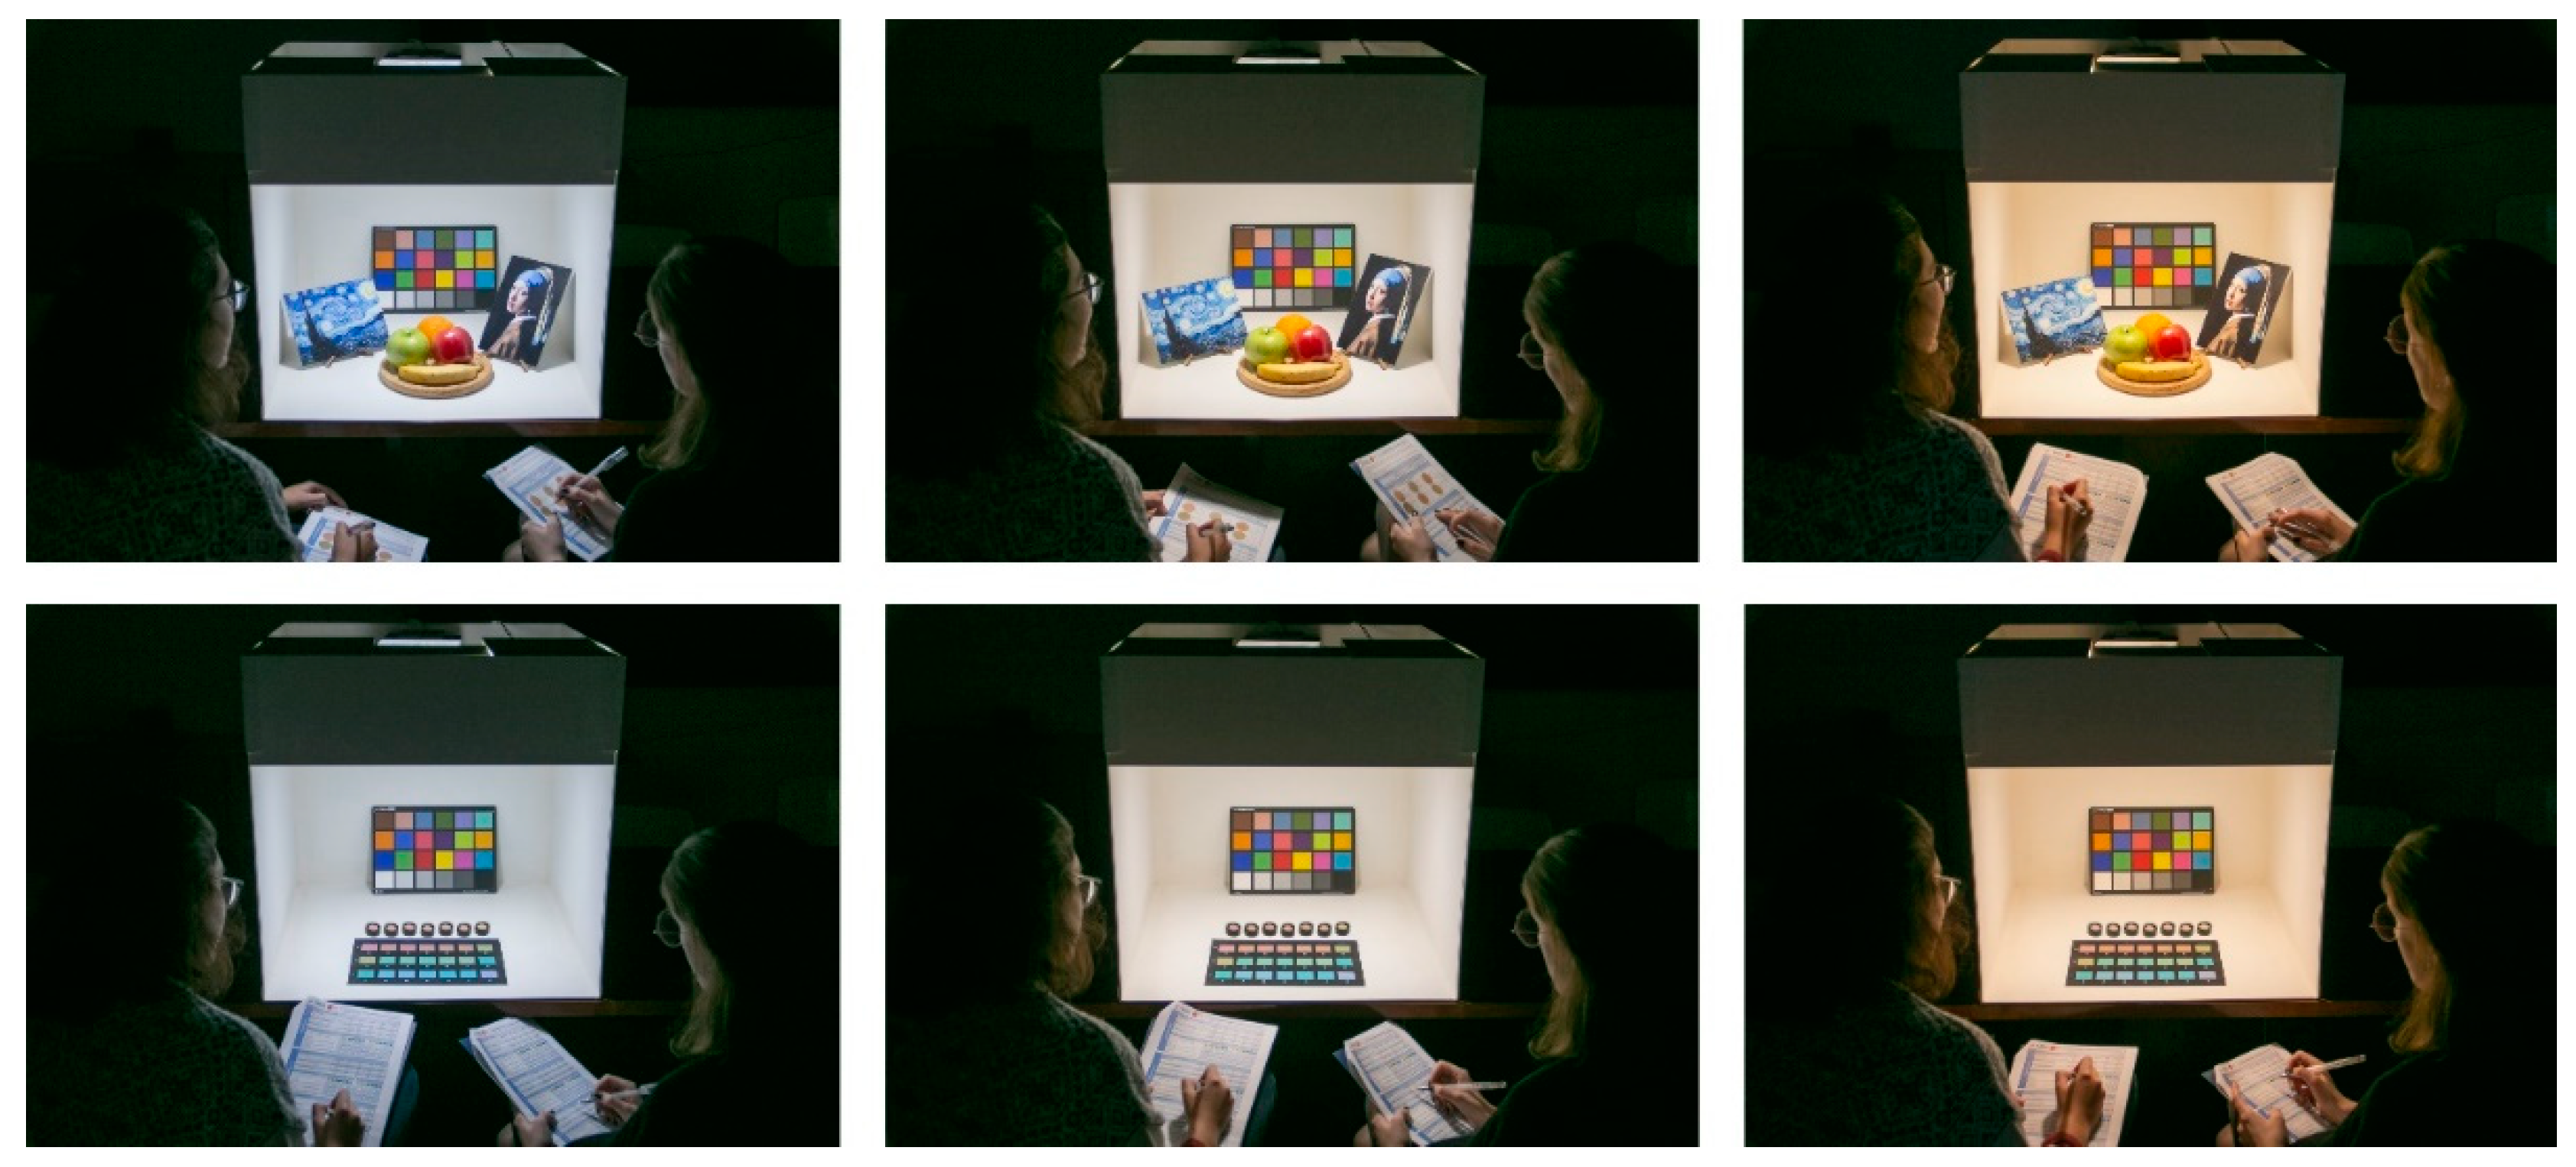
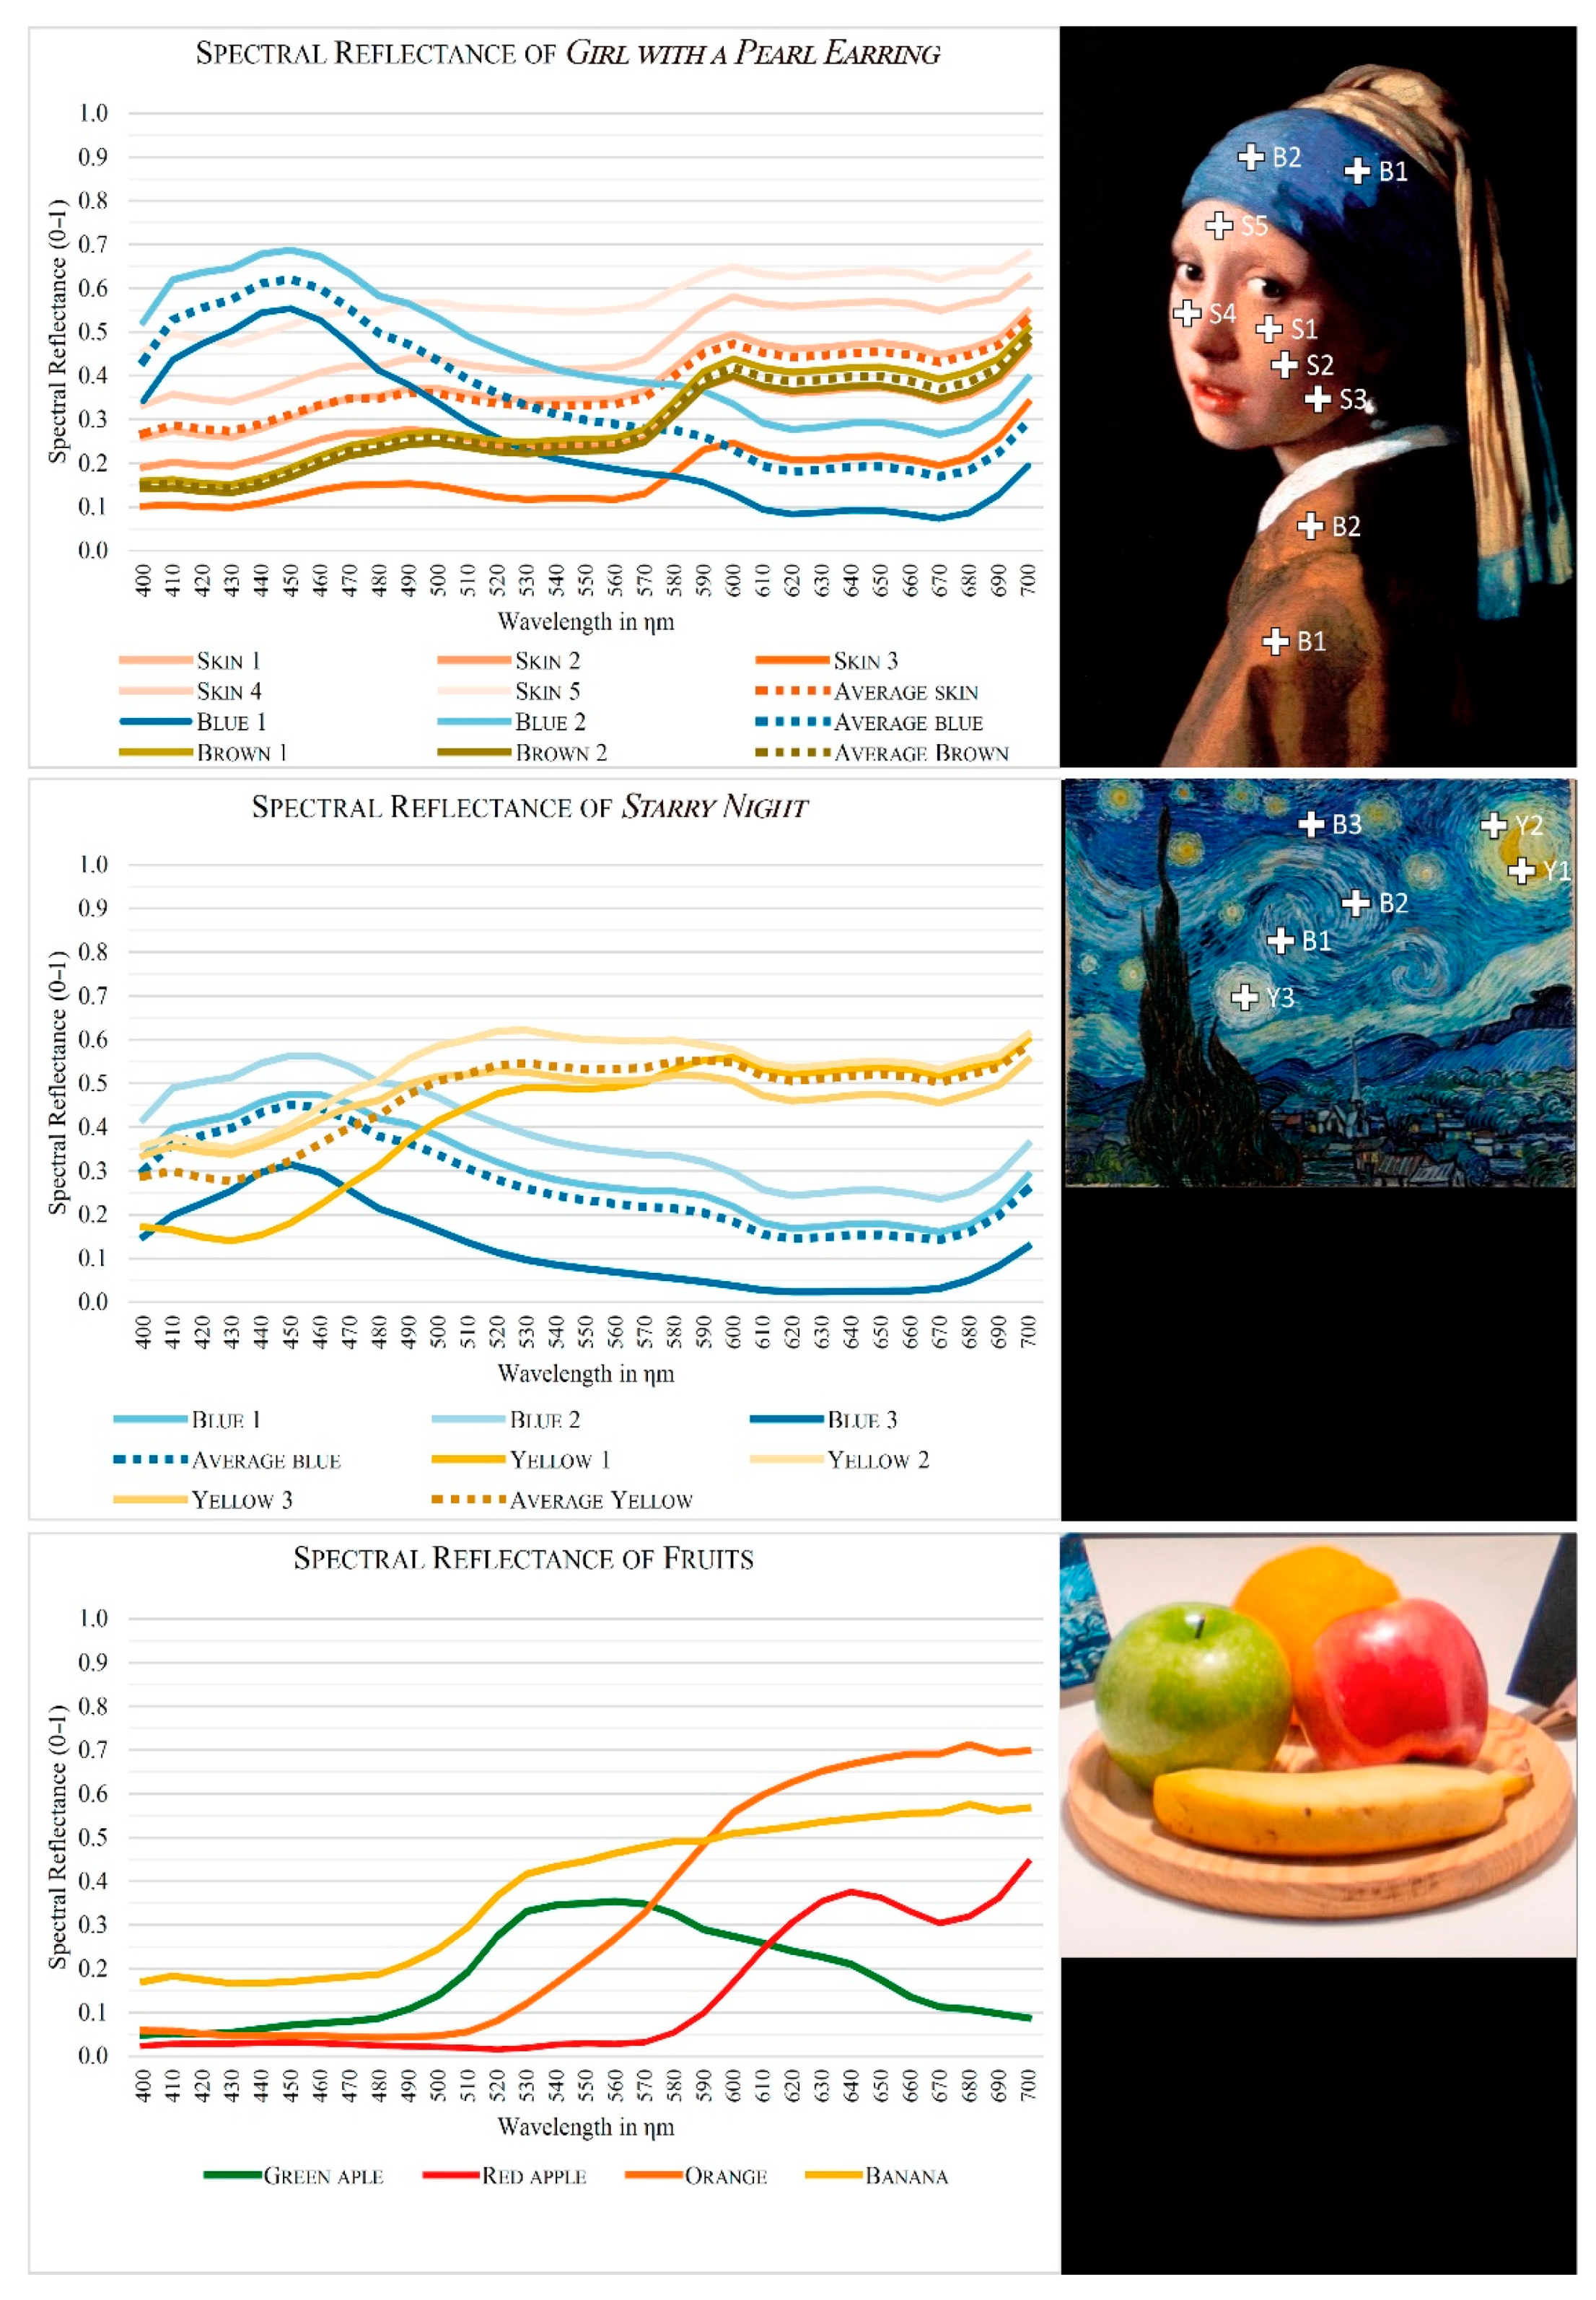
As seen in Figure 3, both the daylight conditions and the electric light sources located inside the testing box are measured using a Konica Minolta CL-70F spectrometer (Konica Minolta, Tokyo, Japan) in order to adjust the luminous flux to a constant value close to 500 lx. A PCE-CSM 8 reflectance spectrophotometer (PCE Instruments, Alicante, Spain) is used to determine the spectral reflectance of the color samples as well as the hue variation of the FM-100 color cards. Spectral resolutions of both equipment are listed in Table 1.
The first light source assessed corresponds to daylighting, with a variable CCT between 5500 and 6600 K, achieving a similar SPD to the standard spectrum D65. Daylight conditions were measured for a north orientation matching the typical sky conditions of spring and summer in Seville (southern Spain), the location where the trial is carried out. All tests were developed under daylight conditions avoiding direct solar incidence inside the testing box. Figure 4 represents the spectral measurements of daylight inside the testing box for three specific days during which the tests were carried out. As can be deduced, the short wavelength was affected by the spectral reflectance of the white paint, slightly reducing the power distribution of daylight from 380 to 430 nm.
In addition to daylight, six electric lamps were assessed by the participants in this study. In order to evaluate a wide range of luminaire types, three LED lamps—with a warm, neutral and cool CCT—are arranged in the testing box, together with an incandescent lamp and two compact fluorescent lamps with cool and warm CCTs. Figure 5 shows the SPDs for the lamps selected.
Neither the multi-channel LED lamps nor the high-pressure sodium-vapor and metal halide bulbs are evaluated in the testing box due to the limitations of the box dimensions, boot time and lower frequency of the application to indoor spaces. The main characteristics of the light sources tested, as well as the color rendition for most the metrics, are shown in Table 2.
In order to guarantee the single-blind test, the lamps are switched on at random to avoid participants identifying the luminaires based on their switch-on position. The time frame for evaluation of color perception is set to 60 s, while the interval for the FM-100 trial is 90 s long so that respondents have the same boundary conditions when assessing color preference and chromatic deviation.

2.3. Color Samples

The survey and test procedures are based on the perception and color discrimination deduced from several objects and scenarios contained in the testing box. On the one hand, two well-known examples of paintings—Girl with a Pearl Earring (1665, Johannes Vermeer) and The Starry Night (1889, Vincent van Gogh)—are used to represent the color preference on skin as well as cool hues. On the other hand, a second scenario with fruit shows warm and neutral hues, with red, orange, yellow and green as predominant, natural and recognized colors. The assessment of these scenarios also provides an approach to the respondents’ color preference, irrespective of the hue deviation or discrimination promoted by the studied light sources. Figure 6 shows the spectral reflectance measured with the reflectance spectrophotometer on the most representative color areas for both the paintings and fruits sample, highlighting the measured points and average results for skin, blue hues and brown in the case of Girl with a Pearl Earring and the blue and yellow hues in The Starry Night.
The second trial is based on the analysis of the FM-100 test, where respondents have to order caps with different hues according to their affinity with the color references. Seven different cap combinations were used for this study in order to ensure the single-blind test. Each FM trial shows three lines of hues, red, green and blue, corresponding to the sensitivity response of the color photoreceptors. Both FM caps and light sources were selected at random in each trial. These trials provide a subsequent objective quantification of the ability of a light source to discretize similar colors [31,44].

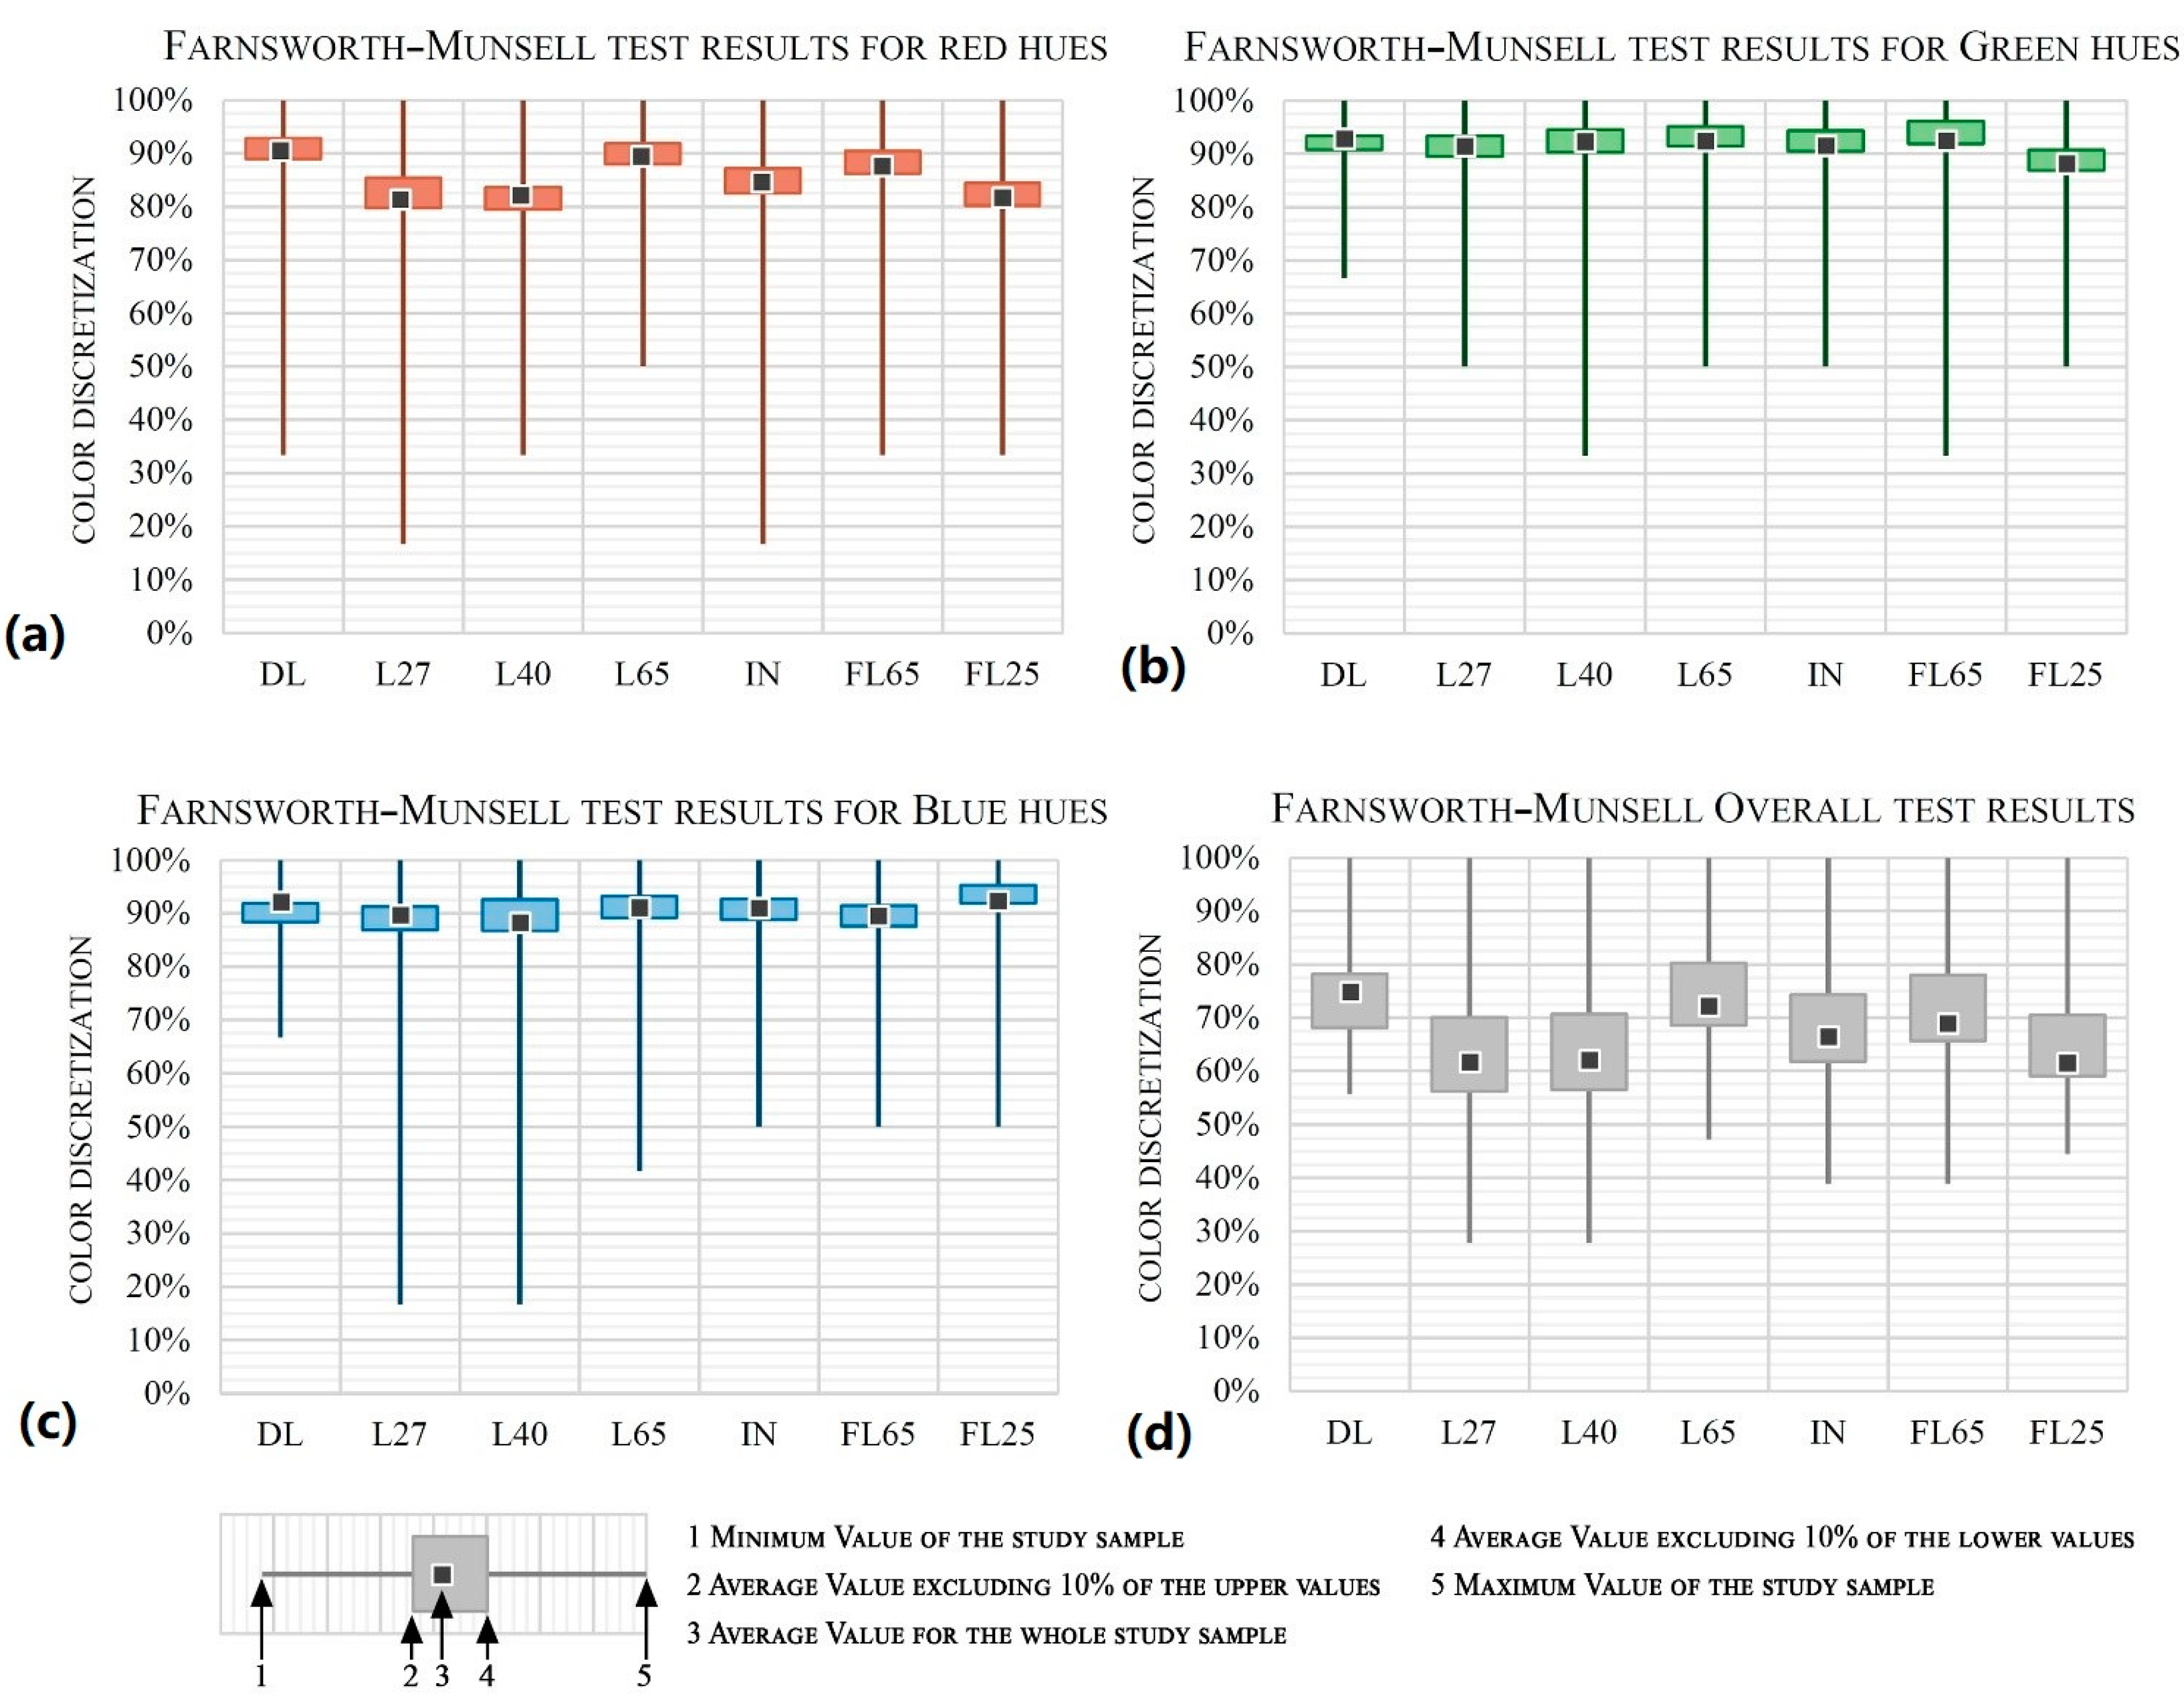
2.4. Quantification of the Results

Following the methodology described above, the color perception and discrimination of hues are assessed by means of surveys and tests. In order to quantify the color rendition, a value of 50% is given for a “sufficient” rendering, while a value of 100% is considered for an “excellent” performance. Accordingly, the rating values between both limits are determined linearly between 50 and 100%.
Moreover, assuming that daylight provides a perfect color rendering, as deduced from this study and previous ones [27,33], all scores obtained are modified according to the average score of natural light as Equation (1) states:
P i ( M O D ) ( % ) = P i · 100 P D L ( A V E )
where Pi(MOD) is the value of color rendering considered for the studied light source, Pi is the color rendering value obtained from the sample of surveys and PDL(AVE) is the average score of the color rendering of daylighting.
The analysis of the FM-100 trial requires a different approach to that described above. For this quantification, the method proposed by Esposito et al. [44] is applied, which depends on the number of transpositions of the color caps. Accordingly, a light source causing an arrangement of one transposition in the FM-100 trial would be attributed with an error score of 4, while two transpositions correspond to an error of 8, three transpositions to a score of 12 and so on. The total error score corresponds to the sum of all tray-specific scores, as deduced from Equation (2):
R d = i = 1 n R d , i
where Rd is the score that corresponds to the number of transpositions measured for each tray in the FM-100 trial. The score obtained will be translated into a percentile value from 0 to 100%.

3. Analysis of Results

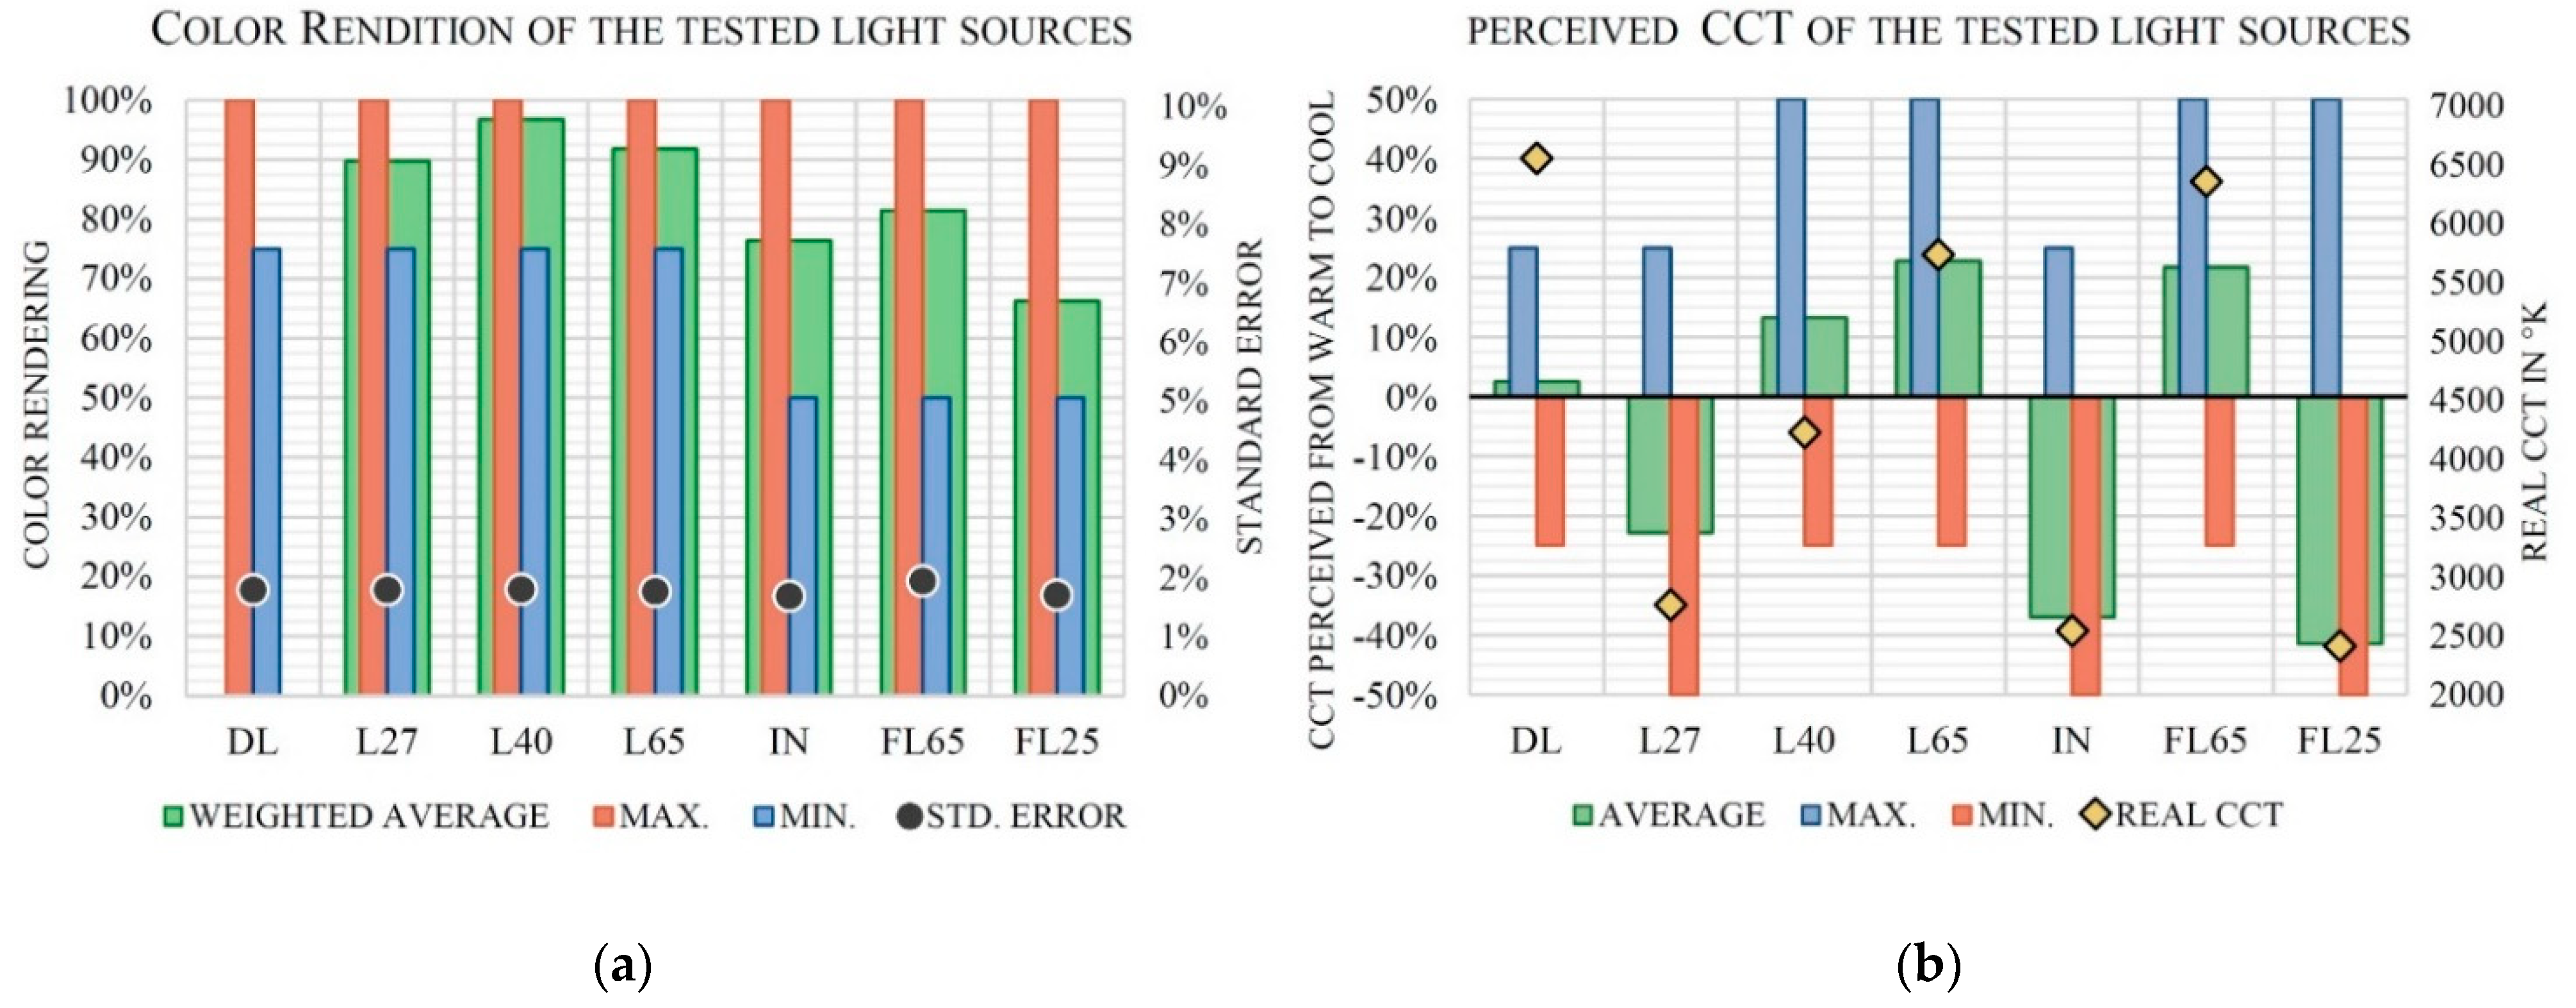
3.1. Color Rendering of the Light Sources

According to the results obtained from the surveys and following the methodology described above, the subjective perception of the color rendition allowed by the tested light sources is shown in Figure 7a, representing the maximum and minimum values as well as the average results weighted depending on the maximum score provided to daylight. The standard error is also shown on the secondary vertical axis.
It should be noted that the subjective color renditions do not necessarily have to correspond to the quantification of color rendering as understood by current metrics, since the subjective preference of the respondent can affect the final score. As deduced from Figure 7a, the standard error of the results obtained for all light sources was between 1.7 and 1.9%, including daylight (DL), with an average score of 1.8%. This deviation is considered sufficient to address the color rendition defined by the subjective perception of the respondents. It should be noted that this study was limited by the scenarios proposed so that conclusions cannot be applied universally.
In addition, Figure 7b shows the perceived CCT of the 7 tested light sources, defining maximum, minimum and average scores from very warm lamps (−50%) to very cool lamps (+50%), considering 0% a perfect neutral appearance of the color temperature. The real CCT value is also shown on the secondary vertical axis.
As expected, daylight (DL) gives the maximum color rendition, followed by the neutral white LED lamp (L40), which shows a performance of 97%. The cool (L65) and warm (L27) LED luminaires obtain scores of 92 and 90%, respectively. It can be deduced that the tested LED sources provide a higher color rendering than the rest of the lamps, with an average score of 93%. Moreover, it is worth noting that the incandescent lamp (IN) does not achieve a perfect color performance as defined by most of the metrics. Finally, it can also be deduced that, according to the studied scenarios, the cool fluorescent lamp (FL65) allows a rendition of 81%, while the warm fluorescent lamp (FL25) provides a lower performance, with a score of 66%.
It should be highlighted that cool light sources—with a CCT between 4200 and 6500 K—provide a better subjective color rendition for the studied scenarios than warm sources—with a CCT between 2400 and 2700 K, achieving an increase of 18% in the color performance of the scenarios presented.
As deduced from the perceived CCT, shown in Figure 7b, there is a slight correlation—R2 equal to 0.432—between this characteristic and the color rendition of the tested light sources. Accordingly, except for the warm white LED (L27), the subjective color performance is higher for neutral and cool lamps. Some divergences are also observed between the color temperature perceived by the respondents and the real CCT value; in the particular case of daylight (DL), the respondents perceived the natural lighting of the sample as neutral, despite the fact that the CCT is higher than in the rest of the studied sources and the illuminance values were similar for all tests.

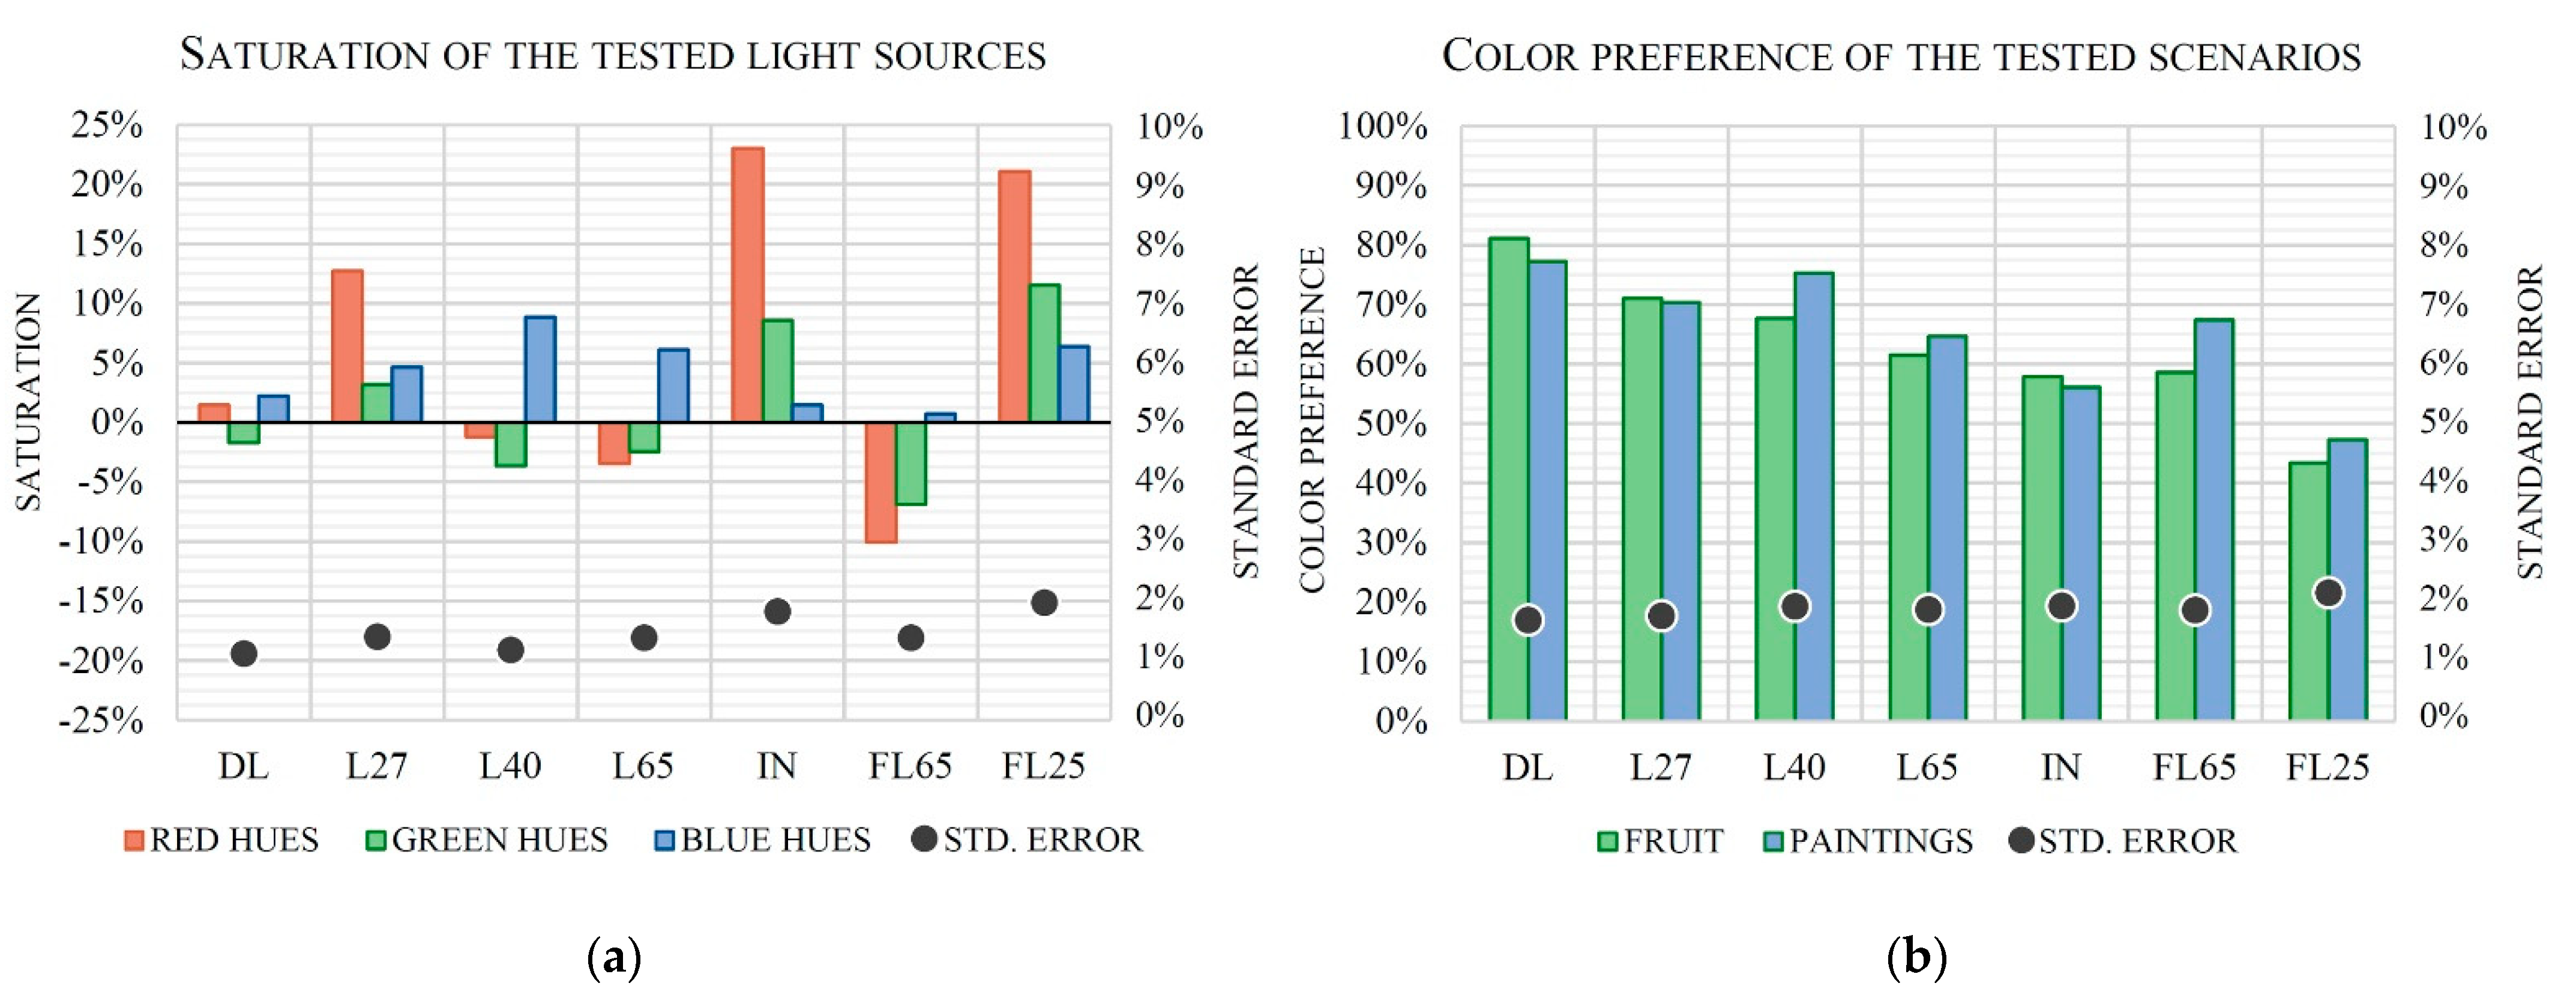
3.2. Color Saturation and Preference of the Light Sources

According to the procedure described above, the saturation of hues and the color preference of two scenarios are assessed according to the subjective perception of the respondents. Figure 8a shows the average scores of the saturation of red, green and blue hues, from non-saturated (−50%) to very saturated (+50%), considering a suitable appearance for a value of 0%. The graph also defines the standard error on the secondary vertical axis, showing a value between 1.1 and 2.0%, with an average score of 1.5%.
Moreover, Figure 8b represents the preference of the respondents with respect to the color appearance of the scenarios under study, previously defined in Figure 6: a set of fruits with different predominant colors and two paintings representing blues, yellows, browns and skin hues.
With respect to color saturation and as deduced from Figure 8a, the incandescent lamp (IN) produced a higher saturation for red hues, followed by the warm white fluorescent lamp (FL25) and the warm LED (L27). However, it is worth noting that cool lights, such as in the case of daylight (DL) and cool LED (L65), barely affected the saturation of colors. Looking for correlation, it can be observed that there is a strong relationship between the CCT of the luminaire and its ability to saturate red and green hues—R2 of 0.961 and of 0.924, respectively—while the saturation of blues does not depend on the color temperature of the source—R2 of 0.004. Accordingly, considering the boundary conditions of this study, it can be assumed that warm light sources increase the saturation of red and green hues, while cool lights do not have a perceptible impact on color saturation for any hue.
Following the previous analysis, it can also be observed that there is a perceptible relationship between the balance of color saturation and the subjective color rendition, comparing the standard deviations of the hue saturation for each tested lamp and the color rendering shown in Figure 7a, with a coefficient of determination of 0.447.
In discussions on the color preference of the tested scenarios, shown in Figure 8b, the response of the participants is deduced from the most subjective study, despite the fact that the standard error is between 1.7 and 2.2% with an average value of 1.9%. A high correlation can be observed between the color preference and the subjective rendering of the light sources, providing similar R2 values of 0.838 for the set of fruits and of 0.893 for the paintings. Therefore, it can be concluded that there is a clear relationship between color rendering and color preference for the scenarios presented. It can also be observed that, with the exception of natural light (DL), neutral LED (L40) allows the most appropriate perception for both scenarios, even though according to the same respondents, cool LED (L65) provides a better balance of color saturation. Therefore, it can be concluded that a better saturation balance does not necessarily imply a more pleasant perception. It should be also noted that, following the conclusions of previous studies [37], the CCT has a noticeable impact on color preference. In fact, cooler lamps produce a higher preference in paintings, while warmer light sources, with the exception of fluorescent lamps (FL25), improve the preference in the case of the set of fruits.

3.3. Color Discrimination Provided by the Light Sources

This final trial assesses the color discrimination allowed by the studied light sources according to the FM-100 caps described in the methodology.
Figure 9 shows the results of the FM-100 trial for the 115 respondents, as seen in Figure 9a: red hues; Figure 9b: green hues; Figure 9c: blue hues and Figure 9d: overall results. The score for all tests were determined using the method developed by Esposito et al. [44], as described above. In order to provide a clear perception of the color discrimination defined by the participants in this study, Figure 9 defines the minimum, average and maximum score for each tested light source as well as the average values excluding 10% of both the upper and lower results of the respondents.
In accordance with the results shown in Figure 9, daylight (DL) produces the best color discrimination for all color ranges, defining an average score of 0.91 and an accumulated score seen in Figure 9d of 0.74. The highest minimum score is also seen for daylight, with the exception of red hues. Accordingly, it can be supposed that a wide spectral distribution and a CCT close to that produced by daylight conditions stimulate a better color discrimination.
It can also be noted that, with the exception of daylight (DL), the cool LED (L65) and the cool fluorescent lamp (FL65) provide the best color discrimination, with an average score of 0.91 and 0.90 and an accumulated score of 0.72 and 0.69, respectively. It should be emphasized that both sources have a CCT and a GAI D65 value close to that defined for DL—as seen in Table 2—so that, according to the scenarios studied, the closer the Gamut Area Index to daylight, the better the color discrimination.
As seen in Figure 9a, warm light sources, such as LED (L27), incandescent (IN) and fluorescent lamps (FL25), result in a poorer discrimination for red caps, giving an average score of 0.82, while cool light sources provide 0.89. Accordingly, and as shown in Figure 8a, the light sources which provide a higher red saturation also have a low capacity for color discrimination. A similar deduction, with a lesser difference, can be observed for green hues, where the average score for warm lights is 0.90 in comparison with the score for cool lights, which is 0.92. The opposite occurs for blue trays, where warm lamps produce a slightly better discrimination than cool light sources. Therefore, it can be assumed that a low saturation of color provides better color discrimination.
It is worth noting that, as seen in the previous section and as deduced from Figure 9d, cool lamps produce a balanced color saturation and a color discrimination suitable for all color ranges, unlike warm light sources, which saturate red hues and give a slightly poorer discrimination for red and green trays. However, as deduced from Figure 8b, it is interesting to note that the respondents have a preference for neutral LED (L40) in the case of the scenarios studied—set of fruits and paintings—despite the fact that such a source does not provide as good a color discrimination as cool lamps. Therefore, as defined by previous studies [27,28,31,44], good subjective color rendering does not guarantee a suitable color discrimination.

3.4. Adequacy of the Main Metrics with Color Discrimination

This final section focuses on the analysis of the relationship between the main current color rendition metrics and the different light sources under study, using parameters of color discrimination, subjective color rendition and color preference, as seen in Table 3. Prior to the development of this analysis, it must be highlighted that most of the presented metrics are focused on the accurate quantification of the color rendering, hence a low correlation with hue discrimination could be expected.

4. Discussion

In general, it was observed that in this context there is no clear correspondence between the color discrimination through the FM-100 trial and most of the current metrics under study, except for the case of GAI D65 (moderated association) and DSI (low association).
The individual analysis per metric shows that, given the boundary conditions of this study, CRI Ra does not achieve a relevant linear correlation with color discrimination, subjective color rendition or color preference. This further confirms its obsolescence as a reliable metric. In the case of GAI, when this metric is applied using the CRI parameters, it obtains a medium-moderated association for subjective color rendition, although it is not of use as a suitable indicator for color discrimination. However, when GAI is applied using daylight as a reference (GAI D65), it shows a remarkable general value of color discrimination and deviation of color saturation, allowing an optimal quantification of color discrimination through FM-100 trials, so it can be used as a complementary metric for this purpose.
In addition, during this analysis the CQS metric has proved to be an accurate tool for determining the color rendering of LED sources both phosphorous and multi-channel based [41], although it does not allow an accurate determination of color discrimination in the scenarios studied. Moreover, the analysis of TM-30-20 procedure, similar to its 2015 edition [44], shows that it is not really representative as a tool for adequate color discrimination, although it is of use as a highly accurate method for determining color rendering, as demonstrated in previous studies [39] and Table 3. With respect to color preference, TM-30-20 can serve as a quantification for this but requires a readjustment of both the general color fidelity index (Rf) and the Gamux index (Rg) [35] for this purpose.
Finally, the DSI metric shows a medium correlation with color discrimination. This high linear relationship can be expected, since this metric determines the affinity of daylight SPD, which corresponds to a broad spectrum, with the light source studied as a function of the spectral sensitivity curves (L, M and S), which have a high correspondence with the studied color ranges (red, green and blue). It should be also noted that DSI provides a suitable quantification of color preference for both scenarios studied, so it can be a useful tool for determining user preferences according to specific contexts, as deduced in previous studies [53].

5. Conclusions

In the current context of colorimetry, it is necessary to adapt the color rendition metrics to new lighting technologies. The constant scientific evolution in this field requires the alignment of the published indicators as well as their adaptation to the current colorimetric requirements of the most common light sources available in the market in industry, engineering, urban design or architecture, both for determining color rendering and hue deviation. In this context, the aim of this research is especially focused on the usefulness of the different metrics on their performance with respect to color discrimination, taking into account other related parameters such as color temperature or gamut saturation.
It should be noted that the conclusions shown below are based on specific boundary conditions, such as two-color scenarios and a range of color caps for the FM-100 trial, with the participation of 115 respondents and the analysis of 805 surveys.
This article shows how, as expected, daylight (DL) provides the maximum color rendering, followed by neutral white (L40), cool (L65) and warm (L27) LED sources. With a lower color rendering, this is followed by cool fluorescent (FL65), incandescent (IN) and warm fluorescent (FL25) lamps. As can be concluded from the previous assertion, cool light sources—with a CCT between 4200 and 6500 K—provide better color reproduction for the scenarios studied than warm sources, with a CCT between 2400 and 2700 K.
As the analysis of the results shows, there is a strong relationship between the CCT of the lamp and its ability to saturate different ranges of color. Specifically, warm light sources produce an increase in the saturation of red and green tones, while cool lights do not produce a noticeable impact on the color saturation in any of the hues studied. Following these results, there is a perceptible relationship between the balance of color saturation and the perception of subjective color rendition, concluding that the better the balance of saturation, the higher the color rendition.
When further exploring the relationship between color rendering and color preference, there is a clear correlation between them for the two scenarios presented in this study. Both daylight (DL) and neutral LED (L40) provide a higher preference perception for both scenarios compared to the other sources studied, despite the fact that cool LED (L65) gives a better balance of color saturation in comparison with the aforementioned LED source. It should also be emphasized that DSI can serve as a suitable indicator for quantifying color preference, as can be deduced from its coefficient of determination with respect to the results obtained from the surveys.
It can also be noted that, with the exception of daylight (DL), the cool LED (L65) and the cool fluorescent lamp (FL65) provide the best color discrimination, with an average score of 0.91 and 0.90 and an accumulated score of 0.72 and 0.69, respectively. It should be emphasized that both sources have a CCT and a GAI D65 score close to that defined for DL—as seen in Table 2—so that, in accordance with the scenarios studied, the closer the color temperature to daylight, the better the color discrimination. It has also been observed that low color saturation provides better color discrimination while good subjective color reproduction does not necessarily mean adequate color discrimination.
In accordance with the usefulness of the color rendering metrics for determining hue discrimination, it can be seen that GAI D65 is a better tool for quantifying the ability to distinguish colors. The picture that emerges from this analysis is that, despite the fact that TM-30-20 has demonstrated excellent accuracy in determining color rendering, this procedure could be complemented with other metrics given its lower fit to the obtained results in other aspects, such as DSI for color preference or GAI D65 for hue discrimination, providing a wider description of the chromatic qualities of a light source. By contrast, CRI Ra did not achieve an appropriate fit to the results of the tests, which could confirm its obsolescence as a reliable metric.

Author Contributions

Conceptualization, I.A. and P.B.; methodology, P.B. and M.A.C.; formal analysis, P.B. and I.A.; investigation, P.B., I.A., J.L. and M.A.C.; data curation, P.B.; writing—original draft preparation, I.A. and P.B.; writing—review and editing, M.A.C.; visualization, M.A.C.; supervision, P.B.; funding acquisition, I.A. All authors have read and agreed to the published version of the manuscript.

Funding

The results presented were funded by the research project CHRONOLIGHT: Biodynamic wide spectrum lighting for biological chronoregulation and pathogens neutralization in hospital facilities (Ref PID2020-117563RB-I00), funded by MCIN/ AEI /10.13039/501100011033 and supported by DYNALIGHT: Efficient design for biodynamic lighting to promote the circadian rhythm in shift work centers (Ref BIA2017-86997-R) The authors wish to express their thanks for all the technical and financial support provided, including from the research project CARELight_Lite: Biodynamic lighting for circadian rhythm regulation of healthcare personnel in Pediatric Intensive Care Units (Ref PI-0136-2019) funded by the Junta de Andalucía.

Institutional Review Board Statement

Not applicable.

Informed Consent Statement

Not applicable.

Data Availability Statement

Not applicable.

Acknowledgments

The authors would like to thank the Agencia Estatal de Investigación (AEI) and the Ministerio de Ciencia e Innovación (MCIN) of the Government of Spain as well as the Junta de Andalucía. In addition, the authors are grateful to all those who collaborated in this research project, especially Blas de Lezo for encouraging this article.

Conflicts of Interest

The authors declare no conflict of interest.

References

  1. Acosta, I.; Campano, M.; Domínguez-Amarillo, S.; Muñoz, C. Dynamic Daylight Metrics for Electricity Savings in Offices: Window Size and Climate Smart Lighting Management. Energies 2018, 11, 3143. [Google Scholar] [CrossRef] [Green Version]
  2. Lin, Y.; Wei, M.; Smet, K.; Tsukitani, A.; Bodrogi, P.; Khanh, T. Colour preference varies with lighting application. Light. Res. Technol. 2015, 49, 316–328. [Google Scholar] [CrossRef]
  3. Acosta, I.; Campano, M.; Domínguez, S.; Fernández-Agüera, J. Minimum Daylight Autonomy: A New Concept to Link Daylight Dynamic Metrics with Daylight Factors. LEUKOS J. Illum. Eng. Soc. N. Am. 2019, 15, 251–269. [Google Scholar] [CrossRef]
  4. Bellia, L.; Acosta, I.; Campano, M.; Fragliasso, F. Impact of daylight saving time on lighting energy consumption and on the biological clock for occupants in office buildings. Sol. Energy 2020, 211, 1347–1364. [Google Scholar] [CrossRef]
  5. Acosta, I.; Leslie, R.; Figueiro, M. Analysis of circadian stimulus allowed by daylighting in hospital rooms. Light. Res. Technol. 2016, 49, 49–61. [Google Scholar] [CrossRef]
  6. Bellia, L.; Spada, G.; Pedace, A.; Fragliasso, F. Methods to Evaluate Lighting Quality in Educational Environments. Energy Procedia 2015, 78, 3138–3143. [Google Scholar] [CrossRef] [Green Version]
  7. Natanian, J.; Aleksandrowicz, O.; Auer, T. A parametric approach to optimizing urban form, energy balance and environmental quality: The case of Mediterranean districts. Appl. Energy 2019, 254, 113637. [Google Scholar] [CrossRef]
  8. Acosta, I.; Campano, M.; Leslie, R.; Radetsky, L. Daylighting design for healthy environments: Analysis of educational spaces for optimal circadian stimulus. Sol. Energy 2019, 193, 584–596. [Google Scholar] [CrossRef]
  9. Bullough, J. LEDs and automotive lighting applications. In Nitride Semiconductor Light-Emitting Diodes (LEDs). Materials, Technologies, and Applications, 2nd ed.; Elsevier: Amsterdam, The Netherlands, 2018; pp. 647–658. [Google Scholar]
  10. Bullough, J.; Snyder, J.; Kiefer, K. Impacts of average illuminance, spectral distribution, and uniformity on brightness and safety perceptions under parking lot lighting. Light. Res. Technol. 2019, 52, 626–640. [Google Scholar] [CrossRef]
  11. David, A.; Sahlhoff, D.; Wisser, M. Human perception of light chromaticity: Short-wavelength effects in spectra with low circadian stimulation, and broader implications for general LED sources. Opt. Express 2019, 27, 31553–31566. [Google Scholar] [CrossRef] [PubMed]
  12. Sándor, N.; Schanda, J. Visual colour rendering based on colour difference evaluations. Light. Res. Technol. 2006, 38, 225–239. [Google Scholar] [CrossRef]
  13. CIE. CIE: Publication CIE 13.2 (TC-3.2); Commission Internationale de l’Éclairage: Vienna, Austria, 1974. [Google Scholar]
  14. CIE. CIE S 017:2011—International Lighting Vocabulary; Commission Internationale de l’Éclairage: Vienna, Austria, 2011. [Google Scholar]
  15. Macadam, D.L. Visual Sensitivities to Color Differences in Daylight. J. Opt. Soc. Am. 1942, 32, 247–274. [Google Scholar] [CrossRef]
  16. Schanda, J. A combined colour preference—Colour rendering index. Light. Res. Technol. 1985, 17, 31–34. [Google Scholar] [CrossRef]
  17. Royer, M.P. What Is the Reference? An Examination of Alternatives to the Reference Sources Used in IES TM-30-15. LEUKOS 2016, 13, 71–89. [Google Scholar] [CrossRef]
  18. CIE. Colour Rendering (TC1-33 Closing Remarks); Commission Internationale de l’Éclairage: Vienna, Austria, 1999. [Google Scholar]
  19. Davis, W.; Ohno, Y. Color quality scale. Opt. Eng. 2010, 49, 033602. [Google Scholar] [CrossRef] [Green Version]
  20. Jost-Boissard, S.; Avouac, P.; Fontoynont, M. Assessing the colour quality of LED sources: Naturalness, attractiveness, colourfulness and colour difference. Light. Res. Technol. 2014, 47, 769–794. [Google Scholar] [CrossRef]
  21. Smet, K.; Schanda, J.; Whitehead, L.; Luo, R. CRI2012: A proposal for updating the CIE colour rendering index. Light. Res. Technol. 2013, 45, 689–709. [Google Scholar] [CrossRef]
  22. Li, C.; Ronnier Luo, M.; Li, C.; Cui, G. The CRI-CAM02UCS colour rendering index. Color Res. Appl. 2012, 37, 160–167. [Google Scholar] [CrossRef]
  23. Illuminating Engineering Society. IES Method for Evaluating Light Source Color Rendition, IES Technical Memorandum (TM) 30-20, IESNA; IES: New York, NY, USA, 2020; Available online: https://store.ies.org/product/tm-30-20-ies-method-for-evaluating-light-source-color-rendition/ (accessed on 17 July 2021).
  24. Royer, M.P. IES TM-30-15 Is Approved—Now What? LEUKOS 2016, 12, 3–5. [Google Scholar] [CrossRef] [Green Version]
  25. Illuminating Engineering Society. IES Method for Evaluating Light Source Color Rendition, IES Technical Memorandum (TM) 30-15, IESNA; IES: New York, NY, USA, 2015; Available online: https://www.ies.org/about-outreach/position-statements/ps-11-18-ies-position-on-tm-30-18-ies-method-for-evaluating-light-source-color-rendition/ (accessed on 21 January 2020).
  26. CIE. CIE 2017 Colour Fidelity Index for Accurate Scientific Use; Commission Internationale de l’Éclairage: Vienna, Austria, 2017. [Google Scholar]
  27. Acosta, I.; León, J.; Bustamante, P. Daylight spectrum index: A new metric to assess the affinity of light sources with day-lighting. Energies 2018, 11, 2545. [Google Scholar] [CrossRef] [Green Version]
  28. Thornton, W.A. Color-Discrimination Index. J. Opt. Soc. Am. 1972, 62, 191–194. [Google Scholar] [CrossRef] [PubMed]
  29. Boyce, P. Illuminance, lamp type and performance on a colour discrimination task. Light. Res. Technol. 1976, 8, 195–199. [Google Scholar] [CrossRef]
  30. Boyce, P.; Simons, R. Hue discrimination and light sources. Light. Res. Technol. 1977, 9, 125–140. [Google Scholar] [CrossRef]
  31. Rea, M.S.; Freyssinier-Nova, J.P. Color rendering: A tale of two metrics. Color Res. Appl. 2008, 33, 192–202. [Google Scholar] [CrossRef]
  32. Farnsworth, D. The Farnsworth-Munsell 100-Hue and Dichotomous Tests for Color Vision. J. Opt. Soc. Am. 1943, 33, 568–574. [Google Scholar] [CrossRef]
  33. Rea, M.; Freyssinier, J. Color rendering: Beyond pride and prejudice. Color Res. Appl. 2010, 35, 401–409. [Google Scholar] [CrossRef]
  34. Royer, M.P.; Houser, K.W.; Wilkerson, A.M. Color discrimination capability under highly structured spectra. Color Res. Appl. 2011, 37, 441–449. [Google Scholar] [CrossRef]
  35. Royer, M.P.; Wei, M. The Role of Presented Objects in Deriving Color Preference Criteria from Psychophysical Studies. LEUKOS 2017, 13, 143–157. [Google Scholar] [CrossRef]
  36. Schanda, J.; Csuti, P.; Szabó, F. Colour fidelity for picture gallery illumination, Part 1: Determining the optimum light-emitting diode spectrum. Light. Res. Technol. 2014, 47, 513–521. [Google Scholar] [CrossRef] [Green Version]
  37. Feltrin, F.; Leccese, F.; Hanselaer, P.; Smet, K.A.G. Impact of Illumination Correlated Color Temperature, Background Lightness, and Painting Color Content on Color Appearance and Appreciation of Paintings. LEUKOS 2019, 16, 25–44. [Google Scholar] [CrossRef]
  38. Szabó, F.; Kéri, R.; Schanda, J.; Csuti, P.; Wilm, A.; Baur, E. A study of preferred colour rendering of light sources: Shop lighting. Light. Res. Technol. 2015, 48, 286–306. [Google Scholar] [CrossRef]
  39. Royer, M.; Wei, M.; Wilkerson, A.; Safranek, S. Experimental validation of colour rendition specification criteria based on ANSI/IES TM-30-18. Light. Res. Technol. 2019, 52, 323–349. [Google Scholar] [CrossRef]
  40. Houser, K.W.; Wei, M.; David, A.; Krames, M. Whiteness Perception under LED Illumination. LEUKOS 2014, 10, 165–180. [Google Scholar] [CrossRef]
  41. Dangol, R.; Bhusal, P.; Halonen, L. Performance of colour fidelity metrics. Light. Res. Technol. 2014, 47, 897–908. [Google Scholar] [CrossRef] [Green Version]
  42. Gu, H.; Luo, M.R.; Liu, X. Testing different colour rendering metrics using colour difference data. Light. Res. Technol. 2016, 49, 539–560. [Google Scholar] [CrossRef]
  43. Esposito, T. An Adjusted Error Score Calculation for the Farnsworth-Munsell 100 Hue Test. LEUKOS 2019, 15, 195–202. [Google Scholar] [CrossRef] [Green Version]
  44. Esposito, T.; Houser, K. A new measure of colour discrimination for LEDs and other light sources. Light. Res. Technol. 2017, 51, 5–23. [Google Scholar] [CrossRef]
  45. De Beer, E.; Van Der Burgt, P.; Van Kemenade, J. Another Color Rendering Metric: Do We Really Need It, Can We Live without It? LEUKOS 2016, 12, 51–59. [Google Scholar] [CrossRef]
  46. O’Connor, D.A.; Davis, R.G. Lighting for the elderly: The effects of light source spectrum and illuminance on color discrimination and preference. LEUKOS J. Illum. Eng. Soc. North Am. 2005, 2, 123–132. [Google Scholar] [CrossRef]
  47. Dangol, R.; Islam, M.; LiSc, M.H.; Bhusal, P.; Puolakka, M.; Halonen, L. Subjective preferences and colour quality metrics of LED light sources. Light. Res. Technol. 2013, 45, 666–688. [Google Scholar] [CrossRef]
  48. Panda-Jonas, S.; Jonas, J.B.; Jakobczyk-Zmija, M. Retinal Photoreceptor Density Decreases with Age. Ophthalmology 1995, 102, 1853–1859. [Google Scholar] [CrossRef]
  49. Ishihara, S. Tests for Color-Blindness; Hongo Harukicho: Tokyo, Japan, 1917. [Google Scholar]
  50. Birch, J. Efficiency of the Ishihara test for identifying red-green colour deficiency. Ophthalmic Physiol. Opt. 1997, 17, 403–408. [Google Scholar] [CrossRef] [PubMed]
  51. Chen, W.; Huang, Z.; Liu, Q.; Pointer, M.R.; Liu, Y.; Gong, H. Evaluating the color preference of lighting: The light booth matters. Opt. Express 2020, 28, 14874–14883. [Google Scholar] [CrossRef] [PubMed]
  52. ISO. ISO 7730:2005—Ergonomics of the Thermal Environment—Analytical Determination and Interpretation of Thermal Comfort Using Calculation of the PMV and PPD Indices and Local Thermal Comfort Criteria; International Organization for Standardization: Geneva, Switzerland, 2005. [Google Scholar]
  53. Huang, Z.; Chen, W.; Liu, Q.; Wang, Y.; Pointer, M.R.; Liu, Y.; Liang, J. Towards an optimum colour preference metric for white light sources: A comprehensive investigation based on empirical data. Opt. Express 2021, 29, 6302–6319. [Google Scholar] [CrossRef]
Figure 1. Flowchart of the proposed methodology.
Buildings 11 00527 g001
Figure 2. Analysis of color rendering of a cool, neutral and warm LED lamp in the light source testing box. Upper line: Objects used for the scenarios of trial 1: Two paintings and fruits; lower line: FM-test samples and color checker.
Buildings 11 00527 g002
Figure 3. Measuring the SPD and illuminance of the light source and the spectral reflectance of the color samples.
Buildings 11 00527 g003
Figure 4. SPD of the daylight conditions perceived inside the testing box.
Buildings 11 00527 g004
Figure 5. SPDs of the electric light sources tested.
Buildings 11 00527 g005
Figure 6. Spectral reflectance values of color samples. From above to below: Girl with a Pearl Earring, The Starry Night and fruit scenario.
Buildings 11 00527 g006
Figure 7. (a) Left: Subjective color rendition provided by the tested light sources of the set of color samples. (b) Right: Perceived correlated color temperature (CCT) produced by the tested light sources.
Buildings 11 00527 g007
Figure 8. (a) Left: Perceived saturation provided by the tested light sources of the set of color samples. (b) Right: Color preference of the tested scenarios: set of fruits and paintings.
Buildings 11 00527 g008
Figure 9. Quantification of the FM-100 trial, showing minimum, maximum and average values as well as averages excluding 10% upper and lower of the study sample. From left to right and above to below. (a) Upper left: Red hues. (b) Upper right: Green hues. (c) Lower left: Blue hues. (d) Lower right: Overall results.
Buildings 11 00527 g009
Table 1. Properties of the equipment used for this study.
InstrumentSpectral Wavelength RangeOutput Wavelength PitchAccuracy
Konica Minolta CL-70F spectrometer380 to 780 nm1 nmEv (Illuminance): ±5% ± 1% per digit xy: 0.003 (at 800 lx)
PCE-CSM 8 reflectance
spectrophotometer
400 to 700 nm10 nmΔE*ab (CIELAB distance metric) 0.2
Table 2. Main colorimetric characteristics of the light sources studied in the testing box.
AbbreviationDLL27L40L65INFL65FL25
DescriptionDaylight CIE D65LED 2700KLED 4000KLED 6500KIncandescentFluorescent 6500KFluorescent 2500K
CCT K5500–6500275441995692253863072406
CRI Ra100838483998784
GAI D651004772834210549
GAI CRI10091868797106112
CQS100848481998678
CIE 224 2017100858483998672
TM-30-20 Rf100858483998672
TM-30-20 Rg10096929299103106
DSI100808587837357
Table 3. Color rendition and coefficient of determination for color discrimination, subjective color rendition and color preference of the current metrics according to the studied light sources and scenarios.
AbbreviationDLL27L40L65INFL65FL25Farnworth–Munsell R2Subjective Color
Rendition R2
Color
Saturation Deviation R2
Fruit Set
Preference R2
Paintings Set Preference R2
CCT K5500–6500275441995692253863072406
CRI Ra1008384839987840.2730.0100.0040.1260.010
GAI D6510047728342105490.5360.2600.4850.1640.336
GAI CRI100918687971061120.0010.4950.0050.2740.314
CQS1008484819986780.2590.0760.0000.2790.087
CIE 224 20171008584839986720.3260.1900.0040.4170.196
TM-30-20 Rf1008584839986720.3260.1900.0040.4170.196
TM-30-20 Rg100969292991031060.0030.4960.0100.2330.299
DSI1008085878373570.4270.7580.2000.7900.597
Publisher’s Note: MDPI stays neutral with regard to jurisdictional claims in published maps and institutional affiliations.

