1. Introduction
1.1. BIM Development
Building information modelling, although appearing to be a relevantly recent advancement in AEC associated with 3D modelling software, was first proposed theoretically in the 1960s when Englebart [
1] described how building information could be visualised on a computer including specifications and construction sequencing through a collaborative design and construction approach. Eastman et al. [
2] expanded on this suggesting that 3D representations of buildings would replace 2D drawings while costings and bills of quantities could be generated from such a system. Technologically, development was slower, despite the fact that computer aided design (CAD) was first developed in 1963 by Sutherland [
3] it was not until 1984 when Radar Ch was released that a data based BIM software was available in the form of Radar Ch [
4]. The development of the building information software Revit in the 1990s [
5] allowed the development of detailed design and visualisation for construction projects. In the last decade, the emergence of cloud computing and increasing computer processing power has enabled the enhancement collaborative working in BIM as well as expanding BIM capability beyond the construction completion phase.
Common agreed levels of maturity associated with varying levels of complexity of a BIM have been developed. Level 0 is considered 2D CAD drawings and is a paper based method of design and construction information exchange, Level 1 is coordinated 2D and 3D information but not shared between project team members, typically designers, architects, mechanical, electrical, contractors, and client. Level 2 BIM includes a managed 3D environment with data whereby individual project teams develop models and contribute to a federated model which is then shared. A level 2 BIM can contain information on sequencing which is known as 4D and cost information, 5D. Level 2 BIM is clearly defined in PAS 1192 [
6]. BIM Level 2 was mandated on all centrally funded public infrastructure schemes in the UK in 2016, and the benefits of adopting BIM has been highlighted within the AEC industry, including improvements in project cost, profitability, and completion value [
7].
The next maturity level is BIM level 3 which concerns all parties working on a single collaborative model. In BIM, level 3 the model is utilised beyond the construction stage into the lifecycle management of the infrastructure. This is known as 6D, BIM level 3 however is not comprehensively defined as well as Level 2 to date.
A key component enabling the collaborative ethos associated with BIM Level 2 and 3 is the use of a common data schema, useable across the range of BIM type software. The Industry Foundation Class (IFC) has been developed as such a schema. It enables a wide range of platforms develop and integrate building information, i.e., interoperability enabling collaboration. The IFC is defined in ISO 16799:2013 and is regulated by buildingSmart [
8]. IFC is currently operating at Version IFC 4.2 [
8]. The most common IFC format is known as a STEP file with the extension ‘.ifc’. IFC is predominantly defined in one of two languages EXPRESS [
9] and XML [
10] whereby an object-oriented approach is taken to define objects in terms of rules, types, and functions.
BIM related innovation is now focused on progressing the project information model (PIM), which relates to the design and construction stages of an asset towards the operation and maintenance of the built asset, the asset information model (AIM). This is in effect, the realization of BIM level 3. The valuable applications of BIM beyond the construction stage into the asset lifecycle (6D) are being revealed through significant research and industry efforts. Migrating from PIM to AIM in a new building project is utilising smart building sensors, Internet of Things, and cloud-based integration is subject to intense innovation. However, to date the adoption of AIM’s to existing buildings designed and built without the benefit of BIM is an area which has received little focus, the present provides insights into undertaking such a process. A review of research activities in the BIM area by Volk et al. [
11] outlined three areas where challenges exist including the automation of capturing existing building the updating and maintenance of BIM information beyond the constructions phase and the handling of uncertain data. This would include the creation of digital models and databases of existing buildings with the primary purpose of asset management rather than design and construction. An extension of the same theme is retrofitting BIM to existing buildings centred on 3D model creation through point cloud and laser scanning technology. The application of this approach in conservation engineering capturing geometrics of culturally significant monuments is now termed Heritage Building Information Modelling or H-BIM [
12].
The implementation of structural health monitoring (SHM) through BIM is potentially a key element within BIM Level 3 development. This is of particular interest to clients of the AEC industry such as asset and utility managers. The attraction is the potential for cost savings in damage detection, maintenance planning, and design life extension of structural assets. This facet of BIM becomes compelling when considering offshore structures, where costs and logistical considerations of maintaining assets at sea are much greater than on land. Murphy [
13] examined the case for BIM adoption in the burgeoning offshore renewable energy industries, highlighting the advantages in the operations phase such as condition based maintenance cost efficient O&M and design life assessment which could lead to a reduction in the through life cost of energy associated with offshore renewable technology. However, to date, BIM in the offshore setting, similar to land based development, has been limited to design and development [
14], while case studies are rare, the benefits of adopting of BIM for developing port facilities in the Arctic was discussed by Garibin and Ol’khovik [
15].
1.2. Background
1.2.1. Structural Health Monitoring in an Offshore Environment
The importance of monitoring the condition of structures in locations where access is limited and the environment is aggressive cannot be underestimated, particularly when that environment is offshore. Weather windows, complex logistic constraints, specialised repair methodologies, equipment and materials, comprehensive personnel training requirements, and onerous insurance premiums all contribute to making a routine repair of a structure offshore several orders of cost magnitude greater than a similar repair on a land based structure. The prevention, minimization, and/or rationalisation of such repair events can be achieved with the aid of structural health monitoring systems.
An SHM system for offshore structures is typically concerned with environmental data, i.e., what forcing is incident on the structure (wind, wave, tidal currents, etc.) and what is the structural response to those forcings (movement, strain, corrosion, chloride attack, etc.) and the analysis of these forcings and responses to detect damage and infer mitigation and maintenance strategies. SHMs can be static, inspection based with single event data recording, periodic inspection based or dynamic where sensors record continuously and send data to the user via cloud based computing. The prevalence of the latter is increasing with the advent of wireless sensors and cloud-based storage. Offshore SHM was developed through the oil and gas industry initially and principally in response to wave loading issues of platforms and components. Mufti et al. [
16] provide comprehensive guidance on various features of an effective SHM system, prior to this in an offshore setting Sigbjörnsson and Smith [
17] developed a stochastic theory in response to an offshore oil and gas gravity platform to various wave spectra.
The effect of vibration due to wave impact on gravity based structures is of particular relevance to the current study, Lee et al. [
18] examined various vibration analysis methods to monitor damage on gravity based caisson breakwater, expanding on this, Lee et al. [
19] identified the vibration characteristics of a concrete caisson breakwater under wave loading at various water levels using scale models. More recently, Lee et al. [
20] used real data from in situ caissons to assess damage models. Nguyen et al. [
21] assessed the damage modes on a gravity-based wind turbine foundation under a range of wave loading. The application of vibration monitoring and structural modelling has been applied to several light houses during the storm lamp project [
22].
During this project, the vibration response of Eddystone light house to wave loading was examined by both in situ geophone measurements and FEA modelling by Trinh et al. [
23] to assess the vulnerability of this structure to wave loading. A Bayesian modal analysis was undertaken on several rock based lighthouses including Eddystone and Wolf Rock lighthouse by Brownjohn et al. [
24], the analysis proved to be challenging due to the axisymmertical behaviour of lighthouses, it was suggested that longer term permanent monitor with accelerometers could yield more definitive modal shapes ultimately for better condition assessment. The validation of this approach was discussed by Raby et al. [
25], whereby the measured accelerations of forced vibration tests were analysed in parallel with FE modelling of the structure. A similar analysis both experimental and numerical was applied to Fastnet lighthouse a masonry structure located on Fastnet rock off the south coast of Ireland [
22]. The analysis of vibration tests both ambient and forced showed that the Fastnet is structurally sound in its current condition. Similar data collection is planned for the present study to assess the effect of wave loading on the structure.
1.2.2. SHM and BIM
Combining SHM data collection and analysis with the visualisation power of BIM has been examined for various infrastructures to date. Ferreira and Martins [
26] presented a case study utilising the IFC schema to incorporate SHM related sensors into a BIM model. In particular, they found it a challenge to implement non environmental sensors such as kinematic and structural sensors. Delgado et al. [
27] described a case study for integrating an SHM system monitoring bridge data with BIM resulting in quick identification of structural behaviour in the casting of bridge beam. It was noted that there is a lack of provision in BIM currently to fully implement SHM. Boddupalli et al. [
28] implemented an SHM system through sensor analysis and structural modelling feedback looped through the visualisation capabilities of an existing long span bridge. A model for IOT sensor monitoring in BIM by Wang et al. [
29] highlights to benefits of an integrated monitoring process and feature early warning analysis for pit excavation during construction Wang et al. [
30] also proposed a framework for live building monitoring for energy management, Kim et al. [
31] examined the implementation of live IOT sensors with a BIM for change management and space layout. Gerrish et al. [
32] assessed the interoperability of sensing data and BIM for building performance using IFC whilst Banfi et al. [
33] proposes a repository method of H-BIM for structural health monitoring of historic structures whereby successive 3D data capture is archived and made available be visualisation to undertake comparative SHM on a medieval bridge.
Sternal and Dragos [
34] discussed a wireless SHM system in a lab-based approach implementing an autoregressive analysis on vibrations to assess damage and populate a BIM model. The potential of active SHM in buildings and infrastructure has been examined linking real sensor data to virtual sensor in a BIM for a five-story building by Valinejadshoubi et al. [
35], this work included real sensors being modelled successfully in IFC. Tsai et al. [
36] successfully developed prediction tool utilising BIM visualisation and real-time RFID sensors to assess corrosion in offshore insulated piping. RFID and BIM was also used for degradation monitoring in reinforced concrete by Romano and Brito [
37]. Interoperability between structural design and BIM visualisation for range of structures was explored by Fleming [
38]. A method of visualising crack damage on bridges utilising BIM was successfully developed McGuire [
39].
It is evident from the literature that there have been successful case studies integrating sensors with BIM; however, some common limitations emerge. Difficulties in automating the data transfer between sensors and BIM platform and the use of interoperable formats for custom sensors dominate the issues raised. The current study provides an example method of automating the transfer of data utilising visual programming. The limitations of the IFC schema adequately describe the complexities of SHM networks. Theiler and Smarsly [
40] have proposed an extension to the IFC schema to deal with the current limitations. This is validated in scale model format of a multi-story building equipped with accelerometers by Theiler et al. [
41] A semantic model for wireless sensor integration in BIM was demonstrated by Ibanez et al. [
42] utilising the schema extension developed by [
40]. Utilising visual programming such as Dynamo [
43], Revit API, and Arduino [
44] proposed in case studies by Kenesek [
45]. To date, the proposed adoption of SHM within BIM of an asset in the offshore environment has been limited, the majority of case studies focus on land based infrastructure including building models, real buildings, and infrastructure such as bridges. This study examines the potential for expansion of the SHM to BIM concept to the offshore environment. The application of the IFC interoperability is also explored in the present study to assess its validity to an offshore SHM designed for an existing structure; however, this is not the primary focus of the study.
The focus of the present study is to identify how a proposed SHM system on an existing offshore structure can be represented in BIM format, as well as exploring the possibility of integrating the monitoring data within the BIM for enhanced asset management and damage detection.
2. Materials and Methods
2.1. Case Study
The Kish Bank [
46] lies approximately 11 km off the Dublin coast and has been a navigational hazard for several centuries forcing marine traffic around its shallow sandy shoals. Prior to the present aid to navigation, several attempts to illuminate the area have been undertaken including a screw pile mounted lantern, and several incarnations of lightships. The former succumbing to storm damage and the latter proved costly in terms of operation and maintenance. In 1962, the authority responsible for aids to navigation around the Irish coast, The Commissioner of Irish Lights (CIL) commissioned the design of a permanent lighthouse on the site of the Kish Bank. The winning design by of Christiani and Neileson [
47] was based on the Norwegian model of a concrete telescopic caisson construction. However, to deal with the energetic environment of the Irish Sea, the Kish Lighthouse design was significantly larger than the Scandinavian lighthouses.
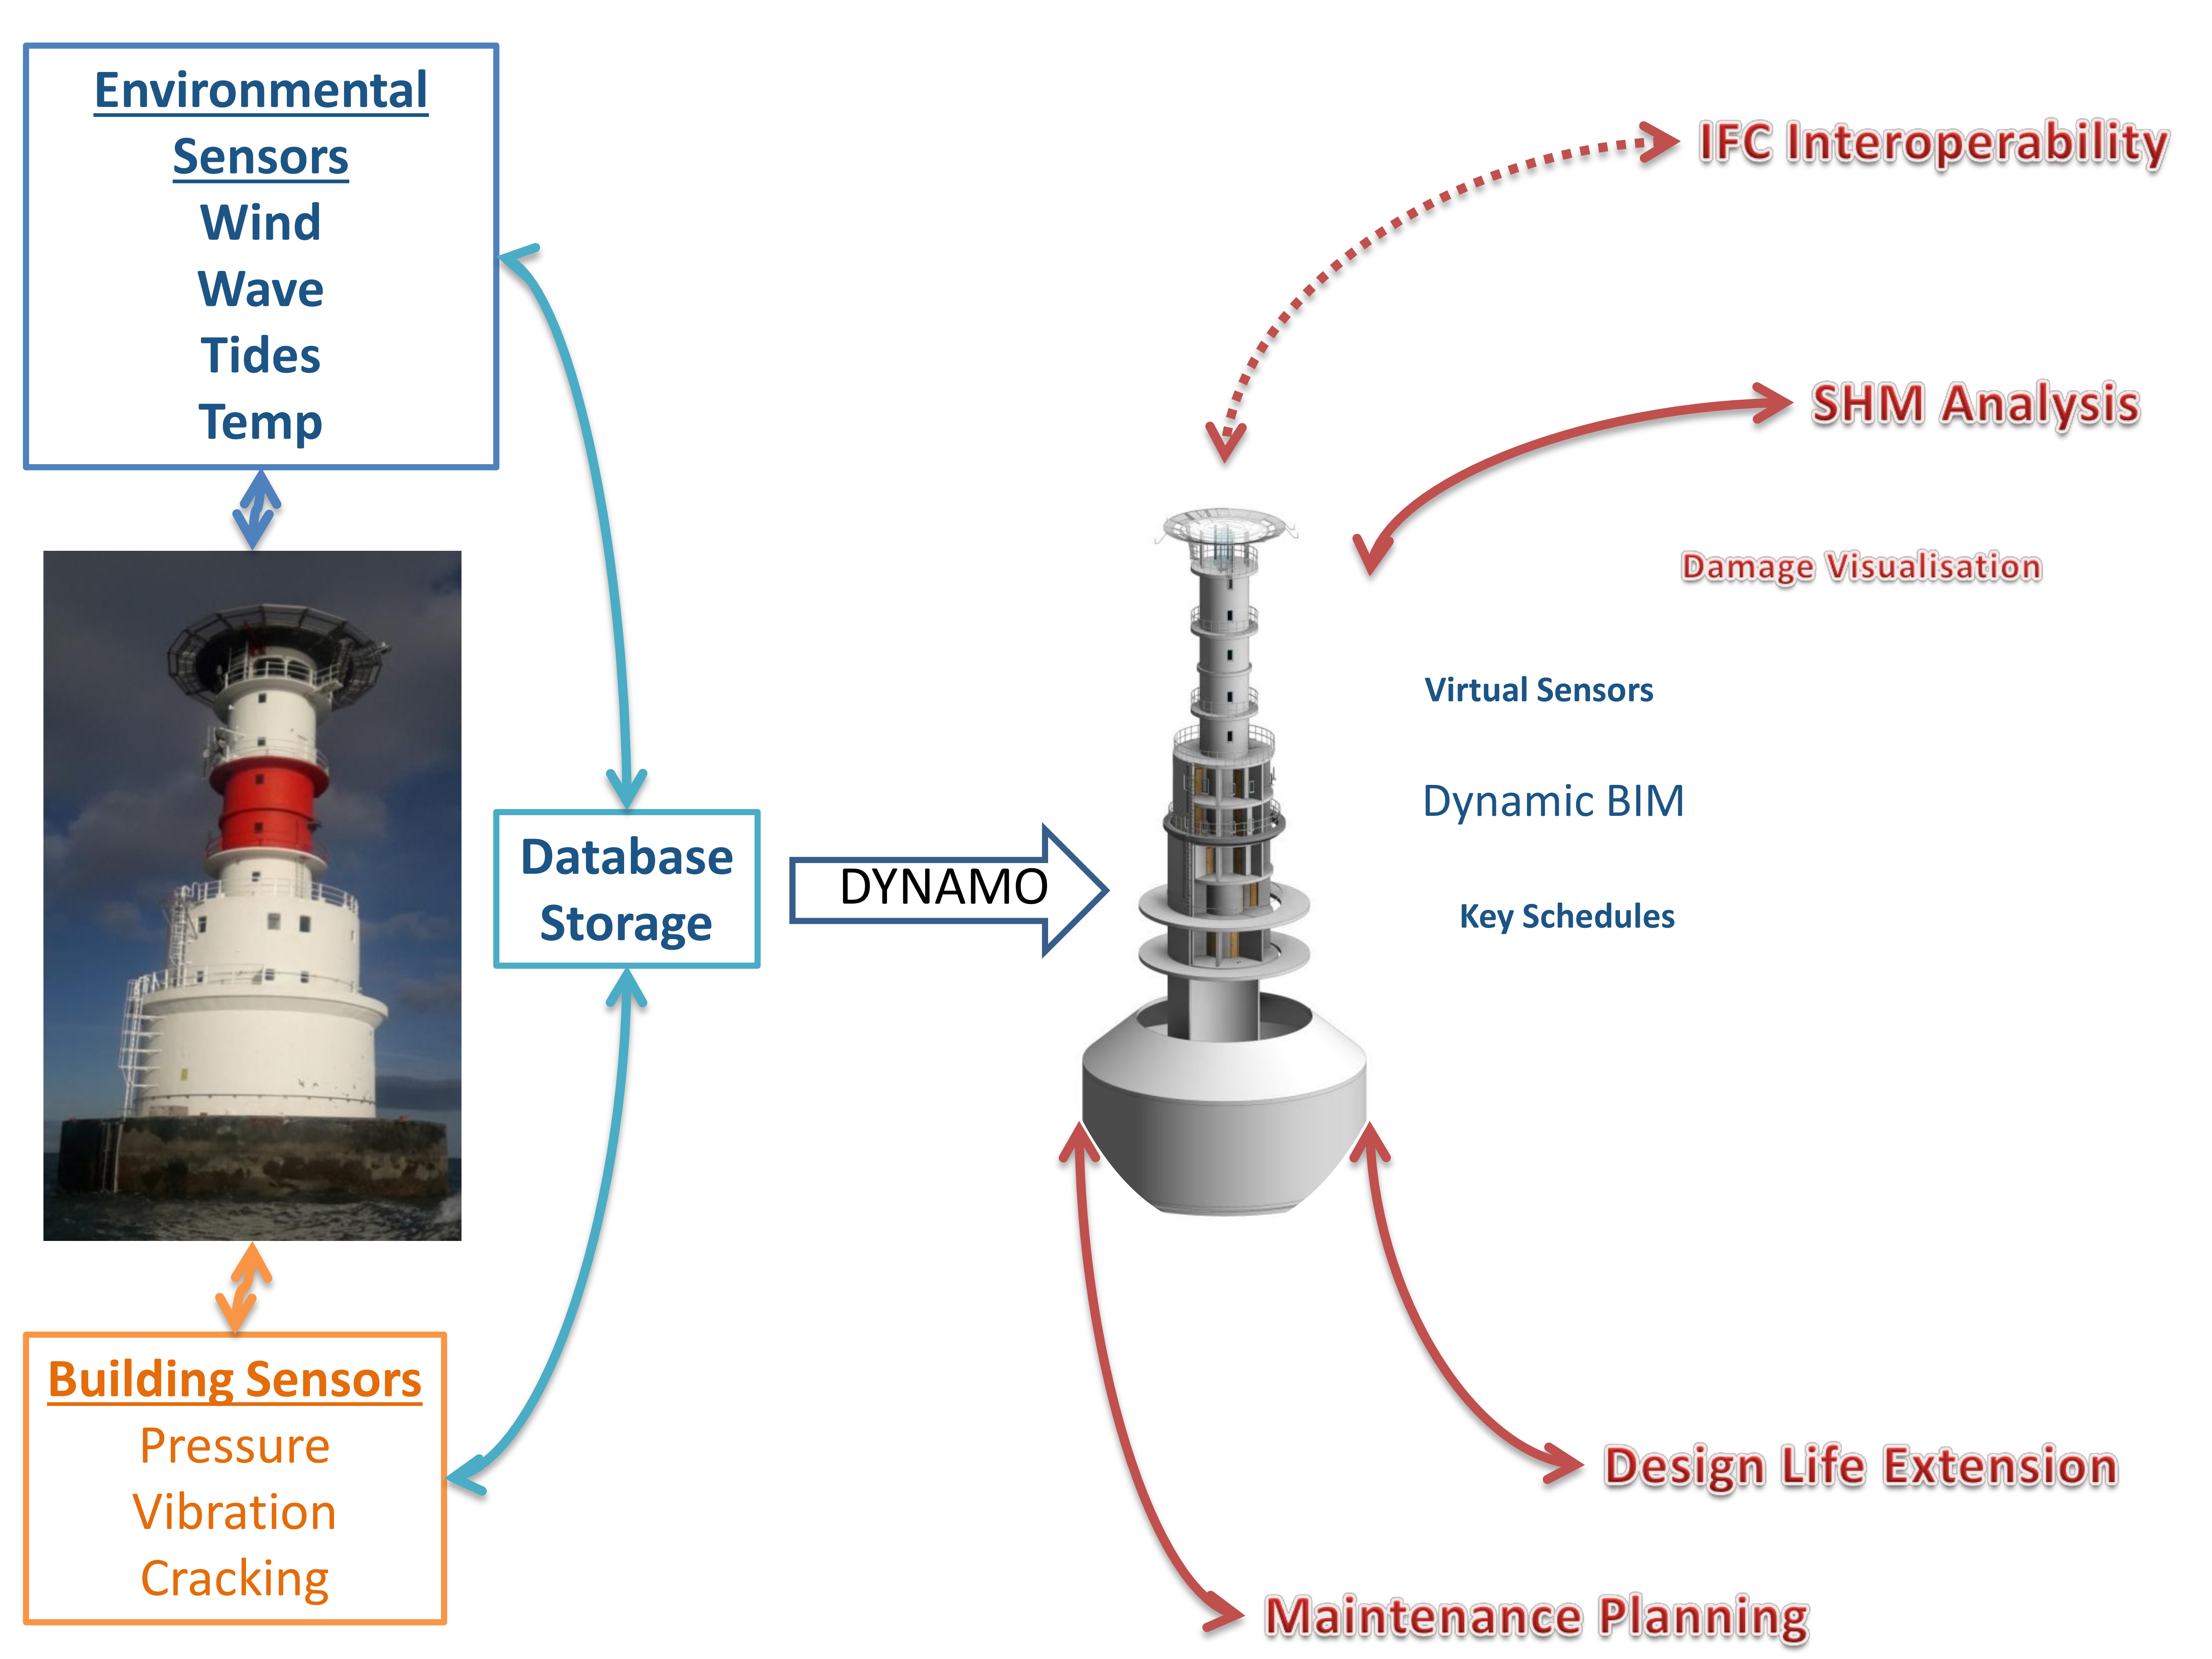
The lighthouse,
Figure 1a, is based on two separate concentric reinforced concrete structures, a gravity caisson, and a second inner tower with 12 floors,
Figure 1b, including two basement levels and a helicopter platform,
Figure 1b. The structures were built in Dun Laoghaire harbour and floated out to the Kish Bank. The inner tower was temporarily housed inside the outer caisson during transport. It was then raised to its final position by means of 12 pre-stressed steel cables and the central void in the outer caisson filled with sand. The annulus between inner and outer caisson was then grouted. The structure is gravity based and sits on prepared gravel bed which includes a 15 m wide apron of protective rock armour.
Routine maintenance operations and periodic reinstatement of rock armour scour protection, the structure has been inspected and assessed structurally at 25-year intervals, in 1989/1990 [
48,
49] and 2015 [
50]. This monitoring and review process enables Irish Lights to make decisions regarding scheduling refurbishment and operational capability of the light house. These activities have also generated some valuable data sets in relation to concrete chloride ingress, crack formation/development, scour development, global structural movement, caisson integrity, and petrographic analysis of the light house.
The 1989/1990 assessments [
48,
49] highlights several minor issues with the structure including a potentially low factor of safety against sliding (1.07), anecdotal rocking or swaying motion of the tower during high winds, the presence of a water filled void between the inner tower floor and sand fill from the gravity base caisson. The head of water pressure was measured by boroscope at 650 mm. To monitor the reported rocking, a plum bob setup was created using a brass chequered plate on the Level 0 floor to assess the verticality of the inner tower. A slight rotation of the tower of circa 25 mm was measured, but verticality was found to be intact. It was also found that chloride ingress was relatively minor except in the basement where secondary efflorescence was visible with some evidence of cracking. Of note was cracking along the path of the prestressed cables used as temporary supports to hoist the tower section from within the gravity section prior to sand filling during construction. The reporting concluded with a recommendation that the service life be extended by 25 years.
The 2015 assessment [
50] revised the FOS for sliding upward to 1.53. The report noted that a structural assessment of the annular grouted section be undertaken given the bearing of the sand filled section is compromised due to the presence of the water gap. The report suggests that as the grout did not contain fine aggregates and the petrographic results suggested a 2% void content, indicating that there is potential for water in the annular ring. The report also states that the tower has not moved definitively, and the plum bob is within tolerance of the previous 1990 inspection. An element requiring further monitoring is identifying the source for the swaying/rocking motion reported. Crack monitoring of the Level 0 cracks were also recommended.
As part of the design process to undertake the remedial works recommended by the 2015 assessment, a 3D Revit structural model was created of the Kish Lighthouse. The remedial works included replacement of corroded hand railing; helipad netting and access, removal of original crane beams, and painting the tower section were completed in 2018. However, the long term monitoring requirements were not undertaken in this work.
In summary, there are several issues that require monitoring so the design life of the light house can be extended and maintenance/ intervention strategies can be decided upon. The main items to be resolved include:
Assessing the annular gap and caisson water filled section;
Active crack monitoring of the Level 0 walls;
Monitoring the motion of the tower to identify the source of rocking/swaying;
Undertake an analysis of sliding on the structure globally.
The aim of this research is to demonstrate that the integration of the above monitoring activities on a single BIM platform is possible. The objective is to develop a framework for integrating the monitoring data for implementation with the existing BIM. First, it is necessary to define the monitoring processes to be undertaken to assess the issues raised in previous assessments. There is also potential to utilise datasets generate in the previous 1989/90 and 2015 inspections within this BIM to provide a comprehensive monitoring and analysis tool within the BIM.
2.2. SHM Methodology
It is evident that there are several aspects of the Kish lighthouse structure that would benefit from monitoring and analysis. The focus of this paper is to define the format of this monitoring with a view to integration within a BIM. The analysis of this data is also dealt with in a limited way, but further work is planned once monitoring datasets are generated during the monitoring period.
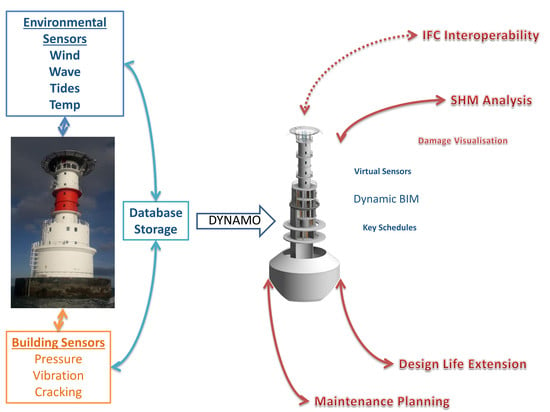
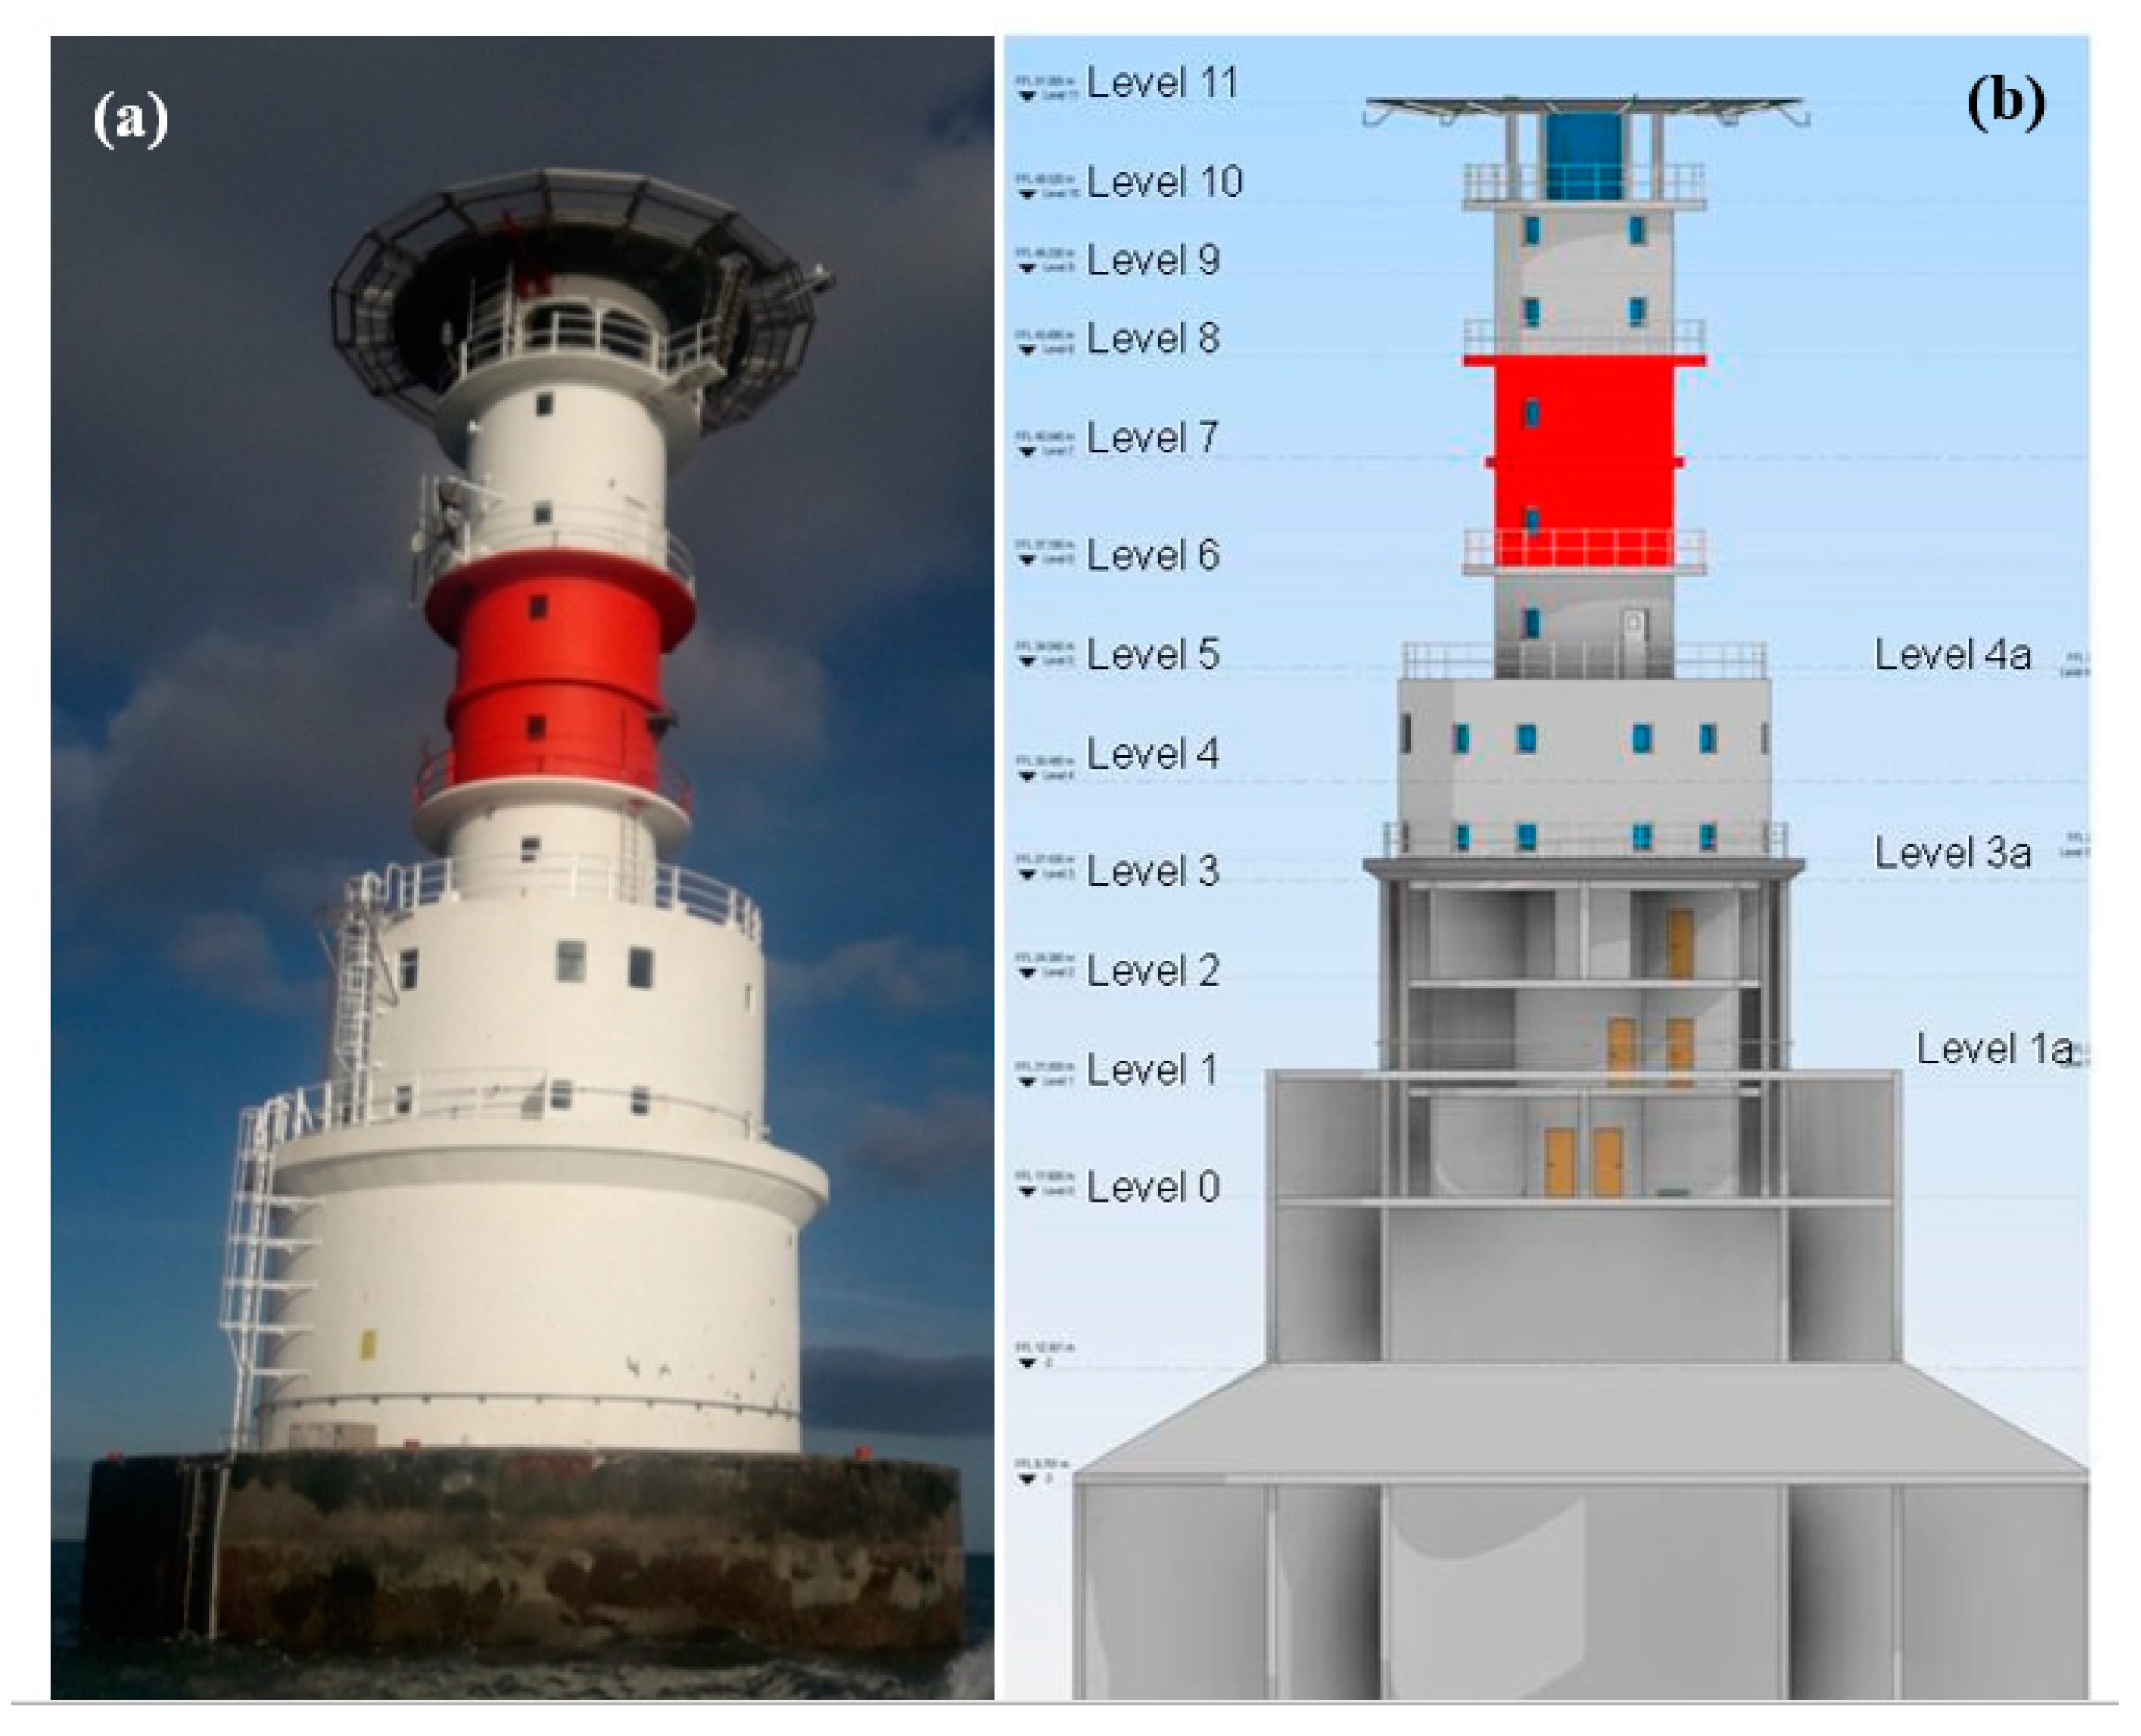
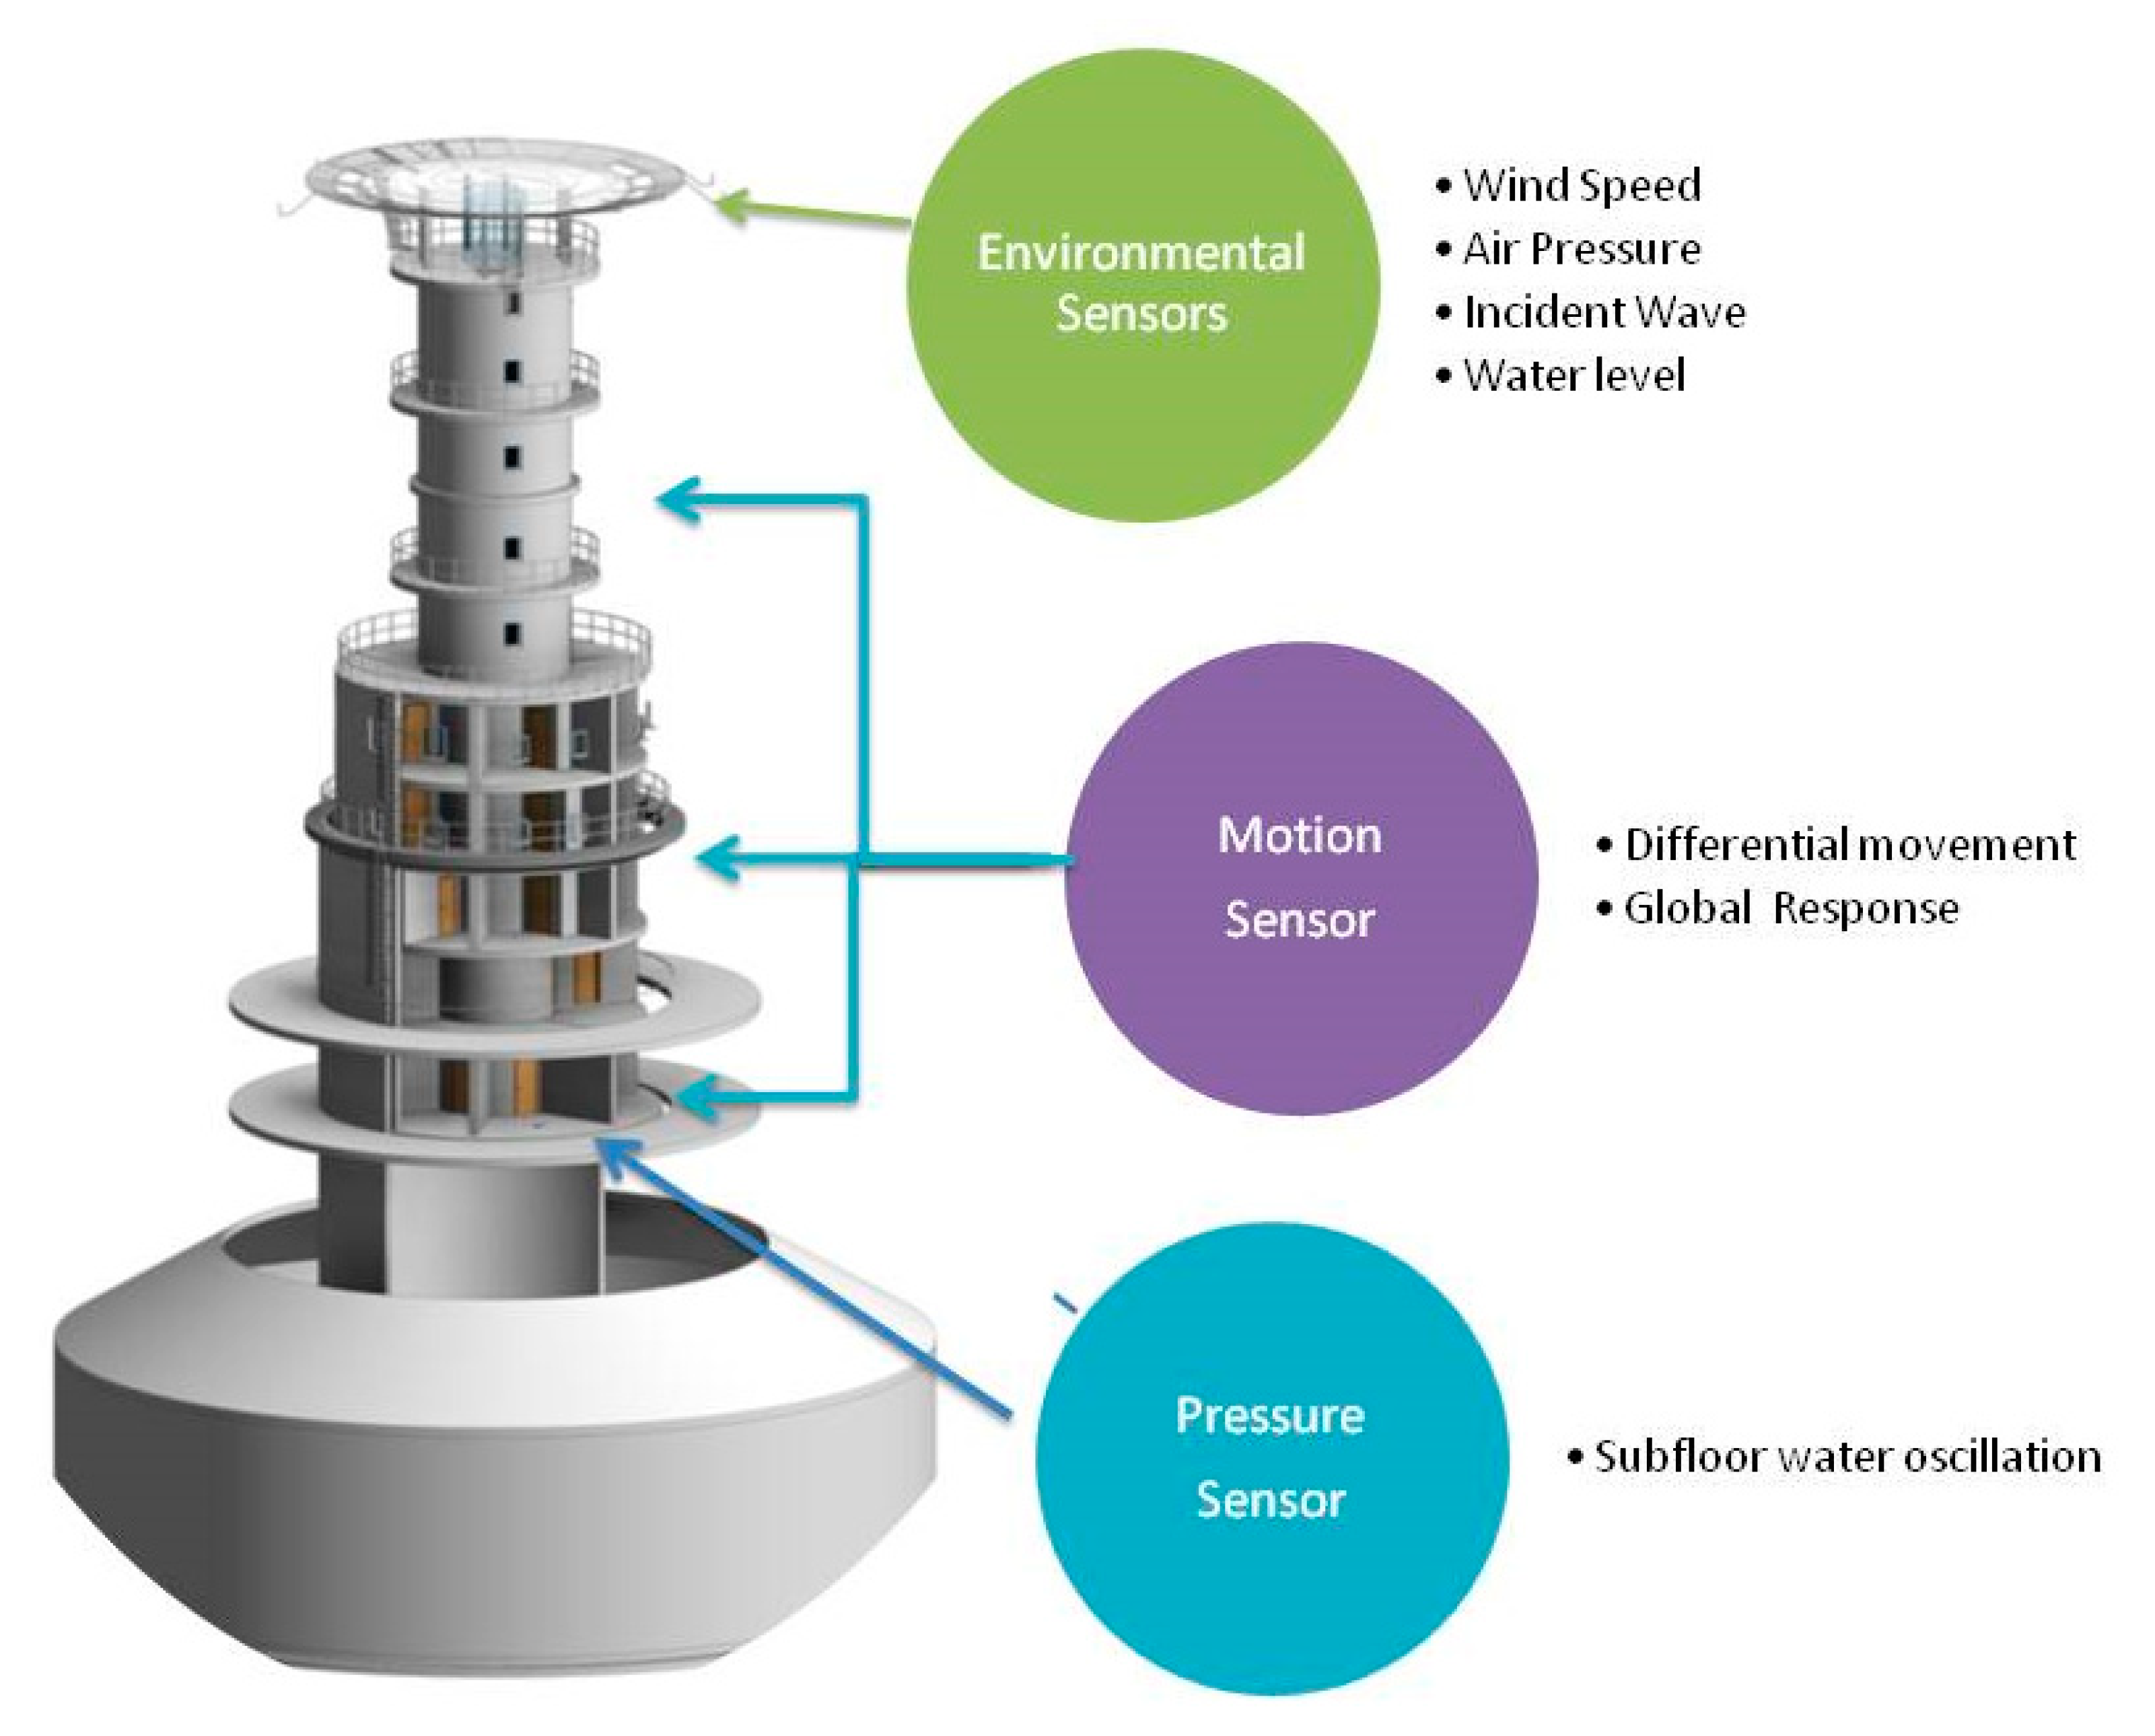
The data collection for SHM of the Kish can be undertaken in one of two ways or a combination both; monitoring and modelling. The sensor monitoring,
Figure 2, which is the focus of this paper, proposed includes vibration monitoring of the caisson and tower, pressure monitoring of the tower subfloor area, environmental monitoring—including wave, tide, wind, air pressure and temperature. This monitoring can be supplemented by mapping previous in-situ analysis such as crack monitoring to infer structural behaviour of the Lighthouse. While extreme wave loading modelling and FEA will be undertaken in a subsequent study as the dataset matures.
2.2.1. Vibration Monitoring
The use of accelerometers and geophones on offshore lighthouses has been documented previously on Fastnet, Eddystone, and Wolfrock lighthouses. The proposed monitoring on the Kish serves a different function in that the aim is to identify modes of vibration to identify and quantify the mode of the reported swaying. A key output will be to confirm if the motion is differential movement between tower and caisson or if the reported swaying is the global movement of the structure. The vibration monitoring system will consist of an RDL VibeGeophone system [
51]. The vibration monitoring operates on an alarm threshold system whereby if the device is activated above a threshold minimum acceleration in any of the three spatial dimensions X, Y, or Z. Once activated, the geophone records a burst of vibrations and transmits the results to a secure online server via an inbuilt 3GSM modem. An email alert system is also activated with details of the accelerations transmitted. The transmission format is given by:
New System—UC Cork (...29412)
An event occurred at 14/10/2019 14:43:17 GMT
X1: −43.270 mm/s
Y1: −43.007 mm/s
Z1: +43.401 mm/s
The geophone is to be located at Floor level 3 at the interface of the tower and the gravity caisson. It is proposed to place one geophone on the outer lip on the gravity caisson and one within the floor of the inner tower. A further set of wireless accelerometers will be installed, one each located at the top and bottom of the inner tower. These instruments will store the data to an in-situ logger and transmit via a Raspberry Pi [
52] controlled GSM modem. The format of the accelerometers is similar to the geophone alarm, providing accelerations in three directions. As the project develops further, accelerometer sensor nodes will be added in locations identified as storm response data is gathered and analysed.
2.2.2. Pressure Monitoring
The pressure of the unexplained water body present under the floor 0 slab has been recorded several times over the lifetime of the structure to identify the source of the phenomena. A boroscope and pressure gauge, have been installed previously. However, for this SHM system, it was considered more appropriate to install a pressure sensor and logger system to capture higher resolution data in an effort to identify the source of the unexplained water pressure by recording the dynamic change in pressure. The pressure transducer was designed to fit on an existing stand pipe connected to the void that was installed during a previous structural inspection of the lighthouse. The sensor records pressure in mm H
2O. The pressure signal is accessed via an Arduino [
44], and logged on a laptop by LabVIEW, and data is transmitted via the same Raspberry Pi GSM as the wireless accelerometers.
2.2.3. Environmental Monitoring
The Kish Bank lighthouse is an active aid to navigation and as such records a wealth of environmental data. Wind speed is recorded utilising a series of Lidar sensors and anemometers located on the helipad safety netting providing wind speed and direction. Air pressure and air temperature are also recorded at the top of the tower. This environmental data is sent to a web server and is available in 10 min temporal resolution. This data is accessed and downloaded utilising a simple Python import script. This sensor is external to the project but is considered part of the network.
Wave height, water surface elevation, and tidal current velocity are not monitored at the lighthouse currently; however a MetOcean buoy in Dublin bay approx. 3 km from the lighthouse records, wave heights, wind speeds, and direction. Similar to the in situ wind, the Dublin bay buoy is considered an external sensor, but nonetheless a part of the sensor network.
To supplement the existing environmental sensors, it is proposed to install an instantaneous water level recorder on the light house. An in-situ measurement of incident wave height and water level is required to enable definitive analysis of wave force impacts on the lighthouse. This will be undertaken utilising a Log_A level ultrasound-based sensor [
53]. This sensor samples at 5 Hz and raw measurements are converted to tide curves using custom software developed by the manufactures general acoustics in an onboard logger and processor. The processed data is then transmitted to via GPRS at 1 min intervals to reduce data bandwidth issues.
2.2.4. Crack Mapping and Monitoring
The focus of the current study is on active sensor integration into BIM but it should also be noted that a wealth of existing historical inspection datasets related to the Kish lighthouse exist. Of particular relevance is the archive of crack monitoring data recorded over successive 25-year inspections. It is proposed to map the historical crack mapping in the 3D model similar to what McGuire [
39] utilised for bridges. This will enable the visualisation of crack emergence and propagation over time which can potentiality yield information on the stress modes the lighthouse structure is subject to.
The level 0 walls of the inner tower have been identified as subject to cracking, with signs of efflorescent particularly along the outline of the temporary cables. This is an area of concern for the integrity of the entire structure. However, it is not clear if these features are solely a result of chloride ingress and carbonation of the cables or if in fact the cables are being stressed in the operational phase of the building life. It is proposed to install digital active crack monitoring along the level 0 walls where cracking is evident. These monitors identify changes in relative width of a crack. If cracks are identified as growing or flexing during storm events, then it can be deduced that the cables are being actively engaged. This could indicate the annular grouting between tower and gravity caisson is in failure and the designed structural load path is not valid.
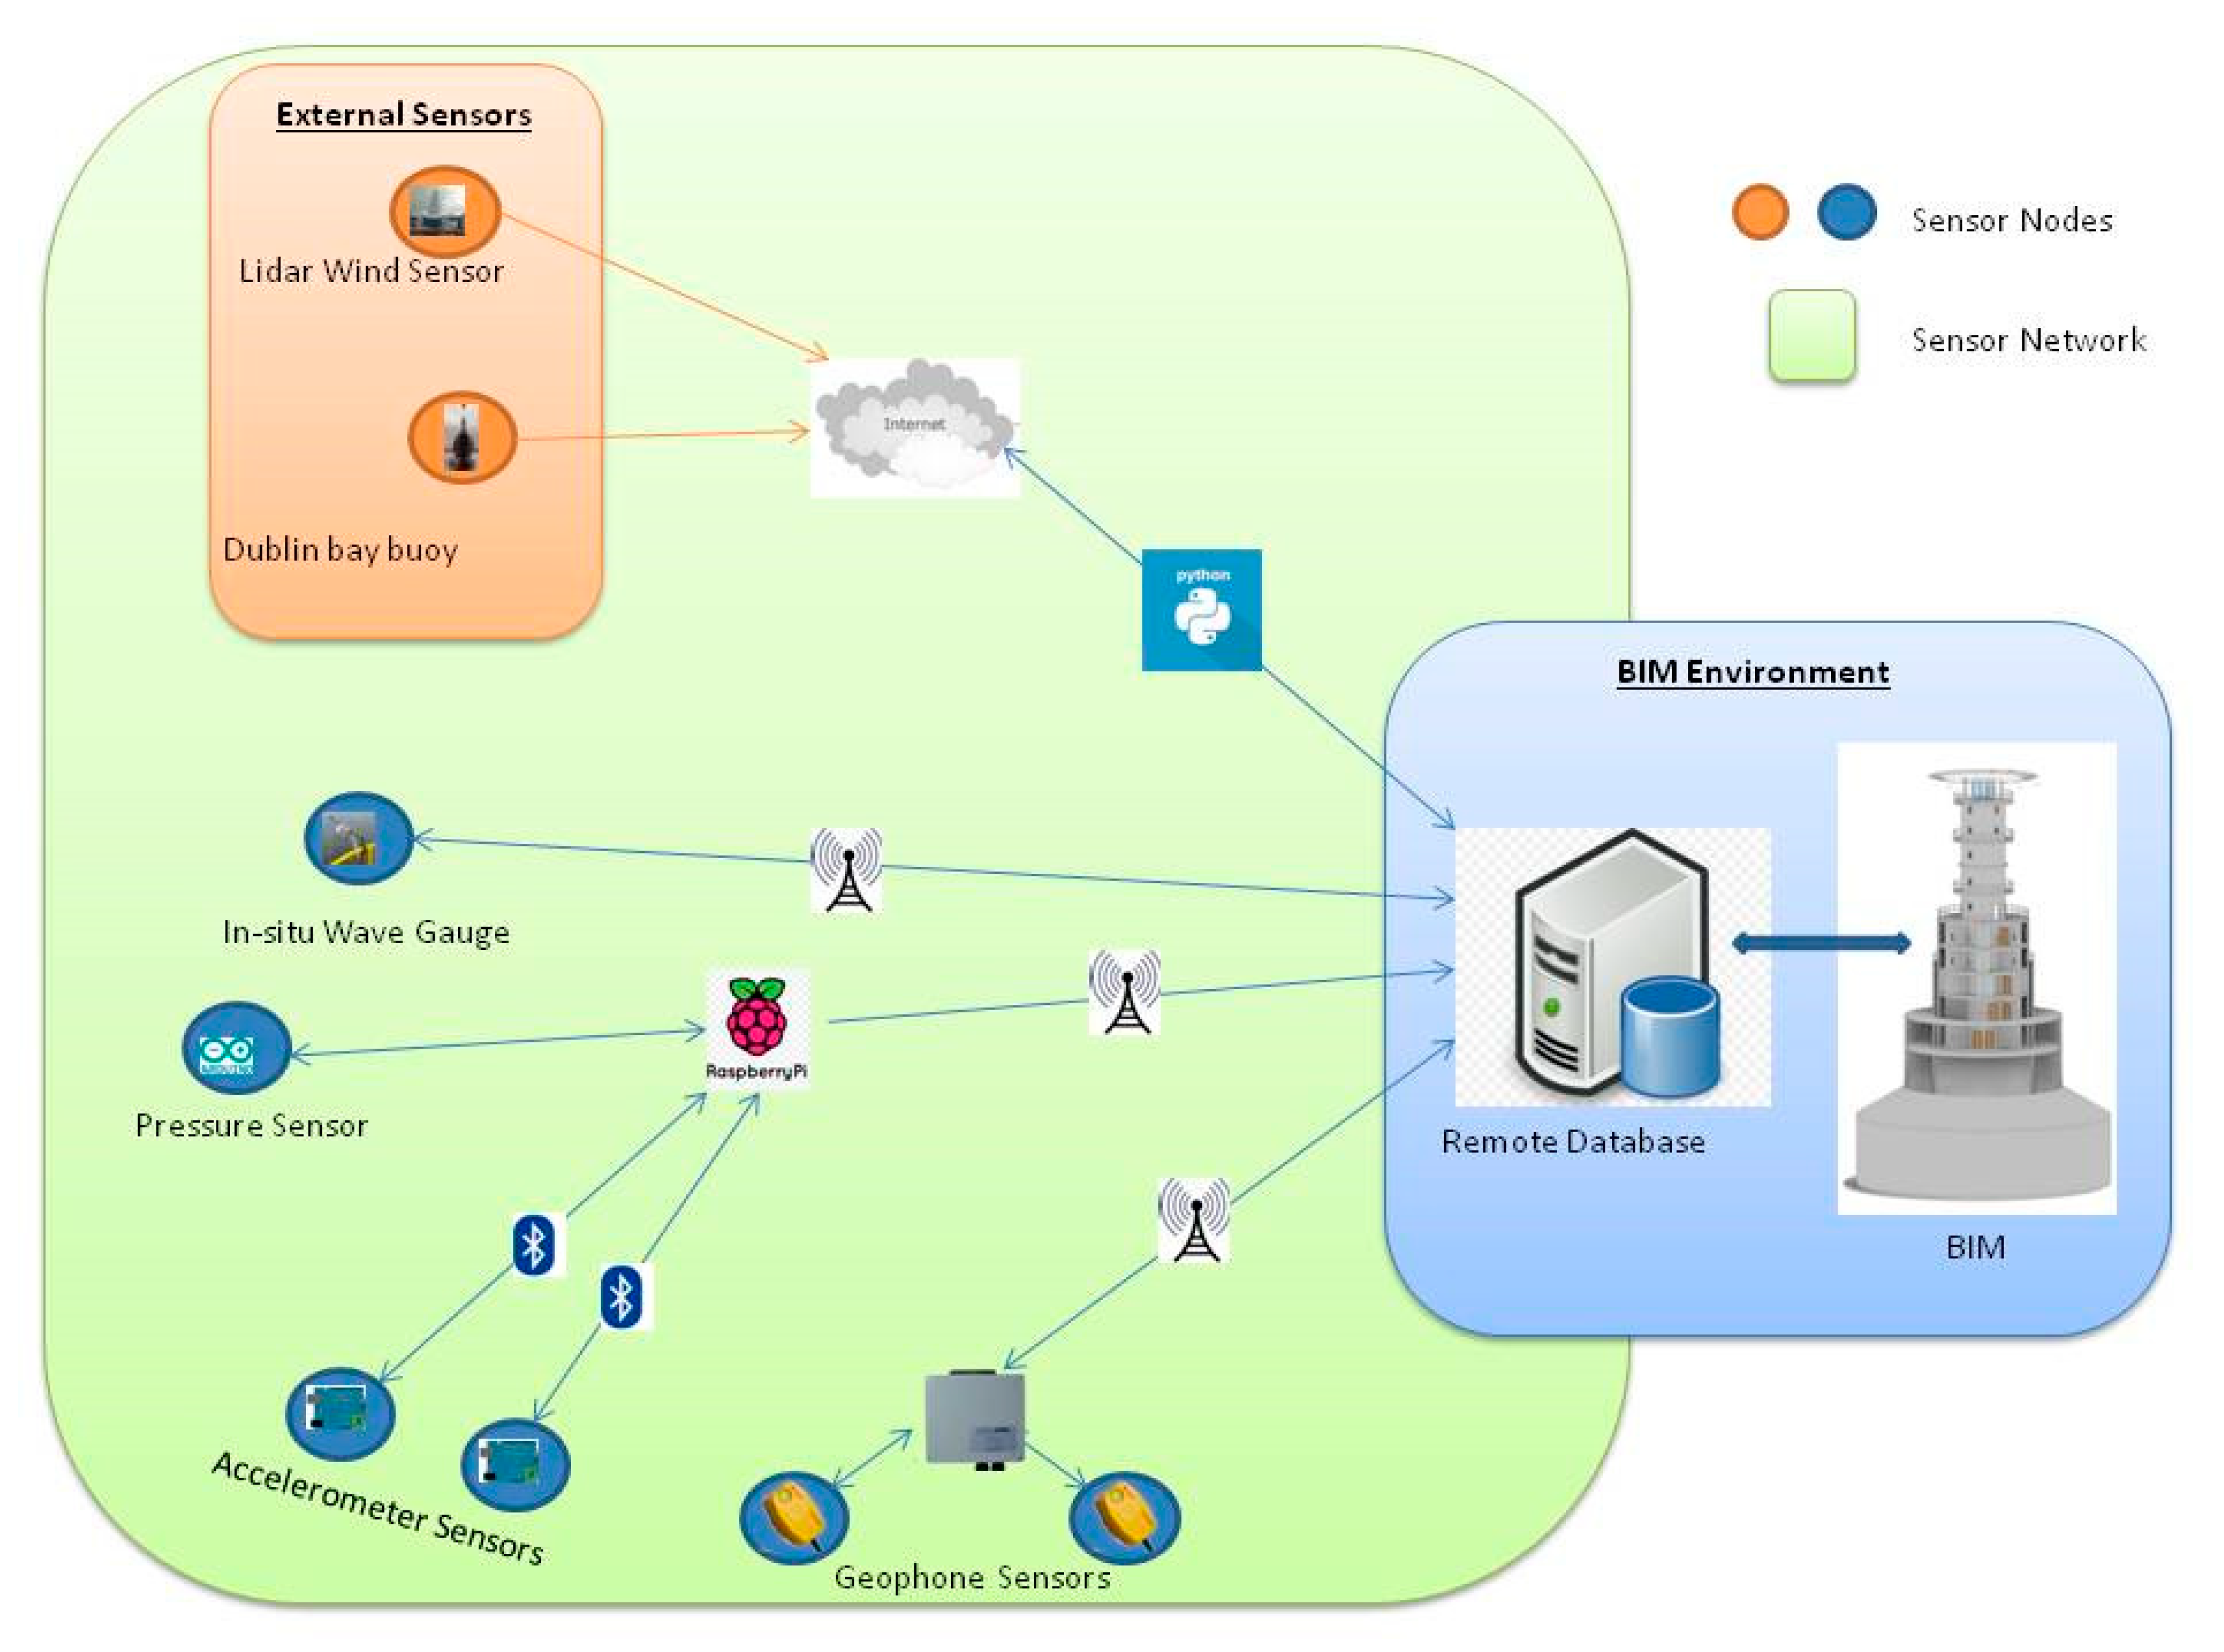
2.3. Networking of Sensors
The proposed sensor network to be implemented for the Kish lighthouse is shown in
Figure 3 below. The SHM network comprises of a range of sensor types with varied recording frequencies, data storage, processing, and transmission capabilities. The sensor network is a combination of wired and wireless sensor nodes measuring various parameters utilising both customised open source formats (water pressure sensor) and standardised commercial sensors (RDL vibe by Caption Data ltd, Worcester, UK, LOG_alevel, General acoustics, Kiel, Germany). The SHM system also utilises sensors from external sources recording data from the wider environment for example wave buoys and wind gauges operated by third parties. Considering these factors, network topology optimisation is difficult. The networking approach taken was to establish a central cluster head remote from the offshore location where all sensor node data is eventually transmitted to. This cluster head is the master database for all the data transmitted across the SHM network. It is located within the BIM file structure and facilitates the link from physical data storage to virtual data representation.
In this initial phase, the effort is concentrated on addressing specific structural concerns in targeted locations of the light house. As such priority was placed on the availability and reliability of sensors during network design. To date, the pressure sensor and all external sensors are operational. The remaining sensors outlined in
Figure 3 will be commissioned prior to Winter 2020, to enable measurements of the structure’s behaviour over a storm season. As the understanding of the structure’s behaviours deepens, the initial fragmented network design will evolve. It is envisaged that as the project matures, further sensor nodes will be added to the network promoting in situ cluster storage and closer wireless sensor networking approaches to optimise the network using open source protocols and increased wireless sensors.
The next stage is identifying how the various sensors will be modelled in the existing Revit model and thereafter how sensor data is transferred to the BIM model. This will enable a global analysis of the issues affecting the lighthouse.
2.4. Proposed BIM Implementation
The sensors were modelled as separate families in Revit each under the specialty equipment family category. A review of the existing IFC 4.2 schema [
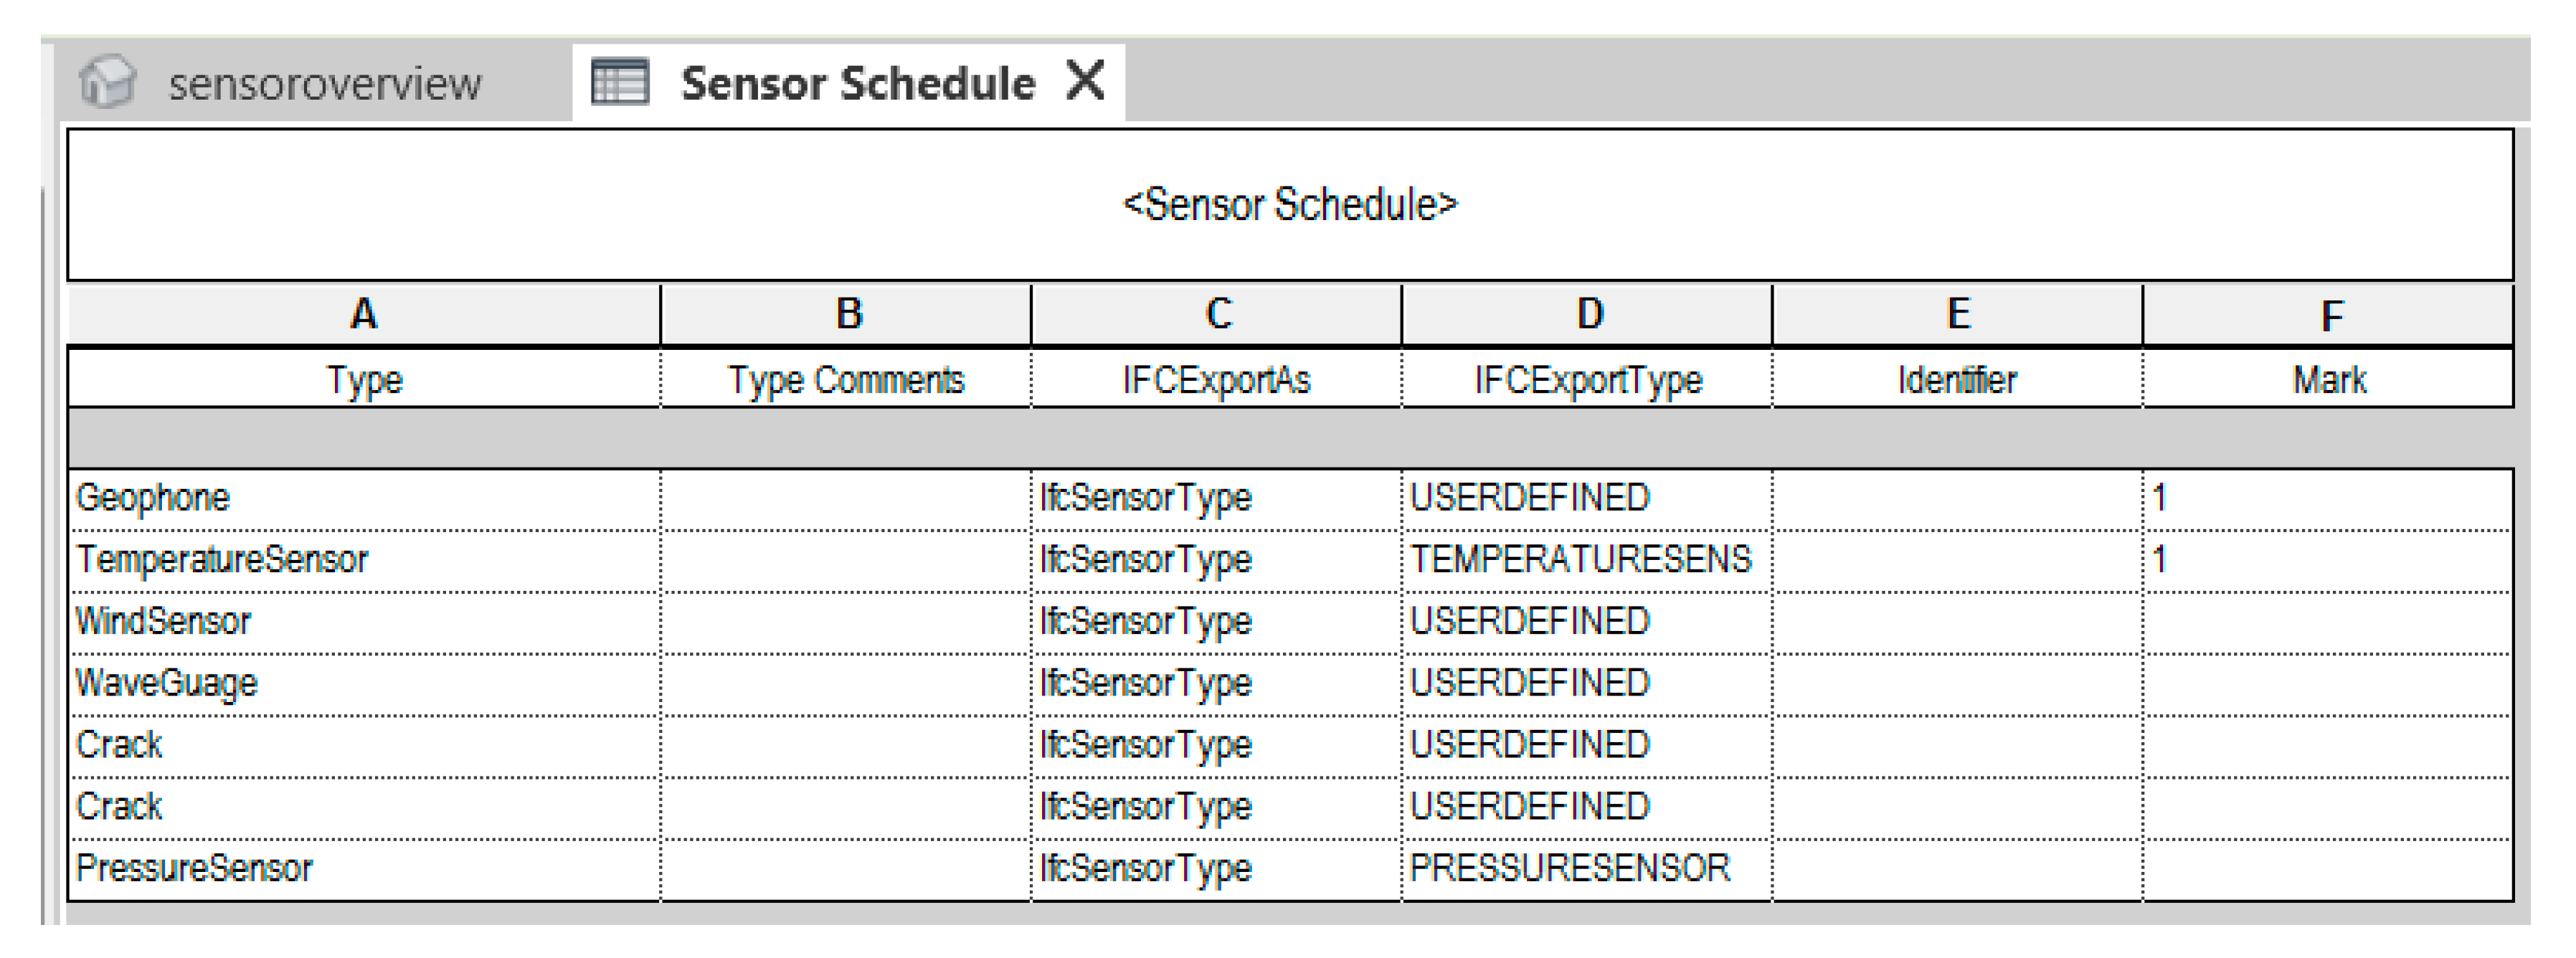
8] indicates that some sensors can be modelled generically without the need for Schema extensions. This enables an import function to utilise the IFC class names ifcSensor and ifcSensorType. Other parameters such as location, level, manufacture name, and type can also be defined. Currently, there are 24 defined sensors in the IFC Schema. The implementation of predefined sensors such as temperature are relatively straight forward; however, to represent the sensor such as the geophone or wave gauge a user defined description is necessary.
Once the sensors were modelled and placed in Revit 2020, a sensor schedule was created (
Figure 4). This schedule can be utilised to identify where on the model sensors are located and what type of data they are recording. Currently there are seven separate sensors defined in the model, some sensors are defined utilising predefined IFC schema while the others are user defined custom definition. This schedule can be expanded upon as the SHM system progresses.
This limitation within the IFC schema has been described in the literature and proposed schema extensions are still being developed to alleviate the interoperability issue of custom sensors. It should be noted that the aim of the present study is to create a BIM based SHM representation but not specifically focused on IFC interoperability. Nonetheless, the IFC compatibility of the SHM system of the present was assessed by exporting the Revit SHM model to IFC, and reopening a new project where the IFC version of the model was linked. The SHM system was successfully geometrically represented in the IFC model, but only some sensor properties of the user defined sensors were successfully transferred.
3. Results
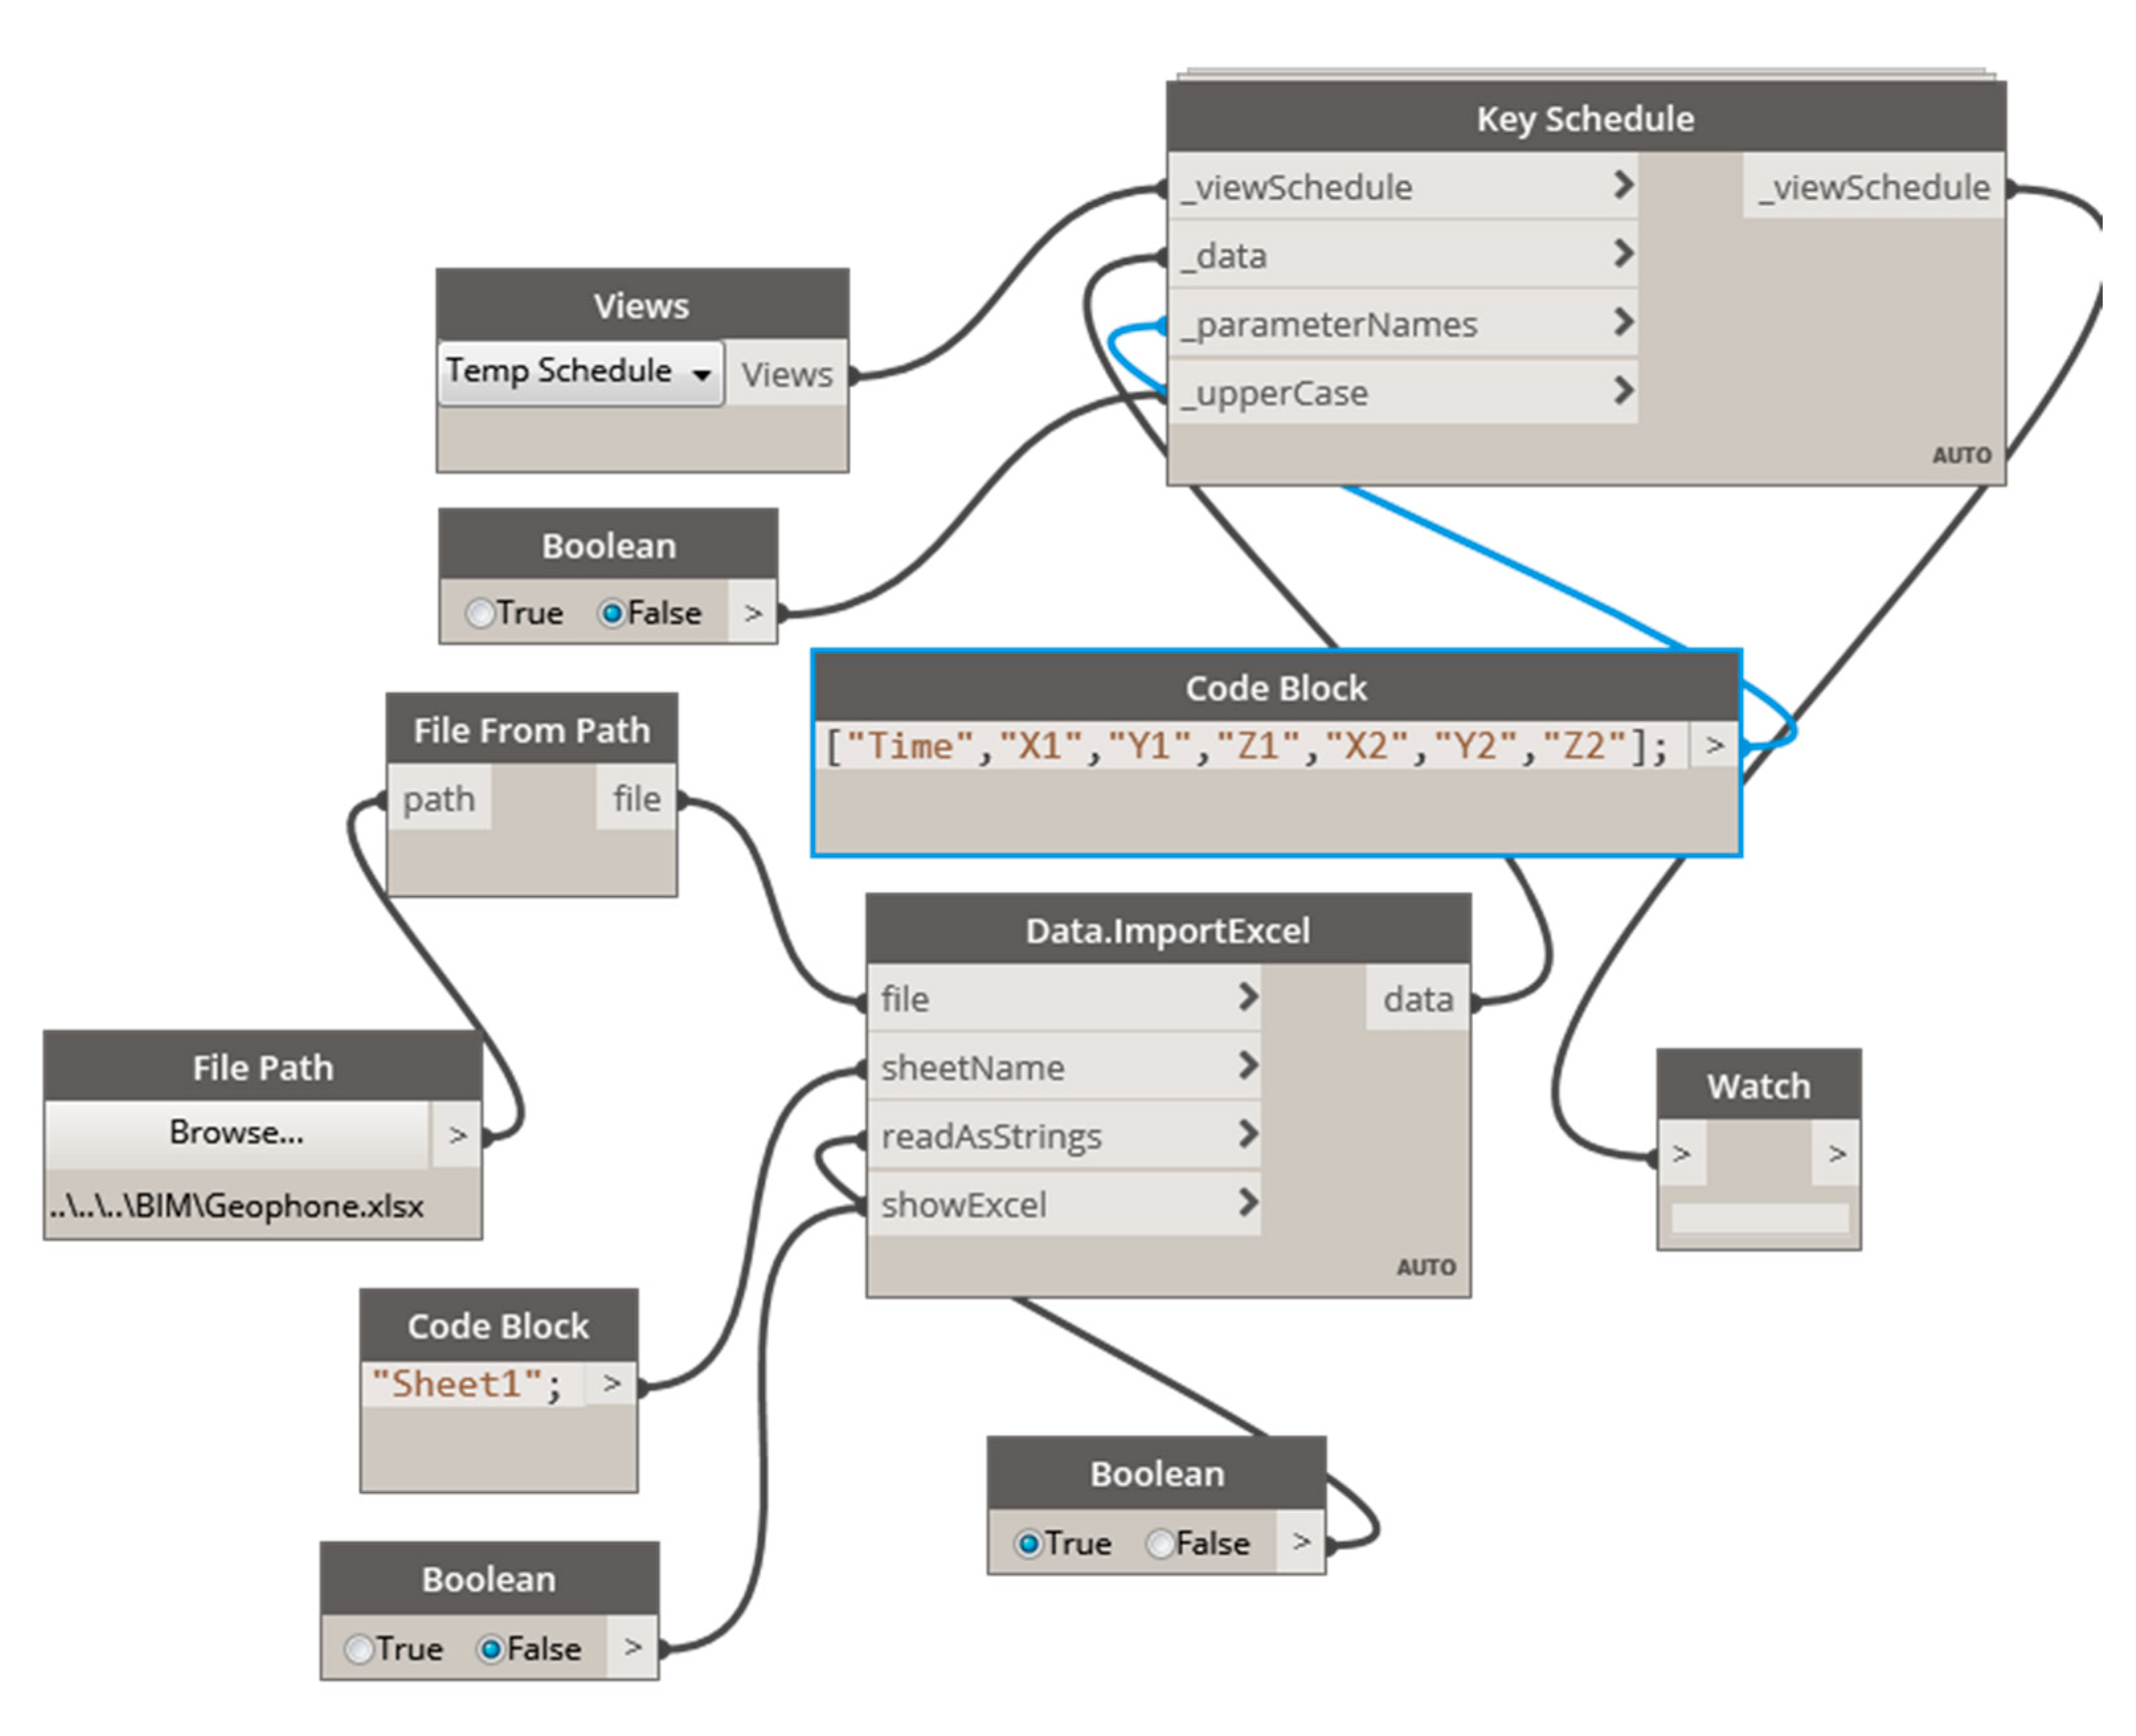
3.1. Visualisation Tool
The visualisation of an SHM system as presented in this study is a beneficial visualisation tool for asset managers. The tool enhances the coordination and installation of the monitoring system to ensure the optimum return of data. Furthermore, the integration of the real data produced by the physical sensors within the BIM model expands the capability so that users can undertake analysis of the entire system on one virtual platform. To achieve this level of integration, custom visual programming is required, the Dynamo tool [
43] within Revit was used in this study to import and display recorded data from the various sensor types in the SHM network (
Figure 5). The sensor data from the SHM is stored in a central repository consisting within the BIM project structure. As discussed previously these results are saved in various text file formats. The sensor data is converted to excel and then read into the REVIT model and displayed as key schedules utilising the Dynamo tool. This function can be selected to run automatically on Revit start-up or manually deepening on the user preference.
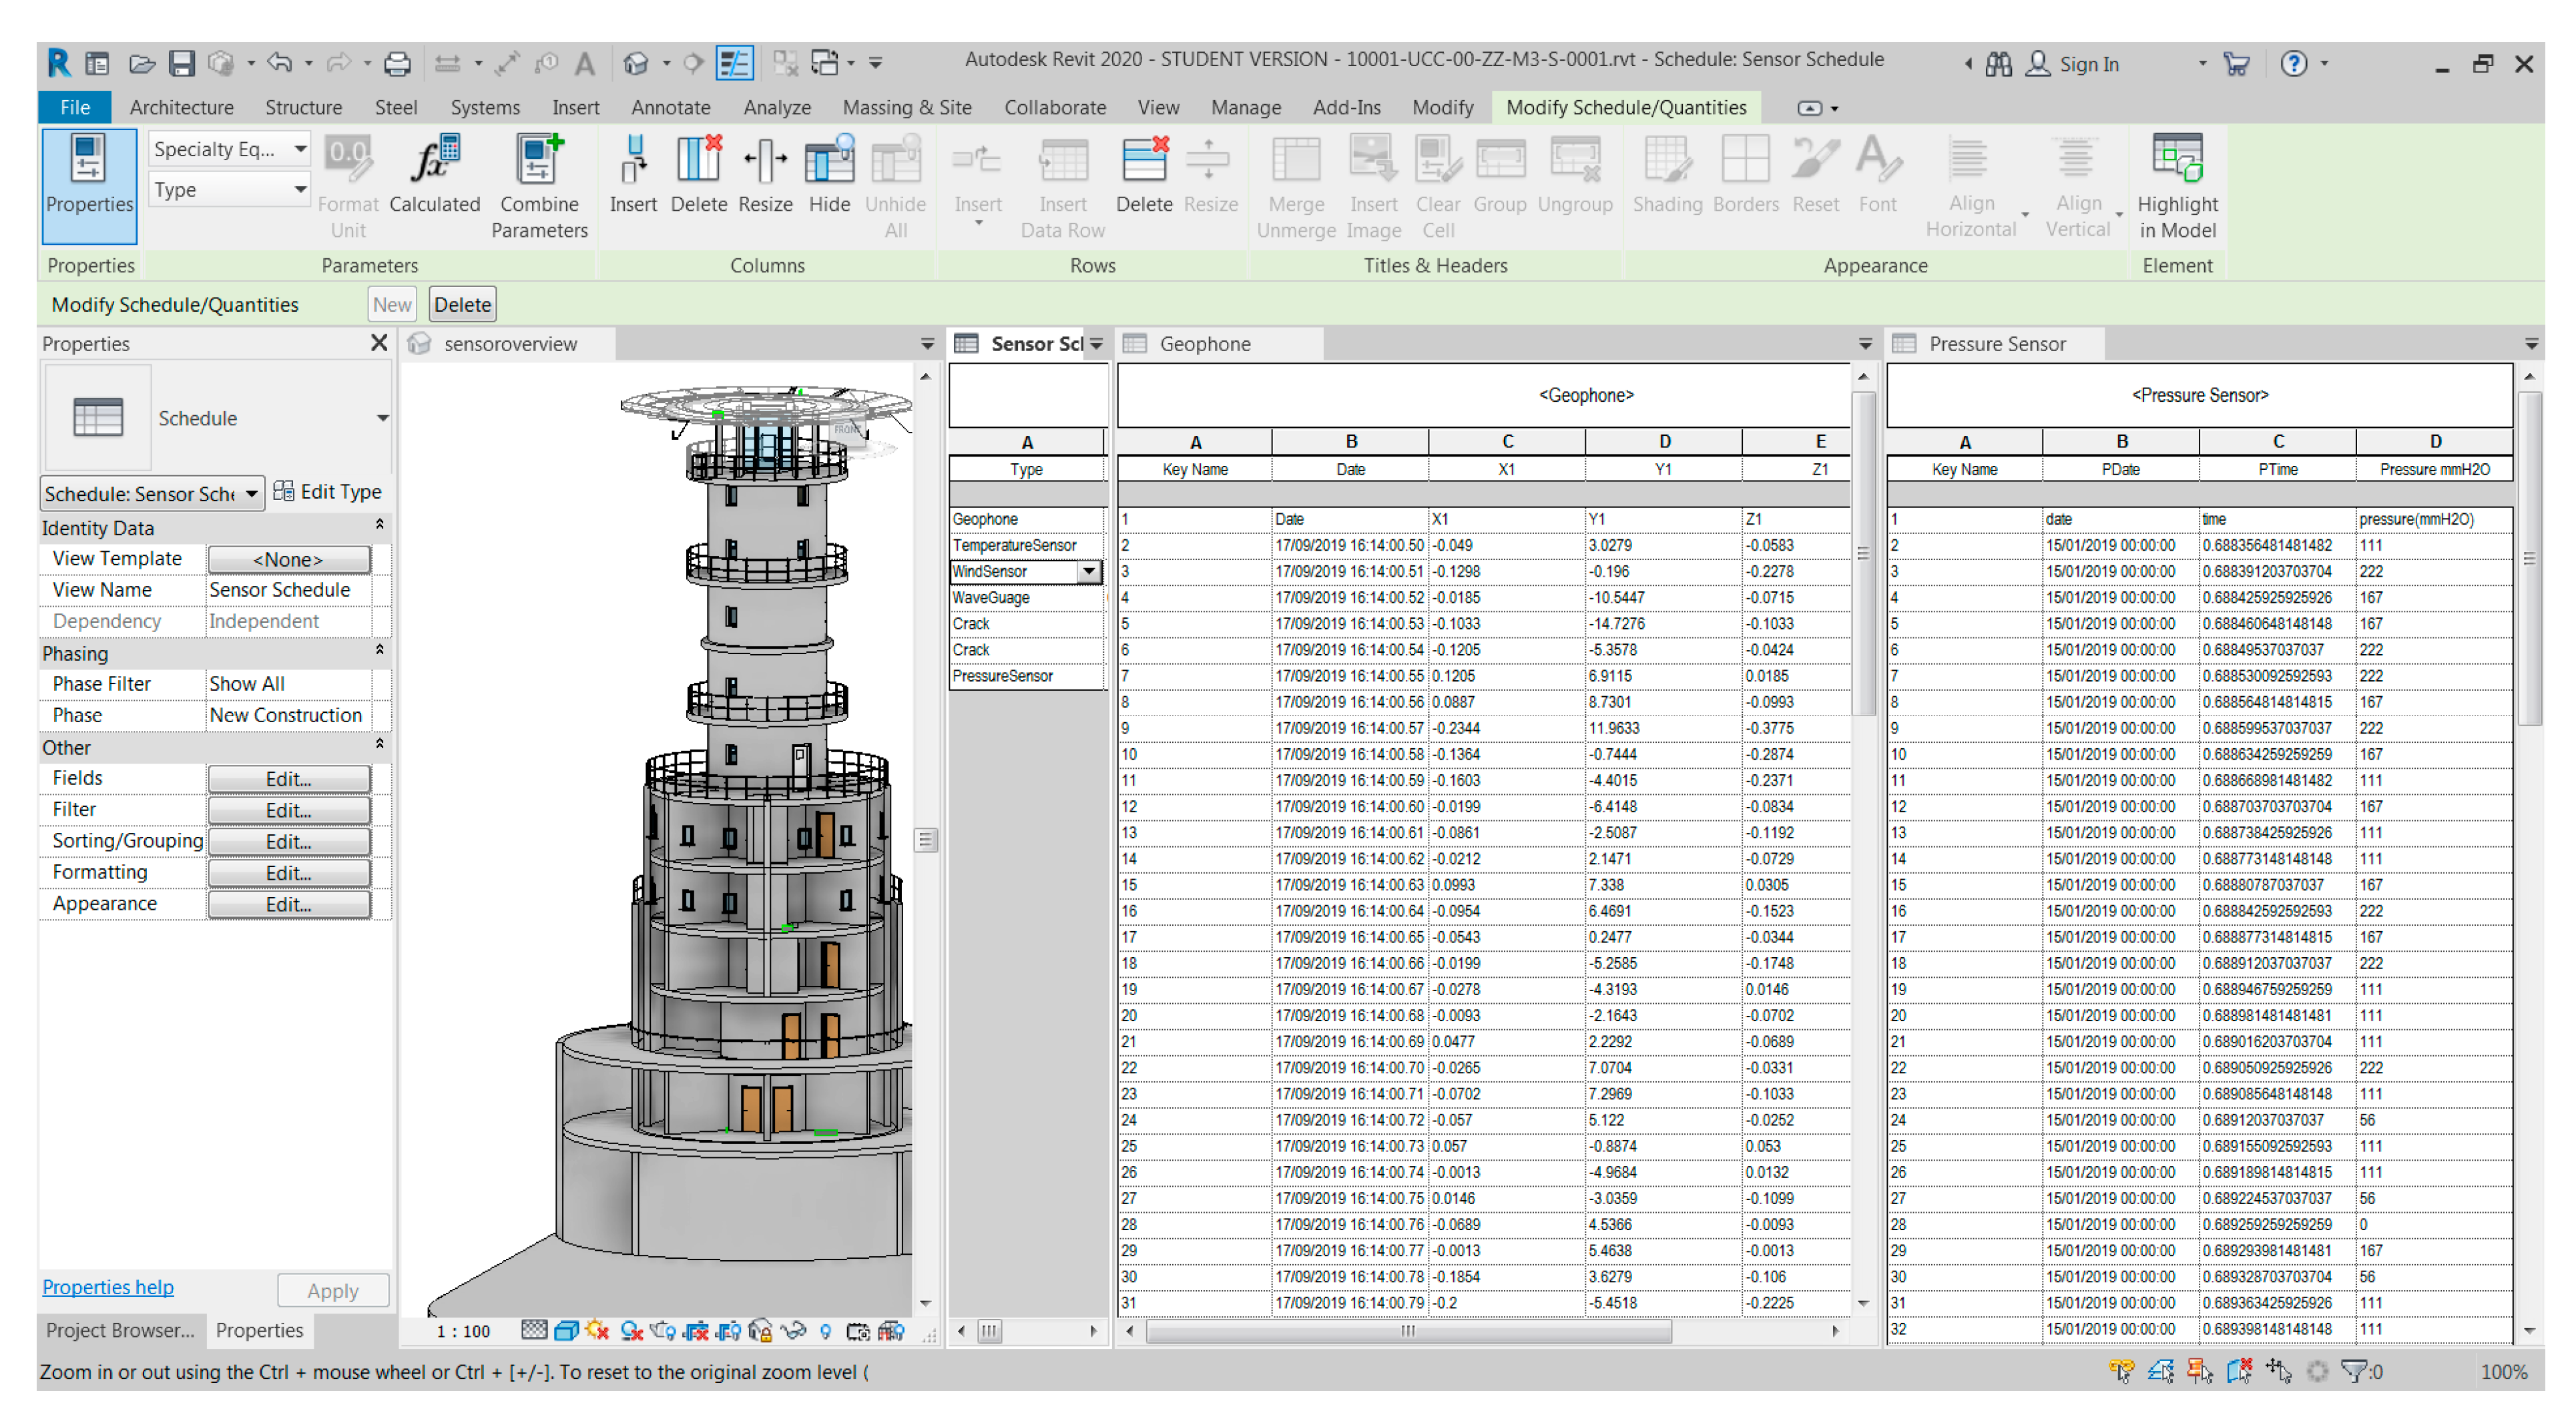
The key schedules for the various sensors’ data are linked with the virtual representation of each sensor in the model. The various sensor data results can be displayed along with the model in Revit. The user can select relevant dates and times to compare the various parameters. In the case shown,
Figure 6, pressure sensor data and geophone accelerations are displayed for a certain event.
3.2. Preliminary Pressure Results
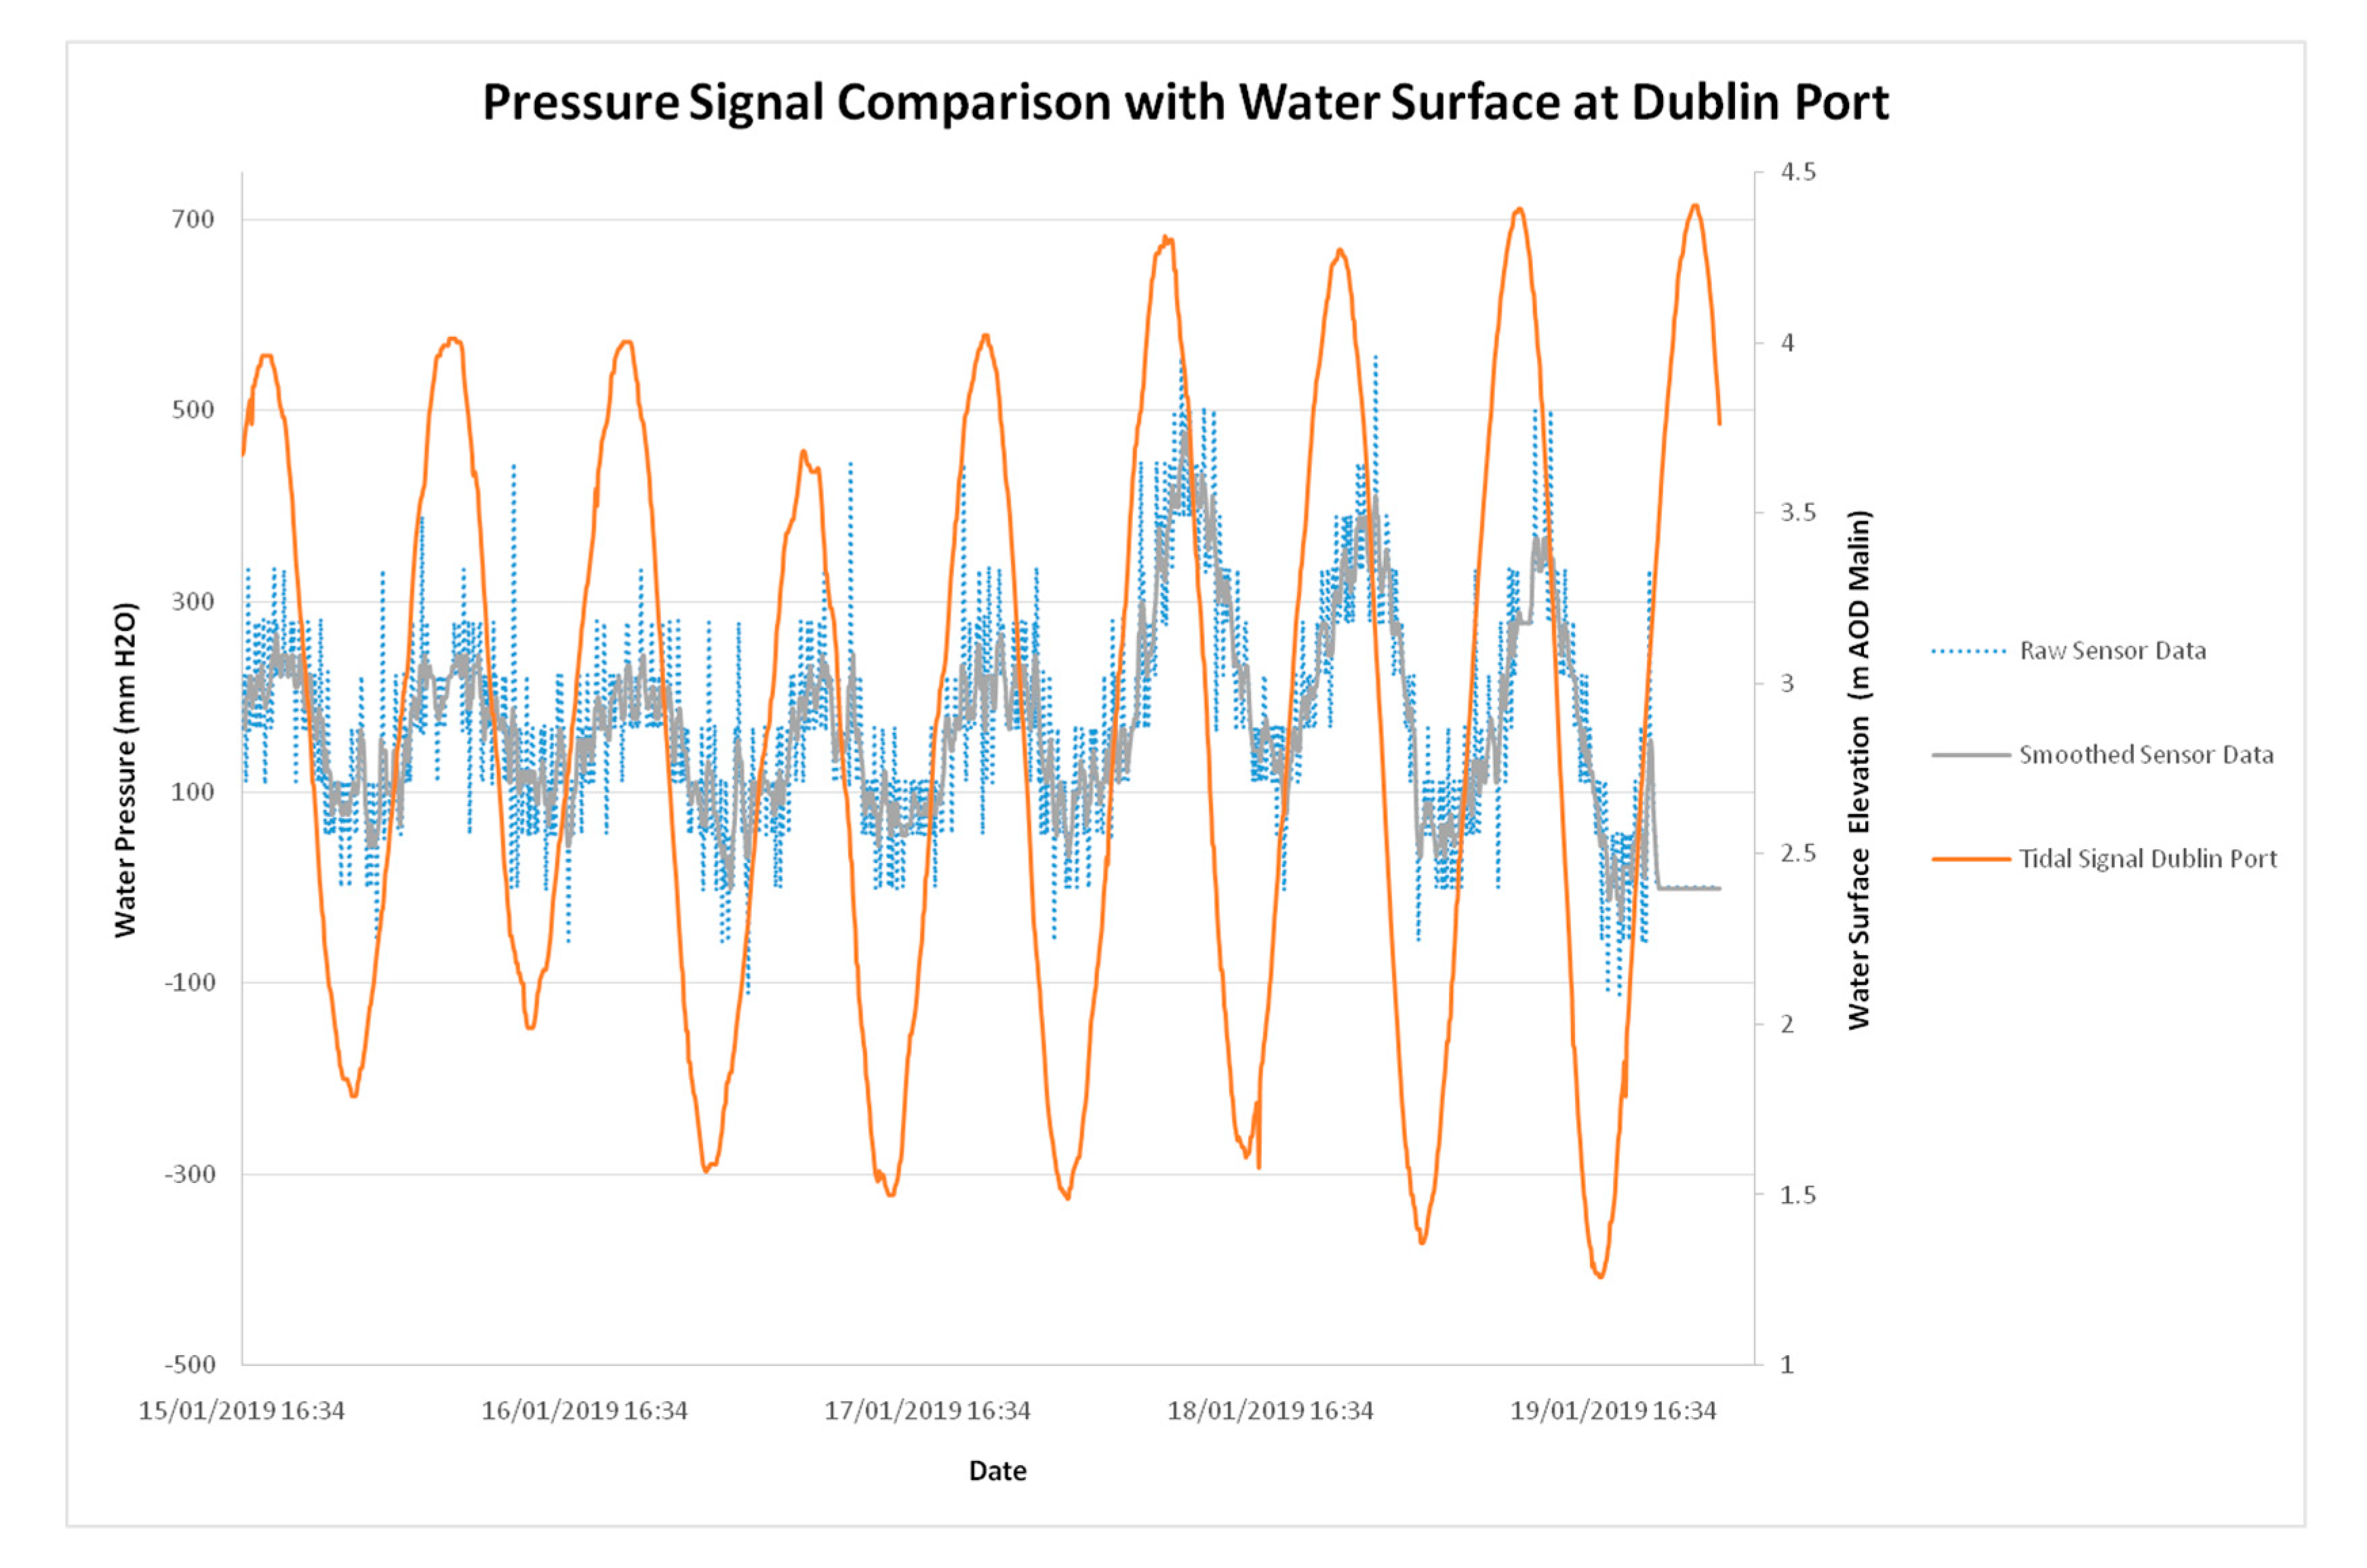
During the commissioning and testing phase of the SHM sensor network development, preliminary pressure readings were recorded and logged. These readings were analysed to identify a distinct pressure variation in the water body underneath floor 0 of the lighthouse tower. The pressure signal recorded in mmH
2O is compared with the nearest water level data, Dublin bay buoy,
Figure 7. It is apparent that a tidal signal exists within this enclosed space. The most likely explanation for this is that there is a flow path between the inner section of the gravity caisson and the surrounding water body. Repeated dive inspection surveys have not identified any obvious deviations or potential flow paths from the outer face of the gravity caisson inwards. This suggests that the source could potentially be diffuse, but analysis of the concrete in main structure would suggest an infiltration to generate the signal as recorded is not possible. There is a relatively high void ratio in the grouted annulus (reported at 2%) however the annulus is not in direct contact with the external water body. In considering infiltration and flow paths it should be acknowledged that this pressure signal has existed for at least half the lifetime of the lighthouse and may have always been present.
The times series of the pressure versus the recorded water level,
Figure 7, indicates that a time lag or phase shift exists between the peak surface water level and peak internal pressure. However, this may be misleading as the surface water level is not recorded at the Kish. This area has complex tidal currents and significant variations in water level could exist between the two locations. Ultimately this snapshot of data asks more questions than answered, reinforcing the need for an active continuous multi parameter recording system as is proposed. A more accurate assessment of the impact of this pressure signal on the health of the lighthouse can be undertaken using the enhanced integrate SHM BIM that has now been developed as the sensor datasets are populated.
4. Discussion
This study presents the design and feasibility stage of a project that is intended to collect and analyse a range of data types related to the structural behaviour of an offshore gravity-based lighthouse. Comprehensive analysis of this structure will be undertaken as the SHM database is populated. It is expected that at least one significant storm season will be required to generate the vibration and accelerometer data required for structural analysis. Although preliminary pressure sensor data has been presented here, additional sensor data will enable comprehensive investigation into the cause of this identified anomaly as well as providing insight into the structural health of the light house as a whole.
The sensor network visualised in the 3D BIM environment will enable identification and examination of any correlations between vibrations with wave loadings. A key output is to determine if there is differential movement between the two main structural elements of the light house (caisson and tower). Characterising the gravity-based structures’ response to large storm forces (wind and wave) as well as tidal currents will also enable an assessment on the structures vulnerability to climate change. An analysis of the light houses responses to large storms as predicted with sea level rise will be simulated in finite element analysis (FEA) validated with data collection and visualised within BIM.
Key aspects of the light house structural behaviour can be derived from the sensor data including the global natural frequency modes of the entire structure, and potential frequencies of the component parts if variation from the global deflections are detected. The results of this analysis can be compared to simulated frequency modes derived in FEA through the BIM environment.
The data collected will also provide an insight into the quantification of wave slamming forces by comparing accelerations in the structure, wave height at structure, and incident wave heights. A comparison with commonly used wave loading formula such as Goda [
54], Irschik et al. [
55], Morison [
56], and Wieke and Oumeraci [
57] can be undertaken. This work will in turn feed a detailed stability analysis which ultimately will be incorporated into the BIM as an active warning mechanism.
Correlating time series of the pressure recorded under floor 0 with the in-situ water level sensor data will help clarify the nature of the tidal signal. The preliminary analysis presented herein relies on water level information several tens of km from the site, in a tidally complex region. The in-situ comparison will enable determination as to the phase of the internal water body in relation with the external, from this infiltration rates may be derived. A further study will be the behaviour of the internal water body during storm events and over longer tidal periods (i.e., semi-annual springs). The visualisation of this sub study through the BIM will characterise and potentially locate the range of any potential infiltration points on the outer surface of the light house caisson.
5. Conclusions
This research describes the design of a structural health sensor network to be implemented on an existing offshore structure with several structural health concerns. The study investigated the potential for a BIM as a mechanism whereby SHM data could be integrated. The aim of the SHM is ensuring the lifetime of an offshore structure is extended with minimum cost in addition to optimizing maintenance works. The sensor network has been successfully represented in the BIM for the structure, thus transforming a static Revit model into an SHM tool for asset management of a structure with complicated structural issues. This tool demonstrates the capability of BIM within the offshore structural sector of the built environment whereby data and analysis can be visualised on one platform.
The SHM BIM has been enhanced to integrate real data from the designed SHM system in tabular form linked to virtual sensors in the model. This is achieved utilizing customised visual programming scripts. The approach provides the basis for future visualisations as the datasets of the structural sensors are populated. Furthermore, this enables multi-parameter analysis of the integrity of the structure to be undertaken and visualised within the existing BIM. The enhancement of an existing static BIM model empowers the end user to dynamically update the BIM of their asset depending on the analysis type desired. The system also allows for dynamic reactive expansion of the SHM system where needed, e.g., initial analysis of one sensor within the system, the pressure anomaly under the tower sub floor is shown to have a tidal signal, indicating porosity, a feature that will inform future sensor placement and analysis.
The research also highlights the limitations of the existing IFC schema in enabling such a system being developed to enable interoperability with other BIM platforms.
This monitoring project is in its infancy in terms of data collection, but the key analysis tasks have already been identified. The two major strands of future work will be (1) the analysis of the sensor data in terms of damage potential identification; and (2) the visualisation of the data and subsequent analysis in the BIM to enable assessment of built assets with the aid of a rich dataset.
The focus of the damage analysis will be on the reaction of the lighthouse during storms to identify differential movement in these events. Additionally, the results from proposed crack monitors will be examined for evidence of correlation between storm forcings and crack development. Examining the behaviour of the pressure signal underneath floor 0 in relation to in-situ environmental data will also be prioritised. This analysis will improve on the preliminary assessment which was based on comparison of environmental data in a separate location by utilising natively sensed data.
Developing the capability of time series visualisation from the sensor key schedules is the next step in terms of BIM visualisation. Thereafter, damage visualisation methods such as colour coding the model based on a matrix of sensor data analysis will be developed. The framework for creating a live BIM analysis is in place with the capability of automatic updates through the DYNAMO scripts developed during this study. As the sensor datasets grow, it is expected that a database management tool will be required. The implementation of the system as developed in Revit/Dynamo to the IFC format to enable interoperability within other platforms will also be explored; however, it is not the main focus of this work.
Author Contributions
Conceptualization, methodology, formal analysis, investigation, writing—original draft preparation, writing—review and editing, M.O.; supervision, J.M. All authors have read and agreed to the published version of the manuscript.
Funding
This research received no external funding.
Acknowledgments
We would like to acknowledge the supply of information and data from the commissioners of Irish Lights.
Conflicts of Interest
The authors declare no conflict of interest.
References
- Engelbart, D.C. Augmenting Human Intellect: A Conceptual Framework; Stanford Research Institute: Menlo Park, CA, USA, 1962. [Google Scholar]
- Eastman, C.; Lividini, J.; Stoker, D. A Database for Designing Large Physical Systems. In Proceedings of the National Computer Conference and Exposition, New York, NY, USA, 19–22 May 1975; pp. 603–611. [Google Scholar]
- Edward, S.I. Sketchpad: A Man-Machine Graphical Communication System. Ph.D. Thesis, Massachusetts Institute of Technology, Cambridge, MA, USA, 1963. [Google Scholar]
- Luciani, S.C.; Garagnani, S.; Mingucci, R. BIM tools and design intent. Limitations and opportunities. Implement. Coord. Eval. Prat. BIM 2012, 19–20, 2012. [Google Scholar]
- Arkin, G. The History of Revit-The Future of Design. Available online: http://bimboom.blogspot.com/2007/02/revit-history_11.html (accessed on 15 April 2020).
- McPartland, R. The NBS: What Is the PAS 1192 Framewor. Available online: https://www.thenbs.com/knowledge/what-is-pas-1192-6 (accessed on 13 April 2020).
- RIBA. NBS National BIM Report; Enterprises Ltd.: Newcastle, UK, 2019. [Google Scholar]
- Liebich, T. IFC4—The New BuildingSMART Standard. Presented at the IC Meeting, Helsinki, Finland, 12 March 2013. [Google Scholar]
- Schenck, D.A.; Wilson, P.R. Information Modeling the EXPRESS Way; Oxford University Press: Oxford, UK, 1994. [Google Scholar]
- Xml. Available online: https://www.w3.org/TR/xml/ (accessed on 13 April 2020).
- Volk, R.; Stengel, J.; Schultmann, F. Building Information Modeling (BIM) for existing buildings—Literature review and future needs. Autom. Constr. 2014, 38, 109–127. [Google Scholar] [CrossRef]
- López, F.J.; Lerones, P.M.; Llamas, J.; Gómez-García-Bermejo, J.; Zalama, E. A review of heritage building information modeling (H-BIM). Multimodal. Technol. Interact. 2018, 2, 2. [Google Scholar]
- Murphy, O. Building Information Modelling for Offshore Wind Projects Improving Working Methods and Reducing Costs; Final TLI-SP-00005; ORE Catapult; National Renewable Energy Centre: Blyth Northumberland, UK, 2016. [Google Scholar]
- Bezkorovayniy, V.; Bayazitov, V.; Bobov, D. Management of the Design and Construction of Offshore Oil and Gas Facilities with Bim Base. IOP Confer. Ser. Mater. Sci. Eng. 2018, 463, 042056. [Google Scholar] [CrossRef]
- Garibin, P.; Ol’khovik, E. Development of requirements for the BIM model of the Arctic port facilities exploitation. EDP Sci. 2018, 170, 03027. [Google Scholar] [CrossRef][Green Version]
- Mufti, A.A.; Bakht, B.; Tadros, G.; Horosko, A.T.; Sparks, G. Are Civil Structural Engineers Risk Averse? Can Civionics Help? In Sensing Issues in Civil Structural Health Monitoring; Springer: Berlin/Heidelberg, Germany, 2005; pp. 3–12. [Google Scholar]
- Sigbjörnsson, R.; Smith, E.K. Wave induced vibrations of gravity platforms: A stochastic theory. Appl. Math. Model. 1980, 4, 155–165. [Google Scholar] [CrossRef]
- So-Young, L.; So-Ra, L.; Jeong-Tae, K. Vibration-based structural health monitoring of harbor caisson structure. SPIE 2011, 7981. [Google Scholar] [CrossRef]
- So-Young, L.; Huynh, T.-C.; Kim, J.-T.; Yoon, H.-S.; Han, S.-H. Vibration Characteristics of Gravity-Type Caisson Breakwater Structure with Water-Level Variation. Int. J. Distrib. Sens. Netw. 2013, 9, 261396. [Google Scholar] [CrossRef]
- Lee, S.-Y.; Huynh, T.-C.; Kim, J.-T. A practical scheme of vibration monitoring and modal analysis for caisson breakwater. Coast. Eng. 2018, 137, 103–119. [Google Scholar] [CrossRef]
- Nguyen, C.-U.; Lee, S.-Y.; Kim, H.-T.; Kim, J.-T. Vibration-Based Damage Assessment in Gravity-Based Wind Turbine Tower under Various Waves. Shock Vib. 2019, 2019, 1406861. [Google Scholar] [CrossRef]
- Antonini, A.; Raby, A.; Brownjhon, J.; Pappas, A.; D’Ayala, D. An Integrated Approach for Marine Structures Survivability Assessment: The Fastnet Lighthouse Within the stormlamp project. Presented at the IDRA 2018, Ancona, Italy, 12–14 September 2018. [Google Scholar]
- Trinh, Q.; Raby, A.; Banfi, D.; Corrado, M.; Chiaia, B.; Rafiq, Y.; Cali, F. Modelling the Eddystone Lighthouse response to wave loading. Eng. Struct. 2016, 125, 566–578. [Google Scholar] [CrossRef][Green Version]
- Brownjohn, J.M.W.; Raby, A.; Au, S.-K.; Zhu, Z.; Wang, X.; Antonini, A.; Pappas, A.; D’Ayala, D. Bayesian operational modal analysis of offshore rock lighthouses: Close modes, alignment, symmetry and uncertainty. Mech. Syst. Signal. Process. 2019, 133, 106306. [Google Scholar] [CrossRef]
- Raby, A.C.; Antonini, A.; Pappas, A.; Dassanayake, D.T.; Brownjohn, J.M.W.; D’Ayala, D. Wolf Rock lighthouse: Past developments and future survivability under wave loading. Philos. Trans. R. Soc. Math. Phys. Eng. Sci. 2019, 377, 2155. [Google Scholar] [CrossRef]
- Rio, J.; Ferreira, B.; Martins, J.P.P. Expansion of IFC model with structural sensors. Informes Construcción 2013, 65, 219–228. [Google Scholar] [CrossRef]
- Davila Delgado, J.; Brilakis, I.; Middleton, C. Modelling, management, and visualisation of structural performance monitoring data on BIM. 2016. In Transforming the Future of Infrastructure through Smarter Information, Proceedings of the International Conference on Smart Infrastructure and Construction Construction, Cambridge, UK, 27–29 June 2016; ICE Publishing: London, UK, 2016; pp. 543–549. [Google Scholar]
- Boddupalli, C.; Sadhu, A.; Rezazadeh Azar, E.; Pattyson, S. Improved visualization of infrastructure monitoring data using building information modeling. Struct. Infrastruct. Eng. 2019, 15, 1247–1263. [Google Scholar] [CrossRef]
- Wang, H.; Gluhak, A.; Meissner, S.; Tafazolli, R. Integration of BIM and live sensing information to monitor building energy performance. Presented at the The CIB 30th International Conference on Applications of IT in the AEC Industry, Bejing, China, 9–12 October 2013. [Google Scholar]
- Wang, J.; Fu, Y.; Yang, X. An integrated system for building structural health monitoring and early warning based on an Internet of things approach. Int. J. Distrib. Sens. Netw. 2017, 13. [Google Scholar] [CrossRef]
- Kim, Y.; Cho, S.; Kim, K.G. Real Time Building Data collecting Using IoT and BIM’. Presented at the 2018 Asian Conference on Desing and Engineering, Okinawa, Japan, 5–9 November 2018. [Google Scholar]
- Gerrish, T.; Ruikar, K.; Cook, M.J.; Johnson, M.; Phillip, M. Attributing in-use building performance data to an as-built building information model for lifecycle building performance management. Eng. Build. 2015, 78, 27–29. [Google Scholar]
- Banfi, F.; Barazzetti, L.; Previtali, M.; Roncoroni, F. Historic BIM: A new repository for structural health monitoring. Int. Arch. Photogram Remote Sens. Spat. Inform. Sci. 2017, 42, 269–274. [Google Scholar] [CrossRef]
- Sternal, M.; Dragos, M. BIM-Based Modeling of Structural Health Monitoring Systems Using the IFC Standard. In Proceedings of the 28th Forum Bauinformatik, Hanover, Germany, 20 September 2016. [Google Scholar]
- Valinejadshoubi, M.; Bagchi, A.; Moselhi, O. Development of a BIM-Based Data Management System for Structural Health Monitoring with Application to Modular Buildings: Case Study. J. Comput. Civil Eng. 2019, 33, 05019003. [Google Scholar] [CrossRef]
- Tsai, Y.-H.; Wang, J.; Chien, W.-T.; Wei, C.-Y.; Wang, X.; Hsieh, S.-H. A BIM-based approach for predicting corrosion under insulation. Autom. Constr. 2019, 107, 102923. [Google Scholar] [CrossRef]
- Romano, P.; Brito, P. Degradation Monitoring Systems for a BIM Maintenance Approach. In Sustainable Construction and Building Materials; IntechOpen: London, UK, 2018. [Google Scholar]
- Fleming, W.S. BIM Modelling for Structural Analysis. Master’s Thesis, Master of Technology: Structural Engineering, Faculty of Civil and Environmental Engineering, Poznan University, Poznan, Poland, 2016. [Google Scholar]
- McGuire, B.M. Using Building Information Modeling to Track and Assess the Structural Condition of Bridges; Colorado State University: Fort Collins, CO, USA, 2014. [Google Scholar]
- Theiler, M.; Smarsly, K. IFC Monitor–An IFC schema extension for modeling structural health monitoring systems. Adv. Eng. Inform. 2018, 37, 54–65. [Google Scholar] [CrossRef]
- Theiler, M.; Dragos, K.; Smarsly, K. BIM-Based Design of Structural Health Monitoring Systems. Presented at The 11th International Workshop on Structural Health Monitoring 2017, Stanford, CA, USA, 12–14 September 2017. [Google Scholar]
- Ibanez, S.P.; Fitz, T.; Smarsly, K. A semantic model for wireless sensor networks in cognitive buildings. ASCE 2019, 6, 2019. [Google Scholar]
- Nezamaldin, D. Parametric Design with Visual Programming in Dynamo with Revit: The Conversion from CAD Models to BIM and the Design of Analytical Applications. Master’s Thesis, KTH Royal Institute of Technology, Stockholm, Sweden, January 2019. [Google Scholar]
- Store Arduino. Arduino; Arduino LLC: Somerville, MA, USA, 2015. [Google Scholar]
- Kensek, K. Integration of Environmental Sensors with BIM: Case Studies Using Arduino, Dynamo, and the Revit API; CSIC: Madrid, Spain, 2014. [Google Scholar]
- Naylor, D.; Haughey, N.; Clayton, G.; Graham, J. The Kish Bank Basin, offshore Ireland. Geo. Soc. Lond. 1993, 4, 845–855. [Google Scholar] [CrossRef]
- Frode, H. Design and Construction of the Kish Bank Lighthouse’, Institution of Civil Engineers of Ireland, Transactions of the ICEI; Engineers Ireland: Dublin, Ireland, 1965. [Google Scholar]
- Roberts, W. Kish Bank Lighthouse Initial Inspection and Review; Halcrow: London, UK, 1989. [Google Scholar]
- Halcrow. Kish Bank Lighthouse Structural Investigation and Testing; Halcrow Offshore: London, UK, 1990; 01/KB/05/1990. [Google Scholar]
- King, P. Assesment of te Kish Bank Lighthouse; Roghan O’Donovan: Dublin, Ireland, 2015; 15.109.10. [Google Scholar]
- Rdl Vibe Remote Vibration Monitoring, Rdl Vibe, Mar. 30, 2020. Available online: https://www.captiondata.com/rdlvibe-remote-vibration-monitoring-system-see-how-easy-it-is-to-set-up/ (accessed on 14 March 2020).
- Pi, Raspberry. Raspberry pi 3 model b. In Onlinehttpswww; Raspberrypi Org.: Cambridge, UK, 2015. [Google Scholar]
- Log-aLevel 2007. User Manual for Stationary and Mobile Version; Version 12.07; General Acoustics: Kiel, Germany, 2007. [Google Scholar]
- Goda, Y. A study on impulsive breaking wave force upon a vertical pile. Rept Port. Harb. Res. Inst. 1966, 5, 1–30. [Google Scholar]
- Irschik, K.; Sparboom, U.; Oumeraci, H. Breaking wave loads on a slender pile in shallow water. In Coastal Engineering 2004: (In 4 Volumes); World Scientific: Singapore, 2005; pp. 568–580. [Google Scholar]
- Morison, J.R.; Johnson, J.W.; Schaaf, S.A. The force exerted by surface waves on piles. J. Pet. Technol. 1950, 2, 149–154. [Google Scholar] [CrossRef]
- Wienke, J.; Oumeraci, H. Breaking wave impact force on a vertical and inclined slender pile—theoretical and large-scale model investigations. Coast. Eng. 2005, 52, 435–462. [Google Scholar] [CrossRef]
© 2020 by the authors. Licensee MDPI, Basel, Switzerland. This article is an open access article distributed under the terms and conditions of the Creative Commons Attribution (CC BY) license (http://creativecommons.org/licenses/by/4.0/).


