Article

The Energy Cost of Cold Thermal Discomfort in the Global South

by
Abdulla N. Alnuaimi
and
Sukumar Natarajan
*
Department of Architecture & Civil Engineering, University of Bath, Bath BA2 7AY, UK
*
Author to whom correspondence should be addressed.
Buildings 2020, 10(5), 93; https://doi.org/10.3390/buildings10050093
Submission received: 3 April 2020 / Revised: 1 May 2020 / Accepted: 11 May 2020 / Published: 15 May 2020
(This article belongs to the Section Building Energy, Physics, Environment, and Systems)

Abstract

:
The Global South, much of it in warm tropical latitudes, is expected to double its total energy demand by 2050. In addition to increased mean demand, greater demand for space cooling during external temperature peaks will exacerbate the strain on already fragile energy networks. Recent anecdotal evidence that a proportion of the increase in cooling demand is driven by cold—rather than warm—indoor thermal discomfort, suggests the imposition of an unnecessary cooling energy cost. Here, we investigate the impact of this cost on the expanding Global South using field data from four cities in India, Philippines, and Thailand. We observe that mean cold discomfort across the four cities is roughly 45 percentage points higher than warm discomfort, suggesting warmer indoor temperatures would not only lower overall discomfort but also reduce cooling energy demand. Computer simulations using a calibrated building model reveal that average savings of 10%/Kelvin and peak reductions of 3%–19%, would be feasible across the expected external temperature range in these cities. This suggests that more climatically appropriate indoor thermal comfort standards in the Global South would not only significantly counteract the expected rise in energy demand, but also produce more comfortable indoor conditions and reduce peak demand.

1. Introduction

The built environment today is continuously expanding at the highest rate ever seen in human history. This expansion is largely driven by historically unurbanized developing economies – collectively termed The Global South in this paper. As an increase in built footprint is known to be accompanied by rising total and per-capita energy consumption which increases carbon emissions, there is an urgent need to mitigate this demand [1]. Indeed, current estimates suggest at least a doubling of total energy consumption by 2050 [2,3].
As the Global South is broadly comprised of countries with warm climates, space cooling as an end use accounts for 30%–40% of the total energy consumption annually [4,5]. In the future, it has been projected that worldwide space cooling output capacity will triple from around 2.0 PWh in 2016 to approximately 6.2 PWh in 2050, much of this in the Global South [4,5]. The increasing demand for cooling not only increases the mean energy demand, but also peak loads as the greatest demand for cooling is likely to occur simultaneously across the built stock during high external temperatures.
However, in this paper we are interested in the question of how much of this increased demand is really “needed”. There are two broad components to the overall increase in demand for space cooling. The first is the “level of service” needed, which is primarily a function of the chosen internal setpoint temperature, such that, lower setpoints result in greater demand. As a country develops and incomes rise, the ability to spend money on greater cooling capacity increases. For example, where a dwelling may have only been able to afford a single ton (3.5 kW) of air-conditioning in the past, falling prices and rising incomes might easily triple this. The implication of this is that larger installed capacities will be able to deliver a broader range of indoor temperatures, particularly at the lower end of the scale. The second is simply a function of market penetration. In our previous example, this would be the equivalent of the same home now being able to buy multiple units for different rooms or many more homes now being able to afford air-conditioning. The overall effect of both components is to increase cooling energy demand, but for very different reasons.
In this paper, we are interested in the impact, in energy terms, of the first of these components—i.e., the impact of buildings being able to cool spaces to low temperatures. We take a low temperature simply as one that results in cold discomfort. Previous thermal comfort studies conducted in Global South countries have suggested elevated levels of cold thermal discomfort are pervasive [6,7,8,9,10,11]. The main reason for this appears to be the common practice of setting the cooling setpoint in accordance with international thermal comfort standards, such as the ASHRAE (American Society of Heating, Refrigerating and Air-Conditioning Engineers) 55 standard [12], which were developed in climates with mild summers [12,13,14,15,16].

Thermal Comfort in the Global South
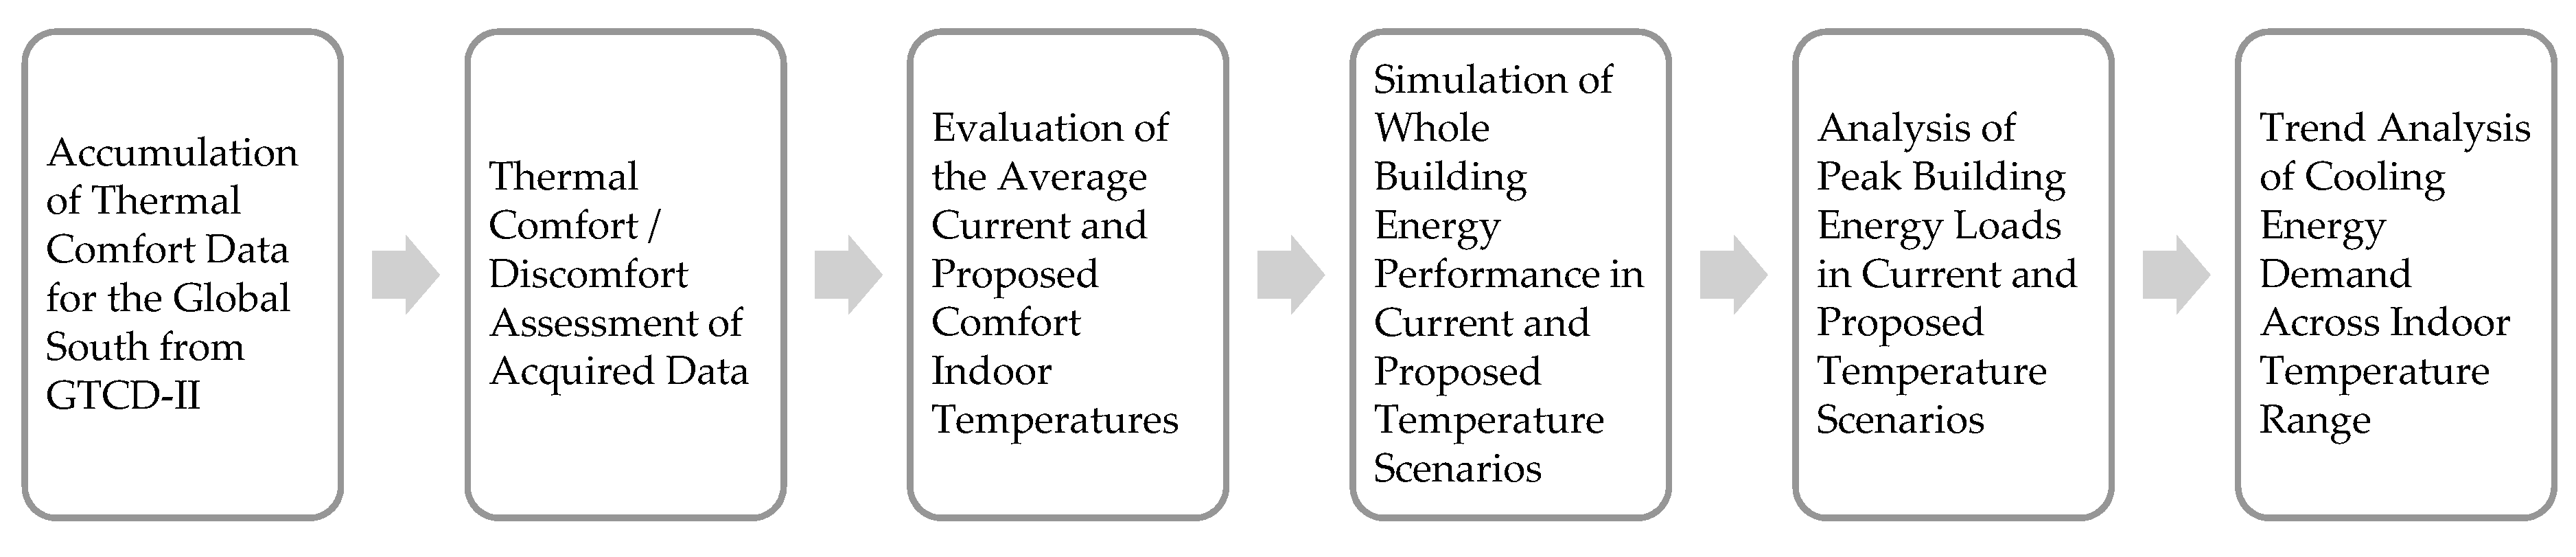
Thermal comfort is most commonly defined as the expression of satisfaction and acceptability of the experienced thermal environment that is represented by a comfortable state of mind [12]. Thermal comfort can be assessed through several standards such as the ISO (International Organization for Standardization) 7730 [13], the ASHRAE Standard 55 [12], and the EN (European Standard) 16798-1:2019 [16]. Thermal comfort standards impact the means in which thermal comfort is achieved and maintained within the built environment.
Evaluating thermal comfort involves examining physical, personal, and subjective metrics of building occupants in an enclosed space. Physical metrics comprise the occupant-associated air temperature, mean radiant temperature, air velocity, relative humidity, whereas the personal metrics are the clothing insulation value and the metabolic activity level [12,13,14,15,16]. These are correlated against subjective metrics such as the thermal sensation vote (TSV) i.e., the occupants’ individual perception of their thermal environment on a 7 point ordinal scale ranging from cold (−3) to neutral (0) to hot (+3) [12,13,14,15,16]. The TSV is often used in regression analysis with associated internal temperatures to determine the ideal comfort temperature for the sampled occupants in a building or set of buildings [17,18,19,20,21,22]. Regardless of the thermal comfort model or standard employed (see below), fundamentally, the building occupant’s thermal responses—one of which being the TSV—are considered to be valid indicators of their thermal comfort.
There are two types of thermal comfort models, heat-balance and adaptive, which are derived either from studies in a dedicated climatic chamber or field studies, respectively [23,24,25]. Of these, the heat balance model, based on the human body’s heat exchange process, is considered appropriate for mechanically conditioned spaces, whereas the adaptive models are for use in naturally ventilated buildings [9,19,23,24,26]. The rest of this paper only considers the heat-balance model as external temperatures in many parts of the developing world are often above 30 °C, the nominal limit of the adaptive model, making air-conditioning inevitable for at least some of the year.
The PMV (predicted mean vote) is used in the heat-balance model to identify the mean thermal sensation of a group of building occupants through a range of physical and personal variables on the same scale as the TSV, as above [12,13,14,15,16,27]. This makes it possible, at a very fundamental level, to compare predictions (i.e., PMV) against observations (i.e., TSV) in real buildings. PMV ranges for attaining thermal comfort are defined within the standards, with buildings with “normal” levels of expectation (e.g., offices) taken to be comfortable when −0.5 > PMV > +0.5 [12,13,14,15,16]. For office workers wearing business attire, this usually translates to a desirable indoor operative temperature of 23 ± 2 °C (this is a weighted average of the mean radiant and air temperatures in a space which, under typical conditions, translates to their arithmetic mean). Individual differences in the building occupants’ notion of thermal comfort make achieving a universal thermal comfort range difficult, therefore standards intend to achieve thermal satisfaction within each space for the majority of the occupants, considered as over 80% [12,13,14,15,16]. The widespread distribution of space cooling systems in warm climates has provided indoor thermal comfort even in extremely warm climatic conditions. However, it is often the case that much more energy is expended in providing this comfort than might otherwise be needed, as cooling systems can be oversized to counteract the effect of poor envelope thermal performance. This is an aspect of wasted cooling energy that requires a separate study. However, research in a small number of countries within the Global South has uncovered worrying evidence of excessive cooling indicated by cold thermal discomfort responses from occupants [28,29,30]. For example, more than 20% of occupants have been seen to experience an uncomfortably cool to cold thermal sensation [6,7,8,9,10,11]—which is remarkable given that the original objective of the cooling must have been to ensure that no more than 20% of occupants experienced warm discomfort.
The observation that buildings are being overcooled is supported by the literature, though the evidence is weighted towards the Global North. For example, one study estimates that overcooling in American buildings adds an annual cost of USD 10 billion in the United States [7]. These studies have primarily implicated poor engineering design assumptions around the widely used variable air volume (VAV) systems with reheat, such as the study of seven buildings in California [31]. These have been supported by results from simulation studies, including those from emerging economies such as China [32,33,34]. The link between the energy cost and thermal comfort, the focus of this paper, has also been made through field data from the US supported primarily by evidence—the majority of it anecdotal—from other industrialised countries such as Australia, Canada, France, Greece, Singapore, Sweden, and the UK, and from the two emerging Asia-Pacific economies of Indonesia and Thailand [35,36]. Some research has also pointed towards moving buildings away from mechanical conditioning to natural ventilation, with higher indoor temperatures, to improve comfort and reduce energy [37].
While a comprehensive review of the literature is beyond the scope of this paper, it is clear that overcooling and the resultant “wasted” energy demand, is a growing concern around the world. Given that building energy consumption contributes 23% of global carbon emissions and that a majority of this consumption in the Global South is from fossil fuel sources [4,5], the reduction of this unnecessary consumption requires urgent attention. Hence, the aim of this paper is to investigate the extent of peak and mean energy savings that are achievable by reducing cold discomfort in warm climates within the Global South.

2. Methods

Achieving our aim requires (i) an estimate of the nature and extent of cold discomfort, if any, in countries in the Global South, (ii) inferring new comfort temperatures that would not produce such discomfort and (iii) a means of estimating the savings achievable through the new comfort temperatures to those recommended in international standards such as ASHRAE 55. Each of these is described below and the resultant individual steps summarized in Figure 1.

2.1. Thermal Comfort Data for the Global South

The ASHRAE Global Thermal Comfort Database II (GTCD-II) is a wide-ranging collection of thermal comfort studies representing over 30,000 building occupant responses within air-conditioned buildings ranging from cities across the world, including the Global South. GTCD-II is available under the Open Database License and the built-in query tool provides easy access [33,38,39,40]. Given that this database is the largest such quality-tested repository of thermal comfort field data, we propose to use it in our analysis.
Using GTCD-II an analysis of the thermal comfort conditions in the Global South is established. GTCD-II accumulates several contributions by researchers, for this reason there exists a variation in the type of data collected which necessitates an initial filtration of the database. We filtered GTCD-II for studies that possess a thermal sensation vote parameter and the six indices of thermal comfort during a summer season in any city located within the Global South. For the purposes of this filter, the Global South was specified based upon the United Nations Development Programme definition [1]. Through this we obtain data for four cities: Bangalore, Bangkok, Delhi, and Makati. This allows for a generalized illustration of thermal comfort within India, Thailand, and the Philippines [38,39,40,41,42]. Each study is analysed to represent the sensed thermal comfort distribution, the predicted thermal comfort, and the average recorded internal temperatures [17,18,19,20,21,22]. To simplify the analysis, we take TSV below (−1) as “cold”, above (+1) as “hot” and in between the two as “neutral”. PMV is similarly mapped to these categories. We also use the TSV to obtain a measure of discomfort, with the space as a whole being taken as uncomfortable if more than 20% of the vote is below (−1) or above (+1).

2.2. Comfort Temperatures

The current building temperature setpoints for simulation (next section) are taken from the average internal temperatures recorded in each study for the Bangalore, Bangkok, Delhi, and Makati data. This allows us to build a clear picture of the actual scale of reductions that would be attained. Proposed comfort temperatures Tc (°C) for each region are obtained using regression analysis on the available thermal comfort data through the standard Griffiths method [20]. The regression analysis utilizes the thermal sensation votes to the associated internal temperatures which allows for the calculation of the comfort temperature to be evaluated which depicts the temperature within the study that is noted to produce a neutral vote (0) on the thermal sensation scale [17,18,19,20,21,22].
The comfort temperature calculated is associated with the Griffiths coefficient (G). We use G = 0.50 as this is widely used in warm climate thermal comfort research [21,43]. The internal air temperature Ta (°C) and the TSV is taken from each occupant response. The Griffiths method is used for calculating the comfort temperature from the study groups using Equation (1) [20,21].
T c = T a + ( 0 T S V ) / G  
By focusing on each populations’ thermal sensation votes, this method considers the existing thermal biases of the building occupants to certain temperatures within each region which allows for a personalized assessment of the comfort temperatures [17,19,44]. The comfort temperature evaluated through the analysis illustrates the potential internal temperature that would result in the highest occurrence of thermal comfort for each region which serves as a basis for the proposed building temperature setpoints.

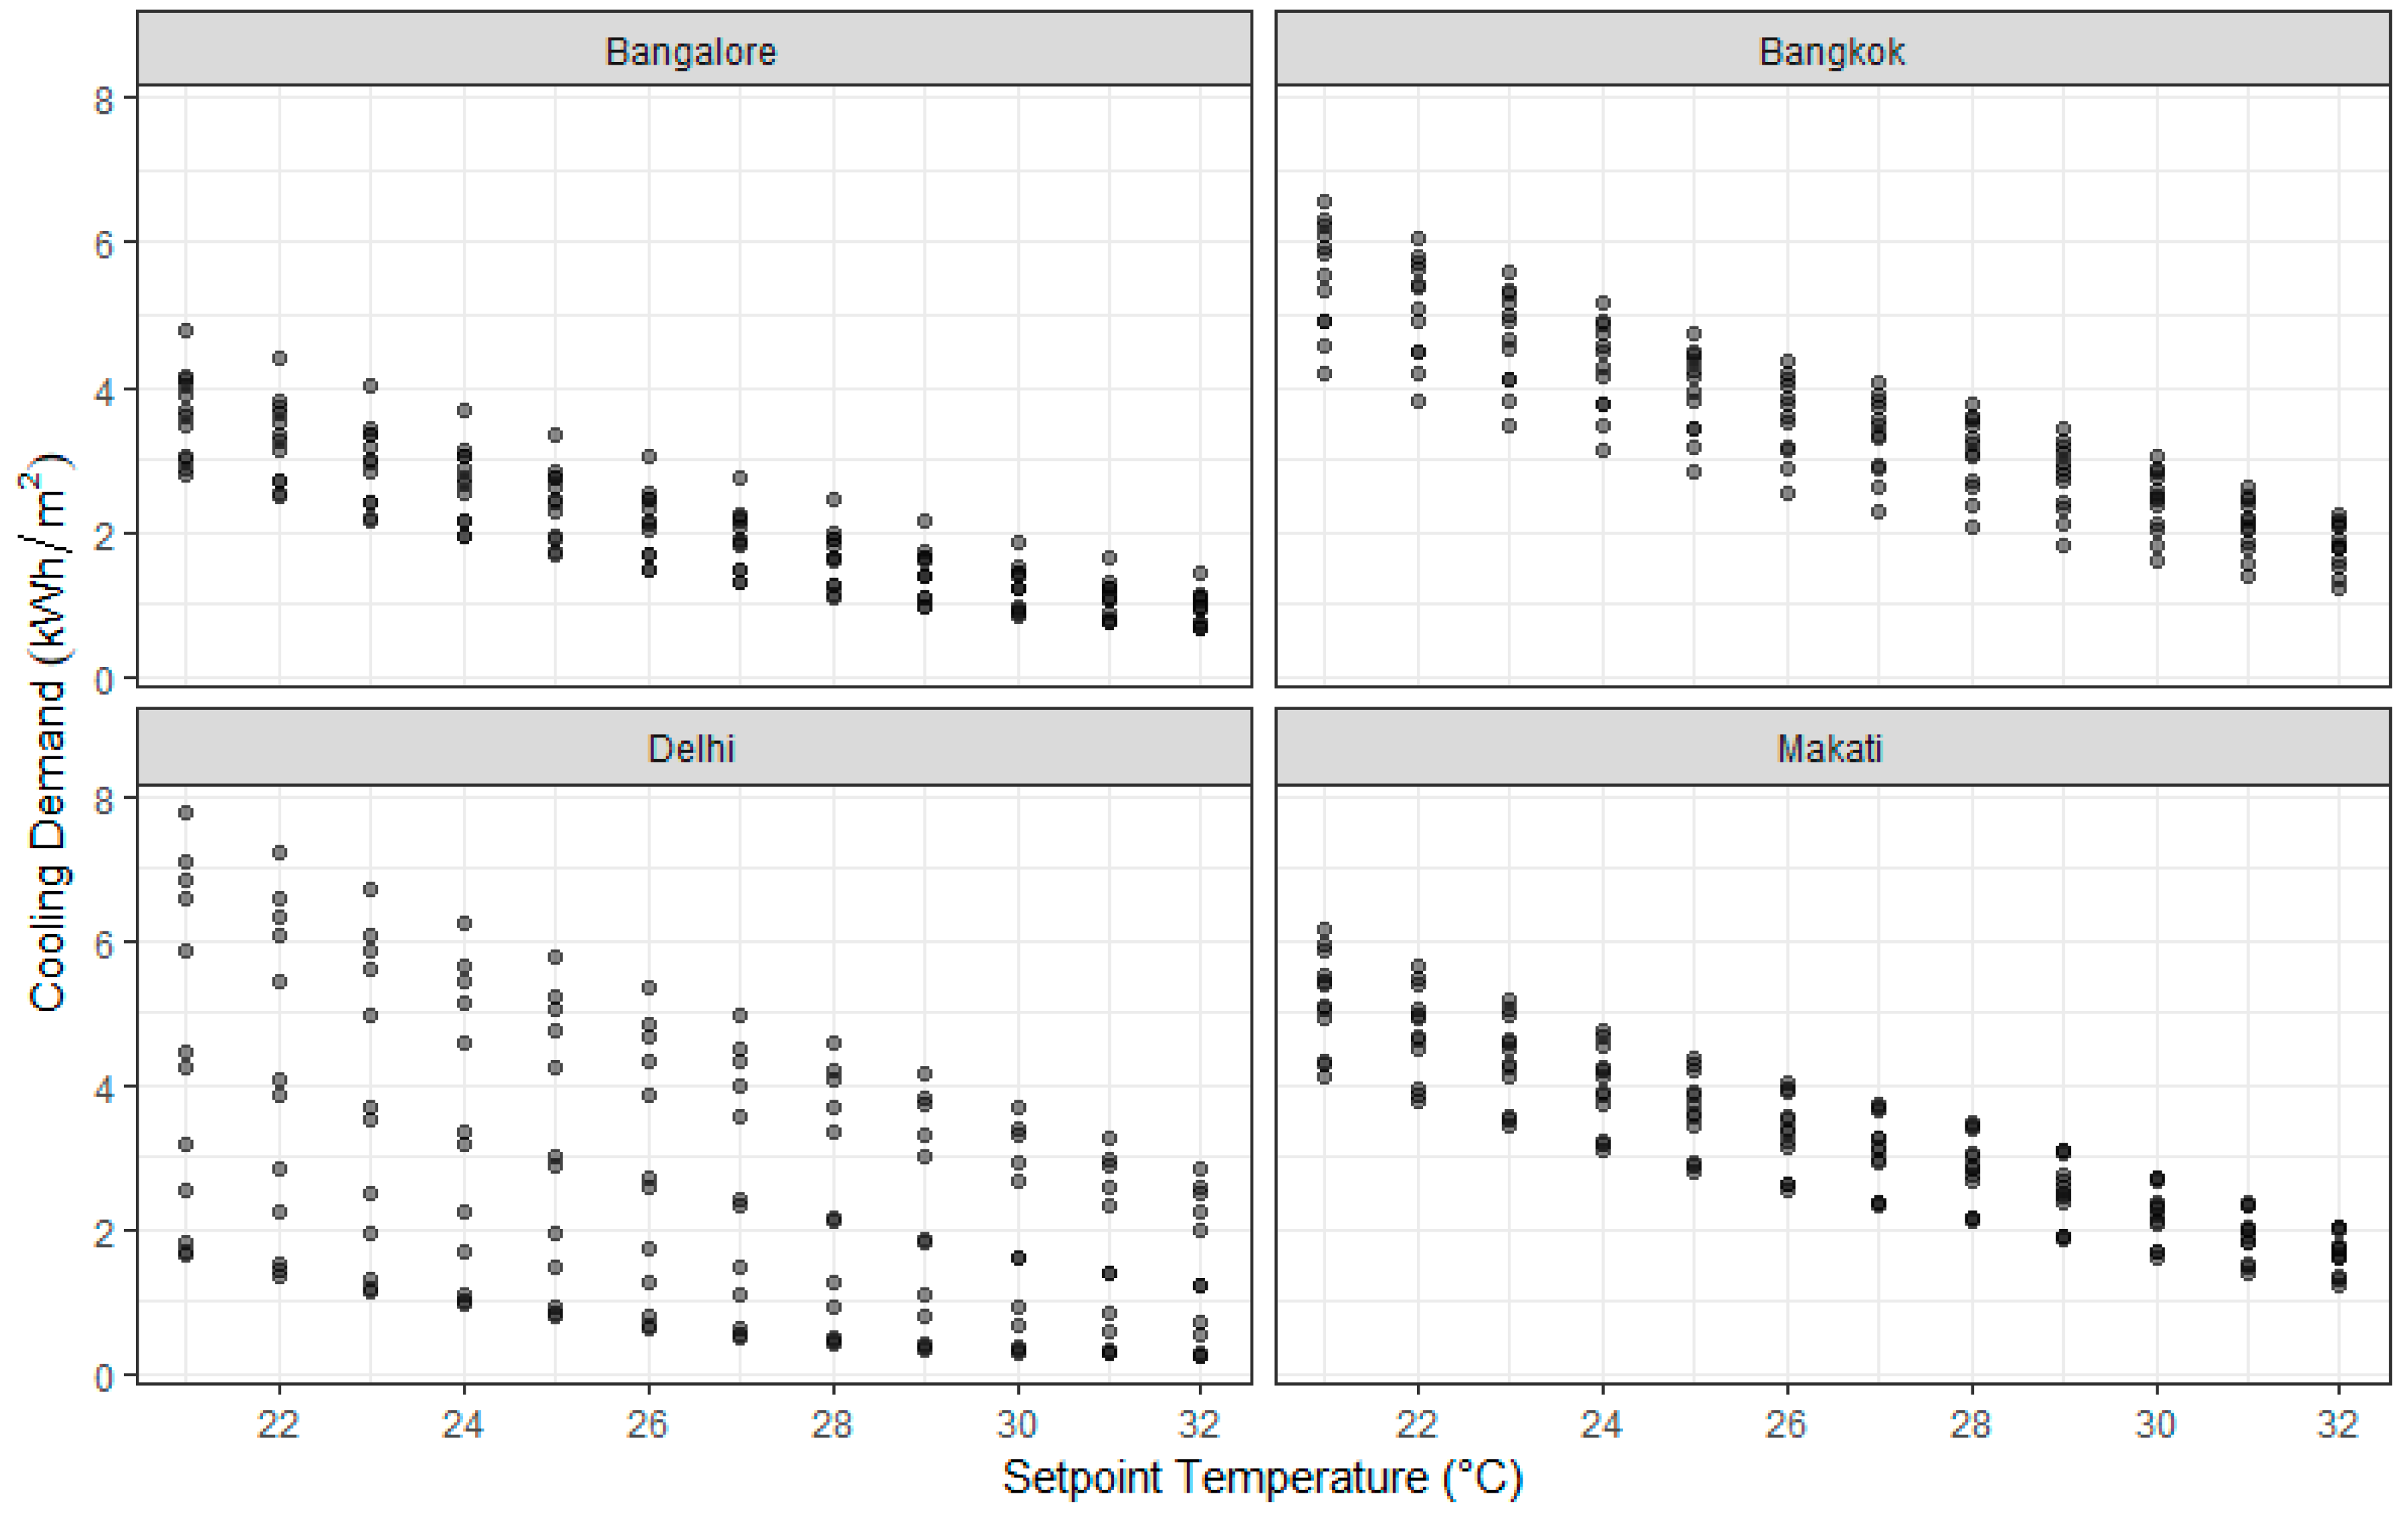
2.3. Building Energy Simulation
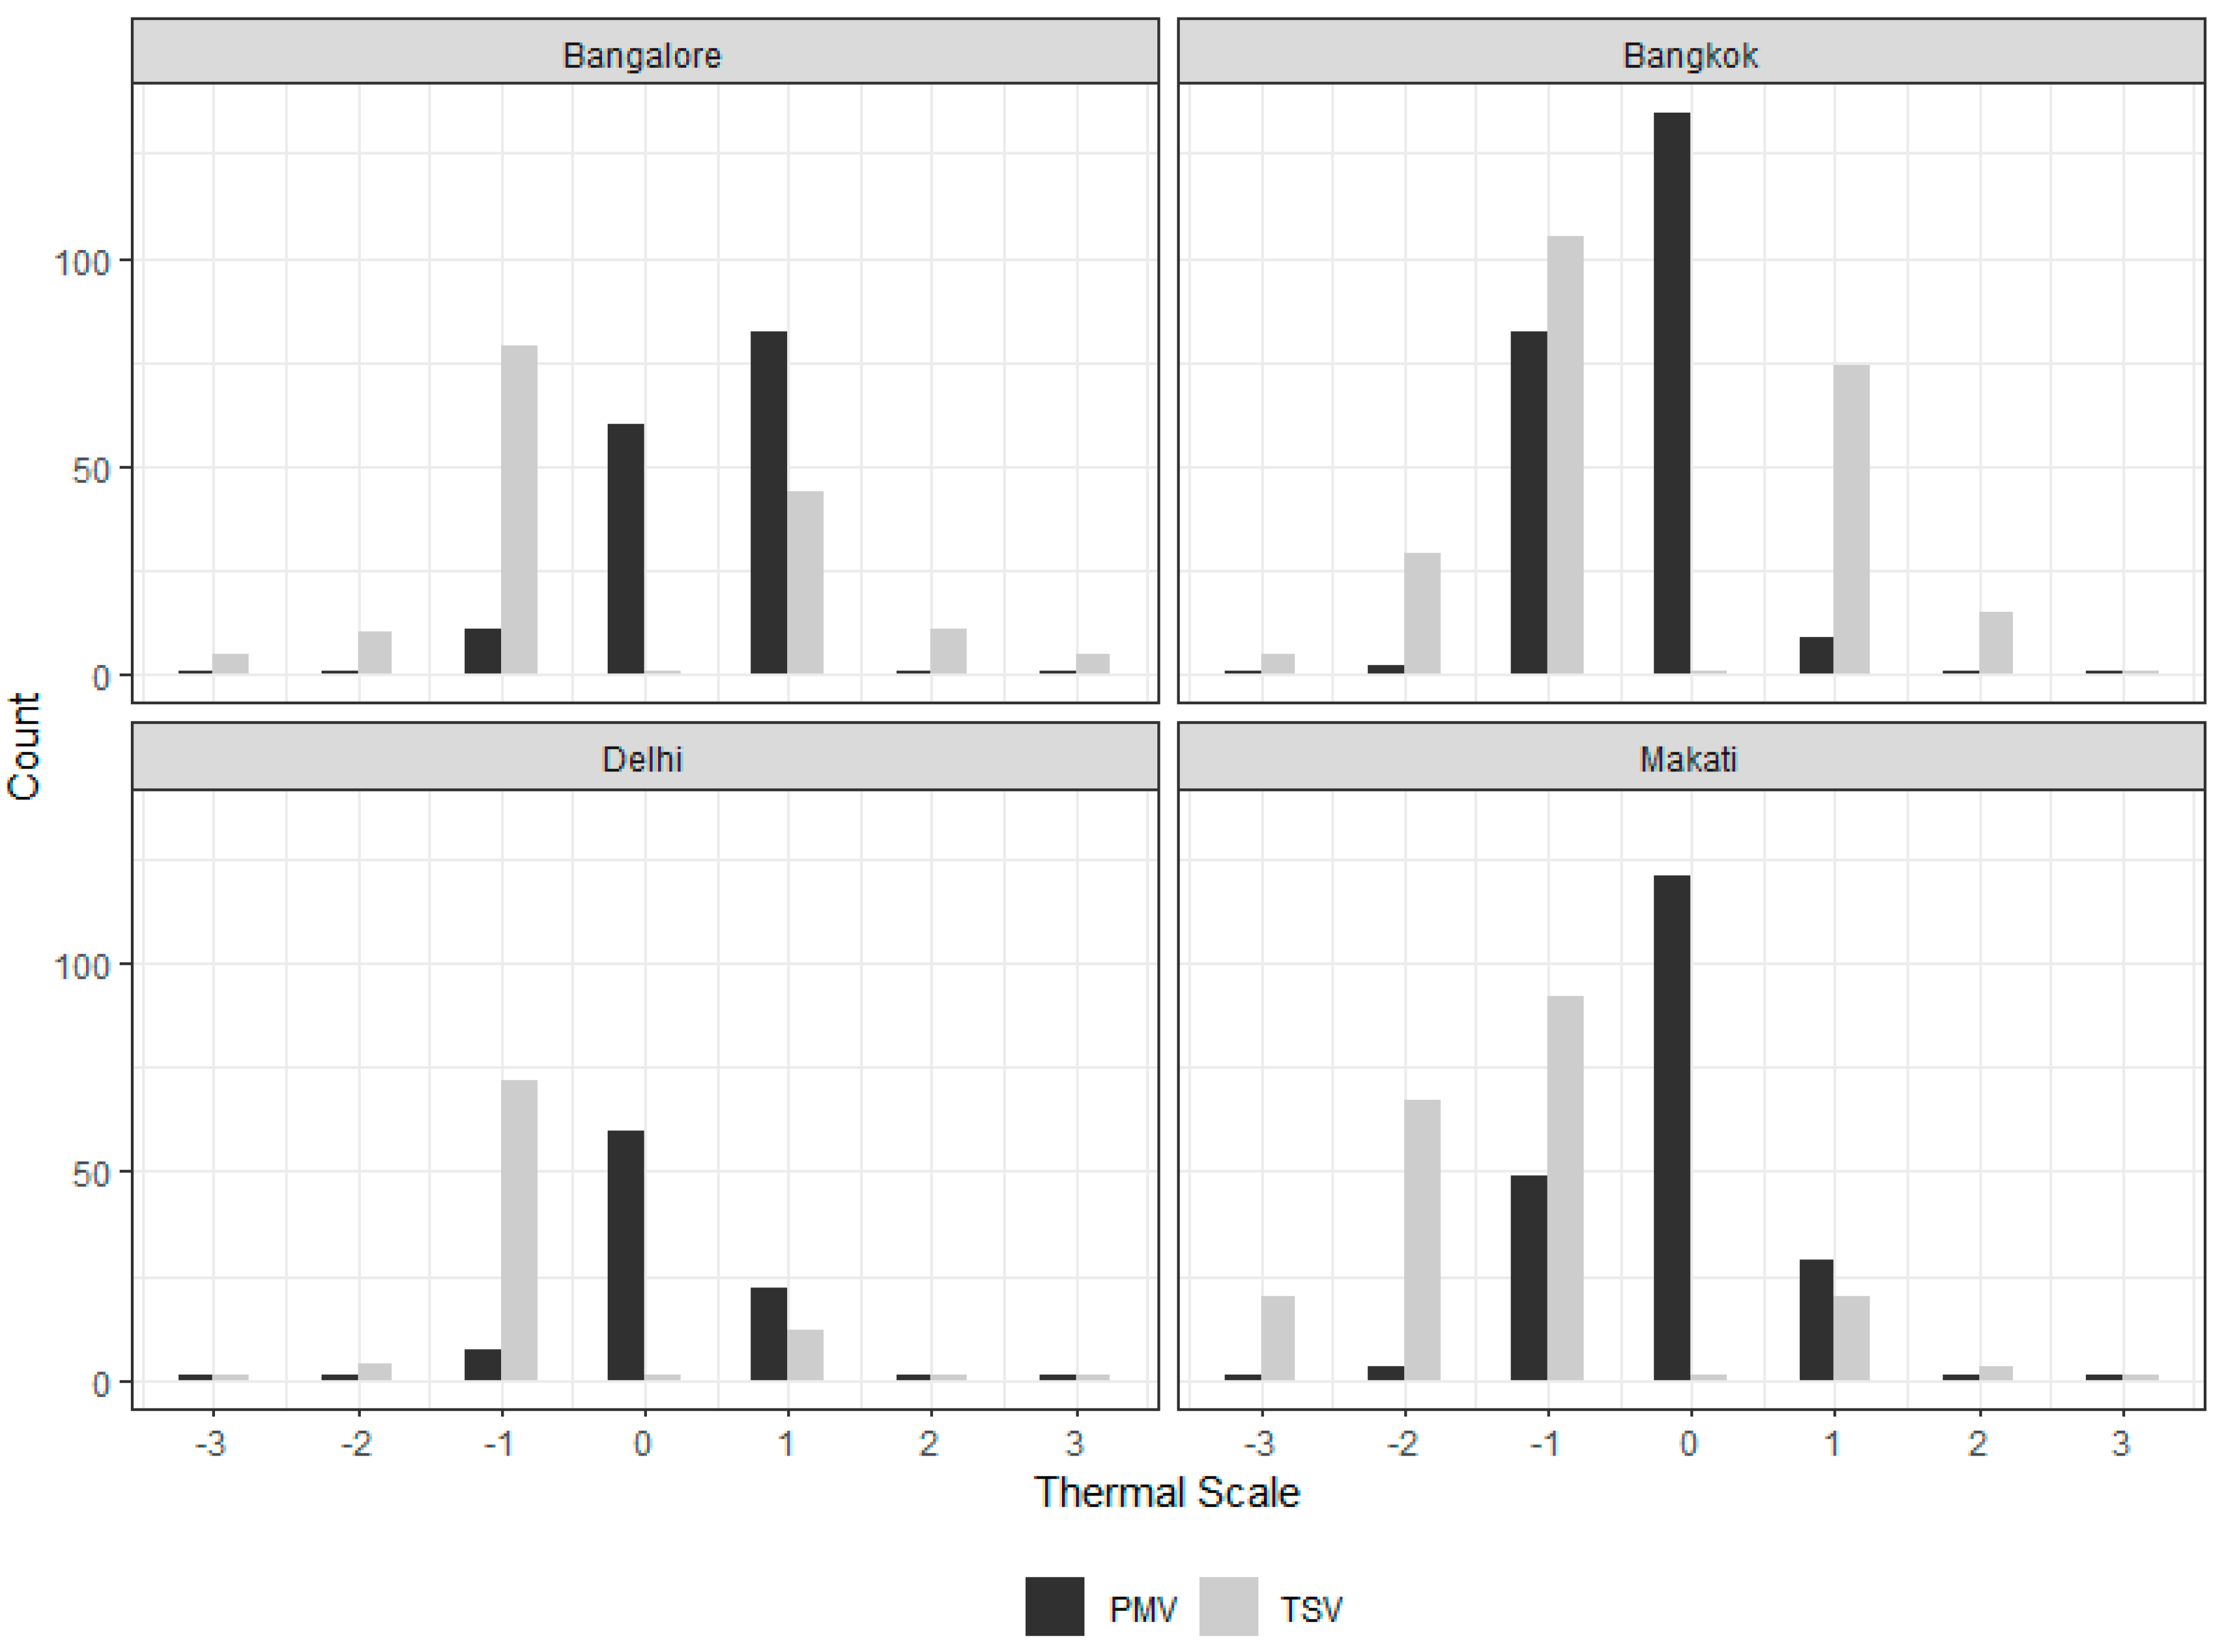
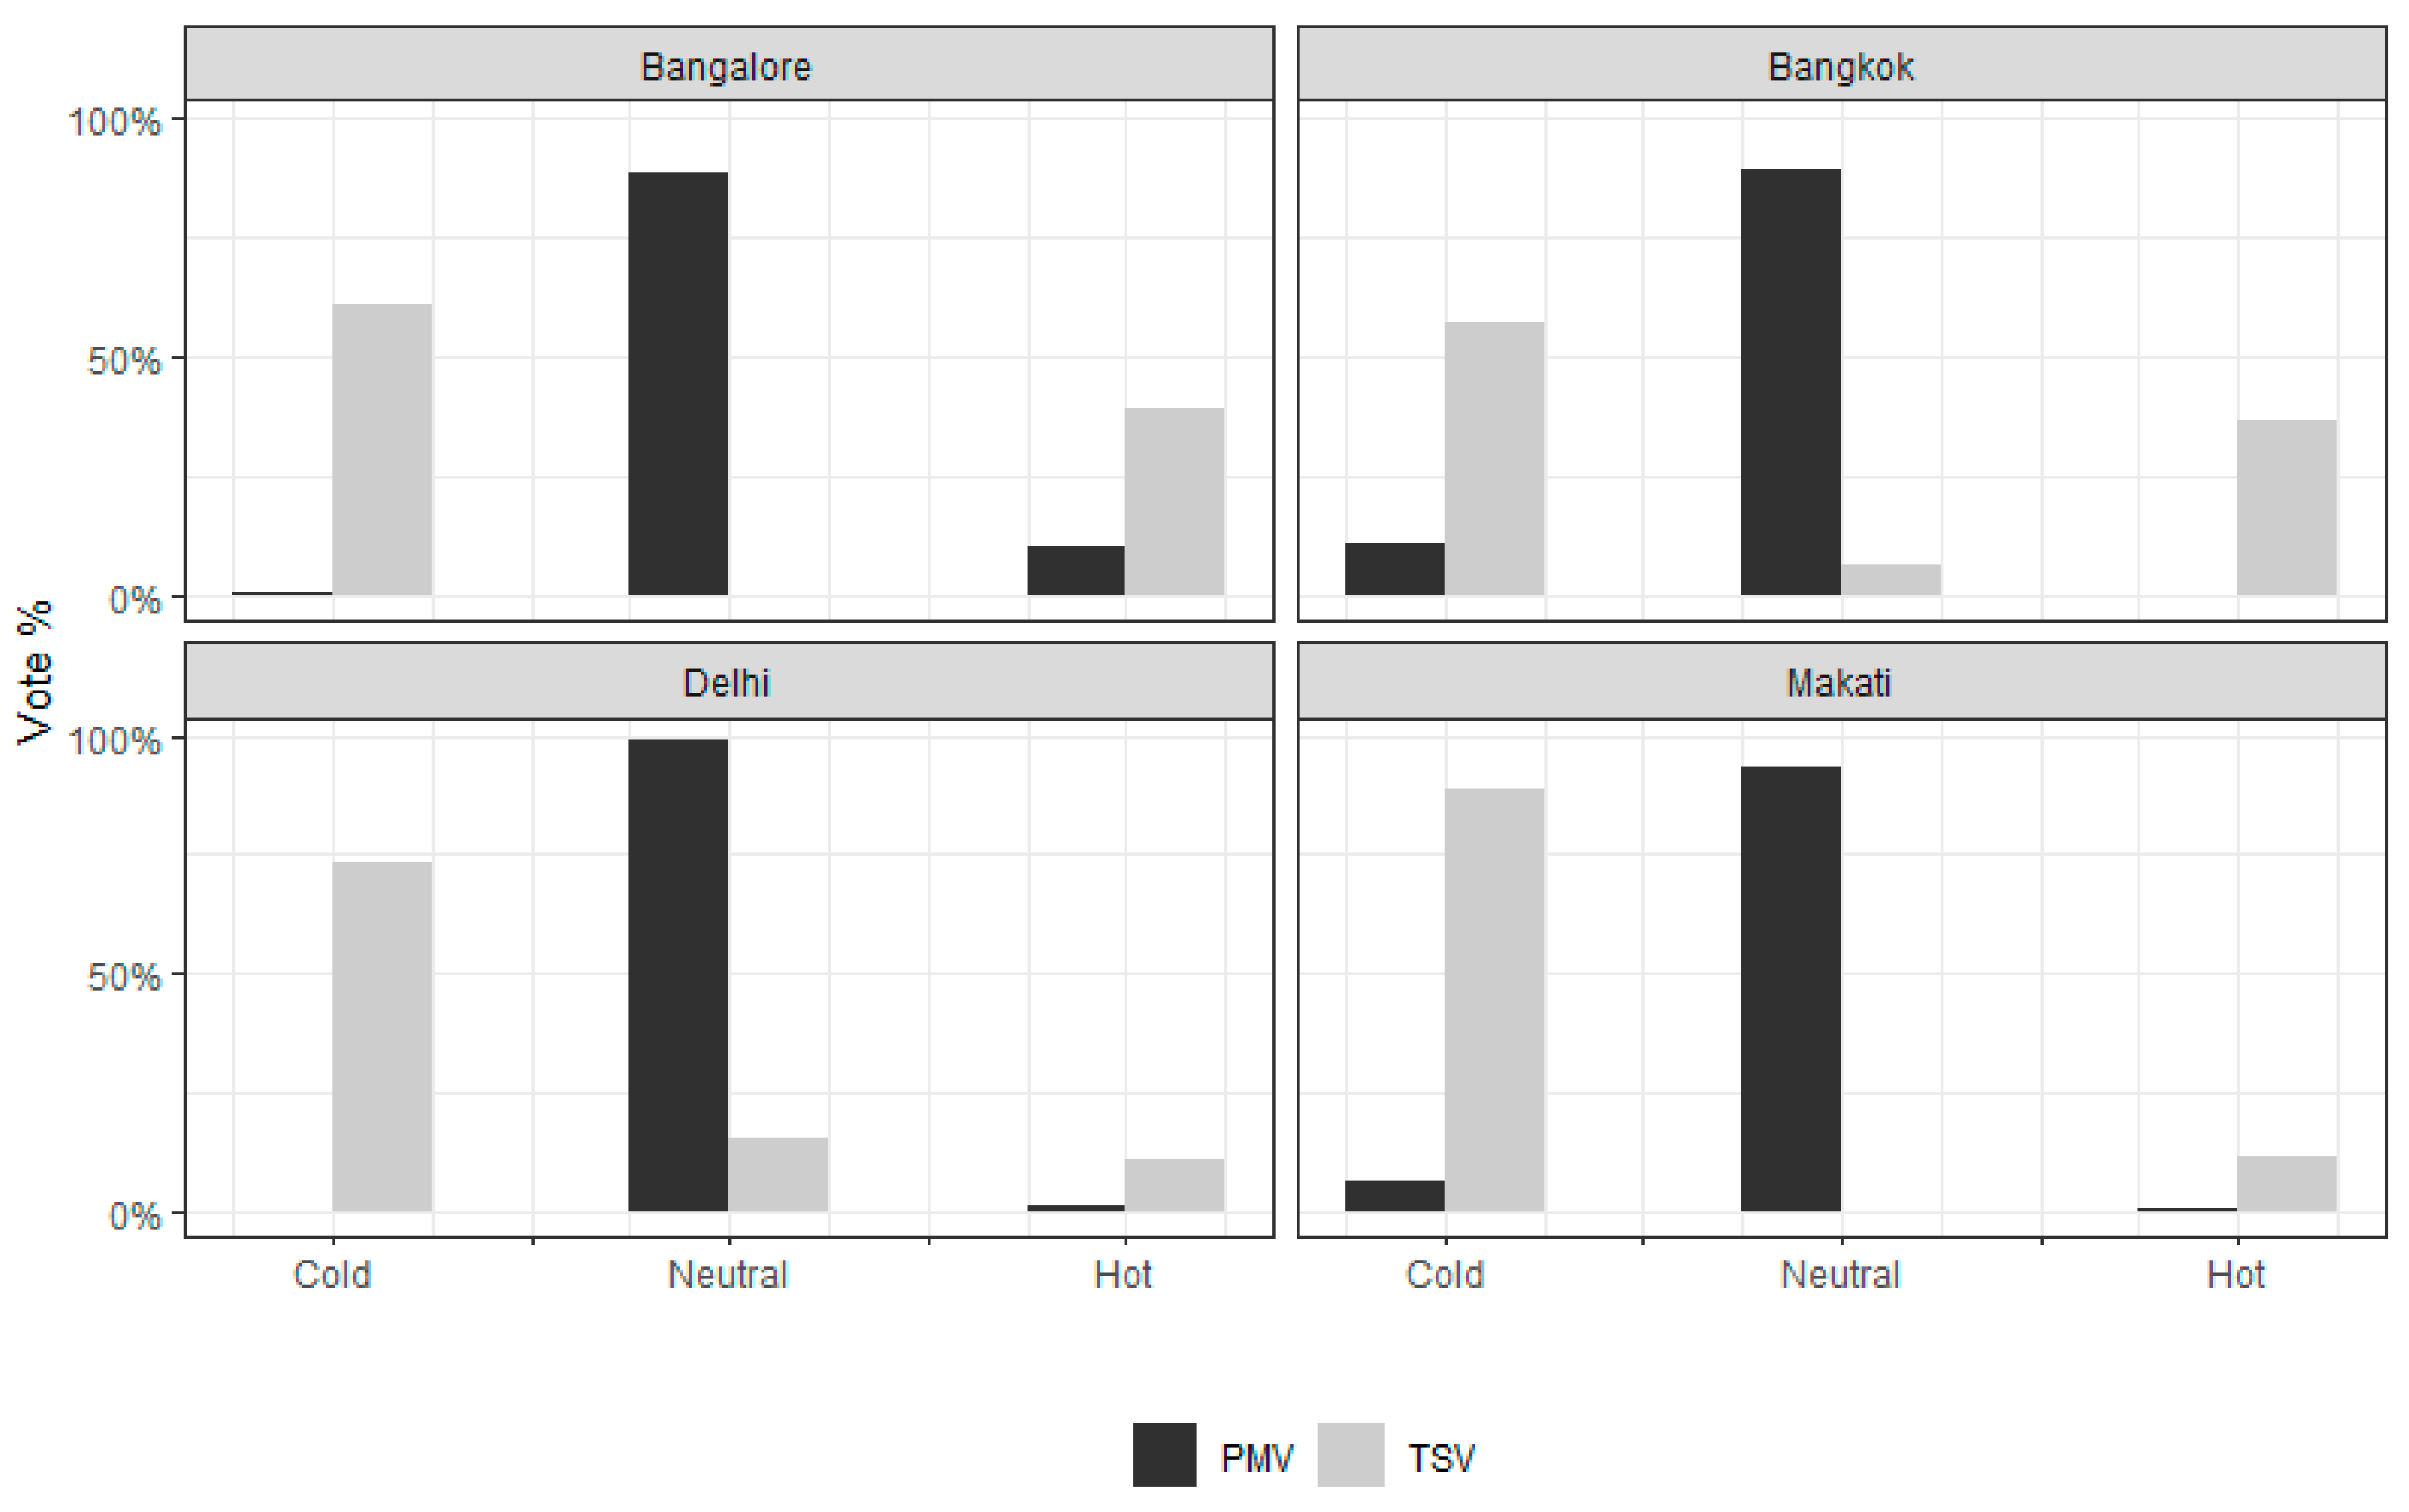
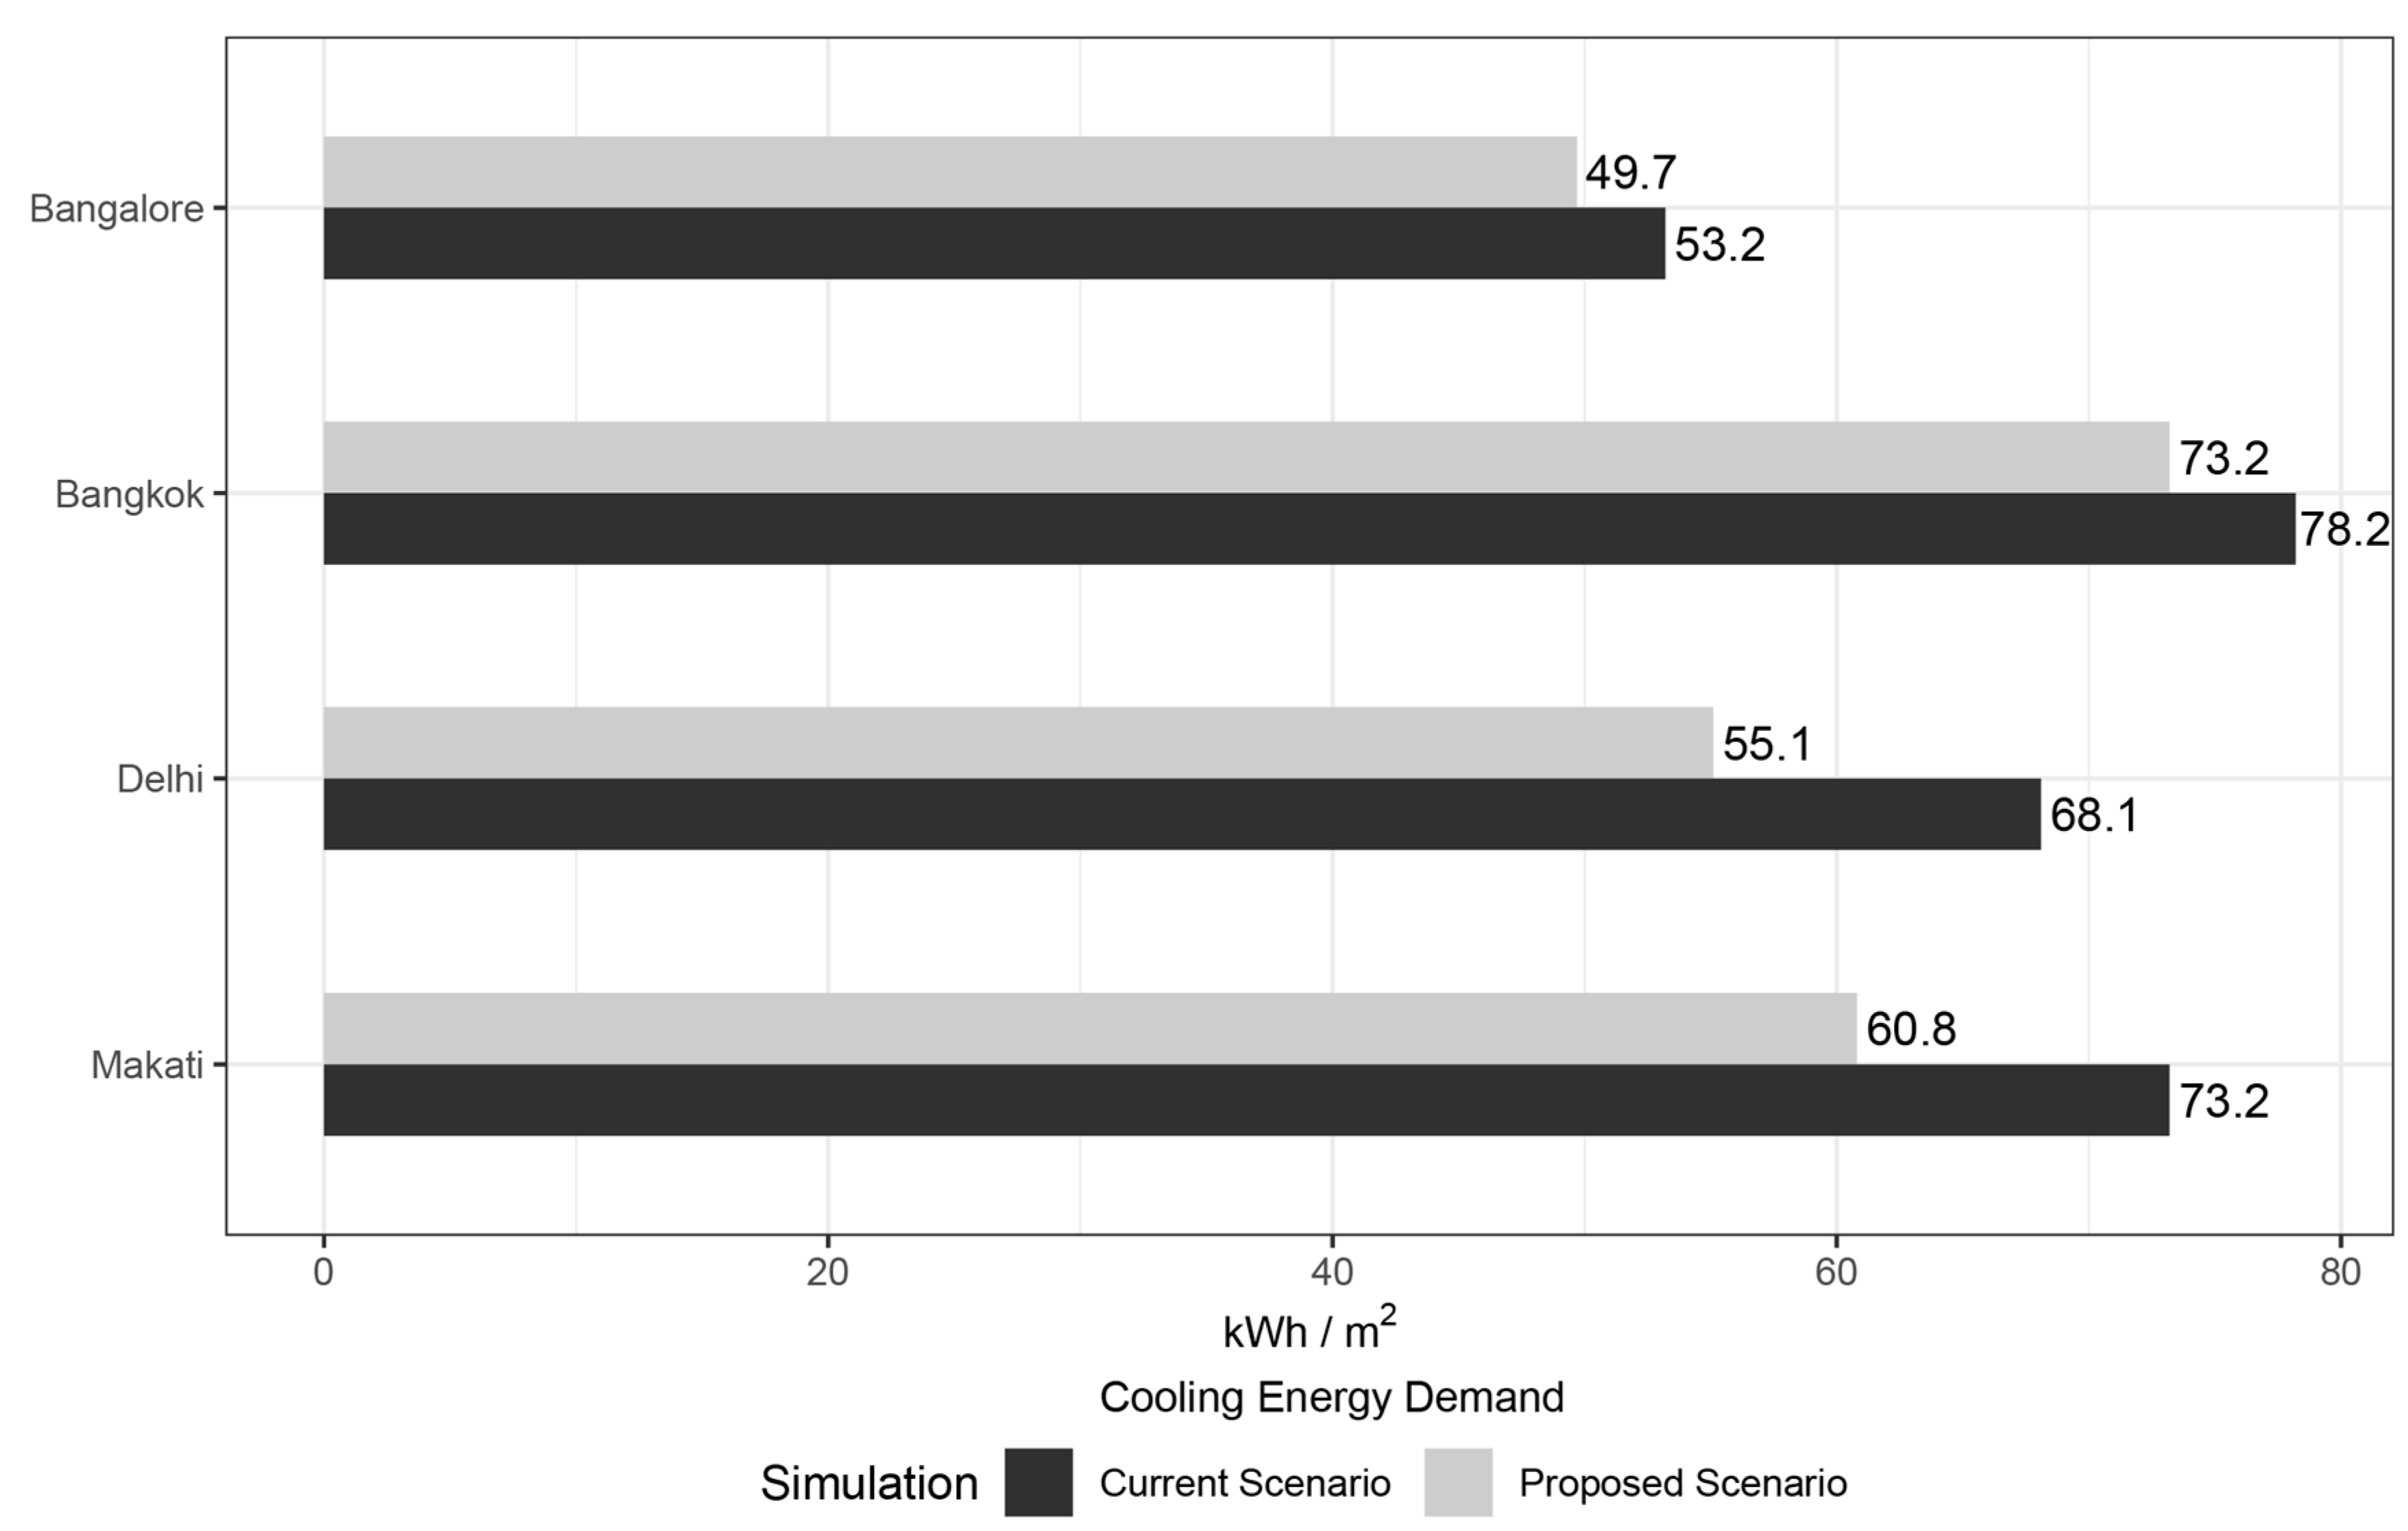
Through energy model simulations of the current scenario building temperature setpoints to the proposed scenario building temperature setpoints the difference in energy demand for space cooling is evaluated. We use the well-regarded and widely used EnergyPlus whole building energy simulations as the simulator and the ANSI (American National Standards Institute)/ASHRAE/IES (Illuminating Engineering Society) Standard 90.1 office commercial prototype building energy model as the base model. The ANSI/ASHRAE/IES Standard 90.1 office commercial prototype buildings are calibrated energy models in agreement with the major institutes such as the US Department of Energy, the International Energy Conservation Code, the American National Standards Institute, ASHRAE, and the Pacific Northwest National Laboratory (PNNL) researchers [45]. The prototype buildings are modelled as a typical building construction covering commercial and residential building types in several climates and are intended for the use of energy simulations in research and practice. Using energy simulation with the prototype building models and changing the building temperature setpoint in each run for each study group individually, the current and proposed simulation scenarios are observed. The PNNL schema provides prototypes for small, medium, and large offices. As our goal is to illustrate the likely scale of impact, rather than a comprehensive account of the full range, we choose the medium office case as a convenient means of investigating the effect of altered setpoints on cooling energy demand. This matches well with the sample buildings derived from GTCD-II (see Table 2) which are all medium sized offices. Although there is insufficient data to directly compare floor areas, the average occupancy of our sample buildings is 168 persons. This compares favourably with the implied occupancy of the PNNL medium office of 268 people, compared to 27 and 2490 for small and large offices, respectively. While a full description of the model can be found on the PNNL website [46], we briefly summarize the key aspects of the chosen model in Table 1.
The comparison study is conducted by simulating the operation of a building in each study’s climate with the current and proposed setpoint temperature conditions. Weather data EnergyPlus Weather Format (EPW) for Bangkok and Makati are available from the ASHRAE International Weather for Energy Calculations (IWEC) repository and for Bangalore from the Indian Society of Heating, Refrigerating and Air-Conditioning Engineers (ISHRAE) repository, whereas data for Delhi is available from both repositories. Both sets of data are produced using comparable methodologies [47], though drawing from different basis sets. As their aim is to produce typical weather years and they are produced by the same source, we take them to be comparable; choosing data for India from the more recent ISHRAE dataset. The building cooling setpoint schedules use the current temperatures and the comfort temperatures with a two-degree (°C) setback after working hours for each building in the different climates. In addition to the mean cooling energy demand analysis conducted over the summer period, peak energy demand analysis is conducted by simulating the average daily space cooling energy demand in the warmest week for each study group. The warmest week is defined as the week with the highest average daily temperature. The warmest week is derived for each study group using the weather data described earlier. As such, these are warm weeks within otherwise average years and hence absolute peaks are likely to be underestimated compared to extreme years. However, as we are interested in the difference in energy demand between the two setpoint scenarios, the use of a warm week within an average year is likely to provide a good idea of the scale of reductions possible. Finally, we simulate each study group with its associated weather conditions across a range of setpoint temperatures (20–32 °C) and the range of expected external temperatures for the location to establish the mean rate of cooling energy demand reduction that would be possible for each group.

3. Results

Our filtering of GTCD-II produced 1502 valid votes from 673 building occupants across the four Global South cities of Bangalore, Bangkok, Delhi, and Makati (Table 2). All studies were in office settings with occupants adopting similar attire and metabolic levels. The mean clothing insulation value (CLO (this is the standard metric for the resistance provided by clothing ensembles where 1 CLO = 0.155 m2·K·W−1, and is defined as the insulation provided by clothing sufficient to allow a person to be comfortable when sitting in still air at a temperature of 21 °C. One CLO approximates to underwear, blouse/shirt, slacks/trousers, jacket, socks and shoes.)) is 0.63 and a metabolic rate (MET (a standardised value for metabolic rates where 1 MET = 58 Wm−2.)) is 1.22, both vary by less than 8% across the four city groups. Firstly, we observe that mean internal air temperatures (Ta) in each study (24.7 °C, 23.6 °C, 23.6 °C, 23.7 °C) are within those suggested by ASHRAE-55 (i.e., 24 ± 2 °C) for the observed CLO and MET. The mean TSV in each study is lower than zero, suggesting the presence of cold thermal discomfort in these warm climates. However, in Bangalore and Bangkok, these are greater than −0.5 which would be considered acceptable within the standards. Excepting Bangkok, where PMV closely matches TSV, we observe PMV is 0.88 higher on average than TSV in the other cities, suggesting a strong mismatch between model predictions and observations. This is apparent in Figure 2 which shows TSV is significantly skewed to the colder left side.
However, a true estimate of the extent of cold, compared to hot, discomfort is only possible by looking at the proportion of votes falling below (−1) and exceeding (+1), as the comfort standards mandate overall discomfort to be less than some threshold, typically 80% for normal office conditions. This is seen in Figure 3, where we observe, on average, 70% of the votes falling into cold discomfort compared to only 24% for hot discomfort. We also observe PMV within the same scale skewing significantly towards neutral (i.e., 0).
Analysis of the mean observed and predicted comfort temperatures (using the Griffith’s method) suggests a significant disparity between the two (Table 3), h the predicted temperature being 1.8 °C above observed, on average.
Using data in Table 3 for observed and predicted temperatures as “current” and “proposed” setpoints for our simulations, we observe an average reduction of 8.5 kWh/m2 (12.3%) across the four cities (Figure 4). The range of potential reductions is substantial, with the lowest being 6.4% in Bangkok to a maximum of 19.1% in Delhi.
Analysis of average daily cooling energy load for the warmest week, again suggests that significant peak load reduction is also possible, though this is more variable between the studied cities than mean demand (Figure 5). For example, potential peak reduction in Bangalore is seen to be quite small (0.24 W/m2 = 2.7%), but it is far more substantial in Makati (2.6 W/m2 = 19.7%). Maximum reductions appear in the late afternoons (14:00–15:00), known to be the warmest times of a typical day.
While the preceding analysis uses a weather file representing average annual conditions and a peak week within it, a broader analysis is possible by considering the full range of external temperatures that a building might experience in each of the cities. In addition, given that our sample is limited to a few buildings in Bangalore, Bangkok, Delhi, and Makati, it is possible to conceive of further excursions in the indoor setpoint to derive a broad trend of cooling energy demand savings for each city. This combined analysis is presented in Figure 6, where we consider building setpoint temperatures ranging from 20 to 32 °C across the monthly mean external temperatures possible in each city. All four groups illustrate a significant reduction in energy demand for cooling as the building setpoint temperature is increased. For the Bangalore group, an average of an 8.0% decrease in energy demand for cooling is observed per K increase in building setpoint temperature. Reduction rates for Bangkok, Delhi, and Makati are 10.5, 9.1, and 10.0%/K, respectively.

4. Discussion

Within the studied data for the Global South, we find that an average of 70% cold thermal discomfort is recorded based on the thermal sensation votes. With the majority of the discomfort in the study groups being on the cold side, the claim for the overcooling of these spaces is justified. Although we do not have access to the design intention, the observed mean temperatures range of 23.6 to 24.7 °C seems to suggest this is driven by an adherence to “international’ comfort standards such as the ASHRAE-55 developed in cooler climates with milder summers. This is consistent with evidence from studies elsewhere, primarily in the Global North, as illustrated earlier.
Regression analysis of the comfort votes suggests that, on average, the occupants are likely to prefer indoor temperatures that are 2.2 K above those currently supplied. This implies an average reduction in energy demand for space cooling of between 7.7% and 24.3% across the cities, if the indoor setpoints were elevated per the prediction from the regression analysis. Indeed, mean reductions of 8% per K increase in temperature is possible when considering the entire range of external temperatures each city is likely to experience. The extent to which temperatures can be elevated to harvest such gains, beyond the 2.2 K indicated above, remains to be investigated.
However, it is not merely reductions in the mean demand that are feasible, but also substantial reductions in the peak demand, though these vary by location. In the cooling season, peak energy demand for space cooling reduces by an average of 6% for every increase in temperature by 1 K. As the Global South tends, on average, to have less resilient electricity networks whilst operating in extremely warm conditions, any rise in peak energy demand on a building level can be reflected on the network level. The 19.3% reduction in peak energy demand in the Makati data is suggestive of substantial positive impact on the network if more appropriate indoor setpoints, driven by more climatically appropriate thermal comfort standards, are adopted.
The cost of thermal discomfort within the global south can be identified as two major issues. Firstly, cold thermal discomfort, as represented by the observed TSV distributions, can significantly affect the productivity and wellbeing of building occupants. This has a direct impact on commercial bottom lines as 90% of an institution’s costs are driven by salaries [48,49,50,51]. Secondly, unnecessary energy consumption adds strain on the electrical infrastructure as well as increasing carbon emissions. For example, using average grid carbon factors for India, our analysis would suggest that a simple 2 K upwards adjustment of indoor setpoints could reduce carbon emissions by 16%.

5. Conclusions

The Global South is expected to triple its space cooling energy demand whilst doubling its built footprint by 2050. There is growing anecdotal evidence that a proportion of the increase in demand is due to an unnecessary “overcooling” of the indoor environment—i.e., the provision of lower temperature setpoints than are desired by the occupants of buildings. However, clear evidence for the presence of this overcooling or indeed the extent to which it might affect demand has remained unquantified. Here, we investigate this problem using thermal comfort data from real buildings in the Global South drawn from the largest global database of thermal comfort, the GTCD-II.
We find that not only is overcooling present in every studied location, it imposes significant costs on occupant comfort, energy use, and carbon emissions. Regressions analysis of comfort votes suggests that occupants, on average, would prefer temperatures around 2.2 K above those observed. That the observed temperatures are consistent with design recommendations from “international” standards such as the ASHRAE-55 suggests that more climate- and culture-localized standards should be given priority. Using computer simulations, we find that an elevated indoor setpoint would drive down average cooling demand by around 8% and peak demand by about 6%, per K increase in setpoint temperatures. This is a significant scale of reductions, with almost no financial investment, that could also help reduce carbon emissions by about 16%.
Thus, through utilizing appropriate building temperature setpoints based on occupant responses within the Global South, more sustainable thermal conditions can be maintained for buildings and their occupants allowing for the reduction of energy consumption and carbon emissions whilst increasing thermal comfort, wellbeing and productivity.

Author Contributions

A.N.A. conducted the research including the acquisition of relevant thermal comfort data, the energy simulations, analysis, and the reporting of the results. S.N., in addition to supervising the overall research, articulated the core idea, suggested additions to the analyses, and helped draft the article. All authors have read and agreed to the published version of the manuscript.

Funding

This research was in part supported by the Zero Peak Energy Building Design for India (ZED-i) project funded by the Engineering and Physical Sciences Research Council (EPSRC grant ref EP/R008612/1). Abdulla Alnuaimi’s doctoral research is also kindly supported by the Qatar University Scholarships Program. The APC was waived as a guest editor contribution to the special issue.

Conflicts of Interest

The authors declare no conflict of interest.

References

  1. Programme UND. Forging a Global South: United Nations Day for South-South Cooperation, 19 December 2004; United Nations Development Programme: New York, NY, USA, 2004. [Google Scholar]
  2. Westphal, M.I.; Martin, S.; Zhou, L.; Satterthwaite, D. Powering cities in the global South: How energy access for all benefits the economy and the environment. World Resour. Report 2017, 1, 4–24. [Google Scholar]
  3. IEA. World Energy Outlook 2014: Executive Summary; OECD/IEA Paris, FRA: Paris, France, 2014. [Google Scholar]
  4. IEA. The Future of cooling. Opportunities for energy-efficient air conditioning. Int. Energy Agency 2018, 90. Available online: www.iea.org (accessed on 12 November 2019).
  5. Change, IC. Synthesis Report Summary Chapter for Policymakers; IPCC: Geneva, Switzerland, 2014; p. 31. [Google Scholar]
  6. Yang, W.; Nyuk, H.; Wong, J.Z. Overcooling And Thermal Comfort In Air Conditioned University Buildings In Singapore. Indoor Air 2014-13th Int. Conf. Indoor Air Qual. Climat. 2016, 554, 1–6. [Google Scholar]
  7. Derrible, S.; Reeder, M. The cost of over-cooling commercial buildings in the United States. Energy Build. 2015, 108, 304–306. [Google Scholar] [CrossRef]
  8. Sekhar, S.C. Thermal comfort in air-conditioned buildings in hot and humid climates-why are we not getting it right? Indoor Air 2016, 26, 138–152. [Google Scholar] [CrossRef]
  9. Cena, K.; De Dear, R. Thermal comfort and behavioural strategies in office buildings located in a hot-arid climate. J. Ther. Biol. 2001, 26, 409–414. [Google Scholar] [CrossRef]
  10. Indraganti, M. Using the adaptive model of thermal comfort for obtaining indoor neutral temperature: Findings from a field study in Hyderabad, India. Build. Environ. 2010, 45, 519–536. [Google Scholar] [CrossRef]
  11. Nicol, F. Adaptive thermal comfort standards in the hot-humid tropics. Energy Build. 2004, 36, 628–637. [Google Scholar] [CrossRef]
  12. American Society of Heating, Refrigerating and Air Conditioning Engineers. Standard 55-2010, Thermal Environmental Conditions for Human Occupancy; ASHRAE: Atlanta, GA, USA, 2010. [Google Scholar]
  13. ISO. BS EN ISO 7730: 2005: Ergonomics of the Thermal Environment. Analytical Determination and Interpretation of Thermal Comfort Using Calculation of the PMV and PPD Indices and Local Thermal Comfort Criteria; International Standards Organization Geneva: Vernier, Switzerland, 2005. [Google Scholar]
  14. CEN. EN 15251: Indoor Environmental input Parameters for Design and Assessment of Energy Performance of Buildings Addressing Indoor Air Quality, Thermal Environment, Lighting and Acoustics; Thermal Environment, Lighting and Acoustics, CEN: Brussels, Belgium, 2007. [Google Scholar]
  15. CIBSE. Environmental Design : CIBSE Guide A, 8th ed; CIBSE: London, UK, 2015. [Google Scholar]
  16. EN EUS. 16798-1: 2019. Energy Performance of Buildings—Ventilation for Buildings—Part. 2019, 1; CEN: Brussels, Belgium, 2019. [Google Scholar]
  17. Oseland, N.A.; Reardon, J.; Langkilde, G. Acceptable temperature ranges in naturally ventilated and air-conditioned offices/Discussion. Ashrae Trans. 1998, 104, 1018. [Google Scholar]
  18. Baker, N.; Standeven, M. A behavioural approach to thermal comfort assessment in naturally ventilated buildings. In Proceedings of the CIBSE National Conference, Eastbourne UK, 1–3 October 1995; pp. 76–84. [Google Scholar]
  19. Humphreys, M.A. Understanding the Adaptive Approach to Thermal Comfort. In Proceedings of the ASHRAE 1998 Annual Meeting-Toronto, Toronto, ON, USA, 17–21 January 1998; pp. 991–1004. [Google Scholar]
  20. Griffiths, ID. Thermal Comfort in Buildings with Passive Solar Features: Field Studies; The Publications Office of the European Union: Brussels, Belgium, 1991; EUR 13431 EN. [Google Scholar]
  21. Nicol, F.; Jamy, G.N.; Sykes, O.; Humphreys, M.; Roaf, S.; Hancock, M. A Survey of Thermal Comfort in Pakistan toward New Indoor Temperature Standards; Final Report to the Overseas Development, Administration Published by Oxford Brookes University, School of Architecture: Oxford, UK, 1994. [Google Scholar]
  22. Nicol, F.; Roaf, S. Pioneering new indoor temperature standards: The Pakistan project. Energy Build. 1996, 23, 169–174. [Google Scholar] [CrossRef]
  23. Brager, G.S.; De Dear, R.J. Thermal adaptation in the built environment: A literature review. Energy Build. 1998, 27, 83–96. [Google Scholar] [CrossRef] [Green Version]
  24. Taleghani, M.; Tenpierik, M.; Kurvers, S.; Van Den Dobbelsteen, A. A review into thermal comfort in buildings. Renew. Sustain. Energy Rev. 2013, 26, 201–215. [Google Scholar] [CrossRef]
  25. Yang, L.; Yan, H.; Lam, J.C. Thermal comfort and building energy consumption implications-A review. Appl. Energy 2014, 115, 164–173. [Google Scholar] [CrossRef]
  26. Olesen, B.W.; Parsons, K.C. Introduction to thermal comfort standards and to the proposed new version of EN ISO 7730. Energy Build. 2002, 34, 537–548. [Google Scholar] [CrossRef]
  27. Fanger, P.O. Thermal Comfort: Analysis and Applications in Environmental Engineering; Danish Technical Press: København, Denmark, 1970. [Google Scholar]
  28. Spagnolo, J.; de Dear, R. A field study of thermal comfort in outdoor and semi-outdoor environments in subtropical Sydney Australia. Build. Environ. 2003, 38, 721–738. [Google Scholar] [CrossRef] [Green Version]
  29. Cena, K.; de Dear, R. Feild Study of Occupant Comfort and Office Thermal Environments in a Hot-Arid Climate. In Final Report-ASHRAE RP-921; ASHRAE Inc.: Atlanta, GA, USA, 1998; Volume 4293. [Google Scholar]
  30. De Dear, R.; Fountain, M. Field Experiments On Occupant Comfort And Office Thermal Environments In A Hot-Humid Climate; UC Berkeley: Berkeley, CA, USA, 1994. [Google Scholar]
  31. Paliaga, G.; Zhang, H.; Hoyt, T.; Arens, E. Surprisingly Straightforward Solution: Eliminating Overcooling Discomfort While Saving Energy. ASHRAE J. 2019, 61, 14–28. [Google Scholar]
  32. Yan, D.; Jiang, Y.; Shi, X. Influence of asynchronous demand behavior on overcooling in multiple zone AC systems. Build. Environ. 2016, 110, 65–75. [Google Scholar]
  33. Földváry Ličina, V.; Cheung, T.; Zhang, H.; de Dear, R.; Parkinson, T.; Arens, E. Development of the ASHRAE Global Thermal Comfort Database II. Build. Environ. 2018, 142, 502–512. [Google Scholar] [CrossRef] [Green Version]
  34. Wang, Z.; Luo, M.; Zhang, H.; He, Y.; Jin, L.; Arens, E. Reducing Building Over-Cooling by Adjusting HVAC Supply Airflow Setpoints and Providing Personal Comfort Systems; UC Berkeley: Berkeley, CA, USA, 2018. [Google Scholar]
  35. Brager, G.; Arens, E. Creating high performance buildings: Lower energy, better comfort. In AIP Conference Proceedings; American Institute of Physics: College Park, MD, USA, 2015; pp. 58–69. [Google Scholar]
  36. Chen, A.; Chang, V.W.-C. Human health and thermal comfort of office workers in Singapore. Build. Environ. 2012, 58, 172–178. [Google Scholar] [CrossRef]
  37. Damiati, S.A.; Zaki, S.A.; Wonorahardjo, S.; Wong, N.H.; Rijal, H.B. Comfort Temperature in Air Conditioned Office Buildings: Case Study of Indonesia And Singapore. In Proceedings of the Malaysia-Japan Joint International Conference 2015 (MJJIC2015), Yamaguchi, Japan, 13–15 November 2015. [Google Scholar]
  38. Andamon, M.M. Thermal comfort and building energy consumption in the Philippine context. In Proceedings of the PLEA 2006-23rd International Conference on Passive and Low Energy Architecture, Geneva, Switzerland, 6–8 September 2006. [Google Scholar]
  39. Bush, J.F. A tale of two populations: Thermal comfort in air-conditioned and naturally ventilated offices in Thailand. Energy Build. 1992, 18, 235–249. [Google Scholar] [CrossRef]
  40. Manu, S.; Shukla, Y.; Rawal, R.; Thomas, L.E.; de Dear, R. Field studies of thermal comfort across multiple climate zones for the subcontinent: India Model for Adaptive Comfort (IMAC). Build. Environ. 2016, 98, 55–70. [Google Scholar] [CrossRef] [Green Version]
  41. Indraganti, M.; Ooka, R.; Rijal, H.B.; Brager, G.S. Adaptive model of thermal comfort for offices in hot and humid climates of India. Build. Environ. 2014, 74, 39–53. [Google Scholar] [CrossRef]
  42. Honnekeri, A.; Brager, G.; Dhaka, S.; Mathur, J. Comfort and Adaptation in Mixed-Mode Buildings in a hot-Dry Climate; UC Berkeley: Berkeley, CA, USA, 2014. [Google Scholar]
  43. Rijal, H.B.; Yoshida, H.; Umemiya, N. Seasonal and regional differences in neutral temperatures in Nepalese traditional vernacular houses. Build. Environ. 2010, 45, 2743–2753. [Google Scholar] [CrossRef]
  44. Baker, N.; Standeven, M. A behavioural approach to thermal comfort assessment. Int. J. Solar Energy 1997, 19, 21–35. [Google Scholar] [CrossRef]
  45. DOE. EnergyPlus|EnergyPlus [Internet]. 2019. Available online: https://energyplus.net/ (accessed on 3 December 2019).
  46. Deru, M.; Field, K.; Studer, D.; Benne, K.; Griffith, B.; Torcellini, P. US Department of Energy Commercial Reference Building Models of the National Building Stock; National Renewable Energy Laboratory: Golden, CO, USA, 2011. [Google Scholar]
  47. Herrera, M.; Natarajan, S.; Coley, D.A.; Kershaw, T.; Ramallo-González, A.P.; Eames, M. A review of current and future weather data for building simulation. Build. Serv. Eng. Res. Technol. 2017, 38, 602–627. [Google Scholar] [CrossRef] [Green Version]
  48. Ruegg, R.; Marshall, H. Building Economics: Theory and Practice; Springer Science & Business Media: Berlin, Germany, 2013. [Google Scholar]
  49. Fuller, S. Life-cycle Cost Analysis (LCCA); Whole building design guide; NIST: Gaithersburg, MD, USA, 2010. [Google Scholar]
  50. USGBC. Sustainable Building Technical Manual: Green Building Design Construction adn Operations; John Wiley & Sons: Hoboken, NJ, USA, 2012; Volume 240, pp. 703–988. [Google Scholar]
  51. Alker, J.; Malanca, M.; Pottage, C.; O’Brien, R.; Akhras, D.; Ambrose, B.; Health, Wellbeing and Productivity in Offices. World Green Building Council. 2015. Available online: http://www.worldgbc.org/activities/health-wellbeing-productivity-offices/research (accessed on 30 March 2020).
Figure 1. Summarized research steps flowchart highlighting the key phases carried in the compilation, analysis, and evaluation of the research.
Buildings 10 00093 g001
Figure 2. TSV and PMV of building occupants in the ASHRAE global database for Bangalore, Bangkok, Delhi, and Makati on the ASHRAE seven-point thermal scale.
Buildings 10 00093 g002
Figure 3. TSV and PMV distribution of building occupant data in the ASHRAE global database for Bangalore, Bangkok, Delhi, and Makati indicating cold thermal sensation (below −1), hot thermal sensation (above +1), and neutral thermal sensation represented by the remaining votes on the ASHRAE seven-point thermal scale.
Buildings 10 00093 g003
Figure 4. Cooling energy demand for current (dark) and proposed (light) simulation scenarios for Bangalore, Bangkok, Delhi, and Makati.
Buildings 10 00093 g004
Figure 5. Average hourly cooling energy loads for the both the current (dark) and proposed (light) setpoint scenarios. Both scenarios are plotted for cooling loads in the hottest week in an average year (weekdays only). Peak reductions of 2.7% and 19.7% are observed at 14:00 p.m. for Bangalore and Makati, whereas reductions of 5.8% and 17.8% are observed at 15:00 p.m. for Bangkok and Delhi.
Buildings 10 00093 g005
Figure 6. Cooling energy demand at site across a range of building setpoint temperatures for Bangalore, Bangkok, Delhi, and Makati across the x-axis. Each dot in translucent grey is the output from a single simulation, hence areas with a greater density of outputs appear darker in colour. The spread of points for a given setpoint temperature on the y-axis represents the cooling energy demand associated with varying monthly mean external temperature conditions in each location.
Buildings 10 00093 g006
Table 1. Summary description of key elements of the office building in American National Standards Institute (ANSI)/American Society of Heating, Refrigerating and Air-Conditioning Engineers (ASHRAE)/Illuminating Engineering Society (IES) Standard 90.1 office commercial prototype building energy models used in this study. For a more detailed description, the reader is referred to [46].
Design ElementSpecification/ValueSource
Floor Area (m2)4982EIA 2005
Aspect Ratio1.5EIA 2005
No. of Floors3EIA 2005
Floor to Ceiling Height (m)2.74EIA 2005
Glazing Fraction0.33EIA 2005
Occupancy18.6 m2/personASHRAE 2004b
Wall Construction (U-Value)steel frame (0.704 Wm−2K−1)ASHRAE 90.1-2004
Roof Construction (U-Value)insulation above deck (0.363 Wm−2K−1)ASHRAE 90.1-2004
Window Overall (U-Value)fixed window (4.652 Wm−2K−1)ASHRAE 90.1-2004
Heating SystemfurnaceASHRAE 90.1-2004
Cooling Systempackaged air-conditioning unitASHRAE 90.1-2004
Air Distributionmultizone variable air volumeASHRAE 90.1-2004
Outside Air Requirement20 cfm/personASHRAE 1999
Operation profiles
Lightinglighting power density 8.5 Wm−2ASHRAE 90.1-2004
CoolingAuto-sized to design dayASHRAE 90.1-2004
Setpoint temperaturesCooling only, variable per simulation
Table 2. Descriptive statistics for the four extant thermal comfort studies in the Global South using the ASHRAE Global Thermal Comfort Database II.
Location + Köppen Geiger Climate ClassSample Size TSVPMVPMV-TSVTa (°C)
Bangalore Tropical wet savanna (Aw)154 (413)Max3.001.50−1.5026.9
Mean−0.210.390.6024.7
St. Dev.1.370.52−0.851.1
Min−3.00−1.002.0022.1
Bangkok Tropical wet savanna (Aw)228 (384)Max2.000.87−1.1326.9
Mean−0.31−0.32−0.0123.6
St. Dev.1.250.53−0.721.4
Min−3.00−2.040.9620.5
Delhi Monsoon-influenced humid subtropical (Cwa)89 (430)Max1.001.100.1024.8
Mean−0.720.150.8723.6
St. Dev.0.710.41−0.300.6
Min−2.00−0.801.2022.5
Makati Tropical wet savanna (Aw)202 (275)Max2.001.00−1.0027.5
Mean−1.29−0.121.1723.7
St. Dev.1.080.53−0.551.1
Min−3.00−1.501.5020.9
Notes: Thermal sensation vote (TSV) represents the occupants’ recorded thermal sensation vote. Predicted mean vote (PMV) represents the calculated predicted mean vote for the occupants. The sample size is the number of building occupants polled in the study and the numbers in brackets indicate the total votes counted.
Table 3. Current temperature and comfort temperature analysis for the four thermal comfort studies in the Global South, ordered by the difference in temperatures.
LocationObserved Ta (°C)Proposed Tc (°C)∆T (°C)∆T (%)
Bangalore24.725.50.83.2%
Bangkok23.624.50.93.8%
Makati23.726.42.711.4%
Delhi23.626.52.912.3%

