Article

Impact of the Reinforcement Detailing on Seismic Performance of Isolated Non-structural Walls

1
Graduate School of Engineering, Hiroshima University, Higashi-Hiroshima 739-8527, Japan
2
Graduate School of Environmental Studies, Nagoya University, Nagoya 464-8603, Japan
3
Earthquake Research Institute, The University of Tokyo, Bunkyo-ku 113-0032, Japan
4
Graduate School of Engineering, Osaka University, Suita 565-0871, Japan
5
Building Research institute, Tsukuba 305-0802, Japan
*
Author to whom correspondence should be addressed.
Buildings 2020, 10(5), 89; https://doi.org/10.3390/buildings10050089
Submission received: 12 April 2020 / Revised: 30 April 2020 / Accepted: 2 May 2020 / Published: 7 May 2020
(This article belongs to the Section Building Structures)

Abstract

:
Following the observation of severe damage to structurally isolated non-structural reinforced concrete walls after major earthquakes, researchers began to reassess the effectiveness and connection detail of non-structural walls to moment-resisting frames. A method to control damages to the non-structural wall, is to cast exterior non-structural concrete wall elements to be monolithic with frame elements, without anchoring the wall longitudinal bar. The non-anchorage of the wall longitudinal bar significantly increases the drift capacity of the wall and decreases damage. Using an experimental approach, this study assesses the influence of reinforcement detailing and quantity of the transverse reinforcements on the strength and drift capacity of the non-structural hanging wall. This study further evaluates the workability mechanism of the transverse reinforcements and reinforcement detailing with concrete. The non-anchorage of hanging walls, having boundary confinements, was found to exhibit a higher drift and strength capacity than similar walls with the anchored detailing without boundary confinements. The strength capacity of the anchored detailing hanging walls with minimum amounts of reinforcements was higher than that of the non-anchored specimen. The boundary confinements were found to be more influential on the capability of the hanging wall when placed along with non-anchored detailing reinforcement.

1. Introduction

Following the observation of severe damage to structurally isolated non-structural reinforced concrete (RC) walls after major earthquakes in Japan, such as the great Tohoku earthquake in 2011, researchers began to reassess the effectiveness of connection details of a non-structural wall segment to a moment-resisting frame.
The Architectural Institute of Japan (AIJ) suggests that wall segments functioning as hanging or wing walls should be considered as non-structural elements during the structural design [1]. Under the current design practices in Japan, RC wall segments are often structurally isolated from the RC moment-resisting frames by a seismic slit (a gap) installed between the wall segment and primary frame, as shown in Figure 1a.
In an experimental study, it is verified that non-structural RC walls significantly increase the stiffness and strength of RC moment-resisting frames [2]. Moreover, several other studies have also reported that non-structural walls affect the seismic performance of RC buildings [3,4]. According to the Japanese building standards, structural design of non-structural spandrel walls, casted monolithically with the frame, generally follows the design criteria of the structural walls. The response of the spandrel walls under lateral load is similar to that of the shear walls working in the compression, hence the observed indications of the shear walls can be considered for the spandrels. However, the axial load is not subjected to the hanging wall unlike shear walls, which may give different design requirement to the walls.
The required transverse reinforcement at the shear wall boundary and the configuration of anchorage of longitudinal reinforcement, has been tested to address the issues associated with wall thickness, slenderness, axial load, and configuration; as well as the expected displacement demands and load history. Johnson [5], tested isolated cantilever shear walls to investigate the behavior of anchorage details of flexural reinforcement. The results indicated an adequate performance in the case of the coupler and showed that the presence of a splice significantly reduced the lateral deformation capacity of the wall. Likewise, researchers experimentally evaluated the impact of wall slenderness on the performance of shear walls. It has been found that thin, rectangular sections confined by the outer hoop and intermediate legs of crossties at the wall boundaries, as allowed by American Concrete Institute (ACI) [6], were less stable than sections using overlapping hoops for confinement of shear walls [7]. Segura [8], studied the relationship between wall thickness and lateral drift capacity and found that thin walls possess lower lateral drift capacities than thicker walls.
An alternative method of connecting hanging wall segments to the frame or another wall was suggested without a seismic slit [9], as shown at the roof level in Figure 1a. Under these circumstances, the longitudinal reinforcement of the hanging wall could either be anchored to the adjacent member (wing wall or column) or not. However, AIJ provides anchoring of the hanging wall longitudinal reinforcement to the adjacent member. Hereinafter, the anchored reinforcement is referred to as the anchored detailing and the non-anchored reinforcement is referred to as the non-anchored detailing.
The non-structural wall connected to the frame without seismic slit, is assumed to have higher strength capacity in cases of anchored reinforcement detailing while the non-anchored detailing establishes better deformability, as shown in Figure 1b. The mechanism which was based on the fact that the anchored and non-anchored detailing confer different capabilities to the structural member was not observed in the related studies. In addition, the impact of transverse reinforcement on the capability of the wall along with detailing of longitudinal reinforcement was not observed for the typical non-structural wall and needs to be investigated.
This study ascertains the impact of transverse reinforcement, different connection methods of hanging walls with the moment-resisting frame using the anchored and non-anchored detailing of longitudinal reinforcement; impact of boundary confinement on the longitudinal bars considering different detailing; and slenderness on the performance of hanging wall against flexural load. It also evaluates workability of the transvers reinforcements and reinforcement detailing with concrete. For this reason, six different hanging wall specimens were tested under cyclic loading. The specimen parameters are the amount of sectional confinement (a complete stirrup hooked to the beam), existence of a boundary confinement, anchorage and non-anchorage of longitudinal reinforcement, amount of longitudinal reinforcement, and slenderness. The data analysis is then used to suggest a reinforcement detailing and confinement arrangement that fabricate a wall with high lateral drift capacity and strength.

2. Experimental Study

2.1. Test Specimen

Several test specimens comprising of a beam and with a monolithically casted hanging wall were made, where the hanging wall was connected to the adjacent vertical structural member without a seismic slit. Wall members were half scale and corresponded to the prototype wall shown in Figure 2, except the beam element which is without a specific scale factor. This was because the specimens are designed in such a manner that extreme compression is applied on the hanging wall boundary during the test; the beam remains elastic and the performance evaluation is focused on the hanging wall rather than the beam.
The test specimens were designated as 3NN, 3NA, 6NA, 12NA, 12HN, and 18NNT as shown in Figure 3. The numbers at the beginning of specimens inferred from rounded amount of wall transverse reinforcement multiplied by 10; first letter indicates having (H) or not having (N) boundary confinements; second letter anchorage (A) and non-anchorage (N); and third letter variation of the thickness (T). Specimens 3NN and 3NA had equal amounts of longitudinal reinforcement but different detailing as shown in Table 1. Specimens 6NA and 12NA had equal amounts of longitudinal reinforcement but different amounts of transverse reinforcement, as shown in Figure 3c,d. The cross-sectional dimensions of the hanging walls were 100 mm × 150 mm for all specimens, except for 18NNT which was 75 mm × 150 mm. The shear span length was 550 mm; and the shear span-to-depth ratio was 3.67. The beam which the hanging wall was connected to had a cross section of 100 mm × 200 mm.
The specifications of the reinforcement detailing are shown in Table 1.
The steel bars, D6 (SD295A) and D4 (SD295A), were used as the longitudinal, transverse, and confinement bars for the shear wall and beam, while bars D16 (SD345) and D13 (SD345) were used as the longitudinal reinforcement of the beam. The longitudinal reinforcement ratio, ρl, was similar for the beams of all specimens; but differed for the walls.
The specimens 3NN and 3NA were considered to test the reinforcement detailing impact in case of minimum longitudinal and transverse reinforcements. In addition, these specimens are to ascertain the proper relation between longitudinal and transverse reinforcement that can incur higher strength and drift capacity to the hanging wall. The specimens 6NA and 12NA were designed to observe the impact of different quantities of transverse reinforcements with respect to the anchored reinforcement detailing on the strength and drift capacity of the wall. The specimens 12HN and 18NNT were designed to assess the workability of confinement reinforcement and slenderness with non-anchored longitudinal reinforcement. The concrete and reinforcement mechanical properties of the specimens are shown in Table 2 and Table 3.
The test specimens had a length of 600 mm and a depth of 250 mm with one end fixed to the lower stab, as shown in Figure 4. A set of strain gauges were installed at the critical points and other points of interest on the longitudinal, transverse, and confinement reinforcement to investigate the detailing effect of the longitudinal reinforcement, confinements and to insight the collaboration of steel and concrete.

2.2. Testing Program of the Specimen

Each specimen was installed horizontally on the universal testing machine, as shown in Figure 5. The lower stab was the fixed end and load was applied on the upper stab. Each specimen was tested under cyclic loading. The up–down loading represented by the plus sign denotes positive loading where the hanging wall acted in compression; while the down–up loading indicates negative loading as shown by the minus sign where the wall acted in tension. Each specimen was positioned over the steel table of universal testing machine to be tested under the positive loading, while negative loading was applied by the external jack manually installed on the steel table under the upper stab. The steel plates located under and over the testing specimen were used to make space for specimen deformation during loading. The lower plates were removed during positive loading cycle and upper plates were removed during negative loading cycles.
The external displacement of a specimen is controlled using a linear variable differential transducer (LVDT). A series of LVDT devices were installed at designated distances along the length of the specimen on the plane perpendicular to the thickness of the specimen and along the length of the beam on the plane perpendicular to the width, as shown in Figure 5a. The LVDTs (TU1, TU2, TU3, and TU4) measured the horizontal displacement of the designated strip during the negative loading cycle, while the transducers (TB1, TB2, TB3, and TB4) measured the hanging wall movement. All specimens were tested under cyclic loading with ±5kN initial loading and ±1/800, ±1/400, ±1/200, ±1/100, ±1/75, ±1/50 and ±1/25 drift sequences. The assumption for the test specimen was that if the strength capacity of the succeeding step in a loading cycle was found to be higher than 80% of that of the earlier step, the test will continue. Otherwise, loading was stopped as the specimen would be deemed to be significantly damaged.

3. Experimental Results

3.1. Damage Outline

The observed cracking patterns are depicted in Figure 6 at the drift level of 0.02 rad. The red patterns indicate the appeared cracks under the positive loading and the black pattern show the cracks under the negative loading direction. The horizontal dashed lines represent the location of longitudinal reinforcement closest to the edge of the wall. Different types of cracks occurred in all specimens owing to different amounts of transverse, longitudinal, and reinforcement detailing.
For anchored specimens, crack propagation began with the appearance of the first shear crack at the critical zone of the wall, near the lower stab and spread along the wall length with the increase of the negative loading. Consequently, the flexural cracking on the wall occurred at the beam and spread along the specimen with the increase of positive loading. As the load gradually increased, the crushing of the concrete compression zone occurred at the root of the compression strut under the positive loading. The anchored longitudinal reinforcement in the specimen 3NA experienced out-of-plane buckling owing to having minimum sectional confinement (see Figure 7), while the specimen 6NA which has medium sectional confinements, experienced in-plane buckling, as shown in Figure 7b The location of buckled reinforcement of the specimen 6NA, which was captured by a backside camera, is indicated with a red dashed line on the face of the specimen in Figure 6c.
For non-anchored specimens, the damage also started after the appearance of the first shear crack at the critical zone but did not further spread along the wall length with the increase of negative loading. The flexural cracks appeared in the beam under the positive loading but was not as dominant as in anchored specimens. In summary, the non-anchored cases resulted in large cracks near the lower stab face under the negative loading cycle due to the absence of anchored reinforcing bars. This resulted in fewer strains in other parts of the wall during bending, resulting in lesser flexural cracking along the bottom of the wall. However, the anchored cases experienced dominant flexural cracks and concrete crushing under positive loading as a result of cracking along the wall length under the negative loadings.

3.2. Load–Deflection Relation

To understand the impact of reinforcement detailing on the performance of a wall, a load–deflection curve for each specimen was plotted, as shown in Figure 8. Almost all specimens were tested under cyclic loading of up to +1/25 drift limit except 12HN. The specimen 12HN reached the peak strength capacity at the drift of +1/10. Although it was designed to test up to −1/25, the last negative loading cycle was not considered owing to concrete crushing during the positive loading cycle before the negative loading cycle.
In the first place, non-anchored specimens showed higher deformability compared to the anchored specimens, while the anchored specimens without boundary confinement showed higher strength capacity in the minimum-reinforcement case. The higher strength capacity of the anchored specimen was due to the earlier yielding of the anchored bars under the tensile loads, whereas the non-anchored steel bars only yielded under the compression load near the maximum step. This means that the anchored reinforcements of the wall boundary carried both positive and negative loads unlike the non-anchored reinforcement that carried only compression load. In addition, the anchored bars of the wall boundary, which were fixed on both ends, incurred buckling under the positive loading (see Figure 7) whereas the non-anchored detailing, which was only fixed on one end, did not undergo buckling. The strength and drift capacity differences can be seen in load–deflection curves of the specimens 3NN and 3NA, which have minimum reinforcements. It was observed that the anchored reinforcements of the specimen 3NA carried load during positive and negative loading but non-anchored reinforcements of the specimen 3NN only resisted compressive loads. It is, therefore, the wall boundary longitudinal reinforcement of the specimens 3NN and 3NA yielded in the different loading direction, as shown with the diamond and circle marks in Figure 8a,b. The diamond mark shows the yield point (YP) of the wall boundary reinforcement of non-anchored detailing, and the circle represents the YP of the anchored detailing of the similar reinforcement. The activity of anchored bar under the positive and negative loads avoided concrete damage in the early steps and conferred higher strength to the specimen. However, the result could be different with having more transverse reinforcements which also confine the concrete. The amount of transverse reinforcement in the specimen 3NN and 3NA was found insufficient to confer higher drift and strength capacity to the hanging wall considering both types of reinforcement detailing.
The influence of transverse and confinement reinforcement along with detailing can be observed by comparing the results from 6NA, 12NA, and 12HN, as shown in Figure 8c–e. The anchored reinforcements of hanging wall in the specimens 6NA and 12NA resisted the negative, as well as positive loadings, and yielded in the negative loading cycle but the specimen 12HN yielded under positive loading. Specimen 12NA, which had a similar longitudinal reinforcement to 6NA, had a higher strength than the latter because it had a larger quantity of transverse bars.
The presence of boundary confinement and non-anchored detailing conferred the highest strength to the specimen 12HN compared to other specimens. The boundary confinement reinforcement confined the concrete core better than sectional confinement, while the non-anchored detailing decreased the bonding stress resulting from load carrying capability of the non-anchored longitudinal bars. The better workability of the confinement reinforcement, and non-anchorage of the longitudinal bars increased the compressive strength of concrete, which results in the higher capability of the wall.
Comparing the performance of 18NNT with 12NA and 12HN indicates that a slender element would result in a lower peak strength capacity, although having a higher quantity of transverse reinforcement and non-anchored detailing, as shown in Figure 8f.
The AIJ standard for lateral load-carrying capacity declares the impact of slenderness regarding the ratio of the beam thickness to wall thickness as well as beam depth to wall depth [1]. The higher ratio of the beam to wall in terms of thickness and depth confer higher deformability to the beam member, while the lower ratio increases the inflexibility. Nevertheless, the specimen 18NNT that had a higher ratio of the beam to wall thickness, did not experience higher drift than others. Because the decrease of wall thickness decreased the concrete compression area during positive loading and harmed establishing deemed interaction between concrete, transverse reinforcement and non-anchored detailing. In addition, the neutral axis depth of the specimen 18NNT increased resulting in a smaller lever arm between the tension bars and the neutral axis, and thus decreasing strength capacity.

3.3. Drift Capacity

As seen in Figure 8, after reaching the maximum strength capacity, the strength degraded at different rates for each specimen. Thus, it can be inferred that the lateral drift capacity of each specimen was different. In this study, the lateral drift capacity of the specimens is defined based on the trend line of stiffness degradation at the point corresponding to 80% of the maximum strength capacity, as shown Figure 8. Accordingly, stiffness degradation was calculated at the descending phase of the skeleton curve of the specimen between the active loading step of the preceding cycle and maximum loading step of the succeeding cycle. The drift capacity was nearly equal in all other specimens except 12HN. The filled marks in Figure 9 represent the drift capacity of anchored detailing specimens and unfilled marks denote the drift capacity of non-anchored detailing specimens.
The transverse reinforcement did not affect the drift capacity of the anchored specimen as it affected the non-anchored specimens. It was observed that transverse reinforcement was not effective for those anchored specimens that had an equivalent or a larger amount of longitudinal reinforcement compared to the transverse reinforcement (specimens 12NA and 3NA). As seen in Figure 9, between 6NA and 12NA, even if the amount of transverse reinforcement of 12NA was larger than that of 6NA, with an equal amount of longitudinal reinforcement, the drift capacity of 12NA was not larger than that of 6NA. It provides that extra sectional confinements did not affect the drift capacity of the wall in a situation that the longitudinal bars are anchored. The anchored longitudinal reinforcement of the wall induced to appear flexural cracks in the concrete as a result of the cyclic tension–compression behavior and higher bonding stress. The appeared flexural cracks gradually damaged the concrete and might have counteracted the impact of extra sectional confinement on the drift capacity.
As seen in 12HN, the drift capacity was higher than the other specimens due to having boundary confinement and non-anchored detailing. The non-anchored detailing did not cause flexural cracks and large bond stress interactions between the steel and concrete; a better concrete condition is maintained during the cyclic loading owing to a higher efficiency of the boundary confinements than sectional confinements. However, the impact of non-anchored detailing associated with the slenderness was found to be insignificant to the drift capacity of the specimen. Finally, considering the small difference in drift between 3NA and 3NN, it is concluded that a wall with higher drift capacity can be established where:
  • There is a non-anchored detailing of longitudinal reinforcement;
  • The amount of longitudinal reinforcement is equal or greater than transverse reinforcement;
  • The confinements are placed at the critical zone of the wall.

3.4. Strain–Drift Relationship of Trasnverse Reinforcements

The impact of transverse reinforcement on the behavior of a hanging wall is proportional to the type of stirrups and their location. According to the displacement-based design approach [10,11], transverse reinforcements are more influential when limited to the critical zone of the specimen. To demonstrate this, based on the strain gauge records the drift–tensile strain curve for the critical stirrups of some specimens are plotted in Figure 10. The data used for comparison of the strain–drift relation of specimens 12HN, 12NA, 3NN, and 3NA were taken from the record of the strain gauges installed in both in- and out-of-plane loading, as shown in Figure 4.
The first stirrup of specimen 3NN, corresponding to strain gauge H1, as shown in Figure 4a, encounters a bigger amount of strain in the negative loading due to the accumulation of cracks near the lower stab rather than spreading along the length of the wall, as seen in Figure 10a. Conversely, specimen 3NA experienced a lower strain for the negative loading, because the cracks spread along the length of the hanging wall, as shown in Figure 10b. As seen in Figure 10d, boundary-confined bars were more operational for carrying tensile and compressive loads rather than sectional confinements, which address the condition of the displacement design approach. Similarly, the performance of sectional confinement stirrup of specimen 12NA and boundary confinement of specimen 12HN were almost alike, as shown in Figure 10c,d. This is because the anchored bars of specimen 12NA could transfer more stress to the stirrup during the loading, resulting in the stirrup experiencing similar strain as the 12HN confined stirrup.

4. Evaluation of the Experimental Results

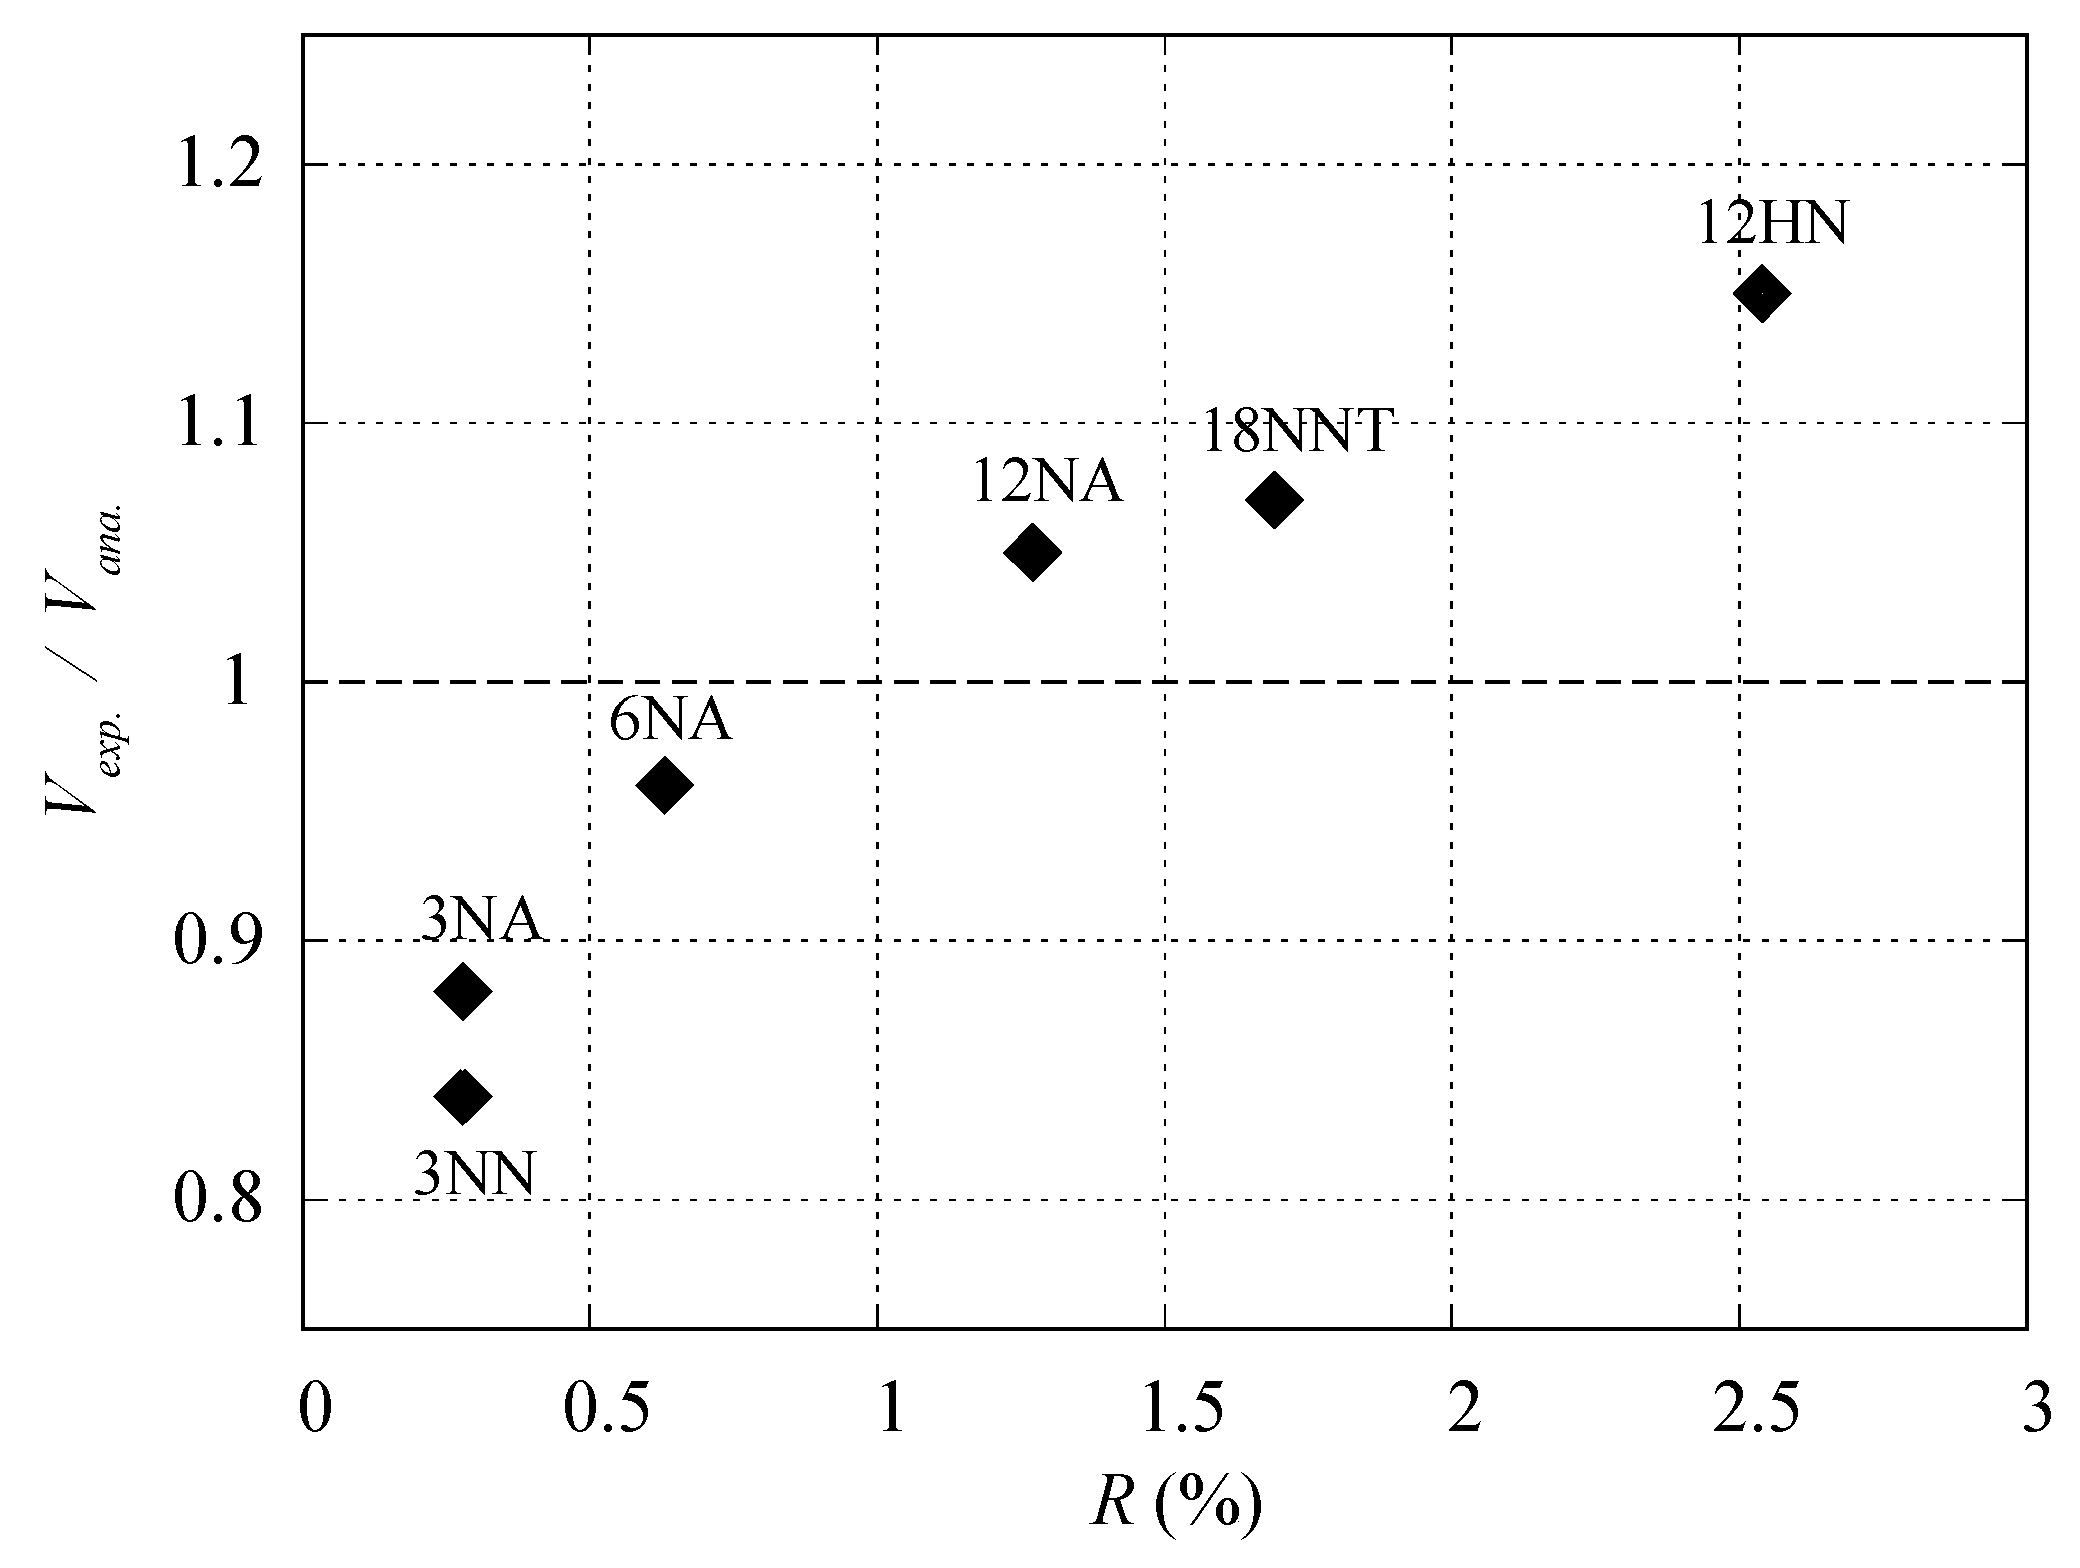
4.1. Evaluation of the Strength

To analyze the experimental results, the sectional analysis program Response-2000 [12], which can conduct reinforced concrete sectional analysis, was used. All specimen sections were modeled in Response-2000 based on their detailed material property obtained from the experimental testing results. The base curve of concrete was assumed based on the non-linear model of Popovics [13], and compression softening was modeled considering the Modified Compression Field Theory (MCFT). The steel curves were developed to be linear until yielding, flat post yielding and quadratic after strain hardening, as shown in Figure 11. The parameters for every model were obtained from concrete cylinder compression and bar tensile pull tests in accordance with Japanese industrial standards. The material tests were also carried out at the Hiroshima University experimental facility a day before testing of the specimen.
The analytical strength capacity of the specimen was identified using the principle of ineffectiveness of transverse and non-anchored reinforcements. Therefore, the analytical strength capacity of specimens 3NN and 12HN, and 6NA and 12NA were found to be alike, as shown in Table 4. Specifically, analytical prediction tends to overestimate the strength capacity of specimens with minimum reinforcement, whereas it underestimates the strength capacity of the specimens with a higher amount of transverse reinforcement. The analytical strength capacity of the specimens was obtained using Response-2000, which is a monotonic loading software. The experimental strength obtained from a cyclic loading test can affect the strength capacity, especially in anchored cases. Considering this, the differences in the analytical and experimental strength might be due to differences of the loading type and the exclusion of non-anchored and transverse reinforcements in the analysis.
The relation between the total amount of transverse reinforcement ratio R, which includes both sectional and confinements reinforcement, versus shear strength ratio for all specimens is shown in Figure 12. The sectional analysis prediction appears to be satisfactory for specimen 6NA with a medium amount of reinforcement, which showed only 4% of underestimation from the analytical result.

4.2. Evaluation of the Confinement and Reinforcement Detailing Impact

The strength variation of specimens, specifically the specimens with similar longitudinal reinforcement, was realized owing to the different amount of transverse reinforcement, different detailing, and slenderness. In fact, the reinforcement detailing and confinements established different workability of the reinforcements with the concrete in every specimen and resulted in the specimens having different capabilities. The influence of transverse reinforcements along with detailing of the longitudinal bars is evaluated in the peak observed strength to ascertain a method of detailing that confers higher capability to the hanging walls. To evaluate the confinement impact on the strength and drift capacity, the non-linear behavior of the concrete compression zone was observed in the maximum positive loading. The concrete compressive stress and strain at the peak strength of the specimens were obtained from the experimental result, assuming that the plane section remains plane. The compressive stress and strain were found using the following steps:
  • To calculate internal forces, the stress incurred in every longitudinal reinforcement was calculated based on the strain gauge record pasted on the longitudinal reinforcement, as shown in Figure 4. The strain records from gauges V1, V5, L1, and L2 were used for stress analysis of specimens 3NN and 3NA, and the strain records from V1, V6, V9, L1, and L2 were used for the other specimens.
  • The concrete compressive force Ncc was extrapolated using the equilibrium Equation (1).
    N C C = N T N C S
    where NT (N1, N2) and NCS are tensile and compressive forces, respectively, as shown in Figure 13, determined according to the strain gauge records installed on the longitudinal bars.
  • Neutral axis Cb was calculated using the curvature ϕ of the specimen. Curvature was calculated according to the strain gauge records L1 and L2 (ε1, ε2) installed on the D13 and D16 reinforcement bars (See Figure 4). Using neutral axis and curvature, the compressive strain at the extreme compression fiber was calculated.
  • Effective concrete compressive stress fce and compressive strain εcu was found using Equations (2) and (3):
    f c e = N c c 0.85 × β C b × d
    ε c u = ϕ × C b
The value of curvature ϕ seems practical until yielding of the D16; however, its value suddenly increased after yielding of D16 near maximum loading. The sudden increase of curvature was observed due to the occurrence of the larger strain in the D16 following yielding; and the compression failure of concrete compressive fiber (see Figure 7). Moreover, the stress distribution at the lower moment could be almost linear, which establishes a triangular concrete stress block. Post-yielding, the stress distribution within the concrete would change to that shown in Figure 13. This change in mechanism could have resulted in the sudden change in curvature. The sudden increase of the curvature near the maximum loading steps was observed in specimen 12HN, which resulted in a larger compressive strain and neutral axis, and relatively lower effective compressive strength.
In summary, the concrete compressive strength and strain of the specimen 12HN were increased by installation of boundary confinements and non-anchored detailing of wall longitudinal reinforcement. However, a certain effective compressive strength and strain was not modified due to the sudden increase in the curvature. Therefore, the experimental effective strength and ultimate strain for all other specimens are shown with filled marks in Figure 14, except for 12HN. The stress–strain relationship of 12HN is shown with trend point lines, to express the strength–strain relation at the peak observed loading as well as in five earlier steps. However, for the sake of comparison with the compressive stress–strain of other specimens, nearly the middle value (third point from the top) of trend point line can be described as the ultimate compressive stress–strain of the specimen 12HN.
The effective concrete compressive strengths of 12HN, 12NA, and 18NNT were larger than the other examined specimens due to the different stress transition mechanisms and larger amount of transverse reinforcement.
As shown in Table 5, the medium value of specimen 12HN exhibits higher effective compressive strength and strain than other specimens due to its non-anchored detailing and confinements. This means that a better workability was established between the concrete, the confinements, and the longitudinal bars in the case of non-anchored detailing.
The effective strength in specimen 6NA was the same as that of 3NA and 3NN, while the strain is larger than all anchored specimens, because, the longitudinal bar of 6NA underwent out-of-plane buckling (see Figure 7b), which might have triggered amplification of the strain.
Furthermore, the effective compressive strength and ultimate compressive strain of every specimen were evaluated analytically, using the model of Mander [14]. The analytical result of specimens, as shown with unfilled marks in Figure 14, was then compared with the experimental results. According to the Mander model, confinement increases the strength and ultimate strain of concrete, which can be calculated using the following equations:
f c = f c c   x r r 1 + x r
where f’cc is the compressive strength of the confined concrete, which is directly related to the effective confining stress f’l, as given in Equations (5) and (6) for a rectangular section in the x and y directions.
f l x = K e ρ x f y h  
f l y = K e ρ y f y h
ρx and ρy are the effective section area ratios of the transverse reinforcement to the core concrete, Ke is the confinement effectiveness coefficient with a typical value of 0.6 for the rectangular wall sections. Confined compressive stress is calculated using K from a biaxial chart.
f c c = K f c  
Moreover, x and r in Equation (4) are given by Equations (8)–(10) as follows:
x = ε c ε c c
ε c c = ε c 0     [ 1 + 5 ( f c c f c 0 1 ) ]
r = E c E c E s e c  
where Ec and Esec are the tangent and secant modulus of the concrete.
The experimental ultimate stress–strain response as shown in Figure 14, almost corresponds to the Mander model in terms of compressive strength. However, there are some differences between the experimental result and the model, which could be due to detailing effect of the longitudinal reinforcement, the variation of amount of transverse reinforcement, and concrete compressive strength.

4.3. Evaluation of the Stress Transition Mechanism

It was observed that different stress transition mechanisms in the anchored and non-anchored detailing bars result in different capabilities of the hanging wall. The non-anchored detailing reinforcement only carries compressive axial load, creating a much lower bond stress in the longitudinal reinforcement compared to the anchored one, as shown in Figure 15. The anchored reinforcement carries tensile and compressive forces during cyclic loading, resulting in a higher bonding stress with the concrete. The reduction of bond stress in a non-anchored longitudinal reinforcement renders the confinements to be more effective on confining the core concrete. Conversely, the higher bond stress in the anchored detailing as well as higher interaction of the concrete–steel result in damaging the concrete core and affect the capability of the hanging wall. With all that considered, if a higher amount of transverse reinforcement is utilized with the anchored detailing reinforcements, it may confine the concrete core and improve the strength capacity but does not improve the drift capacity.

5. Conclusions

This study is the continuity of the former research of the authors which aimed to assess the influence of different reinforcement detailing and transverse reinforcement on the strength and drift capacity of the non-structural wall, to develop walls with higher capability. It was observed that non-anchorage of the wall longitudinal bar increases the drift capacity of the wall and limits damage. The significant increase of drift capacity of the non-structural wall can be established where: (1) there is a non-anchored detailing of longitudinal reinforcement; (2) the amount of longitudinal reinforcement is equal or greater than transverse reinforcement; (3) the confinements are placed at the critical zone of the wall.
Transverse reinforcement in terms of boundary confinements was more influential when limited to the critical zone. It could better confine the core concrete of the wall and led the specimen to have higher effective compressive stress and strain. The workability of the confinements and non-anchored detailing was found to be effective and resulted in the specimen 12HN to have higher strength and drift capacity. The strength capacity of the anchored detailing specimens with a minimum amount of reinforcements was higher than that of the non-anchored specimen.
The slenderness of the non-anchored detailing specimen did not significantly impact the drift capacity despite having a higher quantity of transverse reinforcement. It also decreased the strength of hanging wall. The decrease in wall thickness decreased the concrete compression area and damage, establishing the expected interaction between concrete, transverse reinforcement and non-anchored detailing.
The impact of boundary confinement on the longitudinal reinforcement under flexural load was higher in the non-anchored case compared to anchored detailing due to a different load carrying capacity of the longitudinal reinforcement.
The observed indications of this research can be developed for the normal shear wall considering the workability of the special boundary confinements and detailing of longitudinal reinforcements.

Author Contributions

Conceptualization, Y.H.; Funding acquisition, Y.H.; Investigation, Y.S. and W.A.S.; Project administration, K.K. and T.M.; Supervision, Y.H.; Validation, K.K. and Y.H.; Visualization, Y.S. and Y.H.; Writing—review & editing, W.A.S. All authors have read and agree to the published version of the manuscript.

Funding

This research received no external funding.

Acknowledgments

The present work was supported by the Tokyo Metropolitan Resilience Project of National Research Institute for Earth Science and Disaster Resilience (NIED) The authors would like to thank Trevor Zhiqing Yeow for his useful comments.

Conflicts of Interest

The authors declare no conflict of interest.

References

  1. Izumi, N.; Kashima, K.; Kusunoki, K.; Fukuyama, H. Outline of AIJ Standard for Lateral Load-carrying Capacity Calculation of Reinforced Concrete Structures (Draft). Concr. J. 2016, 54, 1155–1161. [Google Scholar] [CrossRef]
  2. Yoon, R.; Sanada, Y.; Akahori, T. Seismic Performance Evaluation of RC Moment-Resisting Frames with Typical Non-Structural Walls in Japan. J. Adv. Concr. Technol. 2017, 15, 544–557. [Google Scholar] [CrossRef] [Green Version]
  3. Ju, R.-S.; Lee, H.-J.; Chen, C.-C.; Tao, C.-C. Experimental study on separating reinforced concrete infill walls from steel moment frames. J. Constr. Steel Res. 2012, 71, 119–128. [Google Scholar] [CrossRef]
  4. Kabeyasawa, T.; Kato, S.; Hosokawa, Y. Effect of spandrel and hanging walls on flexural capacity of reinforced concrete columns with wing walls. In Proceeding of the 10th U.S. National conference on Earthquake Engineering, Anchorage, AK, USA, 21–25 July 2014. [Google Scholar]
  5. Johnson, B. Anchorage Detailing Effects on Lateral Deformation Components of R/C Shear Walls. Master’s Thesis, University of Minnesota, Department of Civil Engineering, Minneapolis, MN, USA, 2010. [Google Scholar]
  6. American Concrete Institute. Building Code Requirements for Structural Concrete (ACI 318-14) and Commentary (ACI 318R-14); American Concrete Institute: Farmington Hills, MI, USA, 2014. [Google Scholar]
  7. Welt, T.S. Detailing for Compression in Reinforced Concrete Wall Boundary Elements: Experiments, Simulations, and Design Recommendations. Ph.D. Thesis, University of Illinois, Urbanna Champaign, IL, USA, 2015. [Google Scholar]
  8. Segura, C.L.; Wallace, J.W. Seismic Performance Limitations and Detailing of Slender Reinforced Concrete Walls. ACI Struct. J. 2018, 115, 849–860. [Google Scholar] [CrossRef]
  9. Walid, A.S.; Hibino, Y.; Kusunoki, K.; Tomohisa, M.; Sanada, Y.; Izumi, N.; Trevor, Z.Y.; Satoru, F. Structural performance of reinforced concrete members with monolithic non-structural wall under static and dynamic loads. Build. J. 2020. under review. [Google Scholar]
  10. Moehle, J.P.; Acevedo, C.; Creagh, A. Exploratory tests of wall boundary elements subjected to alternating tensile and compressive loadings. In Proceedings of the PEER Annual Meeting, San Francisco, CA, USA, 8–9 October 2010. [Google Scholar]
  11. Wallace, J.; Orakcal, K. ACI 318-99 Provisions for Seismic Design of Structural Walls. ACI Struct. J. 2002, 99, 499–508. [Google Scholar]
  12. Bentz, E.; Collins, M.P. Response 2000, Version 1.0.5; University of Toronto: Toronto, ON, Canada, 2001. [Google Scholar]
  13. Popovics, S. A numerical approach to the complete stress-strain curve of concrete. Cem. Concr. Res. 1973, 3, 583–599. [Google Scholar] [CrossRef]
  14. Mander, J.B.; Priestley, M.J.N.; Park, R. Theoretical Stress-Strain Model for Confined Concrete. J. Struct. Eng. 1988, 114, 1804–1826. [Google Scholar] [CrossRef] [Green Version]
Figure 1. (a) Proposed detailing of a frame with a hanging wall with and without a seismic slit; and (b) their expected performance.
Buildings 10 00089 g001
Figure 2. Prototype specimen.
Buildings 10 00089 g002
Figure 3. Specimen cross section: (a) 3NN; (b) 3NA; (c) 6NA; (d) 12NA; (e) 12HN; (f) 18NNT.
Buildings 10 00089 g003
Figure 4. Specimen configuration: (a) anchored case with minimum reinforcement; (b) anchored case with only sectional confinement; and (c) non-anchored case with confinement.
Buildings 10 00089 g004
Figure 5. Configuration of specimen setting on testing machine: (a) side view; (b) front view.
Buildings 10 00089 g005
Figure 6. Damage outline at the drift limit +0.02 rad: (a) 3NN; (b) 3NA; (c) 6NA; (d) 12NA; (e) 12HN; (f) 18NNT.
Buildings 10 00089 g006
Figure 7. Buckling of the longitudinal reinforcement in the anchored specimens: (a) 3NA; (b) 6NA.
Buildings 10 00089 g007
Figure 8. Comparison of load–deflection curve: (a) 3NN; (b) 3NA; (c) 6NA (d) 12NA; (e) 12HN; (f) 18NNT.
Buildings 10 00089 g008aBuildings 10 00089 g008b
Figure 9. Drift capacity comparison at 80% of maximum loading.
Buildings 10 00089 g009
Figure 10. Strain–drift relation of the critical transverse reinforcement: (a) 3NN; (b) 3NA; (c) 12NA; (d) 12HN.
Buildings 10 00089 g010
Figure 11. Concrete and steel stress–strain distribution models for the analysis.
Buildings 10 00089 g011
Figure 12. Analytical and experimental comparison.
Buildings 10 00089 g012
Figure 13. Stress–strain diagram of the specimen.
Buildings 10 00089 g013
Figure 14. Comparison of effective compressive strength and maximum compressive strain.
Buildings 10 00089 g014
Figure 15. Mechanism of confinement and detailing impacts on the concrete core: (a) anchored detailing and (b) non-anchored detailing.
Buildings 10 00089 g015
Table 1. Reinforcement detailing.
IDCross SectionTransverse ReinforcementLongitudinal ReinforcementBoundary ConfinementAnchoring of Main BarNotice
WallBeamWallBeamRatioDepth
(mm)
3NN100 × 150D4@100
(ρt = 0.28%)
D6@50
(ρt = 1.3%)
4-D4
(ρl = 0.37%)
4-D16
4-D13
(ρl = 6.51%)
No
3NAD4@100
(ρt = 0.28%)
D6@50
(ρt = 1.3%)
4-D4
(ρl = 0.37%)
4-D16
4-D13
(ρl = 6.51%)
--YesMin. 1
6NAD6@100
(ρt = 0.63%)
D6@50
(ρt = 1.3%)
6-D6
(ρl = 1.26%)
4-D16
4-D13
(ρl = 6.51%)
YesMed. 2
12NAD6@50
(ρt = 1.27%)
D6@50
t = 1.3%)
6-D6
(ρl = 1.26%)
4-D16
4-D13
(ρl = 6.51%)
YesMax. 3
12HND6@50
(ρt = 1.27%)
D6@50
(ρt = 1.3%)
6-D6
(ρl = 1.26%)
4-D16
4-D13
(ρl = 6.51%)
1.27%450NoMax. 3
18NNT75 × 150D6@50
(ρl = 1.69%)
D6@50
(ρt = 1.3%)
6-D6
(ρl = 1.69%)
4-D16
4-D13
(ρl = 6.51%)
--NoSlend. 4
1 Minimum reinforcement used in this test. 2 Medium reinforcement used in this test. 3 Maximum reinforcement used in this test. 4 Slenderness impact.
Table 2. Concrete mechanical properties.
Compressive Strength f’c (MPa)Strain at Peak (%)Young’s Modulus (MPa)Tensile Strength (Mpa)
36.30.21217,374.62.7
Table 3. Reinforcing bar mechanical properties.
ReinforcementsYoung’s Modulus (GPa)Yield Stress (MPa)Ultimate Strength (MPa)
D4178.8356.7503.5
D6185.6338.3501.7
D13201.3380.6506.2
D16203.4383.8568.9
Table 4. Ultimate strength capacity.
SpecimenUltimate Strength Capacity Vexp 1
(kN)
Analytical Prediction Vana 2
(kN)
Vexp/Vana
(%)
3NN85.2101.884
3NA92.8104.988
6NA106.2110.596
12NA115.8110.5105
12HN116.8101.8115
18NNT86.280.4107
1 Experimental ultimate lateral load capacity. 2 Analytical ultimate lateral load capacity.
Table 5. Test result parameters.
SpecimenDrift Capacity (%)Neutral Axis Depth (mm)Effective Compressive Strength (MPa)Ultimate Compressive Strain
3NN0.04014440.80.0031
3NA0.03815040.50.0037
6NA0.04016139.80.0064
12NA0.03713448.30.0033
12HN0.09914850.30.0069
18NNT0.04016151.70.0055

