1. Introduction
While there is no agreed definition of the Global South, it generally refers to developing economies, primarily countries situated in Africa, South Asia, Latin America, and the Middle East [
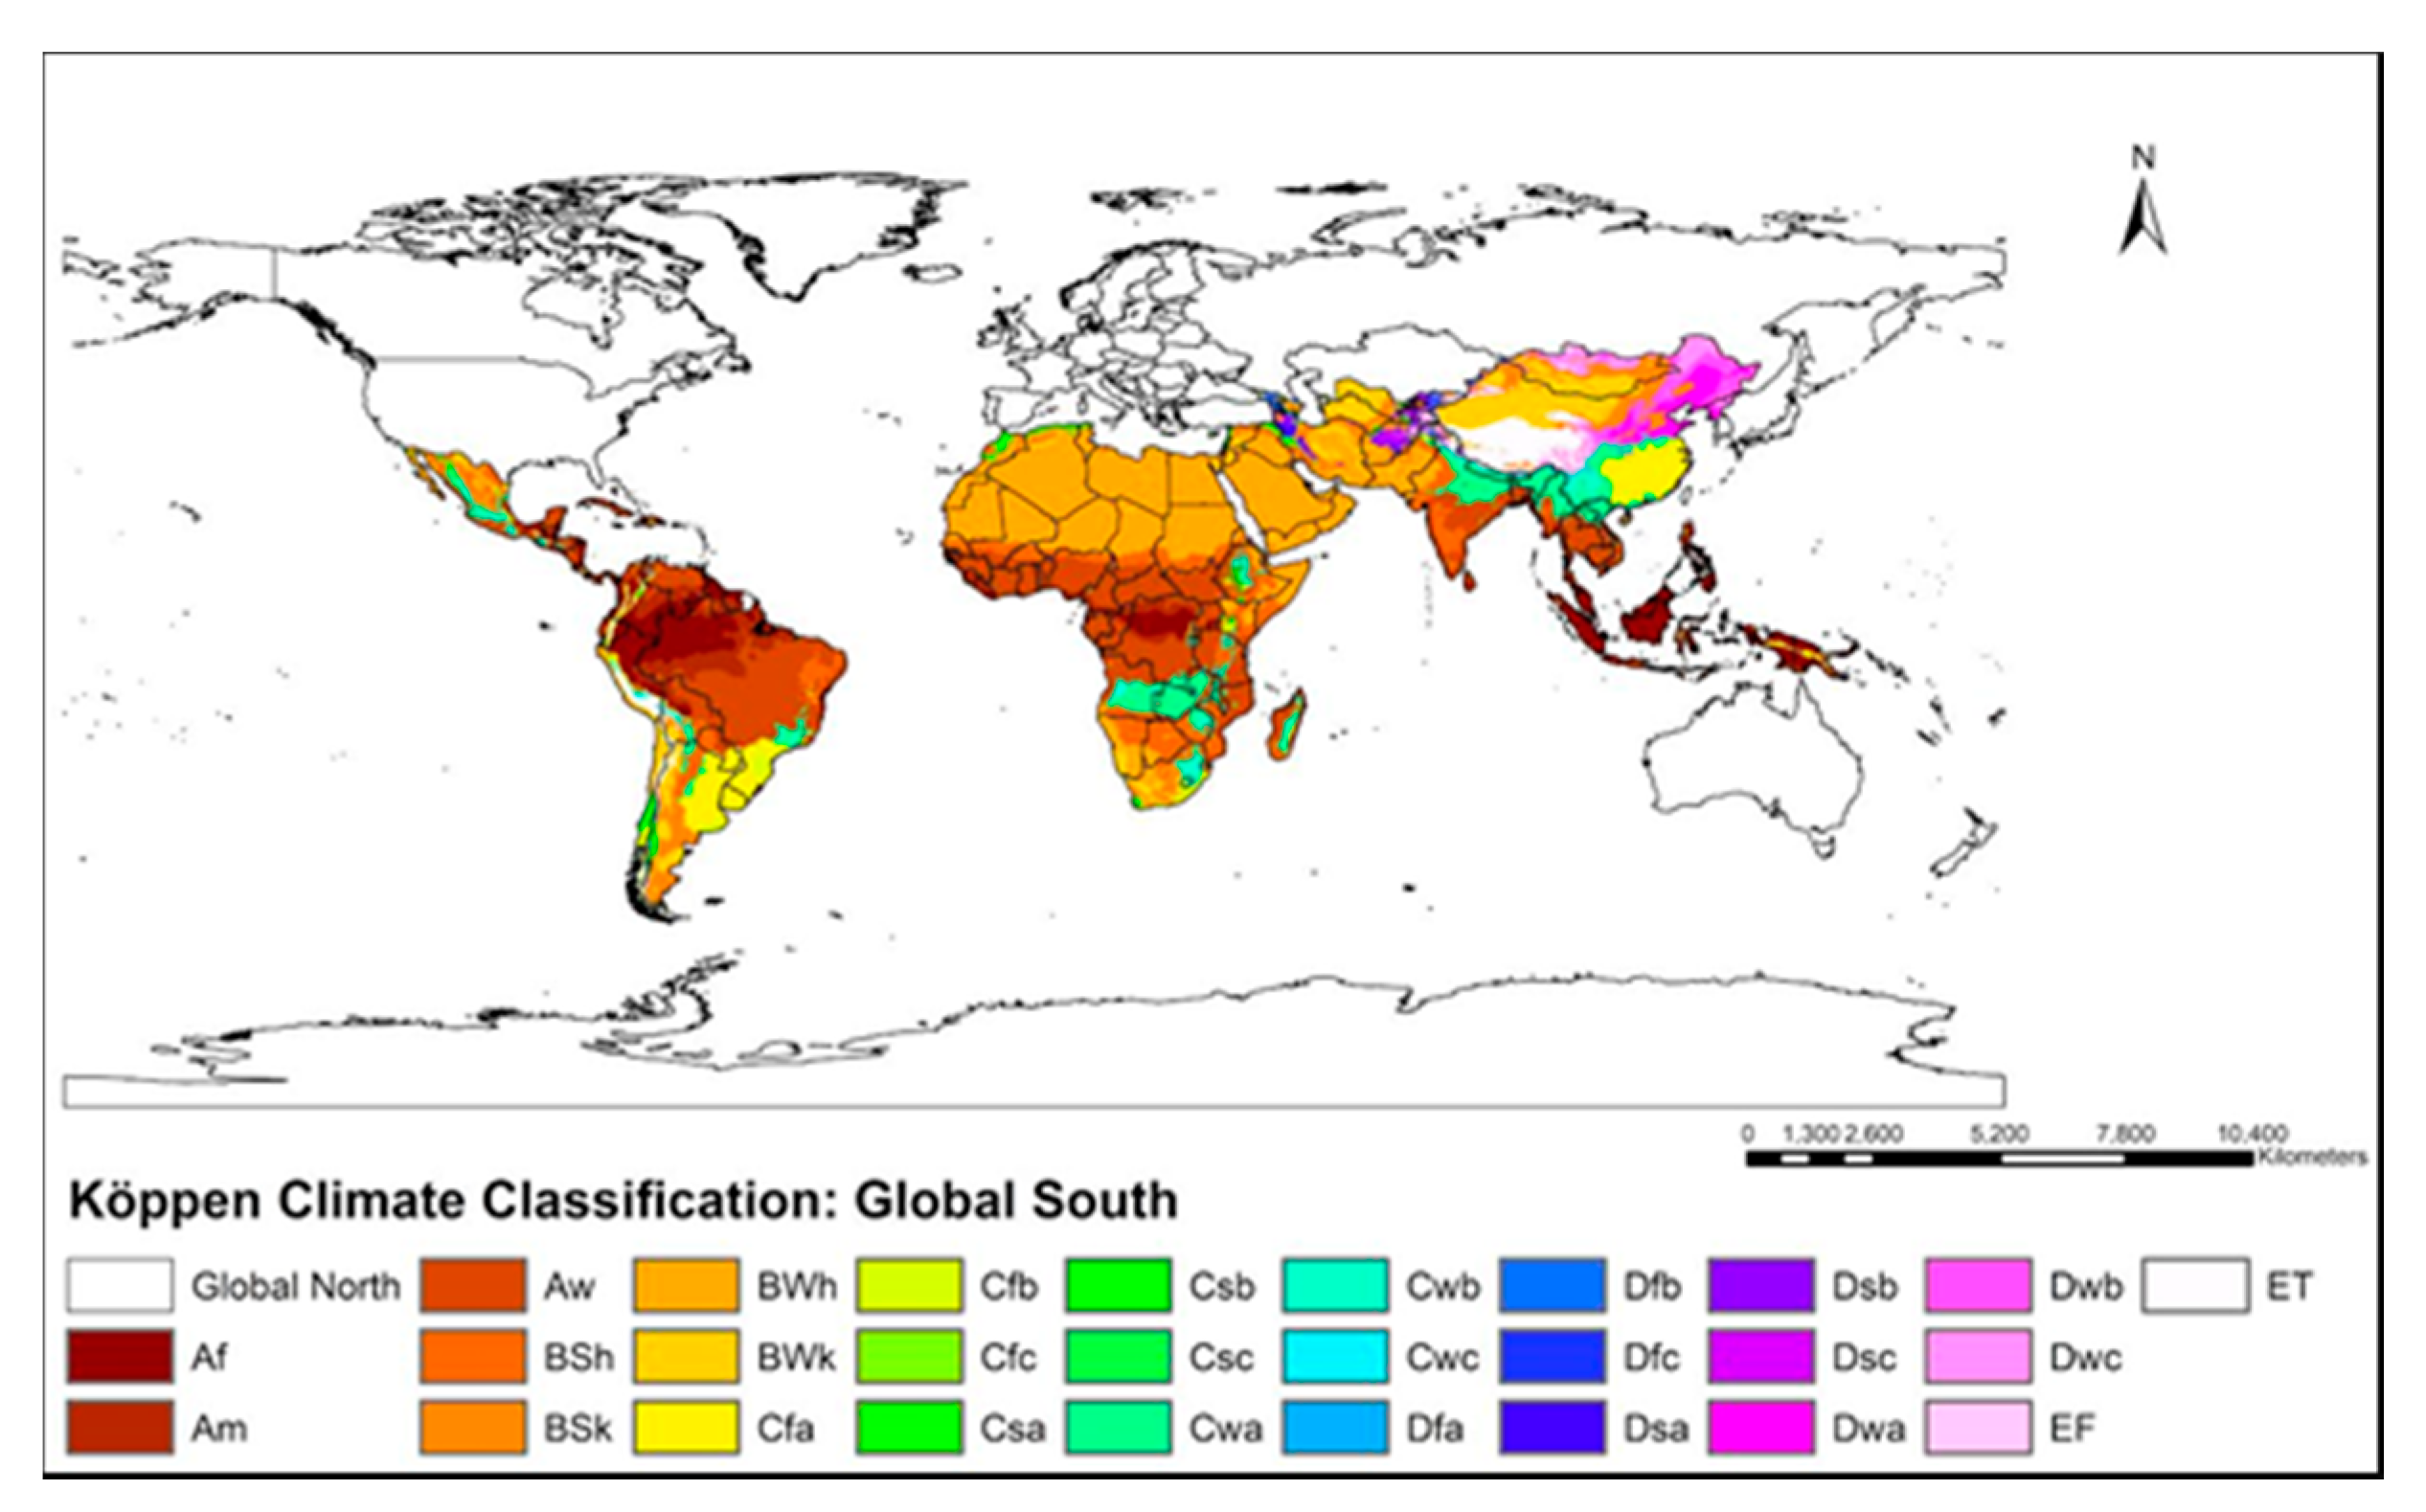
1]. Broadly, these countries are found at 30° on either side of the equator and hence experience a wide variety of tropical and sub-tropical climates. As seen in
Figure 1, a large portion of the Global South falls under harsh dry arid and semi-arid climate, generating a high demand for air conditioning to achieve desired levels of thermal comfort. Due to the growing risk of greater exposure to heat related stresses, lack of sufficient energy for air conditioning is now being seen as an element of energy poverty and human well-being in the Global South [
1]. Presently, only 8% of the 2.8 billion people living in the warmest regions of the world own an air conditioner. However, heatwave related deaths have been rising in recent years, especially in densely populated countries and we can therefore expect to see a rise in air-conditioning ownership as a response to falling prices, increasing incomes, and increases in extreme heat events. As the Global South is expected to double its floor space by 2050, it will be crucial to improve energy efficiency of all existing and proposed buildings [
2,
3,
4,
5]. Failure to take strong actions is likely to escalate the burden over an already fragile environment and increase the frequency of power cuts, grid failures, and health related issues in these regions.
As seen in
Figure 1, large regions of the Global South fall under the BSh climate category. Areas with a BSh climate experience a semi-arid or a steppe type of climate receiving higher temperatures and lower than average precipitation. As a result, these regions experience a high demand for air conditioners (AC) for space cooling applications, thereby increasing building energy demands significantly.
Building codes are implemented across the world to provide building construction guidelines for designers, architects, engineers, and all other associated agencies. The primary focus of these codes is to bring down the energy demand and improve thermal comfort in different types of buildings. Implementing building codes also provides many complimentary benefits such as lower carbon emissions, higher electrical reliability, air quality improvements, and socio-economic development. By 2015, approximately 40 national governments, as well as state and local authorities have successfully implemented some sort of a building code [
7]. For example, a Chinese multitier building energy code has the potential to reduce the national building energy footprint between 13% and 22% by 2100 [
8]. Similarly, nationwide implementation of the Energy Conservation Building Code (ECBC) has the potential to create 1.7 billion kWh of annual energy savings for India [
9], [
10]. Evans et al. (2017) investigated building energy codes across 22 countries and characterized the key elements in their implementation system [
11].
Building codes follow four broad compliance pathways:
Prescriptive building codes set strict performance limits for each building component;
The trade-off compliance path is similar to a prescriptive approach, but it allows for some substitution between code components;
Point system compliance involves scoring for meeting certain specific requirements accompanied by incentives for achieving levels of over-compliance.
Simulated performance compliance relies on simulation tools to simulate energy performance for proposed buildings by comparing their energy performance to a reference benchmark building. It is estimated that between 20% and 50% of energy savings could be achieved by interventions in the building envelope, 20% and 60% for HVAC systems, and 20% and 50% for lighting [
12,
13].
The growing demand for air conditioning has led to a considerable rise in the number of mixed-mode buildings in the Global South. In such buildings, occupants have the freedom to choose between windows and air conditioners to maintain their thermal comfort. For such buildings, the design optimization process must identify solutions which can simultaneously deliver low energy consumption and high thermal comfort. Residential buildings in the Global South exhibit significant uncertainty with regards to the use of lighting, electrical appliances, and the control of cooling and ventilation systems. The actual operation of buildings depends on socio-economic, psychological, and cultural factors which are often under-researched and challenging to predict [
14]. Therefore, it is essential to design buildings which can deliver the target performance under possible operational uncertainties.
This study pertains to the design optimization of a mid-income residential apartment building situated in a hot and dry (Köppen climate classification: BSh) region of India. Our goal is to apply the non-dominated sorting genetic algorithm for multi-objective building optimization under operational uncertainties and compare results with conventional methods. This particular case study has been chosen to have relevance with large parts of the Global South, which experience similar climatic conditions and comparable operational uncertainties. As mass housing schemes in several countries of the Global South are working towards constructing millions of affordable dwellings in the coming decades, significant energy savings can be achieved by developing suitable design interventions [
15].
2. Literature Review
Researchers have used building simulation tools to estimate potential energy savings for the Indian building sector. Tulsyan et al. (2013) estimated that energy savings of up to 17%–42% can be achieved by implementing ECBC guidelines in non-domestic buildings [
16]. Envelope and HVAC improvements are the primary source of energy savings in large commercial buildings. The citywide implementation of ECBC guidelines in Jaipur (Köppen climate classification: BSh) could generate 12.5 Gigawatt hour (GWh) of annual energy savings, equivalent to 12% of national monthly demand. Dhaka et al. (2012) assessed the energy efficiency improvements of an air-conditioned building located in Hyderabad (combination of a tropical wet and dry climate) by adopting energy conservations measures mentioned in ECBC [
17]. It was found that energy savings of up to 16% could be achieved in small buildings by replacing constant AC cooling setpoints with an adaptive setpoint temperature based on the monthly mean outdoor temperature. Adaptive setpoints had a much smaller impact on the energy savings of large commercial buildings due to their higher internal heat gains. Yu et al. (2014) assessed the potential benefits of ECBC adoption for the Indian state of Gujarat. It was found that ECBC guidelines have the potential to avoid 134 GWh of additional electrical capacity addition by the year 2050 [
9]. However, the attainment of these benefits would require strong policy implementation and large scale training for all the professionals involved.
Simulation tools have been used for testing the suitability of various building energy efficiency measures (EEM) in different climates. Ramesh et al. (2012) calculated life cycle energy (LCE) savings for single, double, and multi-story buildings located in hot, dry, and mild composite climates [
18]. Designbuilder and e-Quest software were used for testing the performance of 10 different EEM. LCE reductions between 5% and 30% were achieved by improving roof and wall insulation and glazing replacement. Ramesh et al. (2012) calculated the LCE of a residential building situated in five different climate zones of India, i.e., hot and dry, warm and humid, composite, as well as cold and moderate [
19]. The building was simulated under conventional (fired clay) and alternative (hollow concrete, soil cement, fly ash, and aerated concrete) bricks and many possible wall and roof insulation thicknesses. Maximum LCE savings in warm and humid climates were achieved by increasing the wall and roof insulation thickness. The same strategy was not found to be successful in moderate climates with lower peak temperatures. Higher LCE savings were achieved for roof insulation than wall insulation for the same thickness. In simulation studies, it is challenging to use a parametric approach for testing a very large number (>1000 s) of EEMs. In such situations, the parametric approach becomes cumbersome and time-consuming due to non-linear interactions between the model inputs and outputs. Evolutionary algorithms have proven to be far more efficient in such situations.
3. Building Design Optimization
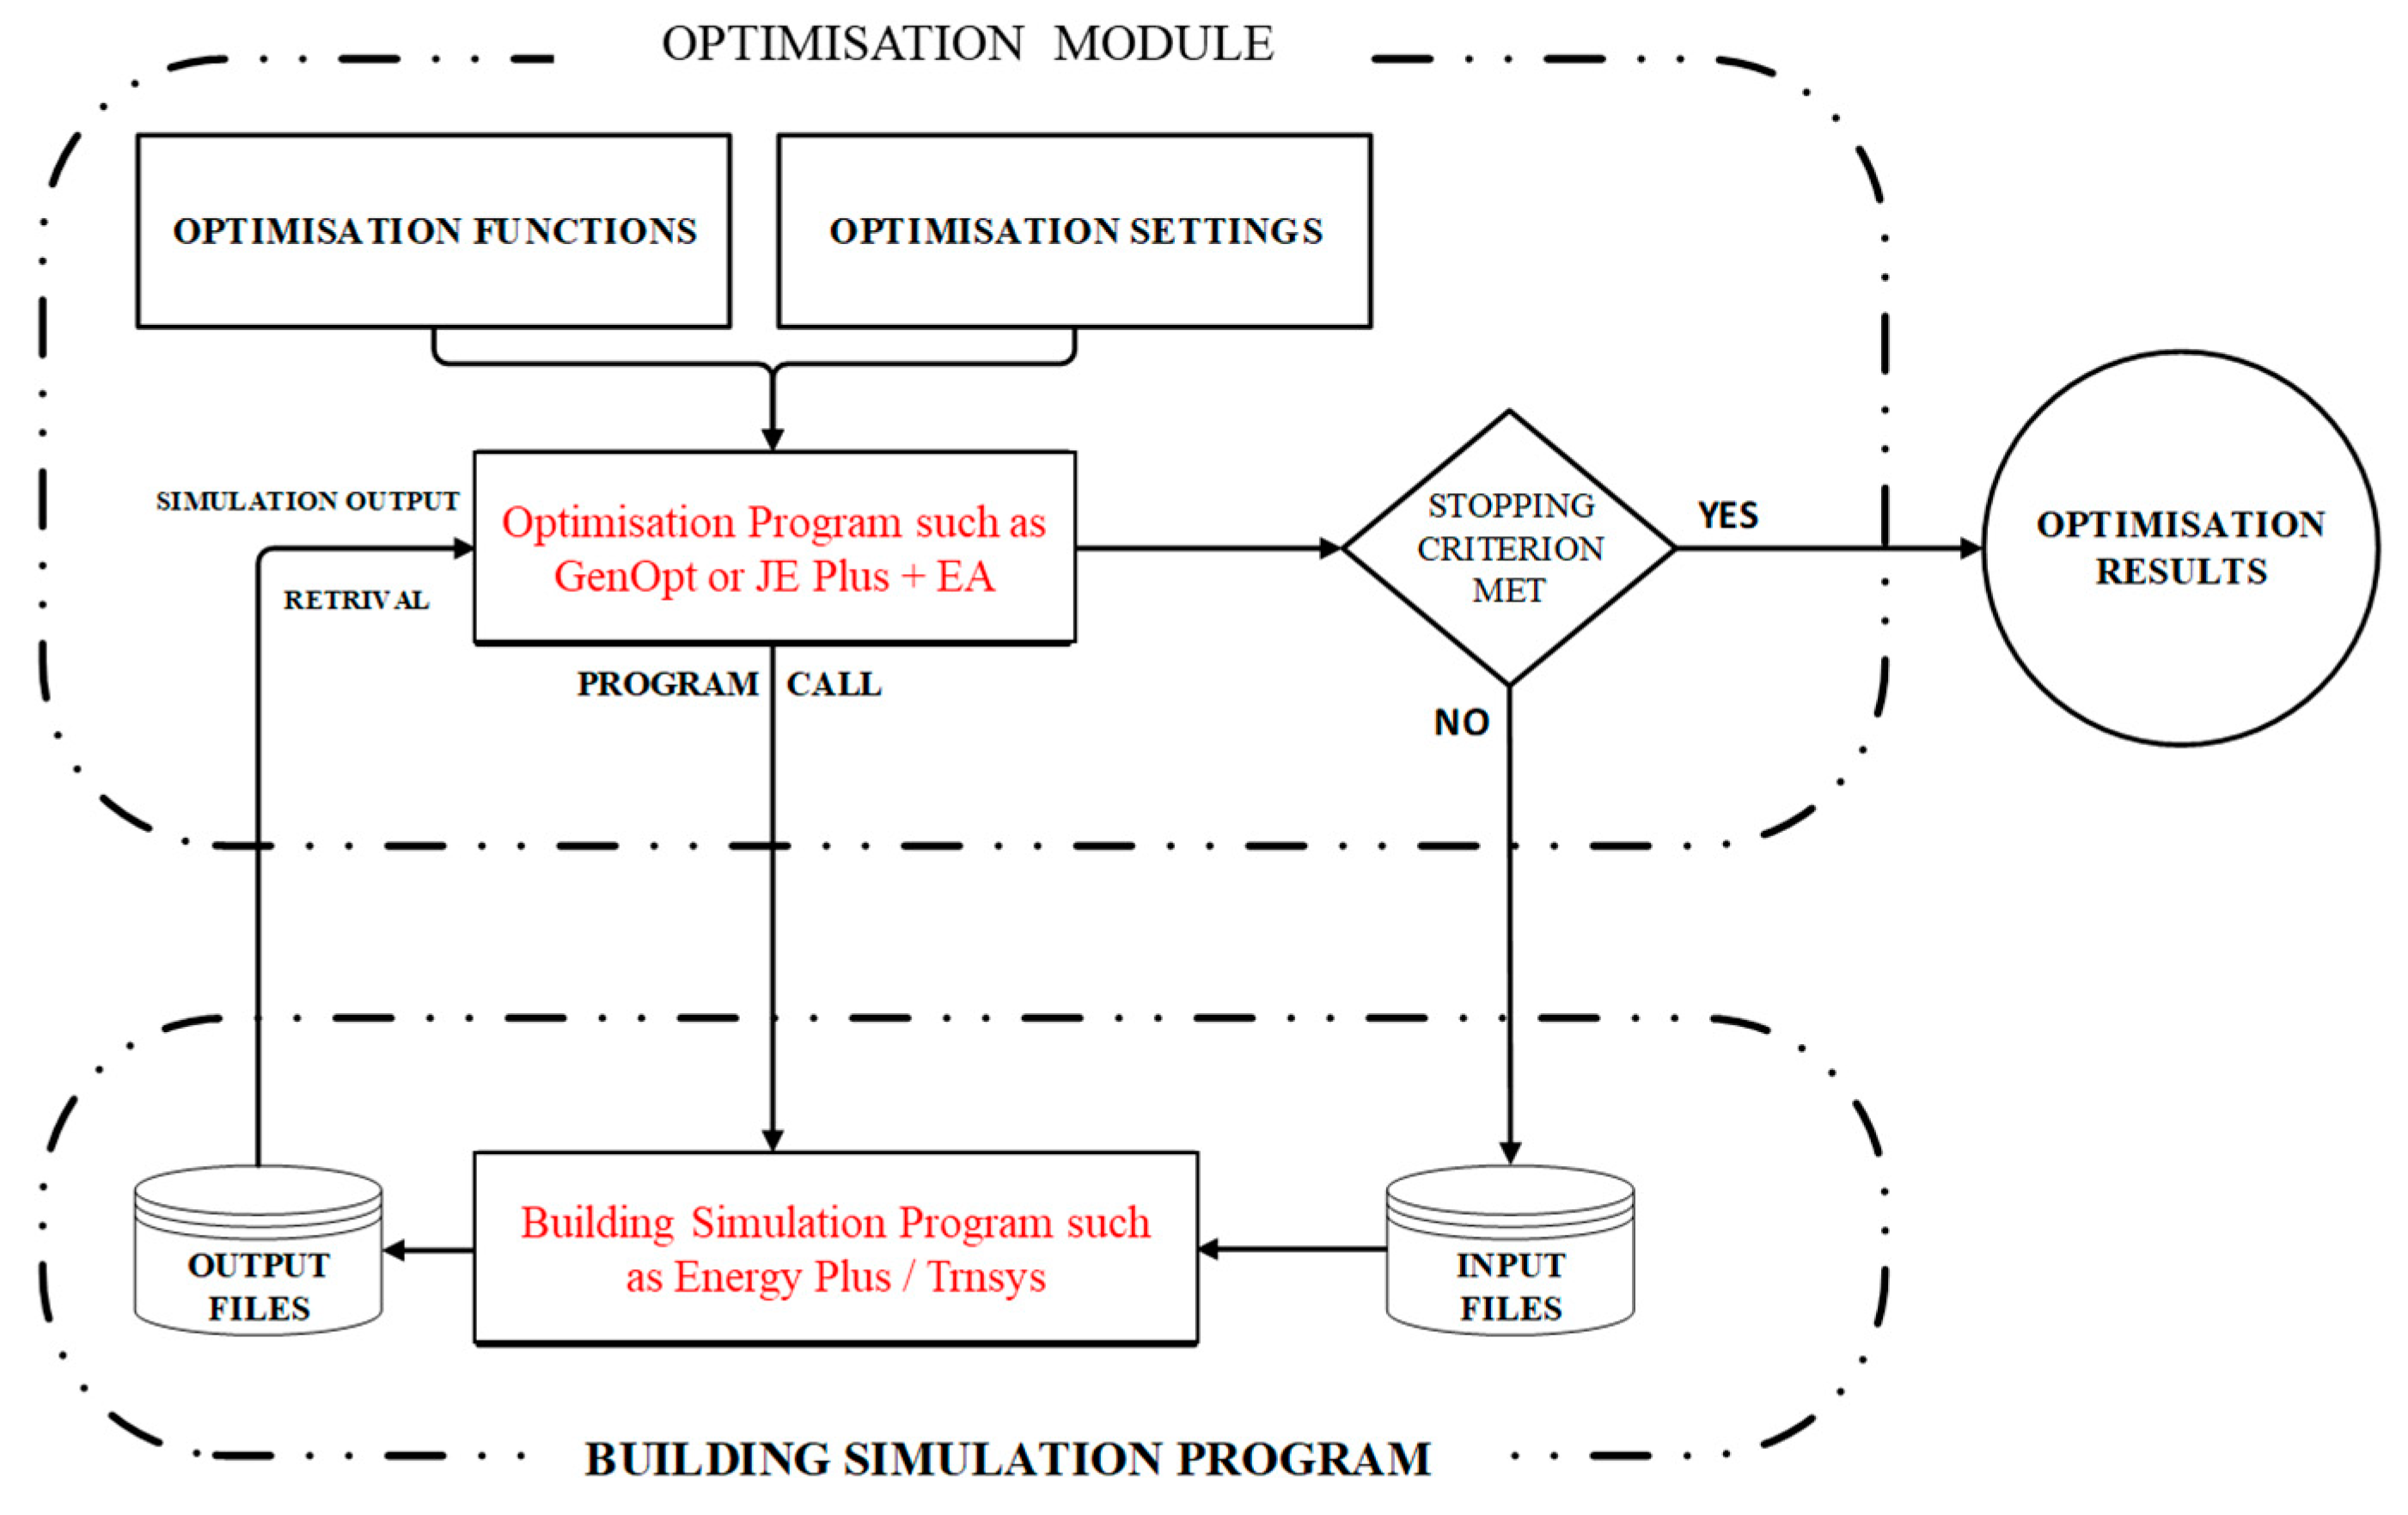
Building design optimization is performed by coupling a building simulation program to an optimization module to identify solutions which can simultaneously satisfy a set of performance criteria and constraints. Nguyen et al. (2012) described simulation-based optimization using a three stage framework, as shown in
Figure 2 [
20]. The initial pre-processing stage consists of model development and coupling of the optimization algorithm with the building simulation program. The second stage involves running the optimization algorithm iteratively treating the simulation model as its objective function. The final post-processing stage involves evaluating the fitness of generated solutions by plotting their objective values over different performance criteria.
For any non-trivial multi-objective optimization problem, no single solution can simultaneously satisfy all the performance objectives. All non-dominated solutions lie on a boundary known as Pareto front. It is not possible to select a single Pareto solution without compromising on at least one of the performance objectives. The final selection of an optimal solution is completed after confirming the priorities of decision-makers for each objective and the manner in which they wish to balance their priorities. A tie between different Pareto solutions is resolved by formulating a decision function, i.e.,
for a maximization problem:
for a minimization problem:
Where
and
represent the normalized performance scores for a candidate solution over the two objectives, and
and
represent the relative preferences of decision-makers for the two objectives such that
and
add up to 1. Researchers have used many evolutionary algorithms for building design optimization [
21]. Delgarm et al. (2016) used a multi-objective artificial bee colony (MOABC) algorithm for simultaneous maximization of building energy efficiency and indoor thermal comfort in cold, temperate, warm and dry, and warm and humid regions of Iran [
22]. Delgarm et al. (2016) used a multi-objective particle swarm optimization (MOPSO) algorithm to identify non-dominated optimum solutions for architectural features like building orientation, insulation, and glazing in four major climate regions of Iran. Solutions were evaluated over annual heating, cooling, and lighting energy consumption criteria [
23]. Hamdy et al. (2016) compared seven popular optimization algorithms for a building design problem, including a non-dominated sorting genetic algorithm with a passive archive (pNSGA-II), two-phase optimization using a genetic algorithm (PR GA), multi-objective particle swarm optimization (MOPSO), elitist non-dominated sorting evolution strategy (ENSES), multi-objective dragonfly algorithm (MODA), multi-objective optimization based on epilson dominance (evMOGA), and a multi-objective differential evolution algorithm (spMODE-II). The PR GA algorithm displayed higher repeatability and robustness exploring a much larger area of the solution space and achieving many near-optimal solutions with good diversity followed by pNSGA-II, evMOGA, and spMODE-II [
24]. Popular building design optimization tools include BEopt™ [
25], jEPLUS + EA [
26], GenOpt [
27], and MOBO [
28,
29].
4. Optimization under Uncertainty
A deterministic building optimization procedure maximizes or minimizes the objective function according to some given scenario without taking into account possible variations which may arise due to uncertainties associated with building occupants. For instance, a building optimized for an air conditioner with a setpoint temperature of 24 °C and 8 h of daily operation might get occupied by a resident who prefers to operate the building at 20 °C for 12 h daily. By going through the literature, it was established that uncertainties related to climate change, building deterioration, ageing of HVAC, and electrical appliances could negatively impact the feasibility of deterministically identified optimal solutions. To improve the robustness of a building optimization procedure, it is essential to test the sensitivity of candidate solutions towards possible changes in building operation. Under this robust approach, the final performance of a candidate solution is determined based on its performance over a wide range of possible scenarios which may arise during the building’s life cycle. As compared to the deterministic approach, robust optimization routines tend to increase the mathematical complexity and time needed for identifying an optimum solution. In the absence of a robust approach, many performance-related issues, such as higher thermal stresses, higher operational costs, and higher grid stress, can surface at later stages of the building’s life cycle [
30,
31,
32,
33].
Researchers have employed many innovative approaches to perform building optimization in an uncertain environment. Hopfe et al. (2012) used SMS-EMOA evolutionary algorithms to perform multi-objective optimization by considering worst, average, and best building operational parameters. Robustness of potential solutions were evaluated over each of the three possible scenarios [
32]. Jacob et al. (2010) coupled Monte Carlo sampling and genetic algorithm to identify the optimum slope of a solar thermal collector system under operational uncertainties related with the mass flow rate of domestic hot water and the infiltration air change rate [
34]. The optimization routine was run over many possible scenarios to develop a distribution for the optimal slope. The expected value from this distribution was selected as the most optimal solution. Ramallo-González et al. (2010) developed a changing environment evolutionary strategy (CEES) evolutionary algorithm for building optimization under an array of diverse occupant behaviors. At each generation, an offspring solution was evaluated using a slightly perturbed objective function due to the impact of various operational uncertainties. Best performing features of robust parent solutions were transferred to offspring solutions without crossover. CEES produced robust solutions with a low risk of underperformance as compared to a deterministic optimization procedure which remained uncomfortable for at least one-third of all occupant behaviors [
33]. Yu et al. (2016) and Lu et al. (2017) used NSGA II for sizing HVAC, renewable energy system, and energy storage for a net-zero energy building (nZEB) to minimize system cost and maximize thermal comfort and grid independence by considering weather uncertainties over a twenty-year period [
35,
36]. The current study has presented the application of a non-dominated sorting genetic (NSGA II) algorithm for multi-objective building optimization under operational uncertainties. The research methodology adopted for this paper is described in the following section.
5. Research Methodology
This study builds on the methodology proposed by Hoes et al. (2011) to perform building design optimization under operational uncertainties. In the first step, a building simulation model was developed using the Energy Plus (v 8.9) program [
37]. Energy Plus is a building simulation program used for modeling building energy consumption, air conditioning, appliance, lighting demands, and ventilation [
38]. In the next step, multi-objective building design optimization was performed using the non-dominated sorting genetic algorithm (NSGA II). After the optimization stage, the sensitivity of every Pareto solution was tested over 162 possible operational scenarios. During the final step, building design optimization was converted into a multi-criteria decision making problem (MCDM) by comparing each Pareto solution over user preference, performance, and reliability criteria. Results obtained using the robust approach were compared with those obtained using the conventional deterministic approach.
5.1. NSGA II Evolutionary Algorithm
A non-dominated sorting genetic algorithm (NSGA II) is a nature-inspired evolutionary algorithm in which a large population of candidate solutions evolve iteratively towards fitter solutions [
39,
40]. Each candidate solution is treated analogously to a chromosome containing a set of unique features (genes). These chromosomes are altered or mutated in a controlled fashion to search the most optimum combination of design variable (genes).
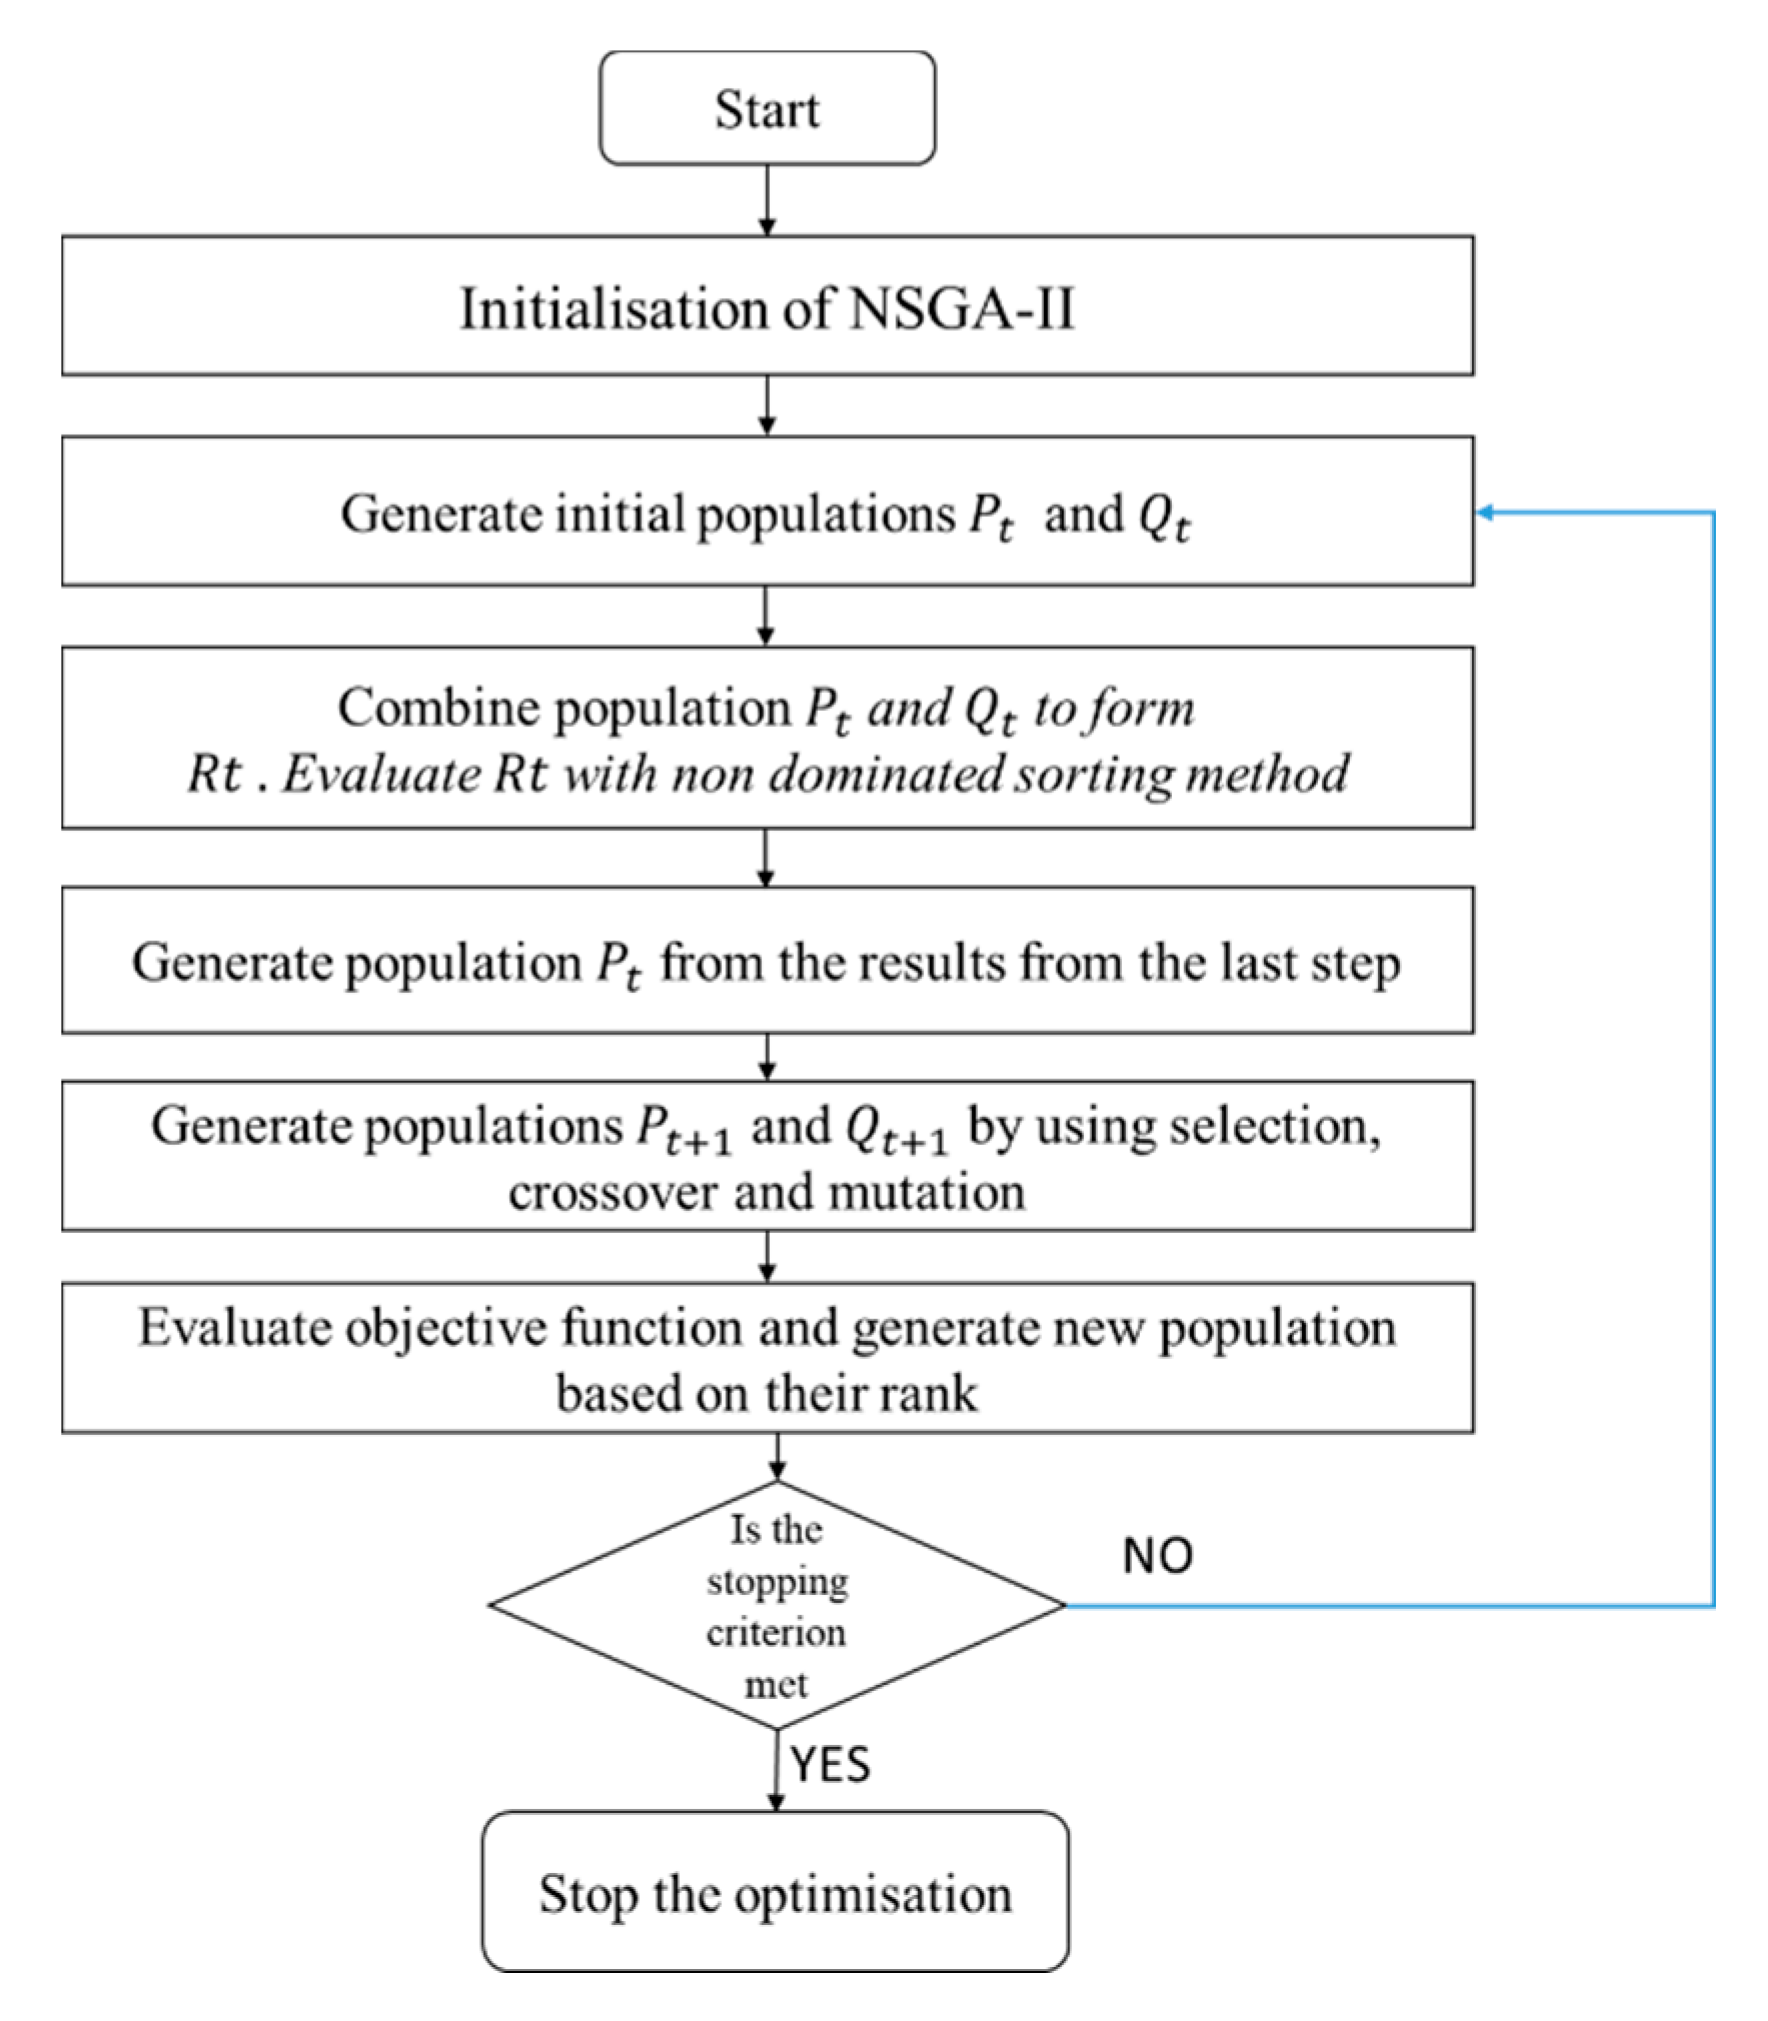
Figure 3 displays the various steps involved during the implementation of the NSGA II algorithm. Implementation begins with an initial population containing several hundred randomly generated solutions. The initial population is selected randomly to achieve equal representation from different regions of the search space. Alternatively, specific seeds may be used in situations when certain known areas of the search space have a higher chance of containing fitter solutions. In the next step, the fitness value is calculated for each solution in the initial population by using an objective function. Objective functions can occur as simple mathematical expressions or complex simulation models. A portion of this initial population is then selected to generate a new population of fitter individuals by screening individuals having stronger objective values. This process is governed by crossover and mutation operators. The crossover operator controls the mannerism in which genetic information is passed from the two parent chromosomes into their offspring [
41]. During the crossover stage, mutation is performed to ensure the genetic diversity of one generation of solutions from the previous ones. It modifies (flips) one or more gene values in a chromosome from its initial state. This is introduced to remove stagnation and introduce new features during the evolution process. Depending on the nature of a given problem, many different mutation operators such as flip bit, boundary, non-uniform, and Gaussian mutation operators can be used [
42]. However, to prevent the search process from becoming a primitive random search, the value of the mutation parameter should be kept low in a range of 10%–20%. The new generation of offspring solutions become fresh candidates for a crossover and recombination process based on their fitness values. This same process is repeated until either the maximum number of iterations or generations are exhausted, or a satisfactory fitness level has been achieved for the final population. It is recommended to perform at least 1400–1800 iterations to attain satisfactory results [
24].
Vasinton and Raslan (2015) used the JEPlus + EA software tool for implementing the multi-objective NSGA II algorithm to minimize the life cycle carbon footprint (LCCF) and life cycle costs (LCC) for a multi-story building situated in London [
43]. Many possible alternatives for insulation, glazing, heating fuels, and solar panel sizes were tested. NSGA II reduced LCCF and LCF by 67% and 16% as compared to the base building. Penna et al. (2015) coupled NSGA II with Trnsys to identify optimum EEM for simultaneously attaining lower cost and lower energy consumption for an nZEB situated in Italy. EEMs, such as insulation upgrades, glazing replacements, and mechanical ventilation system installations, were tested. NSGA II was able to achieve 57% energy demand reduction [
44]. Buso et al. (2015) introduced the term ‘Occupant Robust Building’ to differentiate buildings which can deliver target energy savings with minimum variations under operational uncertainties [
45].
The performance sensitivity of a Pareto solution can be evaluated by calculating the mean (
) and standard deviation
of its performance over (
) uncertain operational scenarios [
37]. Relative standard deviation (RSD), a dimensionless quantity is expressed as the ratio of mean and standard deviation.
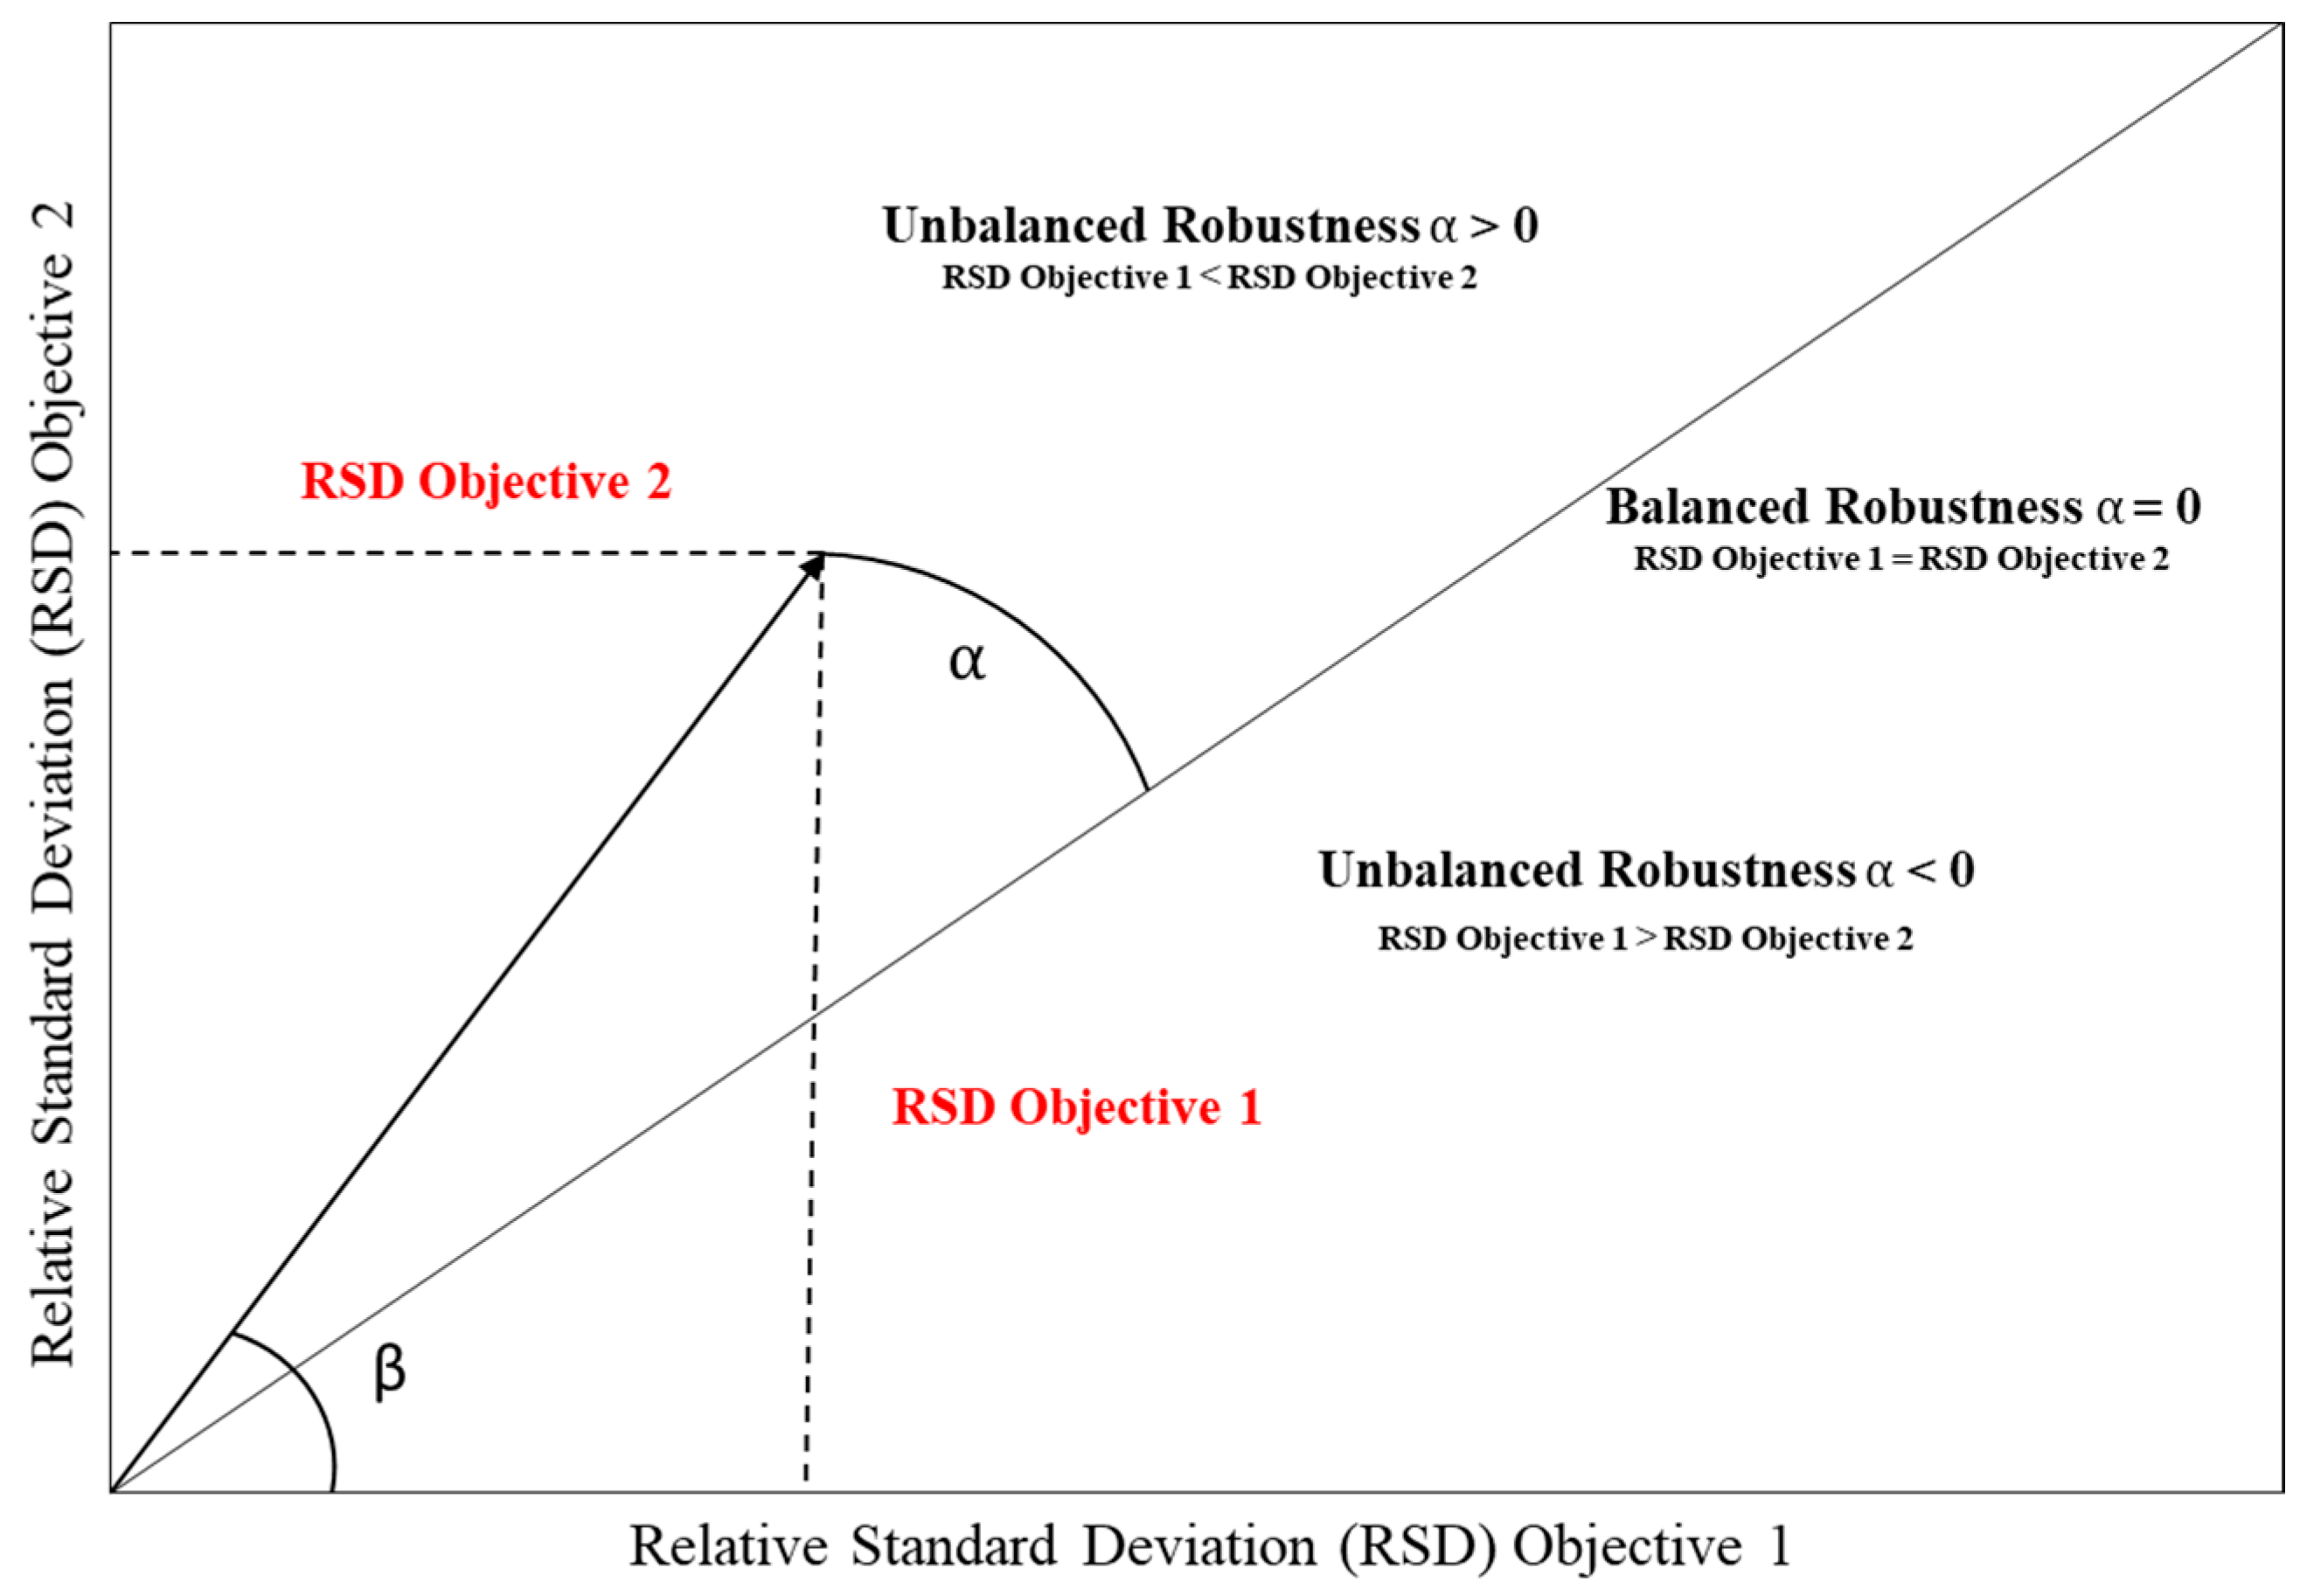
For a given Pareto optimal solution, RSD for both performance objectives can be used to describe an objective vector v = (x, y) =. The length of this objective vector acts as a quantitative estimate for the robustness of Pareto solutions. The smaller the length of the objective vector, the greater the robustness of a particular solution. Further robustness balance (α) is defined as
β – 45
, where β is the objective vector angle:
The angles of the objective vector with the two-axis, i.e.,
and β, convey important information about the balance of robustness between the two objectives. A designer who prefers a design objective with balanced robustness can select an objective vector with
. An unbalanced solution, e.g., α < 0° or α > 0° can be chosen by the designer if the robustness of an objective is preferred over the other (refer
Figure 4).
Decision function can be improved by integrating Equations (1) and (2) with such that
for a maximization problem:
for a minimization problem:
Where and represent the relative standard deviation values for the first and second performance objective. Candidate with the highest performance score is confirmed as the most optimal solution.
5.2. Case Study
Ahmedabad (23.04° N, 72.46° E) represents a hot and dry region as per Indian national building code and is categorized as BSh (mid-latitude steppe and desert) climate as per the Köppen climate classification. As seen in
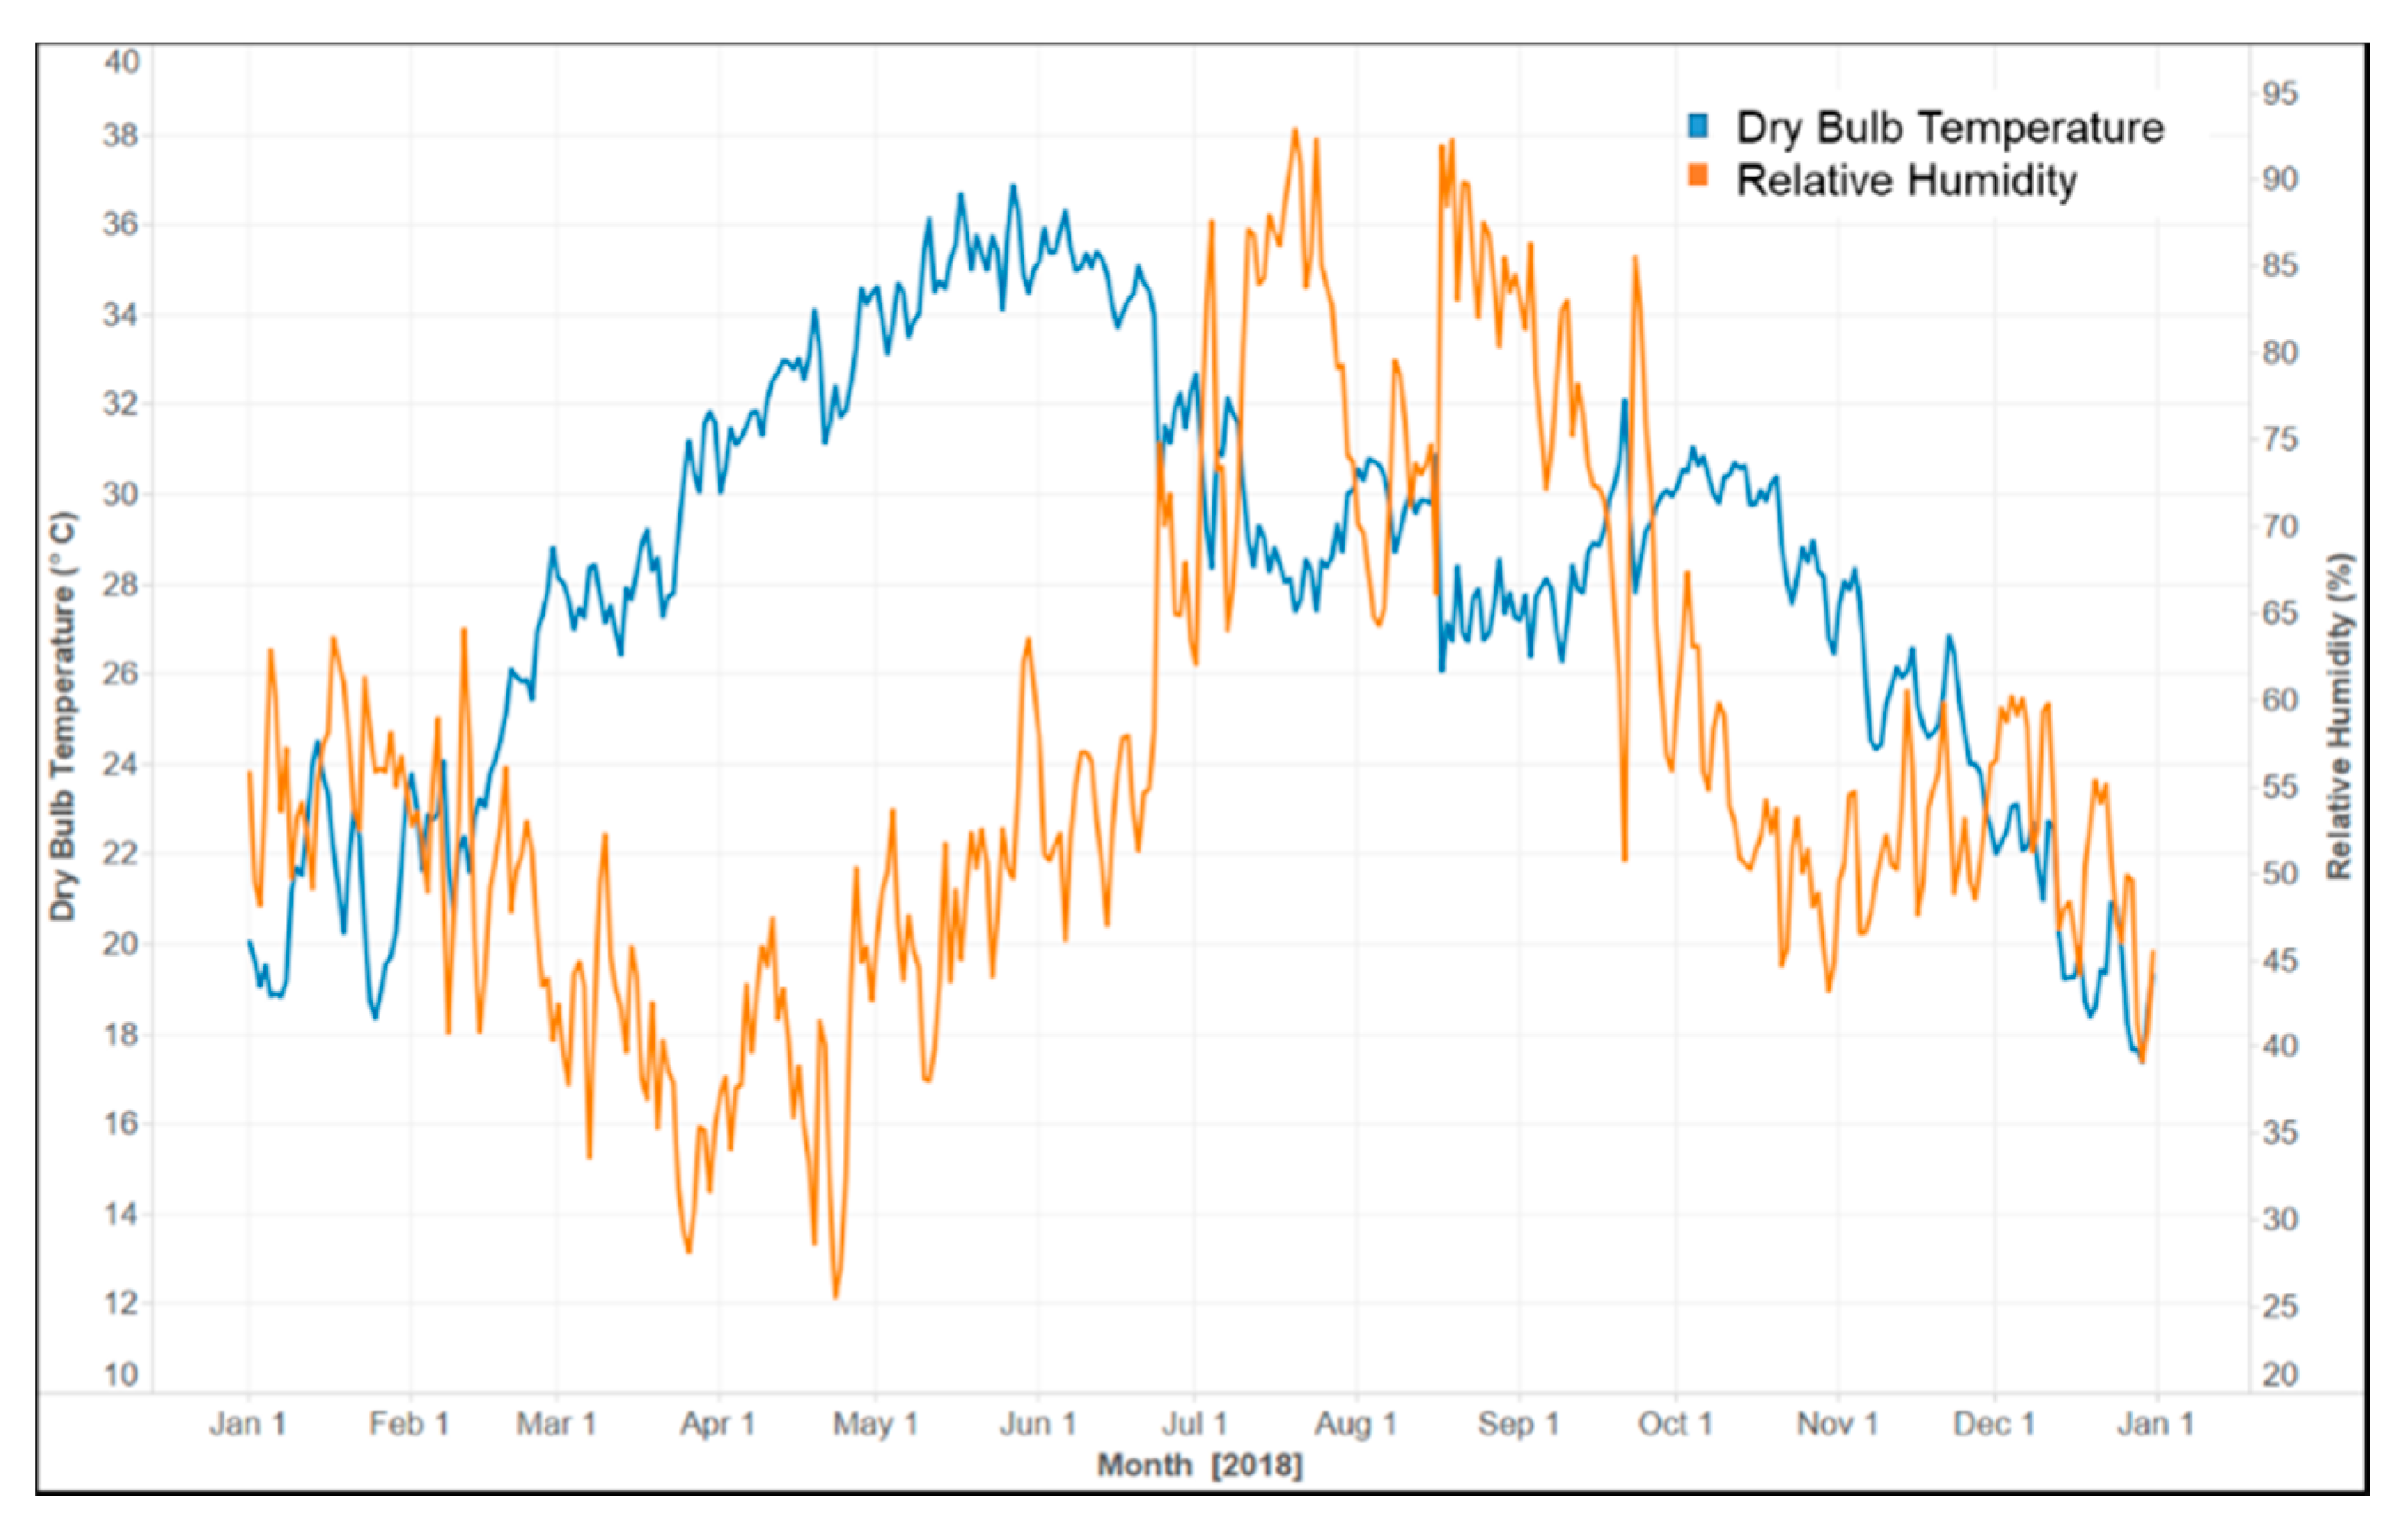
Figure 1, large swaths of land in the Global South exhibit BSh climate. Ahmedabad has three main seasons: summer, monsoon, and winter. Its weather is characterized by extreme heat and little precipitation from March to June. As seen in
Figure 5, the average daily maximum temperatures are around 41 °C during summer months and 30 °C during winter months.
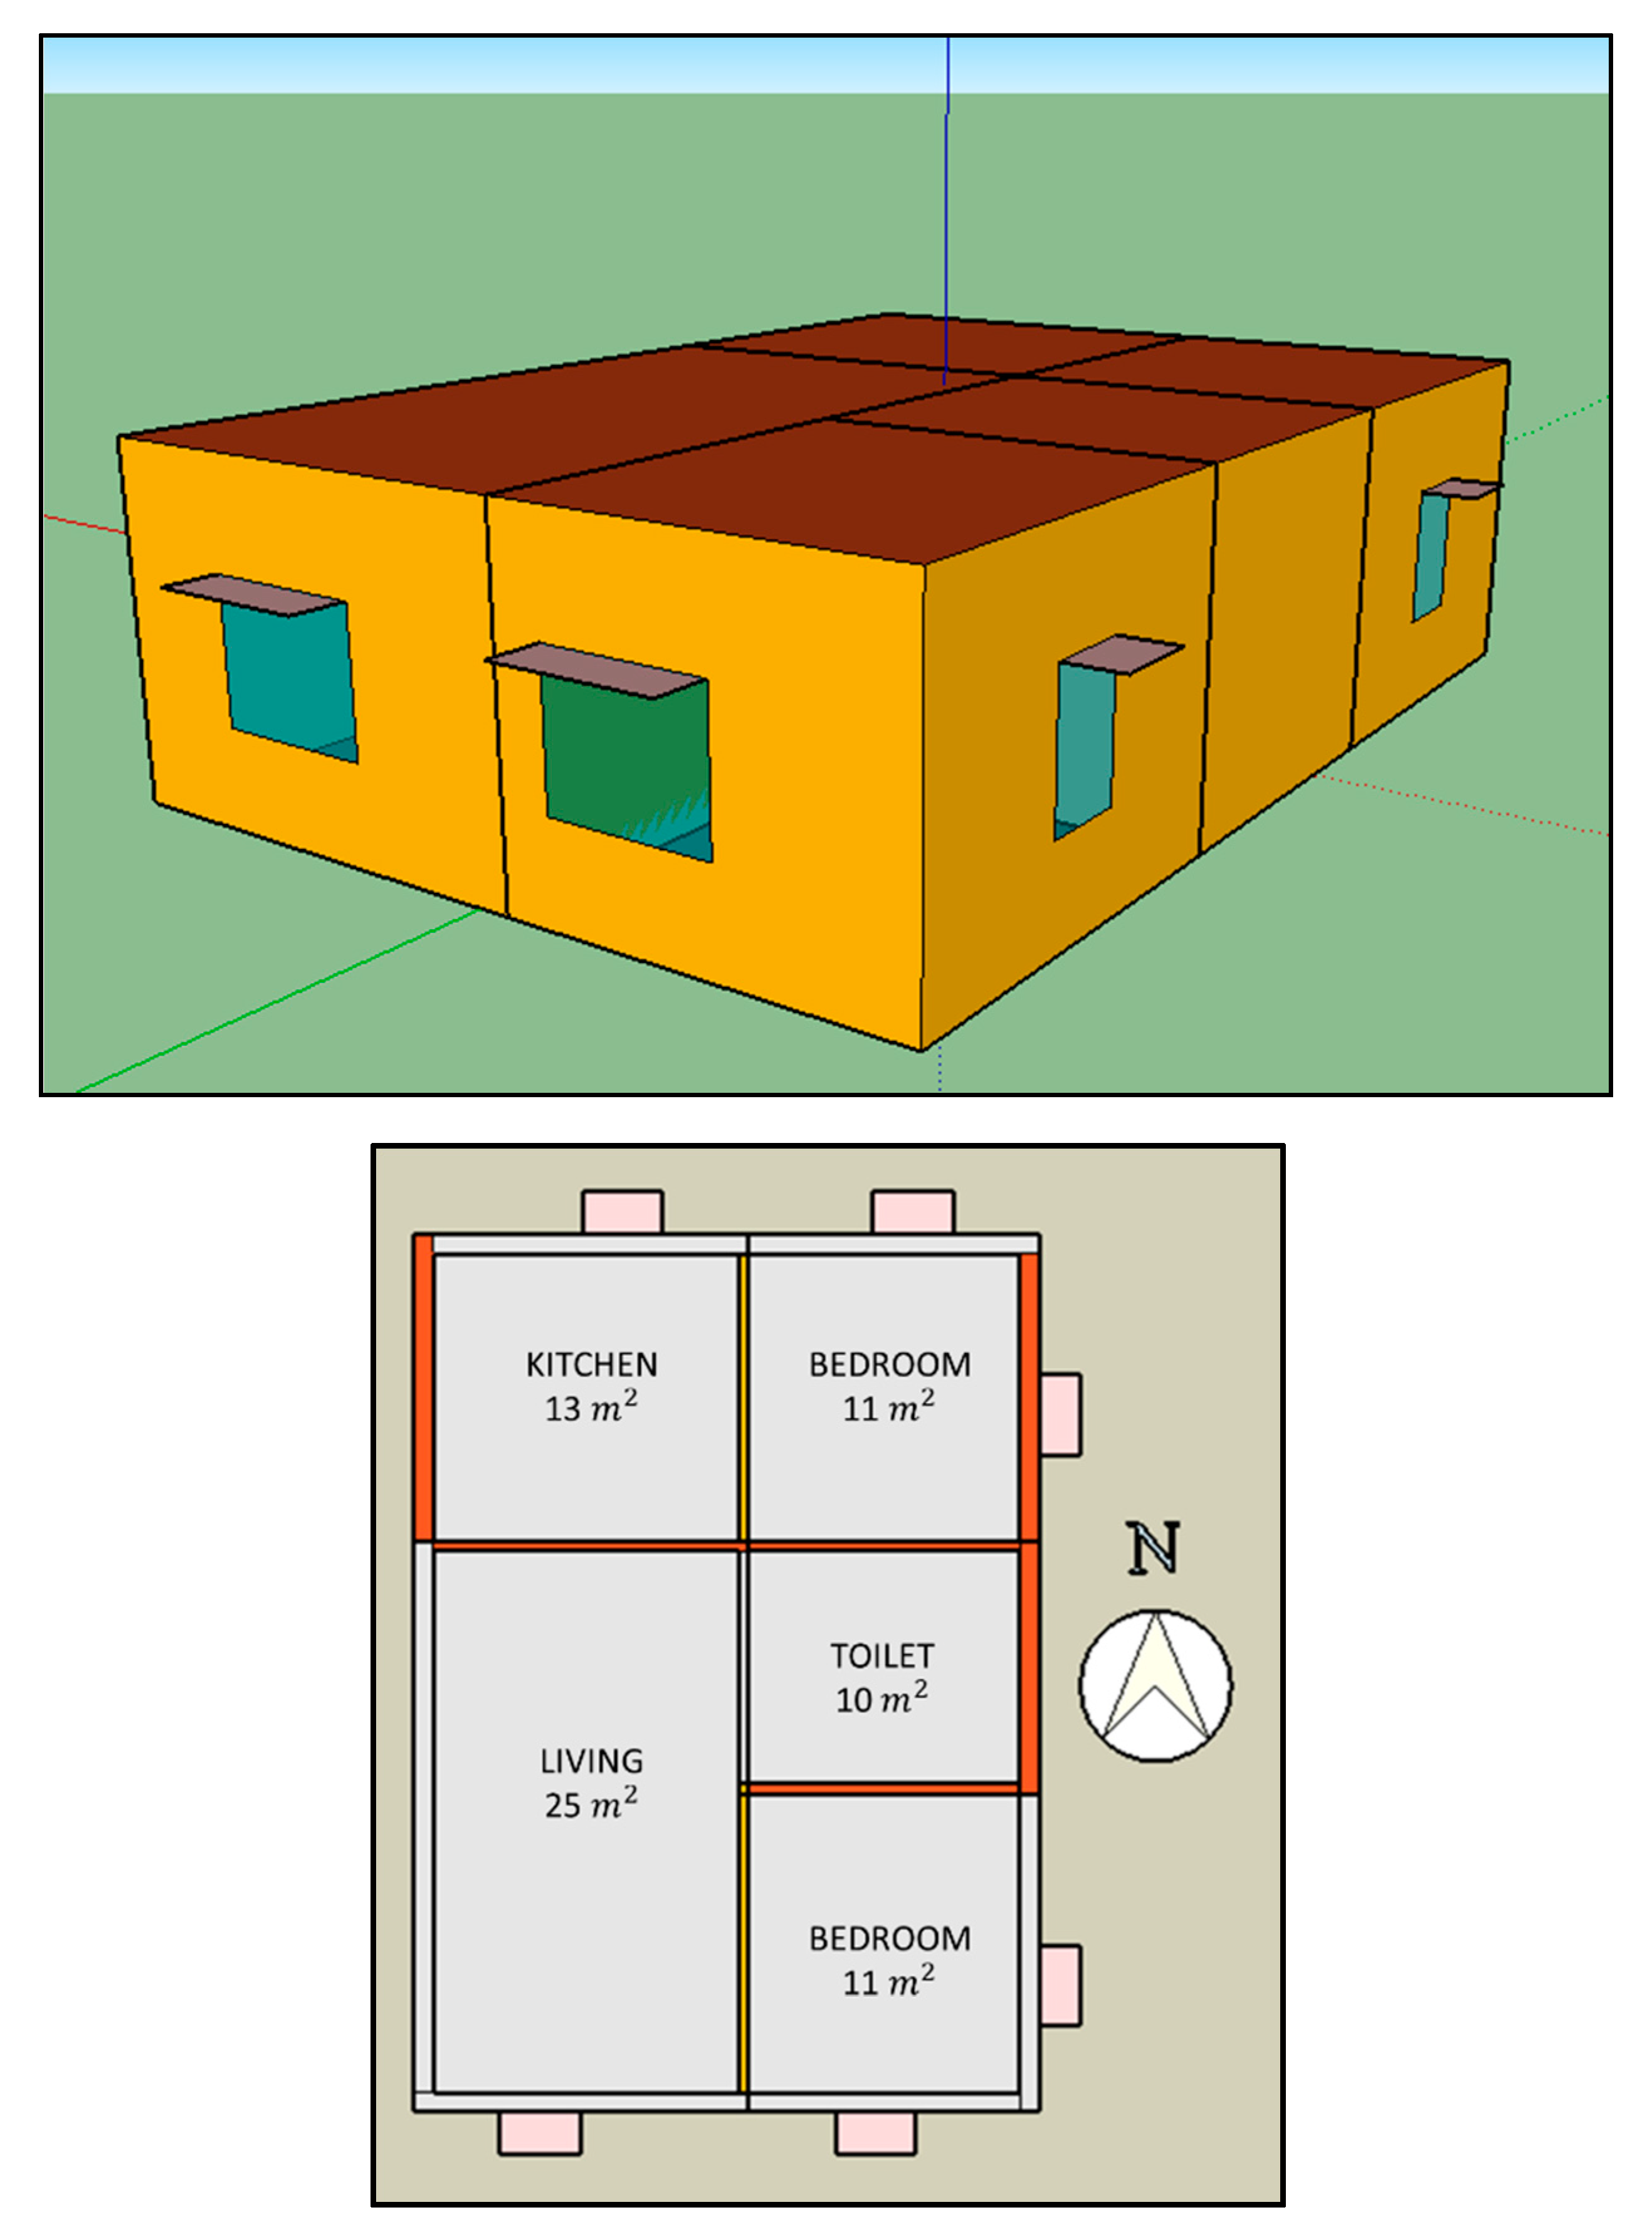
A mid-sized apartment unit having a floor area of 70 m
2 was modeled using the Energy Plus simulation program (
Figure 6). The unit consists of two air-conditioned bedrooms and three naturally ventilated zones, including kitchen, living room, and bathroom. Occupants operate the windows in both the bedrooms and allow natural ventilation whenever outdoor weather conditions were suitable. Specific details about the residential unit are listed in
Table 1.
Simulations were performed using the typical meteorological year (TMY) weather file for Ahmedabad. The base model was found to deliver an annual energy consumption of 8450 kWh and 180 cooling setpoint unmet h. Energy Plus .idf scripts were used by JE-Plus for setting up the optimization file. A multi-objective version of the NSGA II optimization algorithm was used to identify the optimum building design features, i.e., window to wall ratio (WWR), window overhang depth, solar heat gain coefficient of the glazing, wall thickness, wall density, wall solar absorptance, and air conditioner sizes for the two bedrooms. The end goal of optimization was set to simultaneously minimize the total number of cooling setpoint unmet h and the annual energy consumption for the building. Cooling setpoint unmet hours refer to the total number of hours for which the air conditioners were unable to maintain the set cooling temperature. Possible EEM options for the optimization are listed in
Table 2.
All possibilities of EEM results in 13,122 combinations. It would have been incredibly cumbersome and time-consuming to simulate each of these cases using a brute force approach. NSGA II was initialized using 50 randomly selected solutions. NSGA II control parameters, i.e., crossover rate, mutation rate, and selection rate were fixed at 1, 0.2, and 2, respectively (refer
Table 3). The maximum number of generations was set to 100. A python script was run to effectuate the desired WWR values during the optimization process [
46].
6. Results
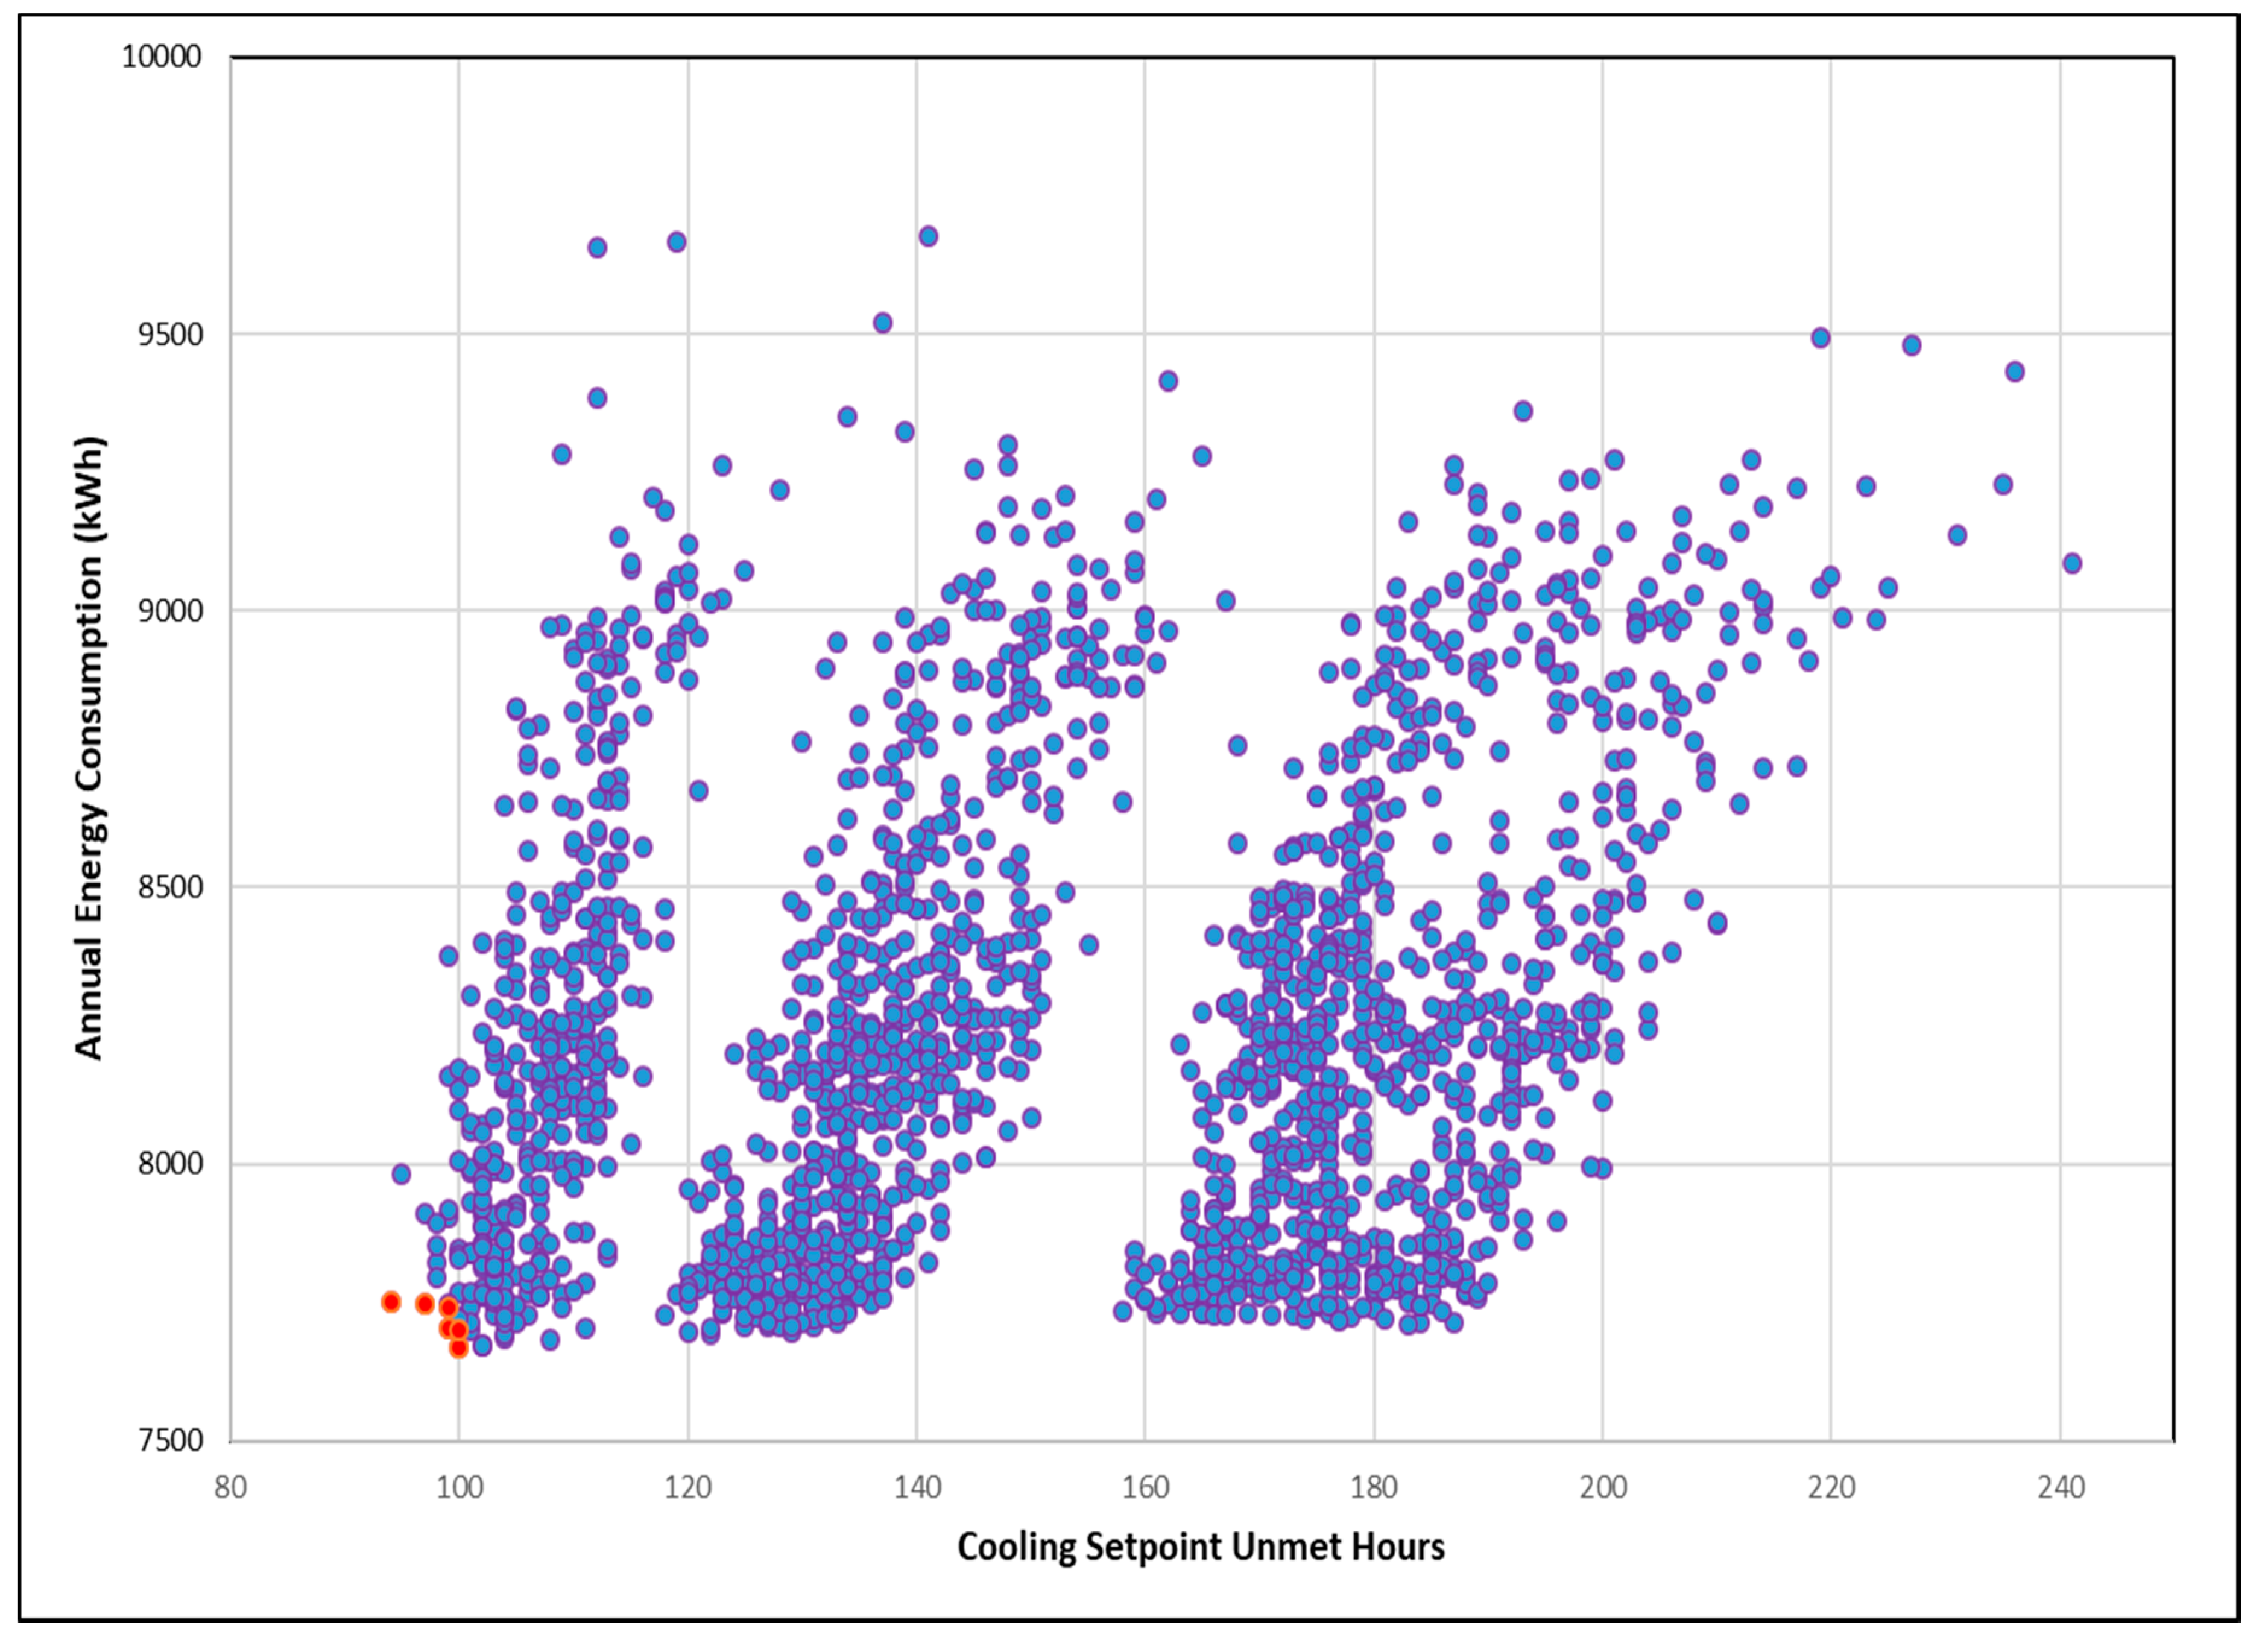
The NSGA II algorithm converged successfully after 1981 simulation runs, identifying six Pareto solutions (refer
Table 4). Pareto solutions (marked in red;
Figure 7) dominate all other sub-optimal solutions (marked in blue) generated during the intermediate generation stages of the NSGA II algorithm.
Table 4 presents the design variable values found in each of the six Pareto solutions. The first performance objective, i.e., the number of cooling setpoint h was found to lie between 94 and 100 h, whereas the second performance objective was found to range between 7669 and 7752 kWh for the six Pareto solutions. Each of these Pareto solutions represents a reduction of at least 8.26% for the annual energy consumption and a 44.4% reduction for the total number of cooling setpoint h for the apartment unit as compared to the base model. It was found that Solution 1 performs best over the first objective (94 h), whereas Solution 2 performs best over the second objective (7699 kWh).
As shown in
Table 4, wall sections made up of core material having a density of 1800 kg/
or 2200 kg/
were found suitable for the hot and dry BSh climate. Depending on the wall core material density, multiple options for wall thickness between 150 mm and 250 mm were recommended. All six Pareto solutions support the application of external surface coatings having high solar absorptance to limit excess solar heat gains. Small window sizes ranging between 10% and 20% of the wall area along with the installation of triple glazed windows were recommended. Further, all six solutions support the installation of 2 t AC in both the bedrooms. Selection of a larger AC capacity can be attributed to reasonably large volumetric spaces of the two bedrooms and lower energy consumption of a bigger AC working at part load as compared to a smaller AC running at full capacity.
Although all six Pareto solutions could be considered as broadly comparable, it was not possible to select a single optimal solution without compromising over one of the two performance objectives. For example, Solution 1 has a lower Objective 1 value (94 h) and a higher Objective 2 value (7752 kWh) as compared to Solution 2 (100 h, 7669 kWh). This same issue was observed on comparing any two of the six Pareto solutions. Therefore, further investigations were needed to identify the most optimal solution. Selection of the optimal solution also depends on the relative preferences of decision-makers (DM) over the two performance objectives. Priorities equal to
and
= 0.75 were chosen for the total number of cooling setpoint unmet h (
) and the total energy consumption (
) for the building, respectively. Robustness assessment of Pareto solutions was performed by simulating their performance over 162 possible building operation scenarios (refer
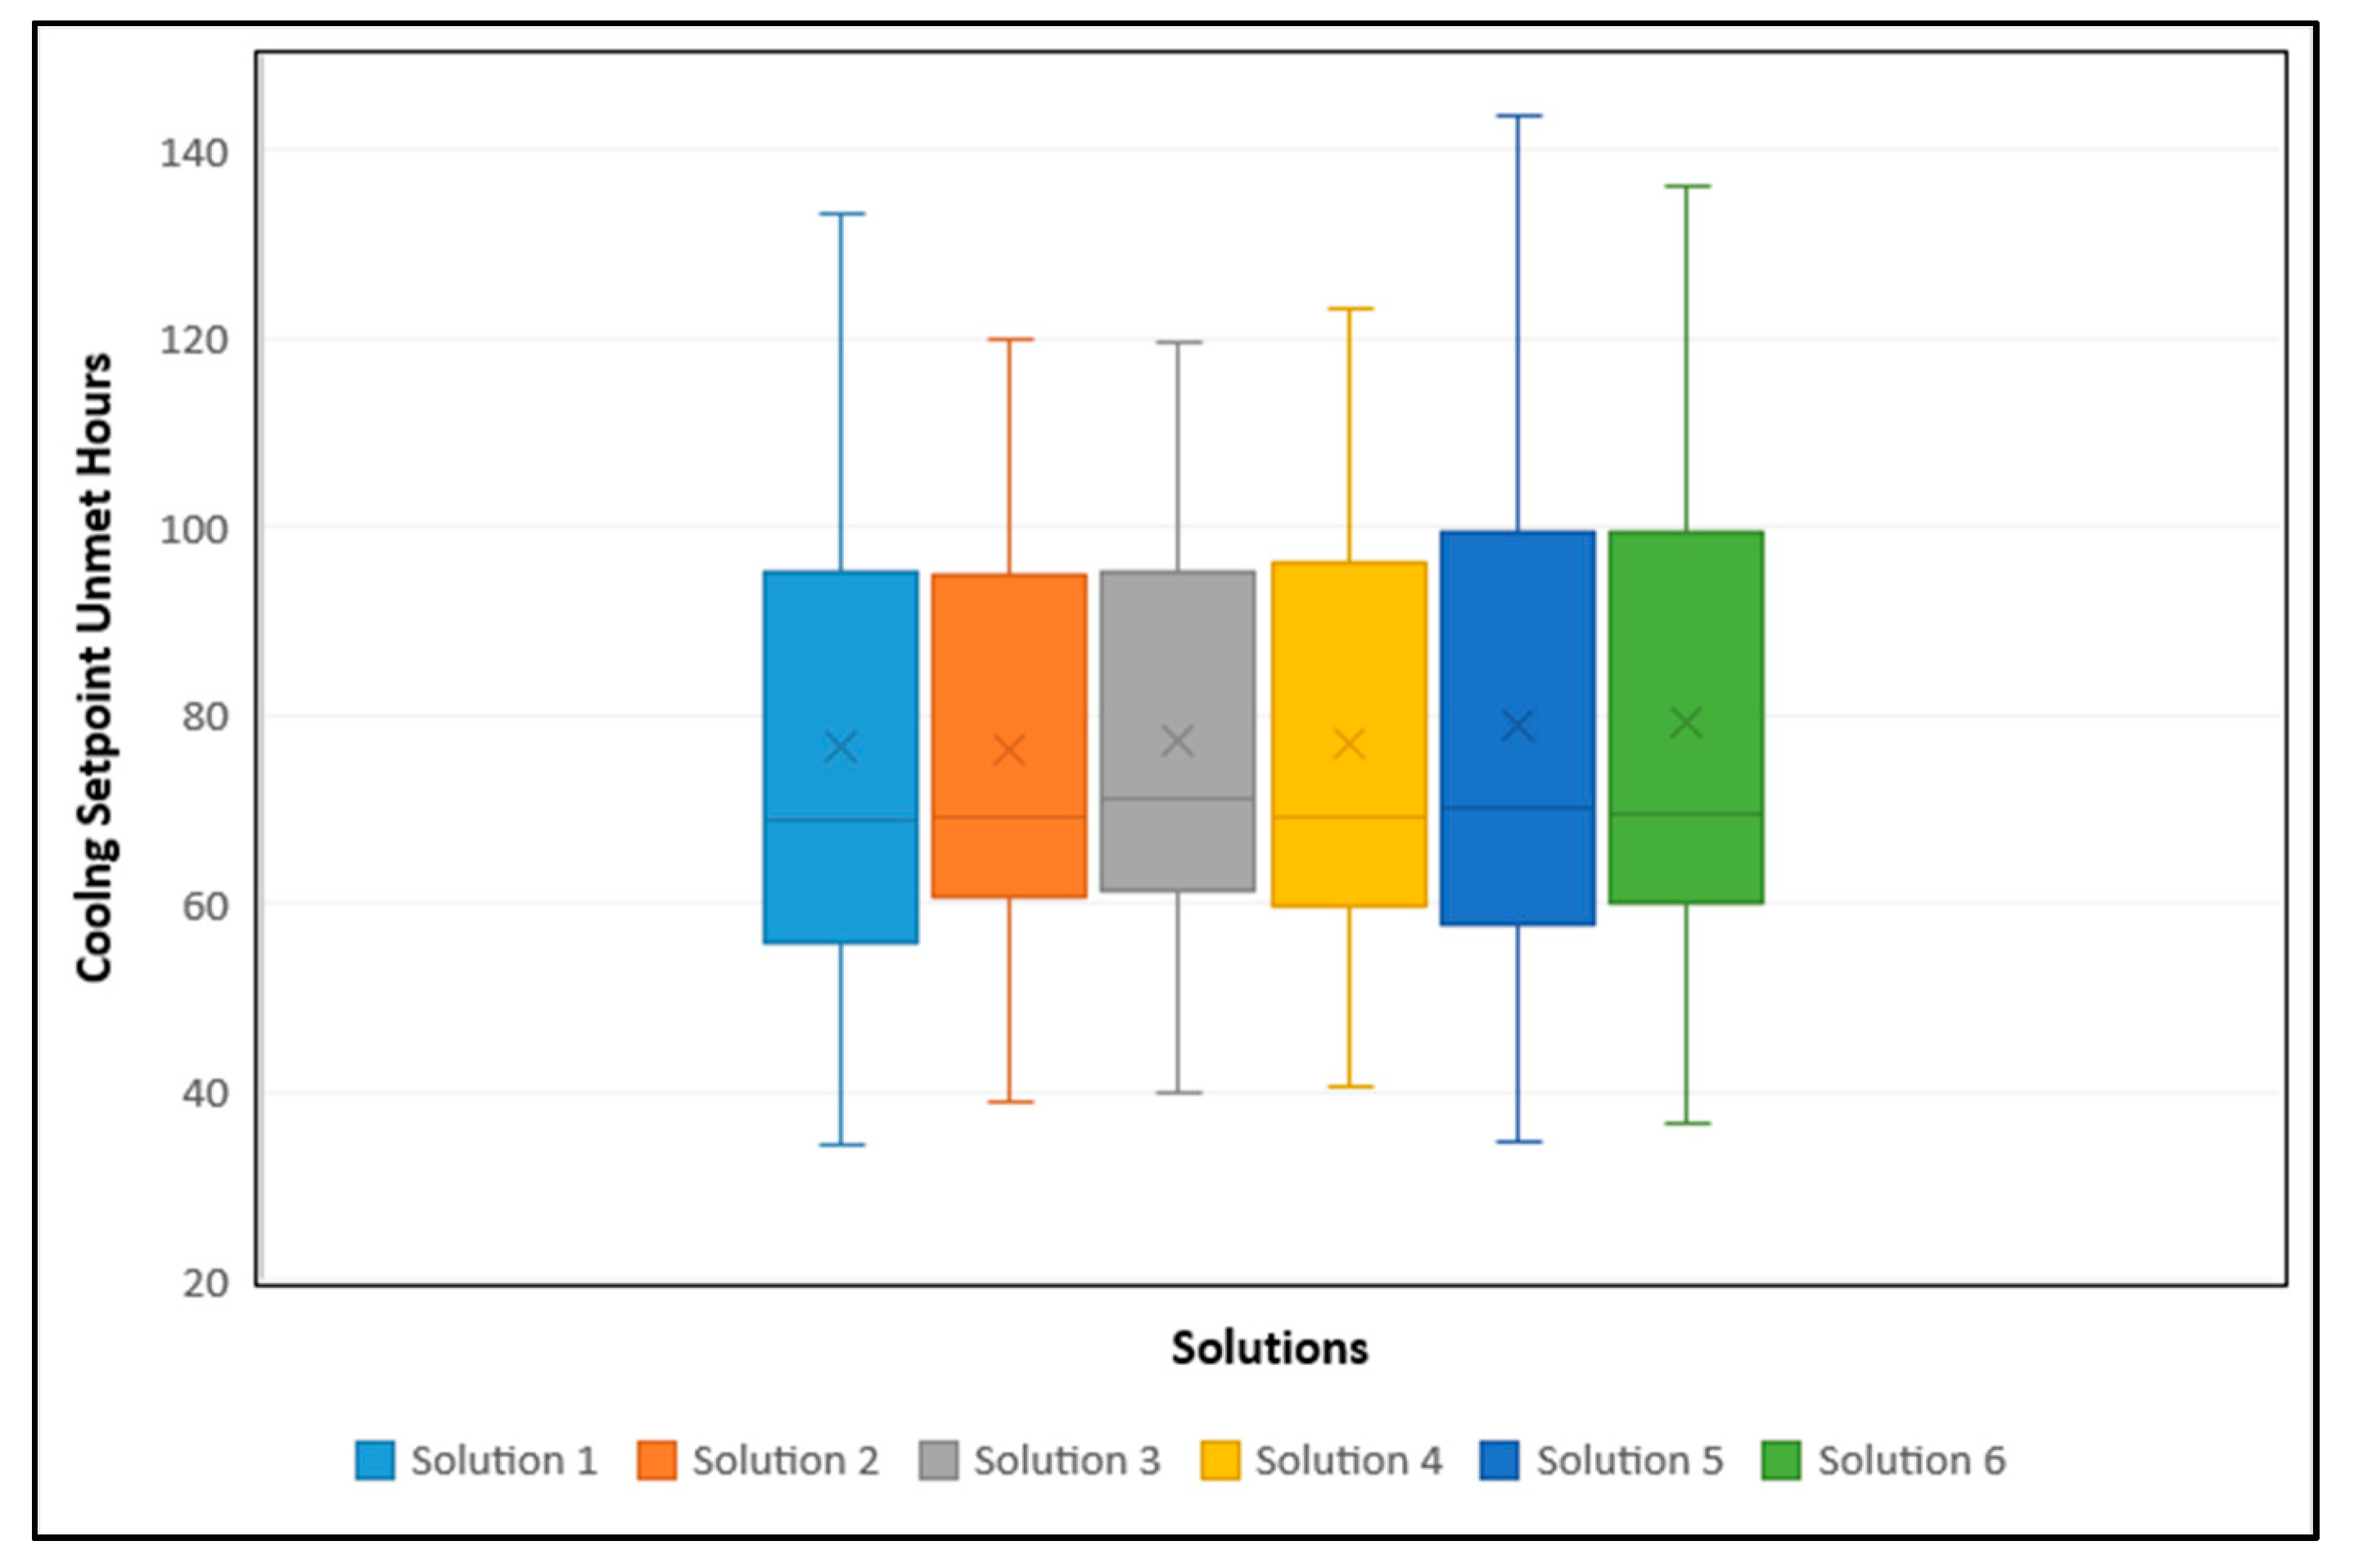
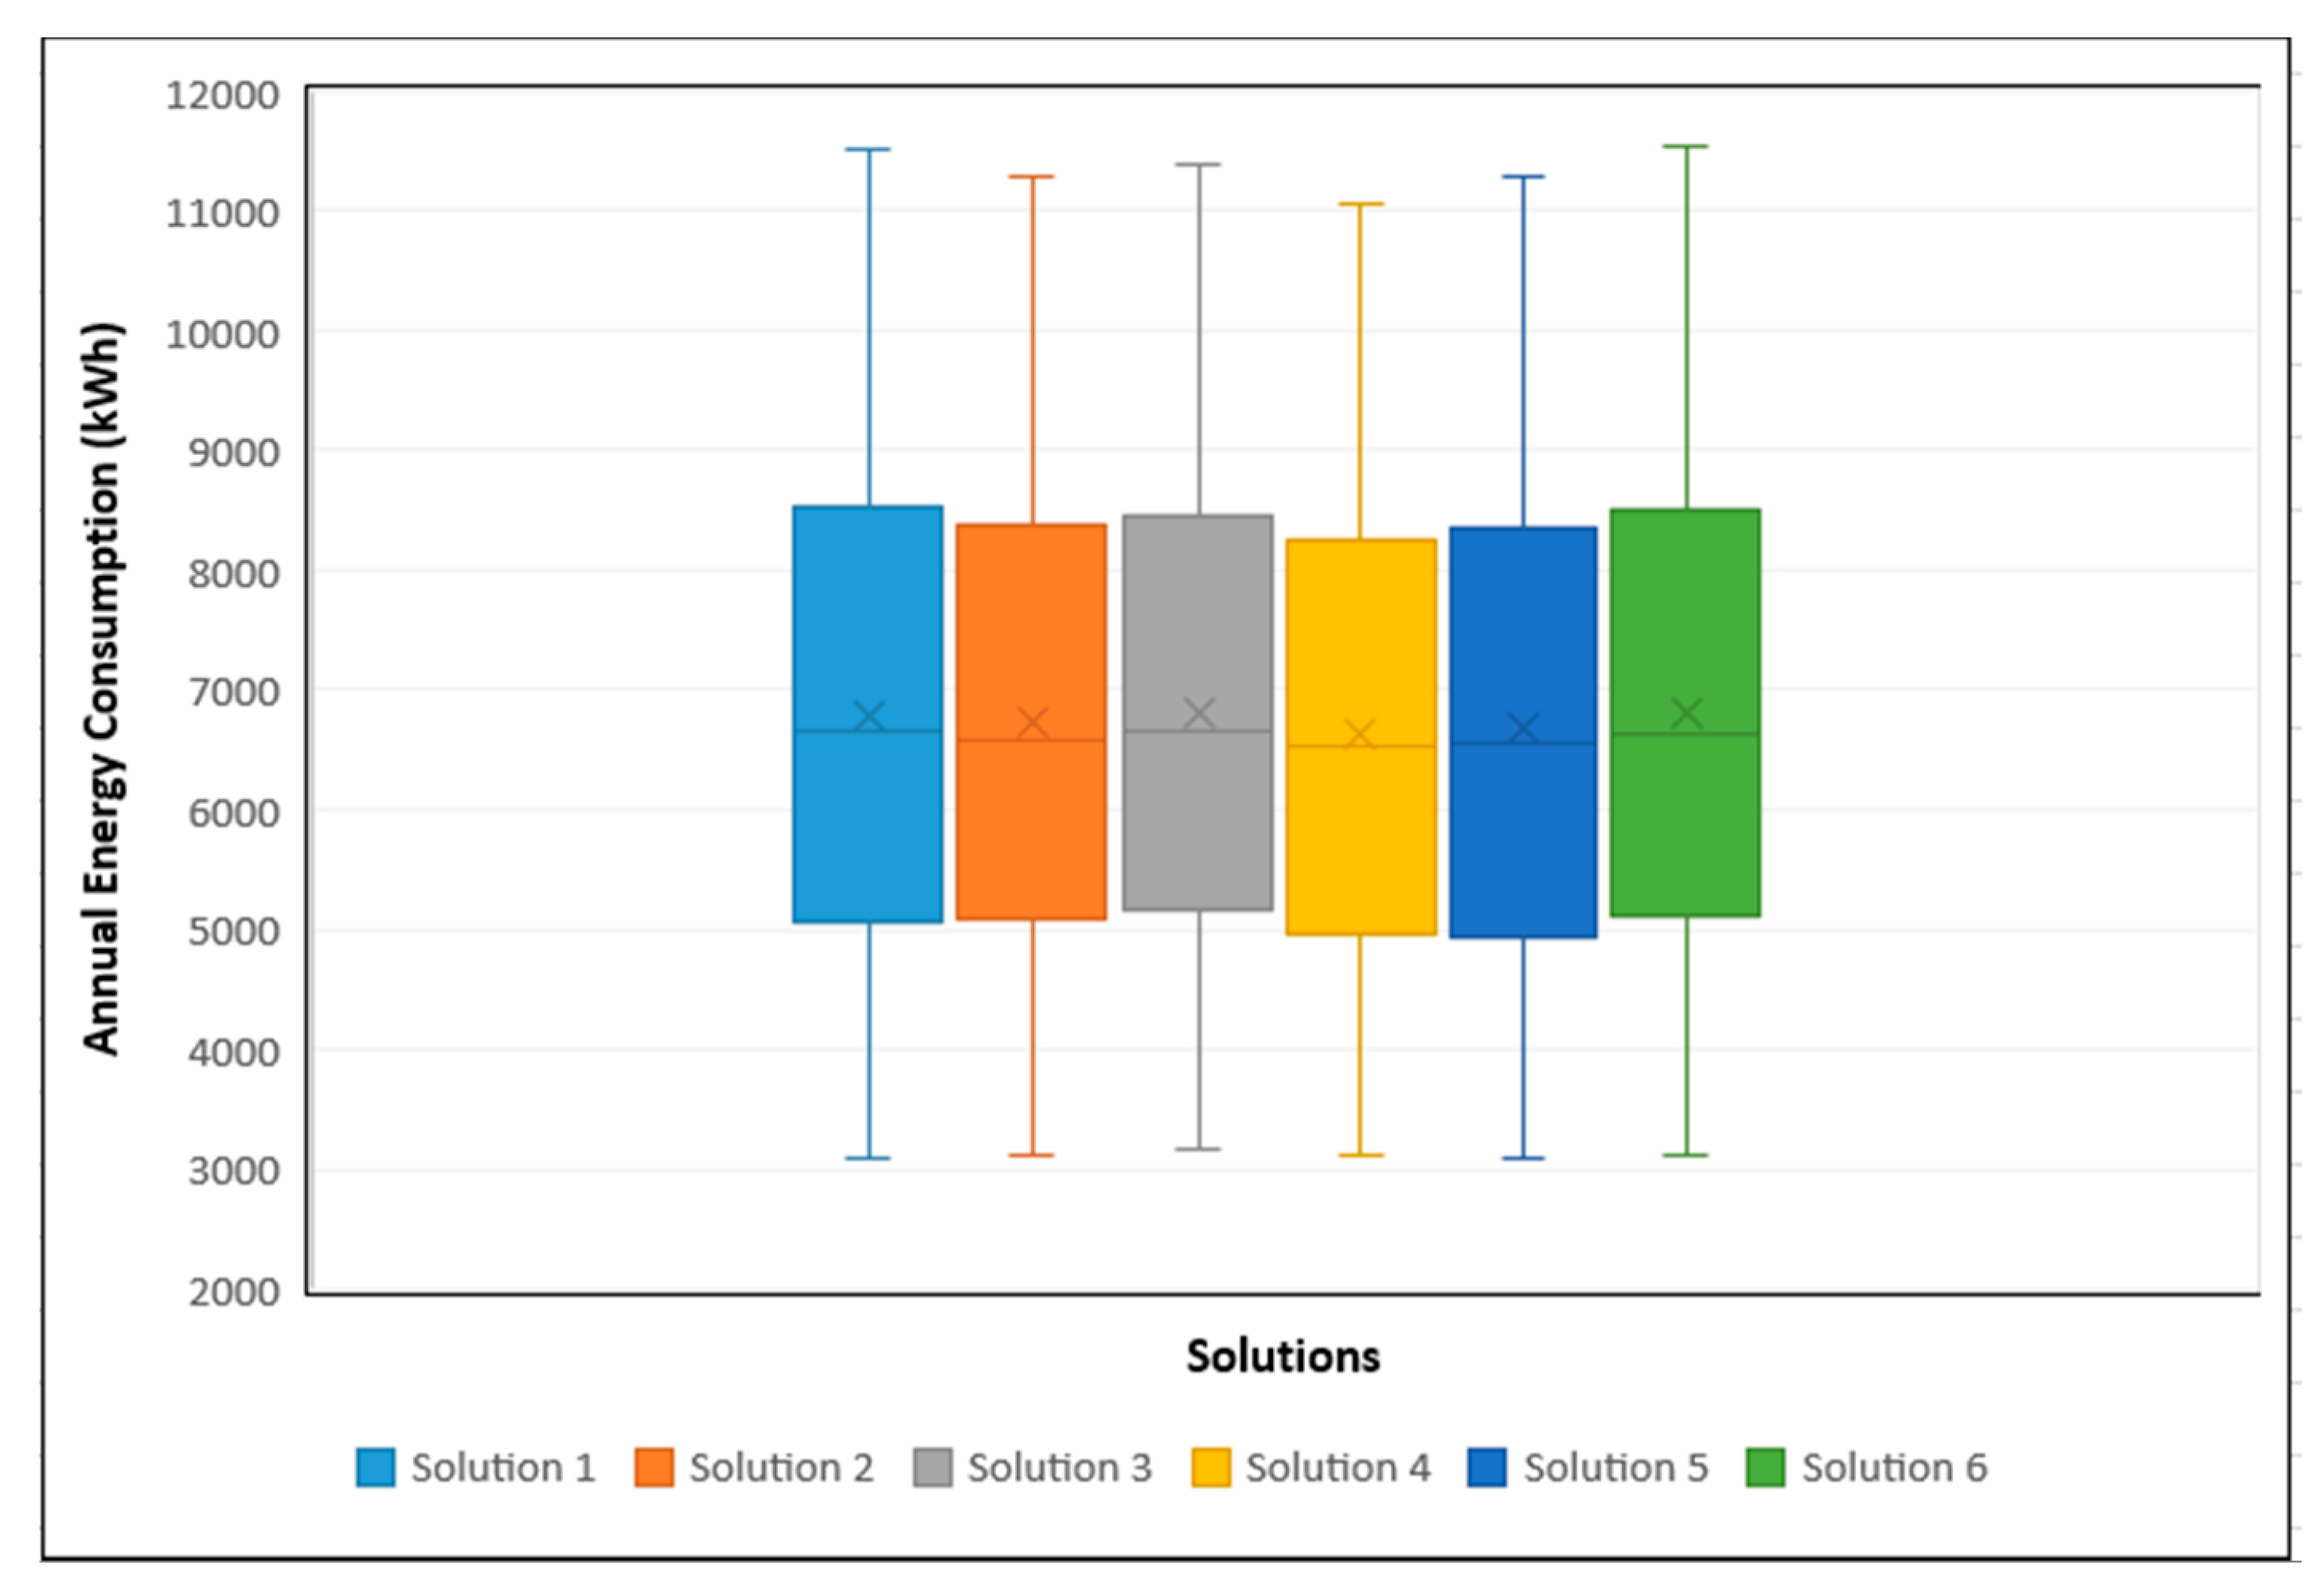
Table 5). These diverse scenarios are representative of uncertainties associated with the choice of an air conditioner setpoint, energy consumption by lighting and electrical appliances, and daily h of air conditioner operation.
Box and whisker plots were developed to highlight the performance variation of each Pareto solution over the two performance objectives (
) and (
) (
Figure 8;
Figure 9).
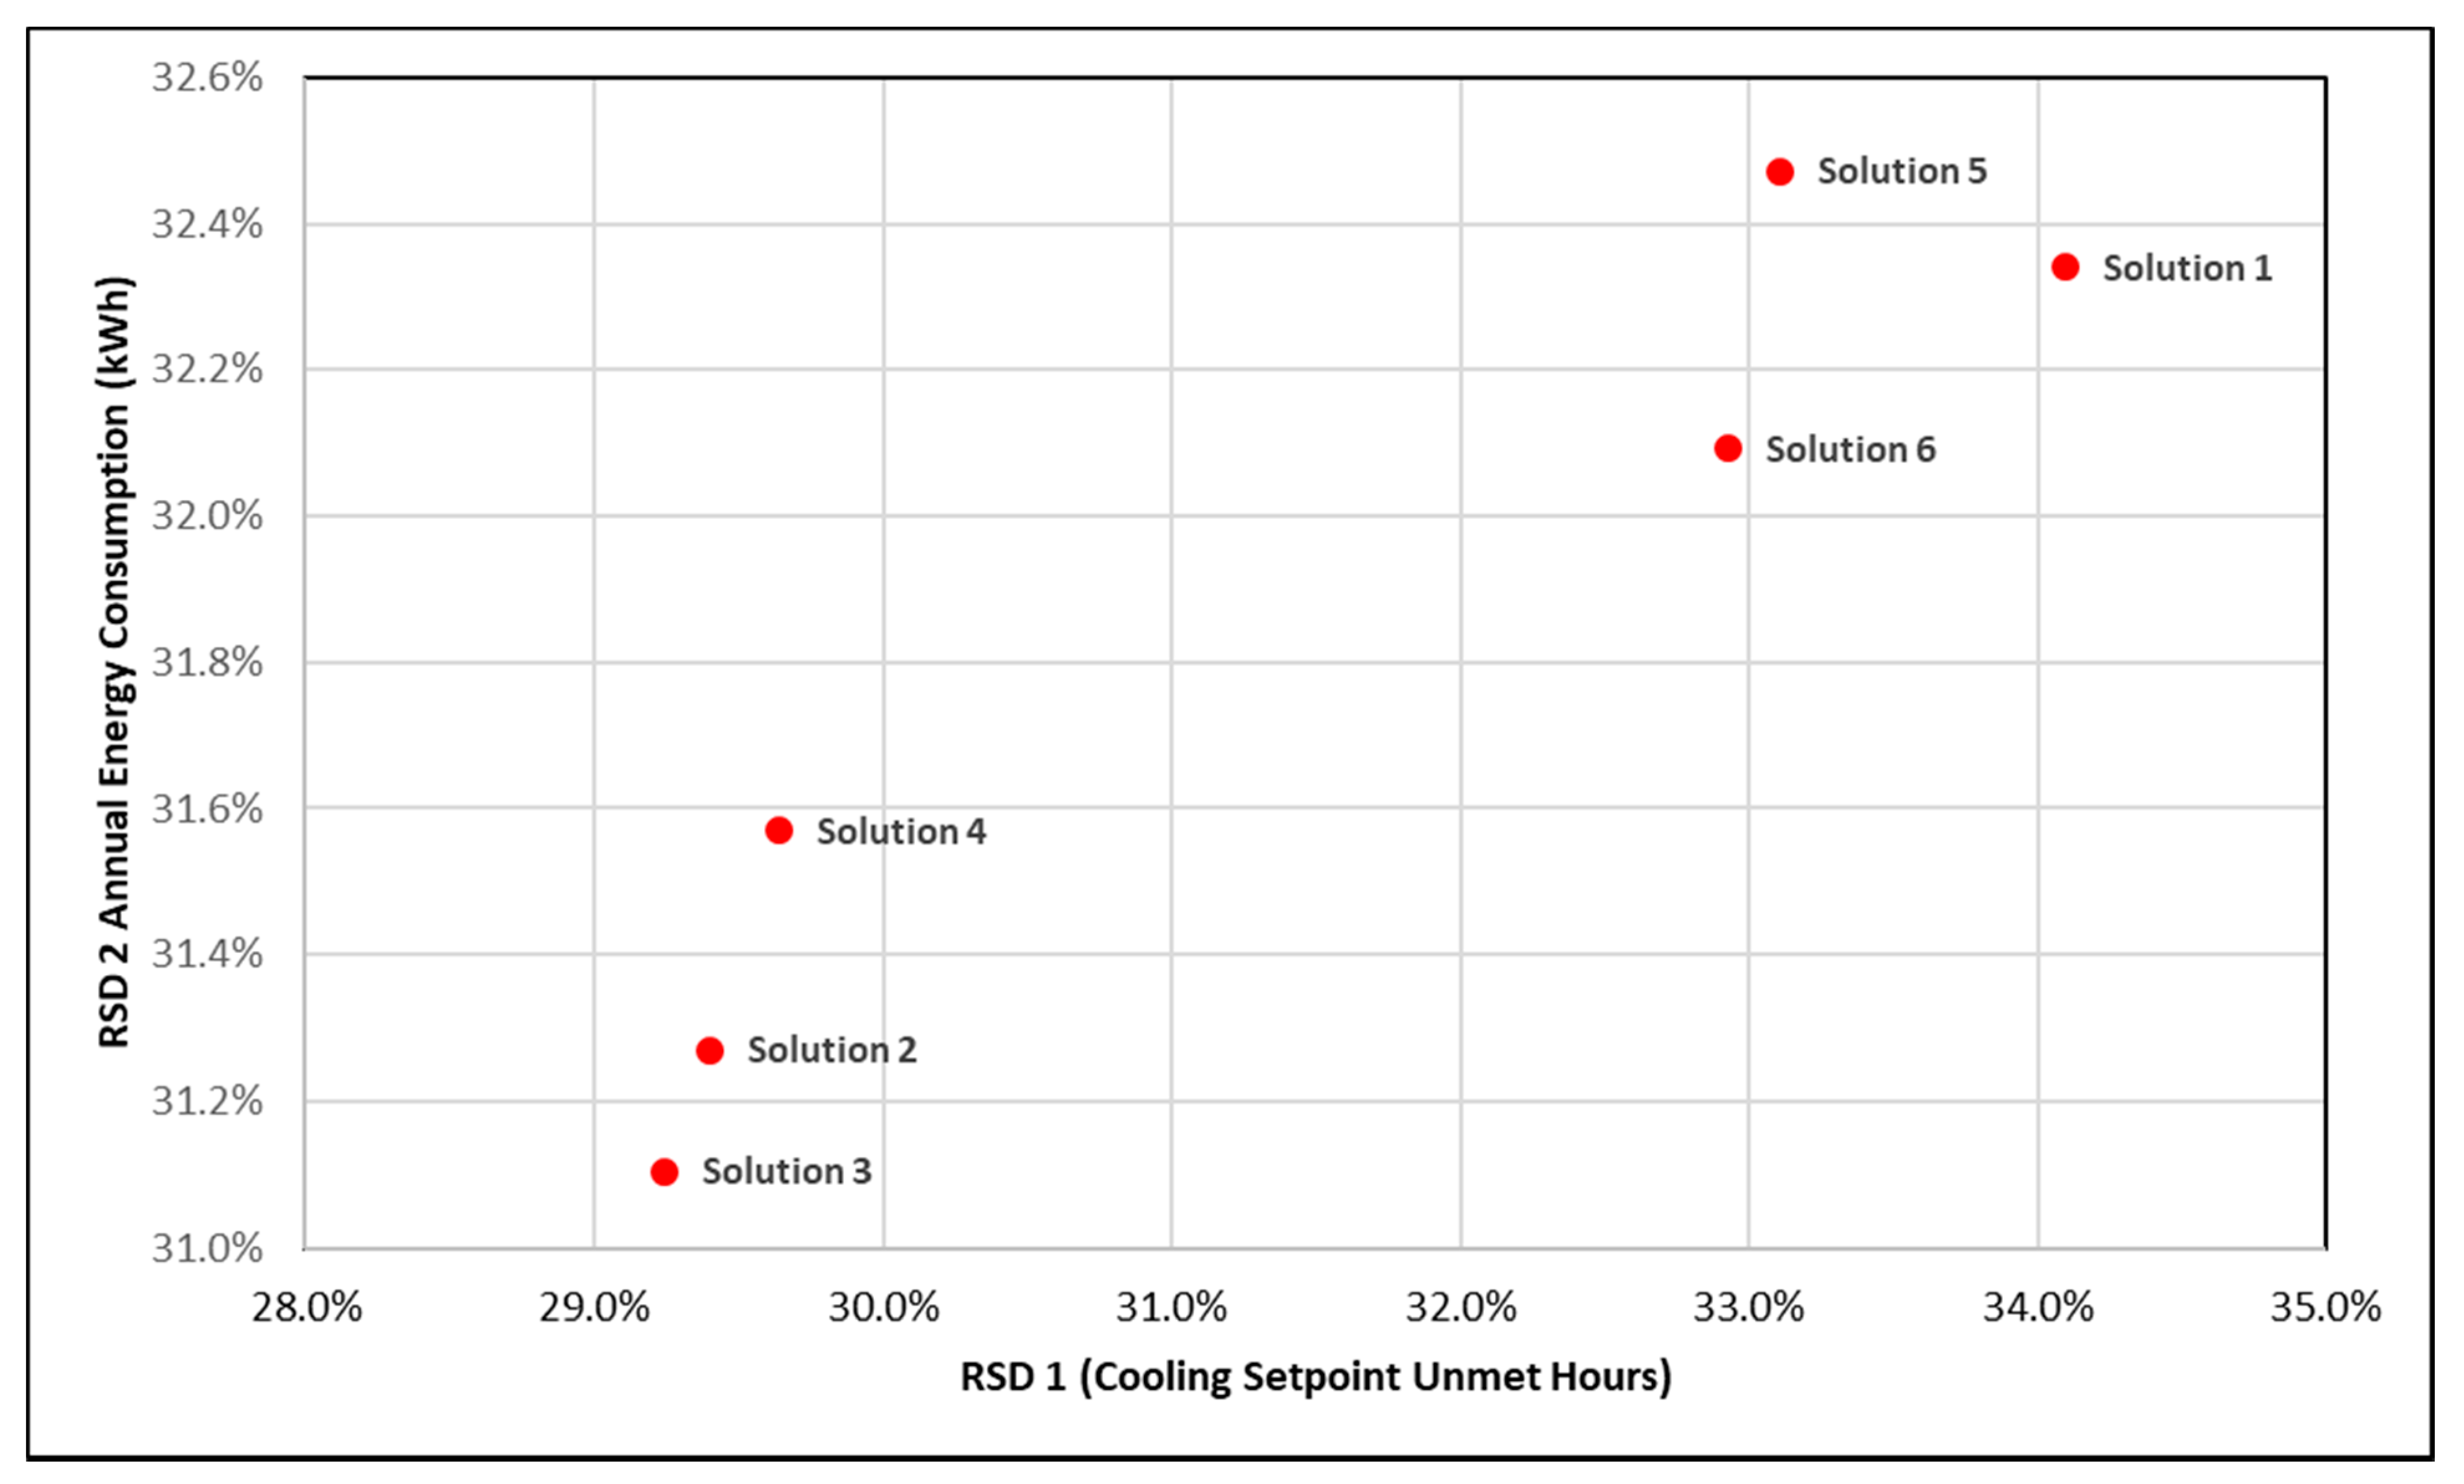
Performance statistics for the robustness of each Pareto solution were collected and tabulated in
Table 6. Relative standard deviations (
and
) were calculated for the two performance objectives. Using (
and
) values for the six Pareto solutions, a robustness plot was developed (
Figure 10).
As seen in
Figure 10, Solution 2 and 3 have the smallest RSD (29%), whereas Solution 1 has the highest RSD (34%) for
. Similarly, Solutions 2 and 3 have the smallest RSD (31%), whereas all other solutions have an equal RSD (32%) for
. Solution 2 and Solution 3 were identified as the two most robust solutions. Therefore, wall sections having a high density of 2200 kg/
and 250 mm thickness display a smaller performance variation for the two objectives as compared to other Pareto solutions. The final performance of each Pareto solution was calculated by multiplying their performance scores (
and
), DM preferences
and
), and corresponding reliability factor. The reliability factor was calculated as (1-
) values. As minimization was the final goal, robust decision function from Equation 8 was used to perform MCDM calculations (
Table 7). The performance of each Pareto solution was also determined according to a deterministic approach (Equation (2)). This approach does not consider the effects of uncertainties for ranking individual solutions. Results of this approach have been reported in
Table 8.
By inspecting the robust approach results, it was found that Solution 2 has the highest performance score of 5.67, followed by Solution 5 (2.83), Solution 4 (2.76), Solution 1 (1.97), Solution 6 (1.76), and Solution 3 (1.72), respectively. The deterministic approach ranked Solution 1 and Solution 2 equally, both having a performance score of 4 followed by Solution 5 (3.20), Solution 4 (2.94), Solution 3 (2.76), and Solution 6 (2.40), respectively. Solutions 1 and 2 were found to be equally optimal by the deterministic approach. However, by introducing reliability criteria in the robust decision function, it was observed that Solution 2 has a 6% lower RSD over the first performance objective and a 1% lower RSD over the second performance objective. Therefore, Solution 2 was selected as the most optimal solution after investigating performance, user preference, and reliability criteria.
7. Discussion
The robust optimization methodology employed for this study allows the decision-maker to compare and rank a large number of Pareto optimal solutions. Depending on specific performance goals, DM preferences, and reliability criteria, this method can be deployed for the design and retrofit of new and existing buildings situated in different climates to identify suitable energy efficiency measures. Depending on the cost, local regulations, and environmental concerns, single or a combination of EEMs can be adopted. This paper has deployed this methodology for the design optimization of a mixed-mode residential building situated in a hot and dry region of the Global South.
In such areas, it was found that high thermal mass walls with high core material density and wider cross-sections behave optimally in limiting the number of cooling setpoint unmet h and annual energy consumption. High thermal mass walls restrict the flow of heat from the outdoor environment into the building due to their high thermal storage capacity. Thermal storage helps to control the rise in indoor temperature, thereby reducing the number of AC operation h, especially during peak summer months. The application of reflective external surface coatings is also optimal in such a climate as they reflect a significant portion of the incident solar radiation. Further, small window sizes with triple glazing can limit excess solar gains into the building. Triple glazed window contains a low emissivity film suspended between the multiple glass layers which acts as a filter allowing the passage of visible fraction and blocks shortwave infrared radiation present in the sunlight. Window glass replacements are more desirable in retrofit projects, where it is not possible to dismantle parts of the building structure.
EEM identified that using this robust optimization methodology delivered higher performance reliability as compared to the deterministic approach. Wall thickness and its core material density were identified as the two major factors impacting the performance reliability of a mixed-mode building situated in a BSh climate. The final optimal design was found to have a 9.24% lower annual energy consumption and 45% less cooling setpoint unmet h as compared to the base model.
8. Conclusions
As the Global South moves towards doubling its existing building stock by the year 2050, it will be crucial to develop potential pathways to reduce the building energy footprint in this region. Simulation users experience uncertainty in modeling operational aspects of buildings situated in the Global South due to the deficiency of reliable data. This paper has presented the application of a non-dominated sorting genetic algorithm for multi-objective building design optimization under operational uncertainties. A residential building situated in the mid-latitude steppe and desert (Köppen climate classification: BSh) region of India was chosen for analysis. Annual energy consumption and the total number of cooling setpoint unmet h were assessed over 13,122 energy efficiency measures. Robustness of Pareto solutions was evaluated by comparing their performance sensitivity over 162 uncertain operational scenarios. A robust multi-criteria decision function was formulated by incorporating performance, user preference, and robustness criteria for ranking the six Pareto solutions. It was found that robustness assessment can improve the performance guarantee of results obtained from a deterministic approach. The final optimal design was found to have a 9.24% lower annual energy consumption and 45% less cooling setpoint unmet h as compared to the base model.
It was found that buildings having high thermal mass walls, reflective surface coatings, and small window sizes with triple glazing windows can limit the flow of heat from the outdoor environment into the building, especially during the peak summer season. It was also found that buildings constructed with high thermal mass wall sections are more resilient towards changes in building operational patterns. These results can be used for simultaneously improving the energy performance and thermal comfort for residential buildings situated in dry and arid regions of the Global South.
It is also recommended to shift from a purely deterministic approach and adopt a more human centric approach for building optimization by considering many possibilities for building operation. The integration of building optimization with robustness assessment can help identify solutions which are capable of achieving promised energy savings for a wide range of operational uncertainties. The methodology used in this paper also has a limitation. The total number of cooling setpoint unmet h variables treats all room temperatures above the cooling setpoint as equal candidates. For instance, a two-degree and a five-degree room temperature above the cooling setpoint were both counted as one for the calculation of the total number of cooling setpoint unmet h. Follow-up studies can attempt to implement a multiplication factor that can change proportionally to the difference between the cooling setpoint and room temperature. This additional step would represent thermal discomfort more accurately by giving more weight to discomfort caused by higher indoor temperatures. Moreover, future studies should attempt to examine the combined effects of uncertainties associated with climate change, HVAC degradation, and occupant behavior on building design optimization.


