1. Introduction
Climate adaptive building envelopes have been receiving increasing interest in recent years [
1]. The growing interest can be explained, among other reasons, by the technological advances in control and motion mechanisms and by the growing awareness of building performance and its influence on energy consumption and climate change [
2]. The use of dynamic external shades is one of the earliest examples of climate adaptive building envelopes. Dynamic external shades have the potential to optimize the internal illuminance and solar radiation over the building’s façade in relation to the sun’s position. They can also react to various disturbances in the sun’s radiation, such as clouds, trees, adjacent buildings and other urban elements, allowing dynamic adaptation of internal environmental conditions. The dynamic operation of louvers also has some limitations. Rapid, automatic movements of louvers can be disturbing [
3]. On the other hand, manual changes in louver orientation are highly dependent on the mindfulness of the occupants, who have been reported to be inconsistent at remembering to change the louver’s position, thereby affecting the building’s performance. According to research, people do not operate shades as much as is required to achieve optimal results. Their operation is done weekly or even monthly at most, with the main aim of improving the visual environment rather than thermal [
4,
5].
Although there is a large scientific literature about the influence of static and dynamic external shades on internal illuminance and energy consumption, there seems to be a lacuna in the knowledge regarding the contribution of dynamic shading operation scenarios in relation to traditional static shading [
6,
7].
This paper presents the results of the second stage of an ongoing study on architectural louvers. This stage focused on examining and comparing various external louvers’ static and dynamic operating scenarios. The analysis was implemented through a method and a tool that were developed in an earlier stage of the research [
7]. The method allows designers and decision makers to check and understand the potential benefits of various positions of kinetic and static external shading elements in close to real time by working with a data base with simulation results that were generated beforehand. It helps to determine the most convenient setting of external shading elements and to compare the influence of different scenarios of external shading dynamics on illuminance.
The paper starts with a summary of the results of the previous stage of the research and a short description of the method and tool that were developed and tested during this stage. Detailed results of the previous stages together with a literature review and a discussion on the gaps in this field were presented in a previous publication [
7]. Subsequently, the paper presents the aims of this stage of the research and its connection to the larger picture of the gaps of knowledge in this field. The main part of the paper presents the results of the analysis that methodically compares the influence of vertical, horizontal and diagonal louver systems on the dynamic measurement of internal daylighting in a Mediterranean climate. The paper finishes by presenting conclusions and promising directions for future research in the field.
2. Literature Review and Existing Knowledge Gaps
A comprehensive literature review on static and dynamic shading in buildings was presented in the previous publication [
7]. Since the previous review, numerous interesting research contributions have been identified. Konstantoglou and Tsangrassoulis [
8] conducted a literature review on the influence of dynamically controlled shading and daylighting systems on energy consumption and visual comfort. They claim that, “In many cases the deficiency of control strategies is mainly related to the fact that they are too simple or too complex to design and install.” They also argue that dynamic systems are examined only during latest stages of the design process, and thus necessitate more advanced tools and metrics. Another recent literature review was conducted by Eltaweel and Su [
9]. This general review focused on parametric design in architecture practice. One of the applications of parametric design that was reviewed was daylighting and solar radiation simulations for design. The review presents and discusses interesting case studies and methods for employing parametric tools such as Grasshopper in design, especially in the design of complex morphologies. Another paper by one of the authors [
10] compared the influence of static and parametrically controlled horizontal louvers on the internal illuminance of a south facing office building in Cairo. The research was focused on daylight illuminance between 300 and 500 lx. It reached interesting conclusions regarding the differences between the examined horizontal louver scenarios but did not attempt to provide an overall understanding of the influences of louvers in different orientations.
Al-Masrani et al. [
11] examined the optimization of solar shading systems for tropical office buildings. The work assessed over 70 studies on various types of shading devices from 2005 to 2018. The research conclusions call for a new hybrid design for shading devices that “can be integrated into various modes, such as soft kinetic systems that functions without mechanical joints or motors.” The research claims that, “Although several studies have proven the efficiency of active mechanical shading systems in terms of environmental and energy performance, their application remains vulnerable to criticism.”
Uribe et al. [
12] examined the potential of perforated exterior louvers regarding the comfort conditions and energy performances of office buildings in different climates. The research focused on the analysis of perforated horizontal louver in six different climate zones. The research found that, “Perforated exterior louvers have the potential to significantly control daylight transmission and solar heat gains and reduce energy consumption in a large variety of climates. However, their performance depends on perforation rate, louver spacing and climate.” Also, the solar heat and daylight transmission through the fenestration system was affected more by louver spacing than by their perforations.
Lee et al. [
13] studied the impacts of four types of shading system (horizontal, vertical, eggcrate and overhang) on daylighting of a classroom in a warm continental climate/humid continental climate. The analysis included static scenarios of various louver angles and presented the results of daylight autonomy (DA) and useful daylight illuminance (UDI).
Boubekri and Lee [
14] compared four daylight metrics daylight factor (DF), mean hourly illuminance (MHI), daylight autonomy (DA) and useful daylight illuminance (UDI) in analyzing the performance of three shading systems (horizontal, vertical and overhang) in static scenarios. They concluded that DF, MHI and DA metrics lead to similar results and should be used to understand and assess energy savings resulting from a daylighting strategy. However, both the UDI and the DA would need to be employed together to achieve both the required visual comfort and energy savings. They also suggest that by combining both metrices, one would be able to meet both energy and daylight demands.
The above-mentioned reviews show new contributions to the body of knowledge in research in relation to dynamic measurement of illuminance, the static scenario performances of various louver geometries and to new types of kinetic control. Nonetheless, there still seem be knowledge gaps regarding the influence of static and dynamic movement scenarios of various louver types on the dynamic measurement of illuminance, which was one of the gaps identified in the previous stage of the research [
7].
The current stage of the research had, therefore, two main aims. The first aim was to compare the performances of various louver types in static and dynamic operation scenarios for a typical office room in a Mediterranean climate. The performance was measured in relation to the level and distribution of internal illuminance and glare conditions. The second aim was to further examine the performance and applicability of the tool and method that were developed in the previous stage of the research.
3. Research Methodology—Simulation Tool, Model Description and Setup for Analyses
In this work we describe a model that supports the rapid evaluation of design alternatives by using a database created from a series of preliminary enumerative simulations as described in [
7]. The model was developed in the Rhinoceros 3D modelling environment using the Grasshopper associative scripting interface, complemented by Python programming. The solar performance is calculated using DIVA–a Radiance-based analysis tool for Grasshopper which allows full control over the parameters of the Radiance simulation. The DIVA plugin is a tool for integrating validated Radiance/DAYSIM simulations into the Rhino3D modelling environment, and allows the visualization of daylight results from an architectural design model, enabling users to easily test several design alternatives [
15]. These tools are rapidly becoming ubiquitous in architectural practice, and are used extensively in the early design stages. The model employs an adjusted useful daylight illuminance (UDI) measure, which integrates Leadership in Energy and Environmental Design (LEED) guidelines regarding glare reduction and recommended lighting levels with spatial daylight autonomy (sDA) demands. As the method’s main aim is to examine and compare alternatives, a more detailed glare test may be required at advanced design stages to determine specific work station locations and to identify possible sources of glare with respect to window positioning.
The simulation tool and method are designed for a flexible calculation of various time scopes, orientations and louver angles. The results given by the current version of the tool represent an illuminance value for every hour. However, this can be altered by the designer when a better resolution is needed.
One of the main differences between the suggested method and tool and other existing simulation tools used by designers is that it is designed to calculate and collect raw-data in a matrix of illuminance values for all the predefined time and louver position parameters in a single simulation run. The preliminary simulations are set up to test the behavior of a several variations of a modeled geometry in different times and at different orientations in a series of extensive simulations. The results are then condensed and stored in an Excel file for future access. Following the simulation run and the creation of the data matrix, researchers and designers can evaluate and compare various louver scenarios in near real time; there is no need to wait for another simulation after the initial run to receive the results of any comparison in any time frame and louver’s angle. One must only wait for the computer to perform simple mathematical comparisons between the various values in the matrix, which are performed in almost real time. This method allows a rapid comparison of different louver operation scenarios by post-processing data directly from the excel file using filters to define the different operation scenarios. This can be of great importance for designers who need quick answers when they examine various design possibilities. In fact, working with this method on simulation problems for designers seems to resemble the way they work on representation problems.
3.1. Analyses Setup—Office Space
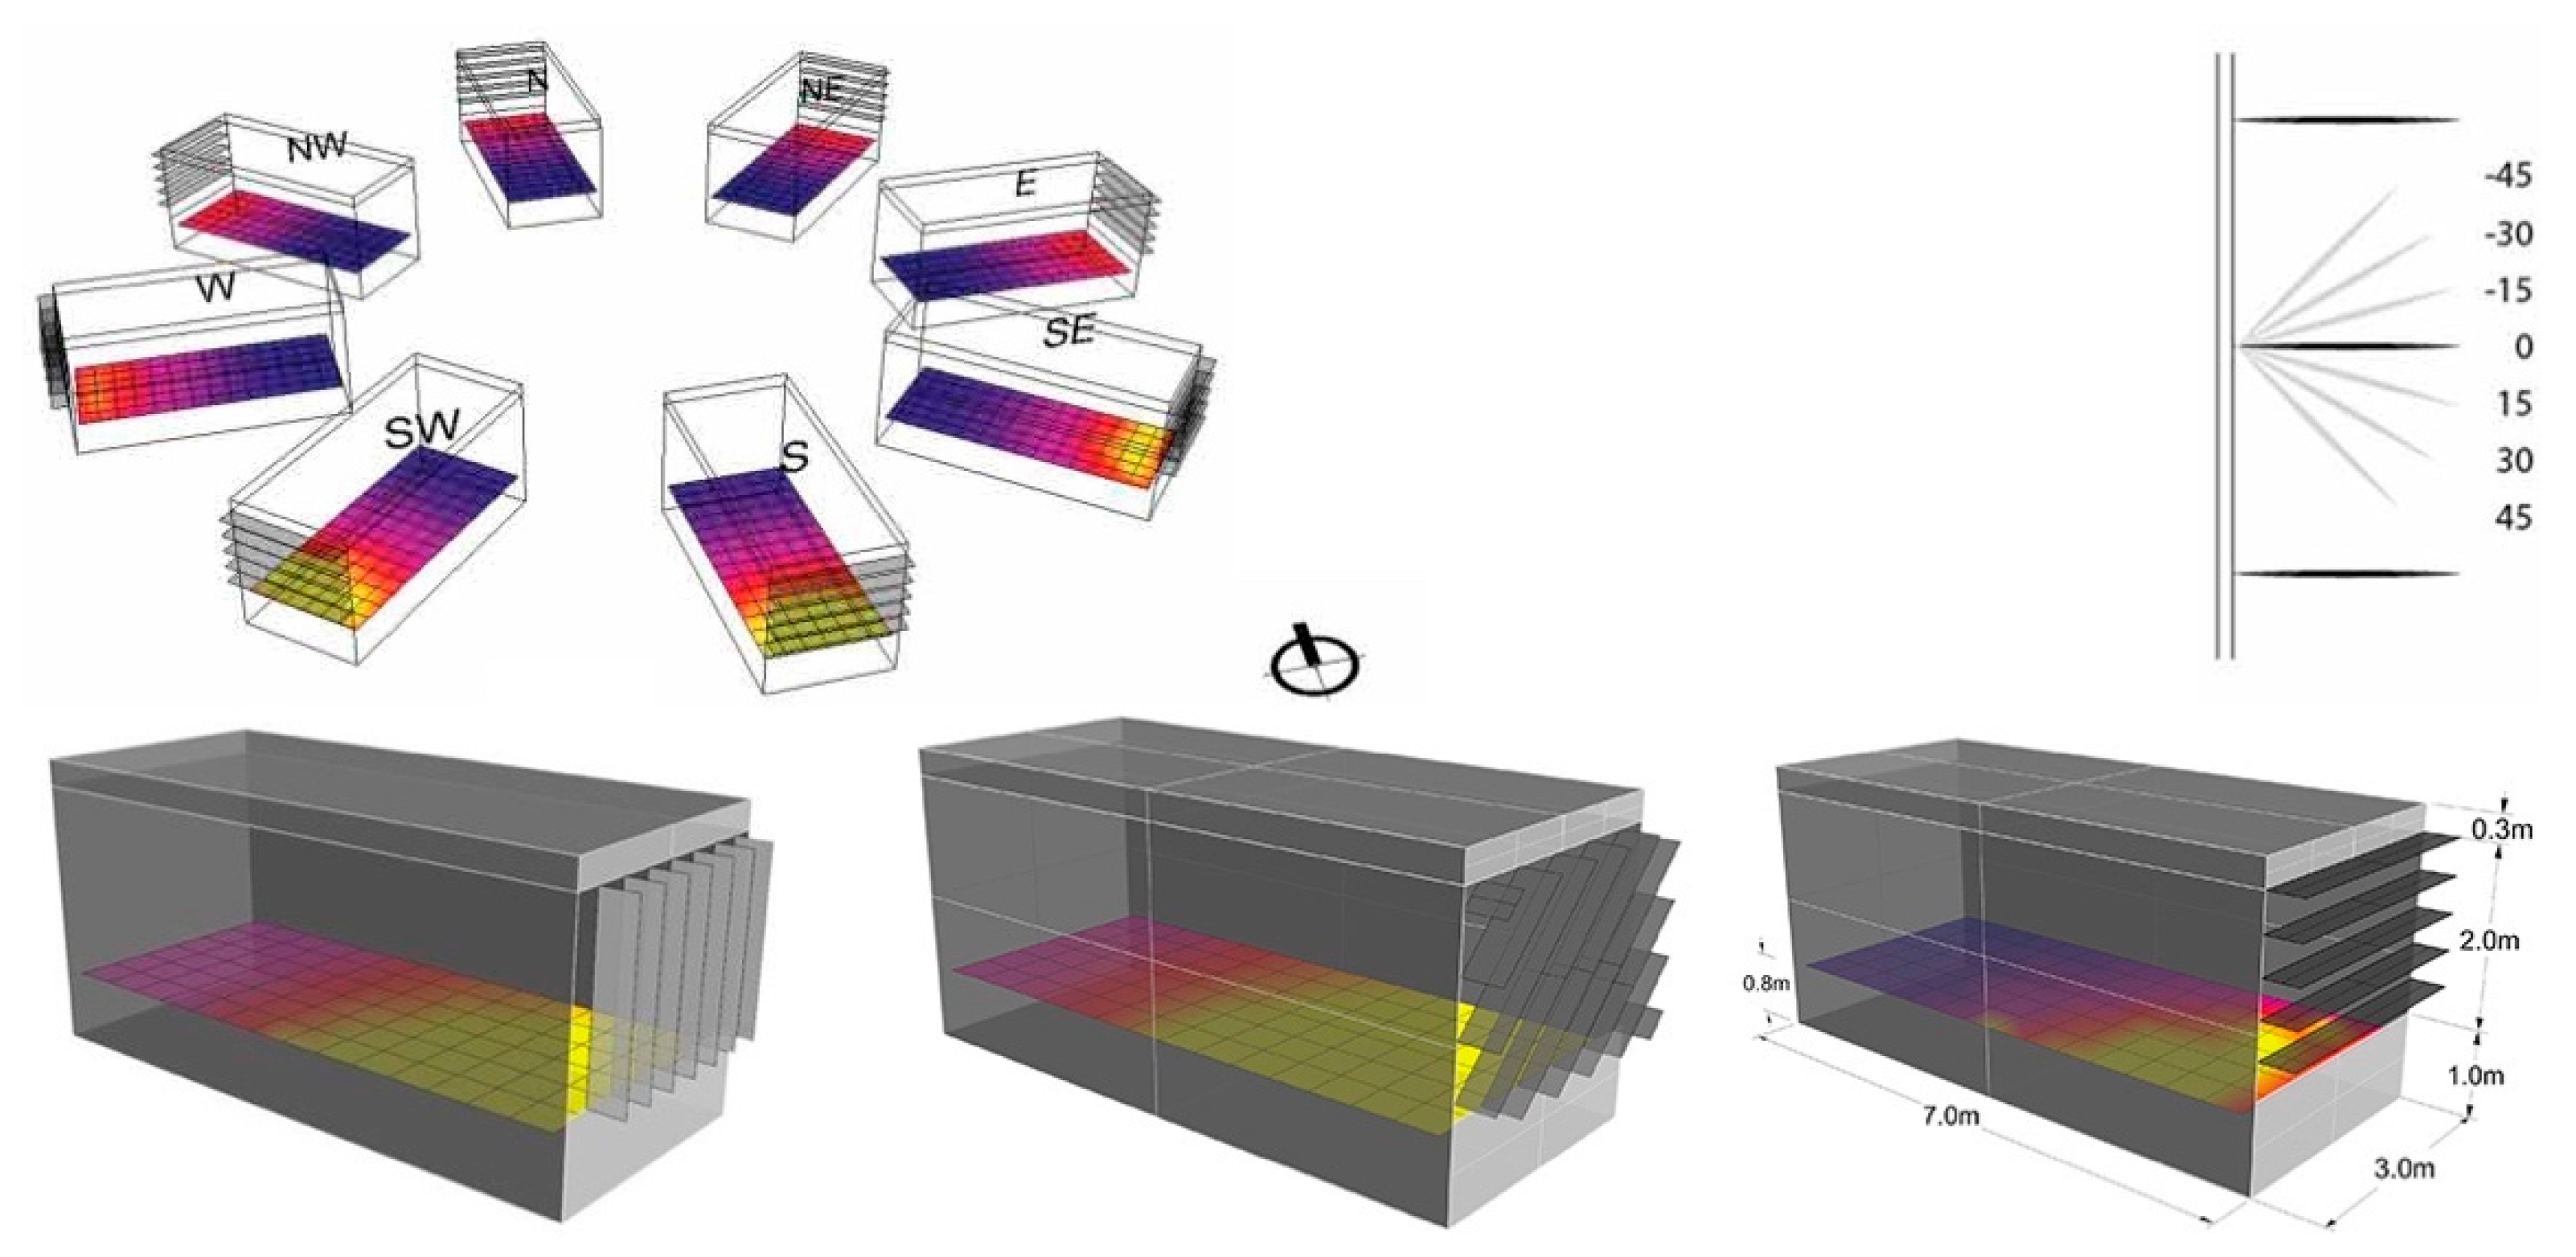
For the purposes of this paper, the simulations were performed on a typical office space, 3 m wide, 3 m high and 7 m deep, as recommended by Ochoa and Capeluto [
16]. One of the short walls of the office is equipped with a full-length window with a 1 m lower sill, going up to the ceiling height of 3 m. The window is comprised of clear double glazing (Visual Transmittance 0.79) and its dimensions are typical for office situations: 6 m
2 window area for a 21 m
2 office representing a 28.5% glazing to floor ratio. The window is shaded by a series of parametrically controlled louvers whose spacing, depth and inclinations in two axes can be adjusted using the Grasshopper interface. The entire complex can also be rotated so that the window faces all the 8 major orientations (N, NW, W, SW, S, SE, E, NE). As this entire scenario is entirely parametrically controlled, it is easily adjustable and can be adapted to any other spatial situation typical of the local environment.
3.2. Louver Types
In the results presented in this paper, the 2 m high window was shaded using three different louver orientations:
Horizontal louvers: In this setup the height of the window was divided into five equal segments of 0.4 m and a 0.4 m deep; a horizontal shading device was fit at the top of each of the segments. The result was a 1:1 ratio between the opening size and the shading depth.
Vertical louvers: Here, the 3 m length of the window was divided into 8 segments with 0.4 m between each segment and 0.3 m at the edges. Between each of the segments, a vertical 0.4 m deep shading device was positioned, again arriving at an average 1:1 ratio between opening size and shading depth.
Diagonal louvers: In this case the widow was divided into eight 0.4 m wide segments at a 45-degree angle to the floor, and a 0.4 m shading device was diagonally positioned at the top of each of the segments, achieving a similar shading ratio.
All louvers are defined using the “diffuse metal” material provided by the DIVA plugin, which corresponds to Radiance parameters of 0.9 specularity, 0.175 roughness and 0.175 reflectance (RGB).
3.3. Analyses Setup—Simulations
For all simulations a 0.2 m wide Radiance analysis grid was situated in a horizontal plane 0.8 m from the floor level, as befits a typical work plane scenario (see
Figure 1). Baseline simulations with no shading devices were then performed in the four seasons (March, June, September and December, on the 21st day) and for each “working” hour—between 09:00 and 18:00. The EnergyPlus Weather File (EPW) file for the central region of Israel (Beit Dagan, 32° north latitude and 34:49° east longitude) was used, with the following Radiance parameters—“ab (ambient bounces) 5, ad (ambient divisions) 1000, ar (ambient resolution) 300, aa (ambient accuracy) 0.1,” to obtain a good accuracy of indirect calculation, and a “clear sky with sun” setting reflecting an average of 300 sunny days/year which characterizes this climate. An unobstructed sky was considered in the simulations. Therefore, care must be taken in situations were significant sky obstructions exist both for designing the required shading devices and checking daylight availability.
Then the same set of simulations was run again with louvers positioned in each of the three main orientations (horizontal, vertical and diagonal). In each set, the louvers were also rotated along their long edge in 15 degree increments, from 45 degrees in one direction to 45 degrees in the other direction, achieving a total of 21 different tested louver geometries.
The louvers were made from diffuse metal with properties as detailed above. The interior of the space was simulated with standard radiance materials—generic floor with 20% reflectance, generic ceiling with 70% reflectance and generic interior walls with 50% reflectance, to allow indirect illumination.
The results of each of the simulations were subsequently analyzed using the adapted UDI measure (AUDI) suggested in our previous paper, which is based on the UDI measure suggested by Nabil and Mardajlevic [
17,
18]. In the new measure, UDI is adapted to reflect the current LEED guidelines for sDA 300%/50% and no more than 10% direct sunlight which exceeds 1000 lux [
19]. These measures were coded into the Grasshopper interface and then recorded for each scenario as both raw data in the Python format and calculated, optimized Excel files.
The results of each single run of the Radiance simulation were converted into an hourly percentage of the grid cells in which the Illuminance ranged between 300 and 1000 lux. These percentages were stored in a python database which allows independent access to each of the hourly results, according to the time, orientation, louver geometry and angle. Storing the useful percentages without the actual illuminance value in each point on the grid allowed us to reduce the dimensionality of the data, compressing it into a much smaller data structure which can be easily accessed, searched and presented. We used a data structure similar to the one described in Grobman et al. [
7], replacing the two-reflection data with updated five reflection data, as described in
Section 4.1. We also expanded the database to include the different louver types described in
Section 3.2. Using Grasshopper to access specific cells in the database and Excel to sum the results, it was possible to calculate daily, monthly and yearly AUDI scores for the different operation scenarios described below.
3.4. Analyses Setup—Dynamic Operation Scenarios
A second type of analysis focused on kinetic scenarios for louver’s operation. It compared static and no louver scenarios with two different kinetic scenarios in terms of the distribution of internal illuminance and glare conditions. In both cases, the solution was reached by searching through the pre-calculated result matrix and choosing the optimal shading solution by comparing the hourly AUDI values in all the different measurements. The kinetic scenarios that were examined are:
- (1)
Dynamic, optimal shading: In this scenario it is assumed that the louvers are continuously, automatically rotated to the position which provides the optimum result in terms of AUDI for each time of day.
- (2)
Seasonally adjusted: In this scenario it is assumed that the louvers are rotated manually by the building superintendent. Here they are adjusted once at the beginning of each season to the position shown by the simulations to be optimal for the ensuing three months.
Besides the two kinetic scenarios examined in this stage, the method allowed us to test any different scenario imagined without the need to rerun the simulations. This could be achieved because the results were pre-calculated and stored separately for each measurement time, orientation and geometry, and could be efficiently re-combined using post-processing in Grasshopper and Excel. This method enables the user to generate and test custom scenarios in real time without the need to re-run the solar simulations.
4. Analyses Results and Discussion
The results section is divided to two complementary parts. The first part is a report on the results of the AUDI levels’ comparison between four louvers scenarios (no louvers, static, seasonally adjusted and dynamic louvers). This comparison could help designers and researchers to calculate the cost effective of a decision on a specific louver’s operation scenario in relation to the expected difference in the fabrication and operation costs. The second part employs the same data base to help designers and researchers compare the performances of various geometries. At this stage of the research we focused on three basic louvers geometries (horizontal louvers, vertical louvers and diagonal louvers). The division to the above parts respects two potential starting points of a design processes of a louver system: one that focuses on the geometry of the louvers and the other that concentrates on performance and operation scenarios.
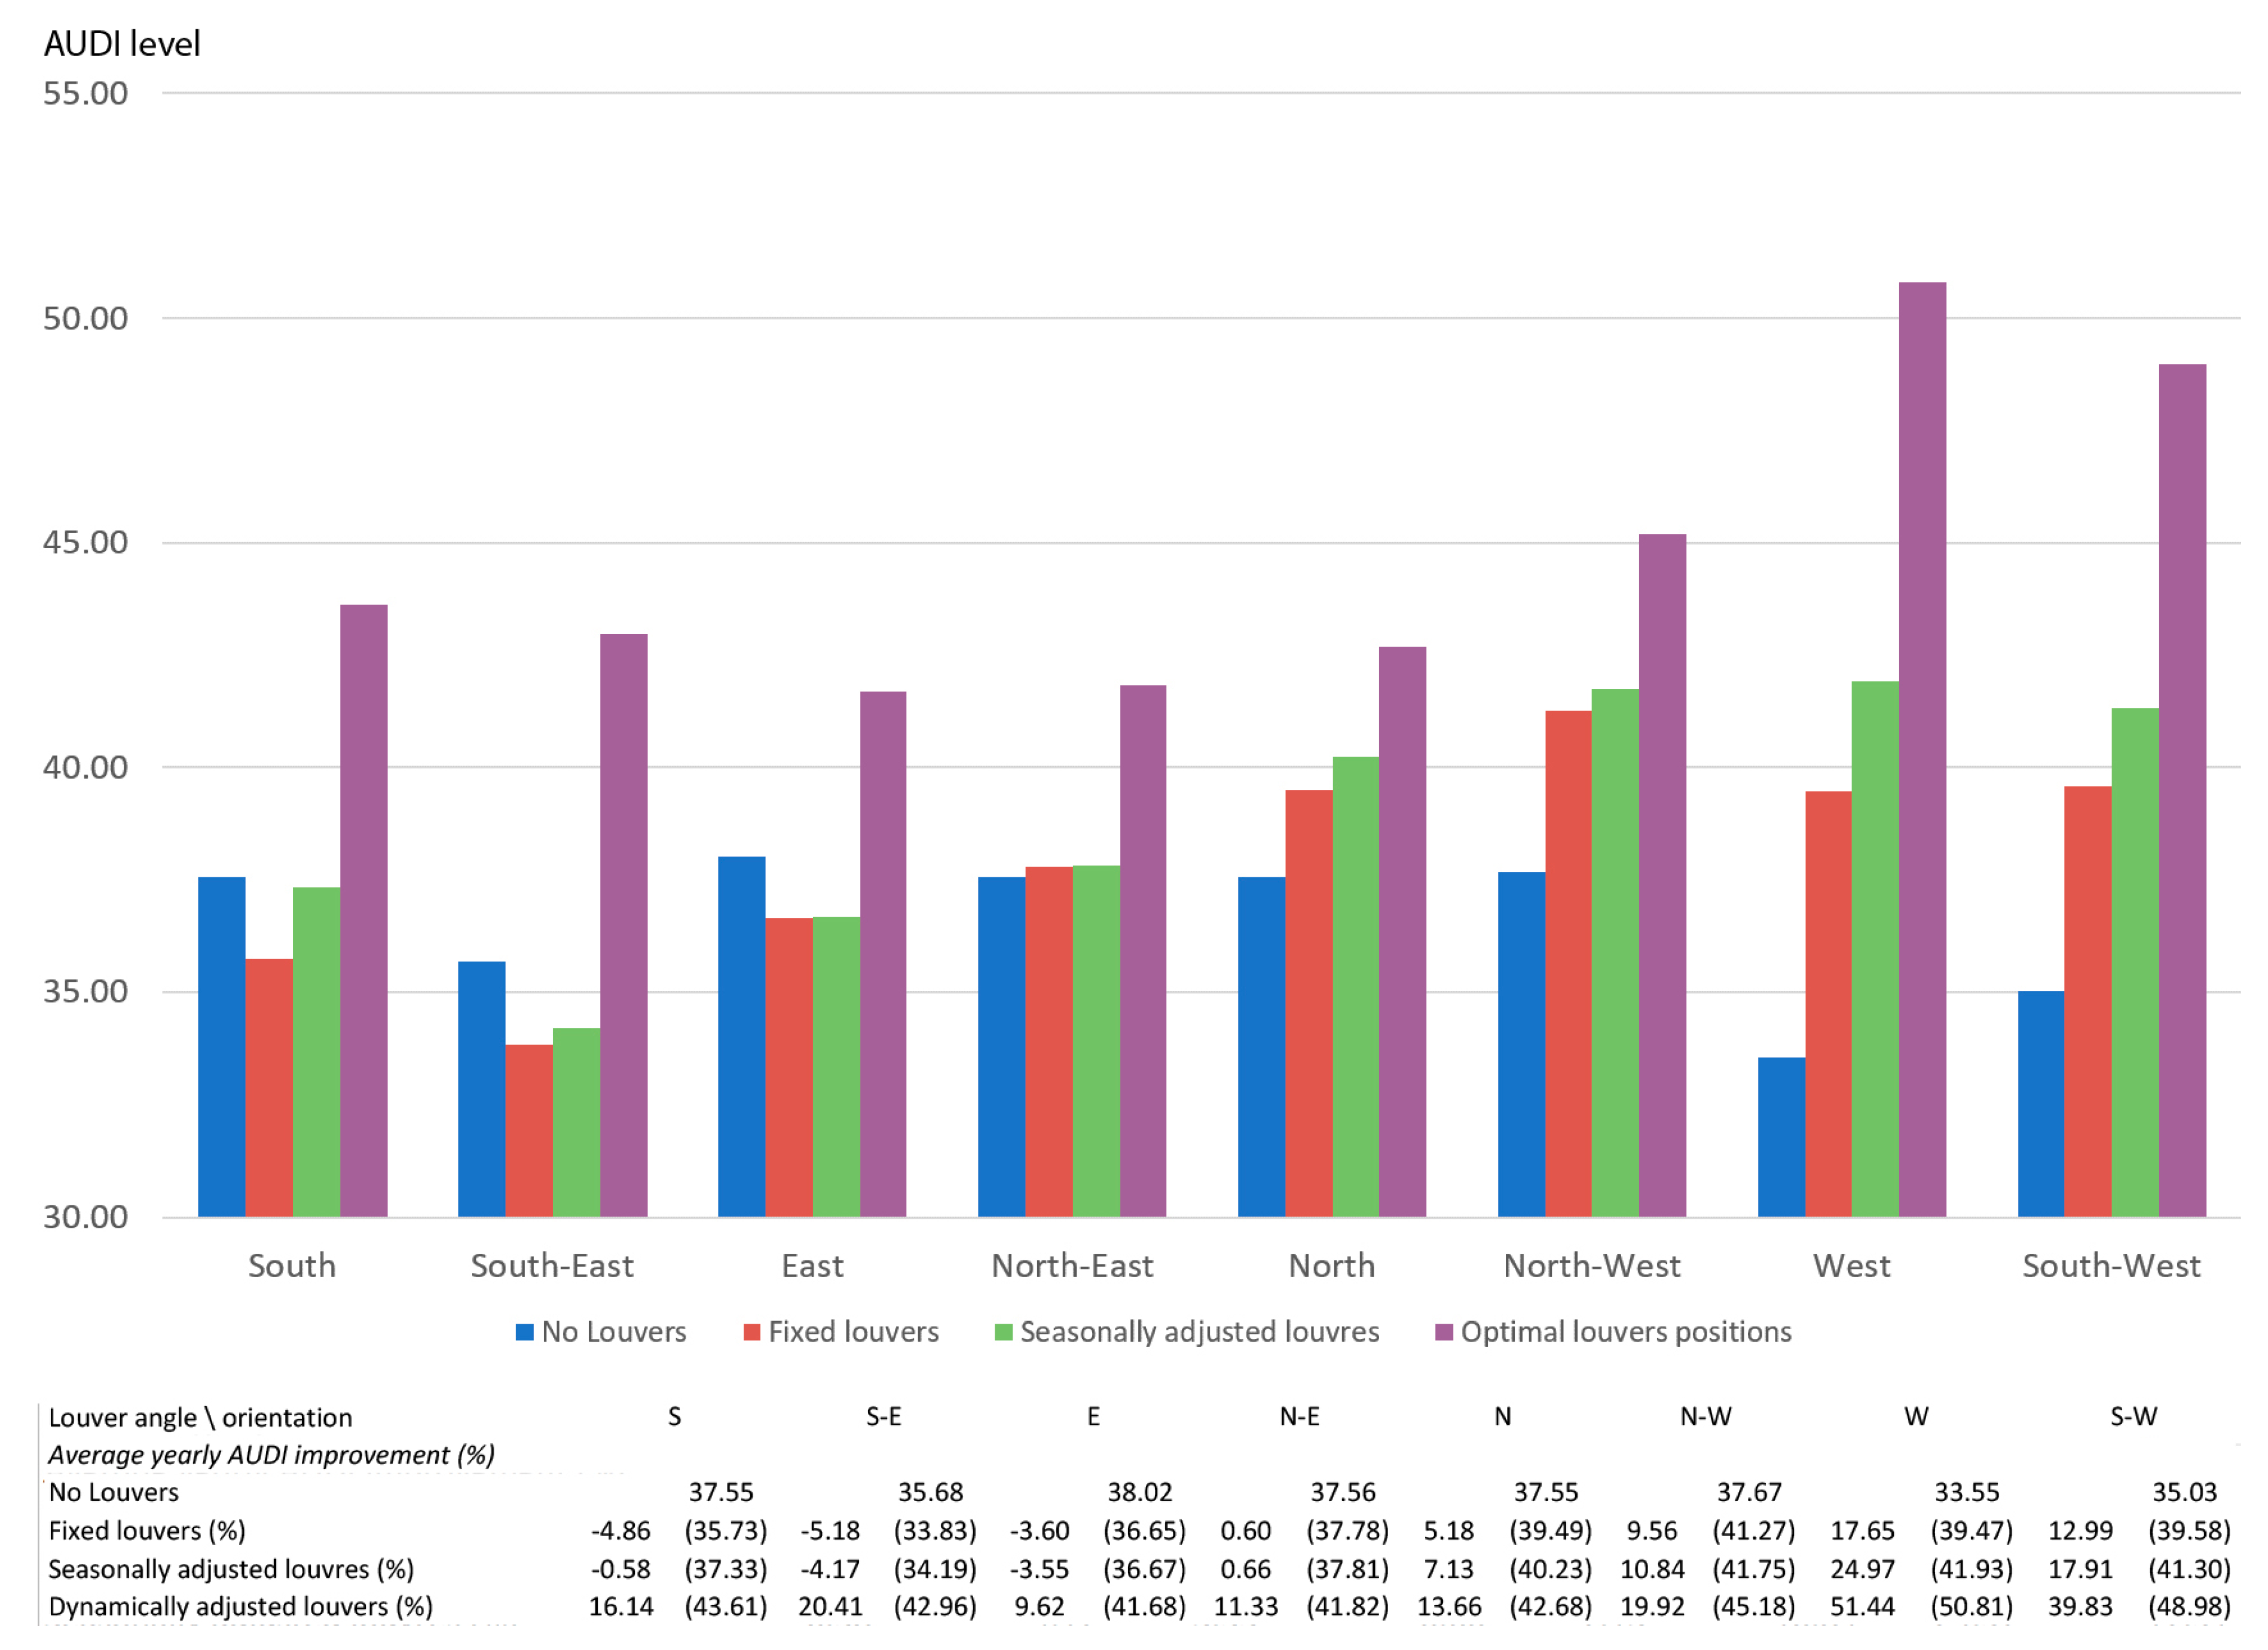
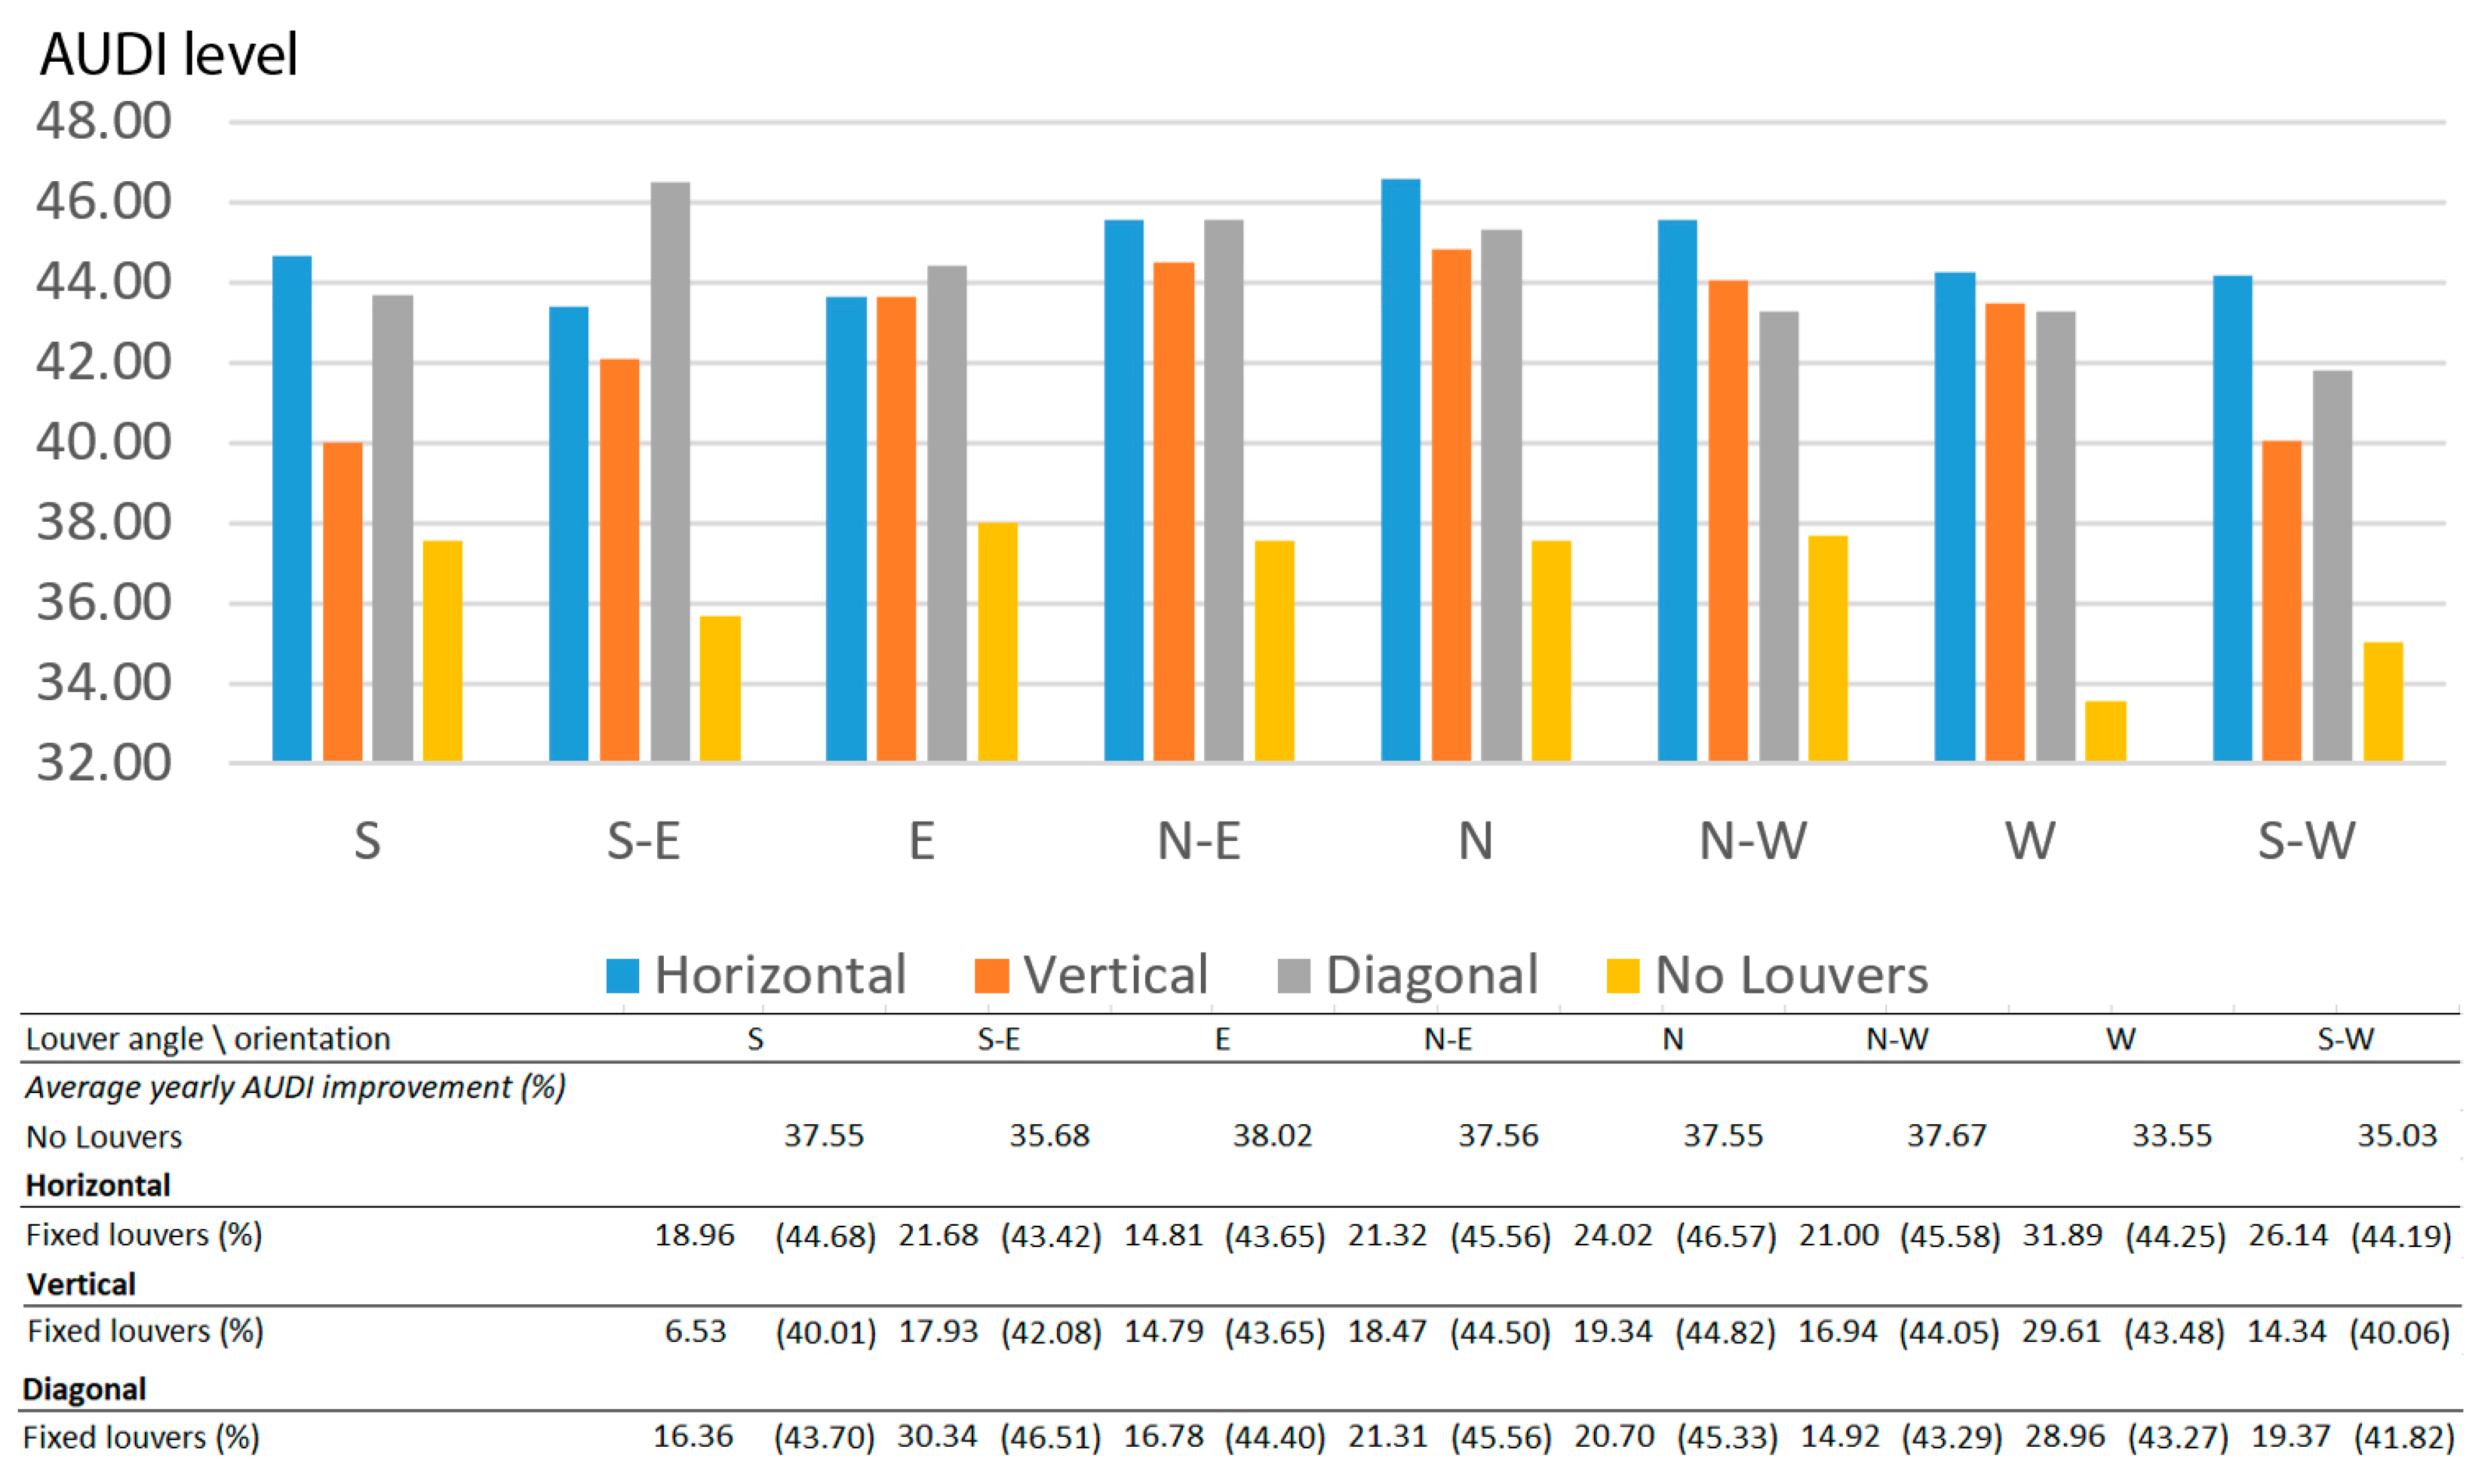
4.1. The Influence of Horizontal Louver’s Orientation on Internal Illuminance in Static and Dynamic Modes of Operation
The first geometry that was tested comprised horizontal louvers:
Fixed louvers: The analysis shows increase in the yearly average AUDI in relation to no louvers scenario in the north (5.18%), northwest (9.56%), west (17.65%) and southwest (12.99%) orientations. In all the other orientations except northeast, fixed louvers caused a decrease in the average AUDI level (in relation to no louvers scenario) of up to −5.18%. In northeast, the yearly AUDI level is almost identical (0.6% improvement) in no louver scenario and fixed louvers.
Seasonally adjusted louvers: An additional up to 7.32% improvement, mainly in the west and southwest facades (24.97% in total in relation to the no louvers scenario), was shown by altering the louver’s position once in every season. Here, only the southeast and east facades performed worse than the no louver scenario, while south performed almost identically.
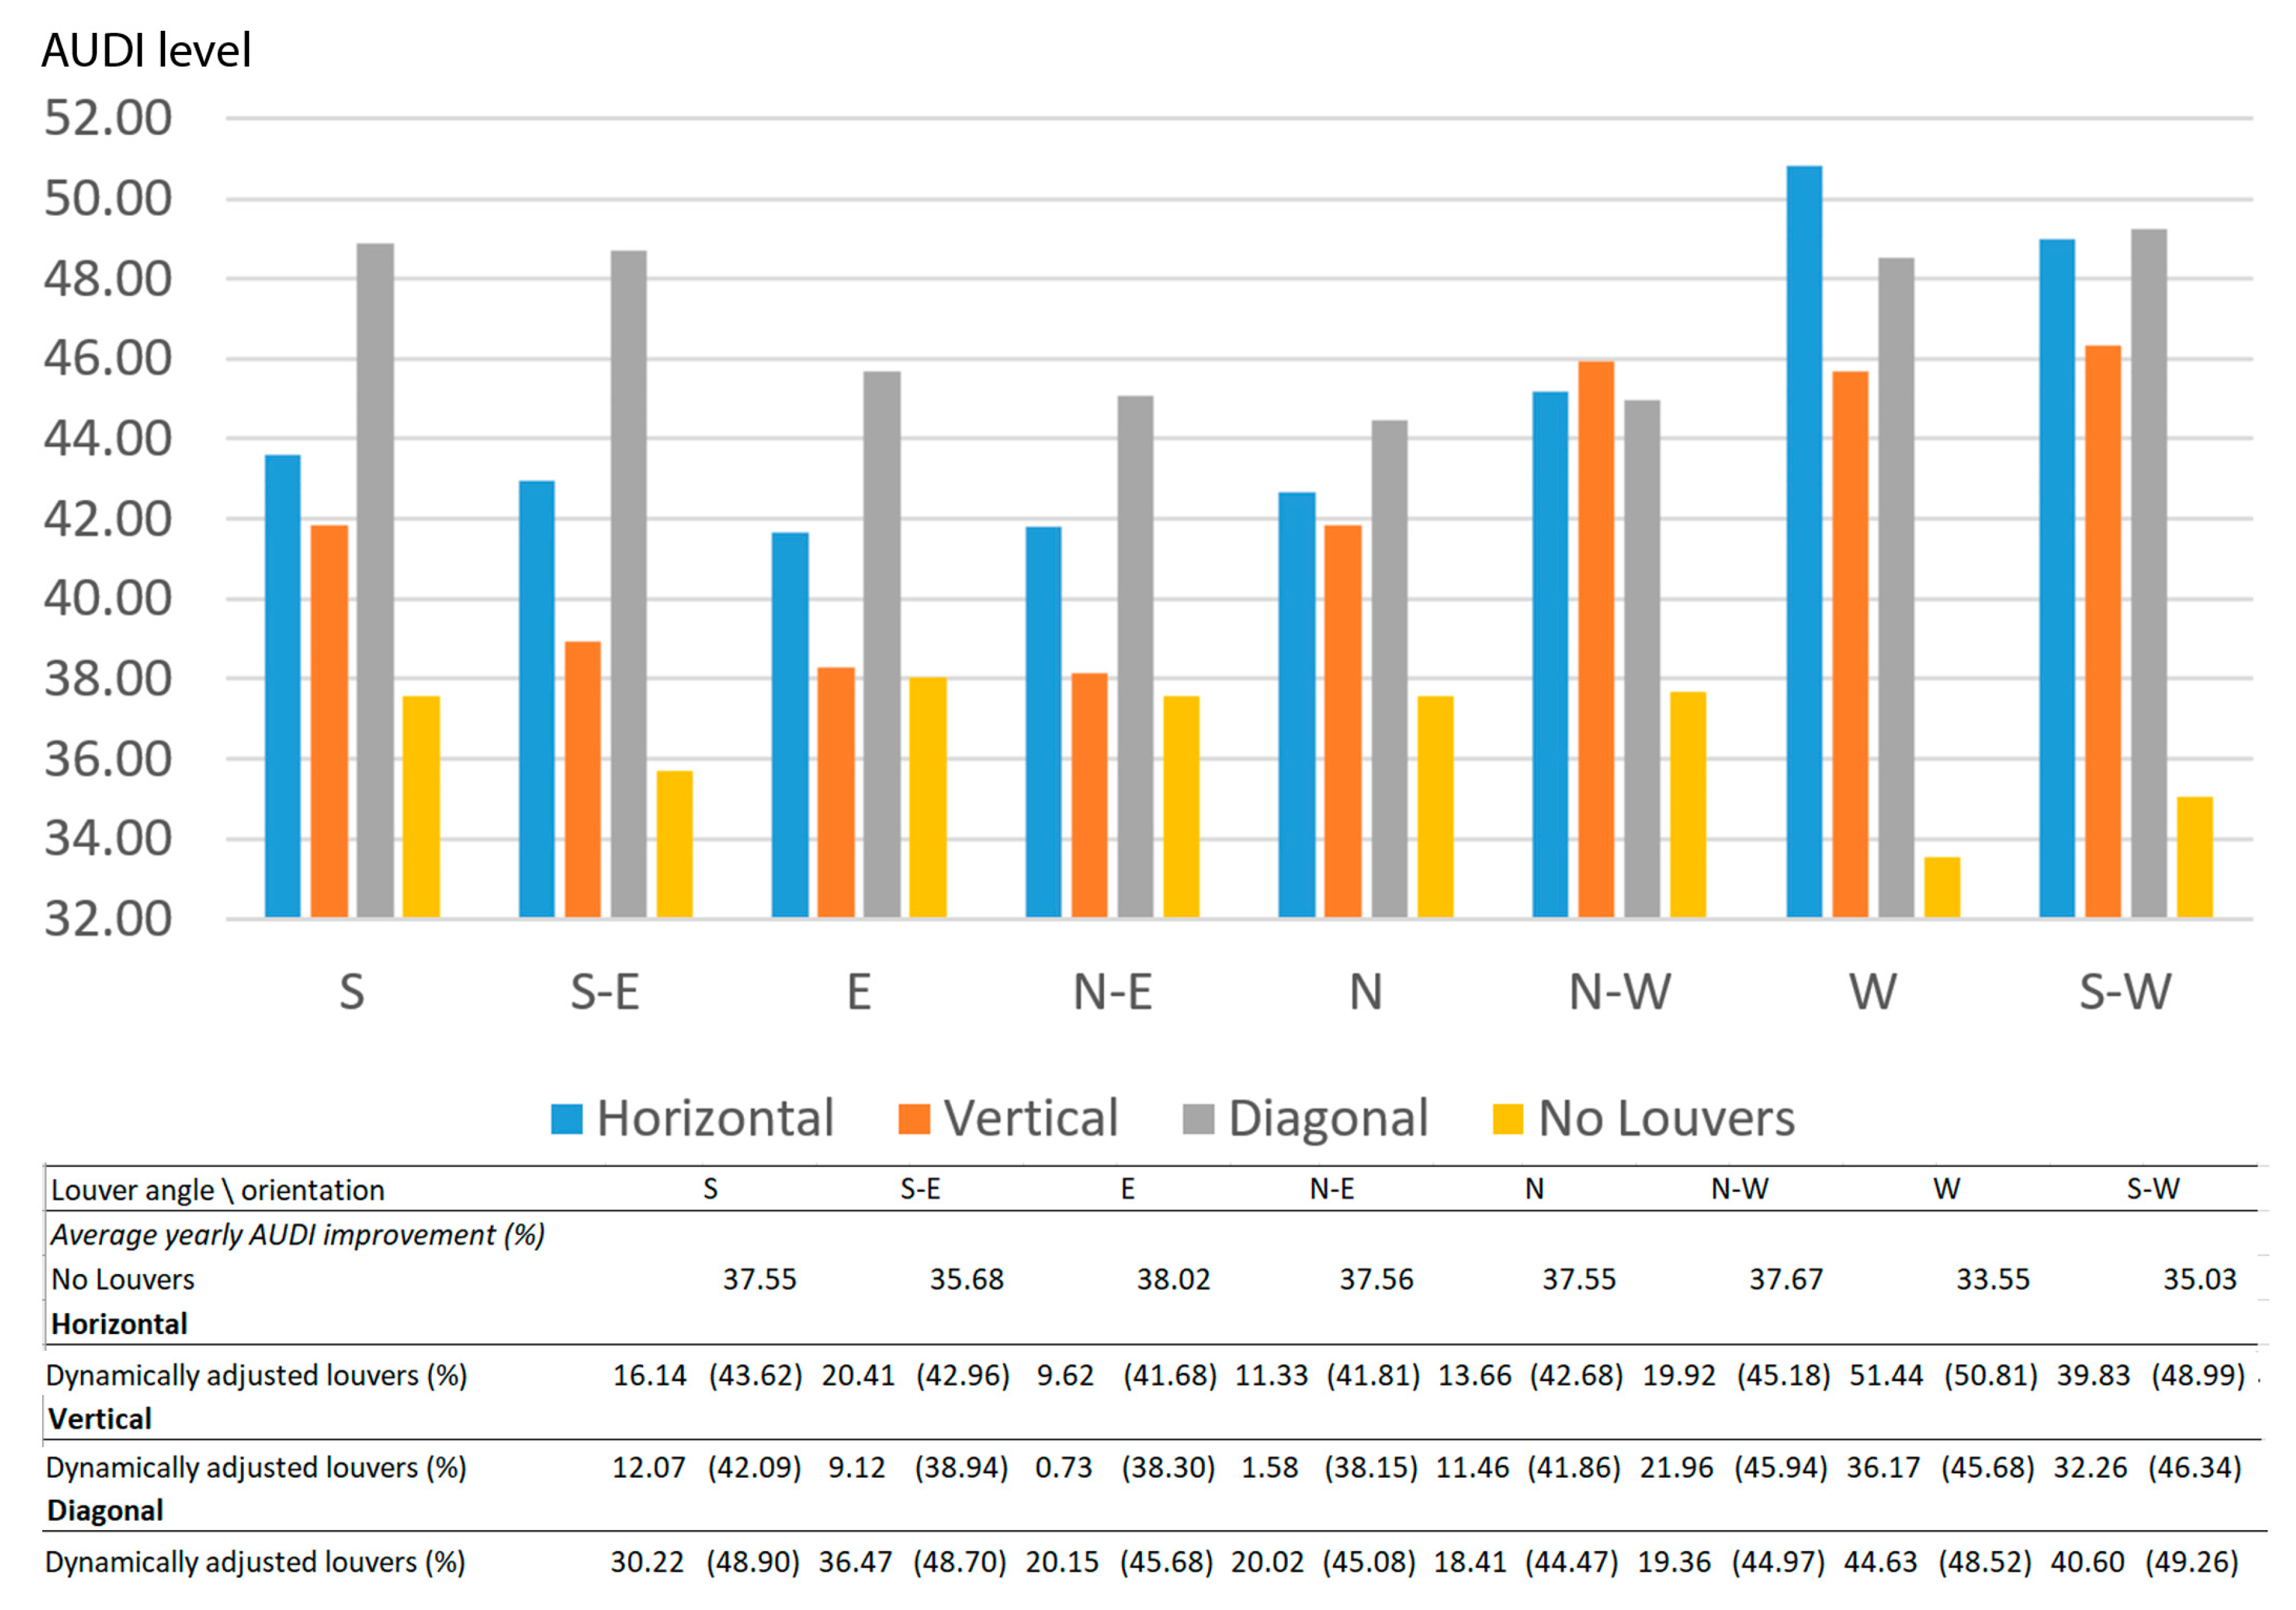
Dynamic louvers: The results show improvements for all orientations and a significant increase in AUDI levels (reaching between 9.62% (east) to 51.44% (west) increase in AUDI levels) compared to the no louvers scenario. This solution can be obtained using louvers that automatically adjust to the optimal placing (see
Figure 2).
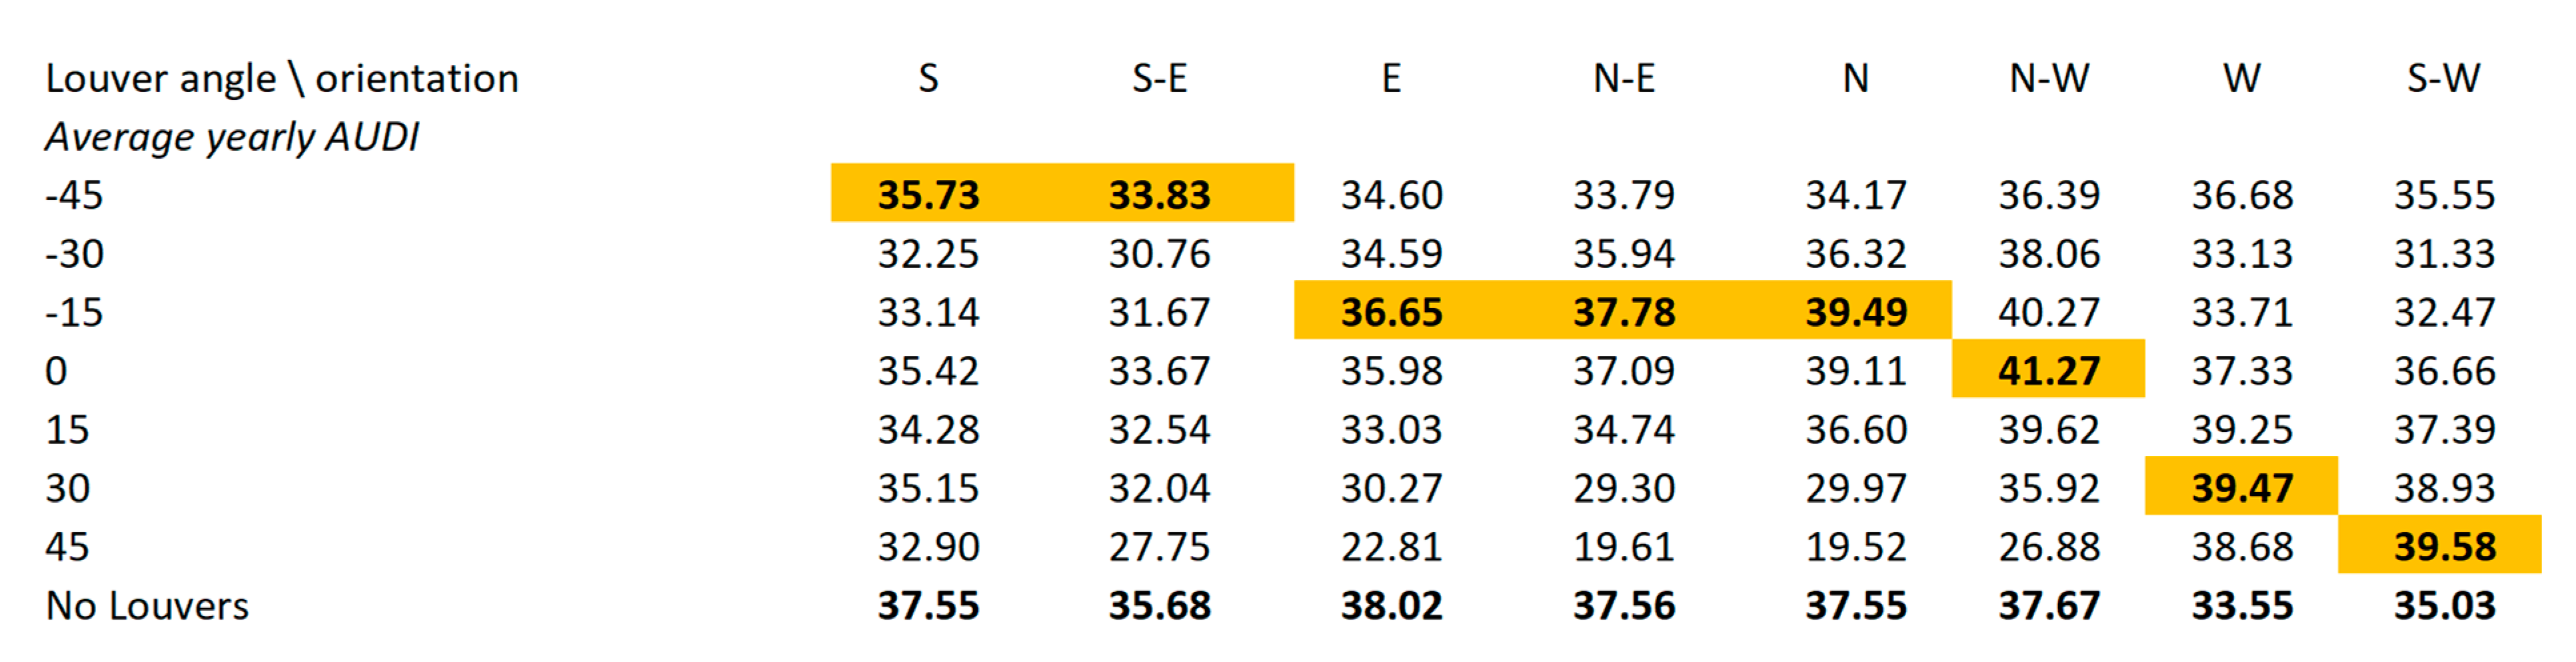
It is important also to note that in conjunction with the specific best results (the suggested best louver position for each month/season/year), the tool and method allow designers to examine alternatives by showing differences in AUDI levels between the various possible positions of the louvers.
Figure 3 shows, for example, that in a yearly average the best louver angle for the southwest (S-W) façade is 45 degrees (39.58 AUDI). However, it also shows that the differences in AUDI between this angle and 30 degrees are very small (0.65 or about 2%). Having this information while designing a louver system gives the designer the ability to better understand the implications of using various alternatives to the suggested optimal louver’s position. Later in the text we also present similar considerations regarding the louver’s operation scenario and geometry.
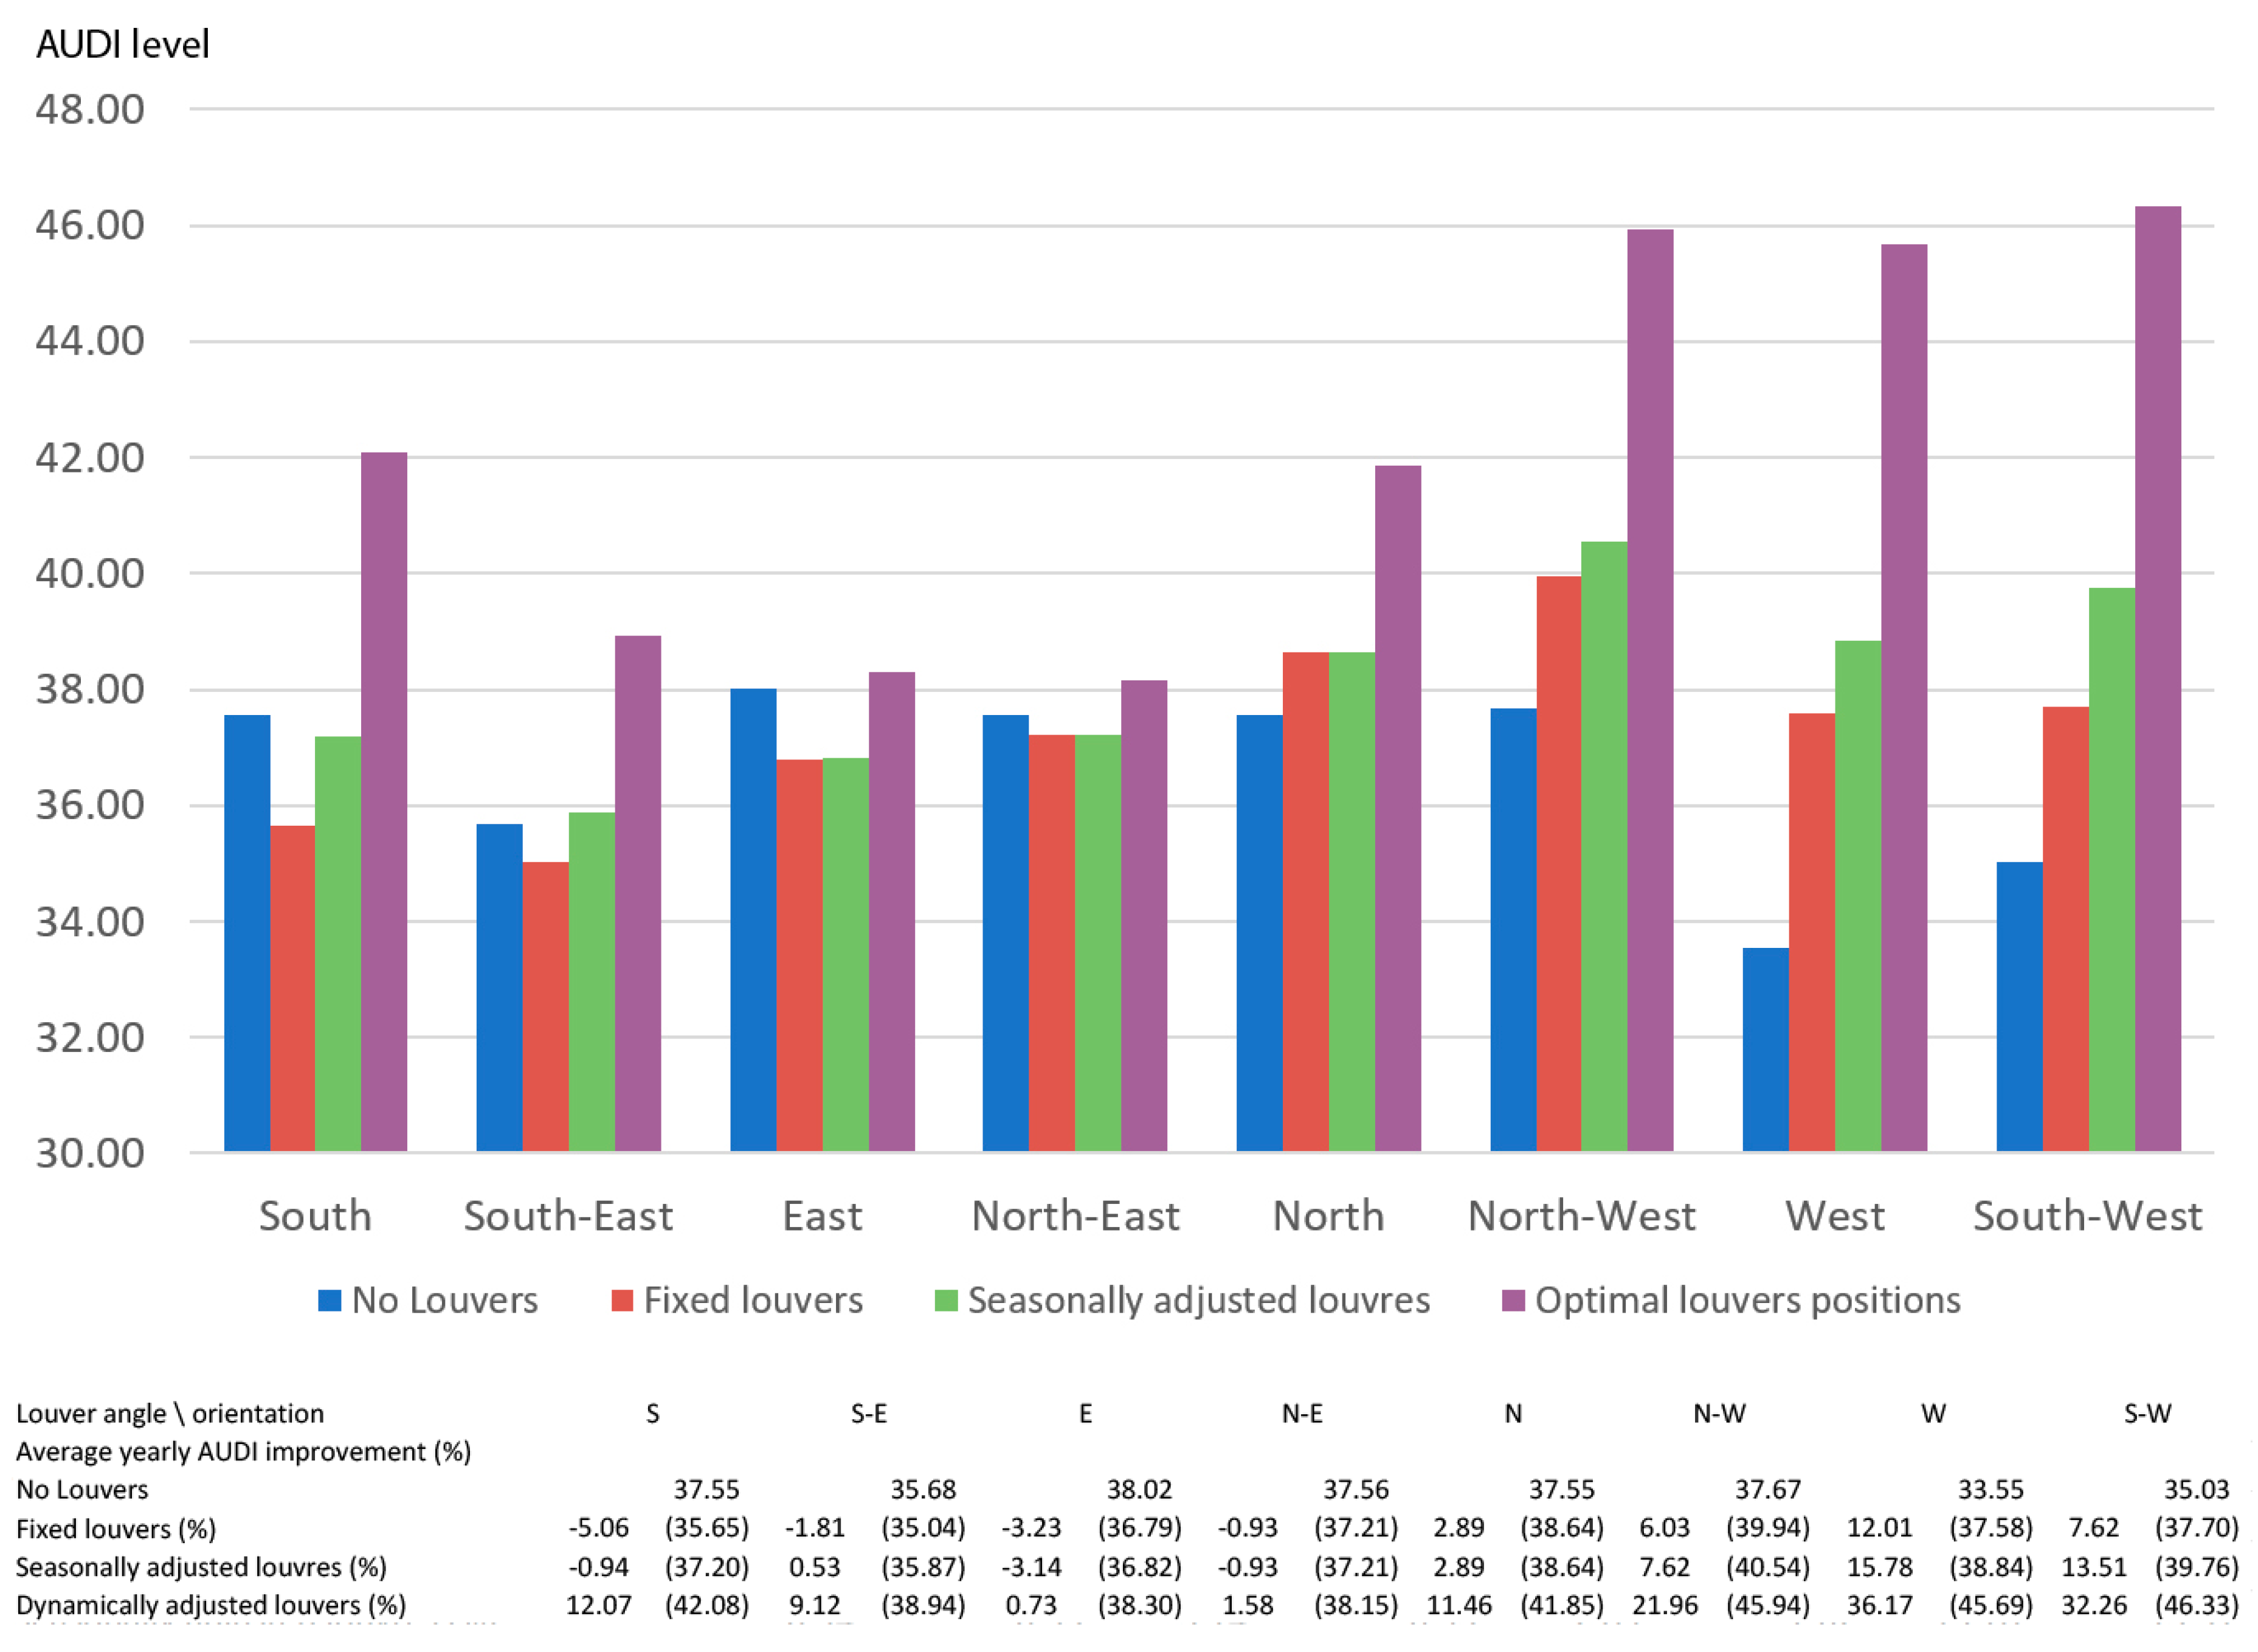
4.2. The Influence of A Vertical Louver’s Geometry and Orientation on Internal Illuminance in Static and Dynamic Modes of Operation
The analysis of the vertical louvers that is presented in
Figure 4 shows surprisingly similar results to those presented in the horizonal louver scenario in terms of the tendencies of the different AUDI orientations. The level of the improvement is, however, slightly lower in the fixed and seasonally adjusted scenarios and higher in the dynamically adjusted louvers scenario:
Fixed louvers: The results show an a small (up to 5%) decrease in the AUDI levels compared to no louvers scenario in the south, southeast, east and northeast orientations and an increase of about 3%–12% in the AUDI levels in the north, northwest, west and southwest orientations.
Seasonally adjusted louvers: The results show that AUDI levels in the south, southeast, east and northeast orientations are similar to those of the no louvers scenario. There is increase in the AUDI levels in the north, northwest, west and southwest orientations between about 3% (north) and 15% (west).
Dynamic louvers: The results show an increase of about 12% and 9% in the south and southeast orientations. As opposed to the previously described increase, the results suggest that the dynamic louvers scenario does not seem to make a significant difference in relation to the no louvers scenario in the east and north east orientations (increases of 0.73% and 1.58%). In the north, north west, west and south west orientations, however, the results show a significant increase in AUDI of about 11%–36%.
4.3. The Influence of Diagonal Louver’s Geometries on Internal Illuminance in Static and Dynamic Modes of Operation
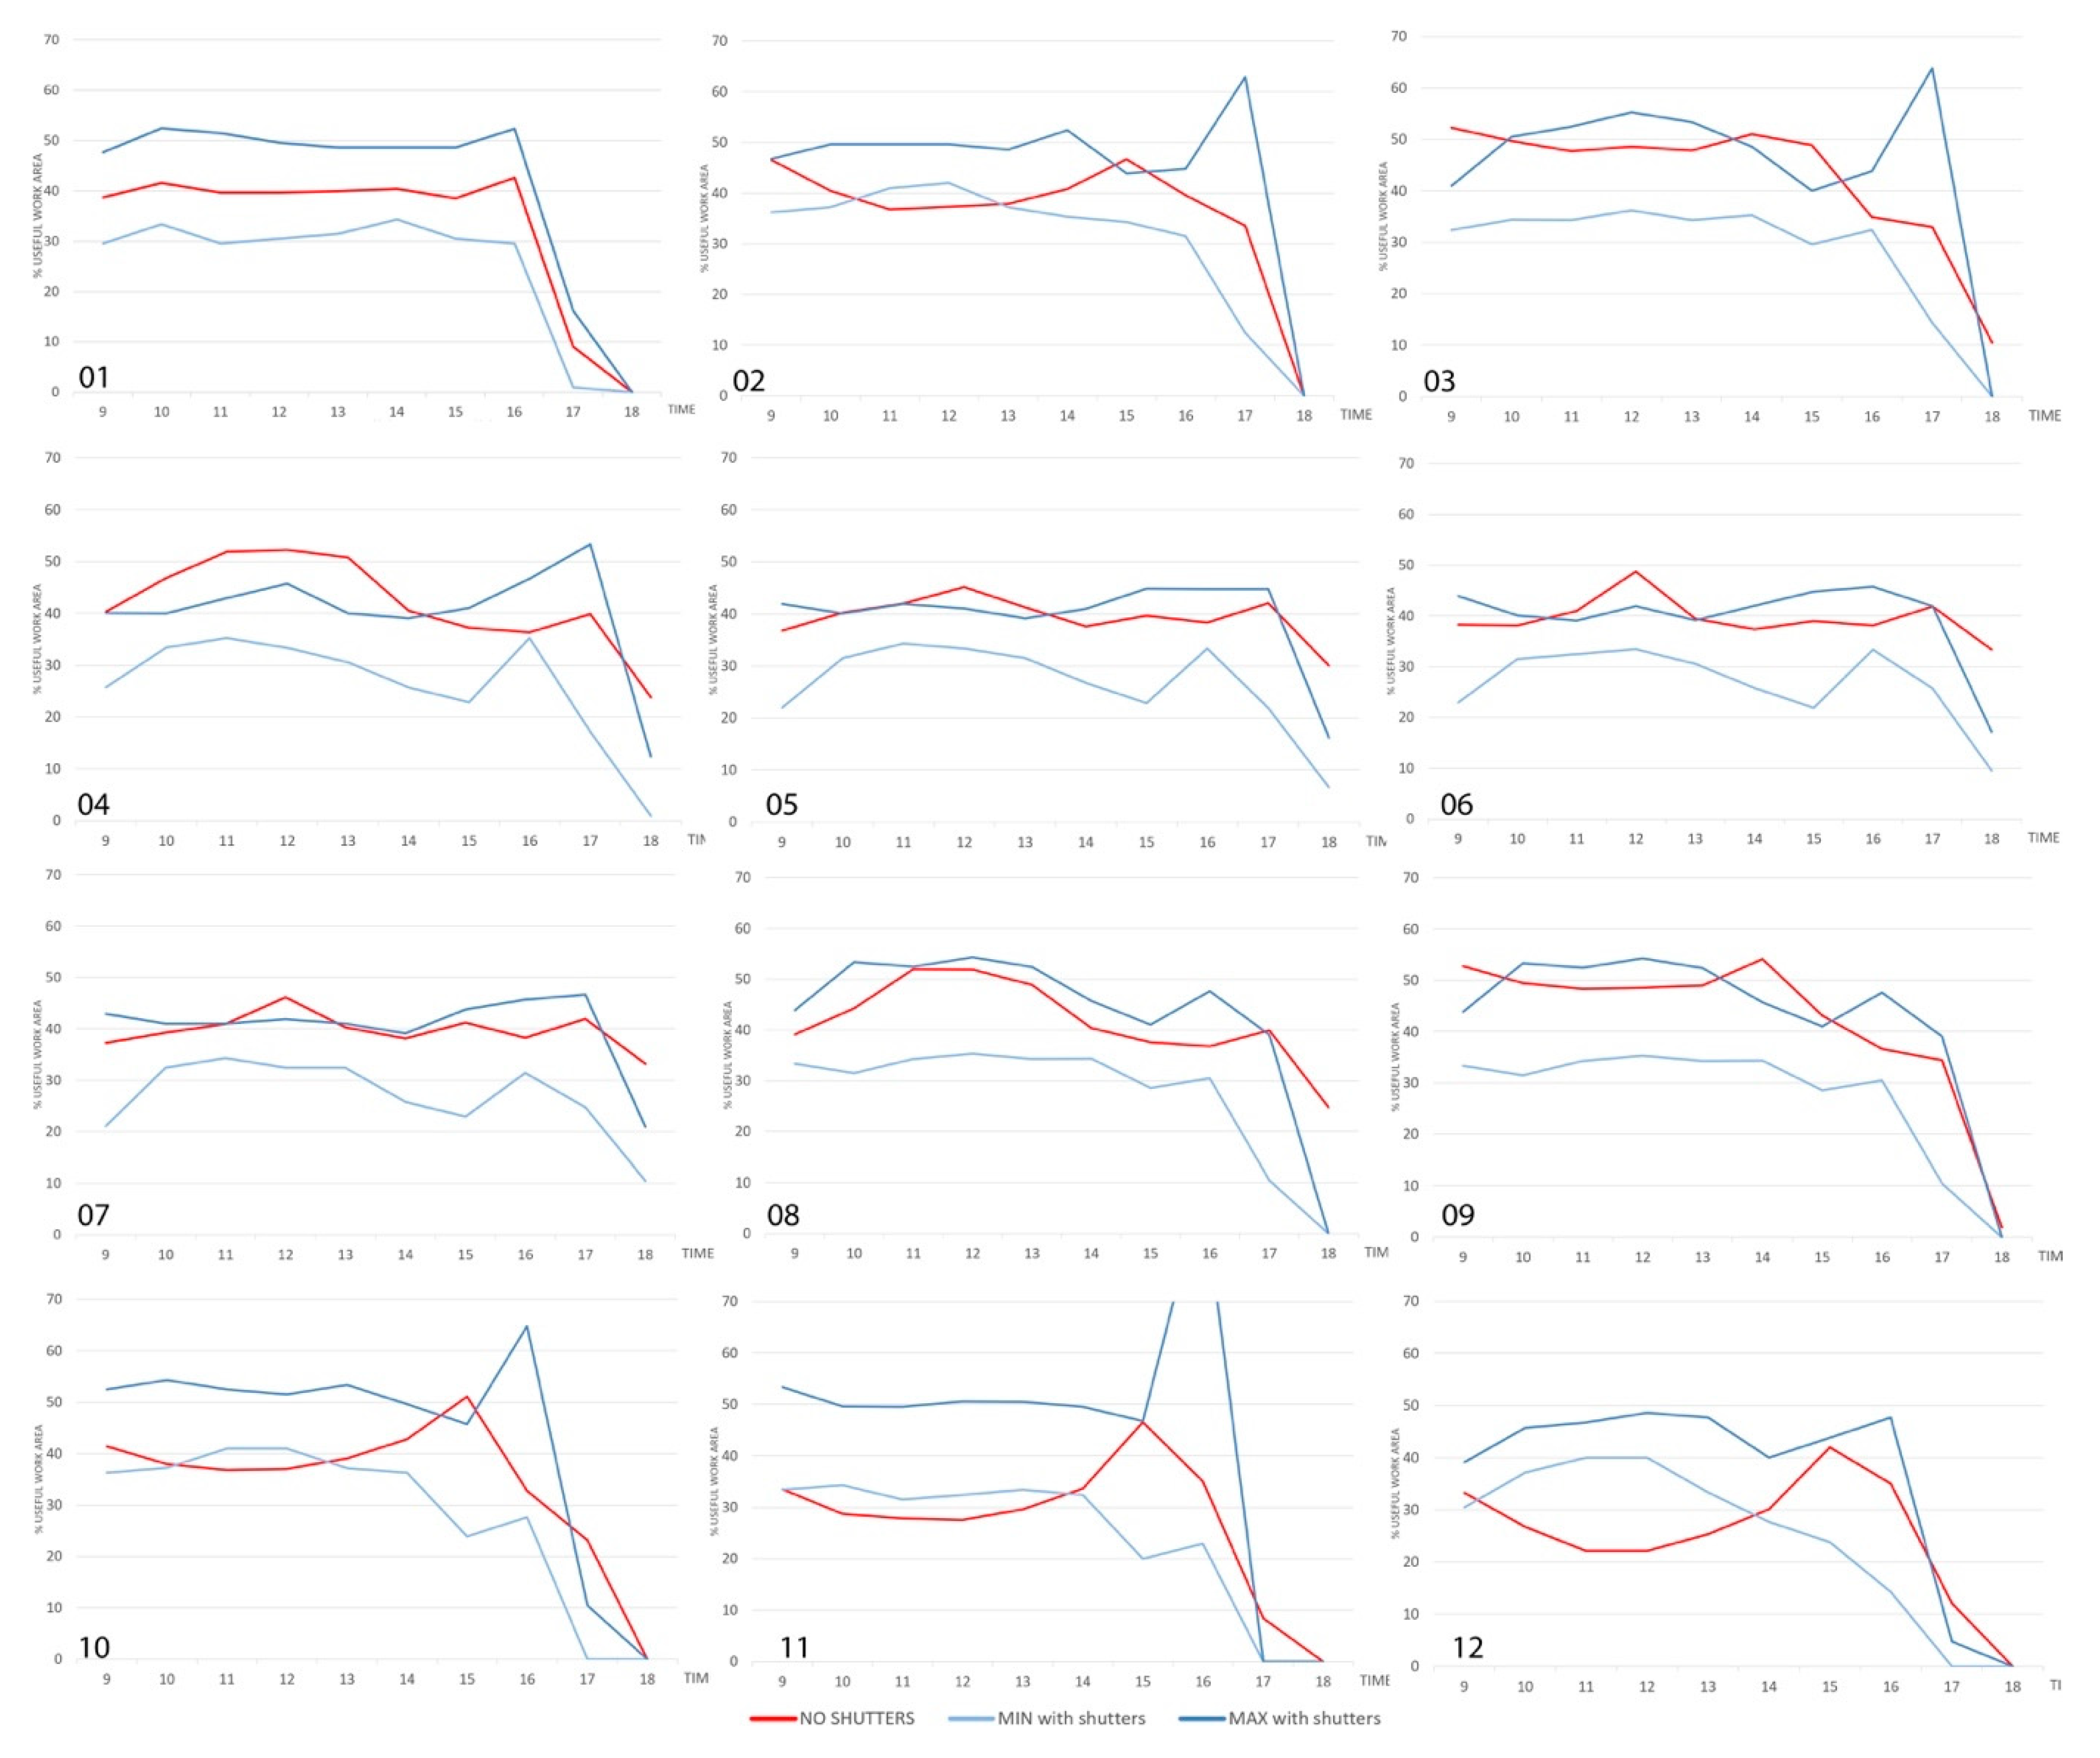
The third geometry that was tested comprised diagonal louvers. An initial analysis compared the influences of the two diagonal directions (left or right inclination). The results of this preliminary analysis showed that the AUDI performance is very close to being symmetrical around noon, with one inclination performing better in the morning and the other in the afternoon (see
Figure 5 for an example of a comparison between two louver inclinations in a south façade on March). Therefore, while it was decided to include only one inclination in the following analysis (right inclination, see
Figure 5), it is clear that when a decision is made to choose diagonal louvers for a façade it is necessary to reexamine both inclinations.
The comparison between average yearly AUDI levels of static and dynamic louver scenarios for diagonal louvers is presented in
Figure 6.
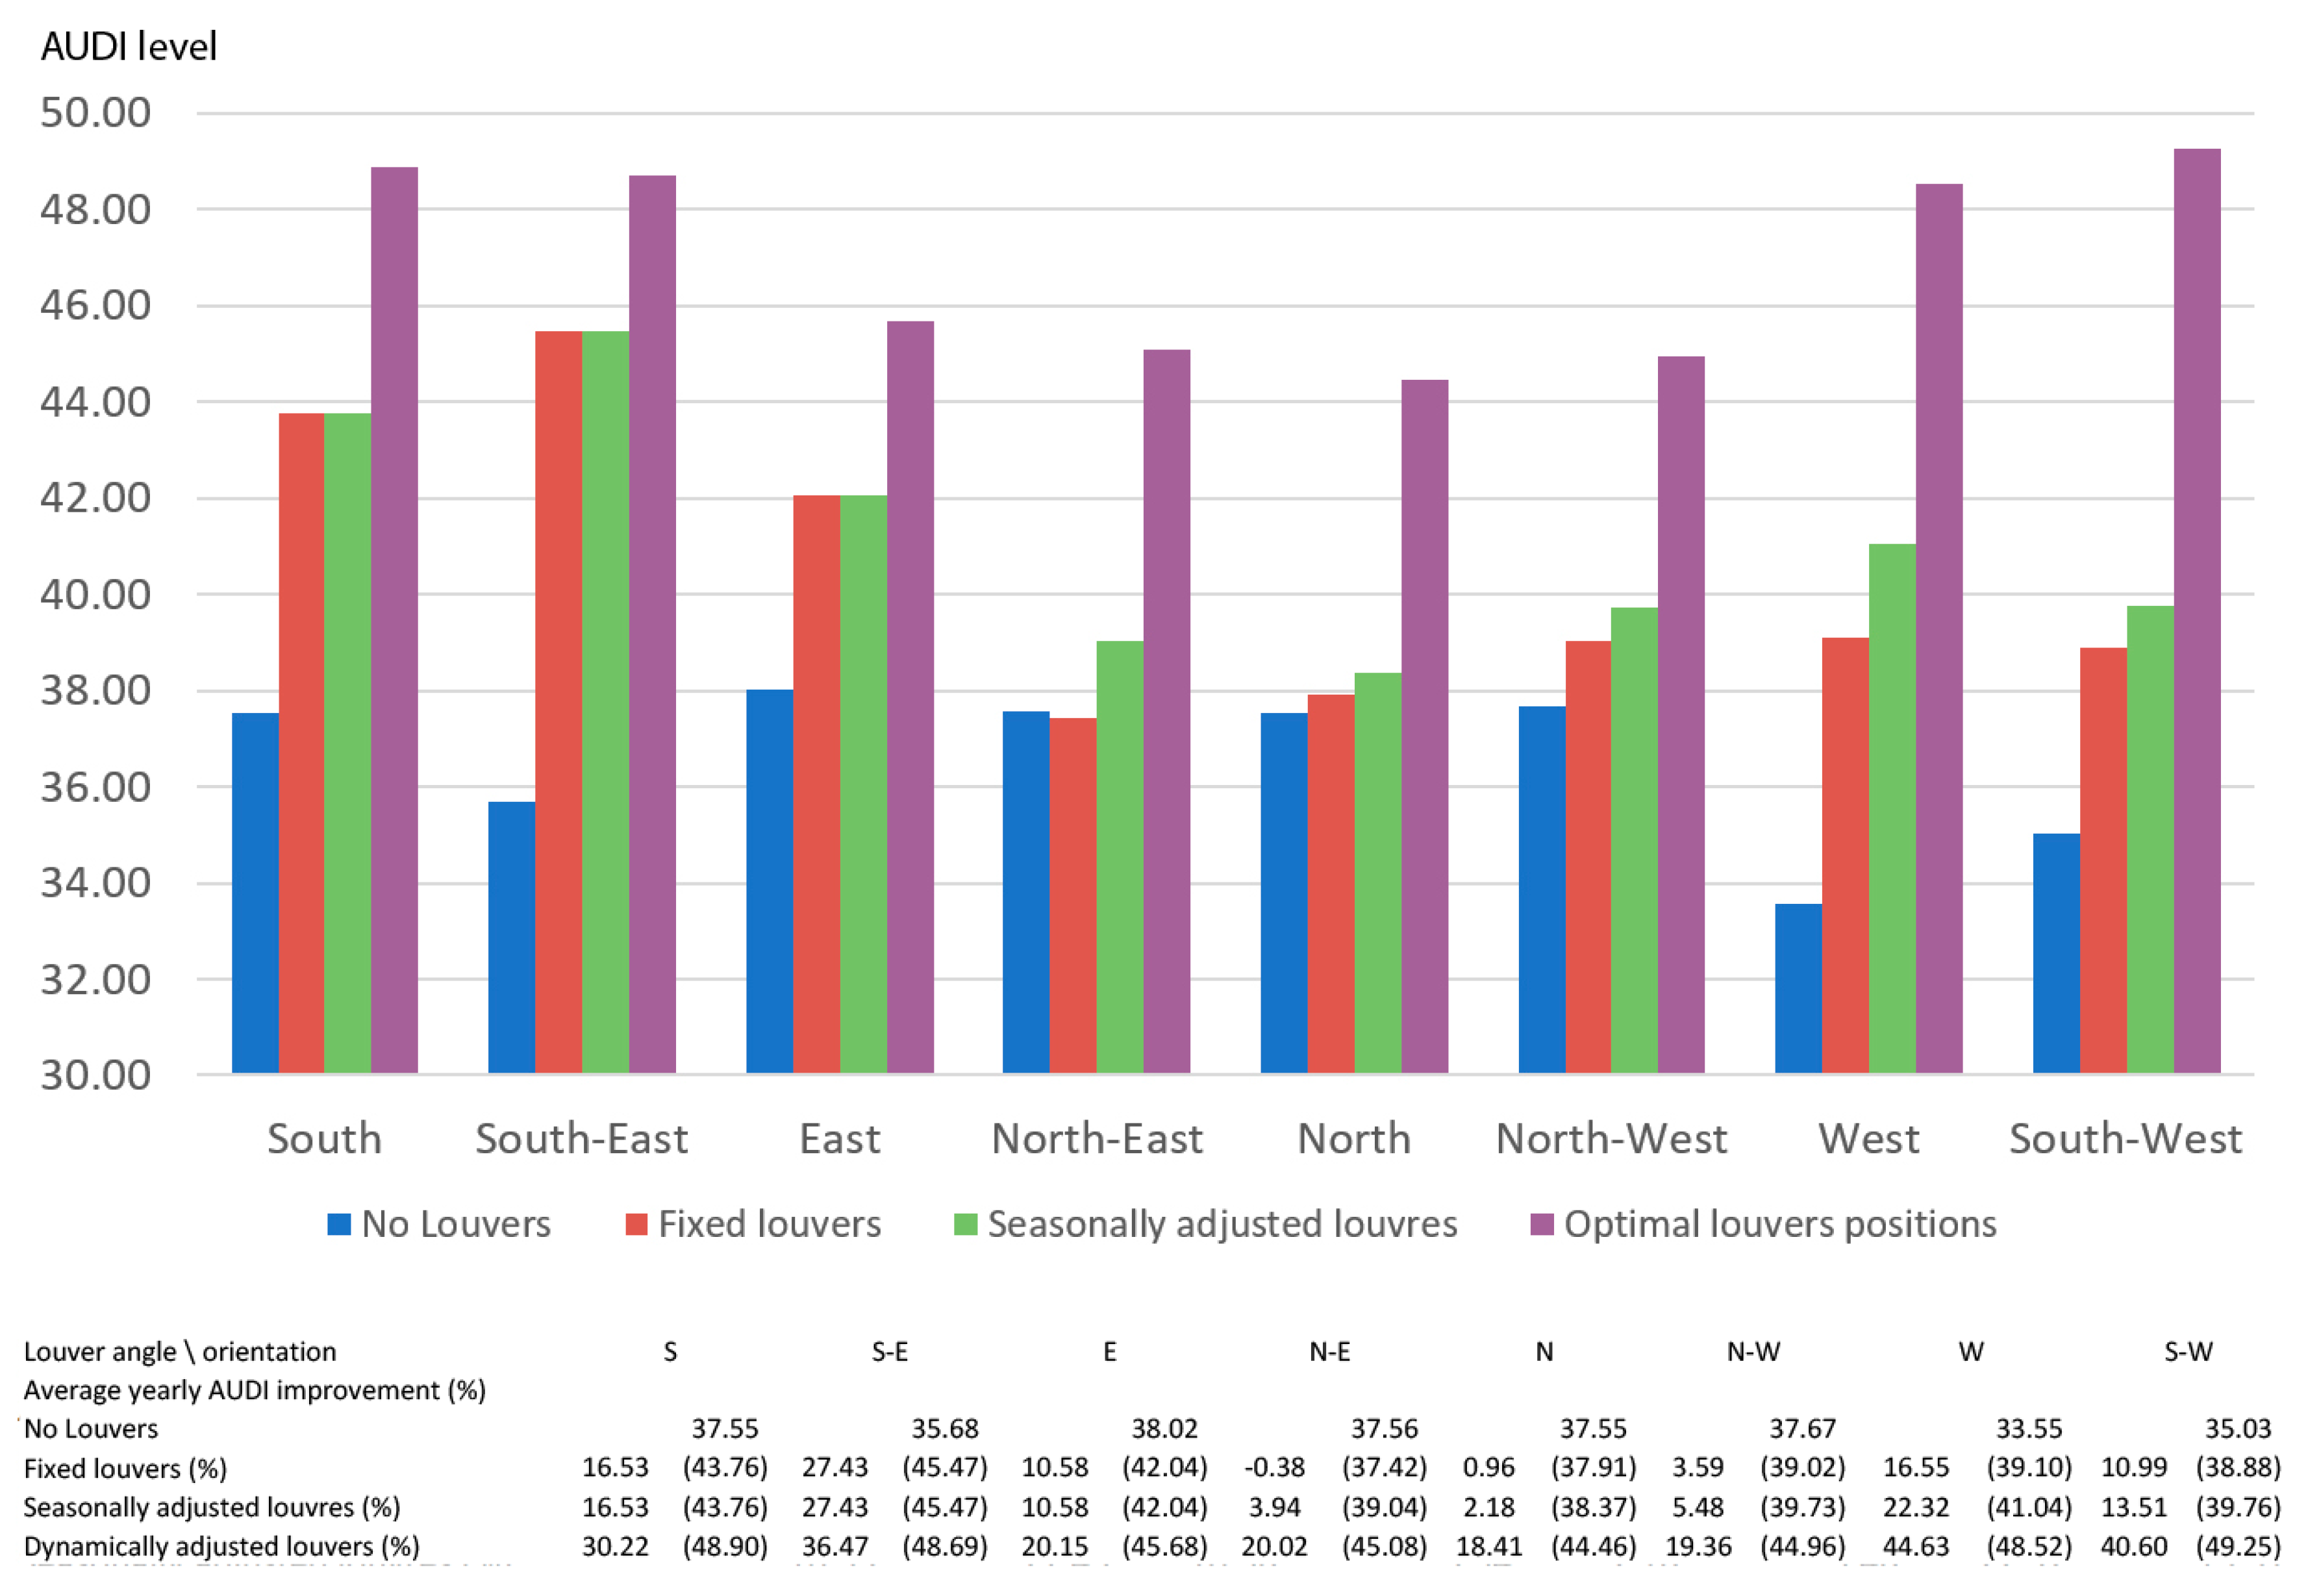
Fixed louvers: The analysis of the diagonal louvers in all orientations besides north and northeast shows between about 10% to 27% improvement in the yearly AUDI level. The AUDI level in the north practically remained unchanged (a decrease of 0.38% in the northeast and an increase of 0.96% in the north).
Seasonally adjusted louvers: The AUDI levels did not change from the fixed louver values in the south, southeast and east orientations. In all the other orientations there was an increase in the AUDI levels of between 1.22% in the north and 5.77% in the west compared to fixed louvers scenario.
Dynamic louvers: The results show a significant increase (in relation to the no louvers scenario) in all orientations of between 18.41% in the east and 44.63% in the west.
5. Comparing the Performances of Various Louver Scenarios
The second part of the analysis compared the impacts of the examined geometries and scenarios on the AUDI values for each of the eight examined orientations.
5.1. Comparing the Performances of Various Louver Setups in the Fixed Louvers Scenario
Figure 7 presents a comparison between AUDI results of all the geometries in a fixed louvers scenario.
The results show that the type of louver has a small effect (up to about ±5%) in northeast and north orientations.
In the west and southwest façade orientations fixed louvers increase the AUDI levels by between 7.62% (vertical) and 17.65% (horizonal). Horizontal louvers show the best AUDI levels, but their results are only 1%–2% better than diagonal louvers.
Of particular interest is the behavior of the fixed louvers in the south and southeast facades. The AUDI results in these orientations show that diagonal louvers perform better than horizontal ones. For southeast this is true for vertical louvers as well. These results which consider light distribution in the office stand in contradiction with the architectural rules of thumb and textbook recommendations of employing horizontal louvers is the south façade [
20].
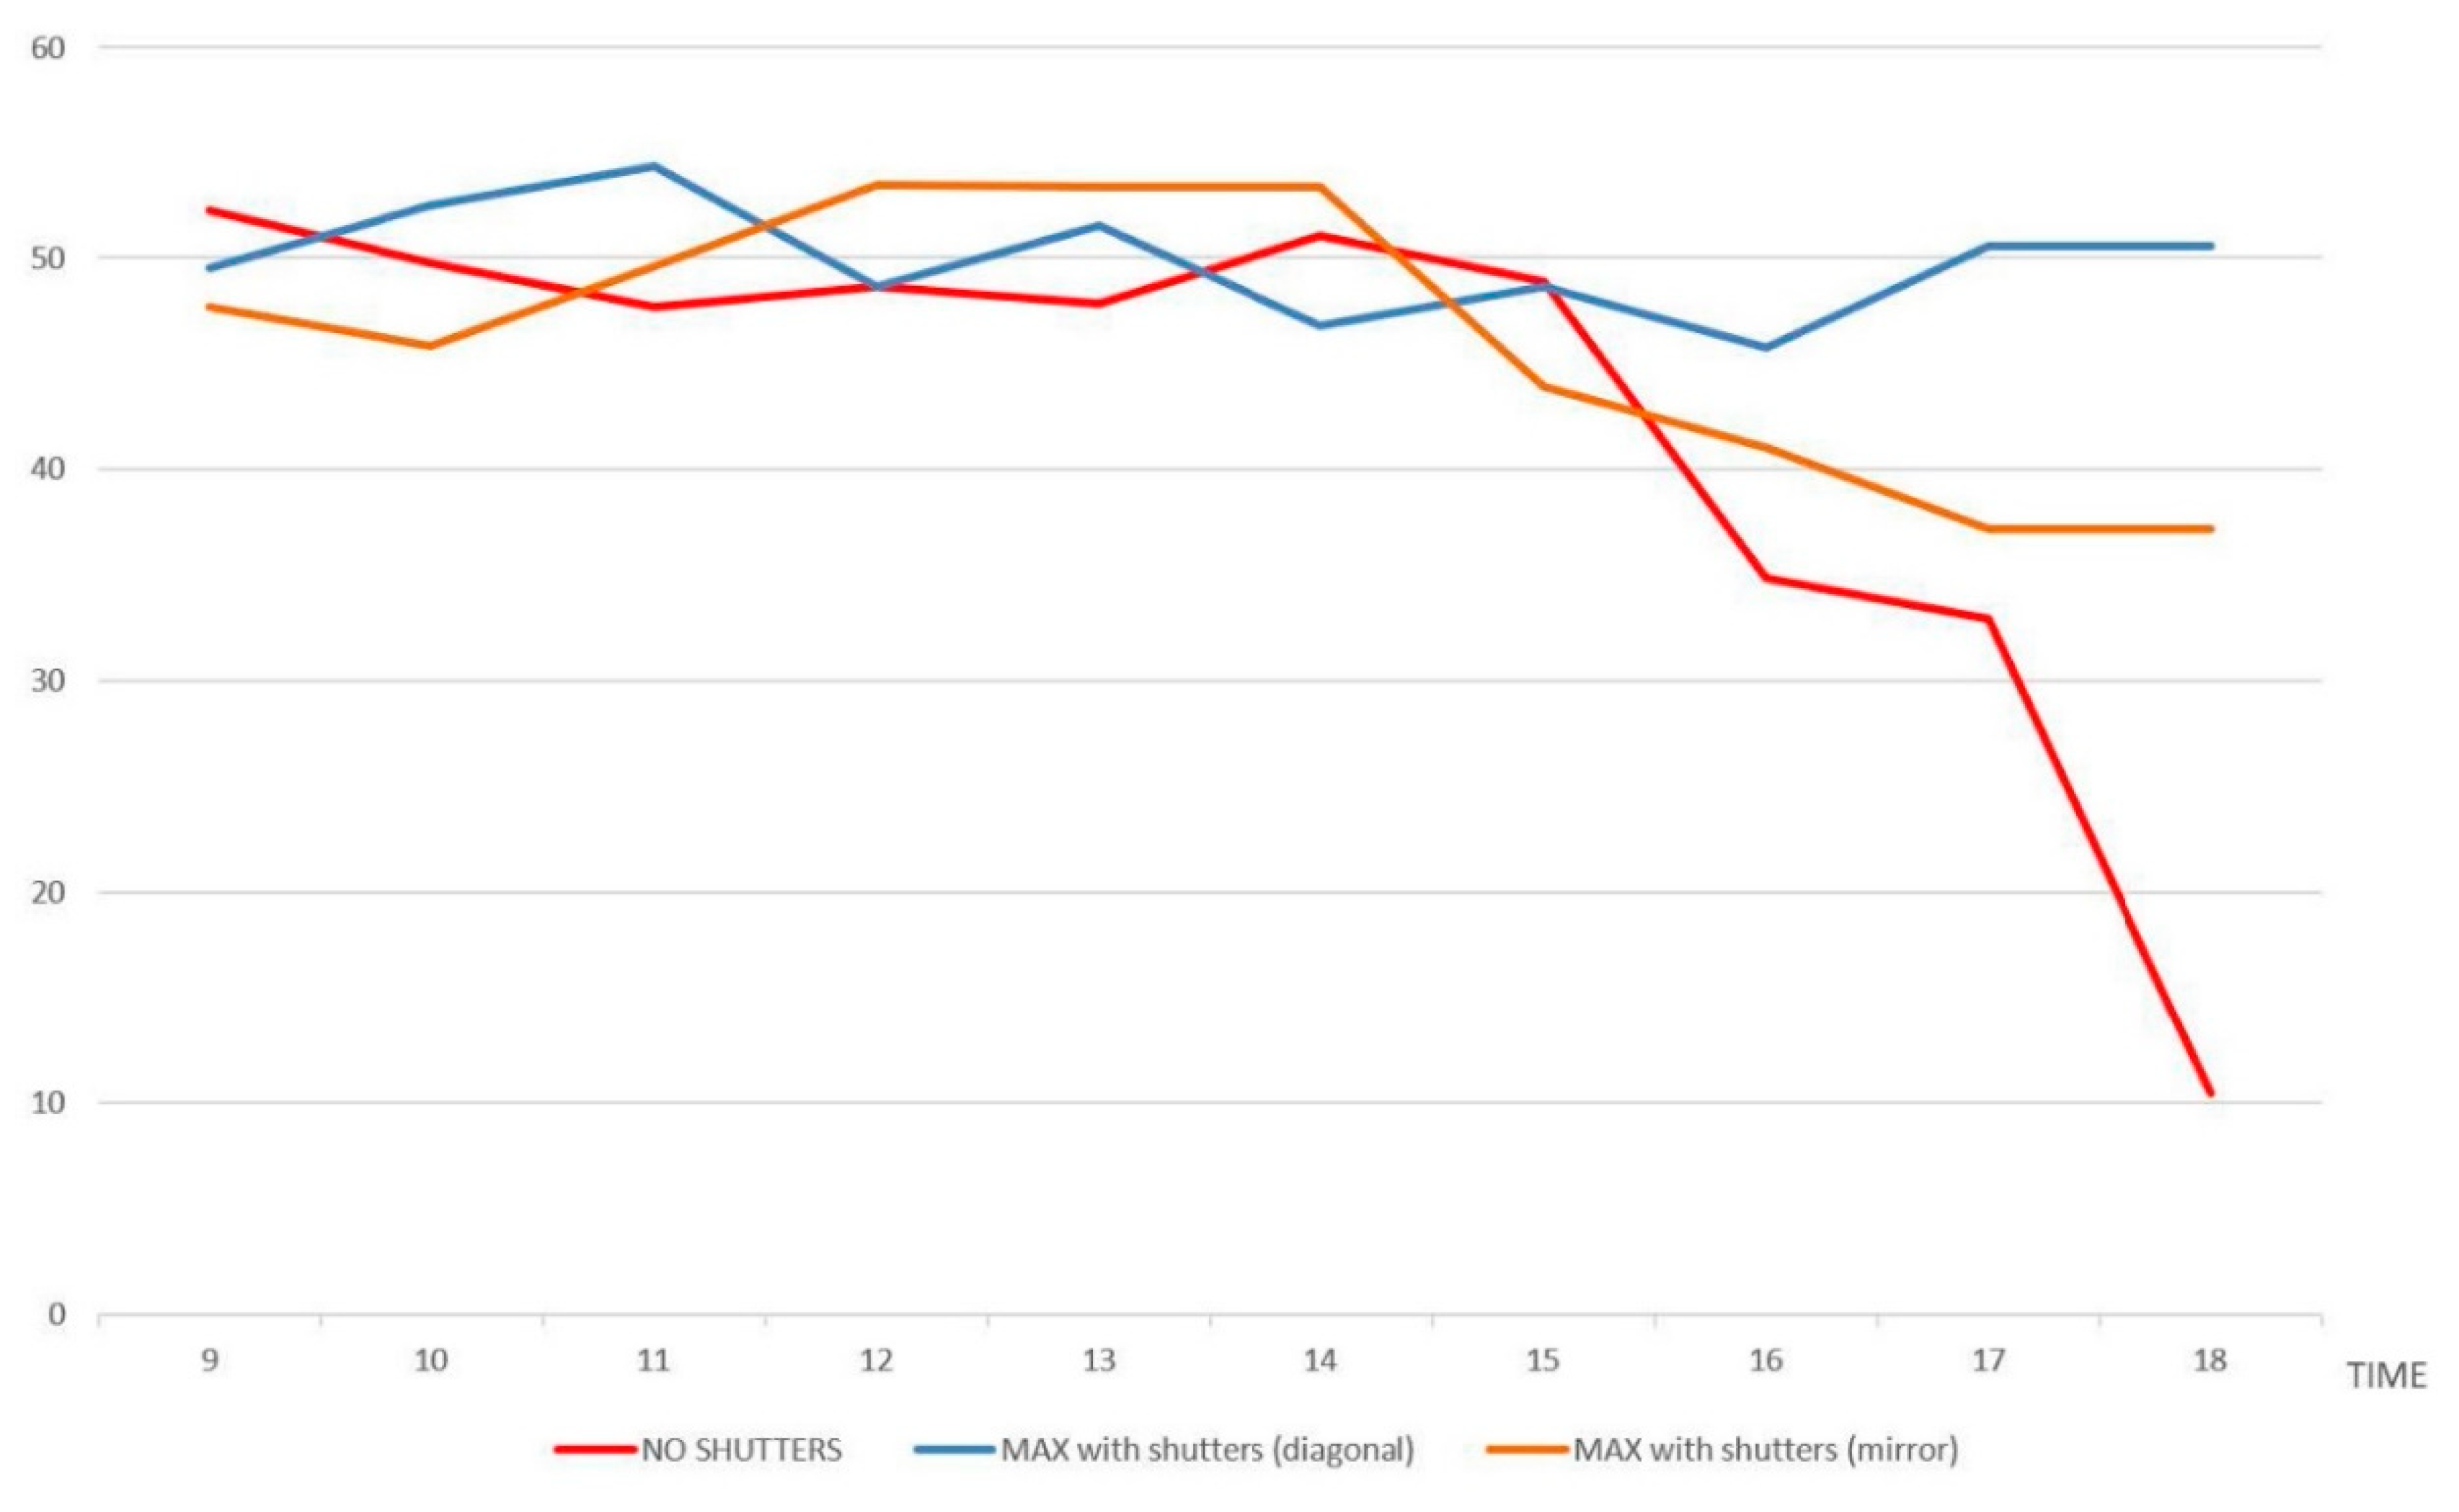
A deeper examination of the results revealed that the change from the traditional recommendation is a result of a high AUDI level at 16:00 in the months of February–April and October–November in the vertical and diagonal scenarios (see
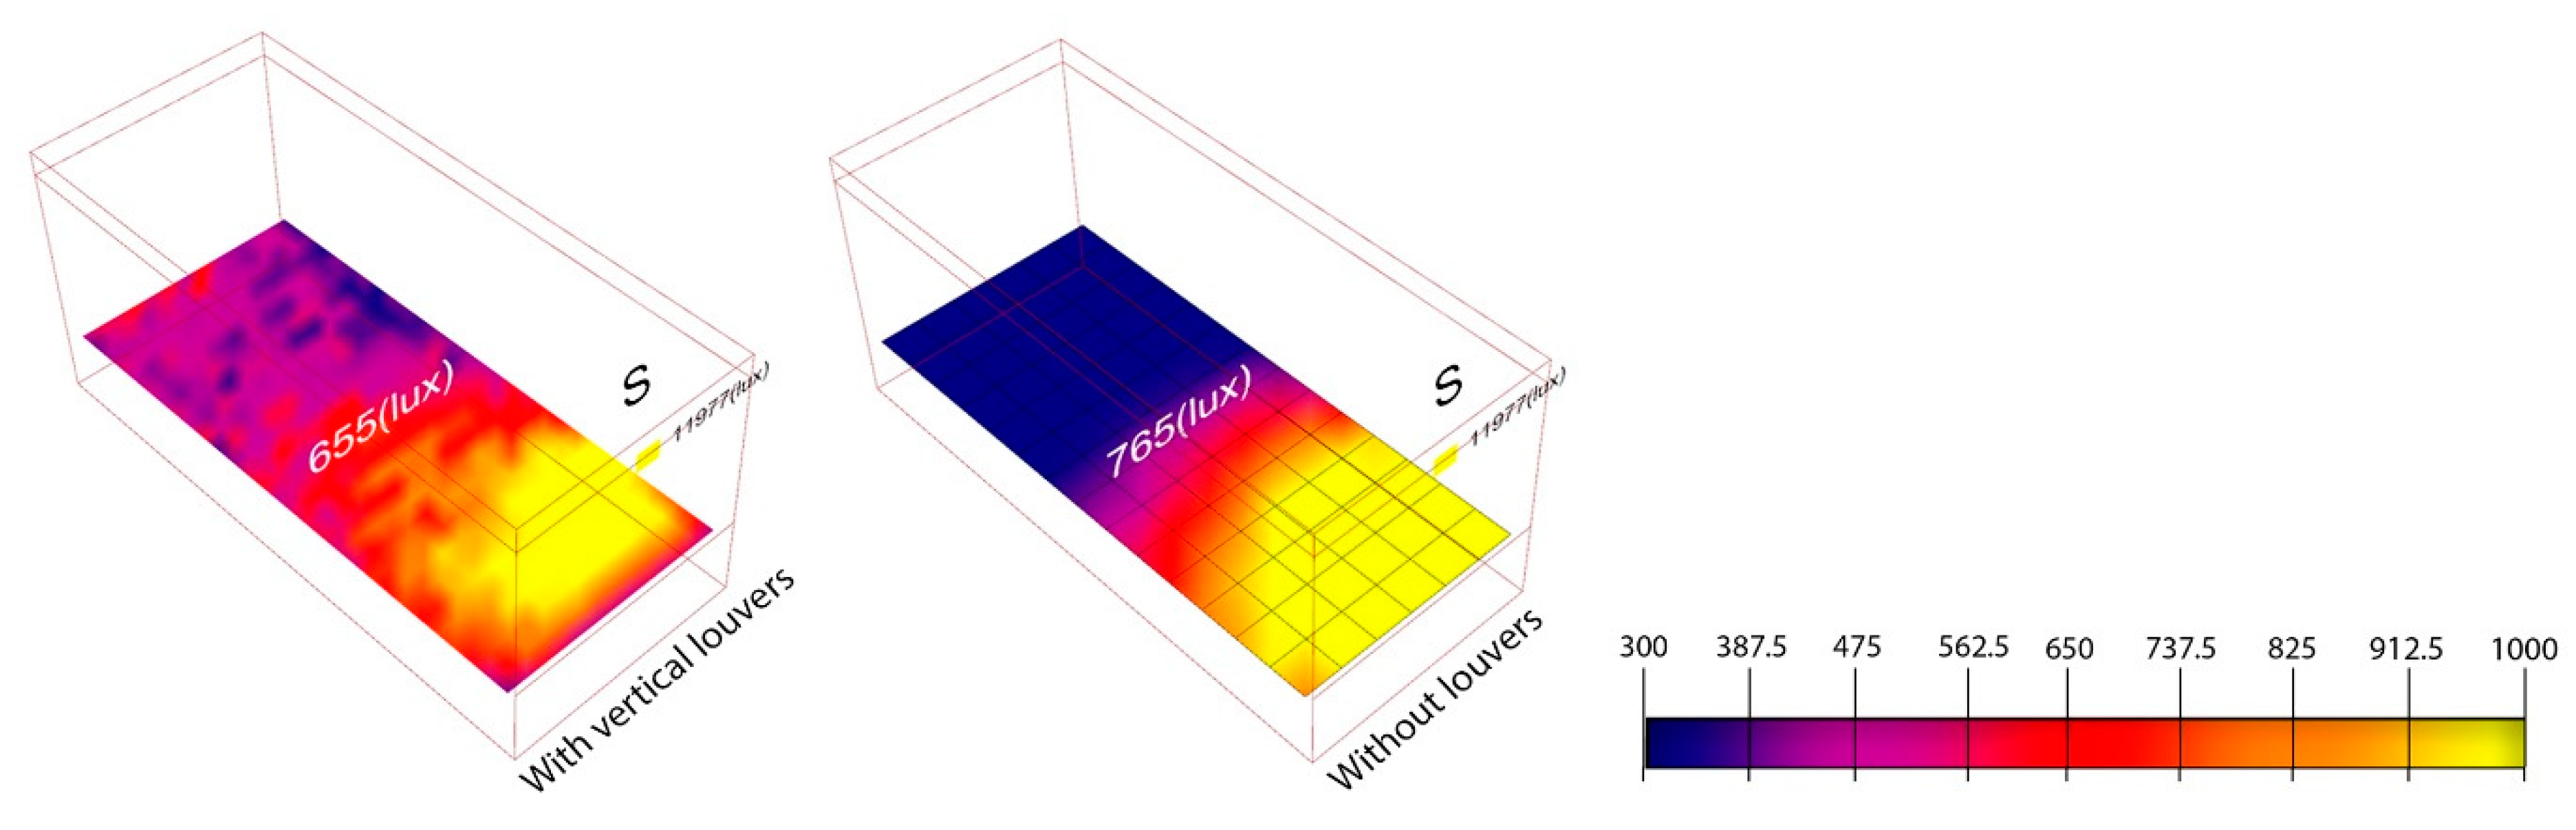
Figure 8). The high AUDI level in these months in the fixed louver scenario can be explained by the fact that in the afternoon the vertical louvers reflect the light towards the far end of the examined room and that the direct illuminance does not exceed the limit of 1000 lux. For example,
Figure 9 shows a comparison of the illuminance distribution in a tested southern office in these conditions in November 16:00 with and without vertical louvers. The figure shows that with vertical louvers almost 100% of the examined cells are within the limits of 300–1000 lux, while the scenario without suffers from lack of illuminance in the back of the room.
It is interesting to note that when the examined period is modified from 9:00–18:00 to 9:00–15:00 the simulation results show the expected higher AUDI values for horizontal louvers in the south façade (and also in the southeast and southwest; see
Figure 10). This means that the definition of the operation hours is crucial to the decision regarding the louver position. It also suggests that the option to set a general rule or a rule of thumbs regarding louver type and position for these orientations in a fixed louver scenario is questionable and that the specific design needs to be examined comprehensively in relation to the programmatic demands in order to decide on preferable louver type and position.
5.2. Comparing the Performances of Various Louver Setups in the Seasonally Adjusted Louvers Scenario
The results show that the louver setup has an effect of up to between 2.18%–10.84% on the AUDI levels in the north and northwest orientations and 13.51%–24.97% in the west and southwest orientations. Horizontal louvers in these orientations perform better than all other geometries with a difference of about 5% in from the vertical and diagonal louvers (see
Figure 11).
In all other orientations diagonal louvers perform better, with an increase of the AUDI levels, which range from 3.94% in the northeast up to 27.43% in the southeast in relation to the vertical/horizonal louvers (see
Figure 11).
5.3. Comparing the Performances of Various Louver Setups in the Dynamic Louvers Scenario
The results show that although the louvers in the dynamic scenario perform much better than in no louver scenario (up to roughly 50% increase in AUDI), the difference in AUDI levels between all the examined geometries stays within the limit of about 20%. It also shows that while in some orientations, such as northwest, there is a small difference between the performance of the different geometries, in other orientations, such as southeast, there is a significant difference between all three geometries (see
Figure 12).
6. Conclusions
The research examined dynamic measurements of daylighting in external shading considering different geometries and both static and dynamic activation scenarios. The analysis was conducted on a typical office space in a Mediterranean climate.
In terms of the activation scenarios the results show that dynamically adjusted louvers perform significantly better than the other examined modes of operation (about 6%–34% better than the other scenarios in the horizontal louvers; 2%–25% better than the other scenarios in the vertical louvers and 9%–28% better than the other scenarios in the diagonal louvers). The AUDI level in the comparison to the no louvers scenario was up to about 12% better in the east and northeast; about 24% better in the north, south and southeast; and up to about 51% better in the northwest, west and southwest orientations.
In relation to the louver’s geometry the results show that amongst the examined louver types, horizonal louvers perform better in the north, northwest, west and southwest. In these orientations, diagonal louvers reach an AUDI level of up to about 5% lower than the horizontal louvers. Vertical louvers reach much lower AUDI level—up to about 15% lower than the horizontal or vertical louvers.
Vertical louvers perform the best only in the northwest in the dynamically controlled scenario.
The results show that in the south, southeast, east and northeast orientations the best performing geometry is diagonal louvers. In these orientations diagonal louver reaches AUDI level of up to about 28% higher than the horizontal louvers, which is, in almost all cases, the second place in terms of AUDI level.
One of the most interesting insights that are raised by this research is related to the notion of rules of thumb. Rules of thumb are a fast substitute to simulation that are usually used in the early stages of the design process, or when conducting a simulation requires time and knowledge resources that are beyond the scope of the design team. The research has shown that in some conditions the existing rules of thumb fail to predict the most favorable design approach. It raises the question whether the increasing availability and speed of current simulation tools calls for a re-evaluation of the need for rules of thumb?
Due to our findings, we believe that several future research directions can be of importance to this field. The first direction is to combine the methods presented in this paper with an energy model of an office room in order to understand the integrated thermal-visual effect of the geometry and the operation scenarios on the energy performance of offices in different climatic zones. Since there is a close relationship between shading elements, direct solar radiation penetrating the space and available daylight, the comparison between results presented here and those considering thermal aspects will enrich the recommendations. This could be done by using existing energy tools, or, by developing an integrative tool that works within the frame of the method that was developed for this research.
Additionally, we note that in the cases described by this research, an optimal louver operation scenario is arrived at by simulating the louver behavior all throughout the year and then pre-programming the louvers to adjust according to the simulation results. However, the optimality of these results assumes that there are no obstructions in front of the windows, and that that the sky is continuously clear. As this is clearly not the case, a second research direction could examine the impact of obstructions, such as clouds, trees and adjacent buildings on the results and evaluate the cost-effectiveness of autonomous modes of operation of rooms of individual louvers. A framework for this research direction was suggested by Yekutiel Pankratov and Grobman [
21].
The current results and the future research directions will contribute to development of sustainable buildings by increasing the use of natural light in buildings and decreasing the energy consumption. It is yet another step towards improving the understanding of the relationship between architectural geometry and its influence on the building performance.
Author Contributions
Conceptualization, Y.J.G.; methodology, Y.J.G., I.G.C. and G.A.; software, G.A. and Y.H.; validation, I.G.C., G.A. and Y.H.; formal analysis, Y.J.G., I.G.C., G.A. and Y.H.; writing—original draft preparation, Y.J.G.; writing—review and editing, Y.J.G., I.G.C. and G.A.; visualization, G.A. and Y.H.; project administration, Y.J.G.; funding acquisition, Y.J.G. All authors have read and agreed to the published version of the manuscript.
Funding
This research was funded by Israeli Science Foundation, grant number 573/14.
Conflicts of Interest
The authors declare no conflict of interest. The funders had no role in the design of the study; in the collection, analyses, or interpretation of data; in the writing of the manuscript, or in the decision to publish the results.
References
- Kasinalis, C.; Loonen, R.C.G.M.; Cóstola, D.; Hensen, J.L.M. Framework for assessing the performance potential of seasonally adaptable facades using multi-objective optimization. Energy Build. 2014, 79, 106–113. [Google Scholar] [CrossRef]
- Moloney, J. Designing Kinetics for Architectural Facades: State Change, 1st ed.; Routledge: Abingdon, UK, 2011; ISBN 0-415-61034-6. [Google Scholar]
- Bakker, L.G.; Hoes-van Oeffelen, E.C.M.; Loonen, R.C.G.M.; Hensen, J.L.M. User satisfaction and interaction with automated dynamic facades: A pilot study. Build. Environ. 2014, 78, 44–52. [Google Scholar] [CrossRef]
- O’Brien, W.; Kapsis, K.; Athienitis, A.K. Manually-operated window shade patterns in office buildings: A critical review. Build. Environ. 2013, 60, 319–338. [Google Scholar] [CrossRef]
- Reinhart, C.F.; Mardaljevic, J.; Rogers, Z. Dynamic Daylight Performance Metrics for Sustainable Building Design. LEUKOS 2006, 3, 7–31. [Google Scholar] [CrossRef]
- Kirimtat, A.; Koyunbaba, B.K.; Chatzikonstantinou, I.; Sariyildiz, S. Review of simulation modeling for shading devices in buildings. Renew. Sustain. Energy Rev. 2016, 53, 23–49. [Google Scholar] [CrossRef]
- Grobman, Y.J.; Capeluto, I.G.; Austern, G. External shading in buildings: Comparative analysis of daylighting performance in static and kinetic operation scenarios. Archit. Sci. Rev. 2017, 60, 126–136. [Google Scholar] [CrossRef]
- Konstantoglou, M.; Tsangrassoulis, A. Dynamic operation of daylighting and shading systems: A literature review. Renew. Sustain. Energy Rev. 2016, 60, 268–283. [Google Scholar] [CrossRef]
- Eltaweel, A.; Su, Y. Evaluation of Suitability of a Parametrically Controlled Louvers for Various Orientations throughout a Year Comparing to an Existing Case. Buildings 2017, 7, 109. [Google Scholar] [CrossRef]
- Eltaweel, A.; Yuehong, S. Using integrated parametric control to achieve better daylighting uniformity in an office room: A multi-Step comparison study. Energy Build. 2017, 152, 137–148. [Google Scholar] [CrossRef]
- Al-Masrani, S.M.; Al-Obaidi, K.M.; Zalin, N.A.; Aida Isma, M.I. Design optimisation of solar shading systems for tropical office buildings: Challenges and future trends. Sol. Energy 2018, 170, 849–872. [Google Scholar] [CrossRef]
- Uribe, D.; Bustamante, W.; Vera, S. Potential of perforated exterior louvers to improve the comfort and energy performance of an office space in different climates. Build. Simul. 2018, 11, 695–708. [Google Scholar] [CrossRef]
- Lee, K.S.; Han, K.J.; Lee, J.W. The Impact of Shading Type and Azimuth Orientation on the Daylighting in a Classroom-Focusing on Effectiveness of Façade Shading, Comparing the Results of DA and UDI. Energies 2017, 10, 635. [Google Scholar] [CrossRef]
- Boubekri, M.; Lee, J. A comparison of four daylighting metrics in assessing the daylighting performance of three shading systems. J. Green Build. 2017, 12, 39–53. [Google Scholar] [CrossRef]
- Jakubiec, J.A.; Reinhart, C.F. DIVA 2.0: Integrating Daylight and Thermal Simulations Using Rhinoceros 3D, Daysim and Energy Plus. In Proceedings of the 12th Conference of International Building Performance Simulation Association, Sidney, Australia, 14–16 November 2011; pp. 2202–2209. [Google Scholar]
- Ochoa, C.E.; Capeluto, I.G. Evaluating visual comfort and performance of three natural lighting systems for deep office buildings in highly luminous climates. Build. Environ. 2006, 41, 1128–1135. [Google Scholar] [CrossRef]
- Nabil, A.; Mardaljevic, J. Useful daylight illuminance: A new paradigm for assessing daylight in buildings. Lighting Res. Technol. 2005, 37, 41–57. [Google Scholar] [CrossRef]
- Nabil, A.; Mardaljevic, J. Useful daylight illuminances: A replacement for daylight factors. Energy Build. 2006, 38, 905–913. [Google Scholar] [CrossRef]
- LEED v4 for Interior Design and Construction Checklist|U.S. Green Building Council. Available online: http://www.usgbc.org/resources/leed-v4-interior-design-and-construction-checklist (accessed on 5 November 2015).
- Lechner, N. Heating, Cooling, Lighting: Design Methods for Architects, 2nd ed.; Wiley: New York, NY, USA, 2001; ISBN 0-471-24143-1. [Google Scholar]
- Yekutiel Pankratov, T.; Grobman, J.Y. Controlling Kinetic Cladding Components in Building Façades: A Case for Autonomous Movement. Available online: http://cumincad.scix.net/cgi-bin/works/Show?_id=caadria2014_095&sort=DEFAULT&search=%2Fseries%3A%22CAADRIA%22&hits=1330 (accessed on 3 December 2015).
© 2020 by the authors. Licensee MDPI, Basel, Switzerland. This article is an open access article distributed under the terms and conditions of the Creative Commons Attribution (CC BY) license (http://creativecommons.org/licenses/by/4.0/).


