Optimising Embodied Energy and Thermal Performance of Thermal Insulation in Building Envelopes via an Automated Building Information Modelling (BIM) Tool


Abstract
1. Introduction and Literature Review
1.1. Insulation Design as a Multi-Objective Optimisation Problem
1.2. A Building Information Modelling (BIM)-Integrated Optimisation Approach to Support Decision-Making
2. Materials and Methods
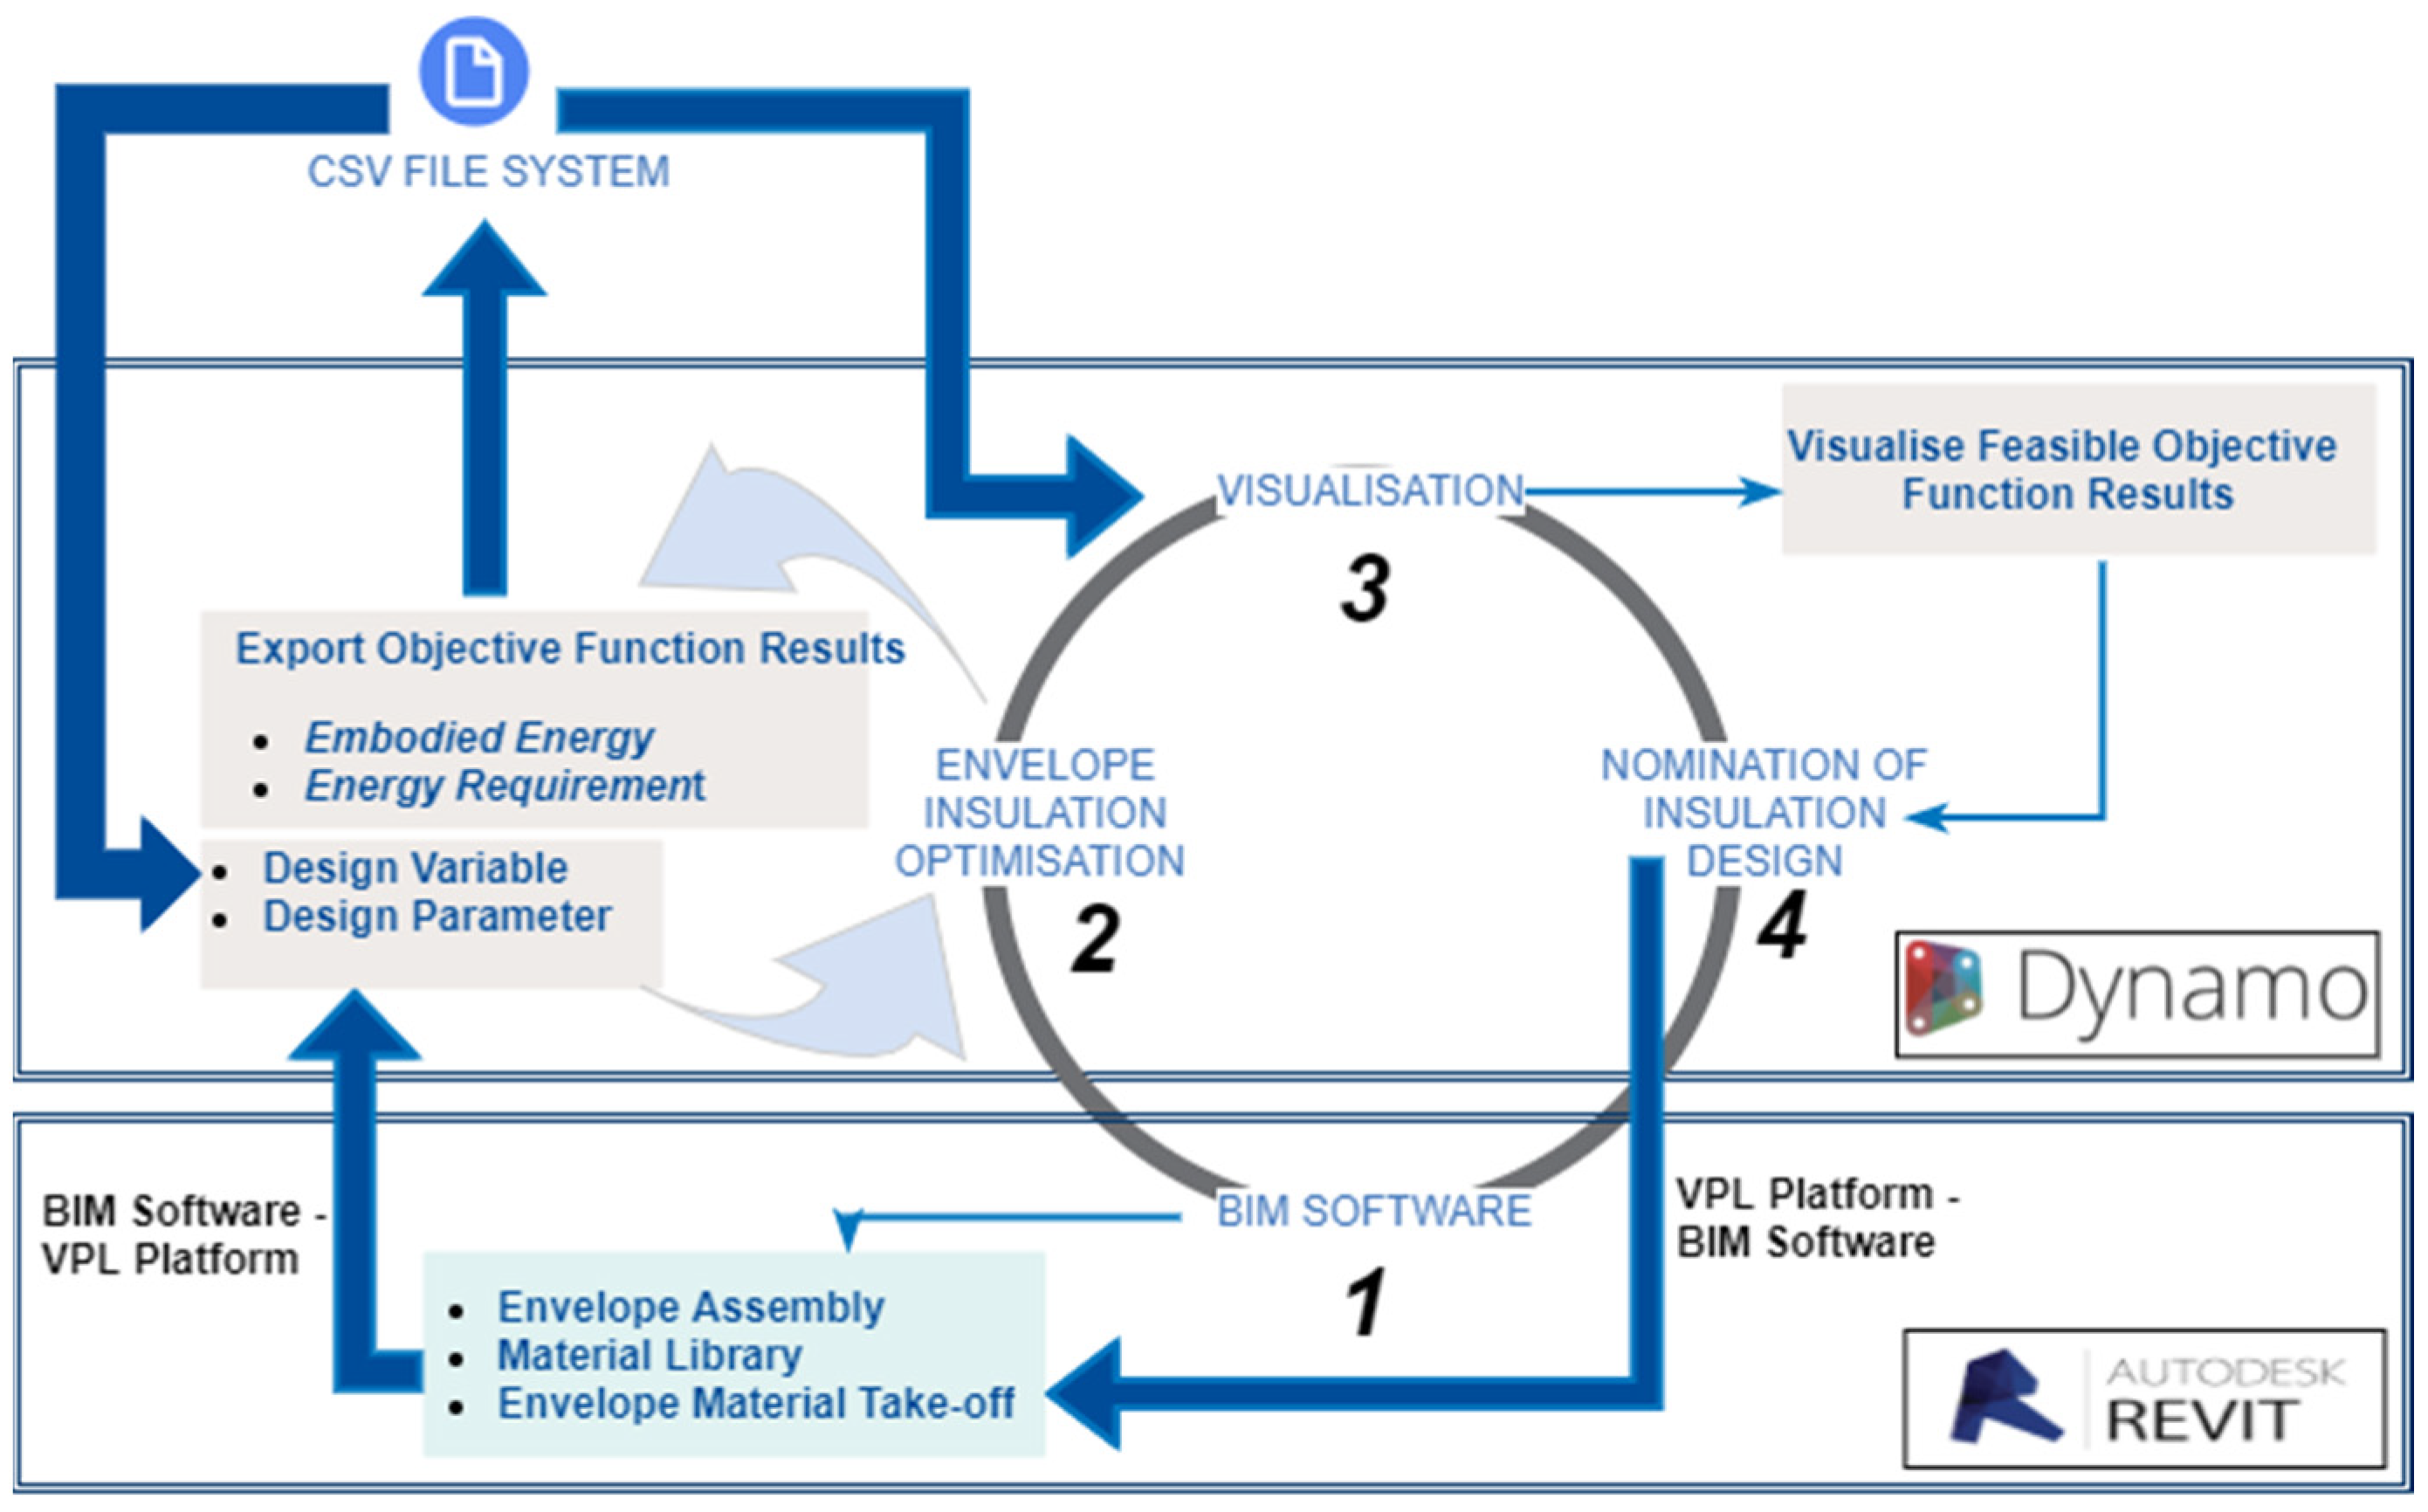
2.1. The Proposed Framework
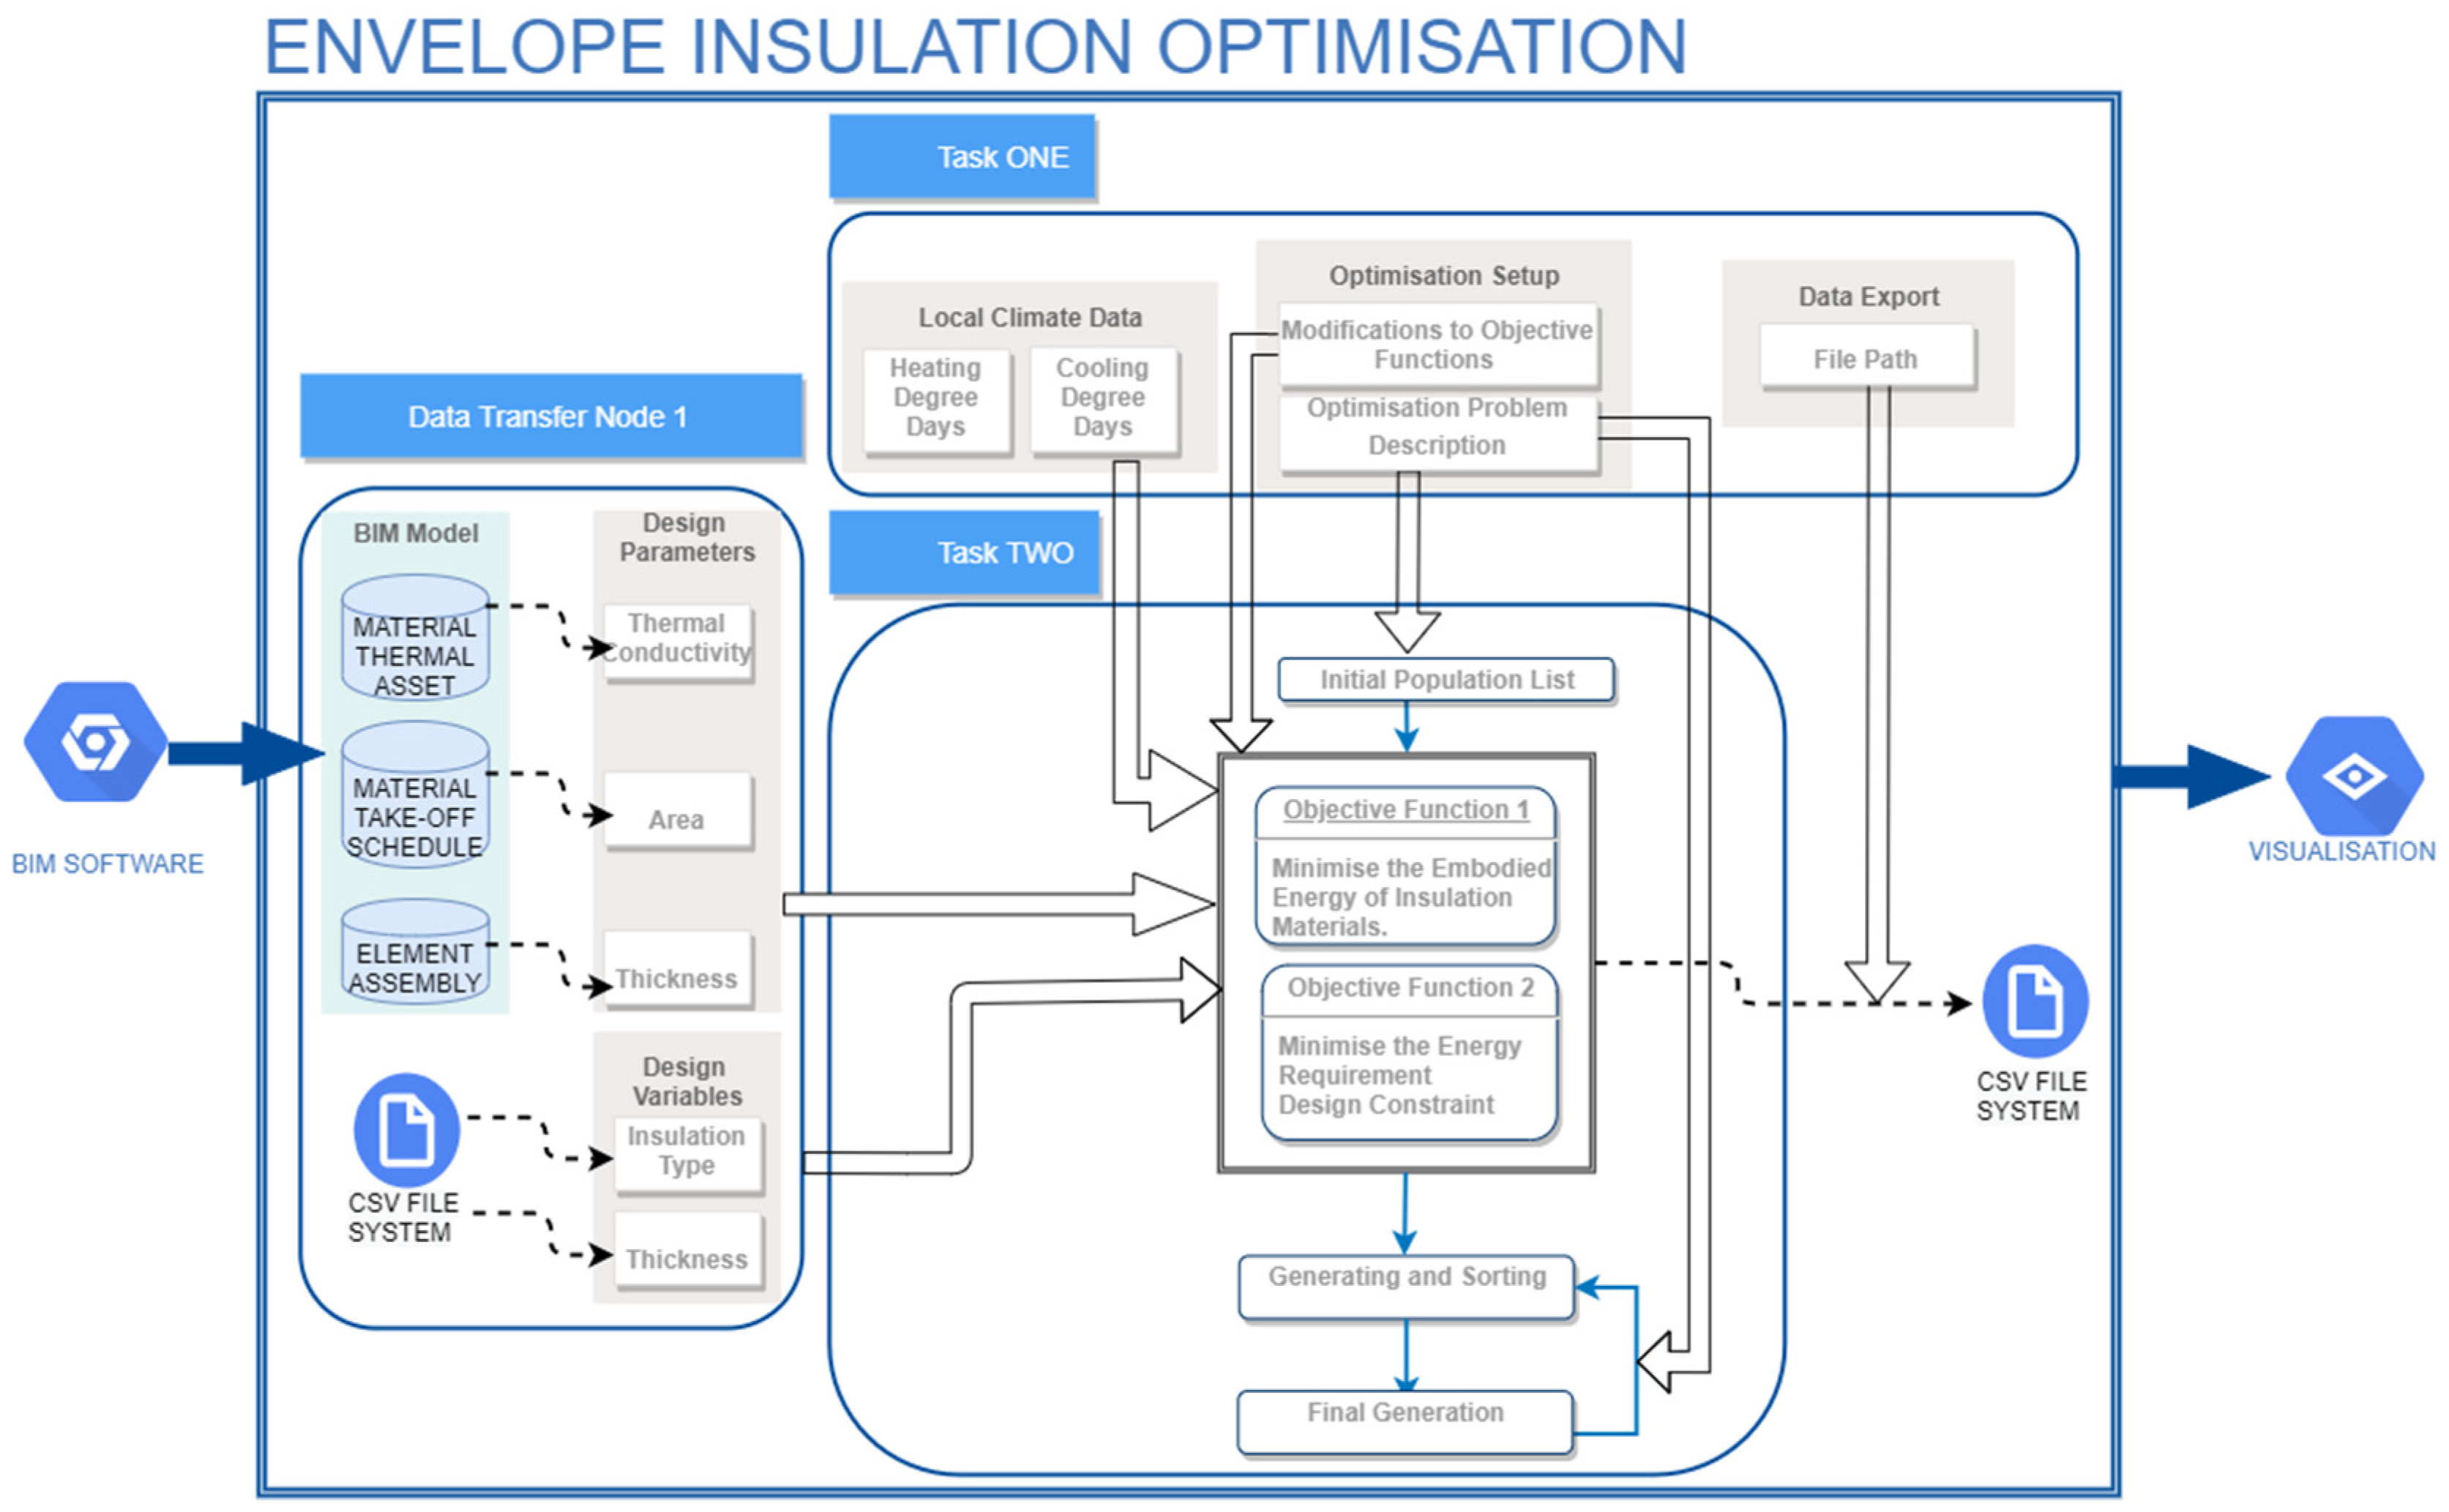
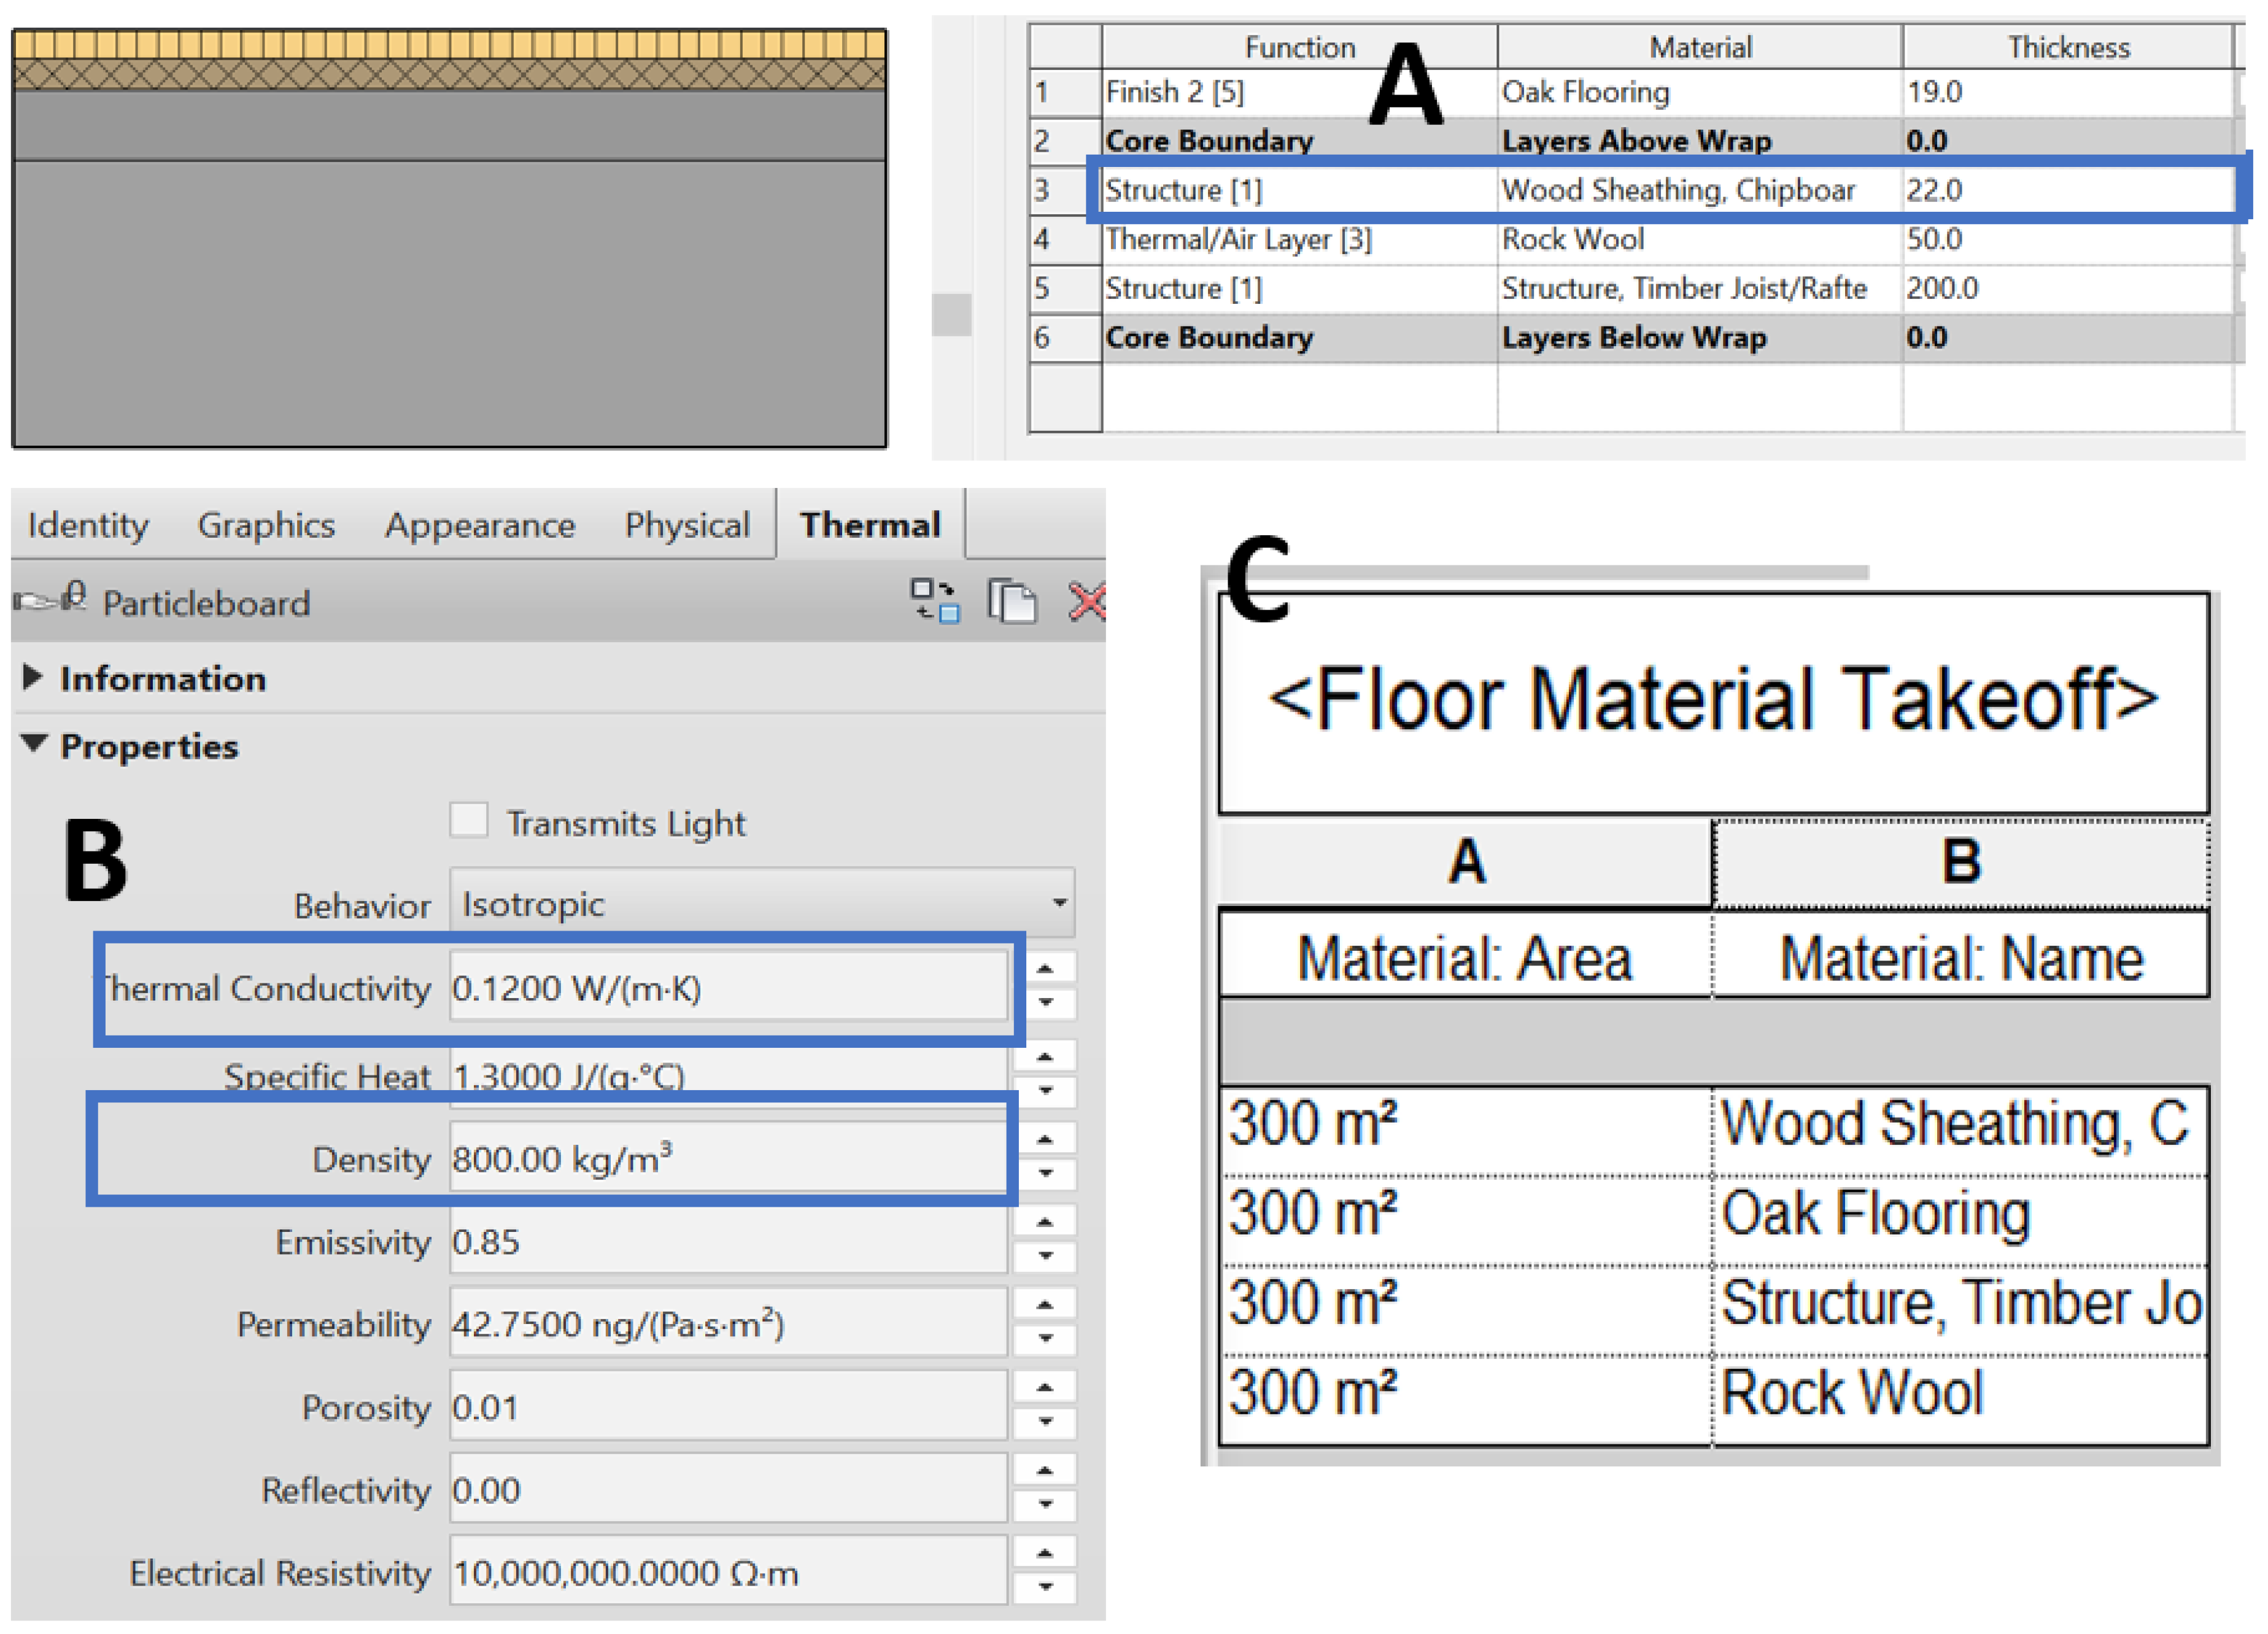
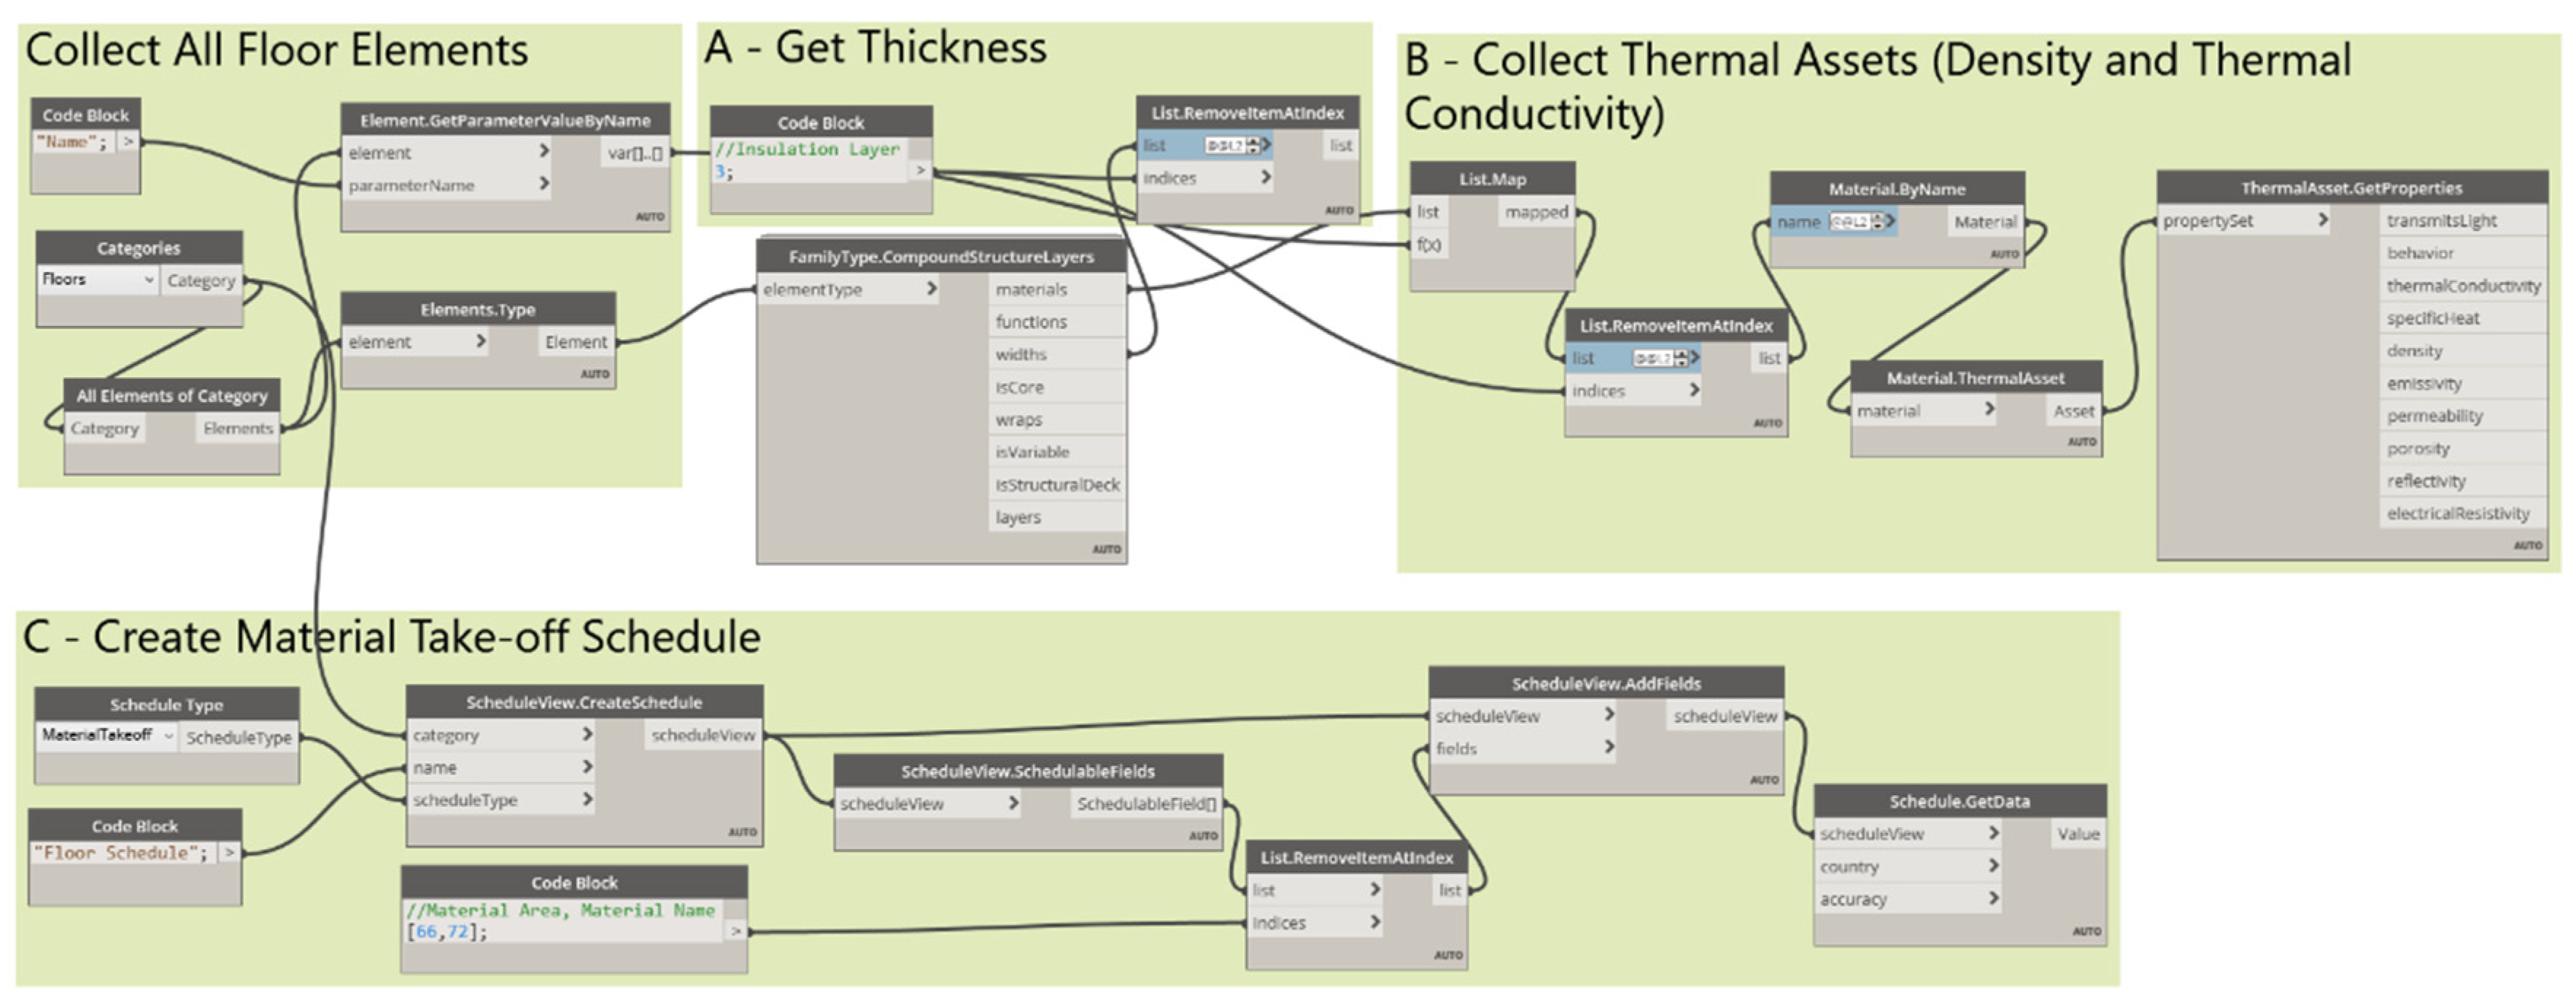
2.2. Envelope Insulation Optimisation
Optimisation Mathematical Model
2.3. Visualisation
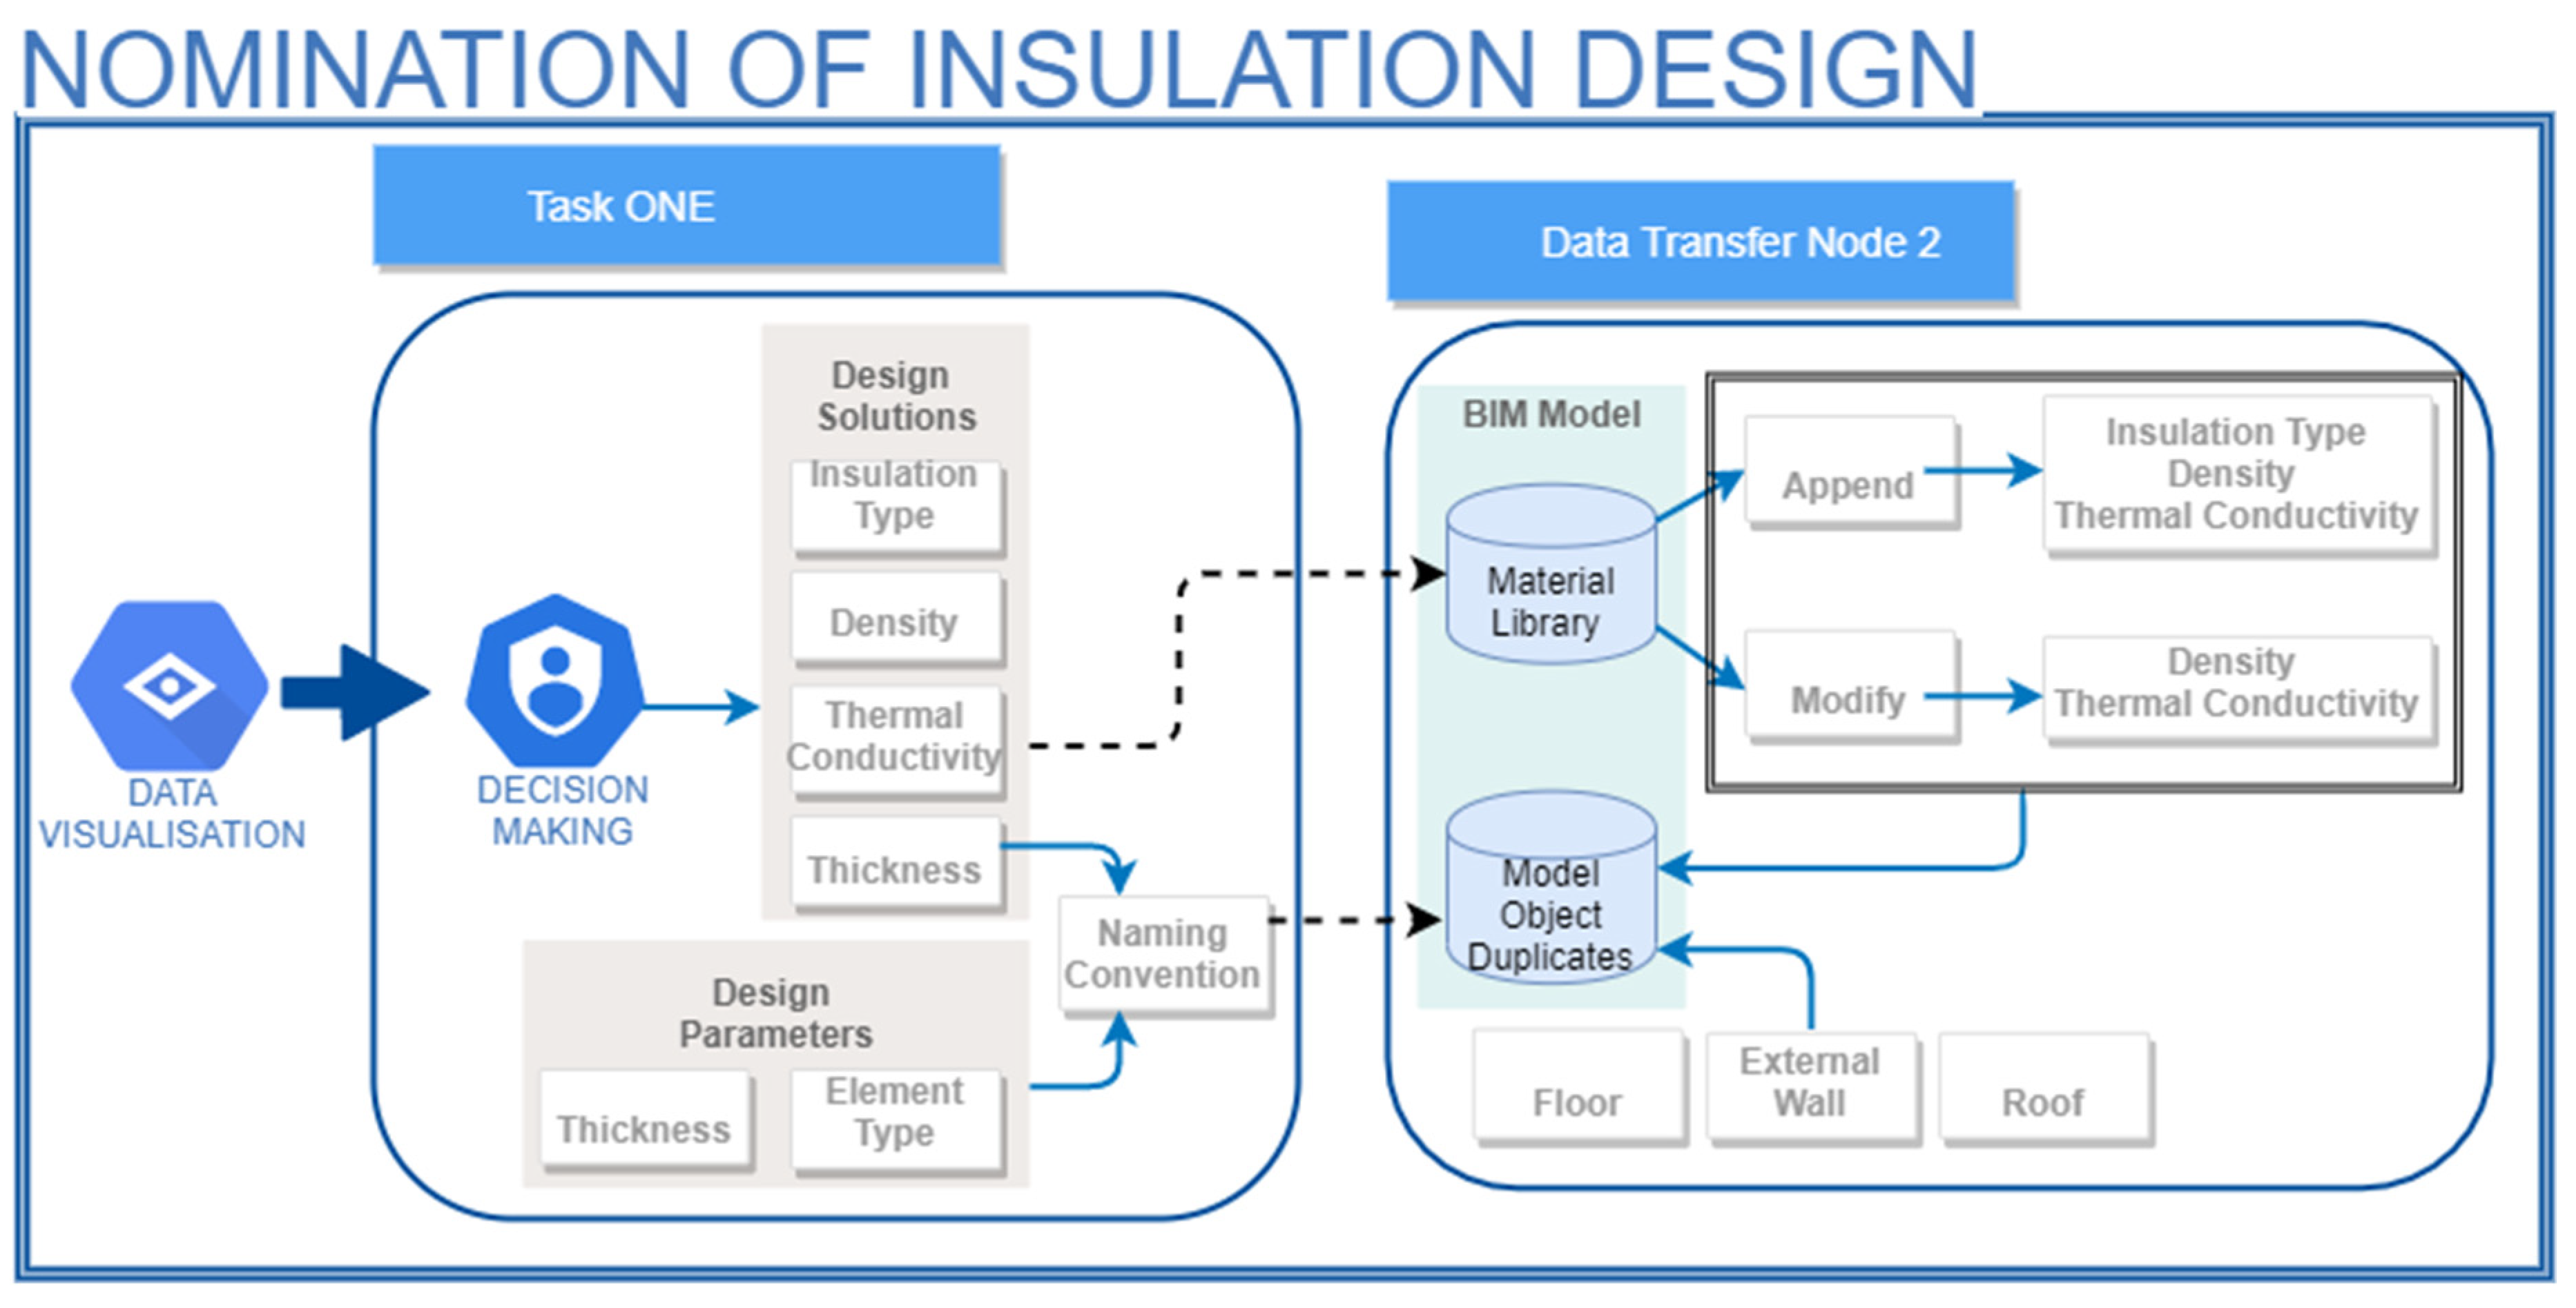
2.4. Nomination of Insulation Design
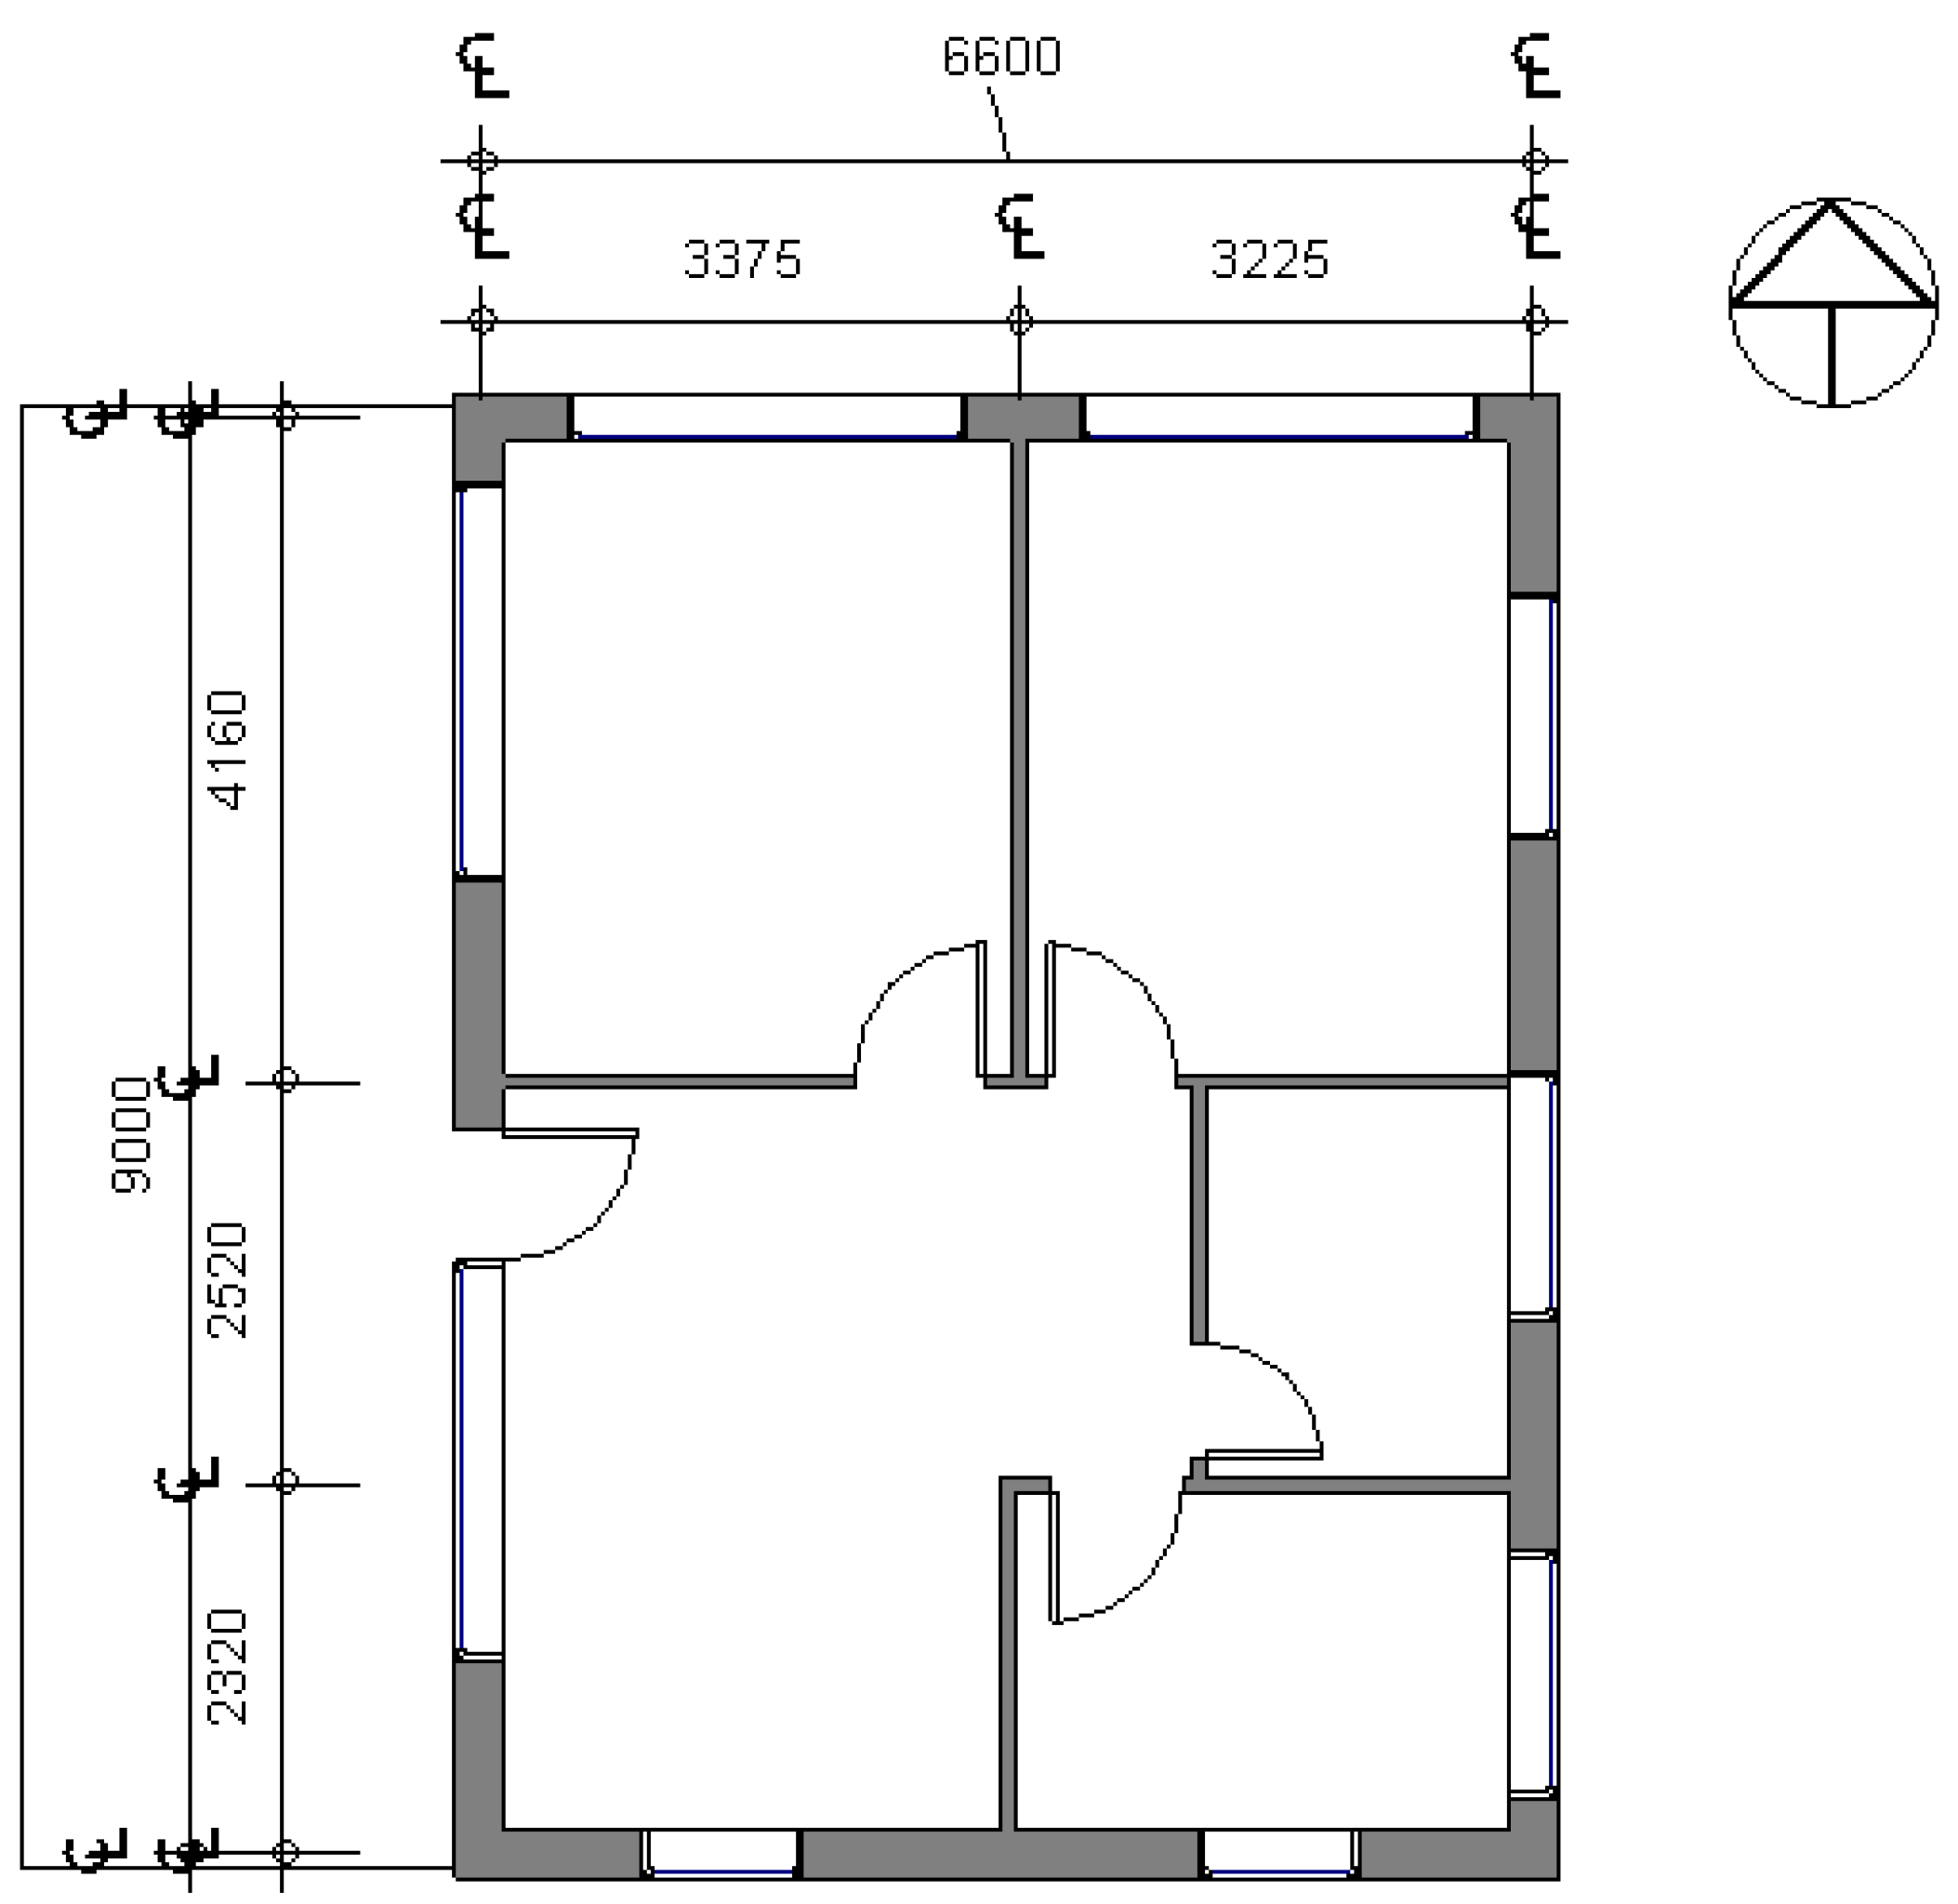
2.5. Case Study
3. Results and Discussion
4. Conclusions
- Plotting feasible objective function results on the Dynamo working canvas.
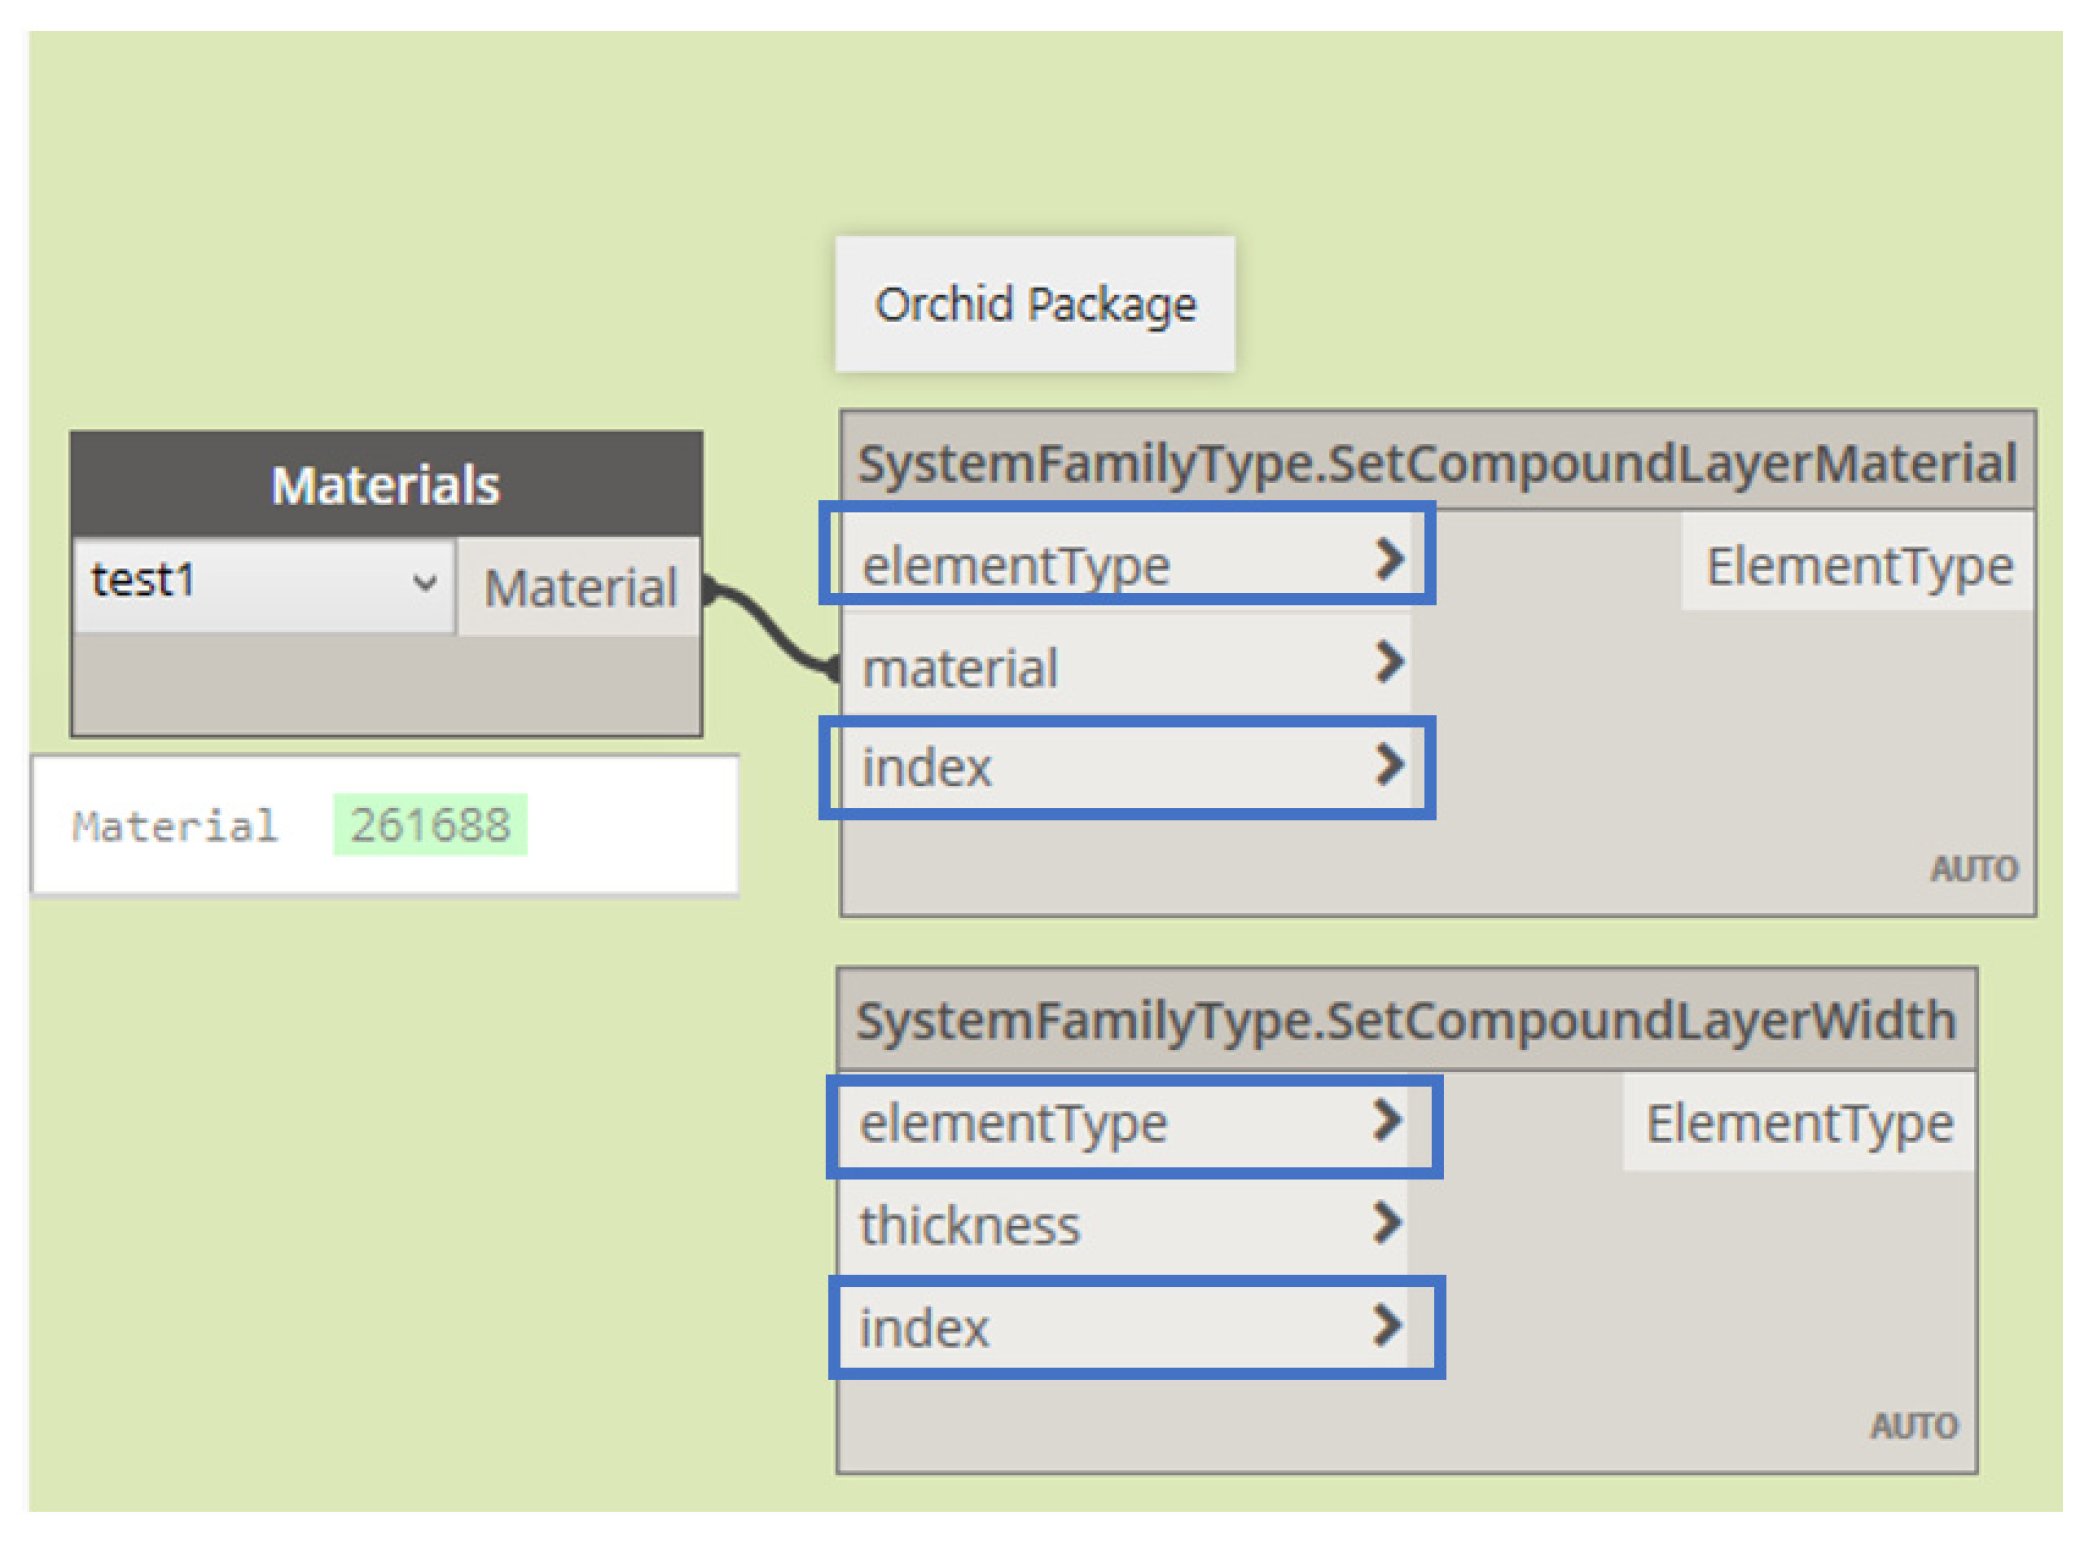
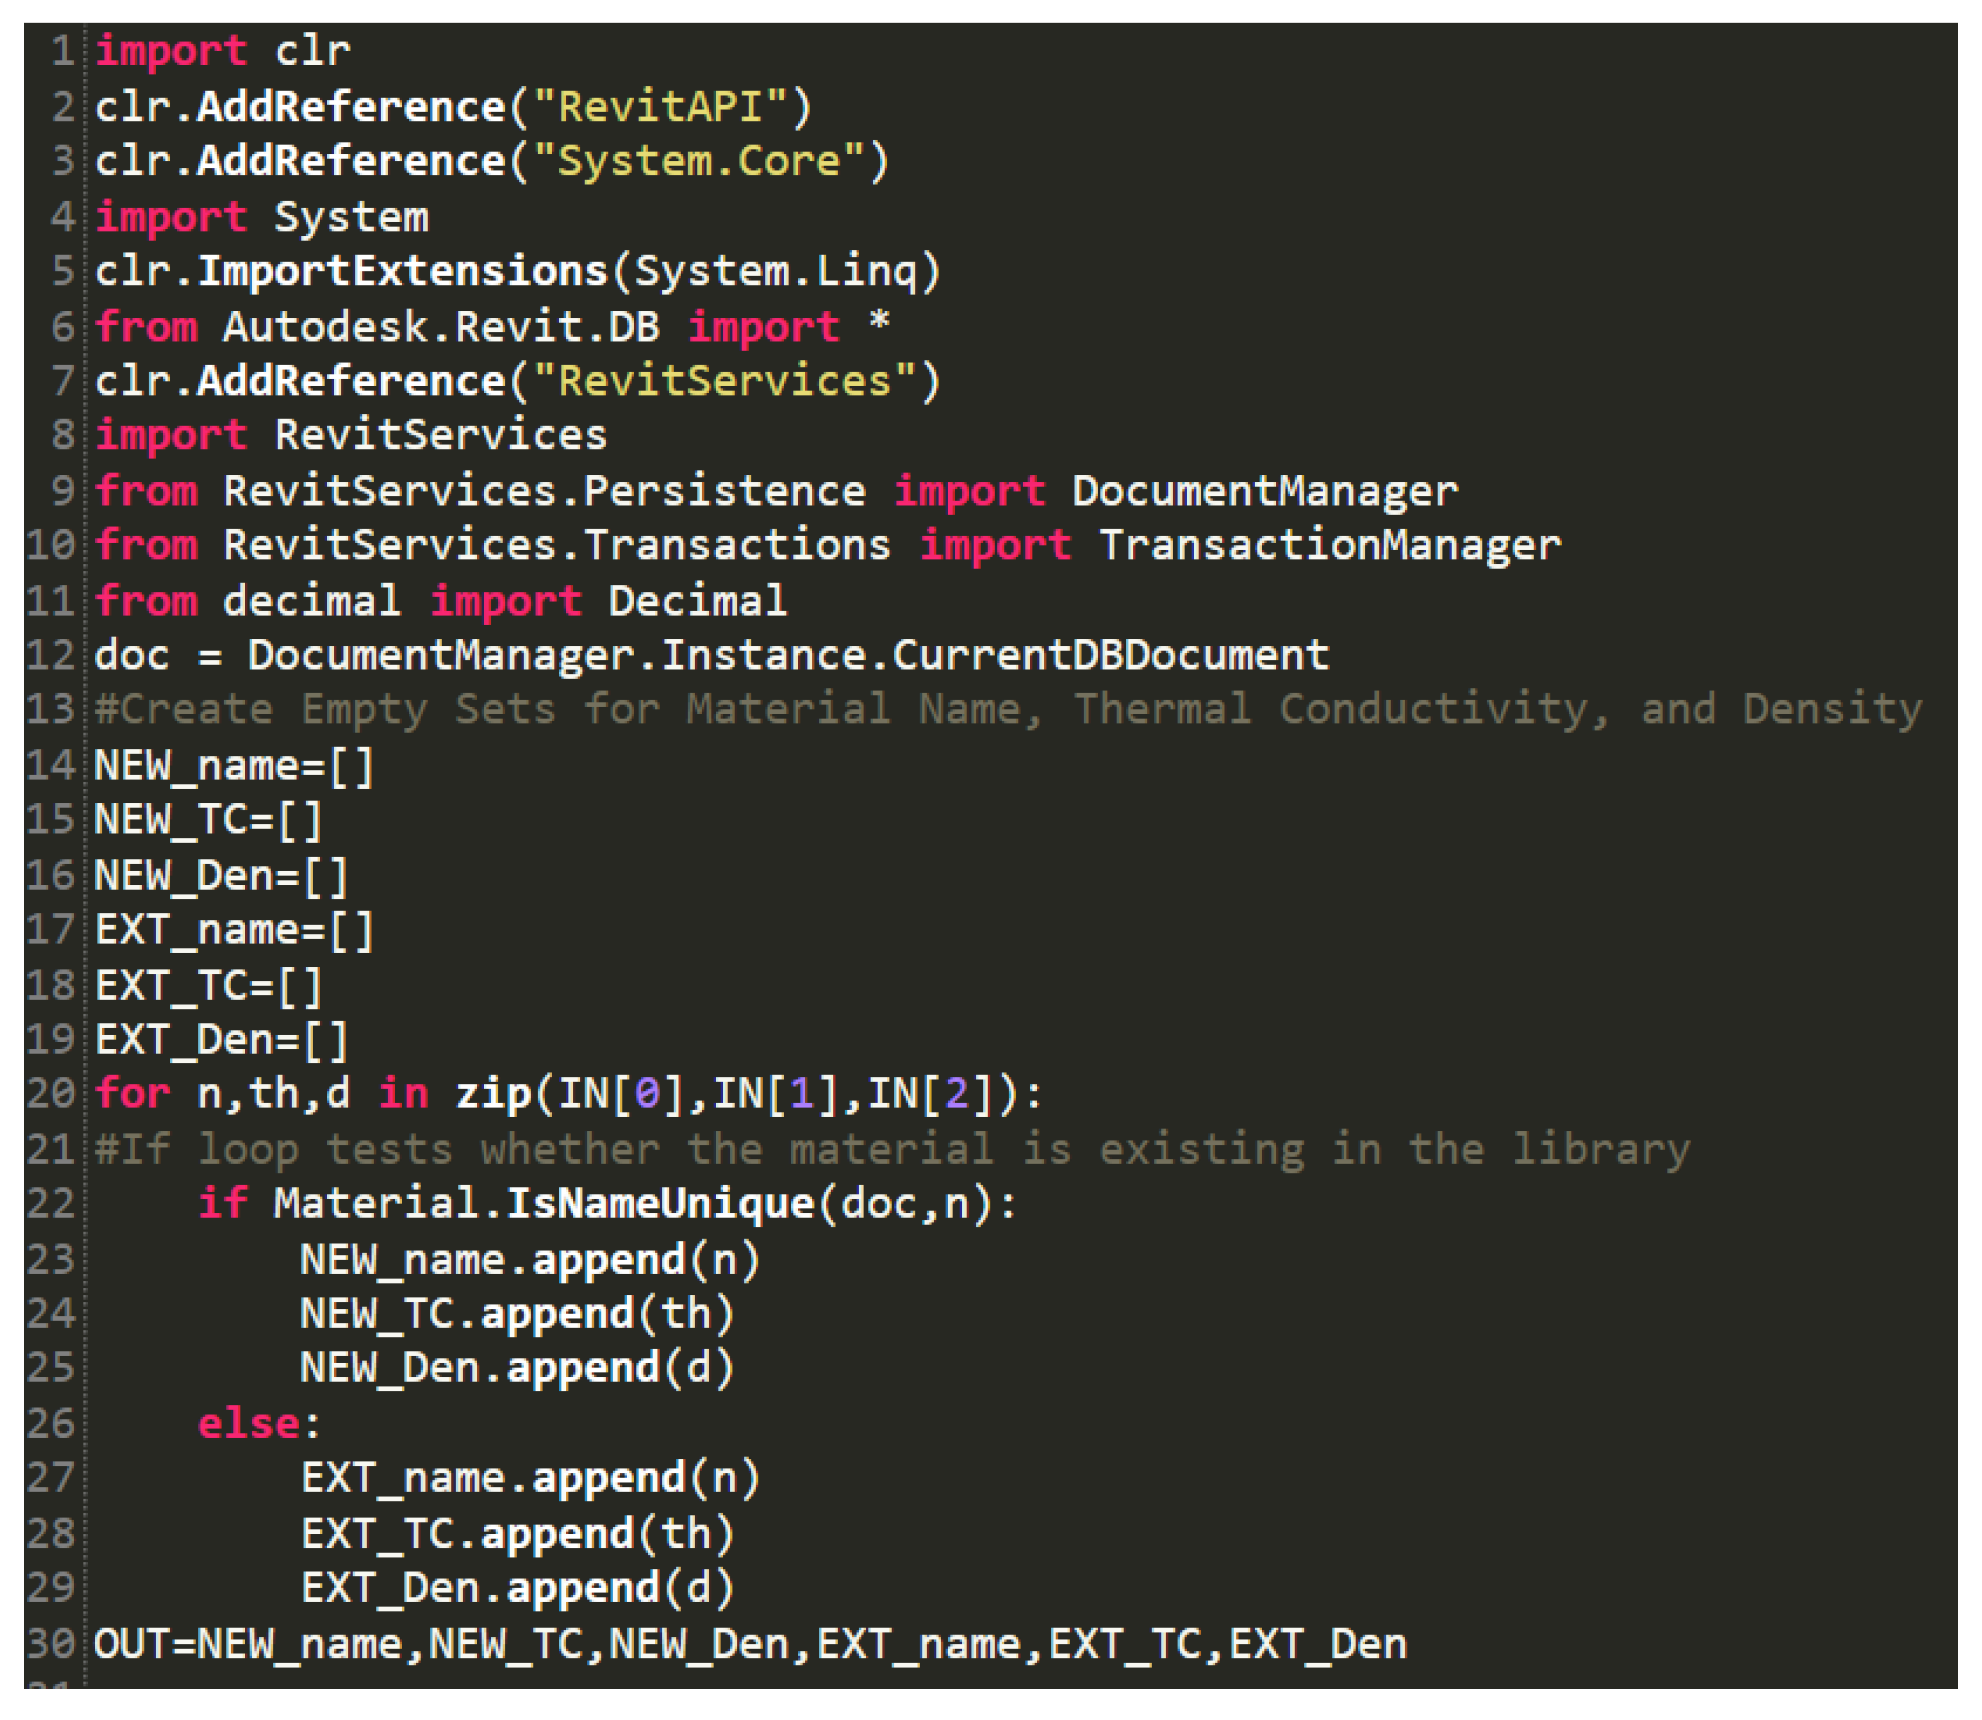
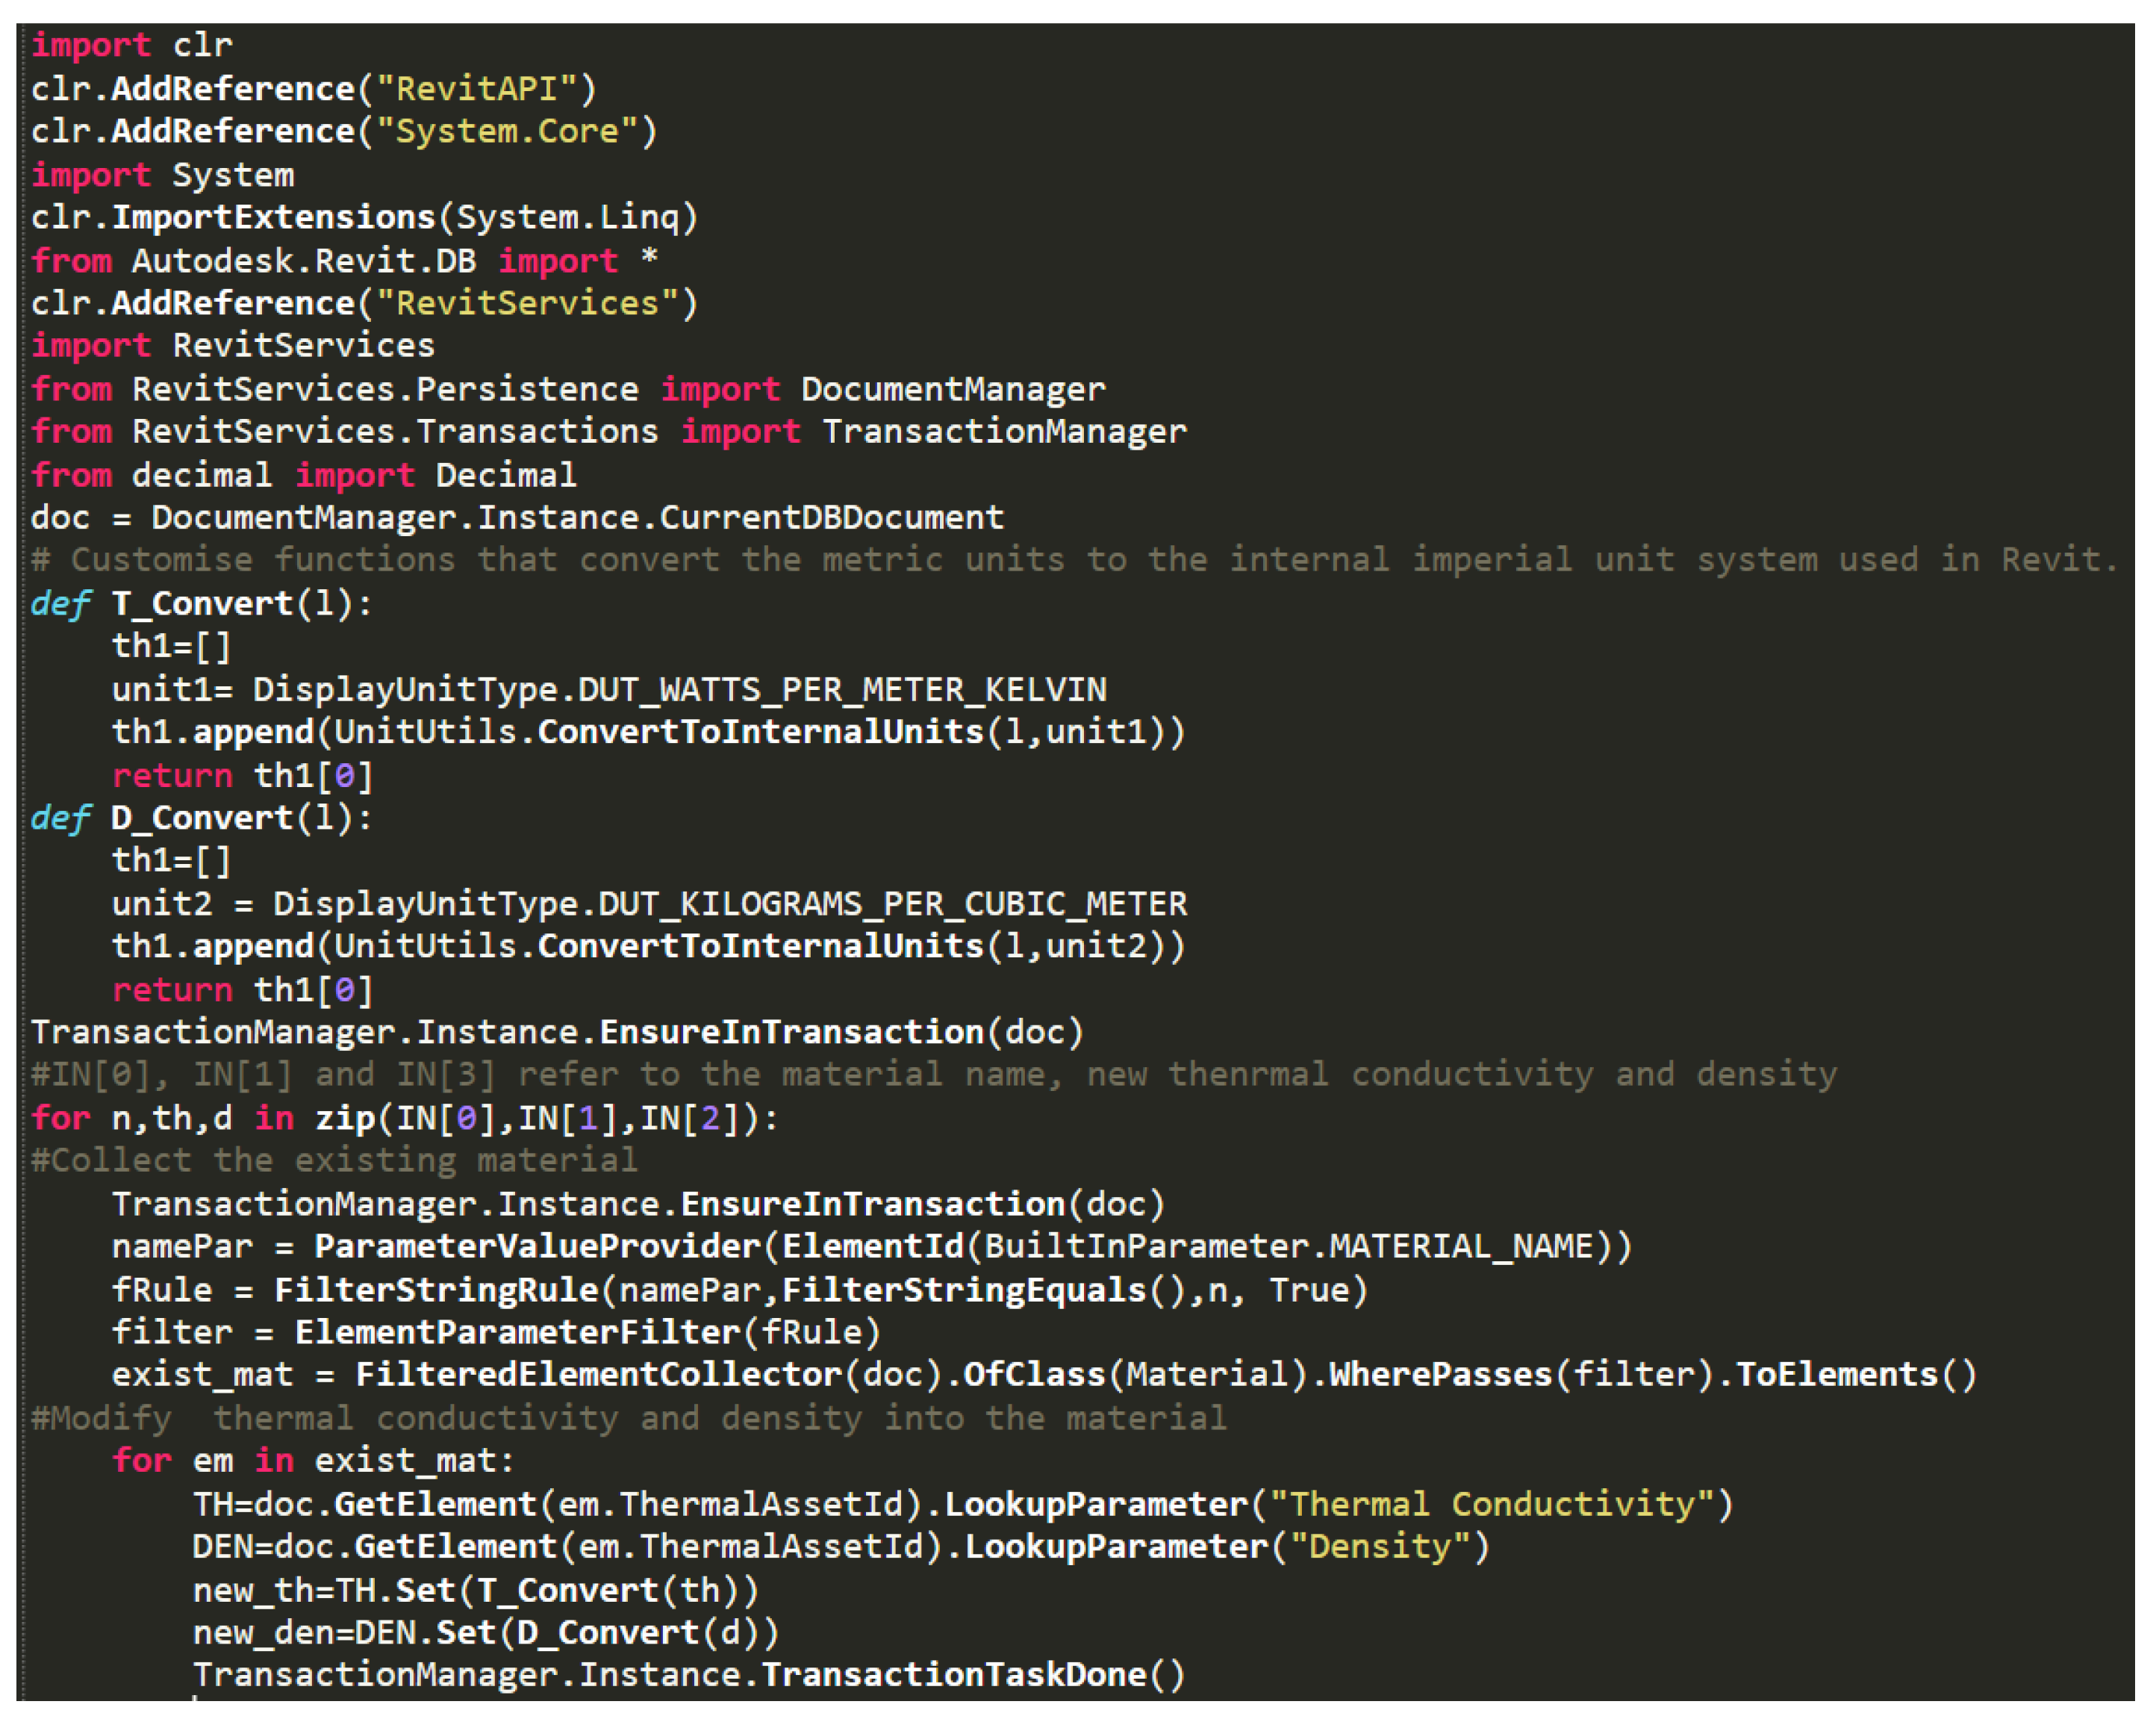
- Mapping insulation material properties into the Revit material library.
- Instantiating the optimal insulation design in the BIM model.
Author Contributions
Funding
Conflicts of Interest
Appendix A. Dynamo Python Scripts Used for Revit Material Mapping


References
- International Energy Agency. 2019 Global Status Report for Buildings and Construction (p. 41). The Global Alliance for Buildings and Construction. 2019. Available online: http://wedocs.unep.org/bitstream/handle/20.500.11822/30950/2019GSR.pdf?sequence=1&isAllowed=y (accessed on 26 November 2020).
- Akbarnezhad, A.; Xiao, J. Estimation and Minimization of Embodied Carbon of Buildings: A Review. Buildings 2017, 7, 5. [Google Scholar] [CrossRef]
- Azari, R.; Abbasabadi, N. Embodied energy of buildings: A review of data, methods, challenges, and research trends. Energy Build. 2018, 168, 225–235. [Google Scholar] [CrossRef]
- Sierra-Pérez, J.; Rodríguez-Soria, B.; Boschmonart-Rives, J.; Gabarrell, X. Integrated life cycle assessment and thermodynamic simulation of a public building’s envelope renovation: Conventional vs. Passivhaus proposal. Appl. Energy 2018, 212, 1510–1521. [Google Scholar] [CrossRef]
- Thormark, C. A low energy building in a life cycle—Its embodied energy, energy need for operation and recycling potential. Build. Environ. 2002, 37, 429–435. [Google Scholar] [CrossRef]
- Treloar, G.J. Validation of the Use of Australian Input-Output Data for Building Embodied Energy Simulation. In Proceedings of the Eighth International Building Performance Simulation Association Conference on Building Simulation: For Better Building Design, Eindhoven, The Netherlands, 11–14 August 2003. [Google Scholar]
- Robati, M.; Daly, D.; Kokogiannakis, G. A method of uncertainty analysis for whole-life embodied carbon emissions (CO2-e) of building materials of a net-zero energy building in Australia. J. Clean. Prod. 2019, 225, 541–553. [Google Scholar] [CrossRef]
- Braulio-Gonzalo, M.; Bovea, M.D. Environmental and cost performance of building’s envelope insulation materials to reduce energy demand: Thickness optimisation. Energy Build. 2017, 150, 527–545. [Google Scholar] [CrossRef]
- Pacheco, R.; Ordóñez, J.; Martínez, G. Energy efficient design of building: A review. Renew. Sustain. Energy Rev. 2012, 16, 3559–3573. [Google Scholar] [CrossRef]
- Biswas, K.; Shrestha, S.S.; Bhandari, M.S.; Desjarlais, A.O. Insulation materials for commercial buildings in North America: An assessment of lifetime energy and environmental impacts. Energy Build. 2016, 112, 256–269. [Google Scholar] [CrossRef]
- Zheng, G.; Jing, Y.; Huang, H.; Gao, Y. Application of improved grey relational projection method to evaluate sustainable building envelope performance. Appl. Energy 2010, 87, 710–720. [Google Scholar] [CrossRef]
- Schiavoni, S.; D’Alessandro, F.; Bianchi, F.; Asdrubali, F. Insulation materials for the building sector: A review and comparative analysis. Renew. Sustain. Energy Rev. 2016, 62, 988–1011. [Google Scholar] [CrossRef]
- Office of Energy Efficiency & Renewable Energy. Insulation. Energy.Gov. Available online: https://www.energy.gov/energysaver/weatherize/insulation (accessed on 6 October 2020).
- Raouf, A.M.; Al-Ghamdi, S.G. Effect of R-values changes in the baseline codes: Embodied energy and environmental life cycle impacts of building envelopes. Energy Rep. 2020, 6, 554–560. [Google Scholar] [CrossRef]
- Crawford, R.H.; Stephan, A. The significance of embodied energy in certified passive houses. In Proceedings of the International Conference on Construction and Building Materials (ICCBM 2013), Hong Kong, China, 7–8 December 2013. [Google Scholar]
- Papadopoulos, A.M. State of the art in thermal insulation materials and aims for future developments. Energy Build. 2005, 37, 77–86. [Google Scholar] [CrossRef]
- Kymäläinen, H.-R.; Sjöberg, A.-M. Flax and hemp fibres as raw materials for thermal insulations. Build. Environ. 2008, 43, 1261–1269. [Google Scholar] [CrossRef]
- Hammond, G.; Jones, C.; Lowrie, F.; Tse, P. Building Services Research and Information Association, & University of Bath. In Embodied Carbon: The Inventory of Carbon and Energy (ICE); BSRIA: Bath, UK, 2011. [Google Scholar]
- Ürge-Vorsatz, D.; Khosla, R.; Bernhardt, R.; Chan, Y.C.; Vérez, D.; Hu, S.; Cabeza, L.F. Advances toward a Net-Zero Global Building Sector. Annu. Rev. Environ. Resour. 2020, 45. [Google Scholar] [CrossRef]
- Dombaycı, Ö.A. The environmental impact of optimum insulation thickness for external walls of buildings. Build. Environ. 2007, 42, 3855–3859. [Google Scholar] [CrossRef]
- Axaopoulos, I.; Axaopoulos, P.; Gelegenis, J.; Fylladitakis, E.D. Optimum external wall insulation thickness considering the annual CO2 emissions. J. Build. Phys. 2019, 42, 527–544. [Google Scholar] [CrossRef]
- Bojić, M.; Miletić, M.; Bojić, L. Optimization of thermal insulation to achieve energy savings in low energy house (refurbishment). Energy Convers. Manag. 2014, 84, 681–690. [Google Scholar] [CrossRef]
- Basbagill, J.; Flager, F.; Lepech, M.; Fischer, M. Application of life-cycle assessment to early stage building design for reduced embodied environmental impacts. Build. Environ. 2013, 60, 81–92. [Google Scholar] [CrossRef]
- Asl, M.R.; Zarrinmehr, S.; Bergin, M.; Yan, W. BPOpt: A framework for BIM-based performance optimization. Energy Build. 2015, 108, 401–412. [Google Scholar] [CrossRef]
- Wong, K.; Fan, Q. Building information modelling (BIM) for sustainable building design. Facilities 2013, 31, 138–157. [Google Scholar] [CrossRef]
- Krygiel, E.; Nies, B.; McDowell, S. Green BIM: Successful Sustainable Design with Building Information Modeling; John Wiley & Sons Incorporated: Hoboken, NJ, USA, 2008; Available online: http://ebookcentral.proquest.com/lib/unsw/detail.action?docID=362054 (accessed on 26 November 2020).
- Iddon, C.R.; Firth, S.K. Embodied and operational energy for new-build housing: A case study of construction methods in the UK. Energy Build. 2013, 67, 479–488. [Google Scholar] [CrossRef]
- Gbadamosi, A.-Q.; Mahamadu, A.-M.; Oyedele, L.O.; Akinade, O.O.; Manu, P.; Mahdjoubi, L.; Aigbavboa, C. Offsite construction: Developing a BIM-Based optimizer for assembly. J. Clean. Prod. 2019, 215, 1180–1190. [Google Scholar] [CrossRef]
- Cho, Y.K.; Alaskar, S.; Bode, T.A. BIM-Integrated Sustainable Material and Renewable Energy Simulation. Constr. Res. Congr. 2010, 288–297. [Google Scholar] [CrossRef]
- Autodesk. Preview of Autodesk Ecotect Analysis 2010|Search|Autodesk Knowledge Network. 2010. Available online: https://knowledge.autodesk.com/search-result/caas/video/youtube/watch-v-BKZ35xh4ofw.html (accessed on 26 November 2020).
- Jalaei, F.; Jrade, A. An Automated BIM Model to Conceptually Design, Analyze, Simulate, and Assess Sustainable Building Projects. J. Constr. Eng. 2014, 1–21. [Google Scholar] [CrossRef]
- Autodesk. Ecotect Analysis Discontinuation FAQ|Search|Autodesk Knowledge Network. Available online: https://knowledge.autodesk.com/search-result/caas/sfdcarticles/sfdcarticles/Ecotect-Analysis-Discontinuation-FAQ.html (accessed on 20 April 2016).
- Kim, H.; Shen, Z.; Kim, I.; Kim, K.; Stumpf, A.; Yu, J. BIM IFC information mapping to building energy analysis (BEA) model with manually extended material information. Autom. Constr. 2016, 68, 183–193. [Google Scholar] [CrossRef]
- Bank, L.C.; McCarthy, M.; Thompson, B.P.; Menassa, C.C. Integrating BIM with System Dynamics as a Decision-Making Framework for Sustainable Building Design and Operation; First International Conference on Sustainable Urbanization: Hong Kong, China, 2010. [Google Scholar]
- Stave, K.A. A System Dynamics Model to Facilitate Public Understanding of Water Management Options in Las Vegas, Nevada. J. Environ. Manag. 2003, 67, 303–313. [Google Scholar] [CrossRef]
- AnyLogic: Simulation Modeling Software Tools & Solutions for Business. 2020. Available online: https://www.anylogic.com/ (accessed on 26 November 2020).
- Thompson, B.P.; Bank, L.C. Use of system dynamics as a decision-making tool in building design and operation. Build. Environ. 2010, 45, 1006–1015. [Google Scholar] [CrossRef]
- Welle, B.; Haymaker, J.; Rogers, Z. ThermalOpt: A methodology for automated BIM-based multidisciplinary thermal simulation for use in optimization environments. Build. Simul. 2011, 4, 293–313. [Google Scholar] [CrossRef]
- National Renewable Energy Laboratory (NREL). EnergyPlus. 2020. Available online: https://energyplus.net/ (accessed on 26 November 2020).
- Larson, G.W.; Shakespeare, R.A. Rendering with Radiance. 2020. Available online: https://floyd.lbl.gov/radiance/book/index.html (accessed on 26 November 2020).
- Autodesk. Dynamo. Dynamo BIM. 2020. Available online: https://dynamobim.org/download/ (accessed on 26 November 2020).
- Shadram, F.; Johansson, T.D.; Lu, W.; Schade, J.; Olofsson, T. An integrated BIM-based framework for minimizing embodied energy during building design. Energy Build. 2016, 128, 592–604. [Google Scholar] [CrossRef]
- Shadram, F.; Mukkavaara, J. An integrated BIM-based framework for the optimization of the trade-off between embodied and operational energy. Energy Build. 2018, 158, 1189–1205. [Google Scholar] [CrossRef]
- Robert McNeel & Associates. Grasshopper—New in Rhino 6. 2018. Available online: https://www.rhino3d.com/6/new/grasshopper (accessed on 26 November 2020).
- Robert McNeel & Associates. Rhino Features. 2020. Available online: https://www.rhino3d.com/6/features (accessed on 26 November 2020).
- Kensek, K.M. Integration of Environmental Sensors with BIM: Case studies using Arduino, Dynamo, and the Revit API. Inf. De La Construcción 2014, 66, e044. [Google Scholar] [CrossRef]
- Asl, M.R.; Stoupine, A.; Zarrinmehr, S.; Yan, W. Optimo: A BIM-based multi-objective optimization tool utilizing visual programing for high performance building design. In Proceedings of the Conference of Education and Research in Computer Aided Architectural Design in Europe (ECAADe), Vienna, Austria, 16–18 September 2015; pp. 673–682. [Google Scholar]
- Lin, S.-H.; Gerber, D.J. Evolutionary energy performance feedback for design: Multidisciplinary design optimization and performance boundaries for design decision support. Energy Build. 2014, 84, 426–441. [Google Scholar] [CrossRef]
- Pilgrim, M.; Bouchlaghem, N.; Loveday, D.; Holmes, M. Towards the efficient use of simulation in building performance analysis: A user survey. Build. Serv. Eng. Res. Technol. 2003, 24, 149–162. [Google Scholar] [CrossRef]
- Autodesk. Revit|BIM Software|Autodesk Official Store. 2020. Available online: https://www.autodesk.com/products/revit/overview (accessed on 26 November 2020).
- Deb, K.; Pratap, A.; Agarwal, S.; Meyarivan, T. A fast and elitist multiobjective genetic algorithm: NSGA-II. IEEE Trans. Evol. Comput. 2002, 6, 182–197. [Google Scholar] [CrossRef]
- Bolattürk, A. Determination of optimum insulation thickness for building walls with respect to various fuels and climate zones in Turkey. Appl. Therm. Eng. 2006, 26, 1301–1309. [Google Scholar] [CrossRef]
- Martínez, D.M.; Ebenhack, B.W.; Wagner, T.P. Chapter 8—Residential and commercial sector energy efficiency. In Energy Efficiency; Martínez, D.M., Ebenhack, B.W., Wagner, T.P., Eds.; Elsevier: Amsterdam, The Netherlands, 2019; pp. 227–269. [Google Scholar] [CrossRef]
- Bolattürk, A. Optimum insulation thicknesses for building walls with respect to cooling and heating degree-hours in the warmest zone of Turkey. Build. Environ. 2008, 43, 1055–1064. [Google Scholar] [CrossRef]
- Hasan, A. Optimizing insulation thickness for buildings using life cycle cost. Appl. Energy 1999, 63, 115–124. [Google Scholar] [CrossRef]
- Sisman, N.; Kahya, E.; Aras, N.; Aras, H. Determination of optimum insulation thicknesses of the external walls and roof (ceiling) for Turkey’s different degree-day regions. Energy Policy 2007, 35, 5151–5155. [Google Scholar] [CrossRef]
- Yu, J.; Tian, L.; Yang, C.; Xu, X.; Wang, J. Optimum insulation thickness of residential roof with respect to solar-air degree-hours in hot summer and cold winter zone of china. Energy Build. 2011, 43, 2304–2313. [Google Scholar] [CrossRef]
- Kośny, J.; Kossecka, E. Multi-dimensional heat transfer through complex building envelope assemblies in hourly energy simulation programs. Energy Build. 2002, 34, 445–454. [Google Scholar] [CrossRef]
- Dewsbury, M.; Wallis, L.; Fay, R.; Nolan, G. The Influence of Residential Framing Practices on Thermal Performance; ANZAScA: Lauceston, Australia, 2009; Volume 8. [Google Scholar]
- Natural Resources Canada. Tables for Calculating Effective Thermal Resistance of Opaque Assemblies. Available online: https://www.nrcan.gc.ca/energy/efficiency/housing/new-homes/energy-starr-new-homes-standard/tables-calculating-effective-thermal-resistance-opaque-assemblies/14176#a52 (accessed on 26 November 2020).
- Huang, Y.J.; Rosenfeld, A.H.; de Piedade, A.C.; Tseng, D. Energy efficiency in chinese apartment buildings: Parametric analysis with the DOE-2.1A computer program. In Proceedings of the First U.S.-China Conference on Energy, Resources, and Environment, Beijing, China, 7–12 November 1982. [Google Scholar]
- Kaynakli, O. A study on residential heating energy requirement and optimum insulation thickness. Renew. Energy 2008, 33, 1164–1172. [Google Scholar] [CrossRef]
- Australian Building Codes Board. National Construction Code NCC Volume One. 2016. Available online: https://ncc.abcb.gov.au/ncc-online/NCC/2016-A1/NCC-2016-Volume-One/Section-J-Energy-Efficiency/Specification-J16-Floor-Construction/1-Scope?inlineLink=%7B8210878D-AF74-4658-8AF1-90E3BD588813%7D (accessed on 26 November 2020).
- Lstiburek, J.; Baker, P. Measure Guideline: Incorporating Thick Layers of Exterior Rigid Insulation on Walls; U.S. Department of Energy’s Building America Program; Office of Energy Efficiency and Renewable Energy: Denver, CO, USA, 2015.
- American Society of Heating, Refrigerating and Air-Conditioning Engineers. ANSI/ASHRAE/IESNA Addenda to ANSI/ASHRAE/IESNA Standard 90.1-2007. 2008. Available online: https://www.ashrae.org/File%20Library/Technical%20Resources/Standards%20and%20Guidelines/Standards%20Addenda/90_1_2007_Supplement.pdf (accessed on 26 November 2020).
- Australian Bureau of Statistics. Environmental Issues: Energy Use and Conservation. 2008. Available online: https://www.ausstats.abs.gov.au/ausstats/subscriber.nsf/0/C70521268BC1B3D4CA25750E001131EF/$File/4602055001_mar%202008.pdf (accessed on 26 November 2020).
- Australian Building Codes Board. National Construction Code NCC Volume Two. 2019. Available online: https://ncc.abcb.gov.au/ (accessed on 26 November 2020).
- NCC|Australian Building Codes Board. 2020. Available online: https://ncc.abcb.gov.au/ (accessed on 26 November 2020).
- Hartikainen, M.; Miettinen, K.; Wiecek, M.M. Constructing a Pareto front approximation for decision making. Math. Methods Oper. Res. 2011, 73, 209–234. [Google Scholar] [CrossRef]
- Carlucci, S.; Cattarin, G.; Causone, F.; Pagliano, L. Multi-objective optimization of a nearly zero-energy building based on thermal and visual discomfort minimization using a non-dominated sorting genetic algorithm (NSGA-II). Energy Build. 2015, 104, 378–394. [Google Scholar] [CrossRef]
- Marios, T.; Kristoffer, N. Sustainable Design with Respect to LCA Using Parametric Design and BIM Tools. In Proceedings of the World Sustainable Built Environment Conference, Hong Kong, China, 5–7 June 2017. [Google Scholar]
- Jørgensen, E.F. What Is Orchid?—Dynamo Nodes. 2019. Available online: https://dynamonodes.com/2019/01/30/what-is-orchid/ (accessed on 26 November 2020).
- Department of Industry, Science, Energy and Resources. YourHome. 2020. Available online: https://www.yourhome.gov.au/ (accessed on 26 November 2020).
- Yumrutaş, R.; Ünsal, M.; Kanoğlu, M. Periodic solution of transient heat flow through multilayer walls and flat roofs by complex finite Fourier transform technique. Build. Environ. 2005, 40, 1117–1125. [Google Scholar] [CrossRef]
- Guan, L. Implication of global warming on air-conditioned office buildings in Australia. Build. Res. Inf. 2009, 37, 43–54. [Google Scholar] [CrossRef]
- Sustainability Victoria. Understand Heating Options for Your Home. 2020. Available online: https://www.sustainability.vic.gov.au/You-and-your-home/Save-energy/Heating/Choose-energy-efficient-heating (accessed on 26 November 2020).
- International Code Council Inc.; APA—The Engineered Wood Association. IECC Compliance Options for Wood-Frame Wall Assemblies. 2014. Available online: https://royomartin.com/wp-content/uploads/2017/01/IECC-Compliance-Options-for-Wood-Frame-Wall-Assemblies.pdf (accessed on 26 November 2020).
- Taitem Engineering. Multifamily Performance Program Technical Topic—New Buildings Calculating the U-Value of a Surface. 2008. Available online: https://www.taitem.com/wp-content/uploads/2011/01/TT-NC-Calculating-U-values-Nov-2008.pdf (accessed on 26 November 2020).
- Sirok, B.; Blagojevic, B.; Bullen, P. Mineral Wool: Production and Properties; Elsevier: Amsterdam, The Netherlands, 2008. [Google Scholar]
- Al-Homoud, M.S. Performance characteristics and practical applications of common building thermal insulation materials. Build. Environ. 2005, 40, 353–366. [Google Scholar] [CrossRef]
- Korjenic, A.; Petránek, V.; Zach, J.; Hroudová, J. Development and performance evaluation of natural thermal-insulation materials composed of renewable resources. Energy Build. 2011, 43, 2518–2523. [Google Scholar] [CrossRef]
- Corscadden, K.W.; Biggs, J.N.; Stiles, D.K. Sheep’s wool insulation: A sustainable alternative use for a renewable resource? Resour. Conserv. Recycl. 2014, 86, 9–15. [Google Scholar] [CrossRef]
- Bradford Gold Wall Batt Specifications. Bradford Insulation. 2020. Available online: https://www.bradfordinsulation.com.au/home-insulation/walls/gold-wall-batts/specifications (accessed on 26 November 2020).
- Knauf ClimaFoam® Insulation. Pricewise Insulation. 2020. Available online: https://pricewiseinsulation.com.au/product/knauf-climafoam-xps/ (accessed on 26 November 2020).
- Insulation Products|Knauf Insulation Australia. 2020. Available online: https://www.knaufinsulation.com.au/product (accessed on 26 November 2020).
- Bradford Insulation. Bradford Insulation for Homes with Metal Roofs—Specifications. 2020. Available online: https://www.bradfordinsulation.com.au/home-insulation/roofing/anticon/specifications (accessed on 26 November 2020).
- Pe, I.B.; Bjegovi, D.; Boström, L.; Milovanovi, B.; Hajdukovi, M. ETICS Fire Performance Test; Third ETICS Forum: Milan, Italy, 2015; Volume 10. [Google Scholar]
- Jelle, B.P. Traditional, state-of-the-art and future thermal building insulation materials and solutions—Properties, requirements and possibilities. Energy Build. 2011, 43, 2549–2563. [Google Scholar] [CrossRef]
- Wang, Y.; Huang, Z.; Heng, L. Cost-effectiveness assessment of insulated exterior walls of residential buildings in cold climate. Int. J. Proj. Manag. 2007, 25, 143–149. [Google Scholar] [CrossRef]
- Hammad, A.W.; Akbarnezhad, A.; Oldfield, P. Optimising embodied carbon and U-value in load bearing walls: A mathematical bi-objective mixed integer programming approach. Energy Build. 2018, 174, 657–671. [Google Scholar] [CrossRef]


| Sets | |
| Component belongs to the building envelope system , including the roof, floors and external walls. | |
| Set that contains available insulation materials. | |
| Set that includes a range of thickness to be tested for envelope component . | |
| Parameters | |
| The insulated area of component using material . | |
| Temperature difference. | |
| Heating Degree days. | |
| Cooling Degree days. | |
| Mechanical heating and cooling system efficiency. | |
| The thermal resistance of the inner air film of component . | |
| The addition R-value of the continuous assembly layers of component . | |
| The thermal resistance of the outer air film of component . | |
| Binary parameter, which equals 0 when the component is slab-on-ground floor system, and 1 other. | |
| The fractional area value of the heat flow path via the opaque structure in component . | |
| The fractional area value of heat flow path via the cavity in component . | |
| The thermal resistance of the heat flow path via the opaque component. | |
| Variables | |
| The volume of an insulation layer using material for component . | |
| The density of insulation material . | |
| The embodied energy coefficient of material . | |
| The thickness of the insulation layer for component . | |
| The overall thermal transmittance of the building envelope. | |
| The total thermal transmittance of component . | |
| The area-weighted R-value of the parallel heat flow path in component . | |
| The thermal resistance of the material utilised for material . | |
| Thermal conductivity of material . | |
| Objective Functions | |
| Embodied Energy of the insulation system. | |
| Heat Transfer via the insulation system. | |
| Q | Heat transfer rate. |
| Element | Layer | Thickness | Thermal Conductivity | R-Value |
|---|---|---|---|---|
| External Wall | Outdoor Air Film | 0.04 [63] | ||
| Brick | 110 mm | 0.5400 W/(m·K) | ||
| Air Cavity | 50 mm | 0.025 W/(m·K) | ||
| Insulation | ||||
| Vapour Retarder | ||||
| Timber Stud Layer | 90 mm | 0.1200 W/(m·K) | ||
| Gypsum Board | 10 mm | 0.6500 W/(m·K) | ||
| Indoor Air Film | 0.12 [63] | |||
| Floor | Indoor Air Film | 0.16 [63] | ||
| Flooring | 15 mm | 1.2000 W/(m·K) | ||
| Insulation | ||||
| Damp Proof Membrane (DPM) | ||||
| Concrete Slab | 100 mm | 1.0460 W/(m·K) | ||
| Roof | Outdoor Air Film | 0.05 [74] | ||
| Metal Roof Sheeting | 1 mm | 230.0000 W/(m·K) | ||
| Air Cavity | 50 mm | 0.025 W/(m·K) | ||
| DPM | ||||
| Insulation | ||||
| Timber Rafter/Joist | 200 mm | 0.130 W/(m·K) | ||
| Plaster | 10 mm | 0.5100 W/(m·K) | ||
| Indoor Air Film | 0.11 [74] | |||
| Insultation Type | Index | Embodied Energy Coefficient (MJ/kg) | Thermal Conductivity (W/m·K) | Density (kg/m3) |
|---|---|---|---|---|
| Cellulose | 1 | 2.12 | 0.042 | 43 |
| Mineral Wool | 2 | 16.6 | 0.038 | 140 |
| Rock Wool | 3 | 16.8 | 0.033 | 100 |
| Fibreglass | 4 | 28 | 0.04 | 10 |
| Expanded Polystyrene (EPS) | 5 | 92.9 | 0.035 | 23 |
| Polyurethane Foam (PUR) | 6 | 101.5 | 0.028 | 30 |
| Flax | 7 | 39.5 | 0.0565 | 60 |
| Woodwool | 8 | 10.8 | 0.08 | 45 |
| Recycled Wool | 9 | 20.9 | 0.038 | 140 |
| Element | Index | Thickness (mm) | |
|---|---|---|---|
| Wall | 1 | 75 | [83] |
| 2 | 90 | ||
| 3 | 140 | ||
| Floor | 4 | 30 | [84] |
| 5 | 40 | ||
| 6 | 50 | ||
| 7 | 75 | [85] | |
| 8 | 90 | ||
| Roof | 9 | 60 | [86] |
| 10 | 80 | ||
| 11 | 100 | ||
| 12 | 110 | ||
| 13 | 130 |
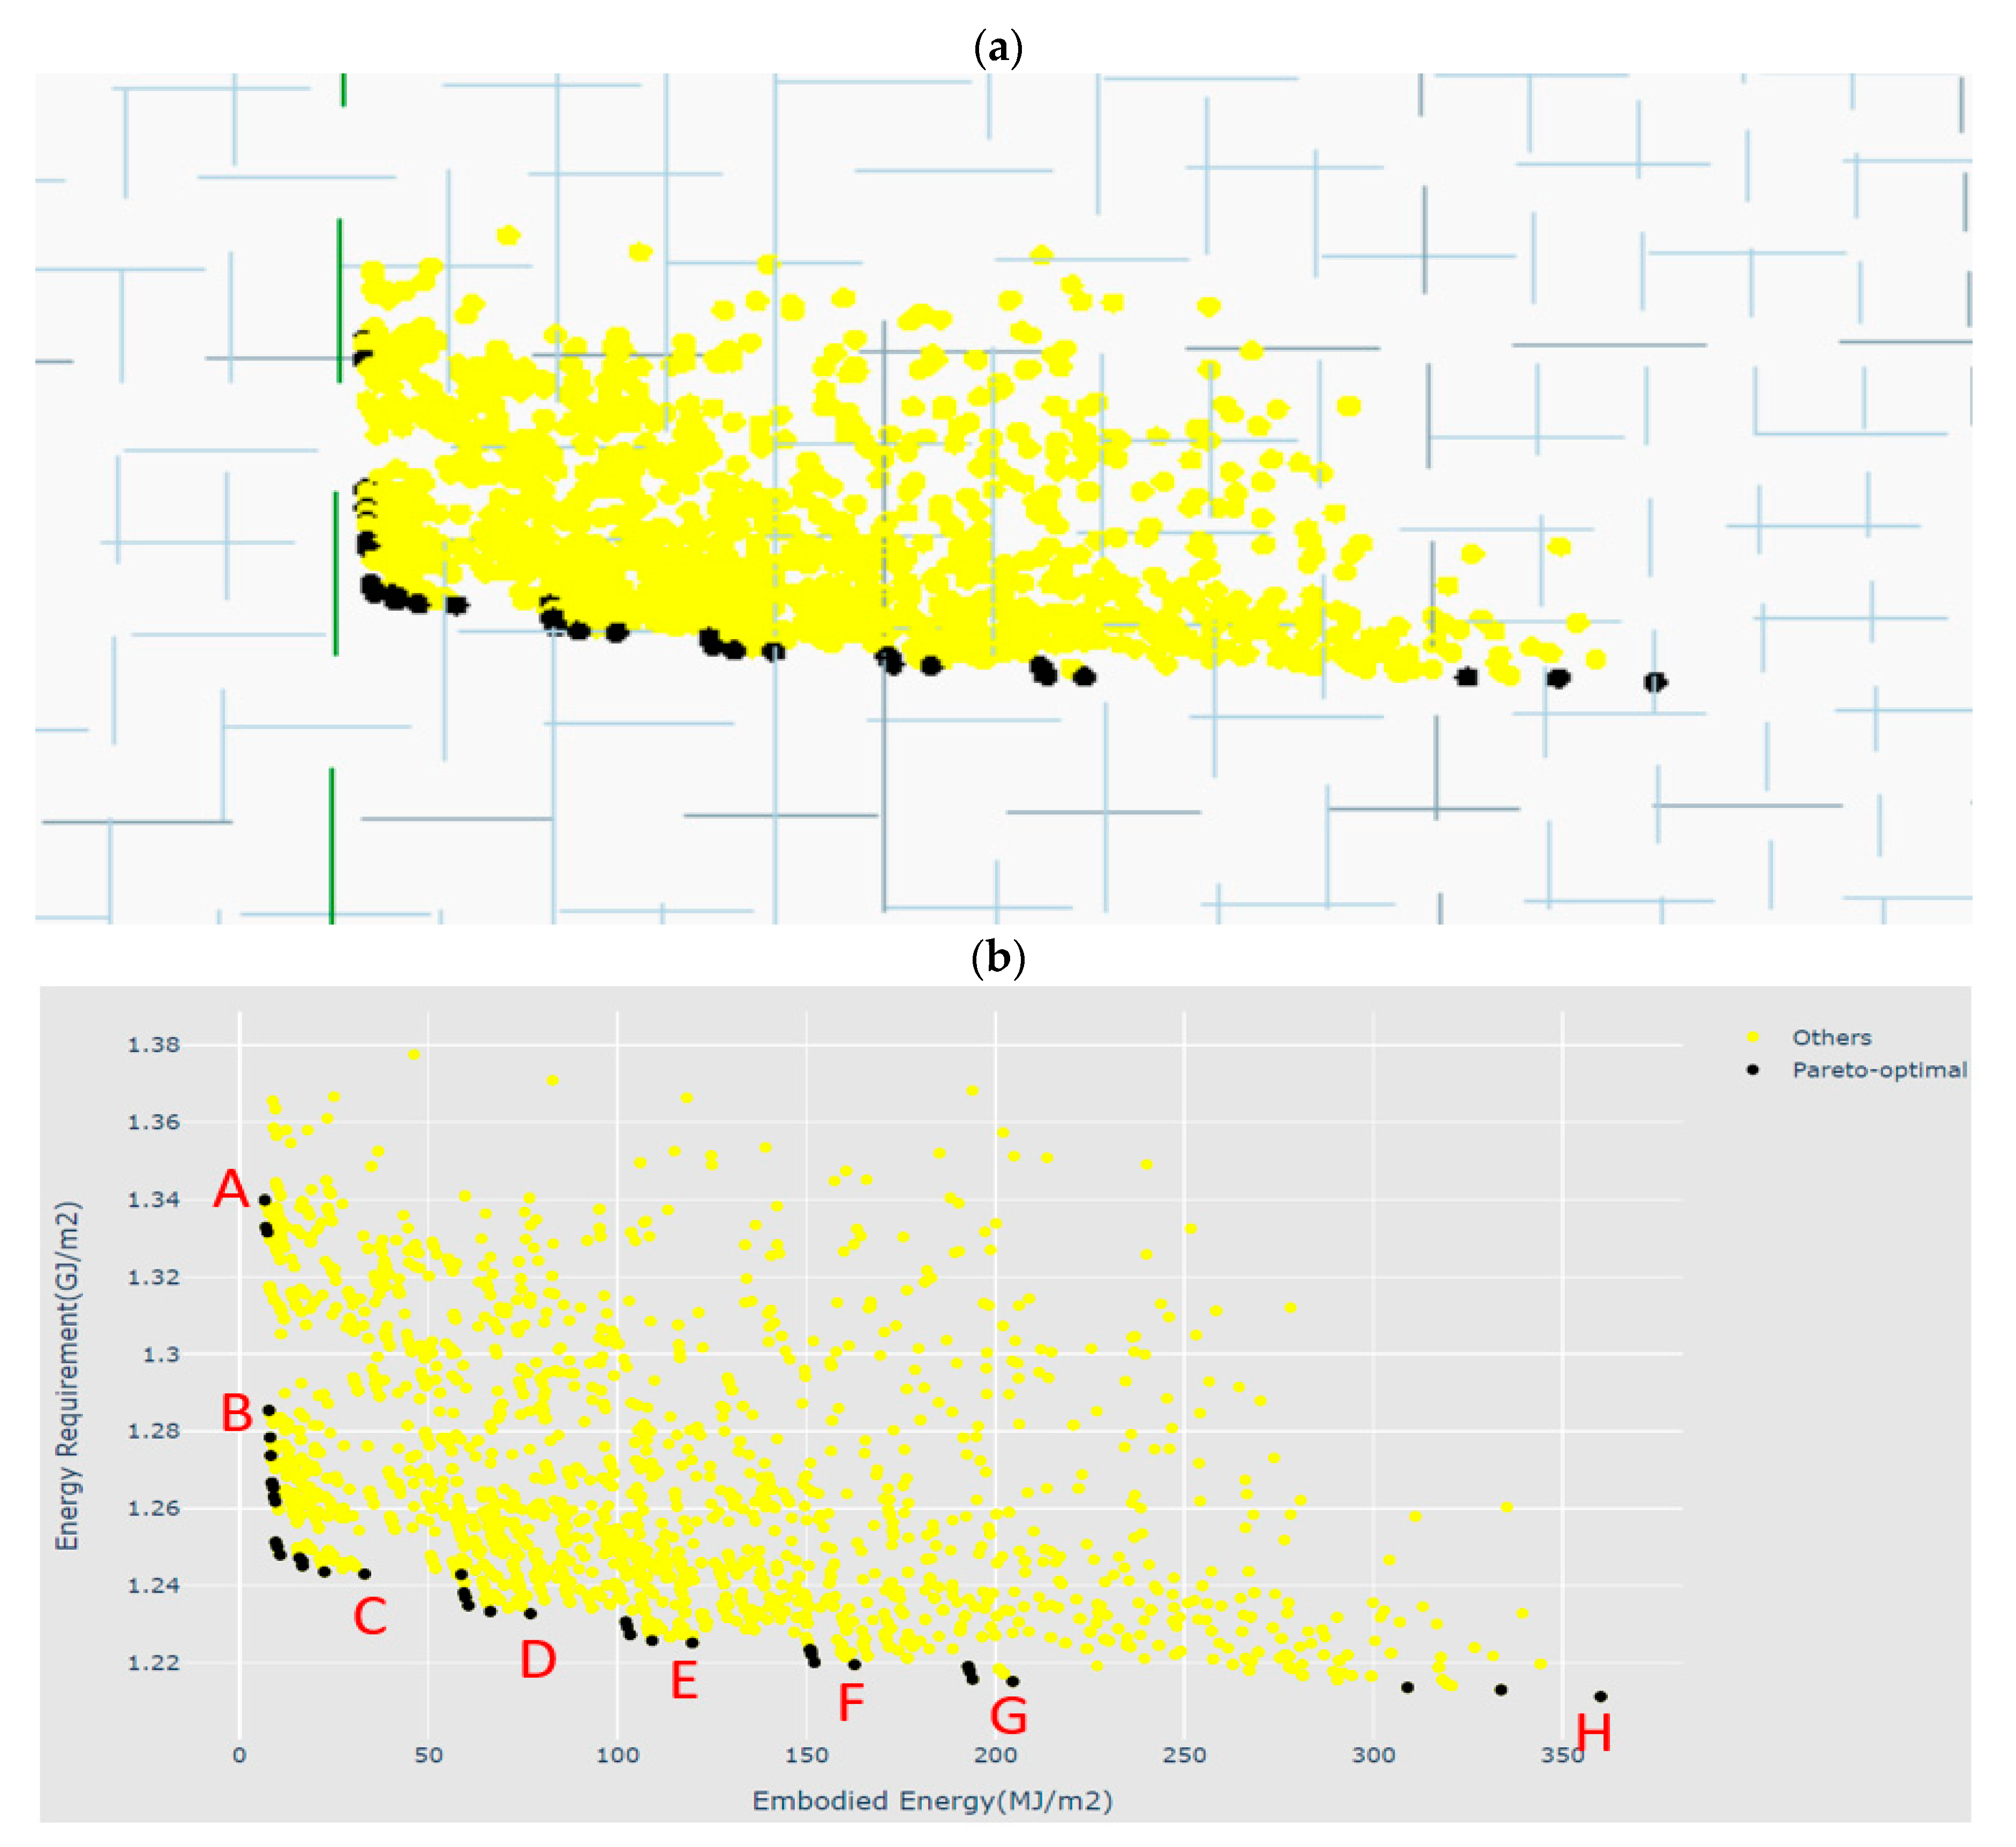
| Roof | Floor | Wall | Objective Functions | |||||
|---|---|---|---|---|---|---|---|---|
| Type | Width (mm) | Type | Width (mm) | Type | Width (mm) | ER (GJ/m2) | EE (MJ/m2) | |
| A | Cellulose | 100 | Cellulose | 40 | Cellulose | 75 | 1.3399 | 6.7115 |
| B | Cellulose | 100 | Cellulose | 75 | Cellulose | 75 | 1.2854 | 7.8229 |
| C | Fibreglass | 130 | Fibreglass | 90 | Fibreglass | 140 | 1.2430 | 33.1118 |
| D | Fibreglass | 130 | Rock Wool | 90 | Fibreglass | 140 | 1.2327 | 77.0042 |
| E | Fibreglass | 130 | PUR | 90 | Fibreglass | 140 | 1.2251 | 119.7994 |
| F | Fibreglass | 130 | PUR | 90 | Rock Wool | 140 | 1.2194 | 162.7309 |
| G | Fibreglass | 130 | PUR | 90 | PUR | 140 | 1.2151 | 204.5891 |
| H | PUR | 130 | PUR | 90 | PUR | 140 | 1.2112 | 360.0903 |
Publisher’s Note: MDPI stays neutral with regard to jurisdictional claims in published maps and institutional affiliations. |
© 2020 by the authors. Licensee MDPI, Basel, Switzerland. This article is an open access article distributed under the terms and conditions of the Creative Commons Attribution (CC BY) license (http://creativecommons.org/licenses/by/4.0/).
Share and Cite
Chen, Z.; Hammad, A.W.A.; Kamardeen, I.; Akbarnezhad, A. Optimising Embodied Energy and Thermal Performance of Thermal Insulation in Building Envelopes via an Automated Building Information Modelling (BIM) Tool. Buildings 2020, 10, 218. https://doi.org/10.3390/buildings10120218
Chen Z, Hammad AWA, Kamardeen I, Akbarnezhad A. Optimising Embodied Energy and Thermal Performance of Thermal Insulation in Building Envelopes via an Automated Building Information Modelling (BIM) Tool. Buildings. 2020; 10(12):218. https://doi.org/10.3390/buildings10120218
Chicago/Turabian StyleChen, Zixuan, Ahmed W. A. Hammad, Imriyas Kamardeen, and Ali Akbarnezhad. 2020. "Optimising Embodied Energy and Thermal Performance of Thermal Insulation in Building Envelopes via an Automated Building Information Modelling (BIM) Tool" Buildings 10, no. 12: 218. https://doi.org/10.3390/buildings10120218
APA StyleChen, Z., Hammad, A. W. A., Kamardeen, I., & Akbarnezhad, A. (2020). Optimising Embodied Energy and Thermal Performance of Thermal Insulation in Building Envelopes via an Automated Building Information Modelling (BIM) Tool. Buildings, 10(12), 218. https://doi.org/10.3390/buildings10120218