Article

Italian Household Load Profiles: A Monitoring Campaign

Power System Development Department, Ricerca sul Sistema Energetico—RSE S.p.A., via Rubattino 54, 20134 Milan, Italy
*
Author to whom correspondence should be addressed.
Buildings 2020, 10(12), 217; https://doi.org/10.3390/buildings10120217
Submission received: 27 October 2020 / Revised: 22 November 2020 / Accepted: 25 November 2020 / Published: 27 November 2020
(This article belongs to the Section Building Energy, Physics, Environment, and Systems)

Abstract

:
The increasing share of renewable energy sources on the supply side, as well as the so-called electrification pathways on the demand side, has led to peculiar challenges for electrical systems: Indeed, the increasing load demand has to be balanced from the supply-side viewpoint. In particular, the residential sector contributes to nearly 26% of the final energy consumption in Europe, suggesting that a further understanding of households’ consumptions and load profiles is needed to support an energy transition. In this context, this paper contributes to the existing discussion by proposing a sociodemographic analysis of Italian households’ load profiles using a smart metering experimental study, while also considering the households in energy poverty conditions. For the sake of generality, results are presented based on a previously proposed household segmentation of the Italian residential sector. The outcomes point out three prominent peaks on load profiles for all the identified clusters, with a notable distinction in intensity. Where children are present, a higher load profile is noted, reaching a maximum value of 600 W of absorbed power between 19:30 and 22:30. Conversely, households in an energy poverty condition show a relatively regular load profile, ranging from a minimum of 110 W of absorbed power in baseload conditions at night time to a maximum of 280 W in the evening hours. The findings in this paper are in agreement with existing research in the field, and accordingly the study proposes a better focus on domestic appliances and sociodemographic parameters.

1. Introduction

The European Green Deal (EGD) [1] sets challenging actions against climate change, including the energy sector’s decarbonization. In this perspective, energy systems are undergoing significant transformations, such as increasing the share of renewable energy sources (RESs), leading to a more distributed and fluctuating power generation. Looking at the residential sector, households are responsible for 26% of the EU’s final energy consumption in 2018 [2]. RESs and electricity account for 45% in this share (natural gas for 32% and petroleum products for 12%), taking part in power generation through photovoltaic (PV) and micro-CHP (combined heat and power) technologies [3,4]. Thus, households play an essential role in future and smart electricity systems as they are relevant electricity consumers, and at the same time, they can contribute to increasing the share of power generation capacity. In this context, a precise knowledge of households’ load profiles is needed, as they strongly influence electricity systems [5]; moreover, knowledge of households’ load profiles supports further investigations and actions in a broader level perspective, such as the supply capacity or the energy market and economy.
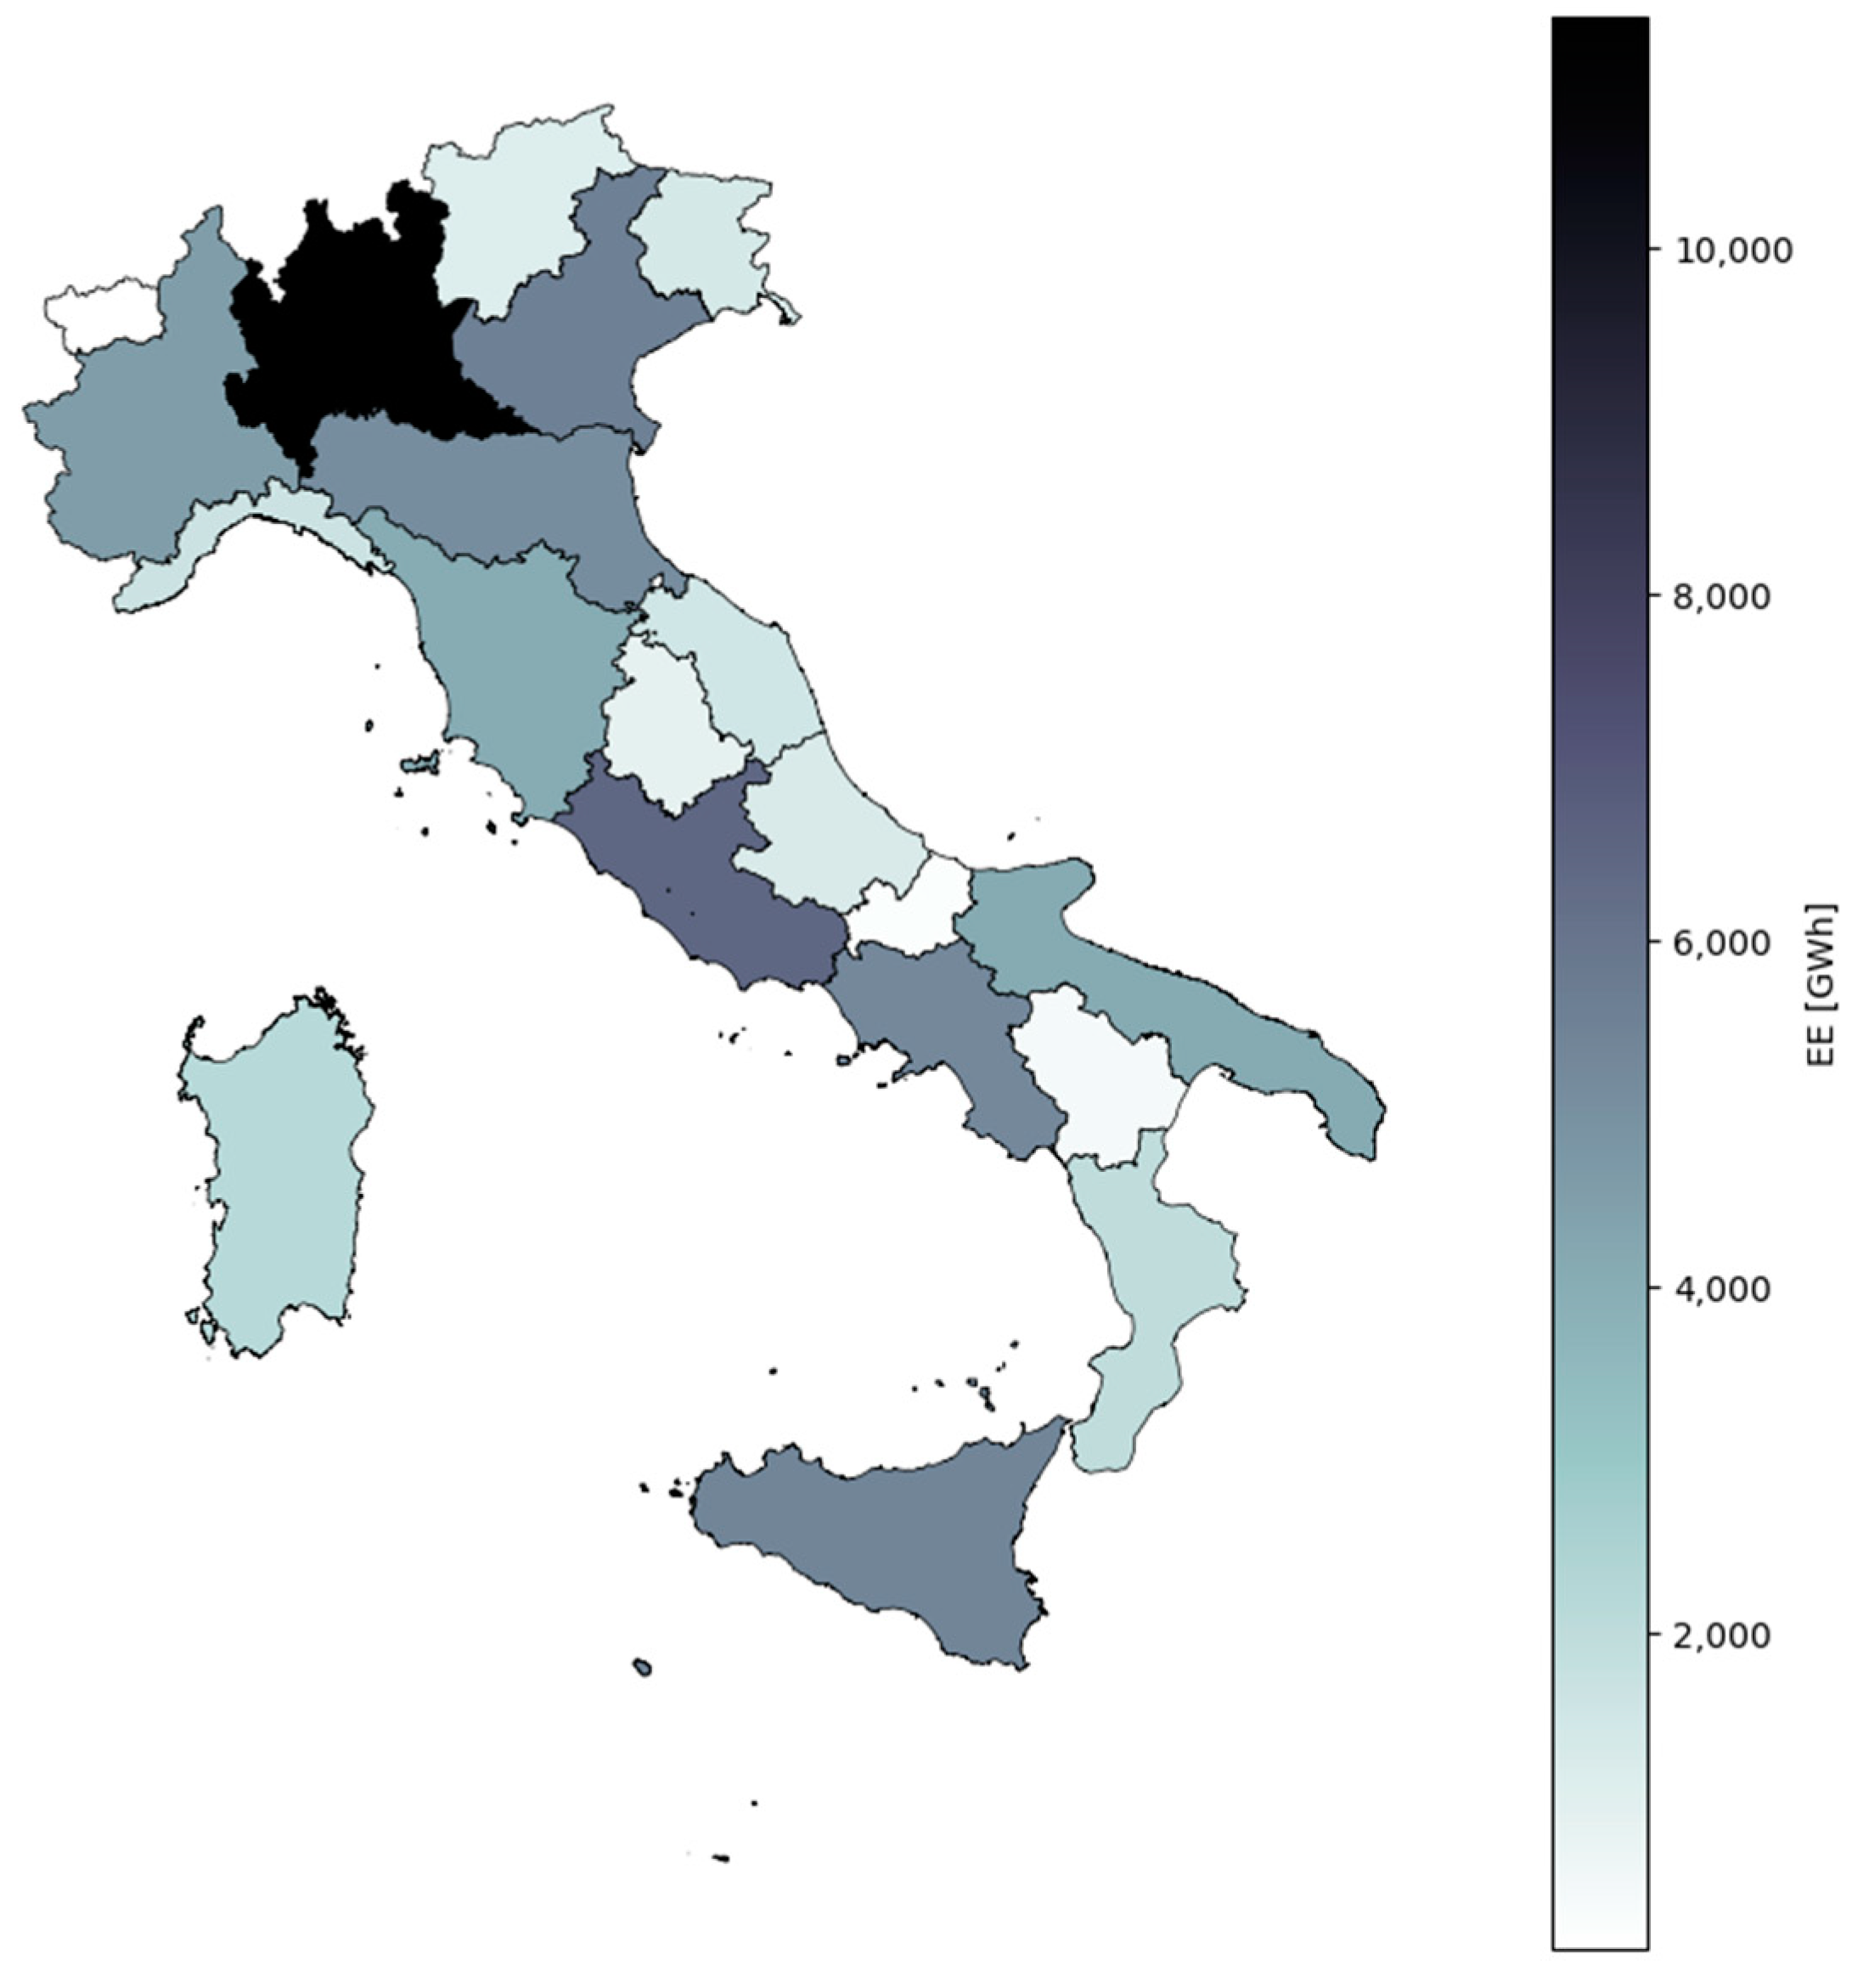
In particular, in Italy, the residential sector has been experiencing an increase of electricity consumption in the last few decades (Figure 1), with roughly constant values from 2013. In this context, the share of electricity consumption of the residential sector by different Italian regions, with a major contribution from the Lombardy region, is indicated in Figure 2. In Italy, mitigation actions related to the EGD are defined by the PNIEC, i.e., the Integrated National Plan for Energy and Climate, which determines the energy transition in the residential sector, and is mainly based on RES. Overall, the energy transition towards RES technologies, which are mainly based on electricity production, requires a significant investment in the energy infrastructure, namely the electricity grid, in order to ensure that the demand side defines the required transport capacity. In addition, the increase of flexibility of RES systems is the main focus in the ongoing research [6,7] as a critical factor for capacity in the demand response mechanism, as well as the possibility to modulate and decrease the peak load of the system, meaning a reduced need on traditional power generation [8].
Nonetheless, in the residential sector, mitigation measures are strictly dependent on sociodemographic spectra; thus, market segmentation is an effective way to identify consumers with similar needs and behaviors [10,11,12]. Moreover, the residential sector segmentation allows us to better characterize the households in energy poverty conditions, and thus to better address economic and technical support aiming at reducing this status [13]. It should be remarked that the identification of energy poverty key parameters is of extreme importance to policymakers when planning investments aimed at reducing the residential sector energy consumption. However, in energy systems modelling, households are often represented by a standard load profile, as in Foteinaki et al. [14], based on historical data, not entirely reflecting ongoing changes. A more detailed segmentation of the residential sector, such as Yilmaz et al. [15], allows us to achieve representative electricity demand profiles and to improve existing models concerning using standard patterns that fit all households. The definition of user engagement actions for energy consumption reduction in the residential sector is critical due to the difficulty in assigning energy consumption changes caused by behavioral measures rather than other uncontrolled external factors. Some changes within observed and quantified variations in the energy consumption could occur even without implemented actions [8]; thus, it is crucial to investigate and replicate physical experiences that can be implemented in more extended cases. The investigation on energy consumption changes, concerning the “baseline” case, often relies on surveys [16], e.g., written questionnaires, phone interviews, ICT (information and communication technology) guided; these take the end user’s self-certification of their performances, which requires their perception on their own behaviors and habits, done in a subjective analysis that could be biased against reality [17]. To exclude the subjective bias, a significant measure of energy savings should be carried into the investigation regarding the overall energy consumption and the energy absorbed by a single appliance [18]. In addition, the choice of users involved in the user engagement project is essential: Studies based only on voluntary participation increase the risk of a bias in end-user typology, making it challenging to obtain generalizable results. Thus, it is essential to choose a representative sample and adapt the methodology to the different socioeconomic groups.
This paper contributes to the existing discussion by proposing a sociodemographic analysis of the Italian households’ load profiles from a smart metering experimental study, while also considering the households in energy poverty conditions. In particular, to measure the changes in energy consumption, a monitoring campaign is defined within the project, referred to as “Energia Su Misura” (a phrase meaning “customized energy”, with misura referring also to measurement and thus the wordplay). This project aims at increasing consumer awareness, providing accurate information on the best consumption-saving behaviors, and reducing bill costs. However, the physical testing can be carried out for only a limited number of cases because of management costs and operational difficulties; thus, the choice of families involved is undoubtedly essential. Hence, the Italian households’ segmentation proposed by Besagni G. and Borgarello M. [19] is used as a reference to identify which clusters of families to involve in the project, based on characteristics such as the family unit, the purchasing power, the seniority, and the level of education; in addition, elaborations and estimates from the Italian National Institute of Statistics (ISTAT) data and market research are used to define the types and quality of domestic appliances available in the households, with the objective to further improve households’ segmentation and cluster family choice. The defined clusters are thereby representative of the Italian households consumptions and behaviors, with accurate approximations; thus, by conducting measurements within the representative clusters, the results can be generalized and exploited to characterize the possible energy savings of the different types of households at a national level (e.g., waste reduction, appliances replacement) in the perspectives of awareness raising, training, and information campaigns. Moreover, the results regarding the load profiles of both total and single-appliance energy consumptions can be applied to validate load profile simulation models [14,15,20,21,22] or to decrease the time steps of more general energy consumption estimation models, in particular in exploiting a bottom-up approach such as MOIRAE [23].
The paper is structured as follows. In Section 2, a comprehensive literature review is carried out. In Section 3, the monitoring campaign is defined, the representative sample is characterized, and the Italian residential sector segmentation is introduced. The results regarding single-appliance usage and total electricity load profiles with a sociodemographic differentiation are then presented in Section 4; in particular, households in energy poverty conditions are characterized. Thus, the results are discussed in Section 5, and Section 6 includes the paper conclusions.

2. Literature Review

To better fit the proposed contribution within the present body of knowledge, a brief literature discussion is proposed here. The pathways towards a decarbonized economy combine different strategies, including the increasing penetration of renewable energies, the development of electric vehicles, and the electrification of the energy systems. To achieve greater flexibility to manage the different energy flows that are needed for energy transitions, the data from the electrical system and its associated services (e.g., electricity grid) must be gathered to improve the efficiency, reliability, and security of the system [24].
In this context, smart meters (SMs) provides large temporal datasets for household electricity consumption, allowing for a high resolution at the level of individual households and thus representing a powerful tool for time-series analyses [25,26]. The number of research activities related to the analytics of smart meter data is overgrowing with a wide variety of potential applications. Moreover, demand-side management measures for residential consumers have a great potential in providing flexibility to the grid, thereby reducing investment needs; this leads to higher investment in the grid infrastructure and an economic inefficiency, compared to increasing the supply-side capacity in order to balance peak demands [27,28]. Based on smart meter data, households may switch electrical devices on and off, within comfort boundaries, in order to handle demand peaks; sophisticated technical solutions in this matter include an automatic system within a smart home [29,30,31]. Further insight into household flexibility potentials is provided by Weber et al. [32], showing how an economic incentive (a contest with different prices) can motivate households’ electricity consumption shift from peak times to higher RES production hours, through a monthly information provision. Indeed, load management can be exploited to better characterize individual end users in order to implement demand-response programs [8,33]. However, smart meter application raises challenges related to privacy and security aspects of energy data analytics, as discussed by Hu and Vasilakos [34]. Smart meter data can be further exploited to forecast energy consumption. Their application within the residential sector is widely spread [35], and thus their employment for demand forecasting methods [36].
Indeed, state-of-the-art models for residential demand forecasting are based on either survey methods [14,22,37] or high time-resolution data [38] (e.g., provided by SMs). For instance, Ge et al. [20] modelled daily load profiles through a generative network, setting a training dataset of real load profiles and mapping such profiles’ probability distribution. Similarly, Sousa et al. [39] highlighted how high-resolution load profiling data are fundamental for neural-network-based forecasting models, and they proposed a day-ahead load profile prediction exploiting such data; moreover, the segmentation of consumers was carried out through clustering algorithms, although sociodemographic variables were not taken into account. Indeed, consumer viewpoints should be investigated in such models, thus taking into account the effects of different types of households’ behaviors and characteristics on the load profiles [19,40,41]. In this regard, Fischer et al. [21] developed a bottom-up method to generate a stochastic high resolution of households’ electric load profiles by including socioeconomic features to better estimate behaviors regarding different types of families; moreover, seasonal effects on load profile were taken into account, using a statistical survey as input database. Conversely, time-use data were exploited by Widén et al. [22] to compute the domestic energy demand for household electricity and hot water, and their work showed a significant correspondence of the output with measurement surveys.
In more recent years, smart building development and spread raised the need to model efficient energy management tools, as addressed by Dadashi-Rad et al. [42], to optimize responsive/nonresponsive devices and distributed RES exploitation. Moreover, the smart meter as a monitoring system allows for the integration with the transport sector, representing an additional challenge for electrification at the household level, as discussed by Liu et al. [43]. However, energy system models often assume a standard load profile of the households, as in Foteinaki et al. [14], not entirely reflecting ongoing changes. As discussed by Hayn et al. [12] a more detailed segmentation of the household sector, through sociodemographic factors, is essential to assess the future development of residential load profiles, thus investigating its impacts on a wider scale. Moreover, the comparison of clustering approaches carried out by Yilmaz et al. [15] pointed out that representative electricity demand profiles derived from household segmentation significantly differ from the average profiles. Thus, household segmentation can improve existing models through specific load patterns.
To further investigate households’ characteristic load profiles, monitoring campaigns are needed. For instance, Craig et al. [44] studied the relationships between household occupants and energy usage through a monitoring campaign in Northeastern Scotland to study how socio-demographic characteristics relate to load patterns, and they found a strict relation with households’ carbon footprint. De Almeida et al. [45] showed energy saving opportunities through an European monitoring campaign, stating that high quality data availability allowed them to define energy efficiency strategies and policy recommendations, along with market transformations. As stated above, a promising method to obtain high-quality resolution data is represented by smart metering. However, a wider spread and installation of smart meters should take into account technical assessments as well as social issues, as discussed by Sovacool et al. [46]. Nonetheless, smart metering has a significant potential in a variety of applications, including energy modelling implementation [20,21,22,36,38,39], households’ behavior characterization [12,15,44], grid infrastructure technical assessments [24,25,26,27,28], and an end user’s awareness raising [8,32,33].

3. Materials and Methods

3.1. Monitoring Campaign

The Energia Su Misura project was structured in two phases: (i) baseline energy consumption patterns characterization and monitoring; and (ii) the identification of actions for energy efficiency improvement through monitoring data analyses and adoption of feedback tools to raise user awareness. However, the main objective is to obtain a generalizable result that implements a method able to extrapolate these results through punctual measurements. The possibility of generalization relies on the choice of representative samples that are able to characterize as much as possible all Italian households; thus, we determined which households should be involved in the project by using the segmentation of Italian households proposed by Besagni G. and Borgarello M. [19] using ISTAT data and identifying the different types of households included in clusters. Moreover, other challenging issues have to be addressed: (i) the use of noninvasive technologies, which should also be reliable, easy to use, nonhazardous, and cheap, thus allowing for their diffusion in the households; (ii) the need for a heterogeneous sample representative of the Italian residential sector; (iii) the organization of a sufficiently long measurement period that should also be compatible with the research time; (iv) privacy and security issues that are related to the direct involvement of end users in the project, with correlated effects on their comfort and behavior. For the first phase of the project, a monitoring tool kit was installed to monitor the baseline energy consumptions for both the overall household and the single appliances. Then, feedback systems were installed to provide personalized suggestions to the users to enhance energy efficiency measures, while also allowing for significant variation on their behaviors.
The EnergyNote [47] and FARNetworks [48] feedback systems were used for the abovementioned purpose. EnergyNote is provided by the Green Energy Options company and includes a color display, a transmitter of the energy measurement from the power meter, several smart plugs, and a bridge for data transmission through a router and an internet connection. The main advantage of this system is the noninvasive and user-friendly structure as well as the efficacy and affordability. However, even though EnergyNote displays complete historical data (with a maximum range of two years), it presents some limitations on subsequent analyses, in that it only includes the total energy consumption and expense per appliance, without the possibility to introduce a more in-depth investigation; moreover, the option available for data export is given only for every single appliance. To overcome these limitations, we used the FAR Networks system, developed with the partner company Flexvalley [49], and this system is similar to EnergyNote. It includes a Raspberry Pi based concentrator with a UMTS (universal mobile telecommunications system) interface, several smart plugs communicating through BLE (Bluetooth light emission) with a concentrator and router for data transmission. Conversely, it has neither a color display nor a transmitter of the energy measurement from the power meter, but it maintains the same advantages of the previous system. Compared to the previous system, the FAR Networks system presents a complete management platform that allows users to monitor the position and state (i.e., on/off) of every component and to conduct specific operations (e.g., restart, analysis, etc.); moreover, the management platform supports the definition of the energy flows and the memorization of data from multiple appliances and users. This allows us to perform more complex postprocessing analyses, integrate the energy consumption data from all the users, and include external data (such as ambient temperature) and personalized final reports; in addition, all data can be exported for further studies. All feedback systems and components described above were tested in the Ricerca sul Sistema Energetico (RSE) laboratories before installing them in the chosen end users’ households. The installation of the feedback systems is shown in Figure 3 and Figure 4.

3.2. Monitored Households

The representative sample of monitored households consists of 67 families, located in Northern Italy (55% of the total number of households), Central Italy (37%), and Southern Italy (7%). A significant number of households (26 families) live in public housing in Milan (ERP) and may represent the households living in energy poverty conditions. The other 41 families live in apartments and private houses and may represent the nation’s middle class. The geographical distribution of the monitored households is summarized in Table 1.
There is a significant difference in the number of individuals between ERP inhabitants (average of 1.4 individuals) and non-ERP ones (more than 3), and the average number of individuals is higher in Southern and Central Italy than in Northern Italy, reaching the minimum in Milan. Moreover, in ERP houses live mainly families that have one single female individual, and the number of ERP households decreases exponentially as the number of individuals increases. Conversely, the non-ERP households present a bell-shaped distribution for the number of individuals, reaching the maximum at 4 individuals. The inhabited surface area of ERP houses is, on average, 46 m2, taken independently from the number of individuals, whereas the surface area of non-ERP houses increases linearly with the number of individuals, ranging from 74 m2 for single-individual households to 170 m2 in large families. Table 2 shows the composition by the age of the individuals in the monitored households. By increasing the number of individuals, the number of youngsters increases as well, whereas the number of elders decreases; indeed, elders represent a large part of single-individual families. Households with 3–4 individuals represent the typical Italian household, with individuals between 35 and 64 years with children.
Table 3 reports the number of monitored appliances, subdivided by ERP and non-ERP households. The appliances involved were defined by their relevance in the Italian residential sector regarding energy consumption and distribution and usage. However, only a limited number of appliances could be measured due to multiple factors: (i) the limitation due to the maximum number of measurable appliances by the monitoring kit installed in the households (maximum 6); (ii) the difficulty to install a smart plug-in in some particular cases (e.g., ovens and dishwashers integrated into the cabinetry); and (iii) the local failures and damages of the measurement equipment, leading to data leakages. The major appliances present in the active households are fridges, TVs, and washing machines because of their diffusion and them having the most straightforward installation of the measurement kit, whereas ovens’ and dishwashers’ plugs are harder to reach; conversely, microwaves are not present in all households. Moreover, the monitored appliances (excluding power meters) contribute to about 43% of total annual electricity consumption in the Italian households [23]; in particular the contribution account for 15.3% from fridges, 7.0% from TVs, 10.6% from washing machines, and a minor contribution of 5.3% from dishwashers, and 4.2% from ovens [23]. Nonetheless, in related future research activity, other household appliances will be monitored, as well as a greater sample.

3.3. Residential Sector Segmentation

Following the households’ segmentation proposed by Besagni G. and Borgarello M. [19], the monitored households were subdivided into clusters by type of household structure, by geographic area, and by inhabited surface area, as follows:
  • Household structure:
    • Single person 18–34 years
    • Single person 35–64 years
    • Single person > 65 years
    • Couple without children 18–34 years
    • Couple without children 35–64 years
    • Couple without children > 65 years
    • Couple with 1 child
    • Couple with 2 children
    • Couple with 3 or more children
    • Single parent
    • Other
  • Geographic area:
    • Northwest: Piedmont, Aosta Valley, Liguria, Lombardy
    • Northeast: Trentino-South Tyrol, Veneto, Friuli-Venezia Giulia, Emilia Romagna
    • Central: Tuscany, Umbria, Marche, Lazio
    • South: Abruzzo, Molise, Campania, Apulia, Basilicata, Calabria
Following the criteria mentioned above by using the analyses described in Section 3.2 and adopting the same definition as the reference [19], the households were grouped in clusters, as shown in Figure 5 and Table 4. It is worth mentioning that the segmentation analysis proposed by Besagni and Borgarello [19] was based on a statistical classification and regression trees (CART) approach, and such a method may be applied to other regions or countries, with the variables and predictors adjusted to the specific case to be studied.
As shown in Table 4, Cluster 7 encompasses the majority of ERP households that are situated in North Italy, whereas Cluster 1 includes mainly households in Central Italy. Leakage is seen in the number of samples for Southern Italy; in further research activities, this gap will be addressed to broaden the monitored sample, and the north–south diversity will be subsequently investigated. For additional insight in this context and energy poverty issue, see Reference [50].
The monitored household clustering was validated by confronting their energy consumption with data available from ISTAT, exploiting 15,000 households as representative samples. The average values are coherent between the two, in particular for Clusters 6 and 7, whereas for Clusters 1 and 3 the results from the monitored sample are included in the standard deviation of the ISTAT data. Results of Cluster 2 diverge significantly, but it should be noted that as the number of households is very limited in this cluster, the influence of outlier values is more significant, thus resulting in an evident difference. It is noted that Cluster 7 includes mostly ERP households, thus suggesting this cluster to be representative of households in a situation of energy poverty. Table 5 summarizes the data regarding the sociodemographic dimension of the clusters.

3.4. Control Patterns

The main objective of the monitoring campaign is to characterize users’ behaviors and energy consumption patterns; thus, it is necessary to define a monitoring period long enough to reproduce the baseline energy consumption pattern, and to exclude the unusual behavior and the outlier data, i.e., the data leakages due to the absence of users or to extreme weather situations. In particular, for power meters, the data leakages regarding quarters of an hour were excluded since it is unlikely not to have at least standby energy consumptions in the households, and thus this is interpreted as a signal error. Overall, the average monitoring time is around 188 days, as summarized in Table 6, with a minimum of 133 days and a maximum of 331 days, as shown in Figure 6. The monitoring period includes different months to better grasp households’ daily routines. To better determine the measurements’ reliability, the percentage of the monitored time concerning the overall monitoring period was computed; indeed, it defines the representativity of the monitored values since it characterizes how much the feedback system worked concerning the total monitored period. Figure 7 shows the values for all appliances and all clusters; we noted a relatively low value for the power meters due to its high sensitivity to failures, whereas for the appliances, the values are relatively high, reaching a maximum of 97%. On average, the monitoring percentage is around 80% for the appliances, but the power meter one is slightly higher than 50%, considering all the monitored samples.

4. Results

4.1. Monitored Appliances Usage

In Table 7, the distribution of monitored appliances and their average daily and annual energy consumptions are reported. The average energy consumption was calculated by considering the total consumption that was measured for all monitoring period and the significant number of days of monitoring campaign, without distinction between weekdays and holidays. We noted how Cluster 7, which includes a large number of ERP households and is representative of the energy poverty condition, has the minimum energy consumptions in comparison with the other clusters. Moreover, Clusters 6 and 7 do not include dishwashers.
Table 8 summarizes the monitored domestic appliances by average energy consumption per cycle, the average number of cycles per day, the average duration of the cycle, and average operating time. A cycle is defined as a continuous operating time with an energy consumption higher than the standby mode value, and it is preceded and followed by a period with a standby energy consumption or lower. Standby energy consumption is set to 0.002 kWh/15 min, calculated with a mean absorbed power of 8 W in 15 min. In this way, local energy consumption decreases are interpreted as instantaneous power decreases instead of new cycles. The average energy consumption per cycle is computed as the total energy consumption divided by the number of cycles calculated, as stated above. The appliances occasionally used have an average consumption from 0.5 to 1 kWh/cycle even with high absorbed power (dishwashers, ovens, and washing machines); conversely, even with a lower absorbed power, TVs have a similar energy consumption due to the continuous operating mode. Microwaves present a shallow consumption (lower than 0.2 kWh/cycle), while fridges have a shallow consumption considering their continuous operating mode, resulting in an average of 1 kWh/day of energy consumption.

4.2. Load Profiles by Clusters

In this section, the load profiles of the monitored households are characterized. The definition of the load profiles is significant, as it could help to modify the power generation side better accordingly. Moreover, a comparison between different household typologies can be carried out, using the proposed residential sector clustering. As the main objective is the definition of the load curves, only the significant appliances having variable operational cycles were considered:
  • dishwashers;
  • washing machines;
  • TVs;
  • ovens;
  • microwaves.
The probability of usage during the day for each appliance, which results from the monitoring campaign, is summarized in Table 9.
The probability of usage during the day by appliances and by clusters is shown in Figure 8, Figure 9, Figure 10, Figure 11 and Figure 12. Moreover, in Figure 13, the total electricity load profile by clusters that result from the power meter monitoring is shown. Some data leakage may be present due to absence of users or to signal errors; however, it should be noted that such data were detected in nearly zero-load conditions and in night hours, as shown in Figure 8, Figure 9, Figure 10, Figure 11 and Figure 12; thus, it does not affect the relevance of the measurements.

5. Discussion

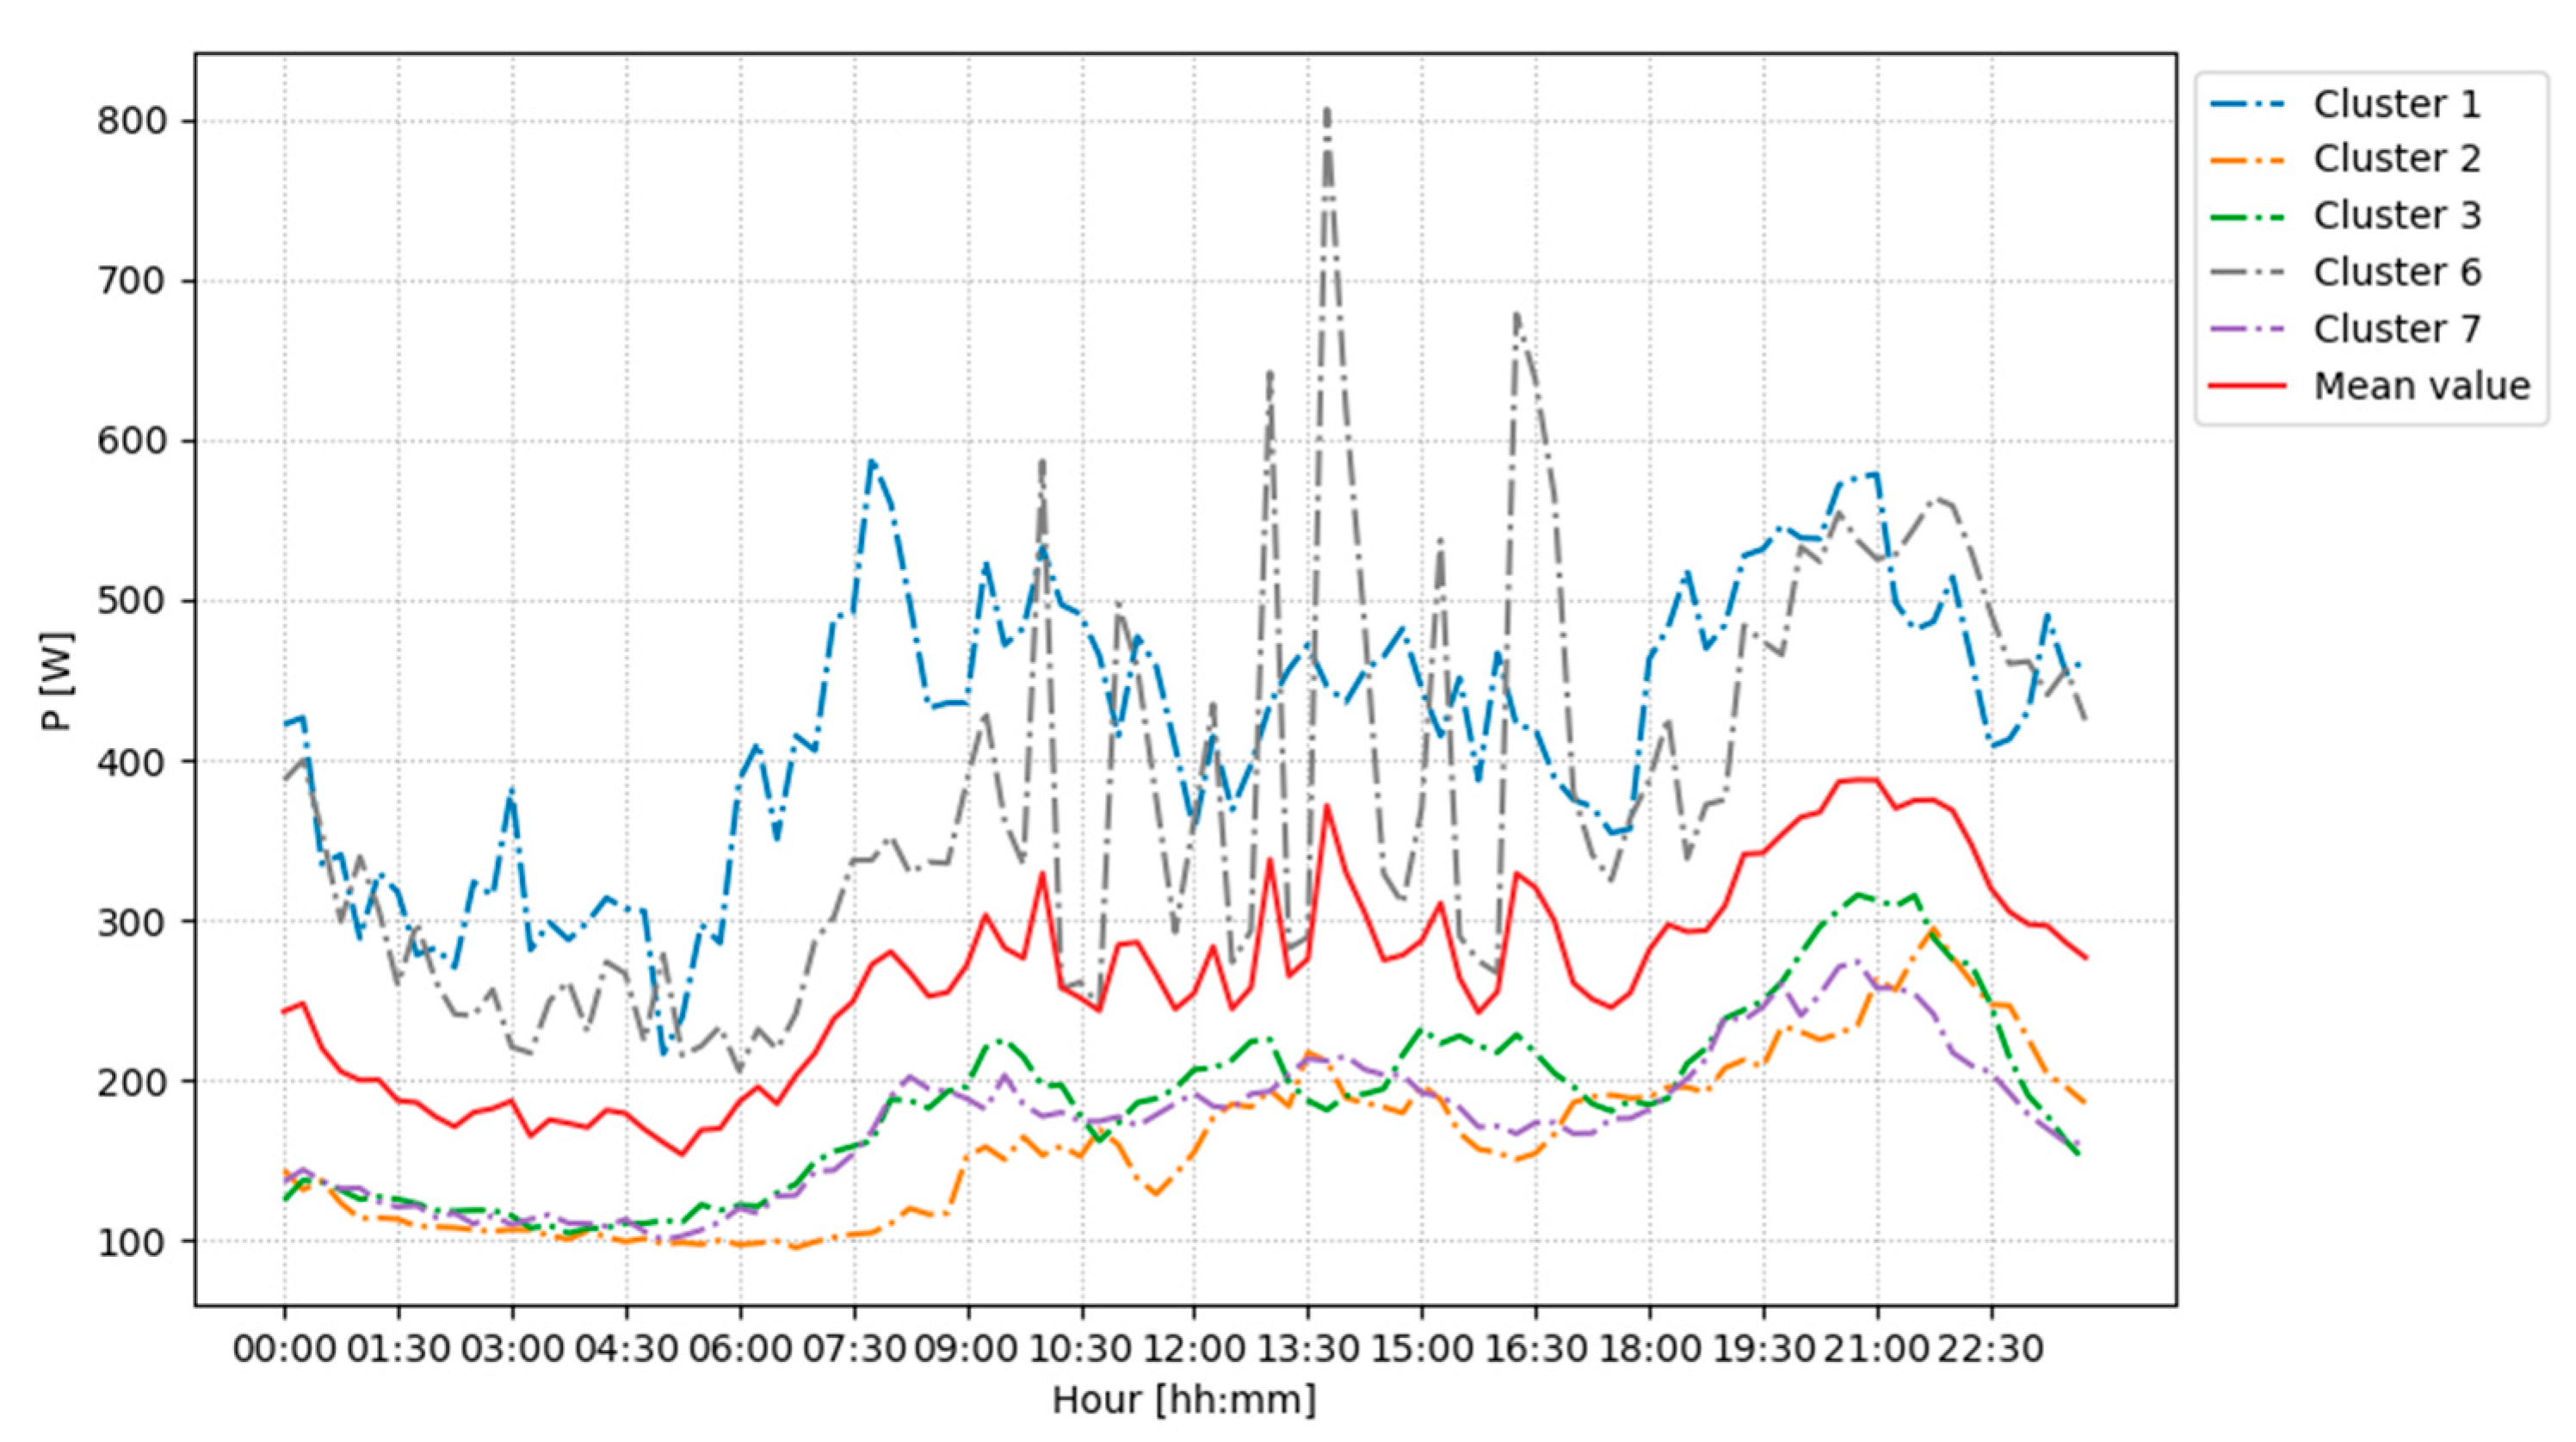
In general, the Italian residential sector presents three peaks:
  • The most empathized one being in the evening hours between 19:30 and 22:30, reaching 580 W of absorbed power for Cluster 1 and 6, and 250–310 W for Clusters 2, 3, and 7;
  • In the early morning from 7:30 to 9:30, reaching 600 W of absorbed power for Cluster 1, 410 W for Cluster 6, and 180–210 W for Clusters 2, 3, and 7;
  • One at lunchtime between 11:30 and 13:30, reaching 480 W of absorbed power for Cluster 1, 500 W for Cluster 6, and 210 W for Clusters 2, 3 and 7.
The power system minimum is reached at night-time hours, at around 2:30–5:30. These results—with the load curve having its maximum in the evening, two relative maximums in the morning, and a plateau in the night—is typical for an Italian working day and agrees with many previous related research [51,52]. The baseload is due to the fridge, standby modes, and electric boilers: they characterize a constant energy consumption all day. The variation in load profiles is mainly due to the other appliances having an uneven distribution in the energy consumption during the day.
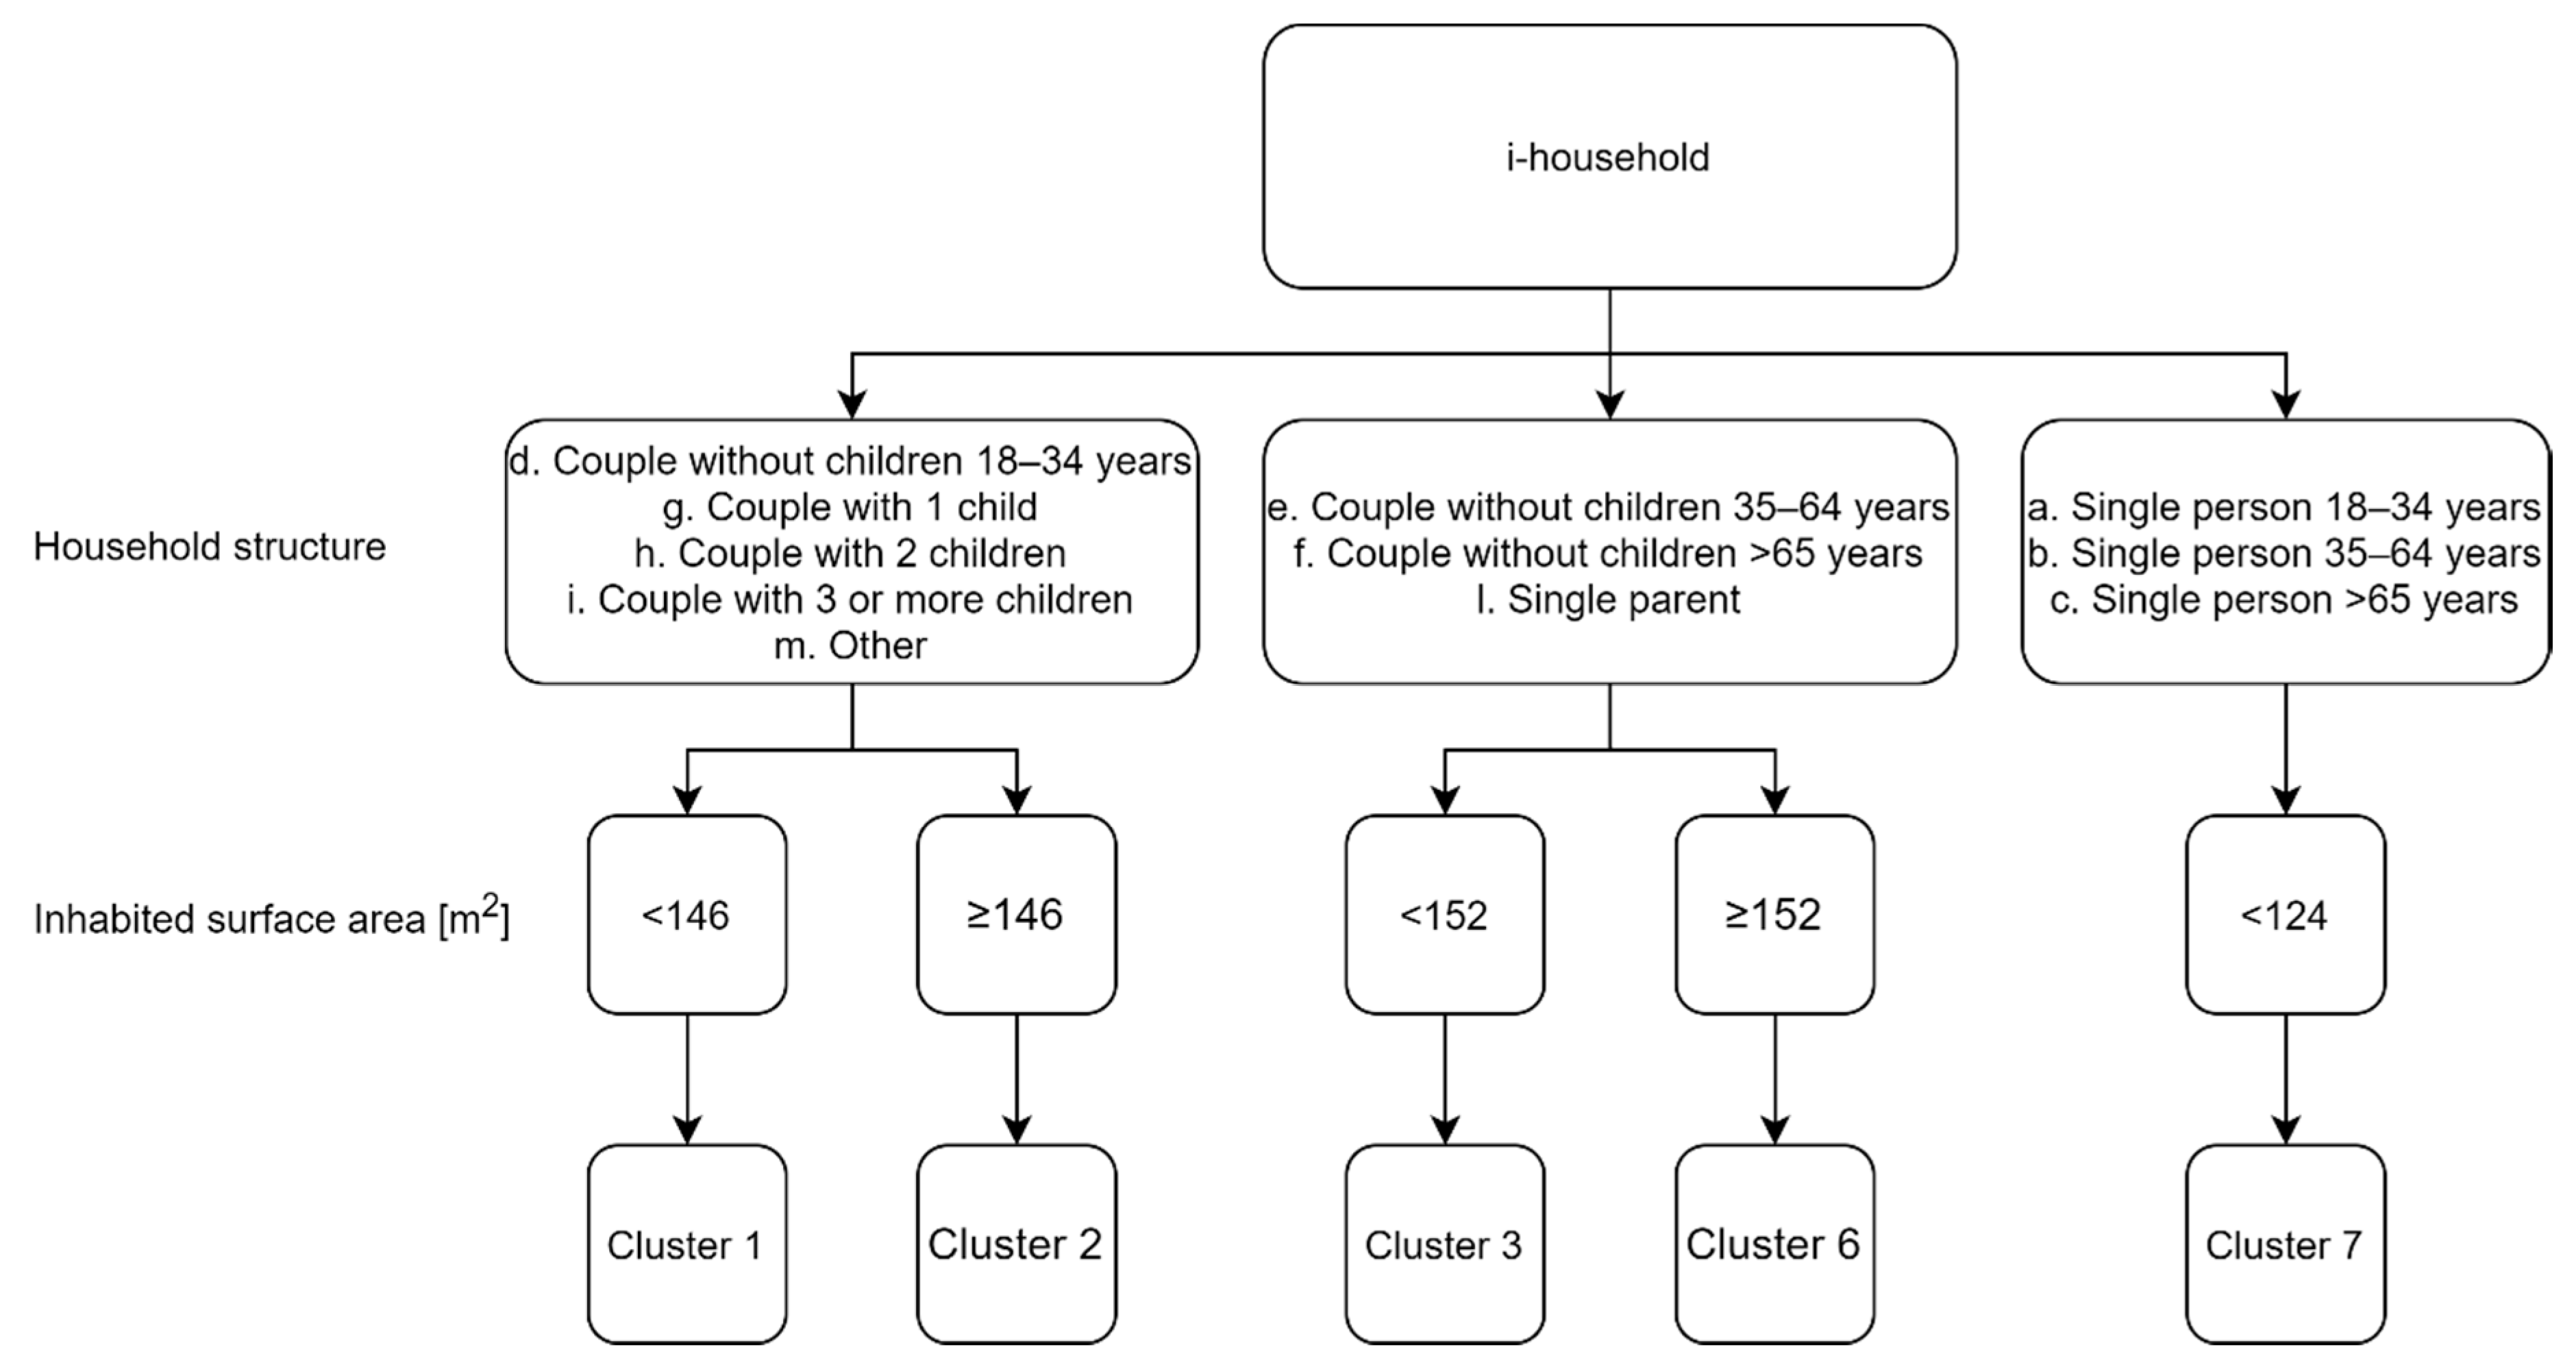
The sociodemographic characterization of the Clusters is displayed in Figure 5 and 
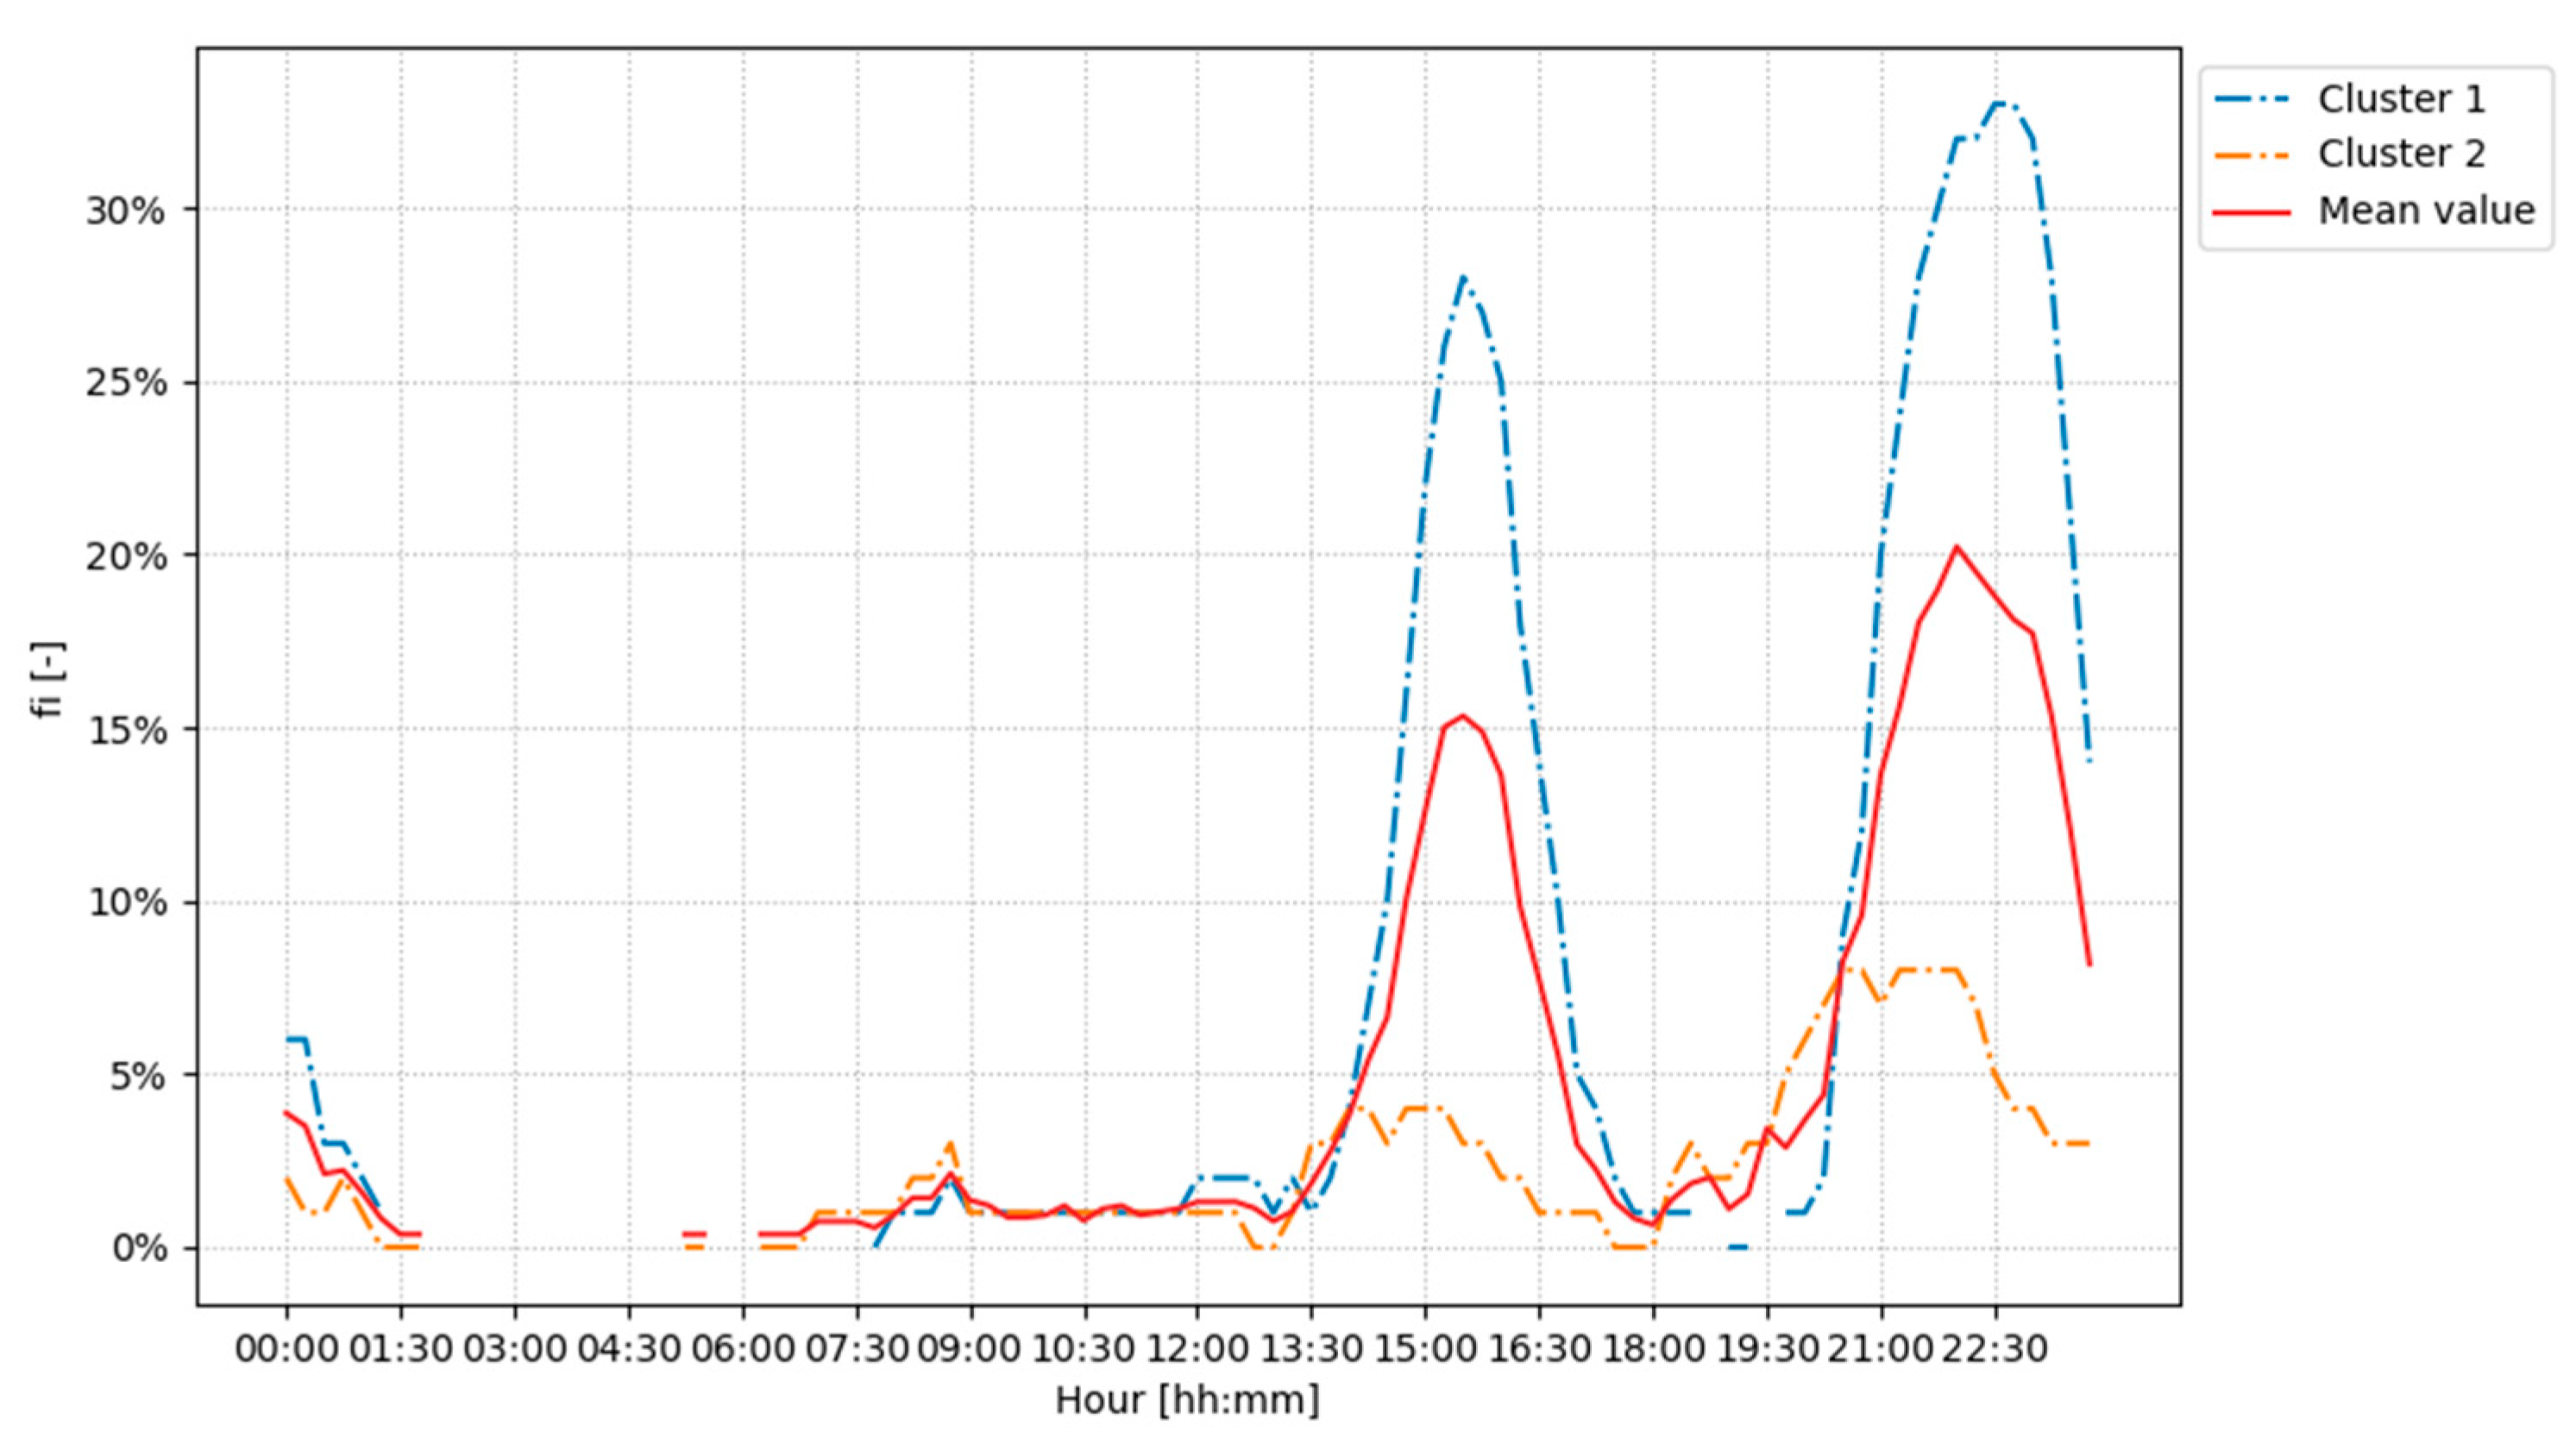
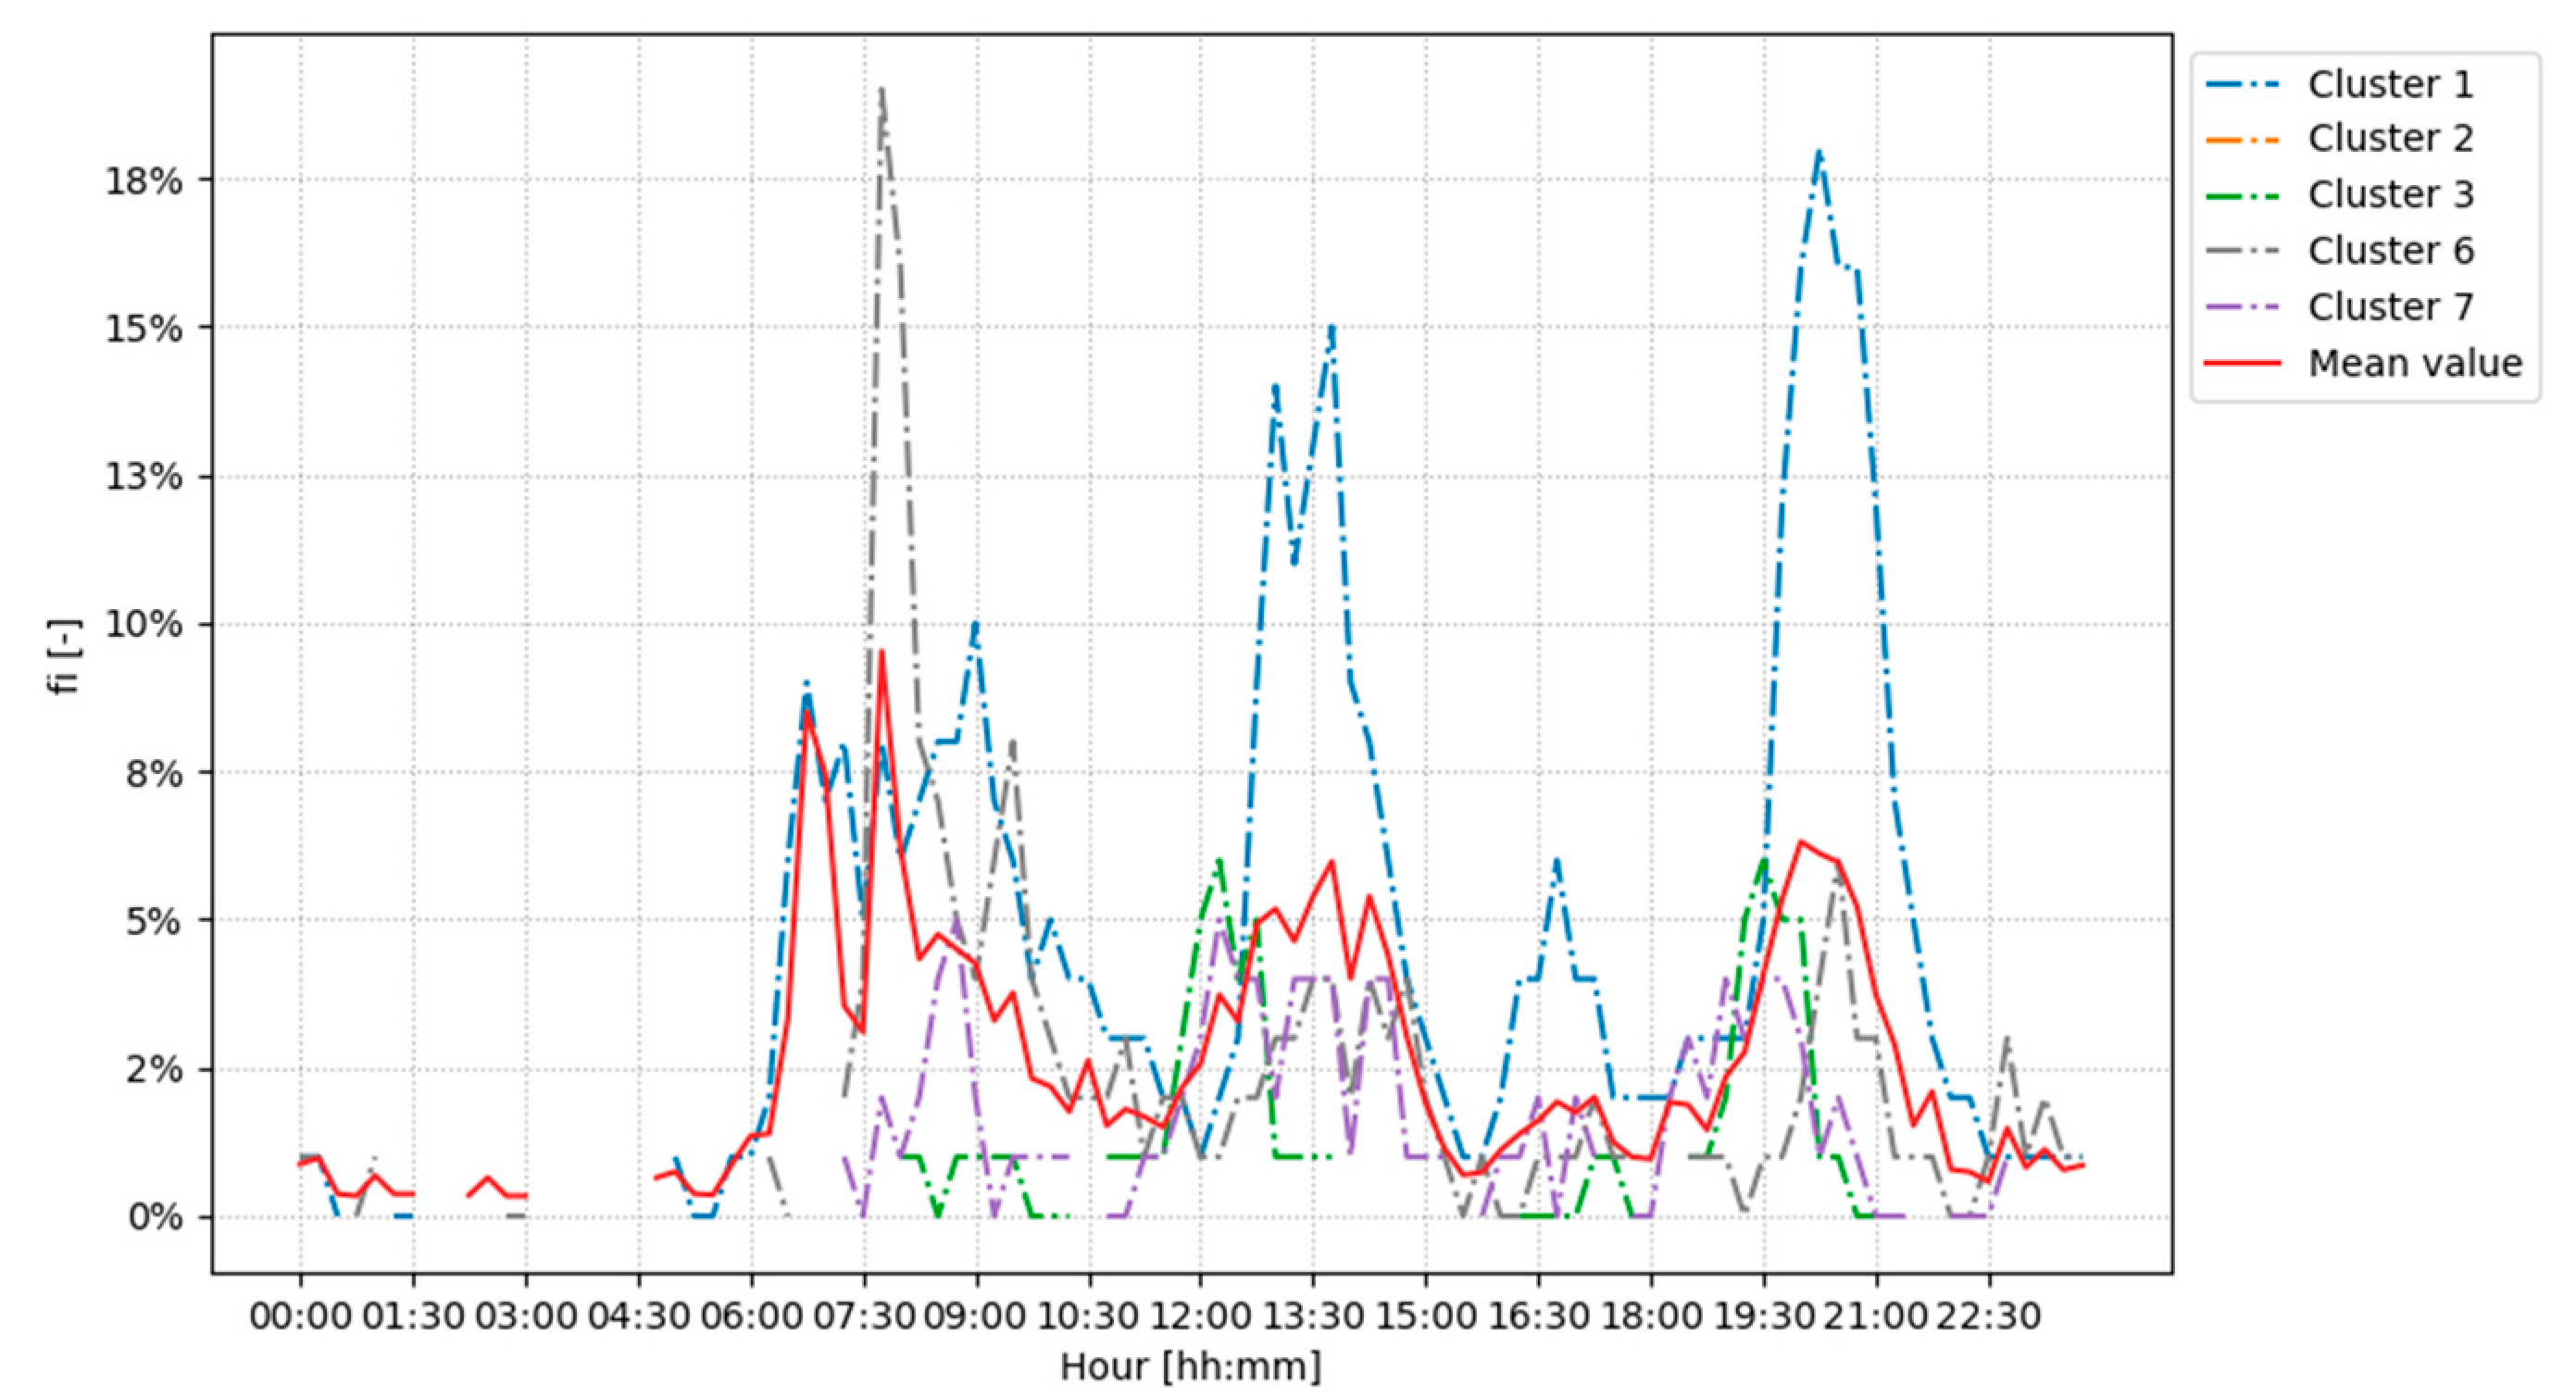
Table 4, and it is noted that Cluster 7 is mainly representative of ERP households, thus reflecting behaviors of households in energy poverty, while Cluster 1 and 2 both refer to households with children, with the only difference in inhabited surface area; these definitions are relevant in the interpretation of the results. For instance, dishwashers load profiles are shown in 
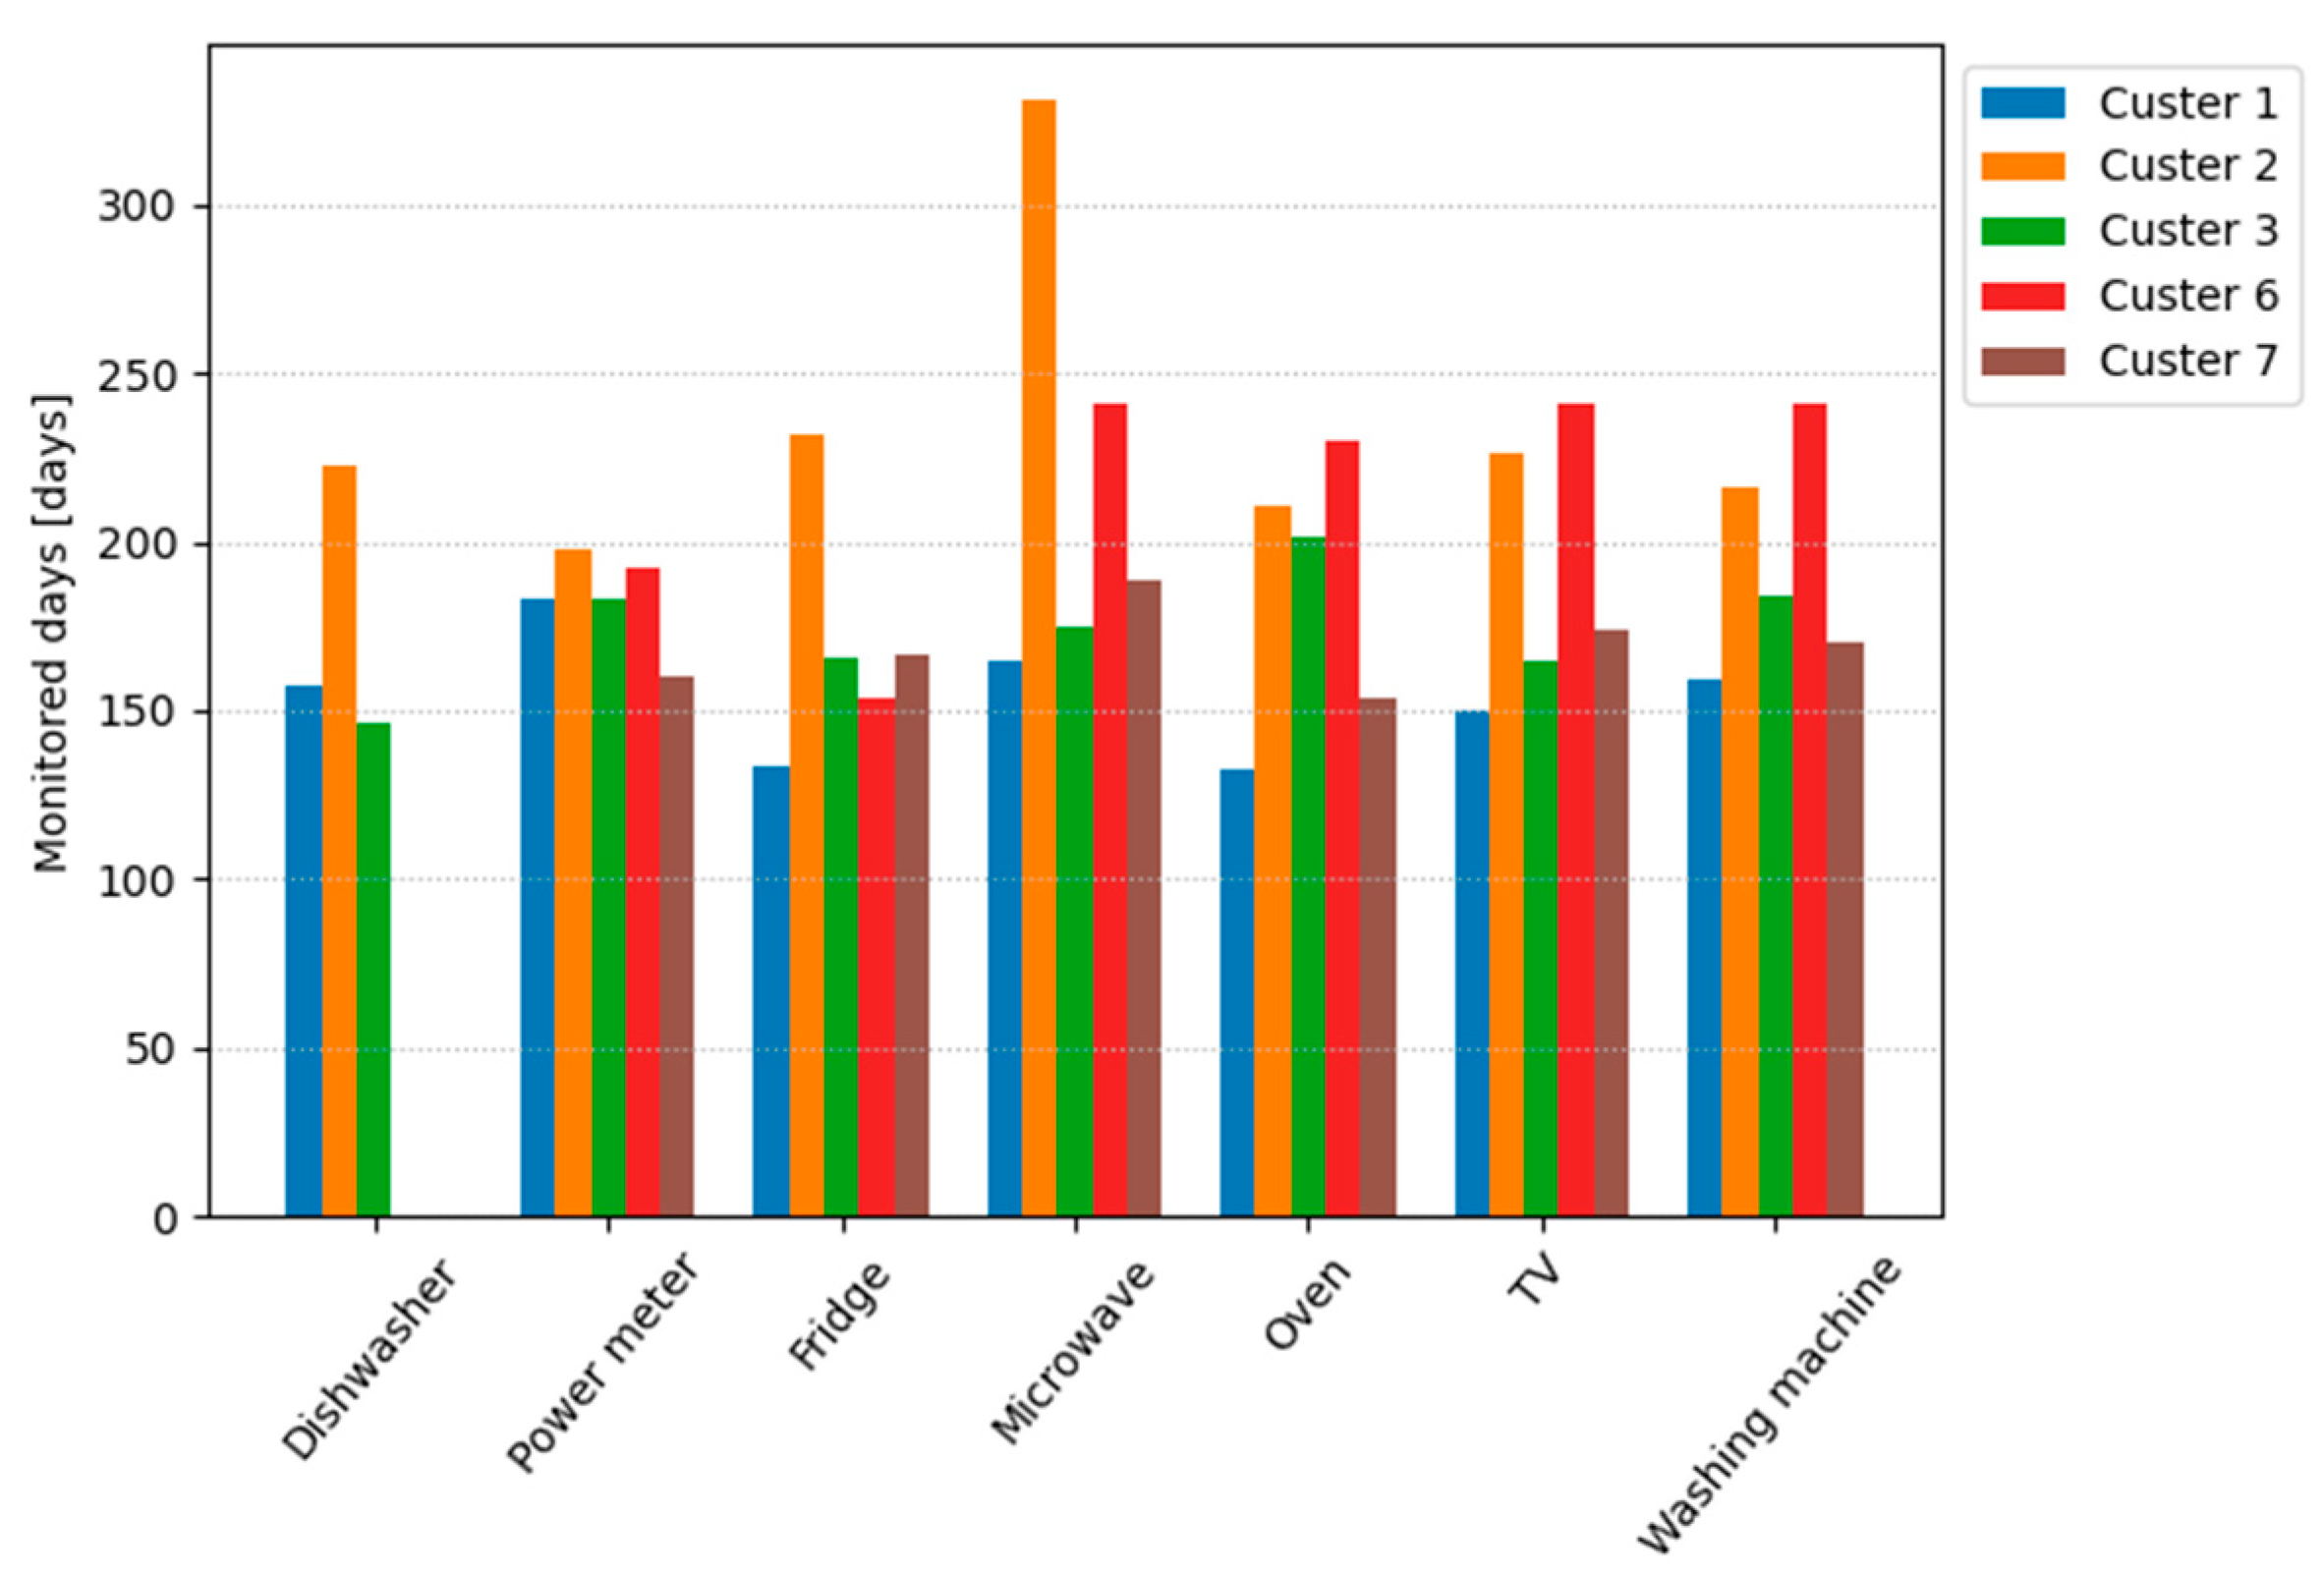
Figure 9 and for which Clusters 1 and 2 are considered, whereas values for Clusters 3, 6, and 7 are not provided. Indeed, as displayed in Table 8, Cluster 7 (representing mostly ERP households and single-person household structure) are most likely to not possess a dishwasher for economic purposes. Moreover, the result between Cluster 1 and 2 reveal a significant difference in its usage, reaching a probability of around 28% at 15:15 and 33% at 22:30 for Cluster 1. In contrast, Cluster 2 reaches its maximum probability peak of 8% at 21:30, much lower compared to Cluster 1, considering that they only differ in terms of the inhabited surface area. The overall load profile results are extracted from the power meter monitoring and without the distinction between weekdays or holidays. Moreover, the energy consumption is also related to seasons; thus, an extension of the monitoring days and a broader monitoring sample should be considered to exclude punctual measurement failures, such as power meters and appliances data leakages. An estimate on the power absorbed by appliances was necessary due to the absence of this information; thus, greater knowledge on this matter for future campaigns could be relevant for identifying the load’s profiles of each appliance with accuracy. Nevertheless, the results presented can be analyzed from a sociodemographic point of view as a way to better address energy efficiency actions; for instance, in 
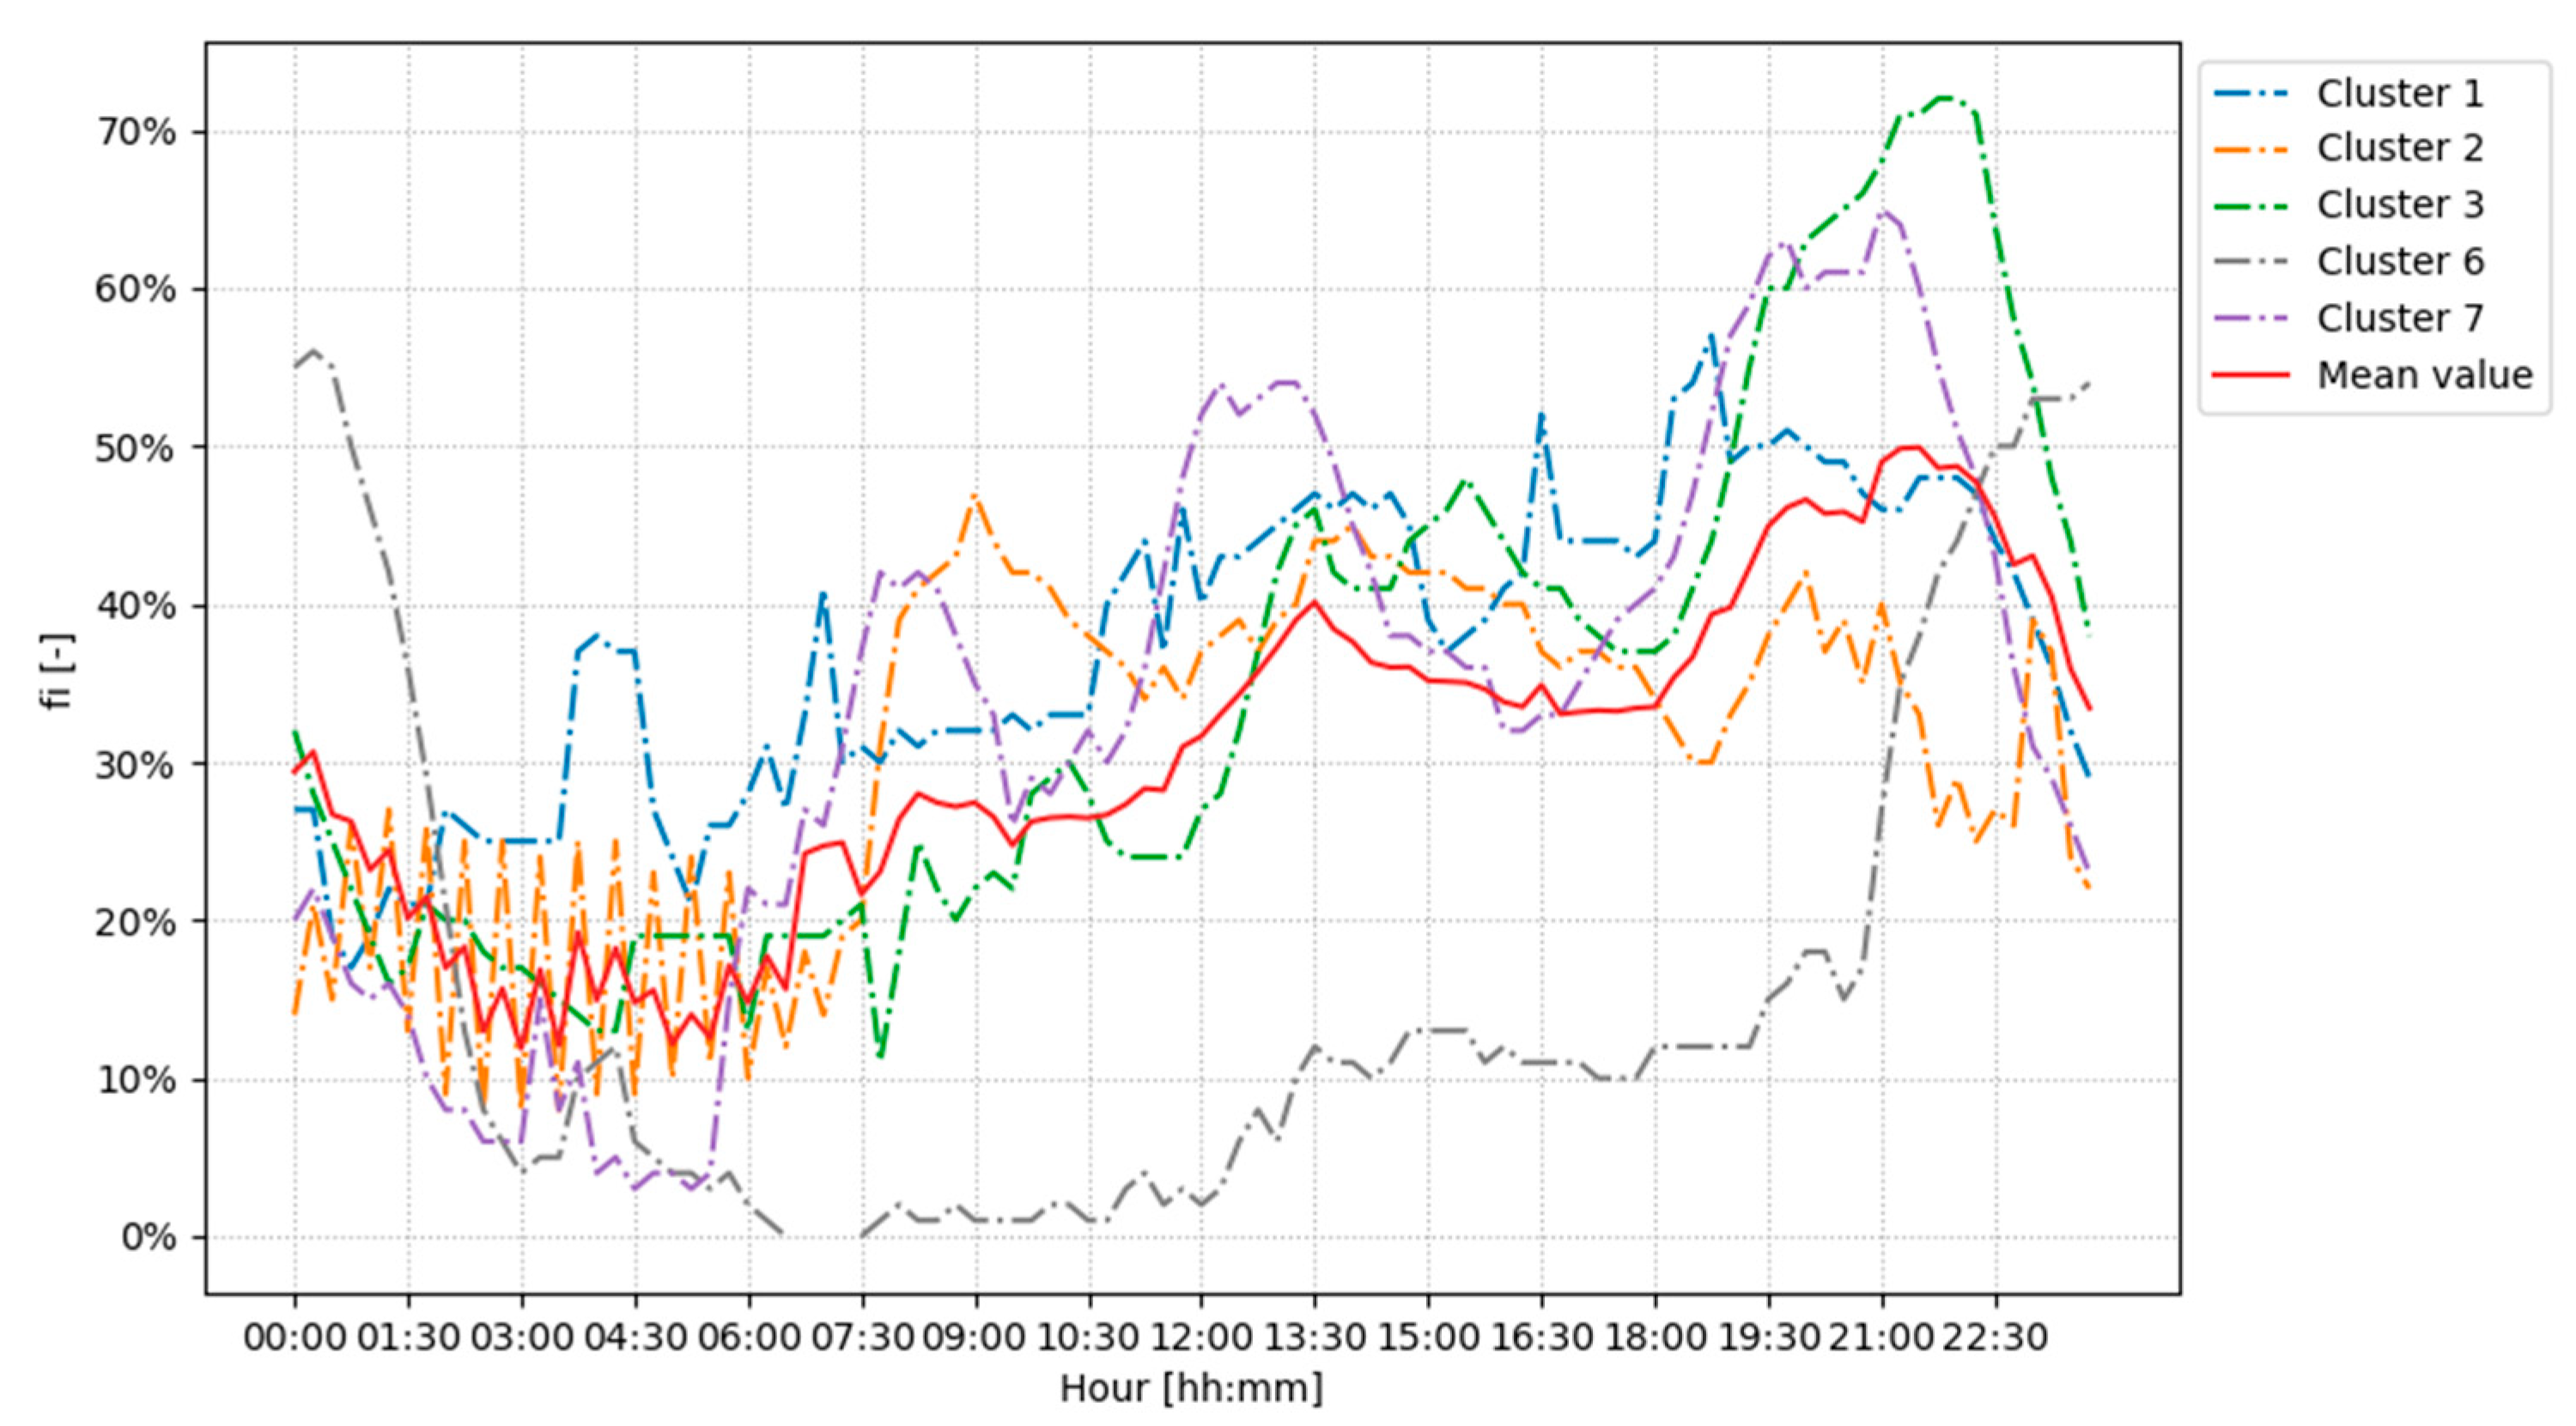
Figure 13, we noted a massive difference in both absolute value and variation of absorbed power shown in the total load profile of Cluster 1 compared to Clusters 2, 3, and 7. In particular, the final few clusters are somewhat similar, and show a minimum of around 110 W of absorbed power in night times (0:00–5:00). Thus, this value can be assumed as the baseload only due to the fridge, standby modes, and electric boilers, as discussed before, as it is reasonable to assume that Cluster 7 (ERP houses) is unlikely to have heating or cooling systems working at these hours. The higher values at night times of Cluster 1, ranging from 220 to 420 W of absorbed power, suggests that more significant economic and technical efforts have to be carried by the households represented by Cluster 1 to significantly reduce energy consumptions, in a more general perspective, considering the European decarbonization objectives and electrification tendencies on the residential sector.
Moreover, it is noted that the TV load profiles (Figure 10) are comparable within all clusters, so the difference in the total load at night times can be related to heating/cooling and water heating electric systems (which suggests that the absorbed power of TVs is much lower and comparable to the baseload power), thus the difference in absorbed power in night hours between Cluster 1 and other clusters gives an estimate on these systems, accounting for about 210 W. In addition, it is noted how Cluster 7, which represents ERP households in energy poverty conditions, display a TVs’ load profiles comparable to other clusters (Figure 10), as opposed to the other appliances, and its total load profile tendencies to be lower, indicating such appliance to be almost the only form of entertainment used during all day. Conversely, results of Cluster 6 show a high variance in TVs load profiles, mostly due to data leakages and to the number of monitored samples, which were too few to be considered meaningful.
It should be noted how the described approach allows the data analysis to be disaggregated by the end users’ viewpoint. Pattern recognition studies, such as Kwak et al. [53], often rely only on a technical approach through appliances and building characterization, neglecting behavioral aspects generalizable by parameters such as family structure as proposed by this paper.

6. Conclusions

This paper proposed a sociodemographic analysis of the Italian households’ load profiles from a smart metering experimental study, while also considering households in energy poverty conditions. The outcomes can be exploited for further research activities, including the validation or the calibration of existing models [14,15,20,21,22], or they can be used to improve the time step of broader energy consumption estimation models, such as MOIRAE [23], which is still under development. Indeed, simulation models based on the consumption behaviors, as developed by Gao et al. [54], require data acquisition either at the calculation procedure phase or at validation phase. Similarly, bottom-up models with a hourly time-step resolution may rely on such data, either as input or for validation and calibration procedures [55,56,57,58], as described by Raftery et al. [59]. Moreover, the proposed clustering may be beneficial in identifying demand-response strategies [60], or in determining the impacts of smart monitoring with feedbacks systems given directly to the households [61]; indeed, the information on households’ structure integrated with economic parameters may further improve the definition of precisely addressed incentives [62,63]. For instance, Cluster 1 with higher peaks in power load have a children-based household structure, and thus an incentive addressed particularly to this parameter may be taken into account. In contrast, energy efficiency improvement in Cluster 7 have to be addressed for the appliances influencing baseload absorbed power. The proposed approach, which disaggregates the results through a sociodemographic clustering, allowed us to analyze and identify different load profiles depending on behavioral aspects that are generalized by parameters such as family structure and inhabited surface, as described in Figure 5 and Table 4. Thus, single-appliance usage was characterized as well, enabling a structured analysis even from an energy community viewpoint, such as clustering the community to better predict energy flows in determined hours. However, some limitations in the described monitoring campaign should be taken into account: The limited number of sample households impacts the quality of the measurements, and data leakages cannot be excluded, as no “back-up” households are available. Further research activity should include a larger sample to avoid outlier data that influence results, as well as other appliances and systems such as cooling and heating load profiles. Moreover, broadening the monitoring sample could allow us to further investigate the north–south diversity in Italy, with an insight in energy poverty distribution. The proposed project and feedback system can be exploited outside the Italian country; for instance, the “Assist2gether” project [64], within which RSE is involved, is based on the same methodology and aims at identifying energy consumption improvements related to household behavior, in particular focusing on households in energy poverty.

Author Contributions

Conceptualization, M.B., and G.B.; methodology, M.B., and G.B.; formal analysis, G.B.; investigation, G.B.; resources, M.B.; data curation, G.B.; writing—original draft preparation, L.P.V.; writing—review and editing, G.B.; visualization, L.P.V.; supervision, M.B.; project administration, M.B.; funding acquisition, M.B. All authors have read and agreed to the published version of the manuscript.

Funding

This work was financed by the Research Fund for the Italian Electrical System in compliance with the Decree of Minister of Economic Development on 16 April 2018.

Conflicts of Interest

The authors declare no conflict of interest. The funders had no role in the design of the study; in the collection, analyses, or interpretation of data; in the writing of the manuscript, or in the decision to publish the results.

References

  1. European Commission. The European Green Deal; European Comission: Brussels, Belgium, 2019. [Google Scholar]
  2. Energy Consumption in Households—Statistics Explained. Available online: https://ec.europa.eu/eurostat/statistics-explained/index.php?title=Energy_consumption_in_households (accessed on 27 October 2020).
  3. Larsen, G.K.H.; van Foreest, N.D.; Scherpen, J.M.A. Distributed MPC applied to a network of households with Micro-CHP and heat storage. IEEE Trans. Smart Grid 2014, 5, 2106–2114. [Google Scholar] [CrossRef]
  4. Schopfer, S.; Tiefenbeck, V.; Staake, T. Economic assessment of photovoltaic battery systems based on household load profiles. Appl. Energy 2018, 223, 229–248. [Google Scholar] [CrossRef]
  5. Linssen, J.; Stenzel, P.; Fleer, J. Techno-economic analysis of photovoltaic battery systems and the influence of different consumer load profiles. Appl. Energy 2017, 185, 2019–2025. [Google Scholar] [CrossRef]
  6. Mohandes, B.; Moursi, M.S.E.; Hatziargyriou, N.; Khatib, S.E. A Review of power system flexibility with high penetration of renewables. IEEE Trans. Power Syst. 2019, 34, 3140–3155. [Google Scholar] [CrossRef]
  7. Papaefthymiou, G.; Haesen, E.; Sach, T. Power System Flexibility Tracker: Indicators to track flexibility progress towards high-RES systems. Renew. Energy 2018, 127, 1026–1035. [Google Scholar] [CrossRef]
  8. Azarova, V.; Cohen, J.J.; Kollmann, A.; Reichl, J. Reducing household electricity consumption during evening peak demand times: Evidence from a field experiment. Energy Policy 2020, 144, 111657. [Google Scholar] [CrossRef]
  9. TERNA. The Statistical Data on Electricity in Italy. Available online: https://www.terna.it/en/electric-system/statistical-data-forecast/statistical-publications (accessed on 22 November 2020).
  10. McDonald, M.; Christopher, M.; Bass, M. Market segmentation. In Marketing; Springer: Berlin, Germany, 2003; pp. 41–65. [Google Scholar]
  11. Besagni, G.; Borgarello, M. What are the odds? On the determinants of high residential energy expenditure. Energy Built Environ. 2020, 1, 288–295. [Google Scholar] [CrossRef]
  12. Hayn, M.; Bertsch, V.; Fichtner, W. Electricity load profiles in Europe: The importance of household segmentation. Energy Res. Soc. Sci. 2014, 3, 30–45. [Google Scholar] [CrossRef]
  13. Faiella, I.; Lavecchia, L. La Povertà Energetica in Italia (Energy Poverty in Italy); Bank of Italy: Rome, Italy, 2014. [Google Scholar]
  14. Foteinaki, K.; Li, R.; Rode, C.; Andersen, R.K. Modelling household electricity load profiles based on Danish time-use survey data. Energy Build. 2019, 202, 109355. [Google Scholar] [CrossRef]
  15. Yilmaz, S.; Chambers, J.; Patel, M.K. Comparison of clustering approaches for domestic electricity load profile characterisation—Implications for demand side management. Energy 2019, 180, 665–677. [Google Scholar] [CrossRef]
  16. Niamir, L.; Ivanova, O.; Filatova, T.; Voinov, A.; Bressers, H. Demand-side solutions for climate mitigation: Bottom-up drivers of household energy behavior change in The Netherlands and Spain. Energy Res. Soc. Sci. 2020, 62, 101356. [Google Scholar] [CrossRef]
  17. Waddams Price, C.; Brazier, K.; Wang, W. Objective and subjective measures of fuel poverty. Energy Policy 2012, 49, 33–39. [Google Scholar] [CrossRef]
  18. Correia da Silva, P.; Leal, V.; Andersen, M. Occupants interaction with electric lighting and shading systems in real single-occupied offices: Results from a monitoring campaign. Build. Environ. 2013, 64, 152–168. [Google Scholar] [CrossRef]
  19. Besagni, G.; Borgarello, M. The determinants of residential energy expenditure in Italy. Energy 2018, 165, 369–386. [Google Scholar] [CrossRef]
  20. Ge, L.; Liao, W.; Wang, S.; Bak-Jensen, B.; Pillai, J.R. Modeling daily load profiles of distribution network for scenario generation using flow-based generative network. IEEE Access 2020, 8, 77587–77597. [Google Scholar] [CrossRef]
  21. Fischer, D.; Härtl, A.; Wille-Haussmann, B. Model for electric load profiles with high time resolution for German households. Energy Build. 2015, 92, 170–179. [Google Scholar] [CrossRef]
  22. Widén, J.; Lundh, M.; Vassileva, I.; Dahlquist, E.; Ellegård, K.; Wäckelgård, E. Constructing load profiles for household electricity and hot water from time-use data—Modelling approach and validation. Energy Build. 2009, 41, 753–768. [Google Scholar] [CrossRef]
  23. Besagni, G.; Borgarello, M.; Premoli Vilà, L.; Najafi, B.; Rinaldi, F. MOIRAE—Bottom-up MOdel to compute the energy consumption of the Italian REsidential sector: Model design, validation and evaluation of electrification pathways. Energy 2020, 211, 118674. [Google Scholar] [CrossRef]
  24. Martinez-Pabon, M.; Eveleigh, T.; Tanju, B. Smart meter data analytics for optimal customer selection in demand response programs. Energy Procedia 2017, 107, 49–59. [Google Scholar] [CrossRef]
  25. Zhou, K.; Fu, C.; Yang, S. Big data driven smart energy management: From big data to big insights. Renew. Sustain. Energy Rev. 2016, 56, 215–225. [Google Scholar] [CrossRef]
  26. Zhou, K.; Yang, S. Understanding household energy consumption behavior: The contribution of energy big data analytics. Renew. Sustain. Energy Rev. 2016, 56, 810–819. [Google Scholar] [CrossRef]
  27. Laicane, I.; Blumberga, D.; Blumberga, A.; Rosa, M. Reducing household electricity consumption through demand side management: The role of home appliance scheduling and peak load reduction. Energy Procedia 2015, 72, 222–229. [Google Scholar] [CrossRef] [Green Version]
  28. Gyamfi, S.; Krumdieck, S.; Urmee, T. Residential peak electricity demand response—Highlights of some behavioural issues. Renew. Sustain. Energy Rev. 2013, 25, 71–77. [Google Scholar] [CrossRef] [Green Version]
  29. Finck, C.; Li, R.; Kramer, R.; Zeiler, W. Quantifying demand flexibility of power-to-heat and thermal energy storage in the control of building heating systems. Appl. Energy 2018, 209, 409–425. [Google Scholar] [CrossRef]
  30. Lai, J.; Zhou, H.; Hu, W.; Zhou, D.; Zhong, L.J.M.P.i.E. Smart demand response based on smart homes. Math. Probl. Eng. 2015, 2015, 1–8. [Google Scholar] [CrossRef] [Green Version]
  31. Froufe, M.M.; Chinelli, C.K.; Guedes, A.L.; Haddad, A.N.; Hammad, A.W.A.; Soares, C.A. Smart buildings: Systems and drivers. Buildings 2020, 10, 153. [Google Scholar] [CrossRef]
  32. Weber, S.; Puddu, S.; Pacheco, D. Move it! How an electric contest motivates households to shift their load profile. Energy Econ. 2017, 68, 255–270. [Google Scholar] [CrossRef] [Green Version]
  33. Crosbie, T.; Broderick, J.; Short, M.; Charlesworth, R.; Dawood, M. Demand response technology readiness levels for energy management in blocks of buildings. Buildings 2018, 8, 13. [Google Scholar] [CrossRef] [Green Version]
  34. Hu, J.; Vasilakos, A.V. Energy big data analytics and security: Challenges and opportunities. IEEE Trans. Smart Grid 2016, 7, 2423–2436. [Google Scholar] [CrossRef]
  35. Wang, Y.; Chen, Q.; Hong, T.; Kang, C. Review of smart meter data analytics: Applications, methodologies, and challenges. IEEE Trans. Smart Grid 2019, 10, 3125–3148. [Google Scholar] [CrossRef] [Green Version]
  36. Wijaya, T.K.; Vasirani, M.; Humeau, S.; Aberer, K. Cluster-based aggregate forecasting for residential electricity demand using smart meter data. In Proceedings of the IEEE International Conference on Big Data, Santa Clara, CA, USA, 29 October–1 November 2015; pp. 879–887. [Google Scholar]
  37. Enongene, K.E.; Abanda, F.H.; Otene, I.J.J.; Obi, S.I.; Okafor, C. Data on the daily electricity load profile and solar photovoltaic (PV) system components for residential buildings in Lagos, Nigeria. Data Brief 2020, 30, 105531. [Google Scholar] [CrossRef] [PubMed]
  38. Khan, Z.A.; Jayaweera, D.; Alvarez-Alvarado, M.S. A novel approach for load profiling in smart power grids using smart meter data. Electr. Power Syst. Res. 2018, 165, 191–198. [Google Scholar] [CrossRef]
  39. Sousa, J.C.; Neves, L.P.; Jorge, H.M. Assessing the relevance of load profiling information in electrical load forecasting based on neural network models. Int. J. Electr. Power Energy Syst. 2012, 40, 85–93. [Google Scholar] [CrossRef]
  40. Debnath, K.B.; Jenkins, D.P.; Patidar, S.; Peacock, A.D. Understanding residential occupant cooling behaviour through electricity consumption in warm-humid climate. Buildings 2020, 10, 78. [Google Scholar] [CrossRef] [Green Version]
  41. Batalla-Bejerano, J.; Trujillo-Baute, E.; Villa-Arrieta, M. Smart meters and consumer behaviour: Insights from the empirical literature. Energy Policy 2020, 144, 111610. [Google Scholar] [CrossRef]
  42. Dadashi-Rad, M.H.; Ghasemi-Marzbali, A.; Ahangar, R.A. Modeling and planning of smart buildings energy in power system considering demand response. Energy 2020, 213, 118770. [Google Scholar] [CrossRef]
  43. Liu, H.; Zhu, X.; Xiao, Z.; Wu, Y.; Li, P.; Li, D.; Deng, K.; Liu, S. The application of smart meter in the management of electric vehicle charging facilities. Procedia Comput. Sci. 2020, 175, 774–777. [Google Scholar] [CrossRef]
  44. Craig, T.; Polhill, J.G.; Dent, I.; Galan-Diaz, C.; Heslop, S. The North East Scotland Energy Monitoring Project: Exploring relationships between household occupants and energy usage. Energy Build. 2014, 75, 493–503. [Google Scholar] [CrossRef]
  45. De Almeida, A.; Fonseca, P.; Schlomann, B.; Feilberg, N.; Ferreira, C. Residential monitoring to decrease energy use and carbon emissions in Europe. In Proceedings of the International Energy Efficiency in Domestic Appliances & Lighting Conference, London, UK, 21–23 June 2006. [Google Scholar]
  46. Sovacool, B.K.; Kivimaa, P.; Hielscher, S.; Jenkins, K. Vulnerability and resistance in the United Kingdom’s smart meter transition. Energy Policy 2017, 109, 767–781. [Google Scholar] [CrossRef] [Green Version]
  47. EnergyNote. Available online: https://www.energynote.eu/?lang=en (accessed on 21 October 2020).
  48. Farnetworks. Available online: https://farnetworks.com/ (accessed on 21 October 2020).
  49. Flexvalley. Available online: https://flexvalley.com/ (accessed on 21 October 2020).
  50. Besagni, G.; Borgarello, M. The socio-demographic and geographical dimensions of fuel poverty in Italy. Energy Res. Soc. Sci. 2019, 49, 192–203. [Google Scholar] [CrossRef]
  51. Semeraro, L.; Crisostomi, E.; Franco, A.; Giunta, G.; Landi, A.; Raugi, M.; Tucci, M. Electrical load clustering: The Italian case. In Proceedings of the IEEE PES Innovative Smart Grid Technologies, Istanbul, Turkey, 12–15 October 2014. [Google Scholar] [CrossRef]
  52. Capasso, A.; Grattieri, W.; Lamedica, R.; Prudenzi, A. A bottom-up approach to residential load modeling. IEEE Trans. Power Syst. 1994, 9, 957–964. [Google Scholar] [CrossRef]
  53. Kwak, Y.; Hwang, J.; Lee, T. Load disaggregation via pattern recognition: A feasibility study of a novel method in residential building. Energies 2018, 11, 1008. [Google Scholar] [CrossRef] [Green Version]
  54. Gao, B.; Liu, X.; Zhu, Z. A bottom-up model for household load profile based on the consumption behavior of residents. Energies 2018, 11, 2112. [Google Scholar] [CrossRef] [Green Version]
  55. Rodrigues, F.; Cardeira, C.; Calado, J.M.F. The daily and hourly energy consumption and load forecasting using artificial neural network method: A case study using a set of 93 households in Portugal. Energy Procedia 2014, 62, 220–229. [Google Scholar] [CrossRef] [Green Version]
  56. Fumo, N.; Mago, P.; Luck, R. Methodology to estimate building energy consumption using EnergyPlus Benchmark models. Energy Build. 2010, 42, 2331–2337. [Google Scholar] [CrossRef]
  57. Song, K.; Kwon, N.; Anderson, K.; Park, M.; Lee, H.-S.; Lee, S. Predicting hourly energy consumption in buildings using occupancy-related characteristics of end-user groups. Energy Build. 2017, 156, 121–133. [Google Scholar] [CrossRef]
  58. Wang, L.; Kubichek, R.; Zhou, X. Adaptive learning based data-driven models for predicting hourly building energy use. Energy Build. 2018, 159, 454–461. [Google Scholar] [CrossRef]
  59. Raftery, P.; Keane, M.; Costa, A. Calibrating whole building energy models: Detailed case study using hourly measured data. Energy Build. 2011, 43, 3666–3679. [Google Scholar] [CrossRef]
  60. Zhang, S.; Wang, K.; Wang, B. A user-transparent pseudonym renewal scheme for smart meters in incentive-based demand response programs. Int. J. Electr. Power Energy Syst. 2019, 109, 49–56. [Google Scholar] [CrossRef]
  61. Jnat, K.; Shahrour, I.; Zaoui, A. Impact of smart monitoring on energy savings in a social housing residence. Buildings 2020, 10, 21. [Google Scholar] [CrossRef] [Green Version]
  62. Balta-Ozkan, N.; Yildirim, J.; Connor, P.M.; Truckell, I.; Hart, P. Energy transition at local level: Analyzing the role of peer effects and socio-economic factors on UK solar photovoltaic deployment. Energy Policy 2021, 148, 112004. [Google Scholar] [CrossRef]
  63. Roth, A.; Boix, M.; Gerbaud, V.; Montastruc, L.; Etur, P. Impact of taxes and investment incentive on the development of renewable energy self-consumption: French households’ case study. J. Clean. Prod. 2020, 265, 121791. [Google Scholar] [CrossRef]
  64. Realini, A.; Maggiore, S.; Crespi, V.; Besagni, G. Behavioural changes to alleviate energy poverty in Europe. In Proceedings of the BEHAVE 5th European Conference on Behaviour and Energy Efficiency, Zurich, Switzerland, 5–7 September 2018. [Google Scholar]
Figure 1. Electricity consumption of the Italian residential sector from 1990 to 2018 [9].
Buildings 10 00217 g001
Figure 2. Electricity consumption of the residential sector in Italy in 2018 [9].
Buildings 10 00217 g002
Figure 3. The power meter transmitter for the energy consumption measurement.
Buildings 10 00217 g003
Figure 4. Display, bridge, and modem/router 3G installed for data transmission and feedback system information.
Buildings 10 00217 g004
Figure 5. Monitored households clustering.
Buildings 10 00217 g005
Figure 6. Average monitoring time by appliance and by cluster.
Buildings 10 00217 g006
Figure 7. Percentage of monitored time concerning overall monitoring campaign.
Buildings 10 00217 g007
Figure 8. Daily usage probability: Washing machines.
Buildings 10 00217 g008
Figure 9. Daily usage probability: Dishwashers.
Buildings 10 00217 g009
Figure 10. Daily usage probability: TVs.
Buildings 10 00217 g010
Figure 11. Daily usage probability: Ovens.
Buildings 10 00217 g011
Figure 12. Daily usage probability: Microwaves.
Buildings 10 00217 g012
Figure 13. Load profiles of monitored households’ clusters.
Buildings 10 00217 g013
Table 1. Geographical distribution of monitored households.
RegionCityType of ResidenceNumber of Households Monitored
LombardyBergamoNon-ERP1
LombardyMilanERP26
LombardyMilanNon-ERP2
LombardySegrateNon-ERP5
LazioRomeNon-ERP9
LazioRomeNon-ERP16
PiedmontVerbaniaNon-ERP3
ApuliaSponganoNon-ERP5
Table 2. Composition by the age of monitored households by the number of individuals.
Number of Individuals in HouseholdAge of Individuals (Years)
<1818–3435–64>65
10%0%16%74%
210%7%37%47%
325%8%50%17%
437%12%47%4%
547%0%33%20%
650%0%50%0%
Table 3. The number of monitored appliances.
Type of ResidenceAppliance
Power MeterDishwasherFridgeMicrowaveOvenTVWashing Machine
ERP24018742517
Non-ERP22143417122930
Table 4. Clusters subdivision of the monitored Italian households.
ClusterHousehold StructureGeographic AreaInhabited Surface Area (m2)Number of Households by Type of ResidenceNumber of Households by Geographic Area
ERPNon-ERPTotalNorthCentralSouth
1d, g, h, i, m-<146218206122
2d, g, h, i, m-≥146099261
3e, f, la, b, c, d<1525611641
6e, f, l-≥152044130
7a, b, ca, b, c, d<124194232201
Table 5. Sociodemographic characterization of the clusters.
ClusterThe Average Number of ComponentsAverage Inhabited Surface Area (m2)Composition by Gender (%)Composition by Age (%)
MaleFemale<18 years18–34 years35–64 years>65 years
13.6104475331144610
24.41734358435458
32.16948521704835
62.018050501301375
71.0513565002674
Table 6. Average monitoring time by appliance.
HeaderAppliance
Power MeterDishwasherFridgeMicrowaveOvenTVWashing Machine
Monitoring time (days)183175170220186191194
Percentage of monitored time (%)53878681858484
Table 7. Appliance energy consumption by type and by cluster.
AppliancesClusters
12367
DishwashersNumber of monitored appliances85100
Average daily energy consumption (kWh/day)0.00.470.1600
Average annual energy consumption (kWh/year)1821725900
FridgesNumber of monitored appliances1777417
Average daily energy consumption (kWh/day)0.861.340.930.770.93
Average annual energy consumption (kWh/year)314488341283340
MicrowavesNumber of monitored appliances91437
Average daily energy consumption (kWh/day)0.160.050.050.060.03
Average annual energy consumption (kWh/year)5916172212
OvensNumber of monitored appliances52234
Average daily energy consumption (kWh/day)0.420.240.110.130.08
Average annual energy consumption (kWh/year)15387414830
TVsNumber of monitored appliances15510321
Average daily energy consumption (kWh/day)0.570.420.620.480.32
Average annual energy consumption (kWh/year)207155226174118
Washing MachinesNumber of monitored appliances1556318
Average daily energy consumption (kWh/day)0.350.340.210.180.12
Average annual energy consumption (kWh/year)127123756745
Total average daily energy consumption at power meter (kWh/day)7.075.584.199.433.24
Total average annual energy consumption at power meter (kWh/year)25802036152934401183
Table 8. Appliance usage characteristics by type and by cluster.
AppliancesClusters
12367
DishwashersAverage energy consumption (kWh/cycle)0.841.060.4000
Average number of cycles (cycles/day)0.600.480.4000
Average duration of cycle (hours/cycle)1.841.361.7300
Average operating time (hours/day)1.110.640.7000
FridgesAverage energy consumption (kWh/cycle)-0.110.070.050.11
Average number of cycles (cycles/day)-14.8314.6418.63-
Average duration of cycle (hours/cycle)-1.501.060.751.31
Average operating time (hours/day)16.1216.9513.8013.3613.52
MicrowavesAverage energy consumption (kWh/cycle)0.070.040.080.040.07
Average number of cycles (cycles/day)2.371.180.631.800.85
Average duration of cycle (hours/cycle)0.370.310.310.310.30
Average operating time (hours/day)0.860.360.190.540.25
OvensAverage energy consumption (kWh/cycle)0.860.540.100.450.52
Average number of cycles (cycles/day)0.530.441.790.330.23
Average duration of cycle (hours/cycle)1.100.940.450.730.79
Average operating time (hours/day)0.570.410.690.240.15
TVsAverage energy consumption (kWh/cycle)0.940.49-0.250.21
Average number of cycles (cycles/day)2.375.532.022.221.90
Average duration of cycle (hours/cycle)3.43--2.224.14
Average operating time (hours/day)8.047.799.004.416.59
Washing machinesAverage energy consumption (kWh/cycle)0.430.480.440.600.41
Average number of cycles (cycles/day)0.750.670.730.390.34
Average duration of cycle (hours/cycle)1.551.511.431.521.45
Average operating time (hours/day)1.221.000.810.500.53
Table 9. Probability of usage during the day: Monitoring campaign results.
AppliancesNumber of UsesCluster 1Cluster 2Cluster 3Cluster 6Cluster 7
Dish washers192%96%---
27%4%---
31%0%---
Microwaves125%-72%47%57%
227%-22%29%30%
321%-5%13%9%
Ovens177%76%49%88%98%
220%21%18%10%2%
32%3%17%3%0%
TVs123%15%48%36%23%
231%21%24%21%31%
325%25%10%20%29%
Washing machines168%66%72%78%81%
227%25%21%16%14%
35%8%6%6%4%
Publisher’s Note: MDPI stays neutral with regard to jurisdictional claims in published maps and institutional affiliations.

