Article

A Novel Contribution for Resilient Buildings. Theoretical Fragility Curves: Interaction between Energy and Structural Behavior for Reinforced Concrete Buildings

by
Alessandra De Angelis
1,*,
Fabrizio Ascione
2,
Rosa Francesca De Masi
1,
Maria Rosaria Pecce
1 and
Giuseppe Peter Vanoli
3
1
Department of Engineering, Università degli Studi del Sannio, Piazza Roma, 21 82100 Benevento, Italy
2
Department of Industrial Engineering, Università degli Studi di Napoli Federico II, Piazzale Tecchio, 80 80125 Napoli, Italy
3
Department of Medicine and Health Sciences-Vincenzo Tiberio, Università degli Studi del Molise, via G. Paolo II Contrada “Tappino”, 86100 Campobasso, Italy
*
Author to whom correspondence should be addressed.
Buildings 2020, 10(11), 194; https://doi.org/10.3390/buildings10110194
Submission received: 25 September 2020 / Revised: 19 October 2020 / Accepted: 23 October 2020 / Published: 27 October 2020
(This article belongs to the Section Building Energy, Physics, Environment, and Systems)

Abstract

:
The paper introduces a new semi-probabilistic methodology for the definition of energy fragility curves suitable for a macro-classification of building stock inspired to and coupled with the widely adopted method of seismic fragility curves. The approach is applied to the reinforced concrete residential buildings of the Italian stock. Starting from a classification according to the climatic zone and the construction period, some reference buildings in terms of building envelope typologies have been defined and simulated by means of dynamic modeling tools. Then, cumulative distributions of the probability that the primary energy consumption for heating was comparable with certain threshold values are defined according to the climatic conditions expressed with the heating degree days, which constitute the intensity measure for the fragility curves. Finally, by focusing on the interaction points between structural and energetic aspects, it is shown how these curves can be useful for decision-makers with regards to definition of importance and or the level of intervention to be made to the building envelope for improving its seismic safety and the energy quality. Indeed, non-integrated interventions are more expensive and less efficient.

1. Introduction

The resilience of the built environment can be defined as the capacity to sustain operations under both expected and unexpected conditions [1]. It is true that the resilience of a community can be improved by adopting consolidate strategies that allow maintaining or returning to functional levels (or acceptable levels) as quickly as possible after a harmful event such as a flood, an earthquake or the heatwave phenomenon [2]. The prevention of disasters, due to extreme events, requires the improvement of building quality under different performance criteria and mainly, it is needed that the built environment is resilient. Nevertheless, the lack of clear rules and criteria for the actions to apply has often created controversy and thus, there was been delays due to long processes for deciding the priority levels.
This is a new theme for the research in the matter of building design and the different aspects of building global sustainability are usually considered separately. In particular, the current need of improving the performances of existing buildings to structural, especially in seismic countries, and energetic standards are pushing many researchers to evaluate a methodology for integrated approach [3]. Although recently some authors have studied technical solutions for integrated interventions [4,5,6] applied to the individual building, there is a lack in the large-scale integrated approaches suitable to plan the priority interventions in both fields of energetic and structural performance, according to the economic resources. For this purpose, it is necessary first to individuate the parameters affecting both structural and energetic behavior to define an integrated classification of buildings.
The fragility curves [7] are a possible method for defining seismic vulnerability; these are usually referred to a single building or to a building typology. Fragility curves can be intended as the conditional probability, with reference to a class of buildings, of reaching or exceeding an established level of damage, once given a level of ground motion. The methodology that gives the fragility curves is based on several important steps: definition of a parameter that represents the ground motion; selection to select of the levels of damage; individuation of the building typologies [8]. Indeed, the building construction material and technology, as well as the structural configuration, can influence the probability of reaching a specific state of damage caused by a seismic input. Based on the types of data available, they can be derived using analytical, empirical or hybrid methods as better explained in Section 2.
This approach is not diffused for the energetic aspects. Surely, these are not immediately connected to the building’s safety and accessibility issues, but, at the same time, the energy standard plays a fundamental role in determining the livability and resilience of a building. The heating and cooling energy demands of the building stock determine the major environmental impact of the civil sector. The consumptions impact also on the costs for the operation and maintenance of the building HVAC system and on the indoor comfort conditions. According to recent studies, the thermal comfort and the air quality affect the quality and intensity of the activities to be carried out inside a building [9]. More in particular, there are not multidisciplinary approaches for considering the similarities between energetic and seismic behaviors. A combined approach is useful for evaluating the possible interaction when an intervention campaign must be planned giving priority to some areas rather than others.
All told, until now, often interventions on existing buildings were designed and realized with a specific approach for solving problems in the field of energy retrofit or seismic assessment. Over the last decades, following the new European regulations’ frame, also when not mandatory, diffused forms of incentives and financial support have been enacted for supporting energy retrofit and structural refurbishments of buildings. Even if a great effort has been spent, the two topics have been taken into consideration separately, by losing the opportunity of a synergic action toward a general improvement of building livability, management and safety. It should be noted that, moreover, when economic incentives are used for improving only the energy performance in zone with high seismic risk, the structural safety has not been improved and the interventions result in the increase of the economic value of the building exposed to earthquake damage (expected annual losses).
The novelty of the proposed paper is the introduction of a methodology for characterizing seismic and energetic vulnerability of the current building stock (and thus the existing buildings of our communities), by means of the approach of the fragility curves, that are used in the structural field. This approach is based on the dynamic simulation of the energy performance and it takes into account the great variability of climatic conditions and building typology that can be found in each country. It is can be useful for the strategic plan of urban renovation because it allows calculating the distance between the performance of the building stock and the reference consumptions as well as the normative performance. This knowledge can be used for evaluating the most critical situations that require focused efficiency measures or specific funding sources.
Moreover, the data of energy and structural vulnerability are combined for a more complete classification of the existing building stock. As in the structural field [10], the methodology for deriving energetic fragility curves is semi-probabilistic, since if the construction of the curves is probabilistic, the selection of the typological and thermo-physical characteristics of the materials was carried out in a deterministic way. The innovative contribution of the present paper is the development methodology of fragility curves in the energetic field and the contemporaneous and synergic evaluation of multidisciplinary issues and targets by an analogous approach. Recent earthquakes around the world have highlighted the need to combine (and thus to analyze together) the energy aspects with structural strengthening design to optimize the use of resources. Indeed, interactions of the two aspects never have been managed, due to the absence of a methodological framework. For these reasons, the final scope of the proposed investigation is the finding of a valid basis of a decision-making support for the priority (structural or energetic) or the integration of the interventions for classes of buildings.
The proposed approach could be useful for designers and politicians when the financial mechanisms for the improvement of the existing building are prepared. Indeed, in some countries like Italy, the current measures to the refurbishment of buildings go in the direction of coupling the seismic and energetic interventions (earthquake-bonus and eco-bonus). The proposed methodology is also applied, as an example of its use, to a category of existing reinforced concrete buildings for residential use.

2. A Brief Review of the Seismic Fragility Curves

The fragility curves can be derived using analytical, empirical or hybrid methods according to the type of input data.
In empirical methods, the fragility curves are derived from statistical elaboration of damage data collected during post-earthquake surveys. Since they are obtained by real observed data, they have the advantage of reliability taking into account automatically all the properties of the building stock (structural and non-structural components) as well as the influence of the earthquake source, path, site. However, on the other hand, their reliability is strongly affected by the quality and completeness of the database as well as by the method adopted to collect the empirical data. Moreover, they need a preliminary complex phase of homogenization of the damage data due to the variation of construction technique from a place to another one during the time. Analytical methods are based on the use of the statistically elaborated results of numerical analyses, carried out on simplified models of the structure or more refined ones [10,11,12]. Usually, they are developed in case of new or complex structures, or for types of structures for which empirical data and information are not available.
Analytical fragility curves were developed by Shirazi et al. [13] for curved single-frame concrete box-girder bridges with seat-type abutments. Perdomo et al. have also verified the accuracy of nonlinear static procedures in the development of analytical damage fragility curves for seismic risk assessment of Reinforced Concrete bridges [14]. Rossetto et al. [15] have proposed a review about the definition method of the empirical fragility functions. Zuccaro and Cacace have described a procedure for a quick assessment of seismic vulnerability of buildings, according to the classification EMS 98 [16]. Lagomarsino et al. [17] have validated two types of models: a microseismical model based on the intensity hazard maps and a mechanical model based on peak ground accelerations and spectral values. Data collected after Italian and European earthquakes have been analyzed in order to derive fragility curves by several authors [18,19]. More in detail, Karababa et al. have proposed some types of vulnerability curves validated for the building types of Lefkada Island [20]. Liel et al. [21] have correlated the building damage to height, usage, elevation irregularities in strength and stiffness and the ground-shaking intensity at each site. Starting from damage grades and peak ground acceleration demand, Del Gaudio et al. [22] have introduced several methodologies for estimating fragility functions. Some studies, as [23], propose a comparison of empirical and analytical fragility functions. Finally, the hybrid fragility curve solves some of the main limitations of the previous methods [24] as demonstrated by Kappos that has combined the use of empirical databases of earthquake damages with the outcomes of nonlinear analysis for representative structural models [25].
The fragility of a structure can be defined as expressed Equation (1).
P f = P [ S d S c 1 ]
where Pf is the failure probability for a specific damage state, Sd and Sc are respectively the structural demand and structural capacity. It should be noted that Equation (1) merely defines values for the probability, under a certain seismic load, because the structural demand (Sd) depends by the intensity of the earthquake ground motion.
Typically, the random natures of both Sd and Sc are described by a lognormal probability distribution. Hence, fragility Pf may be expressed as a standard normal distribution reported in Equation (2).
P f = ϕ ( ln ( S d / S c ) β d 2 + β c 2 )
where the following terms and parameters are: Sc is the mean value of the structural capacity, defined for the damage state; βc is the lognormal standard deviation of the structural capacity; Sd is the mean value of seismic structural demand, in terms of a chosen ground motion intensity parameter; βd is the lognormal standard deviation of the structural seismic demand. There are many methodologies for obtaining the structural demand, and thus the elastic response spectral analysis, nonlinear static analysis and nonlinear time history analysis.
According to the methodology adopted for the seismic fragility curves, in the following sections the development of energetic fragility curves is described; however, more attention is given to the extension of the methodology in the energetic field, thus the use of fragility curves already existing in the technical literature is proposed for the application example.

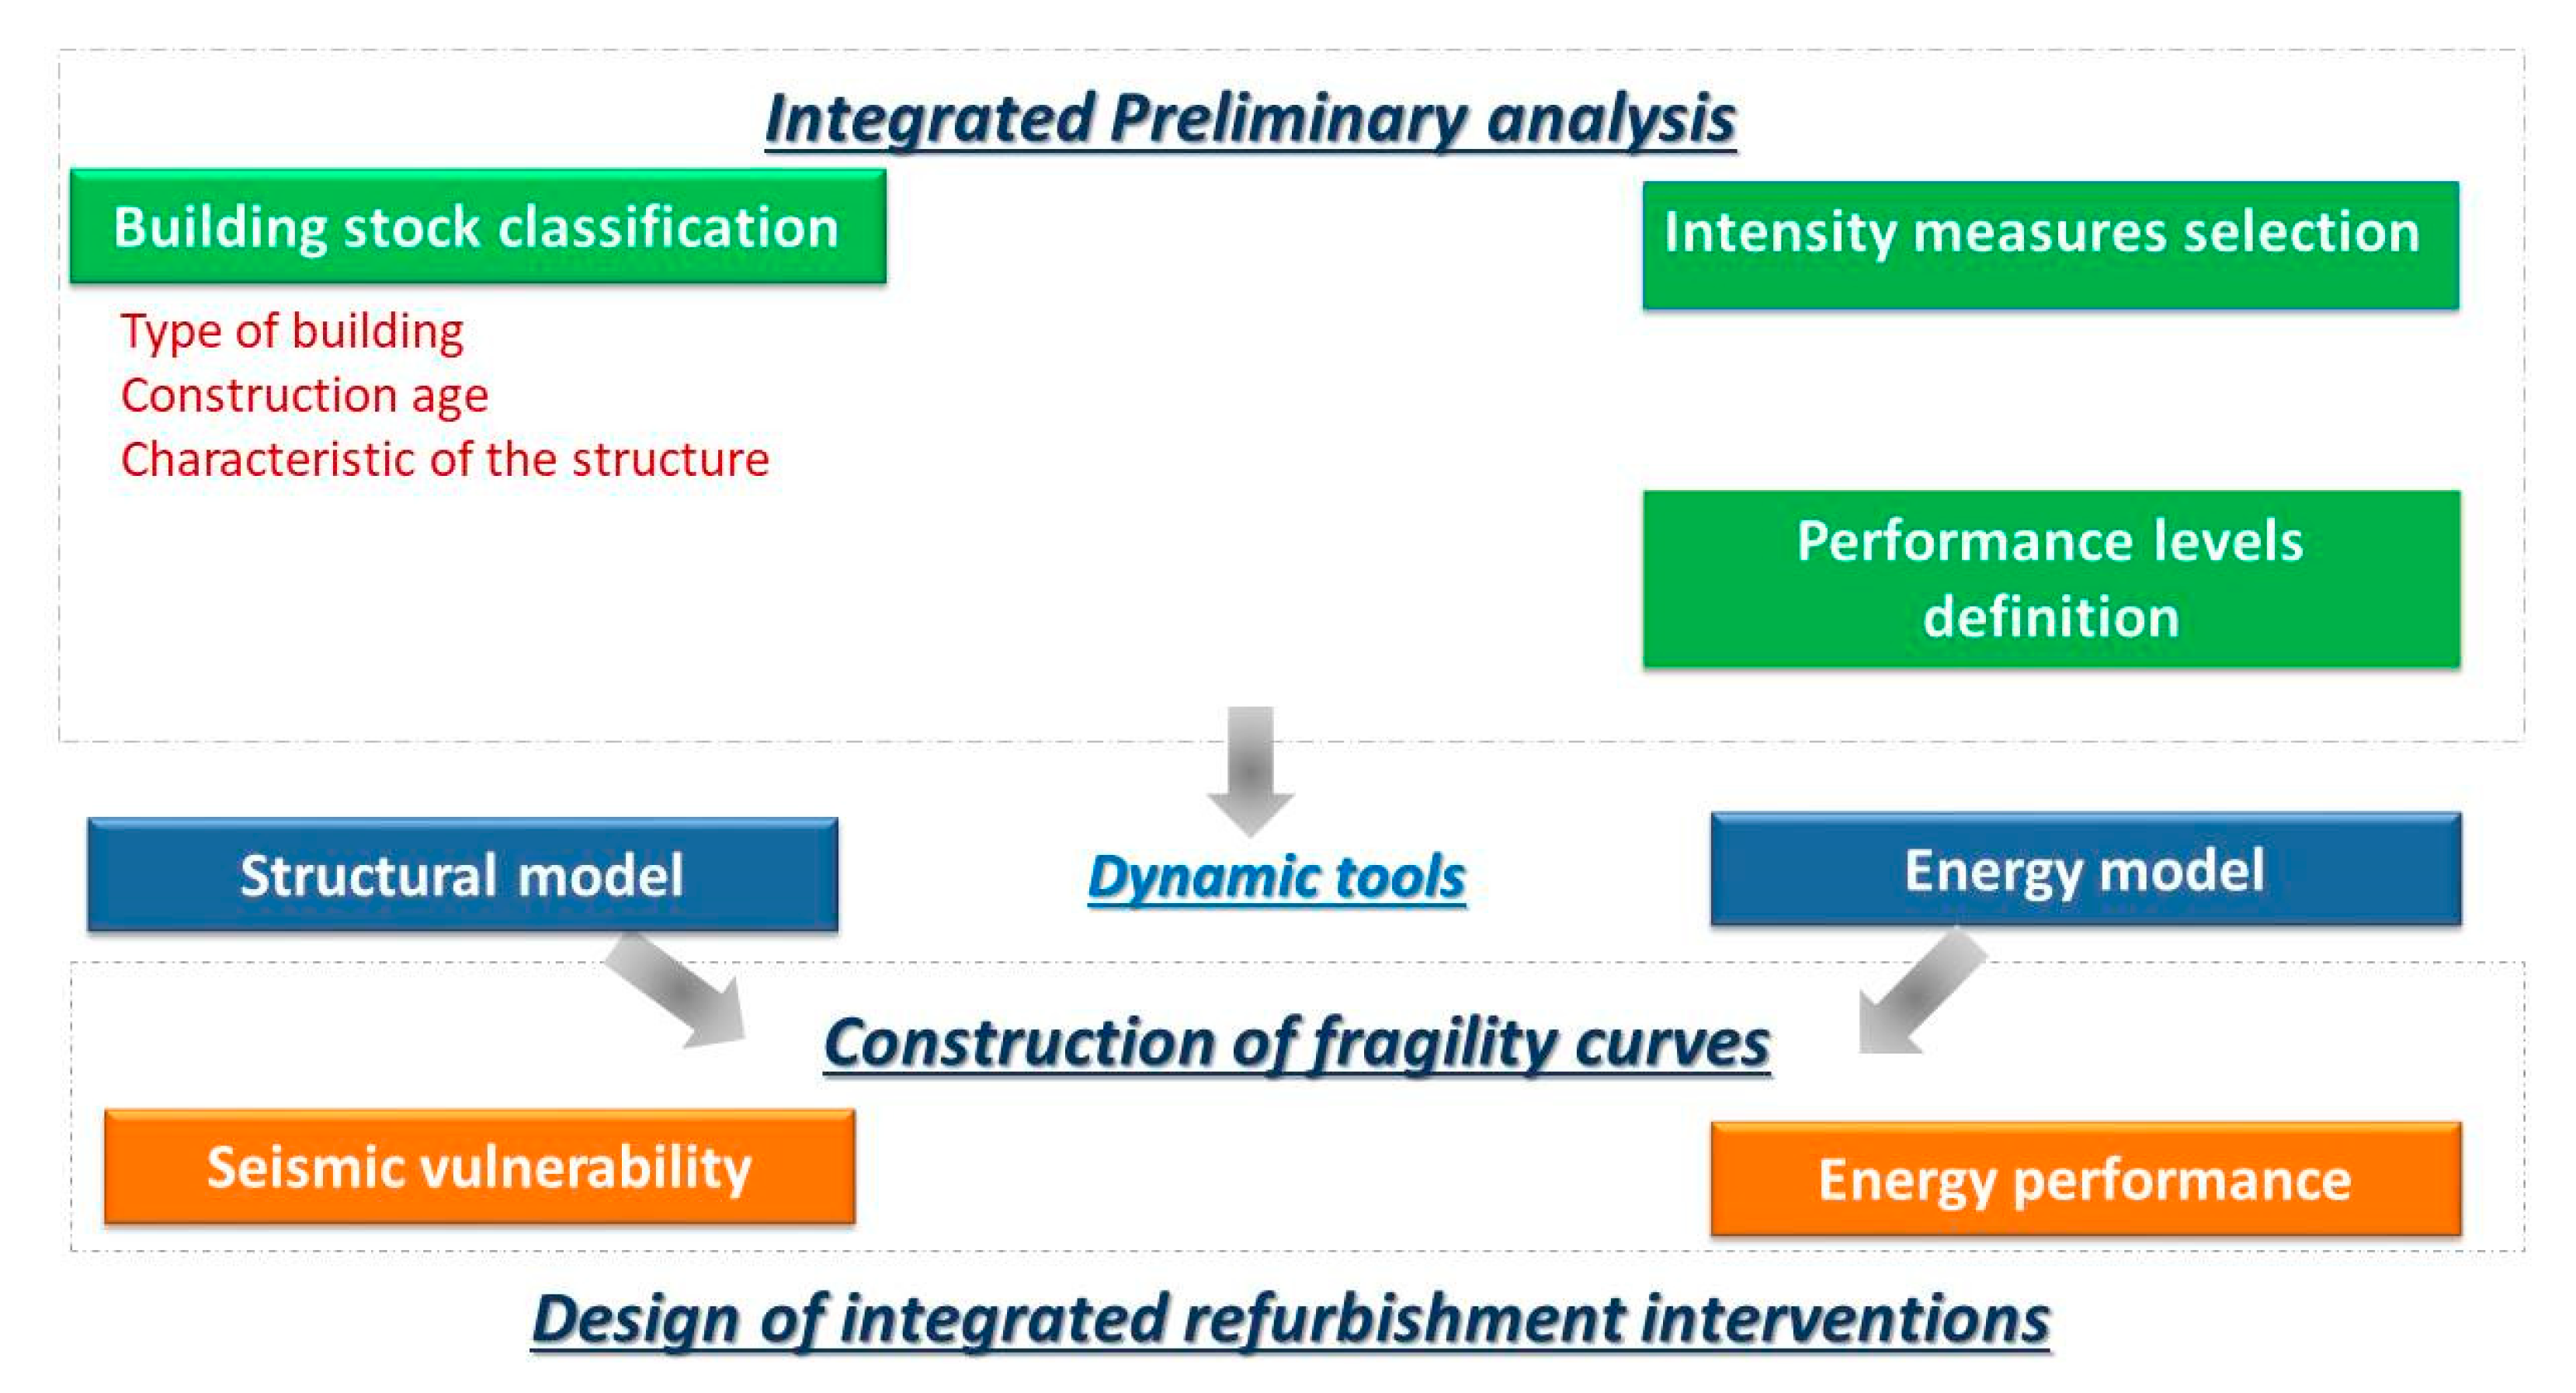
3. Innovative Integrated Approach for Energetic and Structural Fragility Curves

The fragility curves represent the conditional probability of an element exposed to risk reaching or exceeding a specific performance level, for a given level of the intensity for the damaging event. According to the latter, the definition of energetic fragility curve can be introduced. It is conditional probability that the primary energy consumption reaches or exceeds a certain threshold value for a given climatic condition. The performance gap can be evaluated or compared with the energy consumption of the whole existing building stock that is the target set in the case of energy refurbishment. With the aim to derive energetic fragility curves complementary with the seismic vulnerability curves, a methodology is introduced that is based on the connection points between structural and energy issues.
Really, a novel and important contribution of the present investigation is just the contemporaneous and synergic evaluation of multidisciplinary issues and targets. Really, the final aim of the proposed study is the finding a proposition of a valid basis for the decision-makers when it is necessary to establish a priority in the distribution of funds or incentives in the event of strategic restructuring plans or disasters. It should be considered that the combination of diagnostic activities is a useful opportunity, mainly in order to optimize costs and execution time of the in situ tests and for performing the synergic evaluation of various outcomes, in terms of both structural safety and energy performances.
Figure 1 describes the proposed analytical approach for the integrated structural and energetic fragility assessment.
The first phase for the development of integrated structural and energetical fragility curves is related to the introduction of a well-defined building stock classification, the selection of the intensity measures and the definition of the performance levels, as explained in the following subsections.
The second phase of the proposed approach consists of the simulation of the reference building stock by means of a dynamic tool for evaluating the performance parameter when the intensity measure varies. The dynamic tools seem to be more appropriate for taking into consideration all possible variables that influence the performance. For instance, in case of energy performance, the solution of the energy balance with hourly type step, and variable external forcers is surely more suitable for taking into account the dynamic behavior of the building envelope.
The obtained data can be used to define the fragility curves. Similar to what is done for seismic risk, the energy vulnerability assessment can be based on the determination of the cumulative distribution of the probability that the primary energy consumptions are higher or lower than a certain threshold value that allows to compare the performance with the building stock but also with the target set in the case of building refurbishment.
Finally, the two types of curves (structural and energetic) can be crossed for evaluating interventions’ strategies, not only in case of extreme events but also when national and local administrators want to identify grants to push the restoration or refurbishment interventions which can combine structural and energy aspects.
The first step with the integrated approach is described more in detail in this section while the second specific procedure for the structural and energetic development is introduced by an example of application to a building typology.

3.1. The Building Stock Classification

The first step for the development of integrated structural and energetic fragility curves is related to the introduction of a well-defined building stock classification. The development of a building classification should be a compromise between accuracy and usability. Indeed, a highly-detailed subdivision and framing into different classes can lead to very specific results—from both the structural and energetical point of views—but may be poorly useful for a more general interpretation of the outcomes. The definition of the building stock for the development of integrated structural and energetic fragility curves should be based on the parameters that influence both the seismic and energetical performance. In addition, it is also important to prefer parameters that are easily available.
From the point of view of structural performance, the type of bearing structure and the construction materials are certainly the most important parameter that affects the seismic behavior of a building. As most studies of damage due to earthquakes have demonstrated, other aspects related to the structural form (regularity in plan and elevation), to the construction quality or the historical data (design code, pre-existing damage, strengthening interventions or modifications to the structure) have an influence on the building performance during the earthquakes. Another parameter that plays an important role, since it has a great effect on both structural capacity and demand, is the number of floors that are directly related to the height of the building and hence to the period of vibration.
About the classification of the energy performance of the building stock, several approaches have been proposed. Nageli et al. have recently implemented an agent-based modeling approach that models stock development in terms of new construction, retrofit and replacement by modeling individual decisions on the building level [26]. A methodology for building-stock description using building-specific data and measured energy use to augment an age-type building-stock classification has been described by Osterbring et al. [27]. Instead, Oberegger et al. [28] have introduced a levelized cost method to develop building stock retrofit scenarios with a demonstration of the method on a housing stock in northern Italy. A tool that allows public institutions to create a comprehensive database of the energy performance of buildings in an urban setting based on the WEB-GIS plug-has been explained by Dall’O’ et al. [29]. At a multi-scale level (and thus: national, city, county and district), an archetype development methodology—using different data-driven approaches—has been introduced by Ali et al. [30]. The methodology consists of the following five steps: (1) data collection, (2) segmentation, (3) characterization, (4) quantification and (5) modeling results. Statistical models can be used as surrogates of detailed simulation models. Westermann et al. [31] have proposed a comprehensive review for discussing noteworthy publications in the matter of sustainable building design research, where the surrogate modeling is applied.
In addition, the building components should answer to other characteristics for optimizing the thermal and acoustic behavior, the natural ventilation and daylighting of internal spaces. There are a lot of factors that influence these performances. Focusing on the energy performance the main parameters are the thermal transmittance (U) [32], a measure of insulation level of building component; the time lag, the decrement factor, the thermal heat capacity and the periodic thermal transmittance (YIE) as defined by [33] that describe the dynamic behavior of the building envelope during the summer. The effects on the indoor environment (in terms of heat stress) due to the climate overheating have been recently investigated by Rajapaksha [34] with reference to office buildings located at the tropics.
In addition, the spectral characteristics of finishing layer should be considered. Indeed, solar reflectance and thermal emittance significantly affect the temperature of a building component, and these can contribute to reducing the summer energy demand or building overheating as well as the heat island effect. How is it possible to include all these aspects in a typological classification that does not require collecting documents or in site investigations? With the aim to suggest a readily reproducible methodology, the main information that should be acquired for the characterization of the building stock could be: building size, construction materials and age and municipality. These categories take into account all the highlighted aspects because, for instance, the combination of the structural materials and age is related to materials/typology usually used for the envelope giving information on the value of thermal transmittance and periodic thermal one. The distribution of these data is easy to collect from national censuses that are carried out since many centuries in a lot of States. First of all, buildings can be divided according to size classes that refer to the particular kind of building use; these refer to specific dimensional typologies and thus the most common geometry can be identified. The second class is the construction age with specific materials that reflects constructive (due to the codes, knowledge and technique of that time) and dimensional typologies of the buildings. The average age of existing buildings is a good indicator of the average efficiency of the building stock indeed it indicates if the building has been designed following structural or energetic codes.
The third element to take into consideration is the administrative division of the considered country and the territorial characteristics. These aspects influence constructive typologies in terms of available materials for instance and also in term of seismic and climatic solicitations.

3.2. Intensity Measure Selection

The definition of fragility curves requires the adoption of an adequate intensity measure (IM) that is represented on the horizontal axis of the fragility curve graph.
From the structural point of view, generally, the level of ground motion, i.e., the seismic input, is represented on the horizontal axis of a fragility curve. In literature, many parameters were used to define the severity of ground motion, among which the most common are the macroseismic intensity (MI), the peak ground acceleration (PGA), the peak ground velocity (PGV), the peak ground displacement (PGD), the spectral acceleration (SA), the Housner intensity (HI). For a long time, the most used parameter characterizing the motion of the ground was the macro-seismic intensity (MI), that is a descriptive parameter, based on observations of effects of earthquake on the environment. This parameter has the advantage of the availability of historical data on earthquakes in the seismic region where few or no instruments are present. However, it is a subjective parameter, strongly dependent on the characteristics of the building stock under observation, and thus it has the drawback to lead to different values of intensity, at the same site [35]. In addition, it is also difficult to relate macro-seismic intensity to a structural performance parameter of the building such as force capacity or displacement. Often the PGA is used being an objective measure of the severity of ground motion that can be recorded in everywhere. However, it has the drawback to ignore the relationship between the frequency content of ground motion and the dominant period of buildings. The latter can be overpassed using PGV and PGD as suggested by Rossetto [36]. It was emphasized by several authors [37,38] that a good correlation with damage data is given by elastic spectral. However, there is a problem with the determination of vibration periods, i.e., the require structural information regarding the building typology in order to be used.
The energy needs of the building is the amount of energy that the heating and air-condition system must provide for balancing the heat transfer phenomenon due to internal and external forces. The main sources of internal loads are occupants, equipment and lighting system. The occupants’ behavior is the most difficult to describe because they can interact, randomly according to their needs, with several components like windows or plant systems. Currently, when the energy performance is studied, the main approach is to use default library of possible deterministic schedules for describing the thermal zones. Webb et al. [39] have found that the occupant behavior can offset energy saving from physical retrofit in both positive and negative ways. In addition, Rouleau et al. [40] have suggested that the occupant behavior is a critical aspect for understanding the energy usages in residential buildings, and with a regression analysis, they have shown the impact of opening windows in winter or using electrical appliances. Effects of occupant behavior on cost-effective building retrofitting for edifices built in reinforced concrete have been deeply analyzed also in [41].
The external forces can be summarized with the climatic conditions in terms of: (a) the outdoor air temperature, (b) the global horizontal radiation, (c) the wind direction and (d) the wind velocity, (e) the relative humidity of outdoor air and so on. These elements influence the heating losses, the solar gains and thus the energy balance on the building. Very cold conditions correspond to high heating demand and very hot climates require the adoption of air-conditioning for many hours. Typical weather data sets can only predict long-term variations of climate, meanwhile extreme weather files (defined taking into account the climate change) could be useful for taking into consideration the effect of local phenomenon as the heatwaves.
The adoption of the degree days is the most common approach for calculating the incidence of outdoor air temperature on the seasonal building energy consumption. More in detail, the heating degree days (HDD, in the following) are a measure of how much and for how long, the outside air temperature was lower than a specific base temperature (e.g., air temperature set-point of heating system). They are used for evaluating the incidence of climatic condition on the heating energy consumption. Moreover, the cooling degree days (CDD) are a measure the number of time in which the outside air temperature is higher than a specific base temperature. These are adopted in the evaluations related to the summer air-conditioning.

3.3. The Performance Levels

The third element concerns the definition of a threshold performance level that can correspond to a damage or quality classification. In seismic risk assessment, the damage thresholds are called limit states. These can be considered the boundary between two different damage conditions or states. The most common approach for a classification of the effect of an earthquake is the distinction of the following damage states: no damage; slight/minor; moderate; extensive; complete. It is worth to underline that the number of damage states is variable. It depends also by the functionality of the and by the repair duration and cost of a building element.
In the energetic field, the performance level of a building can be defined through the comparison of the energy consumptions with a threshold value. The energy performance of a building is more appropriately defined as the amount of energy currently required (i.e., measured or estimated on the basis of simulation) to meet the different needs associated with a standardized use of the building, and these can include, space heating, hot water heating, space cooling, ventilation and lighting. This amount shall be reflected in one or more numeric indicators which have been calculated, taking into account insulation, technical and installation characteristics, design and positioning in relation to climatic aspects, solar exposure and influence of neighboring structures, own-energy generation and other factors, including indoor climate, that influence the energy demand.
This comparison can bring, very often, to assign a score that corresponds to a building energy classification. There are several rules for defining the energy labeling around the world. However, it seems interesting to introduce a method that allows comparing the energy performance for different climates.

4. Residential Reinforced Concrete Building Stock

The application of the introduced methodology is proposed for the residential building stock. This sector is particularly important not only for social reasons but also for several technical motivations. First of all, residential buildings account for 75% of the total stock in Europe and a substantial share is older than 50 years with many buildings in use today that are hundreds of years old. More than 40% of housing stock has been constructed before the 1960s when energy building regulations were very limited [42]. Moreover in Europe, the buildings’ energy need accounted for 41.7% of total consumption; more specifically, consumption in the residential sector alone accounted for 27.2% of the final energy consumption, based on data from 2017 [43]. Among different nations, Italy has been chosen because it is characterized by different seismic risk as well as by a great variability of climatic solicitation. The buildings with reinforced concrete (RC) structure, with a framed bearing structure, characterize the Italian construction heritage of the last 50 years and are widespread throughout the national territory even in small towns. It represents around 25% of the existing residential buildings [44].

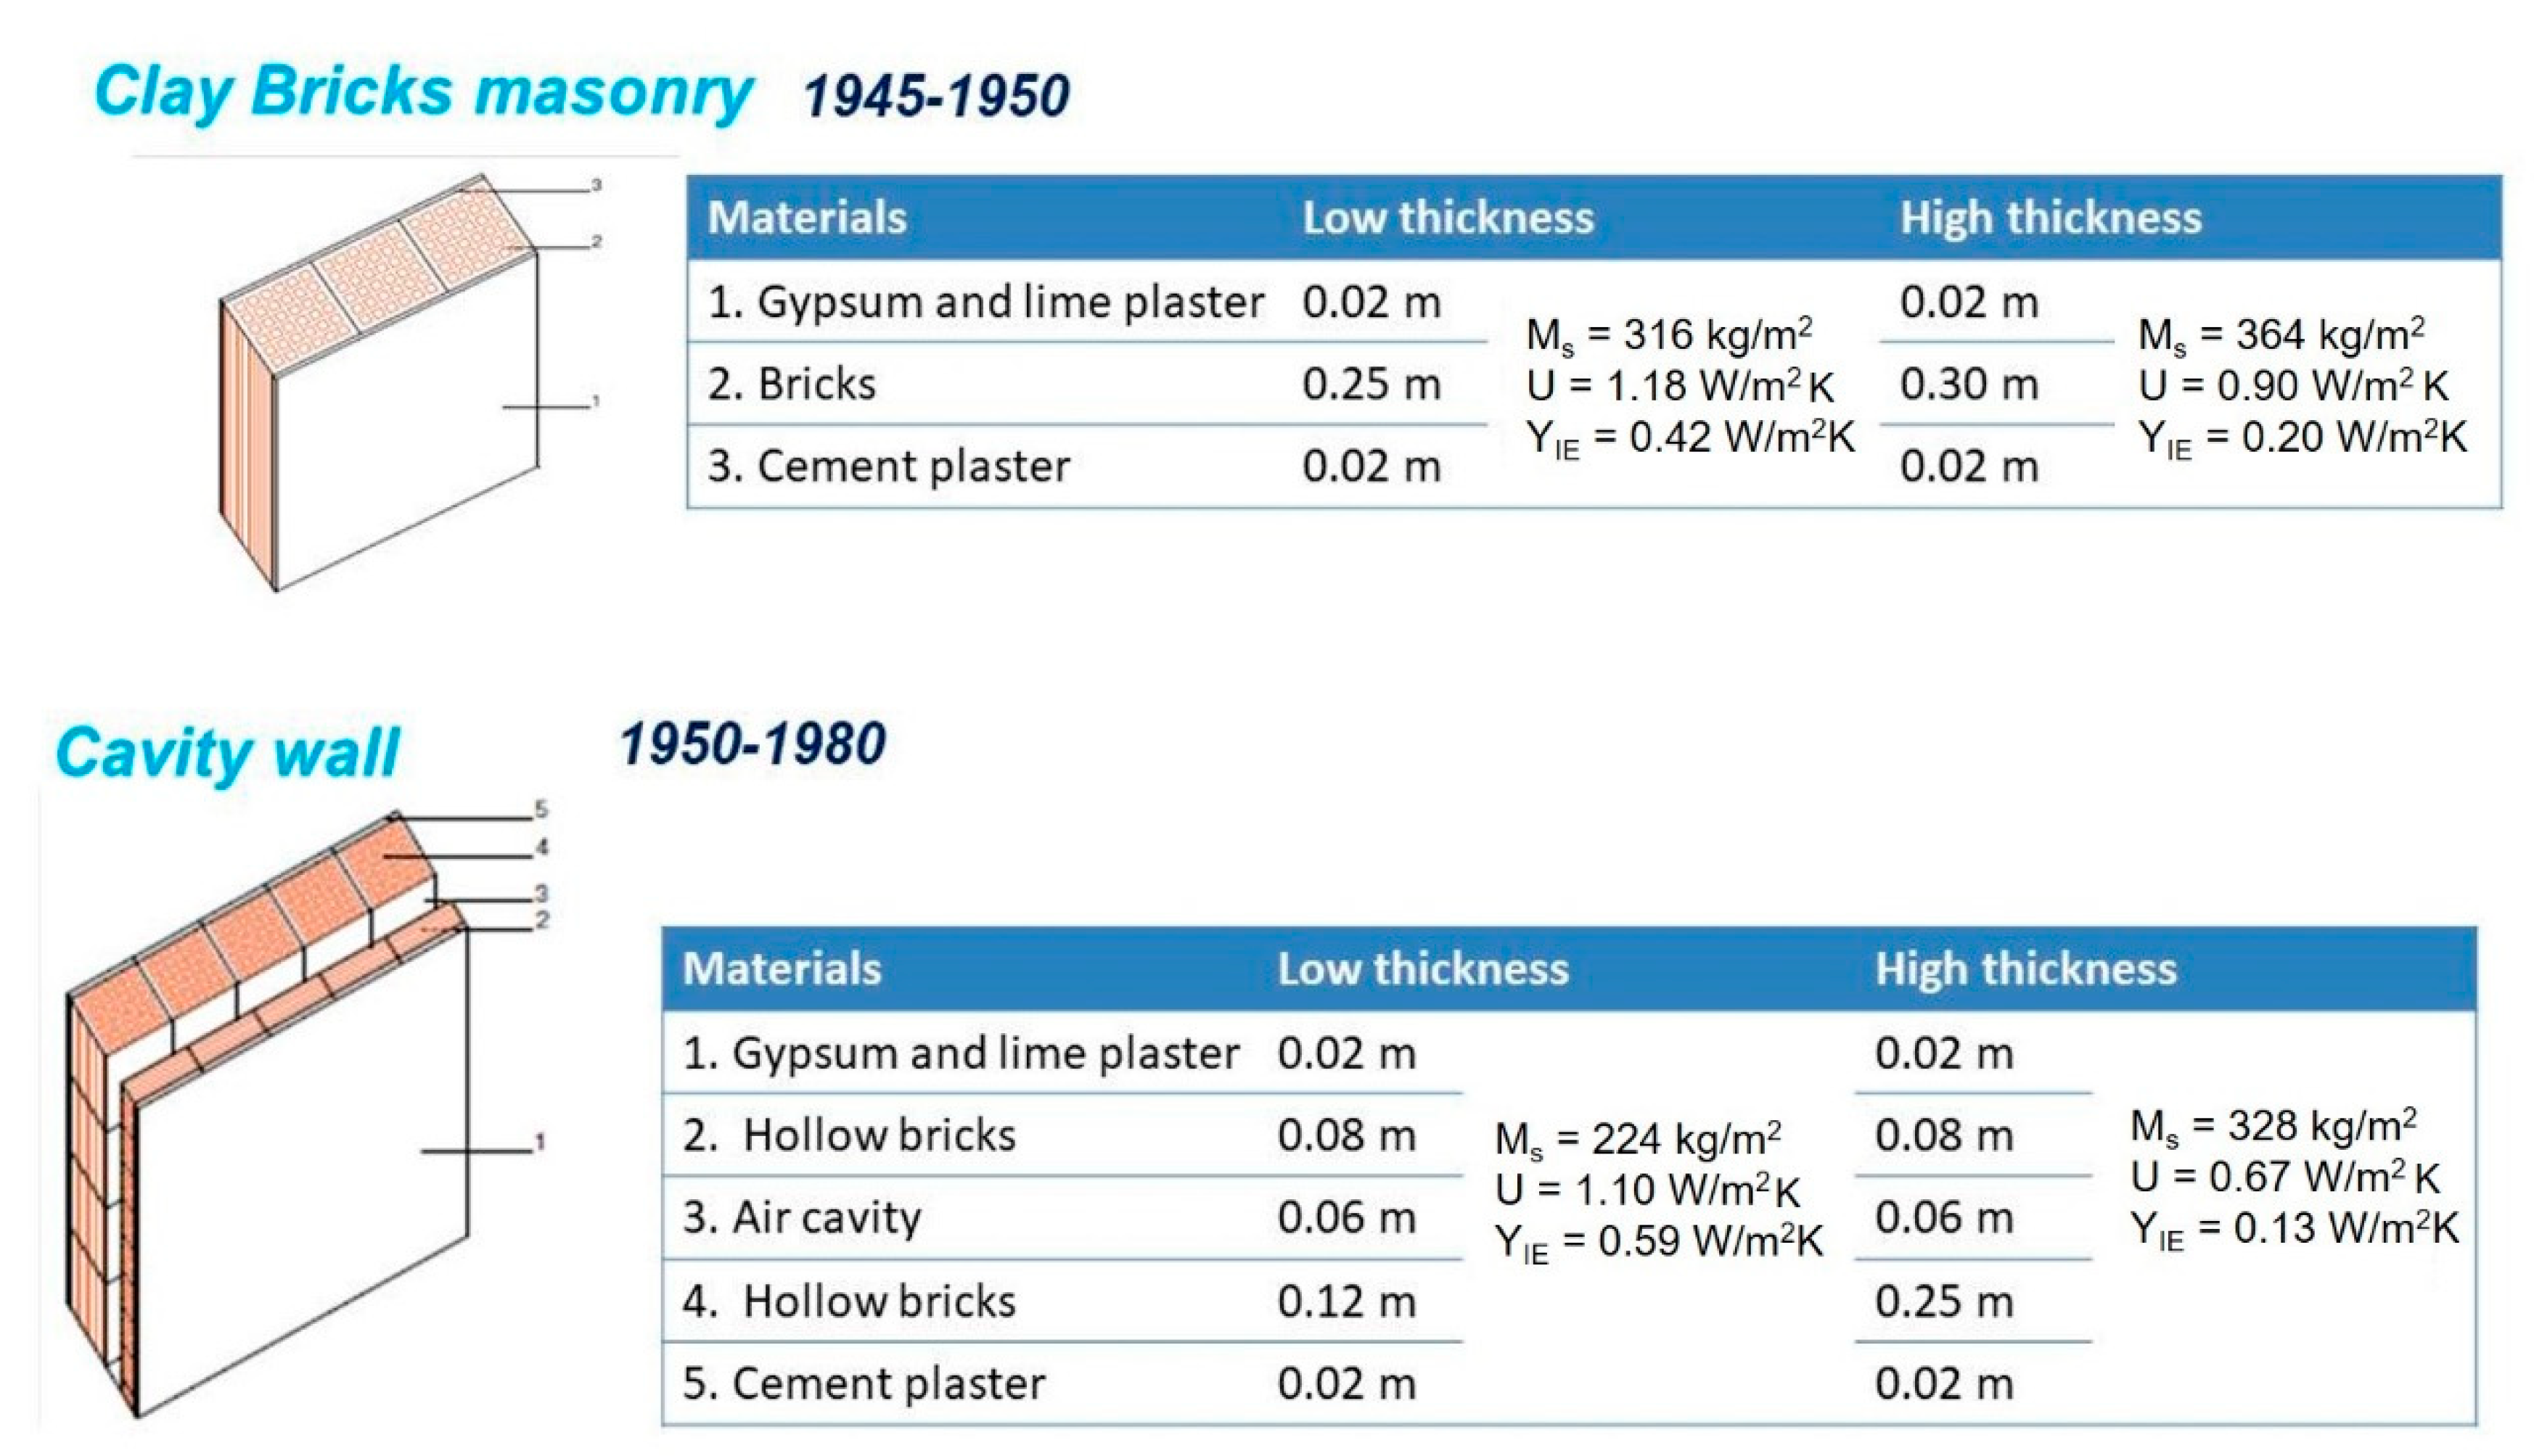
4.1. Reference Building Stock

Considering the methodology explained in the previous section, for defining the geometry, two or three classes of height related to the number of floors are sufficient for reinforced concrete buildings as demonstrated by many authors [17,45]. Moreover, some of the most diffused classes are:
  • detached or semi-detached house: on one or two floors, without or with bordering buildings;
  • terraced house: one of a row of similar houses (one or two floors) joined together by their sidewalls;
  • multi-dwelling units: several housing units inside one building or multiple buildings within a unique complex;
  • apartment blocks: high-rise buildings, multi-storey, with a large number of flats.
In 2017, more than 4 out of every 10 persons (41.9%) in the EU-28 lived in flats, close to one quarter (24.0%) in semi-detached houses and just over one third (33.6%) in detached houses [46]. In Italy, 74% of the residential stock is composed by multi-family buildings with an average size of 91 m2 [47]. For this reason, the proposed methodology has been applied, as a case study, to a multi-family unit.
The construction age for the residential building in Italy can be distinguished in eight periods, i.e., before 1900, between 1901 and 1920, 1921–1945, 1946–1960, 1961–1975, 1976–1990, 1991–2005, after 2005 according to the Tabula project.
However, it is worth to underline that the reinforced concrete structures follow specific rules about the minimum reinforcements, minimum strength and construction details related to the codes used for their design. These rules have evolved over time; therefore, from the structural point of view, it is important to know the year of construction. Furthermore, the municipality indicates if the building has been designed according to seismic regulations or without considering these, because, in the countries, the seismic areas have been defined during the time. In Italy, Di Pasquale et al. [48] have indicated that a building should be considered seismically designed if it has been constructed after the year 1975; this data corresponds to the first applicative decree of the Italian law n. 64 of 1974, introducing a new seismic zonation and specific regulations for constructions in seismic areas.
The main information about the most common building envelope typology are often classified according to construction periods and climatic zone. This information is reported in several national and international technical documents.
The reference building stock has been selected to represent the typical residential buildings of the period between 1946 and 1980. Thus, the selected typologies that are generally rectangular in shape, refer to two basic periods: 1946–1974 and 1975–1980. This time lag derives from the succession of two technical regulations (from the Royal Decree n. 16 of 1939 to the National Law n. 64 of 1974) significantly different for the design of reinforced concrete structures, but for the first period only the post-war period is considered because reconstruction by reinforced concrete improved. In addition, the construction age is also linked to the energy requirement; in most EU countries, as in Italy, half of the residential stock was built before 1970, i.e., before the first thermal regulations. Instead, under the energetic point of view, it can be considered that the edifices built in the period 1946–1974 are normally not insulated; instead for the building in the period 1975–1980, there is often a low insulation level by means of expanded polystyrene foam or closed air cavity.
The typological characterization has led to building typologies with flat symmetry and with beams present only along the perimeter in addition to the longitudinal direction of the building; the floors are warped in the shortest transverse direction. Figure 2a shows the plan of the building and the division of the apartments for the ground floor and for all other floors. The flats have a different area that varies between 51 m2 for flat 5 at the ground floor and 128 m2 for flat 4. The number of stories can vary from 2 to 6 but the internal distribution is the same shown in Figure 2a.
Moreover, Figure 2b reports the total building area and the net heated area in the case of building with 4 and 6 stories building. The ratio between the glazed surface and the opaque envelope (Window to Wall Ratio, W/W) and the shape factor (S/V) are also indicated. It is a measure of the building’s compactness and it is calculated as the ratio between the dispersing net surface (envelope area bordering with an environment with different temperatures than the internal one) and the air-conditioned gross volume.
For the proposed case study the envelope characteristics are selected from the Italian “National Building Typology” of the European IEE project TABULA [49]. It is important underling that TABULA typologies are well established and available for several European countries. For this reason, the proposed database for the application of the introduced methodology can be extended to other countries.
For the case study, and thus for the characterization of the Italian building stock, information and data of TABULA have been integrated with some abacus in the appendix of the technical standard UNITS 11300 [50]. Moreover, the requirement for new and refurbished buildings in terms of insulation level and plant systems performance are usually reported in national law. For the presented case study, these values are reported in the ministerial decree [51]. This decree indicates all parameters that can be considered when a building is designed or refurbished. Briefly, the main prescriptions regard the building envelope and the heating, ventilation and air-conditioning system. For instance, for refurbished buildings, thermal transmittance threshold value of the wall ranges from 0.45 W/(m2K) (warmer cities) to 0.28 W/(m2K) (colder cities), for the roof and the slab on the ground the values are respectively 0.33 W/m2K and 0.38 W/m2K, otherwise for the windows, the thermal transmittance has to be lower than 2.2 W/m2K. Moreover, in the matter of thermal inertia, for the vertical opaque envelope, on all sides except north, north-east and north-west, the surface mass (Ms) has to be higher than 230 kg/m2 and/or the periodic thermal transmittance (YIE) must be lower than 0.10 W/m2K. Instead for horizontal envelope YIE must be lower than 0.18 W/m2K.
The external frames can be equipped with infill panels with different configurations capable of significantly influencing the seismic and energetic response of the buildings. In this work, we considered the configuration of external frames with full height infill panels. More in detail, for each Italian region it has been individuated the type of wall and slabs according to the considered period (1950–1980) in term of materials and thus density, thickness, thermal conductance and specific heat.
These parameters have been used for the calculation of the thermal transmittance (U) and the periodic thermal transmittance and the surface mass. The construction practices change according to the different parts of a country and in the proposed case study, the regions have different characteristics for the building stock. Figure 3 shows, for instance, the most typical reference wall of the Campania region. This region has been selected because, in the following sections, some analyses will be developed as an application example of the proposed methodology. In this case, two typologies have been found and, for each one, two insulation levels have been considered by varying the thickness of some elements as derived by the analysis of the building stock. The number of building elements typology varies across the regions; for instance, for the wall in Veneto 4 typologies have been found and only one in Toscana.

4.2. Intensity Measures

In countries like Italy, the PGA can be chosen for representing the motion of ground on the horizontal axis of fragility curves. The main reason for this choice is related to the fact that the Italian hazard map for a return period of 475 years [52] is described in terms of PGA, as shown in Figure 4a, and hence a single mean value of PGA can be associated to each municipality, i.e., building location, that could be the common parameter to develop integrated structural and energetical risk scenarios.
Indeed, for the development of energetic curves that consider the winter building energy performance, the heating degree day can be used. In Italy, according to [53], the heating degree days assign a climatic zone to each municipality: “A” means lower than 600 (K day), “B” from over 600 (K day) to 900 (K day), “C” from over 900 (K day) to 1400 (K day), “D” from over 1400 (K day) to 2100 (K day), “E” from over 2100 (K day) to 3000 (K day). For what concerns the heating degree day (HDD) definition, there are several methods. Probably, the most rigorous approach, also transposed in the technical standard UNI 10349-3 [54], is based on a calculation that sums the differences between the base temperature (e.g., 20 °C) and the hourly outdoor air temperature (degree-hours) and then dividing by 24 (i.e., the number of hours of a day). The classification is shown in Figure 4b.

4.3. Performance Levels

When the aim is the evaluation of the seismic risk, the limit states can be used as damage thresholds for a structure, as an RC building. Basing on the approach proposed for the structural curves [10], the energetic fragility curve is defined as the cumulative distribution of the probability that the primary energy consumption is comparable with certain threshold values that allow to compare the performance of a building with the building stock but also with the expected target in the case of refurbishment intervention. The calculation of the energy performance is based on dynamic energy tools (e.g., DesignBuilder [55] and EnergyPlus [56]). These allow taking into consideration the not-stationary phenomenon occurring with variable external conditions and the inertial behavior of the building-plant systems. This means that the energy balance is solved with hourly time-step and the building performances are simulated according to a tailored rating, with a scheduled definition of internal gains and occupation patterns that also influence the energy needs. More in detail, in this study the attention has been focused on the winter energy performance since the heating degree days have been selected as intensity measure. Thus, the introduced relation expresses the probability for a building to exceed a threshold level for heating consumption when external climatic conditions, parameterized through the day degrees, change. The equation is as follows:
P [ EP H EP S   |   HDD ] = Φ [ 1 β ×   ln ( HDD μ HDD ) ]
where:
  • EPH: primary energy for heating;
  • EPS: threshold level for heating consumptions;
  • μ HDD : mean of the HDD of a climatic zone, for which the building reaches the consumption threshold;
  • β : standard deviation of the natural logarithm of heating degree days of the consumption threshold;
  • Φ: normal cumulative distribution function.
More in detail, EPH is calculated by means of simulation software for the considered heating period in each city. It is the heating energy demand that characterizes the simulated constructive configuration. The equation allows calculating the probability to have a value of EPH higher than the threshold level, when the HDD is fixed.
There can be implemented different types of classification according to the selected EPS. One of the possible choices consists of the consideration of the energy consumptions of the building stock. More in detail, the simulated consumptions can be compared with the reference energy demand of the building stock for evaluating what is the most critical solution. In other words, it is possible to evaluate what kind of envelope solution determines energy performance too much different compared to the national average. If the probability is high, it means that this type of building has the need of refurbishment interventions more than other building typologies. With reference to the proposed case study, it has been used the specific heating consumption by age and by type of dwellings proposed by ENTRANZE Project [47]. Before the last energy efficiency regulation in building sector (2015), three main thermal regulations were implemented since the 1970s (1976, 1991 and 2005). These standards can be associated to level of energy performance required for the new and refurbished building. performance required. According to this evolution, the theoretical maximum consumptions are considered as threshold values. These are the adopted categories:
  • SC 100 if EPH > 100 kWh/m2 y;
  • SC 95 if EPH > 95 kWh/m2 y;
  • SC 85 if EPH > 85 kWh/m2 y;
  • SC 70 if EPH > 70 kWh/m2 y.

5. The Energy Modeling of the Case Study

The input data for the energy modeling has been derived according to the proposed procedure and considering all typologies of walls and slabs derived by [49,50]. The models have been built for around 80 Italian cities. The weather file of these locations is available in the database of EnergyPlus [56]. The climatic conditions that are the intensity measure in which the building’s energy fragility is assessed, varies from 568 HDDs and 5036 HDDs. In this section, some preliminary considerations about the energy results are proposed.

5.1. Input Data for the Dynamic Energy Model

The geometry of the model has been designed according to the reference building described in the Section 3.1 and for the case of 6 floors the rendering is represented in Figure 5 as well as the comparison with a real typical multi-family building.
For the opaque building envelope, the typologies of the walls and floors have been varied as explained in Section 3.2. The windows have been considered made of single glass with solar factor of 0.86 and polyvinyl chloride frame with an overall thermal transmittance of 5.89 W/m2K. In order to define reliable thermal loads, four typologies of thermal zones have been created (see Table 1) in each flat according to classifications and requirements provided by the Italian standard UNI 10339 [57]. The Air Change Rate (ACH or vol/h) has been fixed to 0.5 h−1, in order to guarantee the required comfort conditions, as identified by the standard UNI EN 15251 [58].
All flats have a hydronic heating system with traditional radiators used for the balancing of sensible loads, with hot water produced by centralized not-condensing gas boiler with a nominal efficiency of 69%. Moreover, each flat is also equipped with dedicated direct expansion units that can be used for the heating and cooling energy needs. During the winter, the dwellings are heated at 20 °C, and during the summer the set-point is 26 °C. The numbers of hours and the period for the activation of the heating and cooling system vary with the climatic zone. These are reported in Table 2.
As explained in Section 4.1, for each region, several configurations for the wall and slabs have been found in the reference stock. The number of possible configurations varies from a minimum of 6 to a maximum of 16 in different regions. Globally, considering all combinations of wall and slab typologies for 80 Italian cities, 1067 simulations have been done for building with 6 floors and also for the models with 4 and 2 floors.

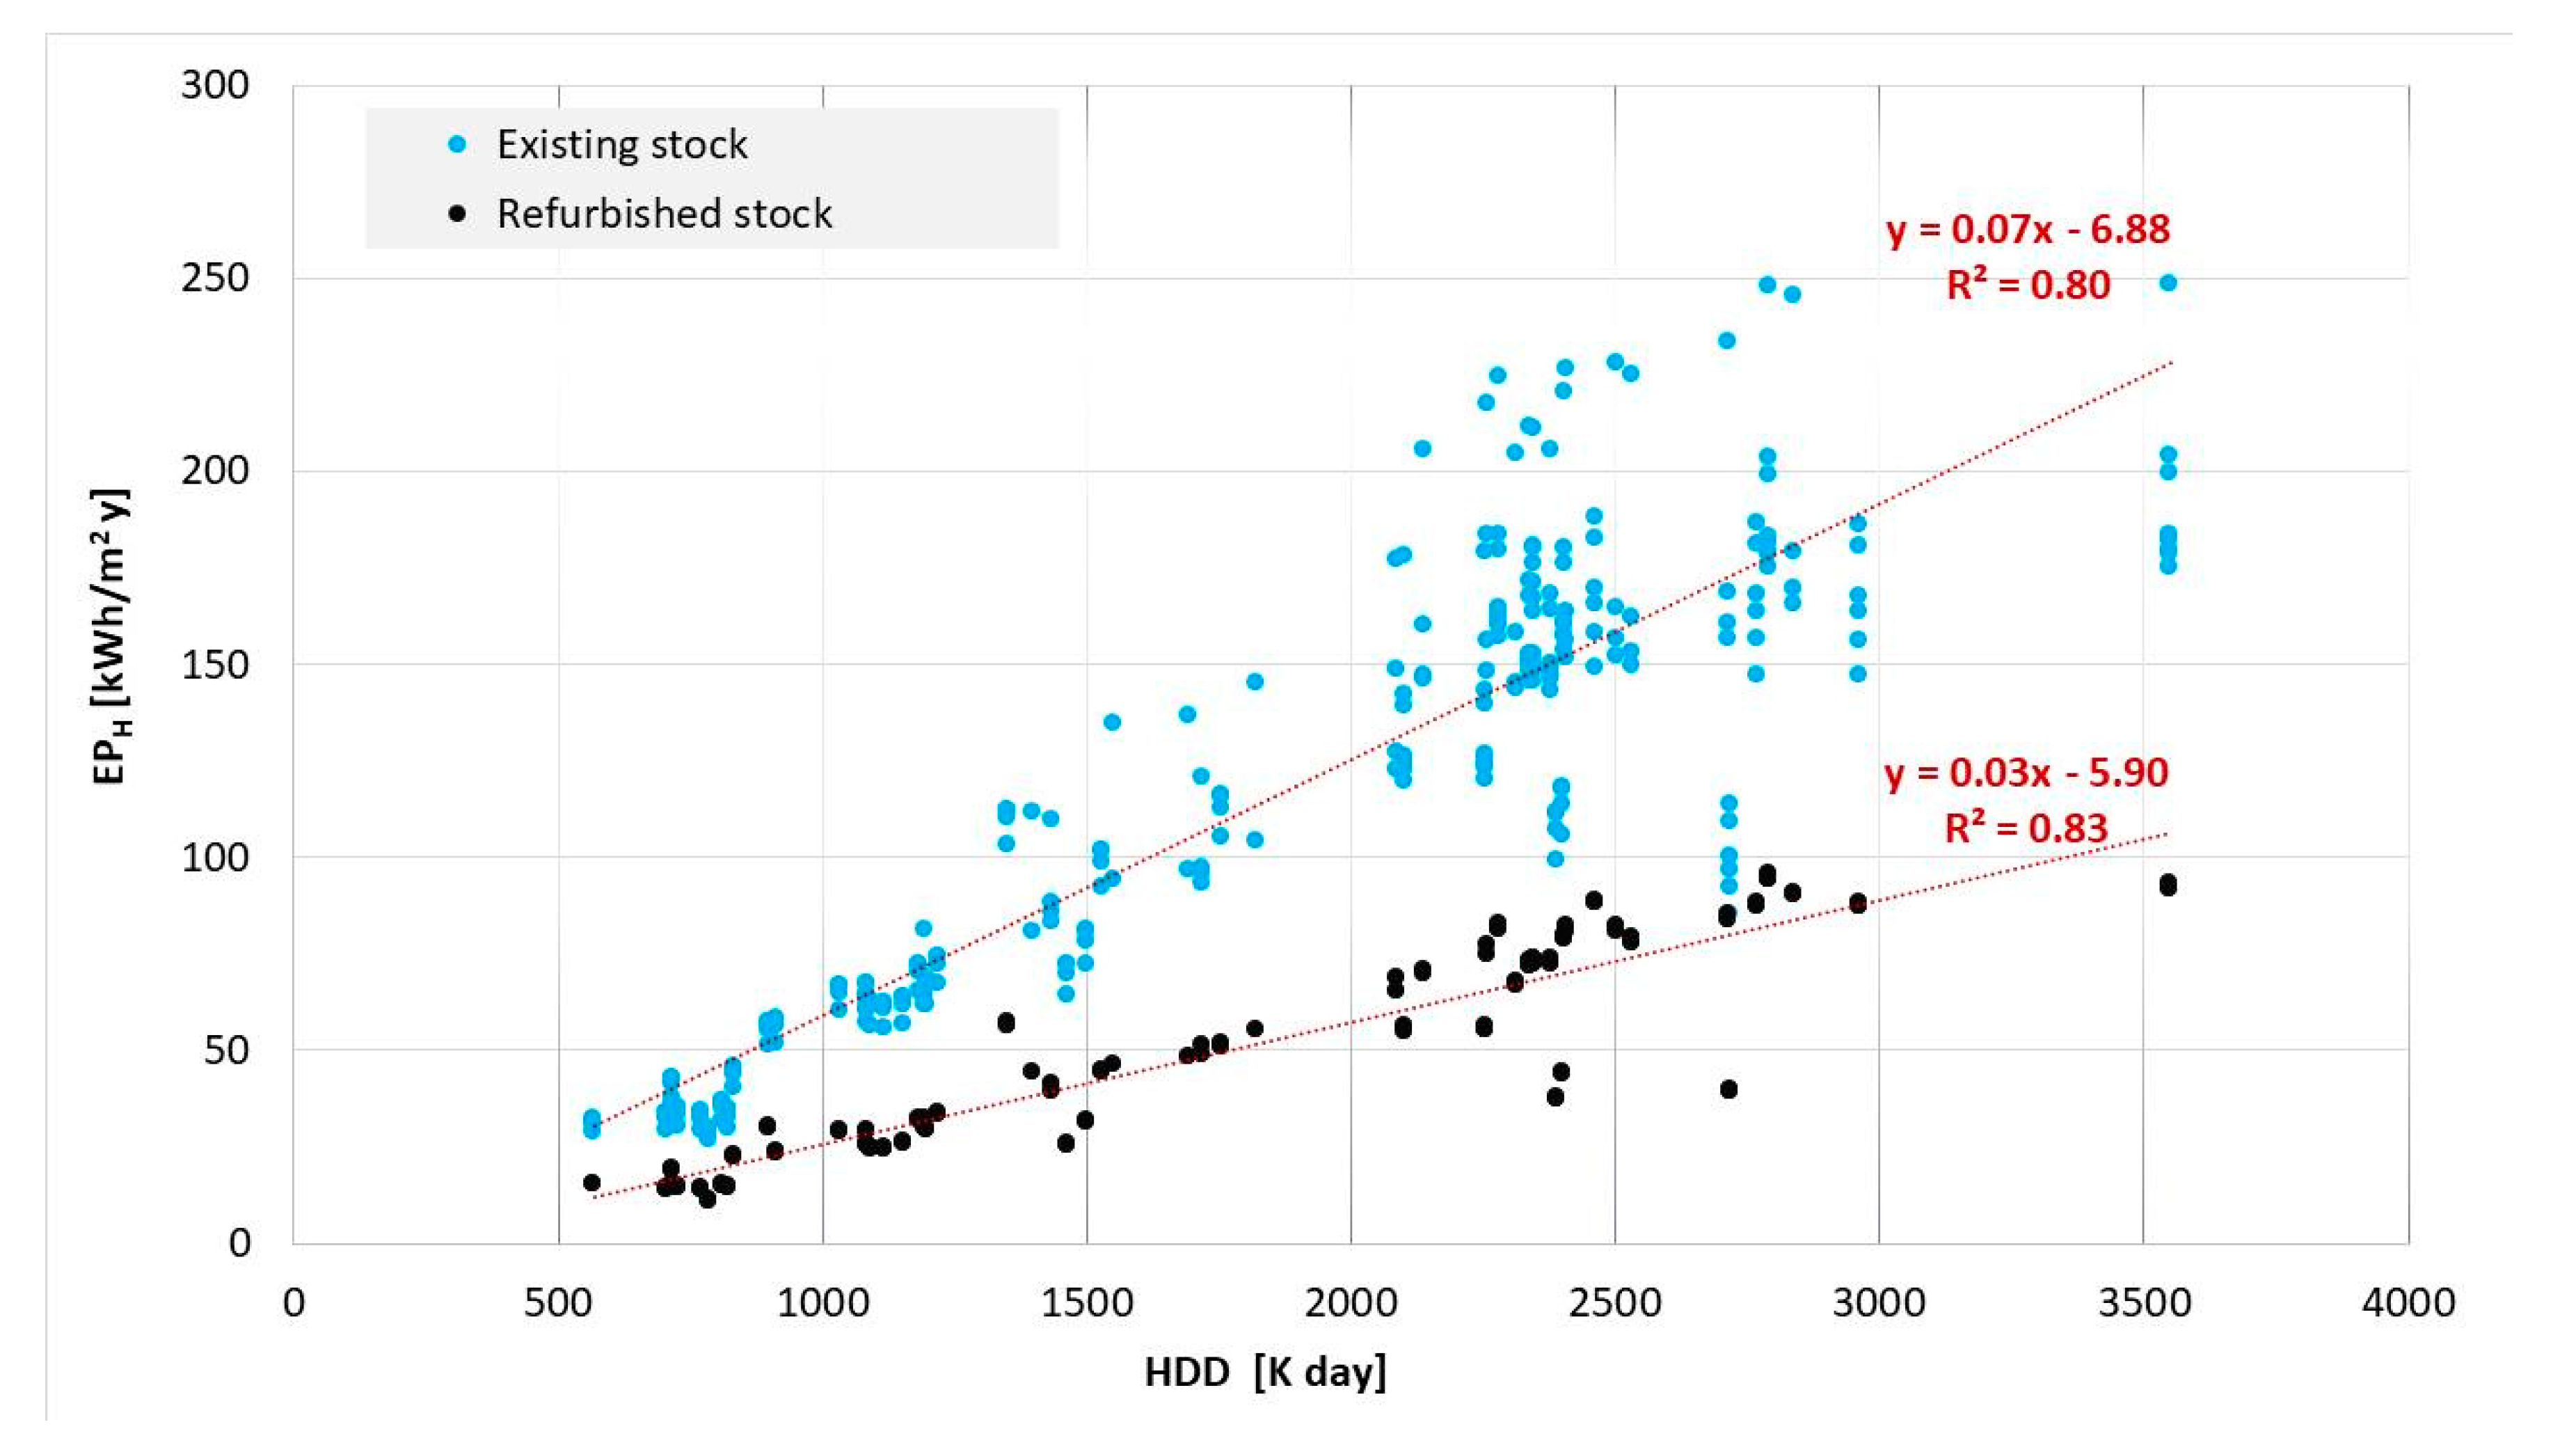
5.2. Energy Simulation Results

The results of the dynamic energy simulation can be analyzed by means of the comparison between the building stock performance and the heating demand in case of building envelope refurbishments, trying to find a relationship with the representative climatic condition. The refurbished cases represent the performance level that the building could reach if some interventions on the opaque and glazed building envelope would be done so that the requirement of the normative decree [51] will be respected.
Figure 6 shows the results in case of 6-storey building. About the building stock, the blue points arranged on the vertical (same HDD value) represent the building typologies with different insulation levels in the same city. It can be observed these points are generally very close, with the percentage difference that varies between 2% and 27%. The higher difference has been obtained with the simulations for the cold climatic zone (F). Indeed, in this case, the adoption of the insulation, also with a low thickness (3.0 or 6.0 cm of expanded polystyrene foam), determines an important reduction of the heating demand.
As expected, there is a great difference in the energy consumptions of different climatic conditions. For instance, considering Messina (Sicilia, south Italy) with 707 HDDs and San Valentino alla Muta with 5036 HDDs (Trentino Alto Adige, north Italy), there is a difference of 86% in the heating consumptions. This is enough to underline the variability of the energy performance of the building stock. In the case of refurbished buildings (black points) following the normative prescriptions, each vertical point represents the different building envelope typologies considered in the climatic zone. In addition, after the improvement in terms of insulation levels, there is a great difference in the energy performance along with different climatic conditions. Considering the same cities, again, the heating demand varies of 85%.
Moreover, it can be underlined that in both cases, with respect to the heating degree days, the linear relationship is not adequate. According to the value of the coefficient of determination (R2), it is confirmed that the energy heating demand does not steadily increase or decrease with the theoretical heating degree days and the behavior of the building–plants system is more complex.
Furthermore, considering the refurbished scenario, the results better approximate the trend line without points significantly distant from it. As expected, the thermal resistance of the envelope increases its resilience compared to the external conditions. Moreover, it is also clear that the normative indications about the requirements for the building envelope, are aimed to allow thermal behavior and energy performance suitable for the specific climatic zone. Properly insulated, well-controlled and operated buildings will have energy performance that will mainly depend on outdoor weather conditions that can be related to HDD.
The comparison of the heating demand before and after the refurbishment, suggests that in all climatic conditions this intervention assures great energy savings. More in detail, in the warmer cities (from 568 to 899 HDDs) the refurbishment of the opaque and glazed envelope allows reduction of the heating demands with a variable percentage from −40% to −60%. Similarly, in the coldest zones (from 2102 to 3550 HDDs), the energy-savings ranges between −43% and −69%.
However, it is necessary to underline that this analysis regards only the winter period and thus this conclusion could change if the cooling loads are considered. Indeed, in some climates, the insulation could cause an overheating problem during the summer. Otherwise, the scientific literature usually suggests that the insulation of the roof slab is a good solution both for winter that for summer; moreover, when yearly analysis is done, the weight of heating reduction promotes the insulation intervention. Considering the residential building, this may be also due to the greater diffusion of heating system compared to air-conditioning system.
Considering the existing stock, the points far above the trend line are the cities with the most extreme climatic conditions: 2561 HDDs (Fucino, Abbruzzo, central Italy), 3419 HDDs (Monte Cimone, Emilia Romagna, central Italy), 3884 HDDs (Paganella Trentino Alto Adige, north Italy). The heating demand varies from 224(kWh/m2 y) to 289 (kWh/m2 y) in case of Fucino; it ranges between 275 (kWh/m2 y) and 414 (kWh/m2 y) in case of Monte Cimone; and between 270 (kWh/m2 y) and 400 (kWh/m2 y) when the weather file of Paganella is used. These values indicate that the consumptions are more different than those associated with other areas. This behavior could depend by several causes. First of all, it is possible that the adopted envelope solutions are not representative of the constructive sector in these cities; indeed, also if these localities falling within the climatic zone E (Fucino) and F (Paganella and Monte Cimone), the latitude and the particular geomorphologic configuration have caused the adoption of different solutions. Another motivation could be the wrong estimation of the climatic condition; indeed, the weather file could be defined starting from old data, or data monitored in the not representative area (e.g., rural area rather than city center).
However, there are also points that lie far below the trend line that have lower consumption than would be expected from the high number of degree days. These are: 3445 HDDs (Trevico, Campania, south Italy), 4503 HDDs (Dobbiaco, Trentino Alto Adige, north Italy), 5036 HDDs (San Valentino alla Muta, Trentino Alto Adige, north Italy). Similar considerations could be done about the motivation of this difference.
For this reason, it seems interesting the analysis of the data made excluding the indicated locations. Figure 7 shows that in both cases the linear trend is more suitable considering the R2 value. Thus, it can be concluded that an in-depth analysis of the highlighted cities is necessary for two main reasons:
  • the degree days may be not aligned with respect to a calculation using dynamic energy simulation because they are based on a stationary method which involves the use of an average monthly external reference temperature;
  • the envelope types associated with the available data are not really representative of the reference stock.
The relations reported in Figure 7, can be useful for designers or city planners when they want to estimate for a large number of buildings the presumable value of the heating request before and after the refurbishment.

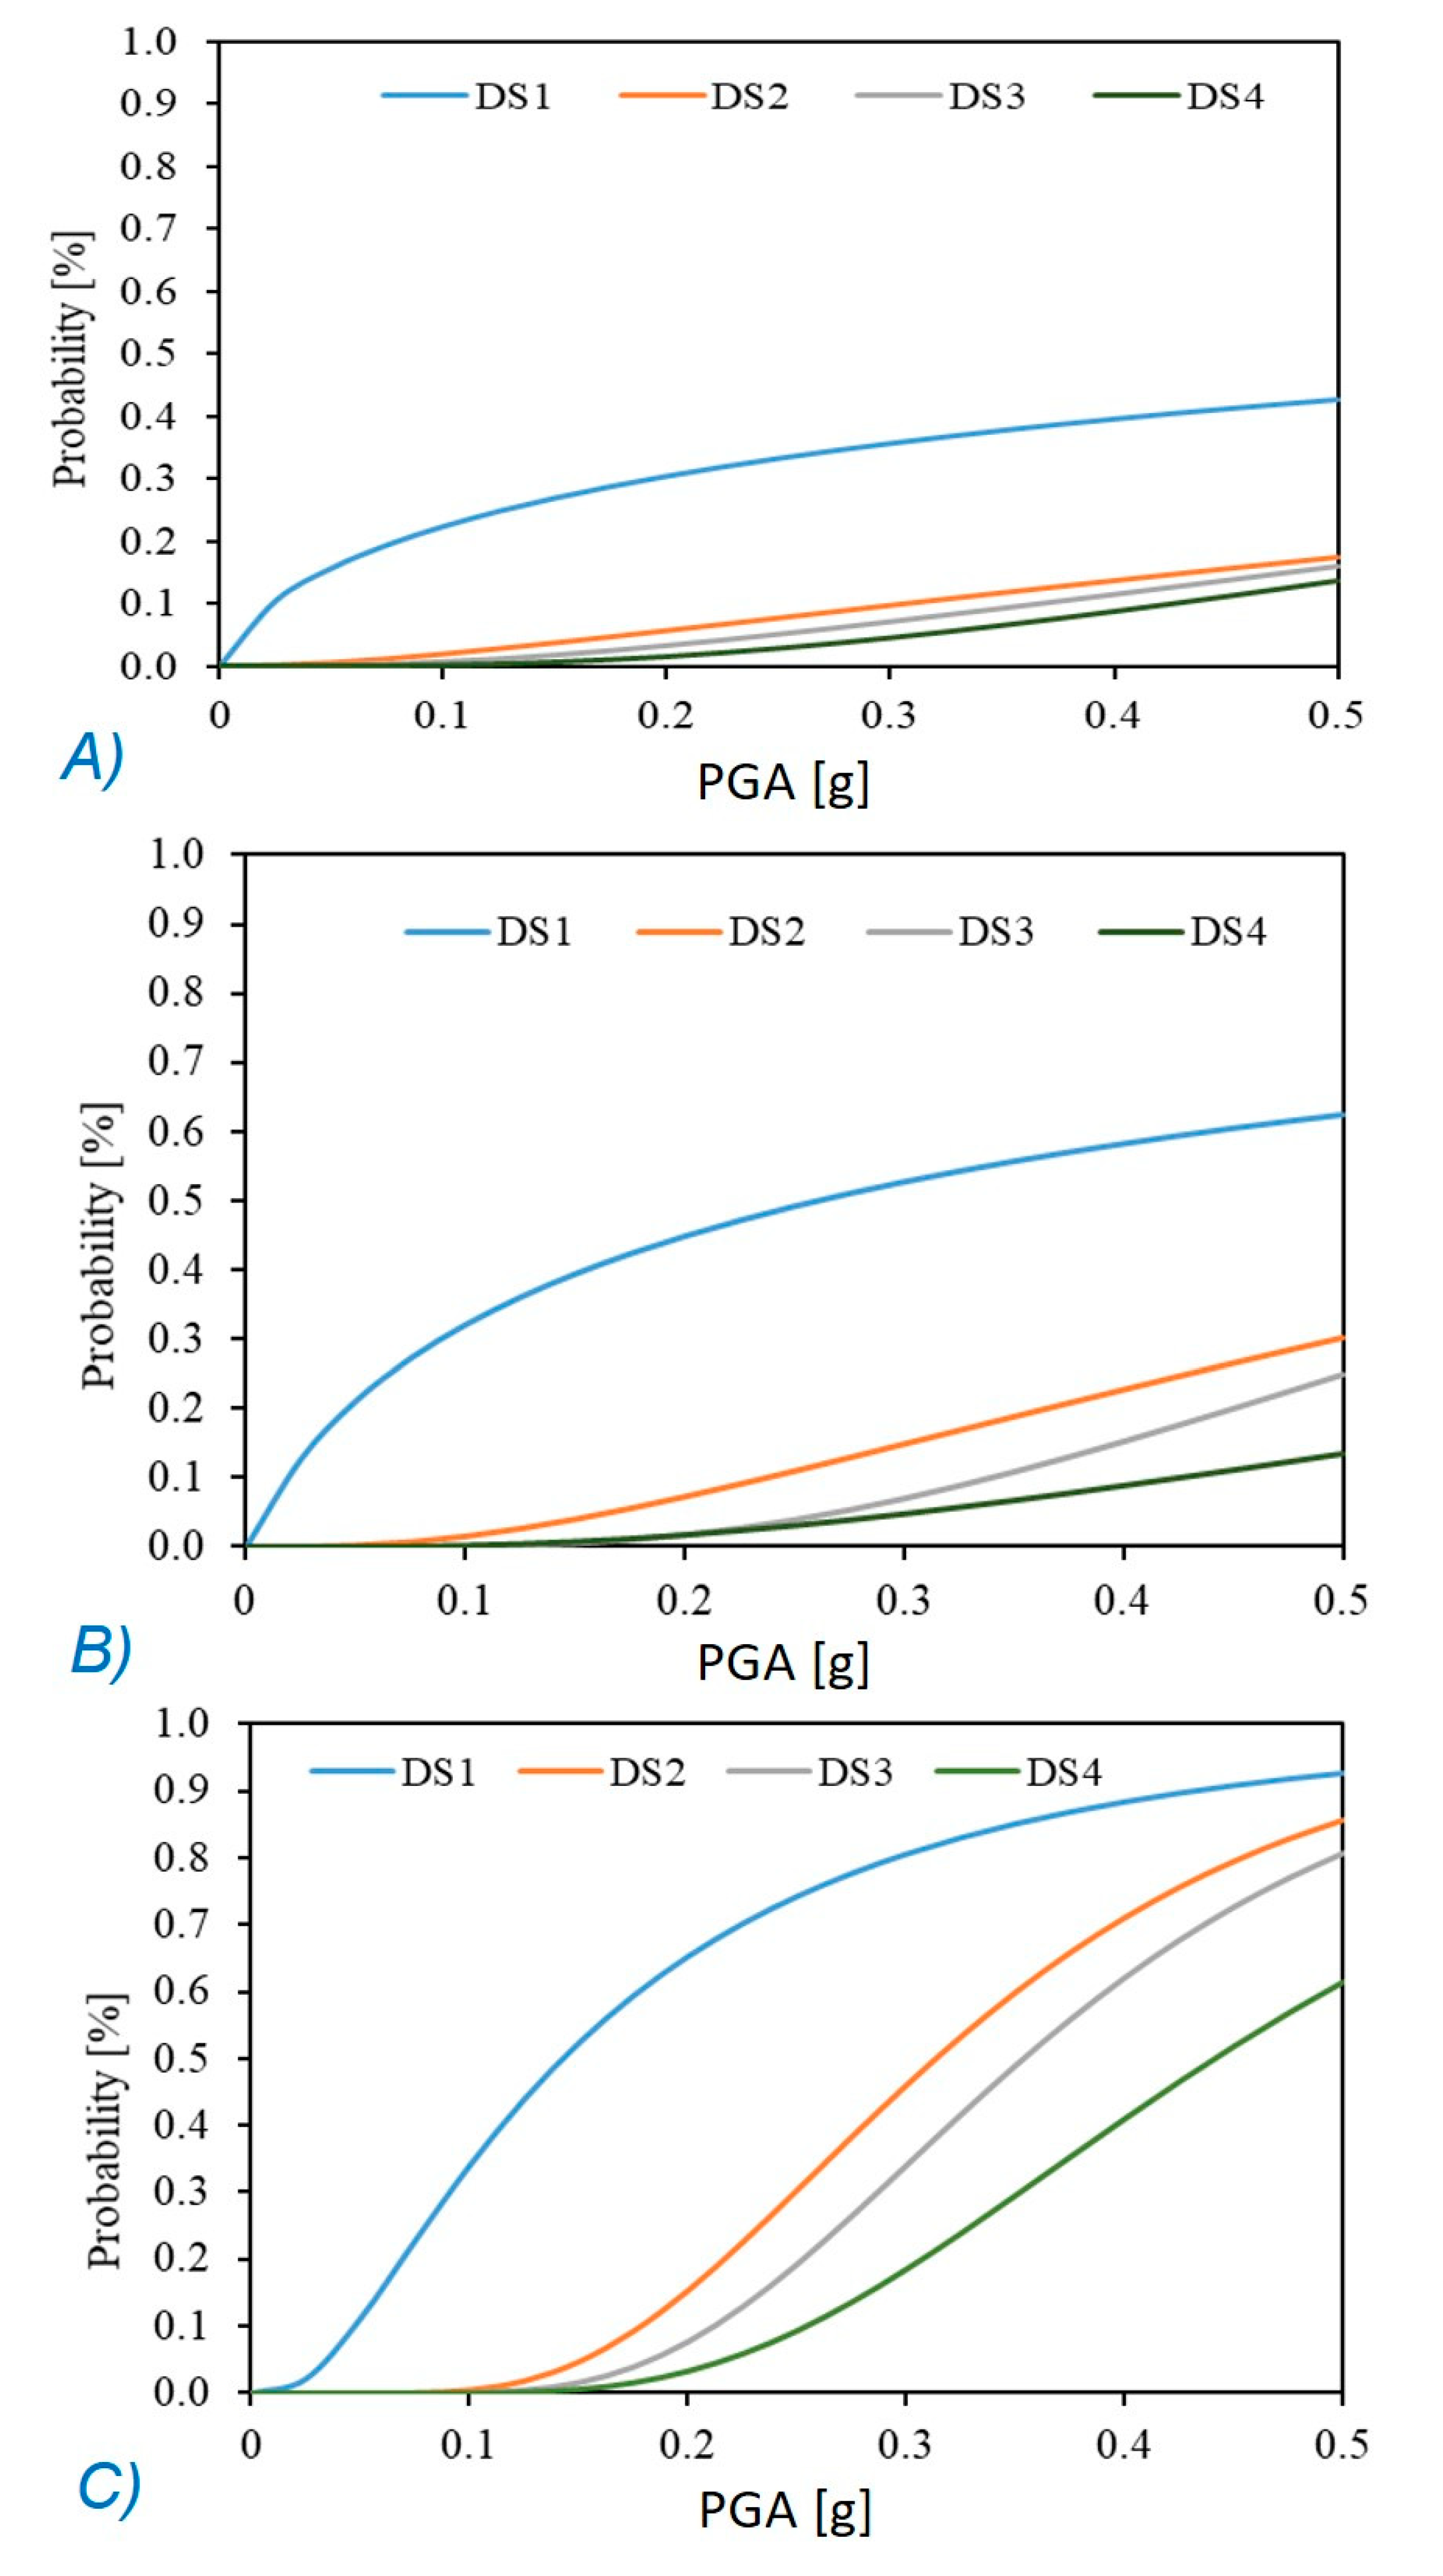
6. Structural and Energetic Fragility Curves for the Proposed Buildings Stock

In this section, the energetic fragility curves derived with the procedure described in the previous section are presented for the selected buildings stock. However, in the case of the structural curves, many researchers have been developed in past, therefore structural empirical fragility curves are chosen from the literature while the energetic ones are an innovative proposal and have been developed by numerical procedures. Regarding the reinforced concrete buildings, the review of existing structural fragility curves shows a variety of methodologies, damage states and intensity measures that surely affect the reliability of the fragility function itself. Therefore, the choosing of a suitable set of fragility curves for residential buildings, analyzed in this work, is a big challenge. In this context, empirical fragility curves are preferred since they are derived from post-earthquake surveys of buildings. It is worth to underline that the reliability is directly linked to the quality, completeness and size of the database. Indeed, empirical curves, based on data obtained from a single earthquake event, could cover a limited range of intensity measure values.

6.1. Structural Fragility Curves

The fragility curves derived by Rota et al. [8] have been chosen for the case study. These can be considered characteristic of the Italian building stock because these are based on post-earthquake survey data (a set of about 150,000 surveys) on building damage, collected in the areas affected by the most relevant Italian earthquakes of the last three decades. The scale of damage, corresponding to the one defined in the European Macroseismic Scale [59], has been adopted in this study. This is articulated in five levels of damage (plus the case of absence of damage, DS0). These are: (1) negligible to slight damage DS1, (2) moderate damage DS2, (3) substantial to heavy damage DS3, (4) very heavy damage DS4 and (5) destruction DS5.
However, in order to apply these curves to the case study together with the energy fragility curves, it was decided to neglect the damage states DS0 and DS5 corresponding respectively to “no damage” and “collapse” since in both cases it is not possible to define any seismic improvement intervention.
The reinforced concrete buildings are distinguished considering both the number of floors and the design according to seismic regulations or not (seismic design, no seismic design). The latter information can be easily obtained by combining together the information related to the year of construction with the year of seismic classification of the municipality which includes the building (i.e., the building location). Figure 8 shows the curves. From the relative comparison among curves, it is worth to note that for low rise buildings (1–3 storeys), for example at a PGA of 0.3 g, the probability of exceeding the damage state DS1 is 0.36 when the seismic design is adopted while this value of probability can more or less double (0.53) if the building has been designed only for vertical loads. The low rise reinforced concrete buildings with no seismic design appear to be more vulnerable than low rise buildings with seismic design, but less vulnerable than those with no seismic design and with a number of floors equal or higher than 4. This information, as it can be derived from the fragility curves, could be used to define prioritization strategies, in order to decide the suitable actions for existing buildings and thus retrofitting and/or replacing.

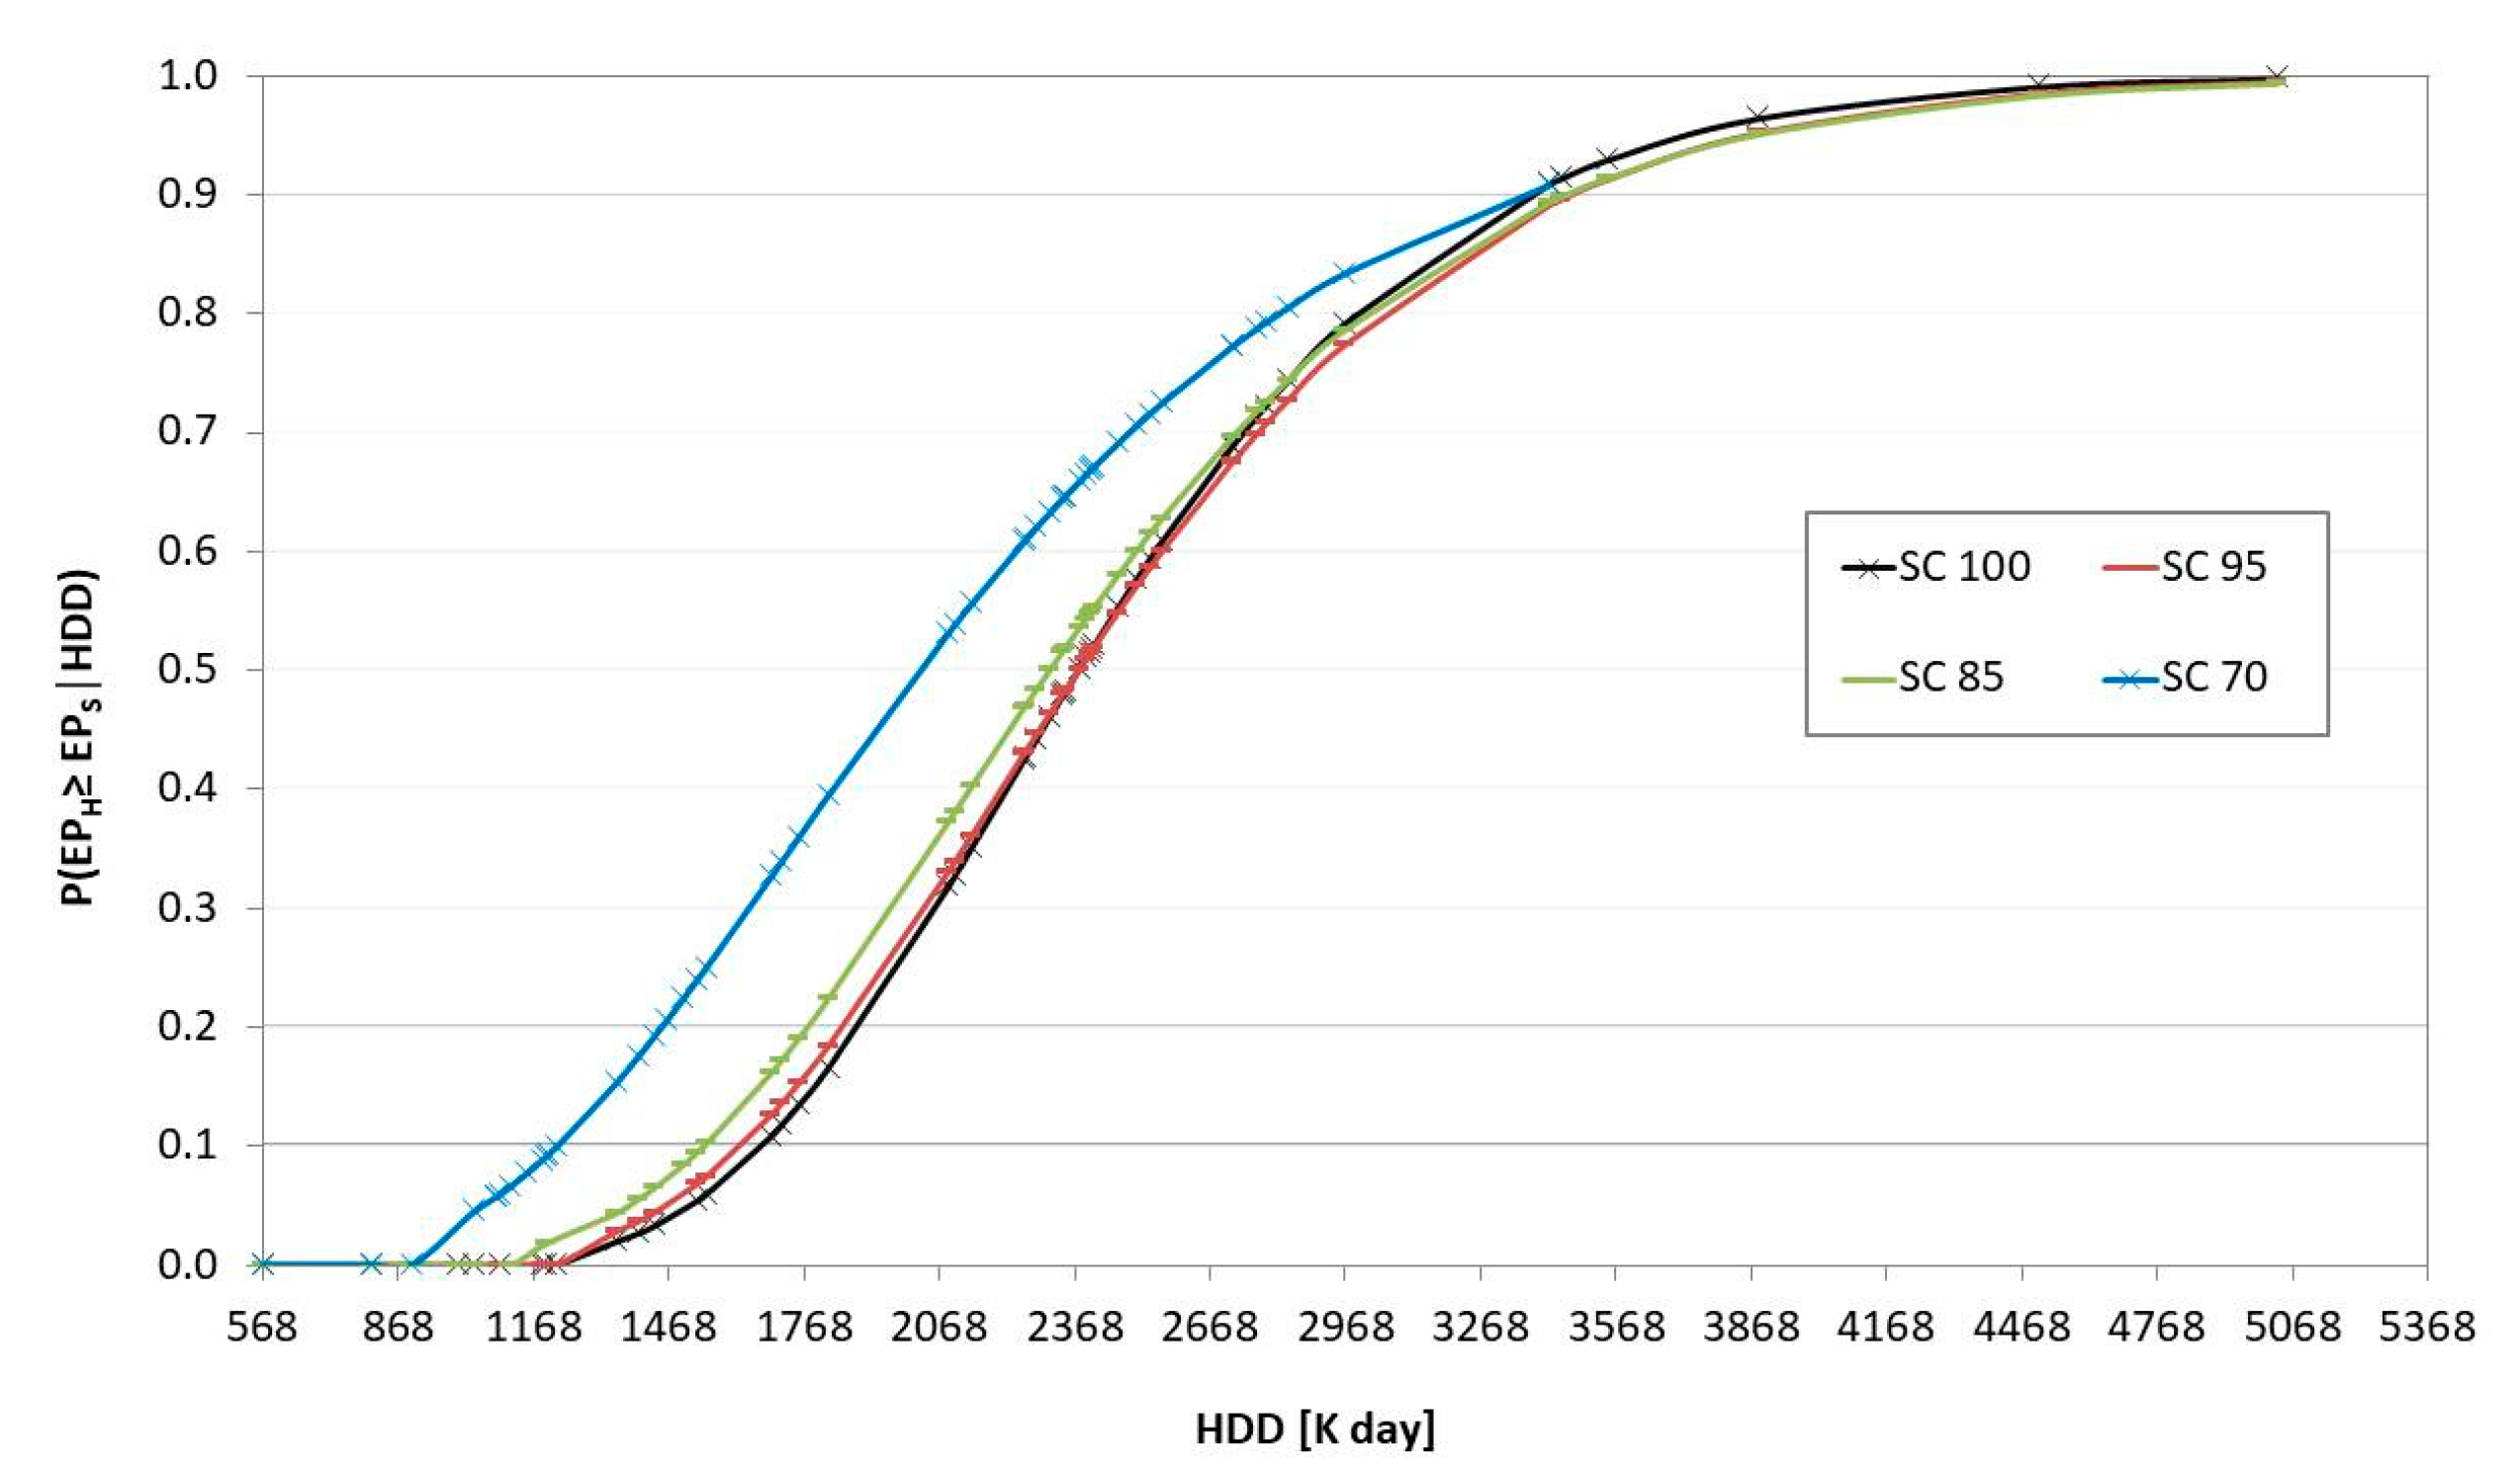
6.2. Energetic Fragility Curves

Figure 9 shows, for the 6-storey building, the fragility curves obtained by means of Equation (1). First of all, it is clear that below 1092 (K day) and therefore for all cities in Zone A, B and most of C, the probability that the building exceeds the primary energy consumption threshold for heating of 70 kWh /(m2 y) is zero.
Therefore, these buildings are less vulnerable from an energy point of view and it is possible to plan an intervention with less urgency since the heating demand is limited by favorable climatic conditions. On the other hand, for higher HDDs the probability of exceeding this threshold increases and exceeding 3400 (K day), this probability becomes higher than 90%. The figure also shows a sudden increase in the probability that passes from 28% (1821 K day) to 43% for locations with HDDs greater than 2000 (K day).
The other three consumption thresholds lead to almost coincident probabilities for each climate zone. More in detail, until 1350 (K day), and thus until climatic zone C, the probability to exceed the threshold value is null. Considering the value of 100 kWh/ (m2 y), this probability is 18% for 1821 (K day), it becomes 33% at 2087 (K day) and 60% when the HDDs are higher than 2561 (K day). More in general, the analysis suggests that all cities characterized by heating degree days greater than 2300 (K day) could benefit from insulation intervention on the building envelope.
Figure 10 and Figure 11 provide the fragility curves for the 4-storey and 2-storey buildings. The trends allow doing the same considerations that in the previous case, but the HDD for which the probabilities to exceed the thresholds move to the left. Therefore, it is clear that the shape of the building and thus its surface to volume ratio influences the energy requirement in winter.
More in particular, in the case of a 4-storey building, for the climatic condition with HDD higher than 900 (K day) the probability to exceed the threshold of 70 kWh/ (m2 y) is not null and, for instance, it is around 4% for 1034 (K day) (Napoli, South Italy). The variation from the climatic zone D to E determines a rapid rise in the probability that goes from 21% (1464 K day) to 53% (2087 K day). The curve related to 85 kWh/ (m2 y) differs from the other two, more than in the previous case. The critical point is 1195 (K day) for which the probability to exceed the reference consumption is 1.7%; it becomes 50% at 2312 (K day) and 80% at 2964 (K day). For the other two thresholds, the distribution indicates that the limit is passed starting from 1350 (K day) (Termoli, south Italy) and it has the greatest variation from 1821 (K day) (Florence, central Itlay) and 2087 (K day) (Forlì, central Italy); indeed, in the case of 100 kWh/(m2 y) the probability passes from 18% to 33%. Additionally in this case, for the climatic zone F and the great part of E the curves coincide with a probability near the unitary value. Herein, it is very important to improve the insulation building level.
Figure 10 indicates that, if the threshold is 70 kWh/(m2 y), the probability is 3% at 899 (K day) (Crotone, south Italy). The climatic zones D to E correspond to a probability of 22% to 56%, respectively. The curves of 85 kWh/(m2 y) and 95 kWh/(m2 y) are comparable and the probability to exceed the thresholds regards all cities with more than 1000 (K day). In case of 95 kWh/(m2 y), the probability is 22% at 1550 (K day) and it becomes 60% at 2255 (K day). For the 2-storey building, the most different trend is found with 100 kWh/(m2 y). Until 1100 (K day) the probability is null and it is low for climatic condition characterized by HDDs near 1800 (K day); starting from 2087 (K day), the probability rises up 40%. As in the previous cases for zones F and E, the curves are quite similar.
All told, it can be noted that these curves allow determining the expected winter performance by means of the knowledge of the climatic data summarized in the heating day degrees. The methodology can be applied also for classifying the energy performance during the summer period. Obviously, the calculation of the cooling energy needs must be performed; then, the cooling degree days can be used as an intensity measure. Moreover, the methodology is reproducible for other countries allowing legislators to have a thorough knowledge of their building stock. Indeed, by means of this trend, it is possible to understand what kinds of building, in what climatic conditions, could benefit from an energetic and structural point of view of incentive for efficiency measures. It is obvious that the planning of national financial plans should be also supported by economic analysis for evaluating what kind of intervention is most profitable.
In this perspective, the proposed methodology could be the starting point because it allows knowing the present and future performance that will certainly damage the structural safety in a building and the energy billing and environmental impact due to the energy consumptions. Really, the procedure of a large-scale analysis is aimed to establish a priority of a class respect to another class, without defining a specific intervention. Otherwise, several studies discuss the economic profitability of refurbishment actions. For instance, on the Italian residential existing buildings, starting from the typologies established by the TABULA research project, Ballarini et al. [60] have found that the measure with the lowest global cost, mainly for buildings in warm climates (less than 1400 HDD), is the replacement of the boiler. Instead, the thermal insulation of walls and slabs is the measure with the most interesting energy savings. This measure becomes cost-effective when it regards old buildings in climates with more than 1400 HDD. Similar approach and conclusions are also available for other counties as the multi-story residential building in Sweden [61].
Finally, by considering the available literature in the matter of economic profitability of refurbishment actions, the conclusions support the finding of the proposed paper that takes also into account the structural performance.

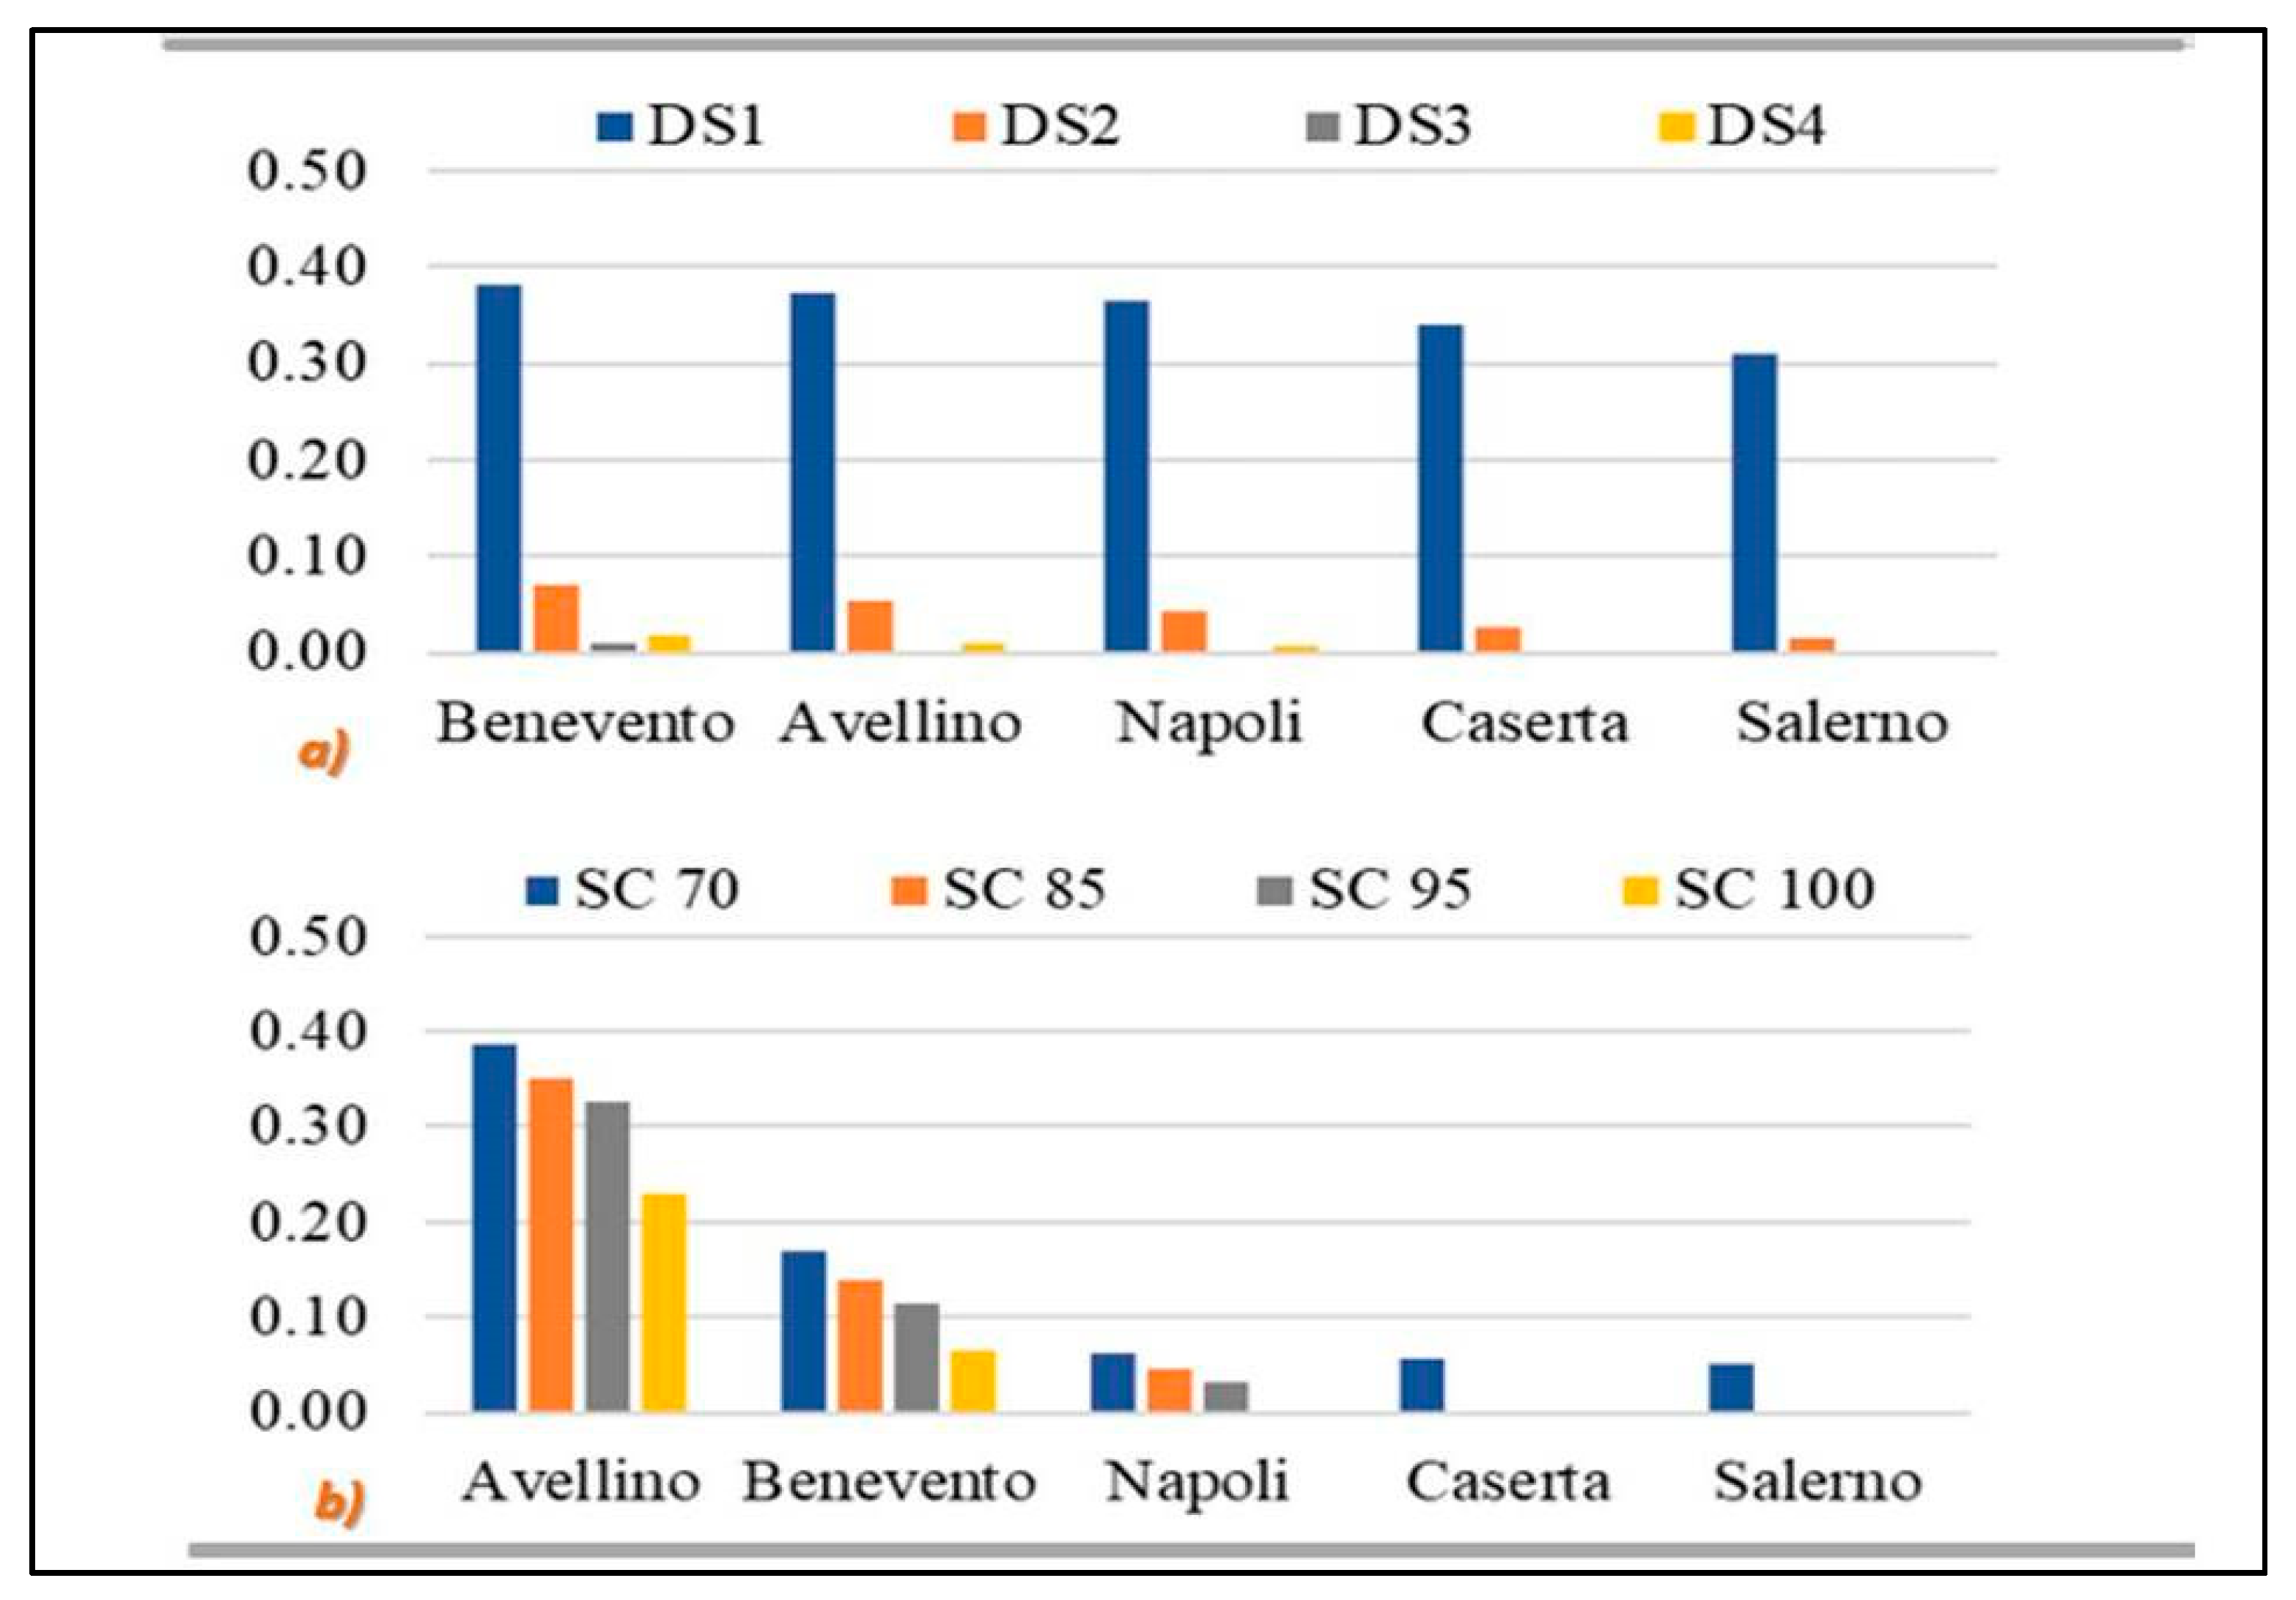
6.3. Example of Combined Application

This section presents the results of application of both structural and energetic fragility curves of the building stock by taking into consideration the five capitals of the provinces of Campania (Avellino, Benevento, Caserta, Napoli and Salerno). The structural and energetic fragility models were used to derive a damage and energy consumption scenario. The damage scenario was derived for RC framed structures designed for gravity loads or low seismic actions but without the geometric and seismic details recommended by the current codes, with the PGA demand corresponding to a return period TR = 475 years. The energy consumption scenario was derived assuming as demand parameters the heating degree days.
Figure 12 and Figure 13 show the results of the analysis for 2-storey and 4-storey buildings, respectively; the results are reported ordering the cities from the worst to the best performance for each one aspect.
First of all, it can be observed that in both cases the number of floors influences the probability of exceeding a threshold and more in general the increment of the number of floors reduce the structural performance and increase the energetic one when the municipality has been fixed. Moreover, Avellino and Benevento seem to be the most critical cities that could benefit from a combined structural and energetic intervention. Indeed considering the case of Avellino, according to Figure 12a, there is around 40% of probability of slight damage and around 40% (Figure 12b) of probability to exceed the consumption threshold of 70 kWh/(m2 y). Thus, an integrated refurbishment campaign could improve at the same time the structural and energetic performances, with higher advantages in terms of costs because the intervention on the structure surely requires removing and restoring a part of the envelope.
Similarly, for Benevento where there is also the higher probability of very heavy damage or destruction and in any case, the building stock exceeds all proposed energetic thresholds.
Figure 12b and Figure 13b indicate that Caserta and Salerno are characterized by an acceptable energy quality. On the other hand, they have high probability of slight damage in case of earthquakes. Therefore, city planners or politicians should prefer to allocate more funds for seismic strengthening interventions or, in order to access to any funds for energy improvement interventions, it should be needed to certify that also the seismic performance of the building has been improved.
This analysis allows underlining the connection between the structural and energetic behaviors of the RC building stock with a typical envelope. More in detail, this type of approach can help the decision-maker when it is needed to plan large-scale interventions to prevent losses after a disastrous event or just to start building stock improvement campaigns. Indeed, very often, the buildings’ owner and more in general the citizens perceive, more immediately, the importance of carrying out an energetic rather than a structural intervention. This probably depends on the probabilistic nature of the seismic event and the deterministic nature of the energy bill.
For this reason, in many states, such as in Italy, incentive campaigns for energy efficiency have been issued over the years, followed by numerous requests for intervention. Only in recent years, some financial support measures have been introduced for seismic interventions; however, these have found only limited application.
All told, it is considered useful for the presentation of a single indicator that can describe the energy and structural quality of a building. This indicator, through appropriate economic evaluations that support the performance analyses, could be useful both to sensitize final decision-makers on the need and convenience of combined interventions, and to set up financing mechanisms that, depending on the priorities of the area (seismic or climatic), favor a specific type of intervention.
In order to have a single index of the building stock, considering the structural and energetic performance, the total probability of failure (intended as the overcoming of the performance limit) is the sum of the two probability percentages multiplied by the weights named W1 and W2. These values represent the importance that each aspect assumes for the decision-makers. The equation is proposed in the following:
C o m b i n e d   P r o b a b i l i t y = W 1 · S t r u c t u r a l   p r o b a b i l i t y + W 2 · E n e r g e t i c   p r o b a b i l i t y
The same weight is assumed for the structural and energetic performances and the combined indices are the ones reported in Figure 14 and Figure 15 for a 2-storey and a 4-storey building, respectively.
The combined classification individuates Avellino as the worst case and Salerno as the best one. It is worth to note that, for the 4-storey building Avellino is the worst case for the energetic field but not for the structural field for which Benevento is characterized by a higher seismic fragility. Nevertheless, when a combined approach is adopted, Avellino results to be the case requiring priority in the intervention measures.
The adoption of the same weighting factors is an example of the possible procedure. It is well known that the definition of a weighing system is a key issue in decision problems and it affects the final results. For this reason, the authors are actually working to extend this research to investigate how the final results are related to the different decision-maker interests.

7. Conclusions

This study discusses the application of a synergic approach for investigating the structural and energy performances for the space heating, at a large scale (building stocks), extending the methodological approach of seismic fragility curves to the energetic field.
This methodology is novel in the context of safety and sustainable evaluation of retrofit interventions since it integrates energy analysis with the evaluation of structural performance over the whole country geographic and climatic conditions. The outcomes of the approach enable public institutions in addressing the selection of priority in the advanced refurbishment planning, in terms of both territorial control and economic opportunities. This might have important implications especially for retrofitting large strategic infrastructures, such as urban districts, as well as for the selection of national policies or incentives. Indeed, the paper indicates a complete and detailed approach that starts with the definition of the reference building stock characteristics and of the intensity measure in both fields of energy and structures. The information collected for the buildings are easily available (age of construction, number of floors, total building area, net heated area, window to wall ratio, shape factor, envelope characteristics) and allowed to identify seismic fragility curves from the literature and develop dynamic simulations in the energetic field to calculate the cumulative distribution of probability to exceed threshold levels of energy consumptions. The obtained probability curves in the structural and energetic field allow a quick sensitivity analysis of the integrated performance of the building stock. The combination of the two probabilities at the various conventional “damage state” can give an integrated index if a weight is assigned to structural and energetic aspects. A sensitivity analysis of the adopted weight values can give information about the implications of different decision-maker strategies starting from reliable energy and structural performance. This analysis combined with a proper economic optimization can guide the urban planners, the owners and the citizens in the evaluation of the most profitable interventions considering both the improvement of structural safety and the reduction of energy cost and environmental impacts.
Finally, it needs to be remarked that this paper has proposed the results of the first step of the methodology and it will be expanded to include other types of buildings both in terms of bearing structure and construction materials, destination use and also summer energy performance, introducing also a multicriteria approach considering the economic feature, for the combination of the results.

Author Contributions

Conceptualization, A.D.A.; data curation, R.F.D.M.; formal analysis, A.D.A. and R.F.D.M.; investigation, F.A. and G.P.V.; methodology, F.A. and M.R.P.; supervision, M.R.P. and G.P.V. All authors have read and agreed to the published version of the manuscript.

Funding

This research was funded by PRIN 2017, for the project titled SUSTAIN/ABLE—SimultaneoUs STructural And energetIc reNovAtion of BuiLdings through innovativE solutions.

Acknowledgments

The authors would like to thank the anonymous reviewers for their suggestions. They gave us the opportunity for improving our study.

Conflicts of Interest

The authors declare no conflict of interest. The funders had no role in the design of the study; in the collection, analyses, or interpretation of data; in the writing of the manuscript, or in the decision to publish the results.

References

  1. Hosseinzadeh, S.; Galal, K. Seismic Fragility Assessment and Resilience of Reinforced Masonry Flanged Wall Systems. J. Perform. Constr. Facil. 2020, 34, 04019109. [Google Scholar] [CrossRef]
  2. Iddon, C.; Mills, T.; Giridharan, R.; Lomas, K. The influence of hospital ward design on resilience to heat waves: An exploration using distributed lag models. Energy Build. 2015, 86, 573–588. [Google Scholar] [CrossRef] [Green Version]
  3. Quaglia, C.; Yu, N.; Thrall, A.P.; Paolucci, S. Balancing energy efficiency and structural performance through multi-objective shape optimization: Case study of a rapidly deployable origami-inspired shelter. Energy Build. 2014, 82, 733–745. [Google Scholar] [CrossRef]
  4. Longo, F.; Lassandro, P.; Moshiri, A.; Phatak, T.; Aiello, M.A.; Krakowiak, K.J. Lightweight geopolymer-based mortars for the structural and energy retrofit of buildings. Energy Build. 2020, 225, 110–352. [Google Scholar] [CrossRef]
  5. Pohoryles, D.; Maduta, C.; Bournas, D.; Kouris, L. Energy performance of existing residential buildings in Europe: A novel approach combining energy with seismic retrofitting. Energy Build. 2020, 223, 110024. [Google Scholar] [CrossRef]
  6. Manfredi, V.; Masi, A. Seismic Strengthening and Energy Efficiency: Towards an Integrated Approach for the Rehabilitation of Existing RC Buildings. Buildings 2018, 8, 36. [Google Scholar] [CrossRef] [Green Version]
  7. Hamzeh, L.; Ashour, A.; Galal, K. Development of Fragility Curves for Reinforced-Masonry Structural Walls with Boundary Elements. J. Perform. Constr. Facil. 2018, 32, 04018034. [Google Scholar] [CrossRef]
  8. Rota, M.; Penna, A.; Strobbia, C. Processing Italian damage data to derive typological fragility curves. Soil Dyn. Earthq. Eng. 2008, 28, 933–947. [Google Scholar] [CrossRef]
  9. Golparvar-Fard, M.; Ham, Y. Automated Diagnostics and Visualization of Potential Energy Performance Problems in Existing Buildings Using Energy Performance Augmented Reality Models. J. Comput. Civ. Eng. 2014, 28, 17–29. [Google Scholar] [CrossRef]
  10. Masi, A.; Vona, M.; Digrisolo, A. Costruzione di Curve di Fragilità di Alcune Tipologie Strutturali Rappresentative di Edifici Esistenti in c.a. Mediante Analisi Dinamiche non Lineari; ANIDIS—XIII Convegno ANIDIS: Bologna, Italy, 2009. (In Italian) [Google Scholar]
  11. Borzi, B.; Pinho, R.; Crowley, H. Simplified pushover-based vulnerability analysis for large-scale assessment of RC buildings. Eng. Struct. 2008, 30, 804–820. [Google Scholar] [CrossRef]
  12. Lagomarsino, S.; Cattari, S. Seismic Vulnerability of Existing Buildings. In Seismic Vulnerability of Structures; Wiley: Hoboken, NJ, USA, 2013; pp. 1–62. [Google Scholar]
  13. Shirazi, R.S.; Pekcan, G.; Itani, A. Analytical Fragility Curves for a Class of Horizontally Curved Box-Girder Bridges. J. Earthq. Eng. 2017, 22, 881–901. [Google Scholar] [CrossRef]
  14. Perdomo, C.; Monteiro, R.; Sucuoğlu, H. Development of Fragility Curves for Single-Column RC Italian Bridges Using Nonlinear Static Analysis. J. Earthq. Eng. 2020, 1–25. [Google Scholar] [CrossRef]
  15. Rossetto, T.; Ioannou, I.; Grant, D.N. Existing Empirical Fragility and Vulnerability Relationships: Compendium and Guide for Selection; GEM technical report 2013-X; GEM Foundation: Pavia, Italy, 2013; p. 62. [Google Scholar]
  16. Zuccaro, G.; Cacace, F. Seismic vulnerability assessment based on typological characteristics. The first level procedure “SAVE”. Soil Dyn. Earthq. Eng. 2015, 69, 262–269. [Google Scholar] [CrossRef]
  17. Lagomarsino, S.; Giovinazzi, S. Macroseismic and mechanical models for the vulnerability and damage assessment of current buildings. Bull. Earthq. Eng. 2006, 4, 415–443. [Google Scholar] [CrossRef]
  18. Braga, F.; Dolce, M.; Liberatore, D. A statistical study on damaged buildings and an ensuing review of the MSK-76 scale. In Proceedings of the 7th European Conference on Earthquake Engineering, Athens, Greece, 20 September 1982; pp. 431–450. [Google Scholar]
  19. Sabetta, F.; Goretti, A.; Lucantoni, A. Empirical fragility curves from damage surveys and estimated strong ground motion. In Proceedings of the11th European Conference on Earthquake Engineering, Paris, France, 6–11 September 1998. [Google Scholar]
  20. Karababa, F.S.; Pomonis, A. Damage data analysis and vulnerability estimation following the August 14, 2003 Lefkada Island, Greece, Earthquake. Bull. Earthq. Eng. 2010, 9, 1015–1046. [Google Scholar] [CrossRef]
  21. Liel, A.B.; Lynch, K.P. Vulnerability of Reinforced-Concrete-Frame Buildings and Their Occupants in the 2009 L’Aquila, Italy, Earthquake. Nat. Hazards Rev. 2012, 13, 11–23. [Google Scholar] [CrossRef]
  22. Del Gaudio, C.; De Martino, G.; Di Ludovico, M.; Manfredi, G.; Prota, A.; Ricci, P.; Verderame, G.M. Empirical fragility curves from damage data on RC buildings after the 2009 L’Aquila earthquake. Bull. Earthq. Eng. 2016, 15, 1425–1450. [Google Scholar] [CrossRef]
  23. Paez-Ramirez, J.; Lizarazo-Marriaga, J.; Medina, S.; Estrada, M.; Mas, E.; Koshimura, S. A comparative study of empirical and analytical fragility functions for the assessment of tsunami building damage in Tumaco, Colombia. Coast. Eng. J. 2020, 62, 362–372. [Google Scholar] [CrossRef]
  24. Kappos, A.J.; Panagopoulos, G.; Panagiotopoulos, C.; Penelis, G. A hybrid method for the vulnerability assessment of R/C and URM buildings. Bull. Earthq. Eng. 2006, 4, 391–413. [Google Scholar] [CrossRef]
  25. Kappos, A.J. An overview of the development of the hybrid method for seismic vulnerability assessment of buildings. Struct. Infrastruct. Eng. 2016, 12, 1573–1584. [Google Scholar] [CrossRef]
  26. Nägeli, C.; Jakob, M.; Catenazzi, G.; Ostermeyer, Y. Towards agent-based building stock modeling: Bottom-up modeling of long-term stock dynamics affecting the energy and climate impact of building stocks. Energy Build. 2020, 211, 109–763. [Google Scholar] [CrossRef]
  27. Österbring, M.; Mata, E.; Thuvander, L.; Mangold, M.; Johnsson, F.; Wallbaum, H. A differentiated description of building-stocks for a georeferenced urban bottom-up building-stock model. Energy Build. 2016, 120, 78–84. [Google Scholar] [CrossRef] [Green Version]
  28. Oberegger, U.F.; Pernetti, R.; Lollini, R.; Ulrich, F.O.; Roberta, P.; Roberto, L. Bottom-up building stock retrofit based on levelized cost of saved energy. Energy Build. 2020, 210, 109–757. [Google Scholar] [CrossRef]
  29. Dall’O’, G.; Galante, A.; Torri, M. A methodology for the energy performance classification of residential building stock on an urban scale. Energy Build. 2012, 48, 211–219. [Google Scholar] [CrossRef]
  30. Ali, U.; Shamsi, M.H.; Hoare, C.; Mangina, E.; O’Donnell, J. A data-driven approach for multi-scale building archetypes development. Energy Build. 2019, 202, 109–364. [Google Scholar] [CrossRef]
  31. Westermann, P.; Evins, R. Surrogate modelling for sustainable building design—A review. Energy Build. 2019, 198, 170–186. [Google Scholar] [CrossRef]
  32. ISO. Building Components and Building Elements—Thermal Resistance and Thermal Transmittance—Calculation Method; International Organization of Standardization: Geneva, Switzerland, 2008. [Google Scholar]
  33. ISO. Thermal Performance of Building Components—Dynamic Thermal Characteristics—Calculation Methods; International Organization of Standardization: Geneva, Switzerland, 2007. [Google Scholar]
  34. Rajapaksha, U. Environmental Heat Stress on Indoor Environments in Shallow, Deep and Covered Atrium Plan Form Office Buildings in Tropics. Climate 2020, 8, 36. [Google Scholar] [CrossRef] [Green Version]
  35. Dolce, M.; Zuccaro, G.; Kappos, A.; Coburn, A.W. Report of the EAEE working group 3: Vulnerability and risk analysis. In Proceedings of the 10th European Conference on Earthquake Engineering, Vienna, Austria, 28 August–2 September 1994; Volume 4, pp. 3049–3077. [Google Scholar]
  36. Rossetto, T. Vulnerability Curves for the Seismic Assessment of Reinforced Concrete Structure Populations. Ph.D. Thesis, Imperial College, London, UK, 2004. [Google Scholar]
  37. Singhal, A.; Kiremidjian, A.S. Method for Probabilistic Evaluation of Seismic Structural Damage. J. Struct. Eng. 1996, 122, 1459–1467. [Google Scholar] [CrossRef]
  38. Spence, R.J.S.; Coburn, A.W.; Pomonis, A. Correlation of ground motion with building damage: The definition of a new damage-based seismic intensity scale. In Proceedings of the 10th World Conference on Earthquake Engineering, Madrid, Spain, 19–24 July 1992. [Google Scholar]
  39. Webb, A.L. Energy retrofits in historic and traditional buildings: A review of problems and methods. Renew. Sustain. Energy Rev. 2017, 77, 748–759. [Google Scholar] [CrossRef]
  40. Rouleau, J.; Gosselin, L.; Blanchet, P. Understanding energy consumption in high-performance social housing buildings: A case study from Canada. Energy 2018, 145, 677–690. [Google Scholar] [CrossRef]
  41. Ascione, F.; Bianco, N.; De Masi, R.F.; Mastellone, M.; Mauro, G.M.; Vanoli, G.P. The role of the occupant behavior in affecting the feasibility of energy refurbishment of residential buildings: Typical effective retrofits compromised by typical wrong habits. Energy Build. 2020, 223, 110–217. [Google Scholar] [CrossRef]
  42. BPIE. Europe’s Buildings under the Microscope. Available online: http://bpie.eu/wp-content/uploads/2015/10/HR_EU_B_under_microscope_study.pdf (accessed on 10 October 2020).
  43. Eurostat Database—Eurostat. Available online: https://ec.europa.eu/eurostat/data/database (accessed on 10 October 2020).
  44. Composition of the Load-Bearing Structure of Residential Buildings in Italy between 2018 and 2019, by Material. Available online: https://www.statista.com/statistics/1090304/material-composition-residential-buildings-italy/ (accessed on 10 October 2020).
  45. Rossetto, T.; Elnashai, A. Derivation of vulnerability functions for European-type RC structures based on observational data. Eng. Struct. 2003, 25, 1241–1263. [Google Scholar] [CrossRef]
  46. Eurostat Housing Statistics, Data Extracted in May 2020. Available online: https://ec.europa.eu/eurostat/statistics-explained/index.php/Housing_statistics#Type_of_dwelling (accessed on 10 October 2020).
  47. ENTRANZE. The Challenges, Dynamics and Activities in the Building Sector and Its Energy Demand in Italy. Available online: https://www.entranze.eu/files/downloads/D2_1/D2_1_Short_country_summary_report_-final-Italy.pdf (accessed on 10 October 2020).
  48. Di Pasquale, G.; Orsini, G.; Romeo, R.W. New Developments in Seismic Risk Assessment in Italy. Bull. Earthq. Eng. 2005, 3, 101–128. [Google Scholar] [CrossRef]
  49. Corrado, V.; Ballarini, I.; Paolo Cognati, S.P. Building Typology Brochure-Italy, Fascicolo Sulla Tipologia Edilizia Italiana. 2014. Available online: https://episcope.eu/fileadmin/tabula/public/docs/brochure/IT_TABULA_TypologyBrochure_POLITO.pdf (accessed on 10 October 2020).
  50. UNI—Italian Unification Body UNI/TS 11300-1: Energy Performance of Buildings—Part 1: Evaluation of Energy Need for Space Heating and Cooling. 2014. (In Italian). Available online: http://store.uni.com/catalogo/catalogsearch/advanced/ (accessed on 10 October 2020).
  51. Italian Government. Decreto Requisiti Minimi; Ministerial Decree of 26 June 2015; Italian Government: Rome, Italy, 2015.
  52. Working Group. Redazione Della Mappa di Pericolosità Sismica Prevista dall’Ordinanza PCM 3274 del 20 Marzo 2003; Dipartimento della Protezione Civile: Milano-Roma, Italy, 2004; 65p. (In Italian)
  53. Italian D.P.R. 26 Agosto 1993, n. 412: Regolamento Recante Norme per la Progettazione, l’installazione, l’esercizio e la Manutenzione Degli Impianti Termici Degli Edifici ai Fini del Contenimento dei Consumi di Energia, in Attuazione dell’art. 4, Comma 4, Della Legge 9 Gennaio 1991, n. 10 (In Italian). Available online: https://www.gazzettaufficiale.it/eli/id/1993/10/14/093G0451/sg (accessed on 10 October 2020).
  54. UNI—Italian Unification Body. UNI 10349-3: Heating and Cooling of Buildings—Climatic Data—Part 3: Accumulated Temperature Differences (Degree-Days) and Other Indices (in Italian). 2016. Available online: http://store.uni.com/catalogo/catalogsearch/advanced/ (accessed on 10 October 2020).
  55. DesignBuilder v.6.1. Available online: http://www.designbuilder.co.uk/ (accessed on 20 October 2020).
  56. EnergyPlus. Available online: https://energyplus.net/ (accessed on 10 October 2020).
  57. UNI—Italian Unification Body. UNI 10339: Air-Conditioning Systems for Thermal Comfort in Buildings. General, Classification and Requirements. Offer, Order and Supply Specifications (In Italian). 1995. Available online: http://store.uni.com/catalogo/catalogsearch/advanced/ (accessed on 10 October 2020).
  58. UNI—Italian Unification Body. UNI EN 15251: Indoor Environmental Input Parameters for Design and Assessment of Energy Performance of Buildings Addressing Indoor Air Quality, Thermal Environment, Lighting and Acoustics (In Italian). 2008. Available online: http://store.uni.com/catalogo/catalogsearch/advanced/ (accessed on 10 October 2020).
  59. Grunthal, G. European Macroseismic Scale 1998 (EMS 1998); Cahiers du Centre Europeen de Geodynamique et de Sismologie: Luxembourg, 1998; p. 15. [Google Scholar]
  60. Ballarini, I.; Corrado, V.; Madonna, F.; Paduos, S.; Ravasio, F. Energy refurbishment of the Italian residential building stock: Energy and cost analysis through the application of the building typology. Energy Policy 2017, 105, 148–160. [Google Scholar] [CrossRef]
  61. Bonakdar, F.; Kalagasidis, A.S.; Mahapatra, K. The Implications of Climate Zones on the Cost-Optimal Level and Cost-Effectiveness of Building Envelope Energy Renovation and Space Heat Demand Reduction. Buildings 2017, 7, 39. [Google Scholar] [CrossRef]
Figure 1. Scheme of the methodological approach.
Buildings 10 00194 g001
Figure 2. Reference building: (a) floor distribution; (b) geometrical data.
Buildings 10 00194 g002
Figure 3. Reference wall in case of Campania region.
Buildings 10 00194 g003
Figure 4. Italy: (a) Seismic hazard map; (b) climatic zone map.
Buildings 10 00194 g004
Figure 5. Model rendering and typical building comparison.
Buildings 10 00194 g005
Figure 6. Primary energy for heating demand—all available weather files.
Buildings 10 00194 g006
Figure 7. Primary energy for heating demand—selected weather files.
Buildings 10 00194 g007
Figure 8. Structural fragility curves for building with 1–3-storeys: (a) seismic design; (b) no seismic design; (c) no seismic design 4-storey.
Buildings 10 00194 g008
Figure 9. Energetic fragility curves—6-storey building.
Buildings 10 00194 g009
Figure 10. Energetic fragility curves—4-storey building.
Buildings 10 00194 g010
Figure 11. Energetic fragility curves—2-storey building.
Buildings 10 00194 g011
Figure 12. 2-storey building Campania region: (a) damage scenario; (b) energy quality.
Buildings 10 00194 g012
Figure 13. 4-storey building Campania region: (a) damage scenario; (b) energy quality.
Buildings 10 00194 g013
Figure 14. 2-storey building Campania region: combined structural and energetic index.
Buildings 10 00194 g014
Figure 15. 4-storey building Campania region: combined structural and energetic index.
Buildings 10 00194 g015
Table 1. Main data concerning the simulated building—thermal zones.
ApplianceLighting
Kitchen30 W/m23.5 W/m2
Dining room3.1 W/m23.5 W/m2
Bathroom2.0 W/m23.5 W/m2
Bedroom3.6 W/m23.5 W/m2
Table 2. Operational period for the heating and cooling system.
WinterSummer
Climatic ZoneMonths (All Days)HoursMonths (All Days)Hours
A1/12–15/0305:0008:0015/05–01/1011:0015:00
20:0023:00 17:0021:00
B01/12–31/0305:0008:0015/05–01/1011:0015:00
18:0023:00 17:0021:00
C15/11–31/0305:0008:0015/05–15/0912:0015:00
14:0016:0018:0021:00
18:0023:00
D01/11–15/0405:0009:0015/05–15/0912:0015:00
14:0016:00 18:0021:00
17:0023:00
E01/11–15/0404:0009:0015/05–15/0912:0015:00
15:0000:00 18:0021:00
F01/10–01/0500:0024:0015/06–30/0812:0015:00
Publisher’s Note: MDPI stays neutral with regard to jurisdictional claims in published maps and institutional affiliations.

