1. Introduction
Structural cracks are a phenomenon occurring in all types of buildings, regardless of the technology and material used. Ensuring structural durability and safety requires engineers to analyze the causes of cracks, as well as to plan and carry out appropriate repairs. Repairs and remedial measures are effective if engineers correctly identify the true causes of cracks. The most common causes are uneven and excessive foundation settlements. However, to verify the presumed causes, careful observation of the location, shape, size, depth, behavior, and other features of the cracks should be carried out. In addition, as much information as possible about the conditions in which the building was operated should be collected [
1]. One of the techniques for automatically collecting data on the operating conditions of the facility is a wireless monitoring network.
Systems for wireless monitoring of the structural safety of buildings are becoming increasingly popular due to the rapid development of the concept of the Internet of Things (IoT). A particularly useful application of IoT is measuring systems used in sensor networks located in distributed research locations [
2,
3,
4,
5]. Technological progress in the miniaturization of sensors and controllers greatly facilitates the design and implementation of such networks, enabling the construction of very efficient and, above all, cheap systems for monitoring physical parameters of buildings [
6,
7,
8,
9]. The concept of the Internet of Things is most often used in mechatronic systems (see [
10]), e.g., for intelligent energy control in intelligent buildings [
11] and smart cities [
12]. The IoT facilitates remote real-time monitoring of processes at end-of-life vehicle recycling centers [
13]. It is used in the field of public safety [
14], including human disaster detection system [
15], early warning systems to prevent accidents, and advanced safety management in underground structures [
16,
17] and early earthquake warning systems [
18]. Increasingly, production management systems for prefabricated structural components use solutions offered by the IoT [
19,
20]. The Internet of Things is used to monitor very complex structures with the huge consequences of possible failures, as in the case of dams and mines [
21].
The widespread occurrence of wireless networks encourages their use in specialized applications. Wireless measuring networks can be built in various technologies, usually using the 2.4–2.5 GHz Industrial, Scientific and Medical (ISM) band (like: WiFi, Bluetooth including Bluetooth Low Energy—see [
22], nRF24). Carrier frequencies in the GSM 1.88–1.9 GHz band are also used for data transmission, but the most interesting from the point of view of designing inexpensive, small and local measurement networks are solutions based on lower carrier frequencies: 865–956 MHz (Z-wave) or even 433 MHz (remote control devices). Among the low-frequency radio communication solutions, the Long Range (LoRa) concept deserves special attention. LoRa is a low-power wide area network technology that can use three carrier frequencies: 433, 868 and 915 MHz. It is based on spread spectrum modulation techniques derived from chirp spread spectrum (CSS) technology [
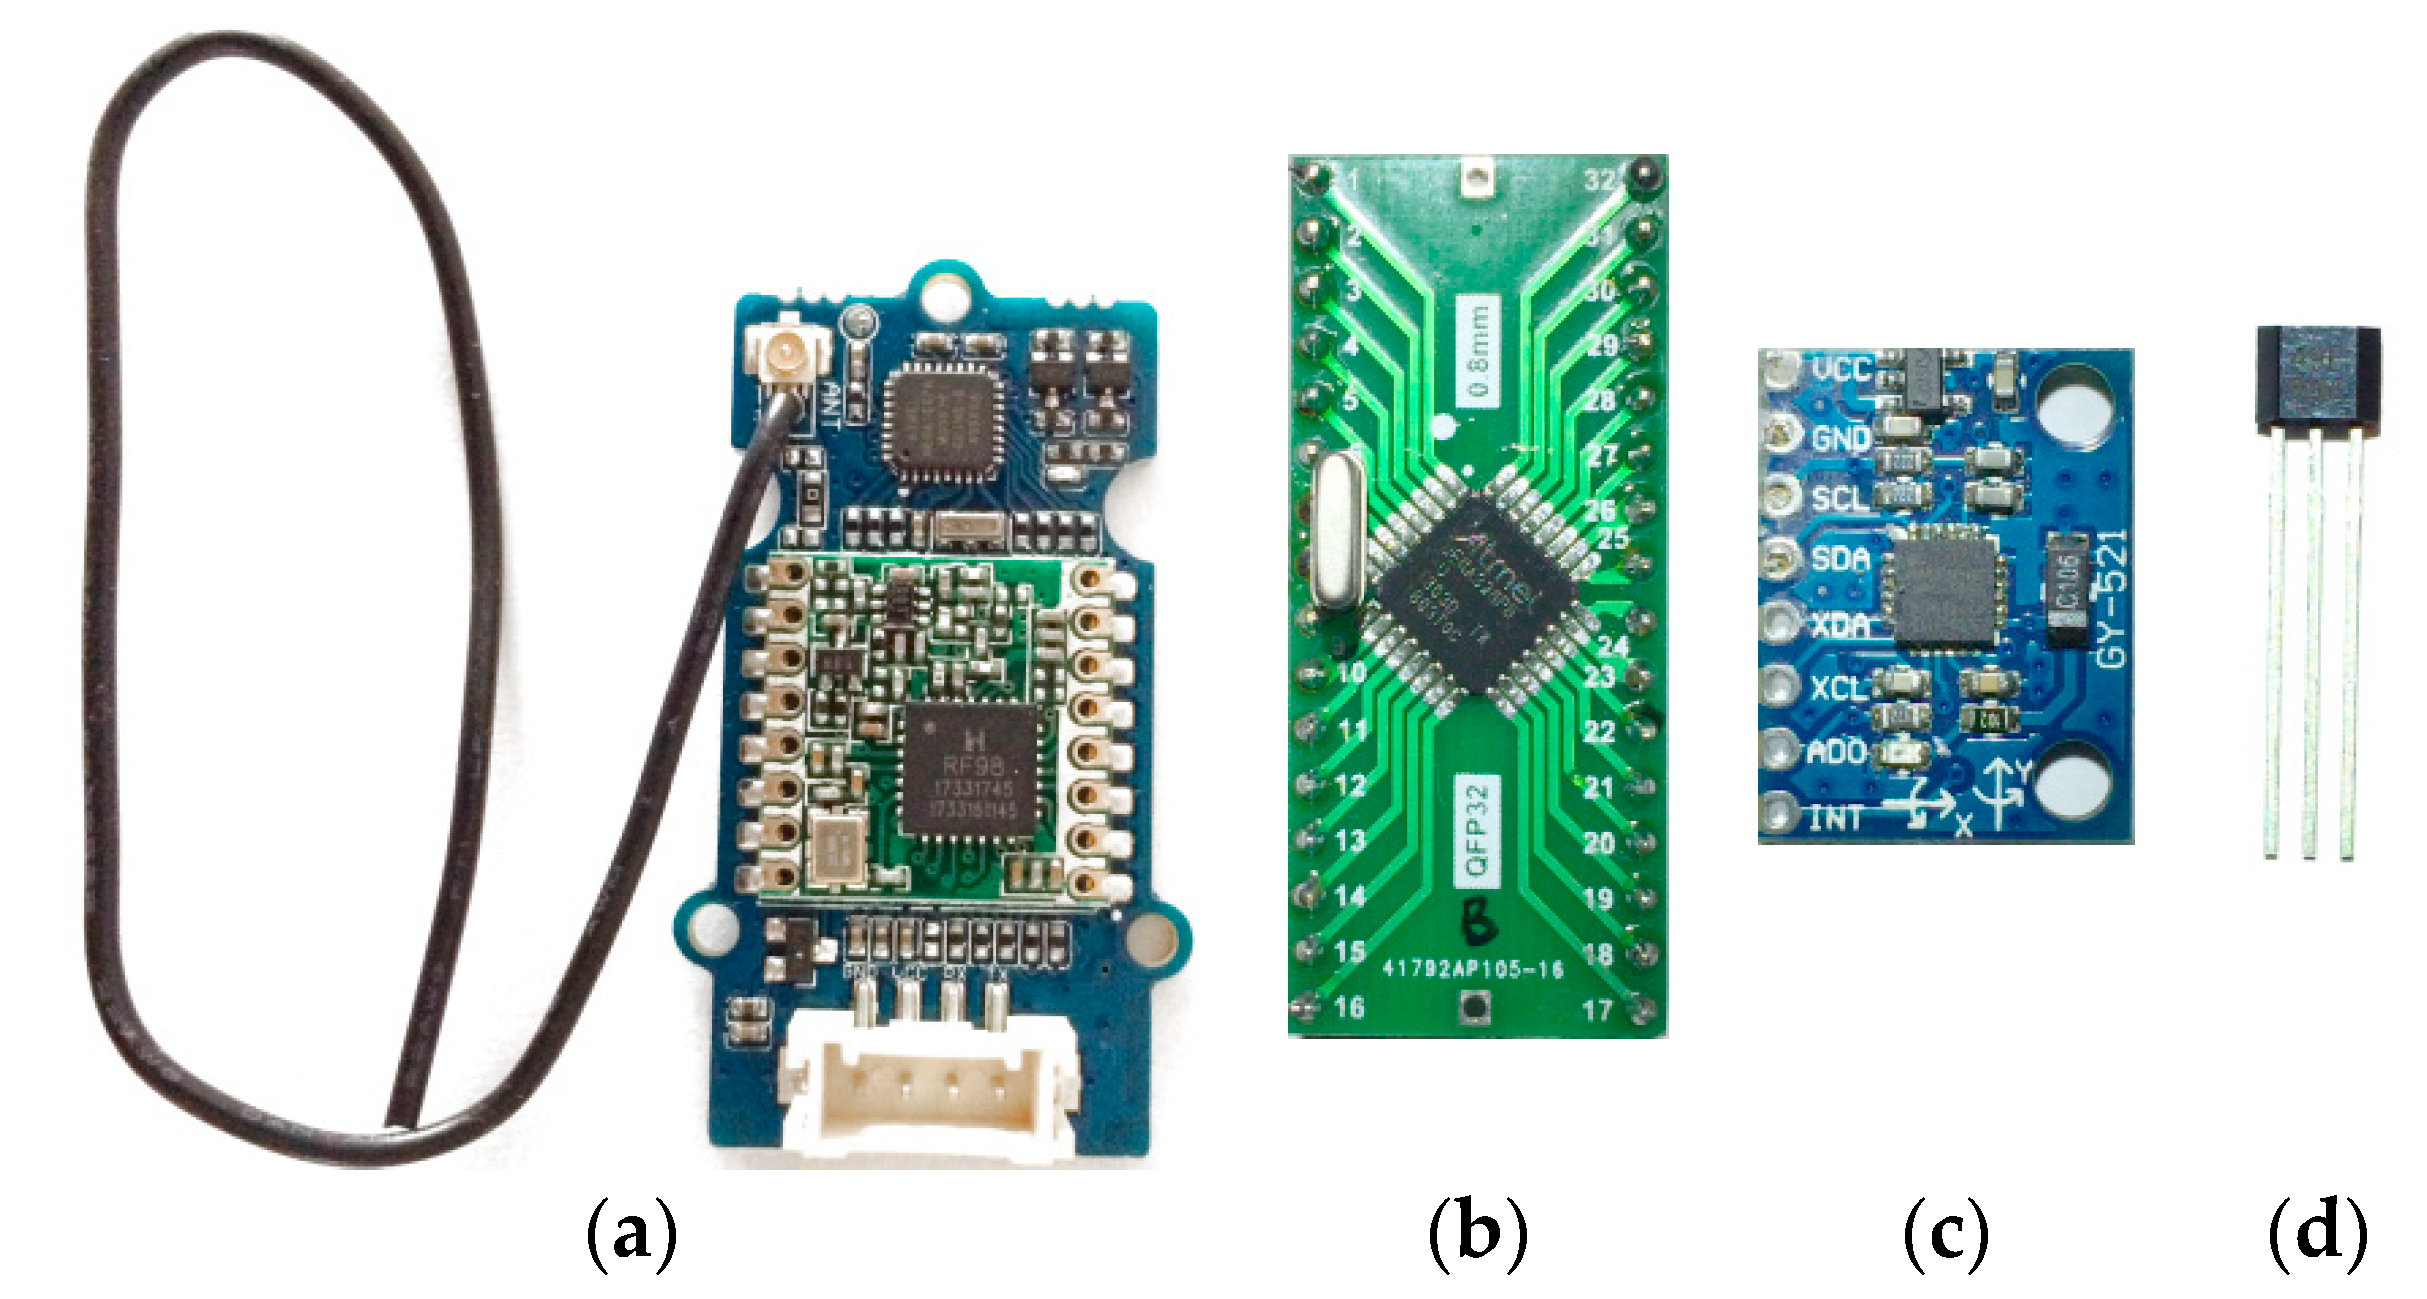
23], which enables transmission over a distance of more than 10 km (in rural areas). It is available as cheap modules with Semtech Sx1276/1277/1278 or HopeRF RF96/97/98 integrated circuits that act as transceivers that provide high interference immunity. An important advantage of these solutions is the low power consumption enabling battery operation. The concept of wireless monitoring network presented in this article is based on the Grove-LoRa RF98 433 MHz module (
Figure 1a).
Selection of parameters for monitoring of building structural safety was influenced by currently conducted research in the Institute of Geodesy and Civil Engineering, at the University in Olsztyn (Poland). In connection with the cyclical inventory of construction damages carried out at the Faculty of Geoengineering by the Social Labor Inspectorate, it was decided to build a wireless system for monitoring the width of cracks and the impact of dynamic loads on building structures. The prototype system was installed in the building located at 4 Heweliusz Street in Olsztyn, Poland.
This paper is organized as follows.
Section 2 describes the concept of a wireless sensor network. The sub-sections present the hardware and software functionality of the developed system.
Section 3 gives examples of the results recorded by the system and also discusses them in some selected aspects. Finally,
Section 4 presents our conclusions based on the contributions.
2. Wireless Sensor Network Concept
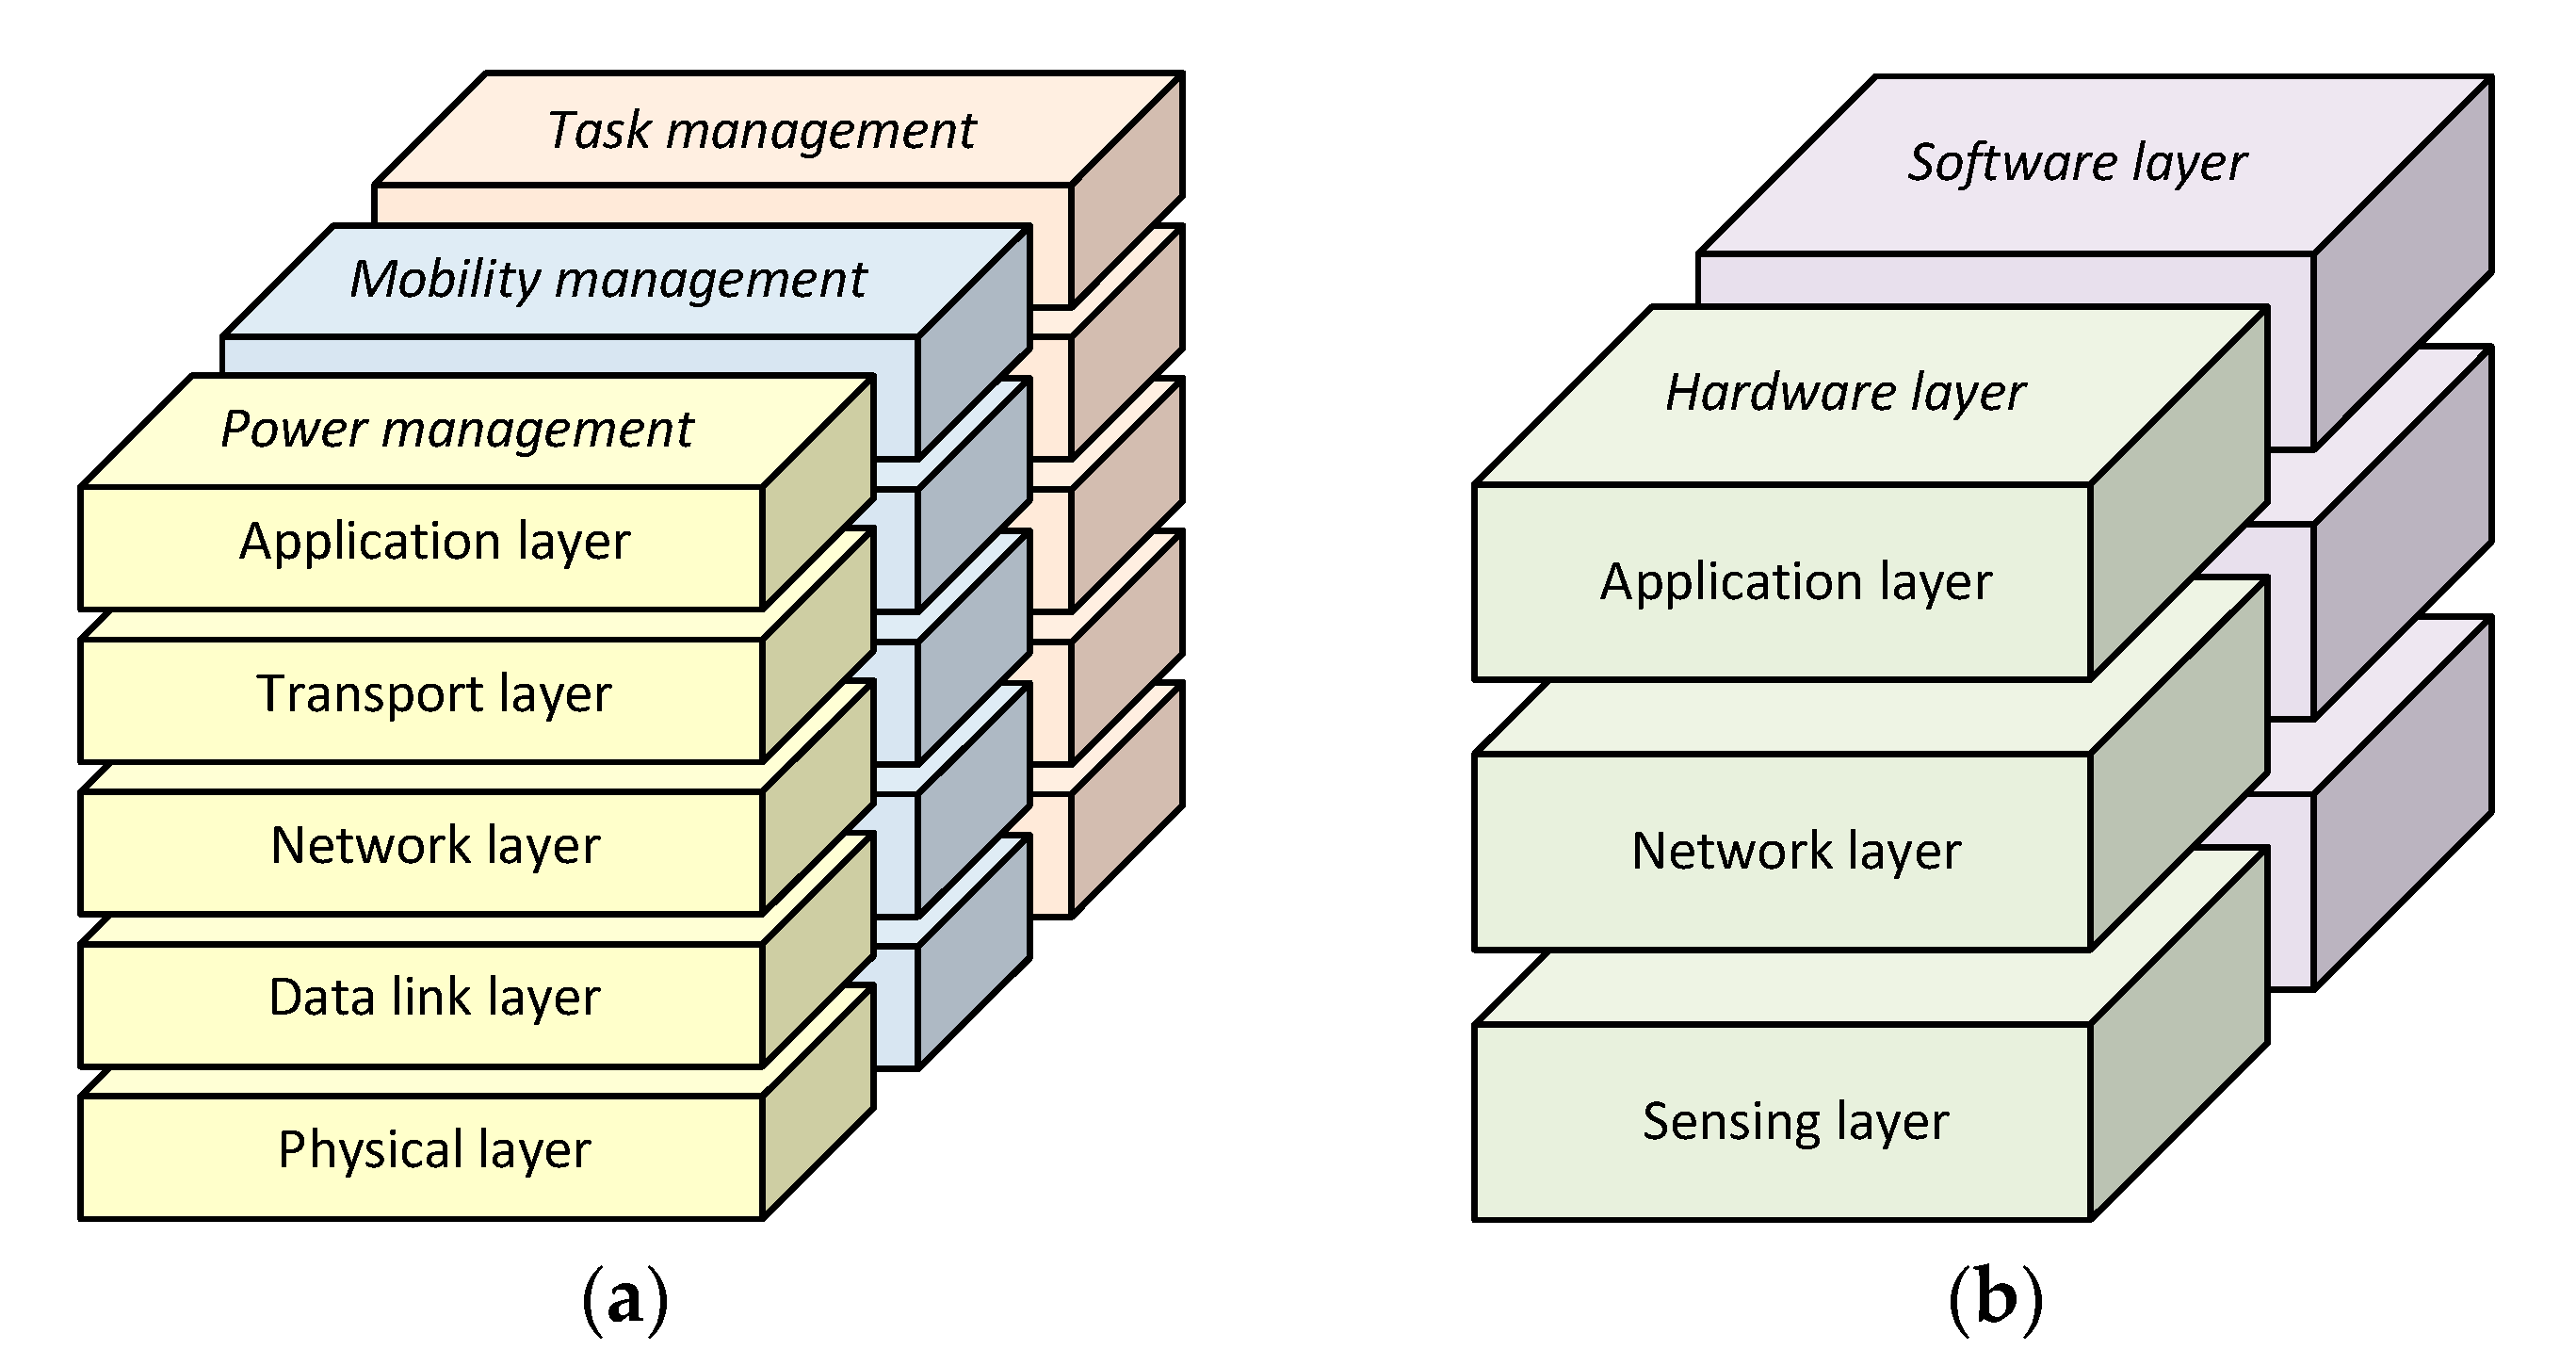
In general, the sensor network consists of five layers: application layer, transport layer, network layer, data link layer, and physical layer. In addition, three more transverse layer planes are considered for network management to increase overall efficiency [
24] (
Figure 1a).
However, networks may have different architectures mainly due to expected functionality. For example, in distributed sensor networks, measurement units (nodes) can be clustered just like cells in a cellular network. Each cluster is assigned to a local head unit that coordinates the units in the cluster and collects data from them during monitoring [
25]. Regardless of the type of architecture used, each network must consist of a hardware and software layer, according to the adopted operating assumptions. The design assumptions of the network were as follows:
data transmission: LoRa wireless,
registration of dynamic actions: acceleration sensor (
Figure 2c),
registration of changes in crack width: linear Hall-effect sensor (
Figure 2d),
reading frequency: one reading per minute,
internal memory capacity (in case of lost connection): data saved from 24 h of observation,
power supply: 3.6 V 18650 lithium-ion cell.
According to the adopted assumptions, the architecture of the designed network has the functional orientation presented in
Figure 1b (see [
14]).
2.1. Hardware Layer—Functional Orientation
2.1.1. Application Layer
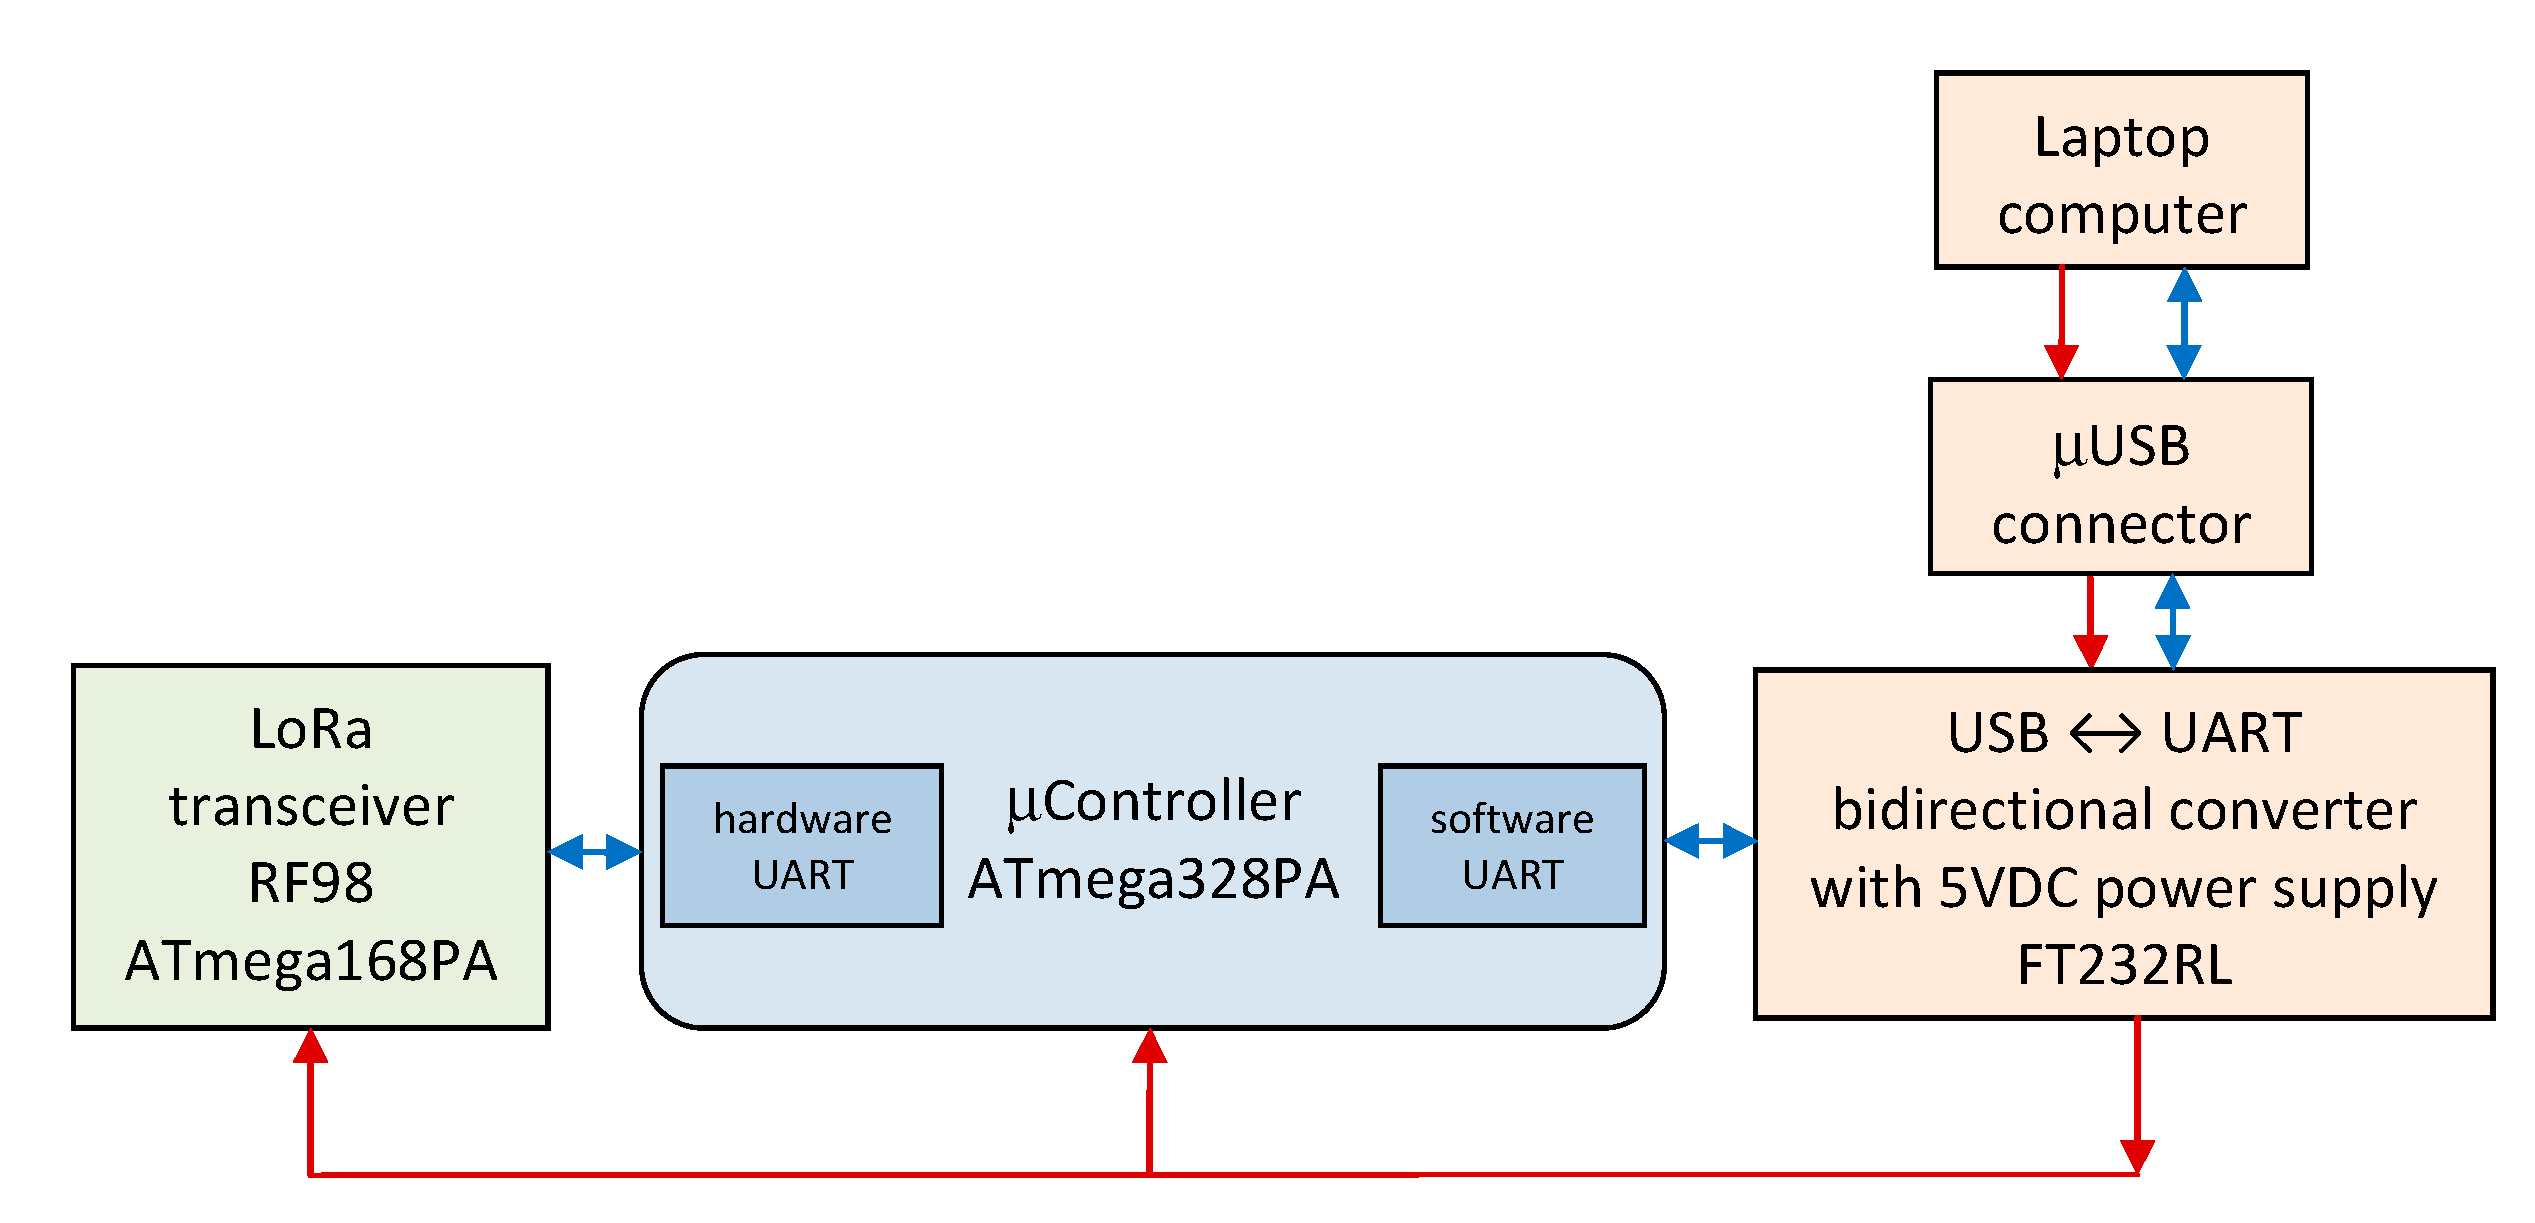
In the project, the service platform was built on the basis of a microcontroller connected to a laptop through a Universal Asynchronous Receiver-Transmitter interface (UART) operating at a bit rate of 9600 (
Figure 3). Connectivity with the network is also ensured by UART working with the same bit rate.
Due to low computing power requirements and a strictly defined range of processed numbers (mainly integers, without floating point numbers), the implementation of the service platform was based on the Atmel 8-bit Advanced RISC Architecture AVR chip—ATmega328PA microcontroller, clocked at 16 MHz (
Figure 2b). In these types of designs, high clock frequency is usually not necessary if the microcontrollers do not perform high-intensity activities. Ensuring a significant reduction in energy consumption with simultaneous failure-free operation requires clocking reduced to about 1 MHz and a supply voltage not greater than 3 V.
2.1.2. Network Layer
The network layer is based on the Grove-LoRa RF98 433MHz module (
Figure 2a), which is a very powerful platform developed by Seeed Studio to simplify IoT projects. It provides the transmission of various types of information obtained from sensing layer through the application layer to all request centers. It has high reliability and high security. The Hope-RF RF98 transceivers provide wide-range, spread-band communication and high noise immunity, while minimizing power consumption. The module is equipped with a local microcontroller (Atmel AVR ATmega168PA), which contains RF98 management software. The module is controlled via the UART interface. The RF98 transceiver can achieve a sensitivity of −148 dBm and the output power reaches 100 mW (20 dBm), which, with a half-wave dipole antenna, ensures seamless connectivity in buildings with a dense and complex arrangement of rooms.
2.1.3. Sensing Layer
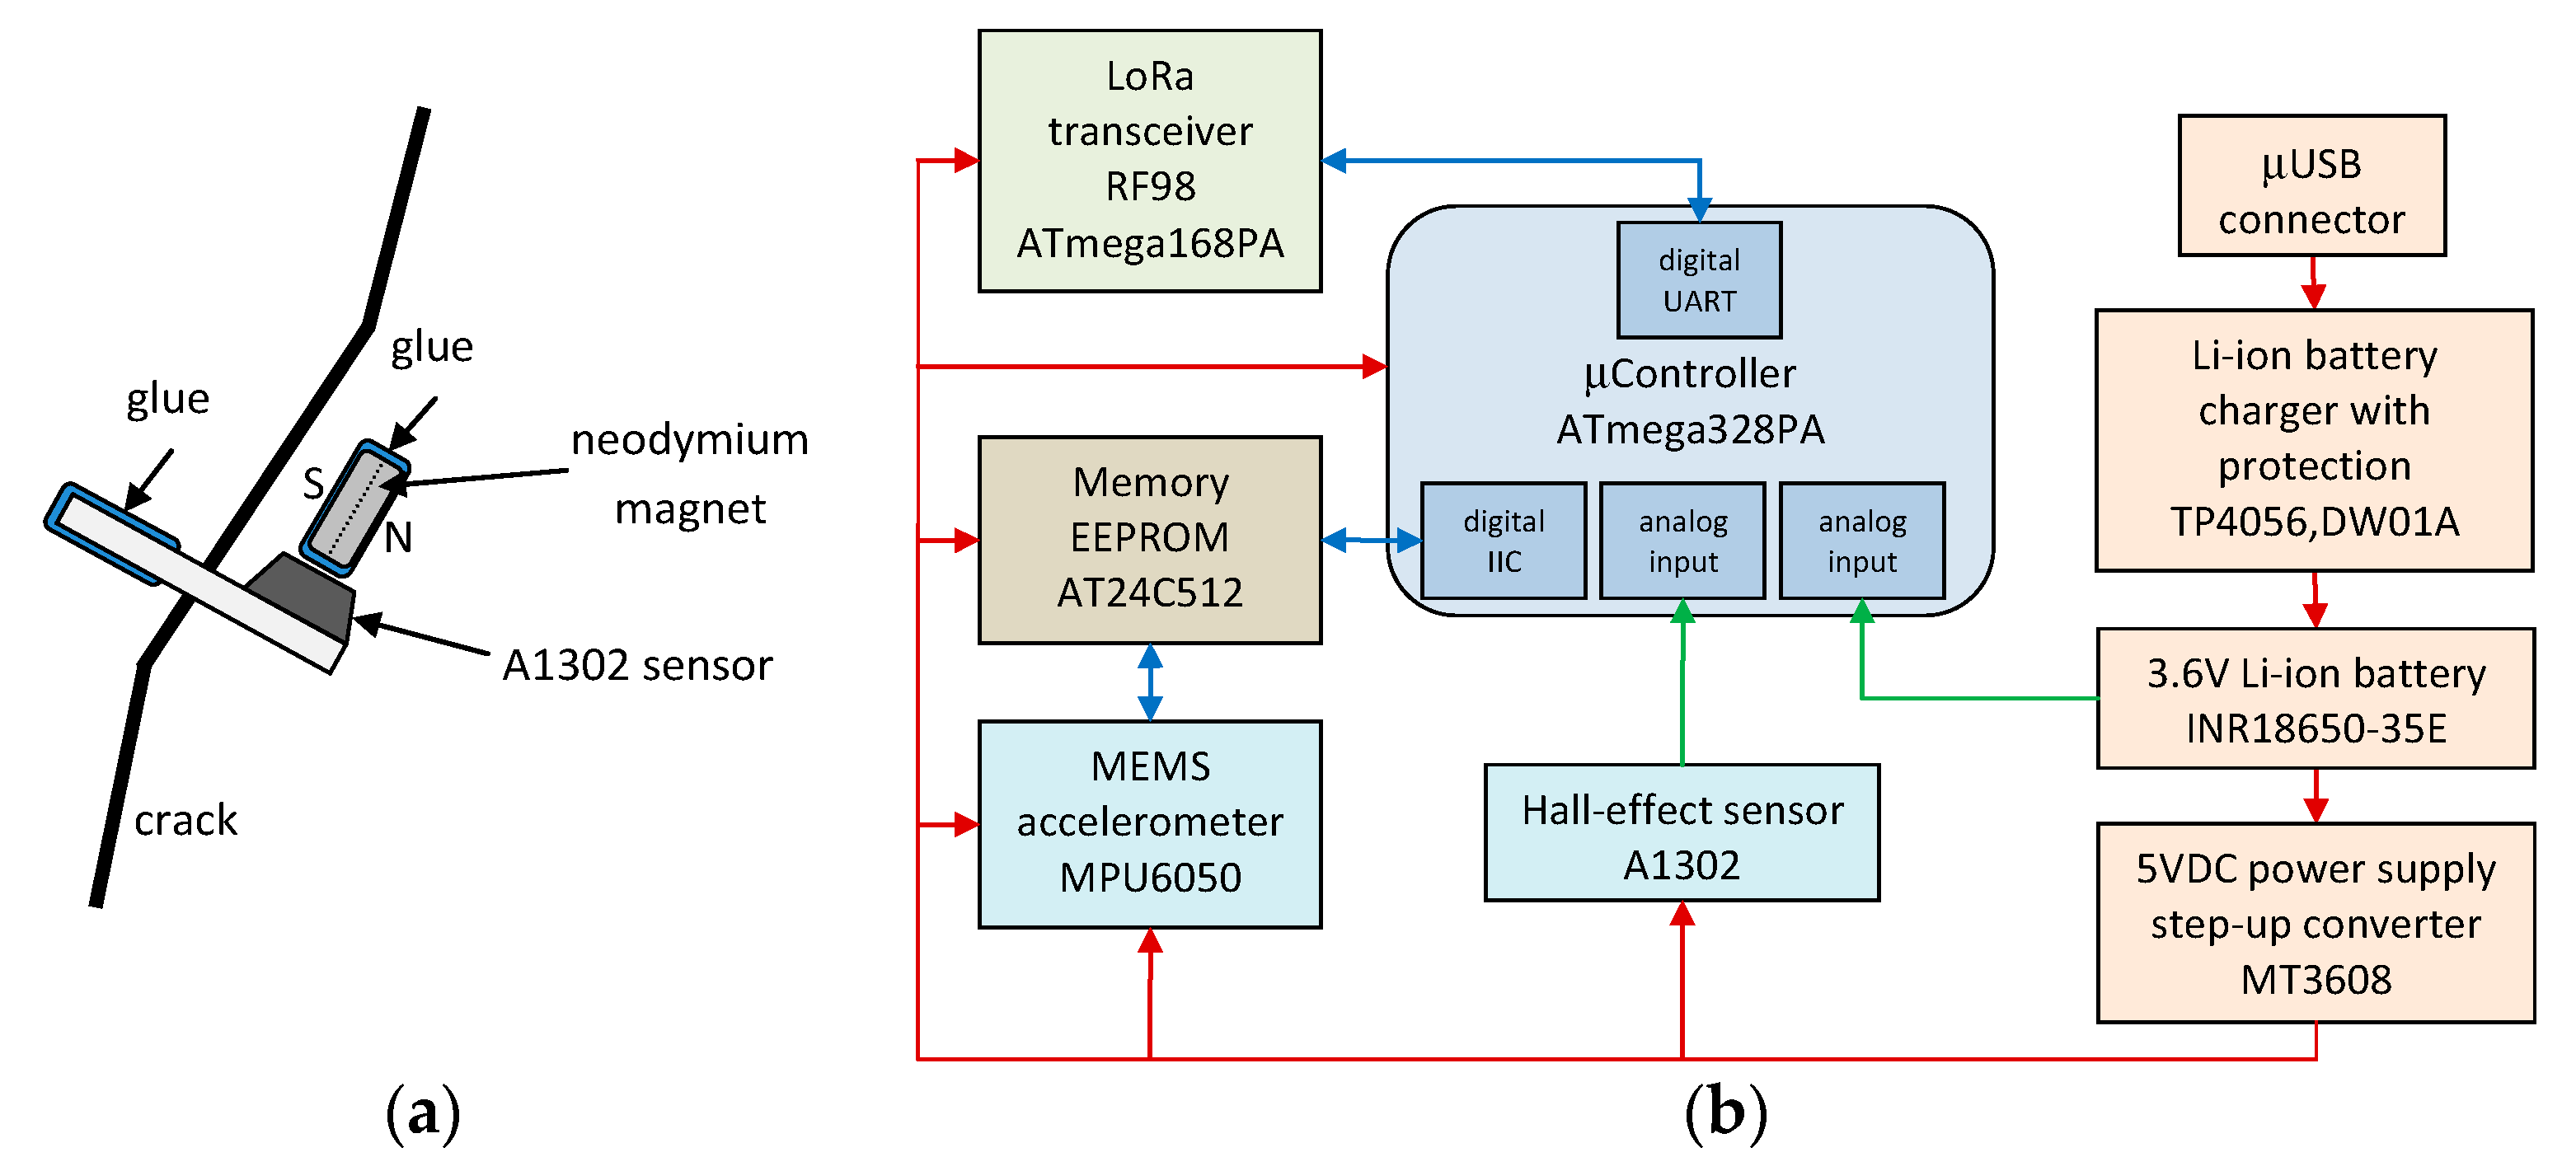
The sensing layer consists of a set of Micro-Electro-Mechanical System (MEMS) Invensense MPU6050 accelerometers and Hall-effect Allegro Microsystems A1302 linear sensors (
Figure 4b). The MPU-6050 combines a three-axis gyroscope and a three-axis accelerometer (only the accelerometer was used in the project). The measurement data are 16-bit numbers available via the Inter-Integrated Circuit (IIC, I
2C) interface. The acceleration recording range is programmable and has been set to ±2 g (the most sensitive range). The A1302 is a continuous-time, ratiometric, linear Hall-effect sensor. It is optimized to accurately provide a voltage output that is proportional to an applied magnetic field. The output sensitivity is 1.3 mV/Gauss. The sensor works with a miniature neodymium magnet in the configuration shown in
Figure 4a.
In total, five modules were designed and manufactured (four nodes and one request center). The node schematic diagram is shown in
Figure 4b (the request center module has a simplified form: it consists only of a microcontroller, LoRa module and a USB-UART converter based on FTDI FT232RL chip).
2.2. Software Layer—Functional Orientation
2.2.1. Application Layer
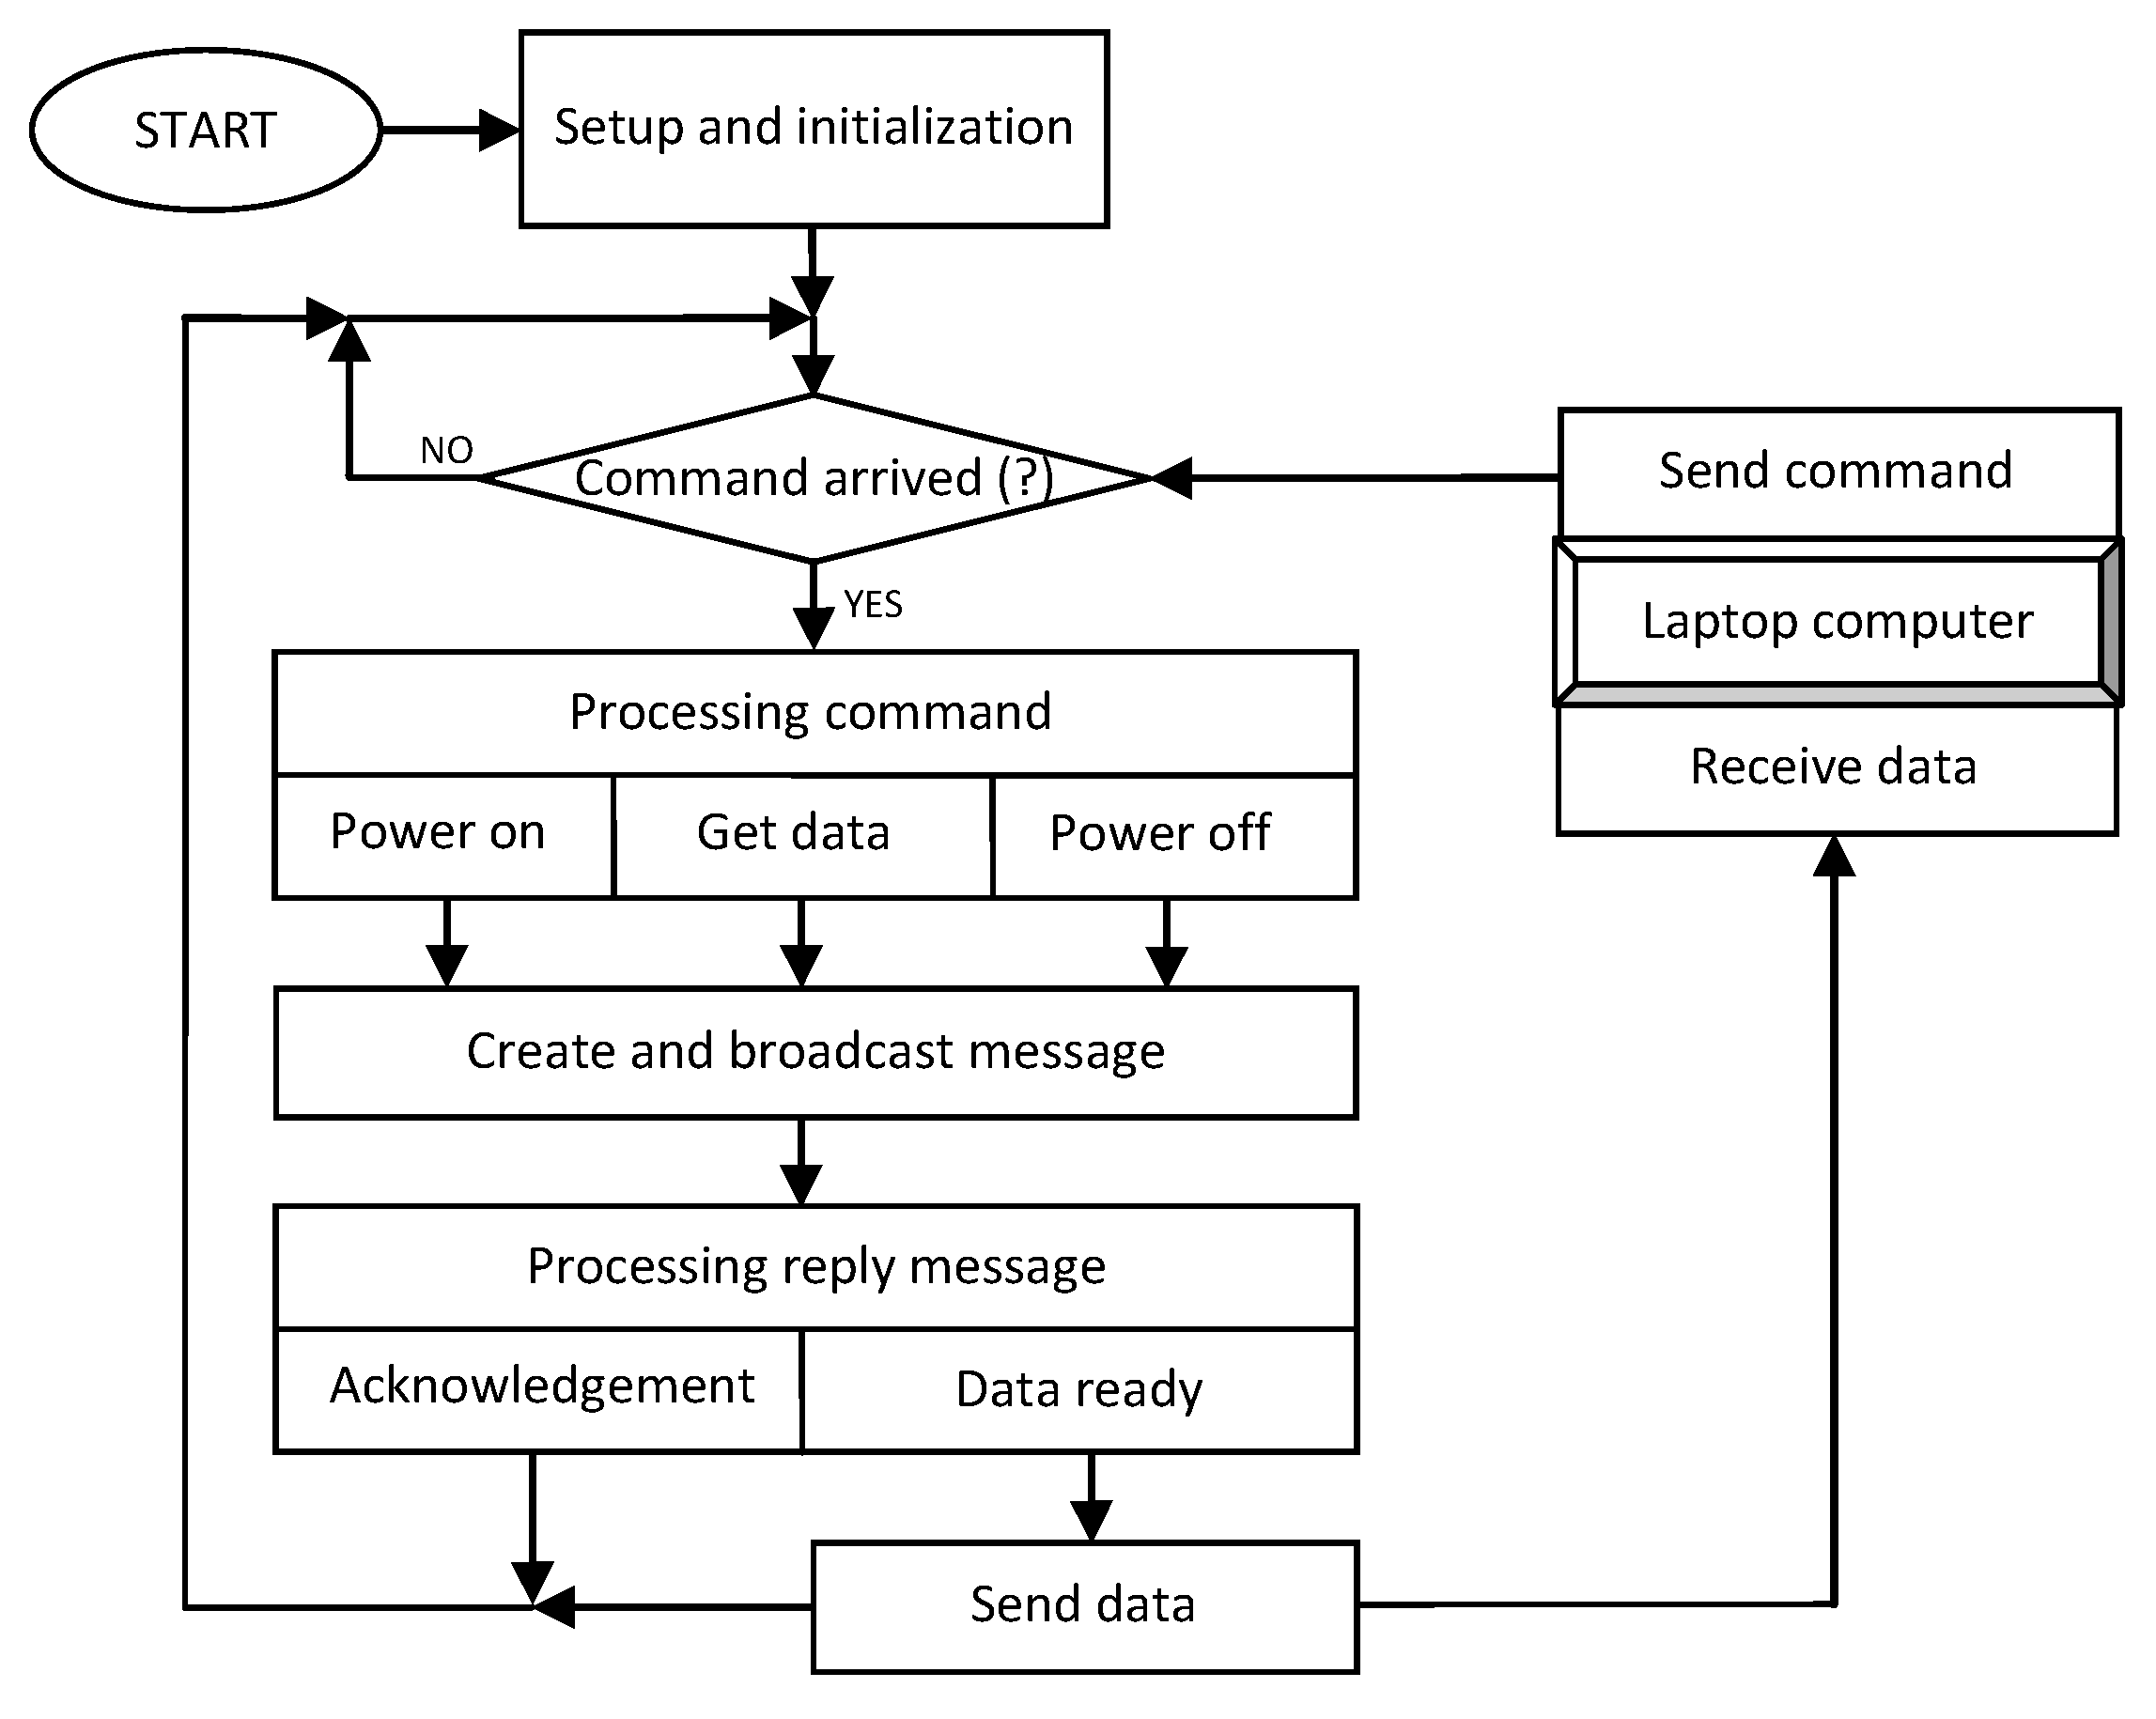
The software service platform is a set of two programs that handle all events related to external requests and commands as well as internal, programmed tasks. The software (created in C/C++) was installed on a hardware service platform (AVR microcontroller + laptop computer). The view of the task manager window is shown in
Figure 5. The algorithm of the program running in the AVR microcontroller is shown in
Figure 6.
The system user starts monitoring nodes and receives data at set intervals (selectable in the range of 1 min–1 h). Incoming data is saved on the laptop disk as a text file.
2.2.2. Network Layer
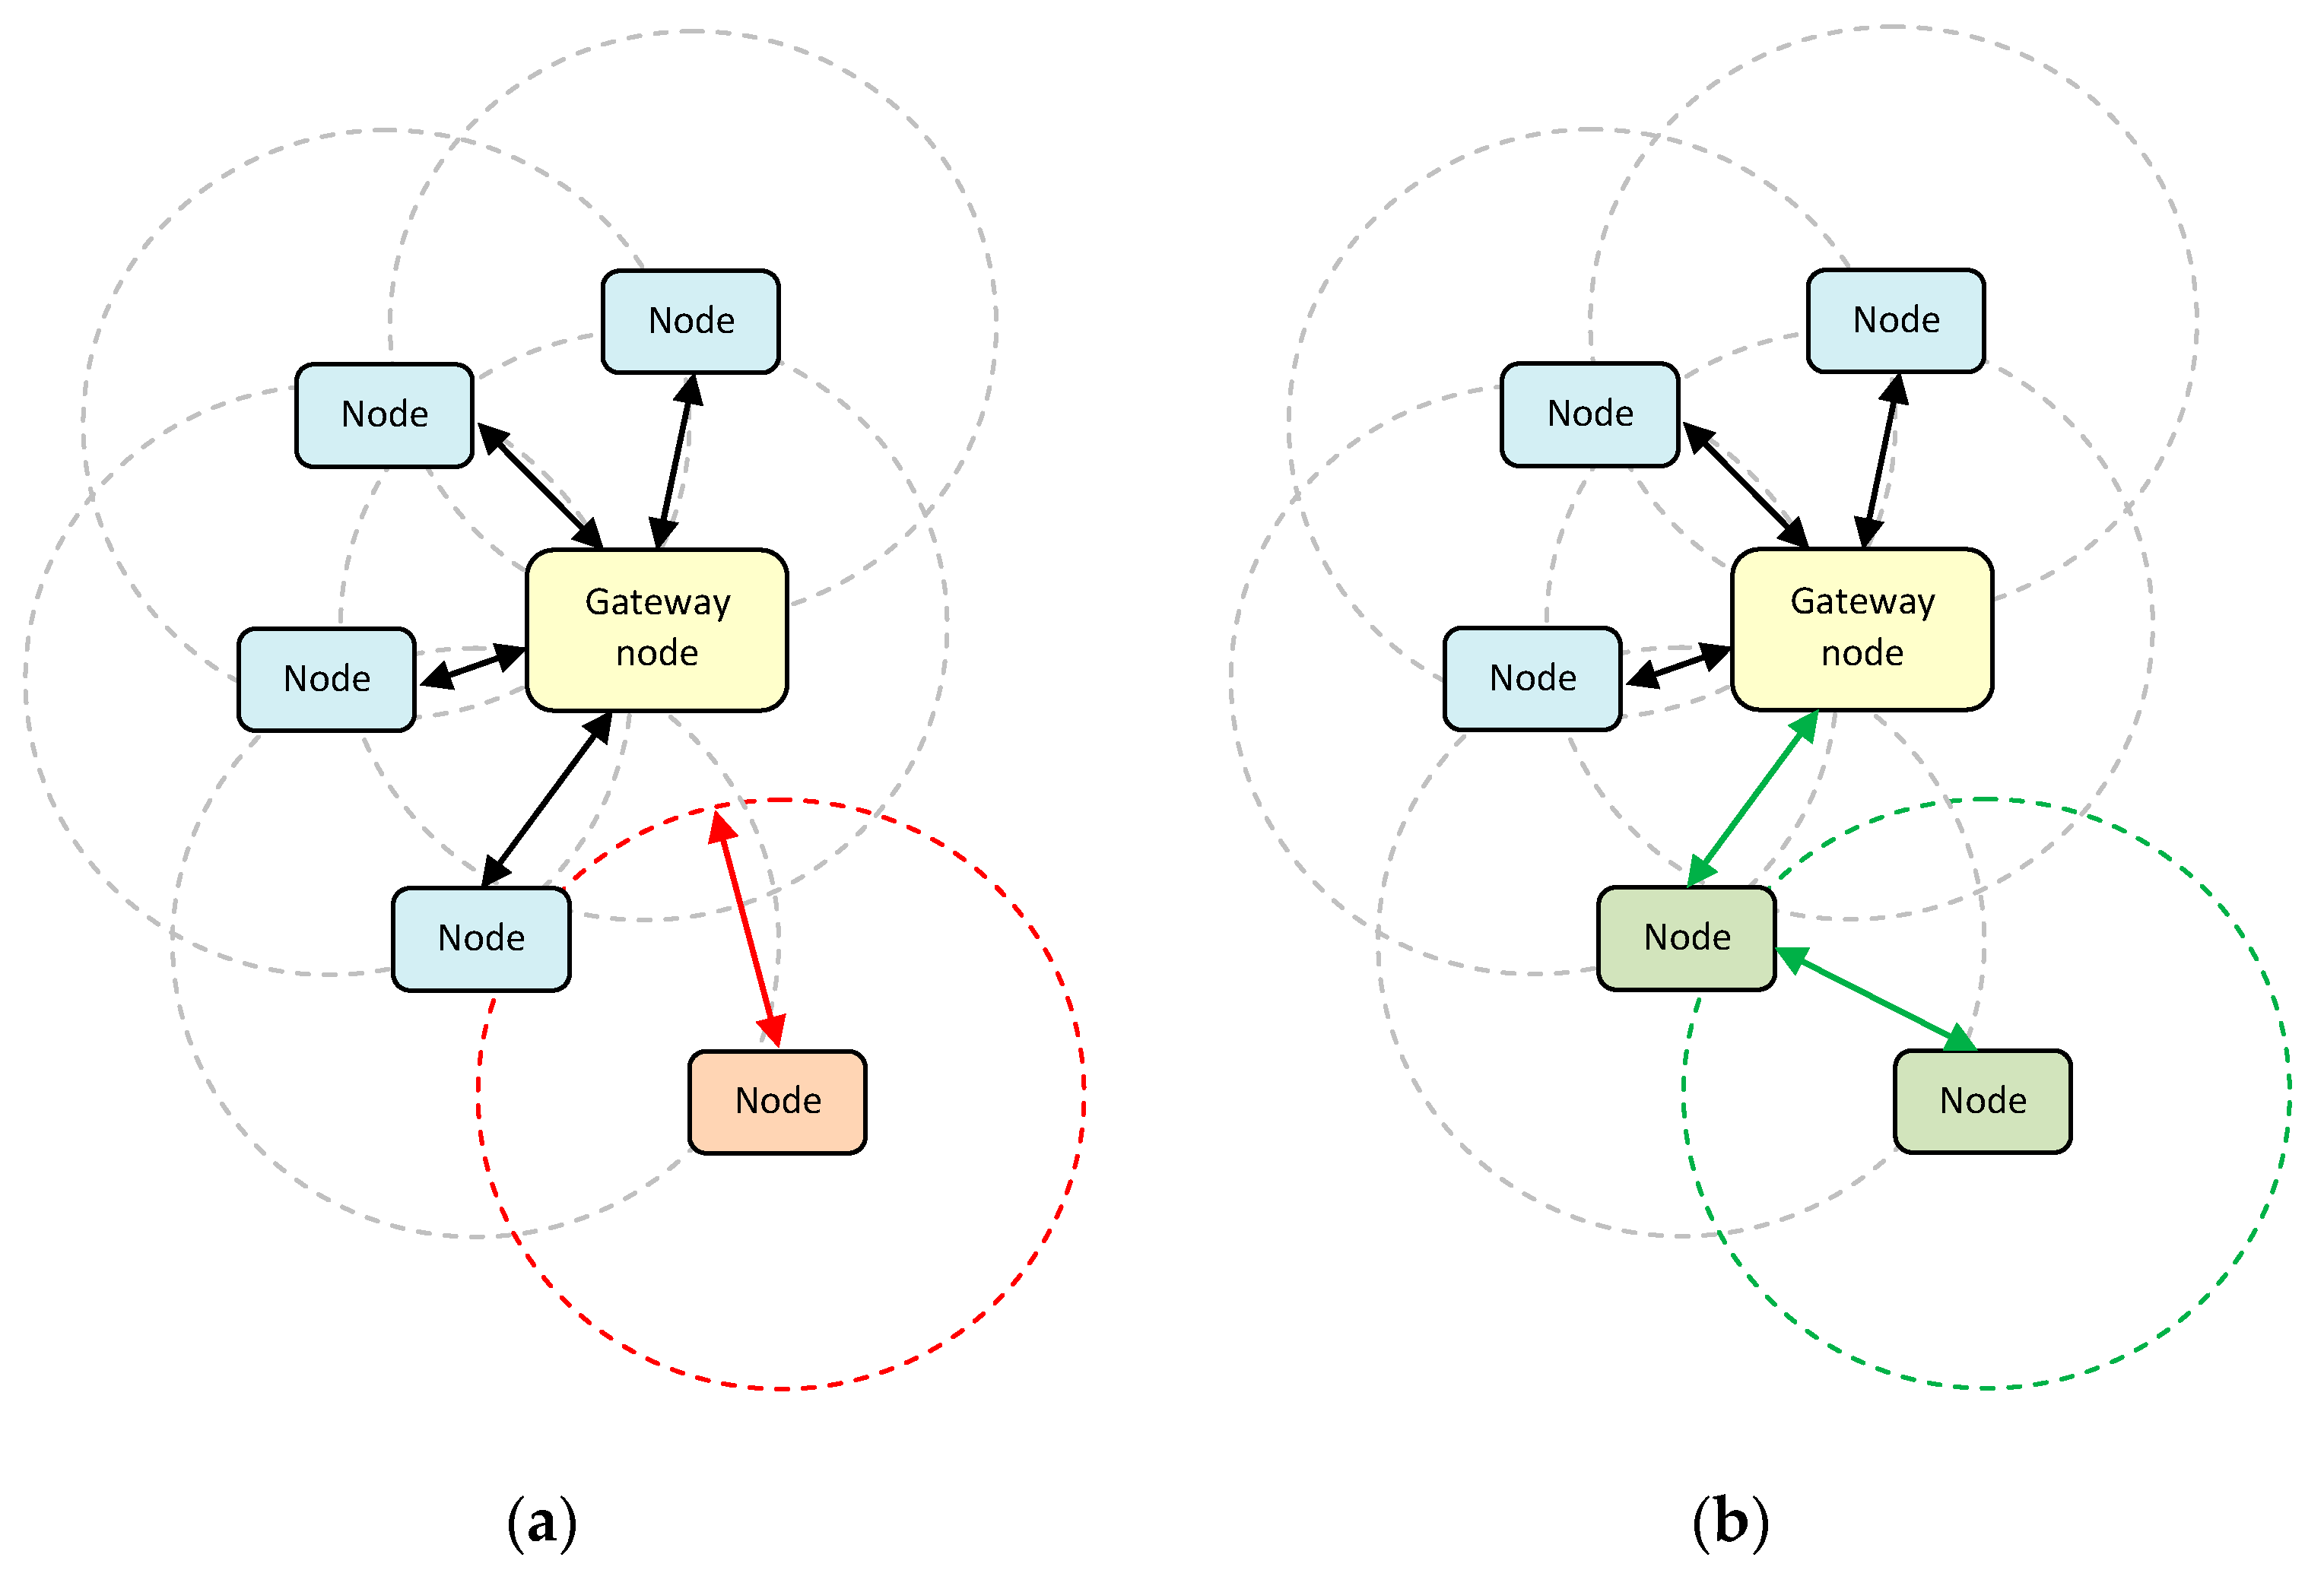
The type and complexity of the measurement network topology depends primarily on the creativity of the designer. Measurement nodes can be programmed in two basic ways: for direct or indirect communication. In the direct type of communication, nodes can communicate with each other only if they are within range (
Figure 7a). This type of configuration is most often used in networks with topologies based on a central node supervising the operation of the entire network. The indirect type of communication enables the formation of a mesh network in which nodes can communicate with each other either directly (if within range) or indirectly via intermediate nodes (
Figure 7b). Due to the small size of the monitored space (building), the first communication topology was used.
2.2.3. Sensing Layer
The software sensing layer is a program that handles a set of physical signal converters as well as external requests. The software (created in C/C++) was installed on a hardware sensing platform (AVR microcontroller + sensors). The algorithm of the program running in the AVR microcontroller is shown in
Figure 8.
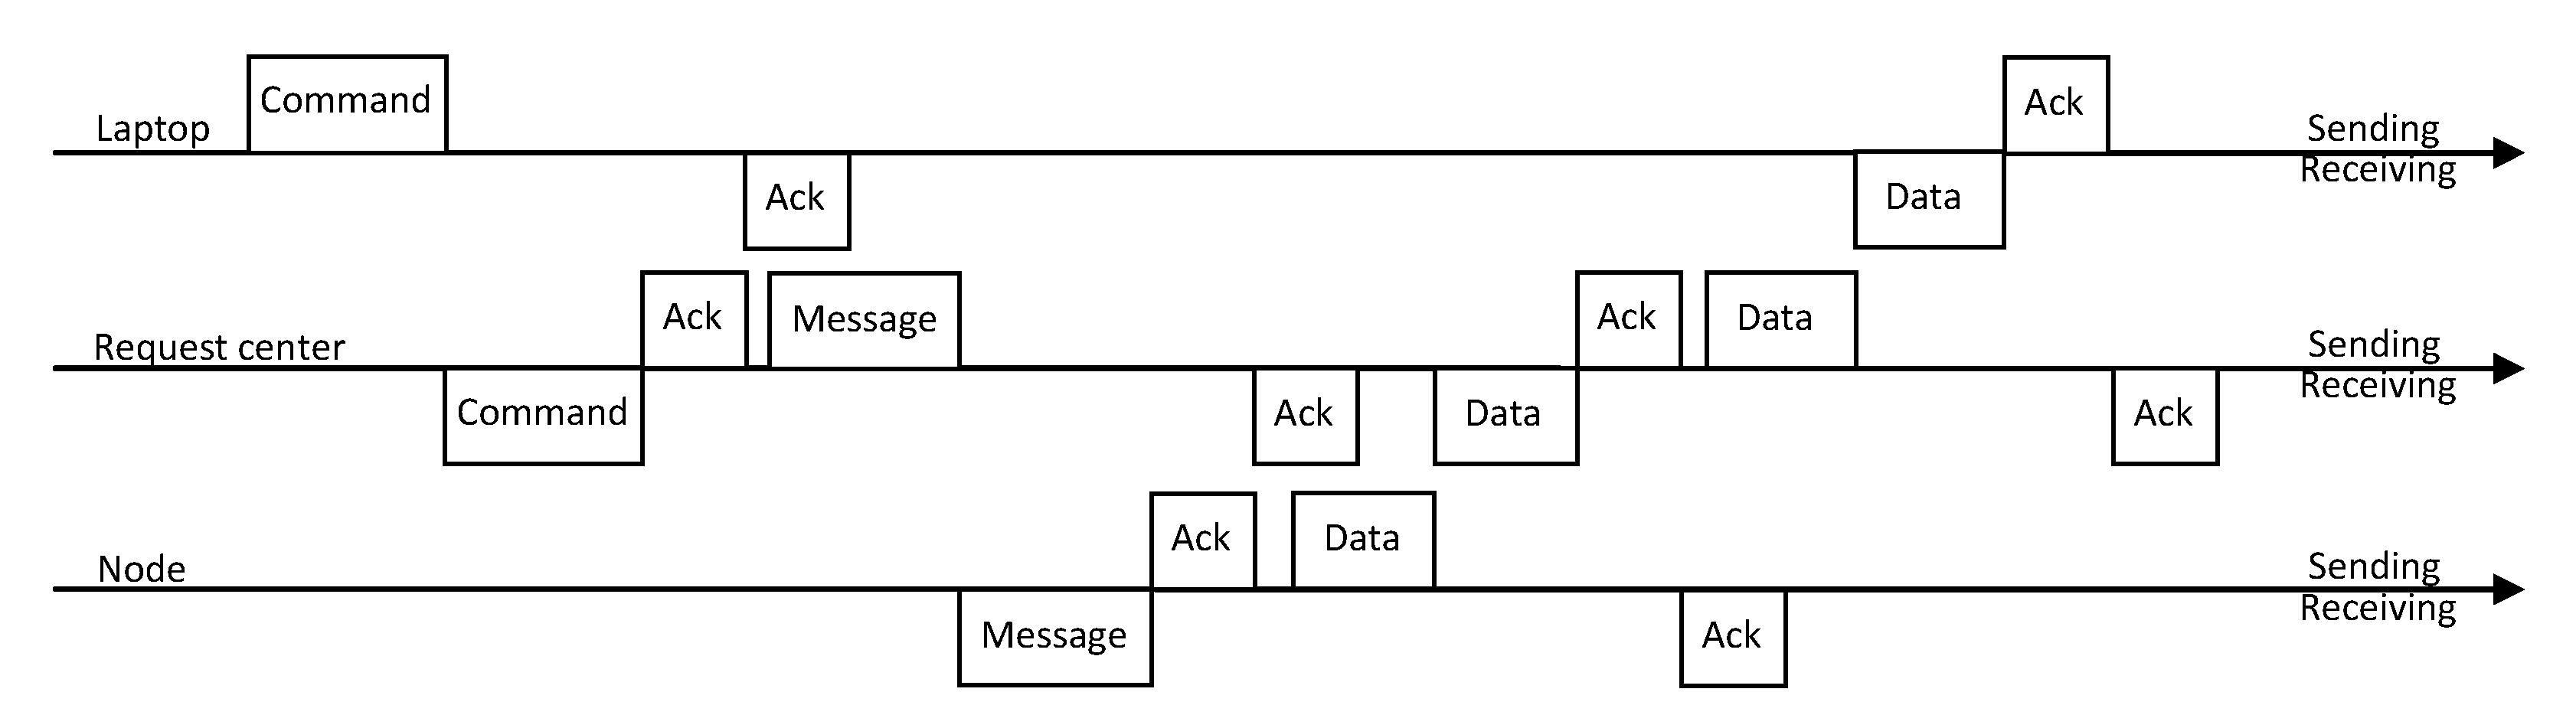
The system works cyclically by reading data from the accelerometer and Hall sensor (every 5–6 ms) and saving extreme values in the internal memory. Receiving a data transfer request resets the maximum values. Requests are sent at 1-minute intervals (intervals can be extended to 1 h). The set of data stored in the memory is sent in the form of ASCII characters (numbers in hexadecimal code); the data frame is presented in
Table 1 (the “<” and “>” characters facilitate parsing of message in the request center). The transmission protocol is shown in
Figure 9. A general view of assembled modules is presented in
Figure 10.
3. Results and Discussion
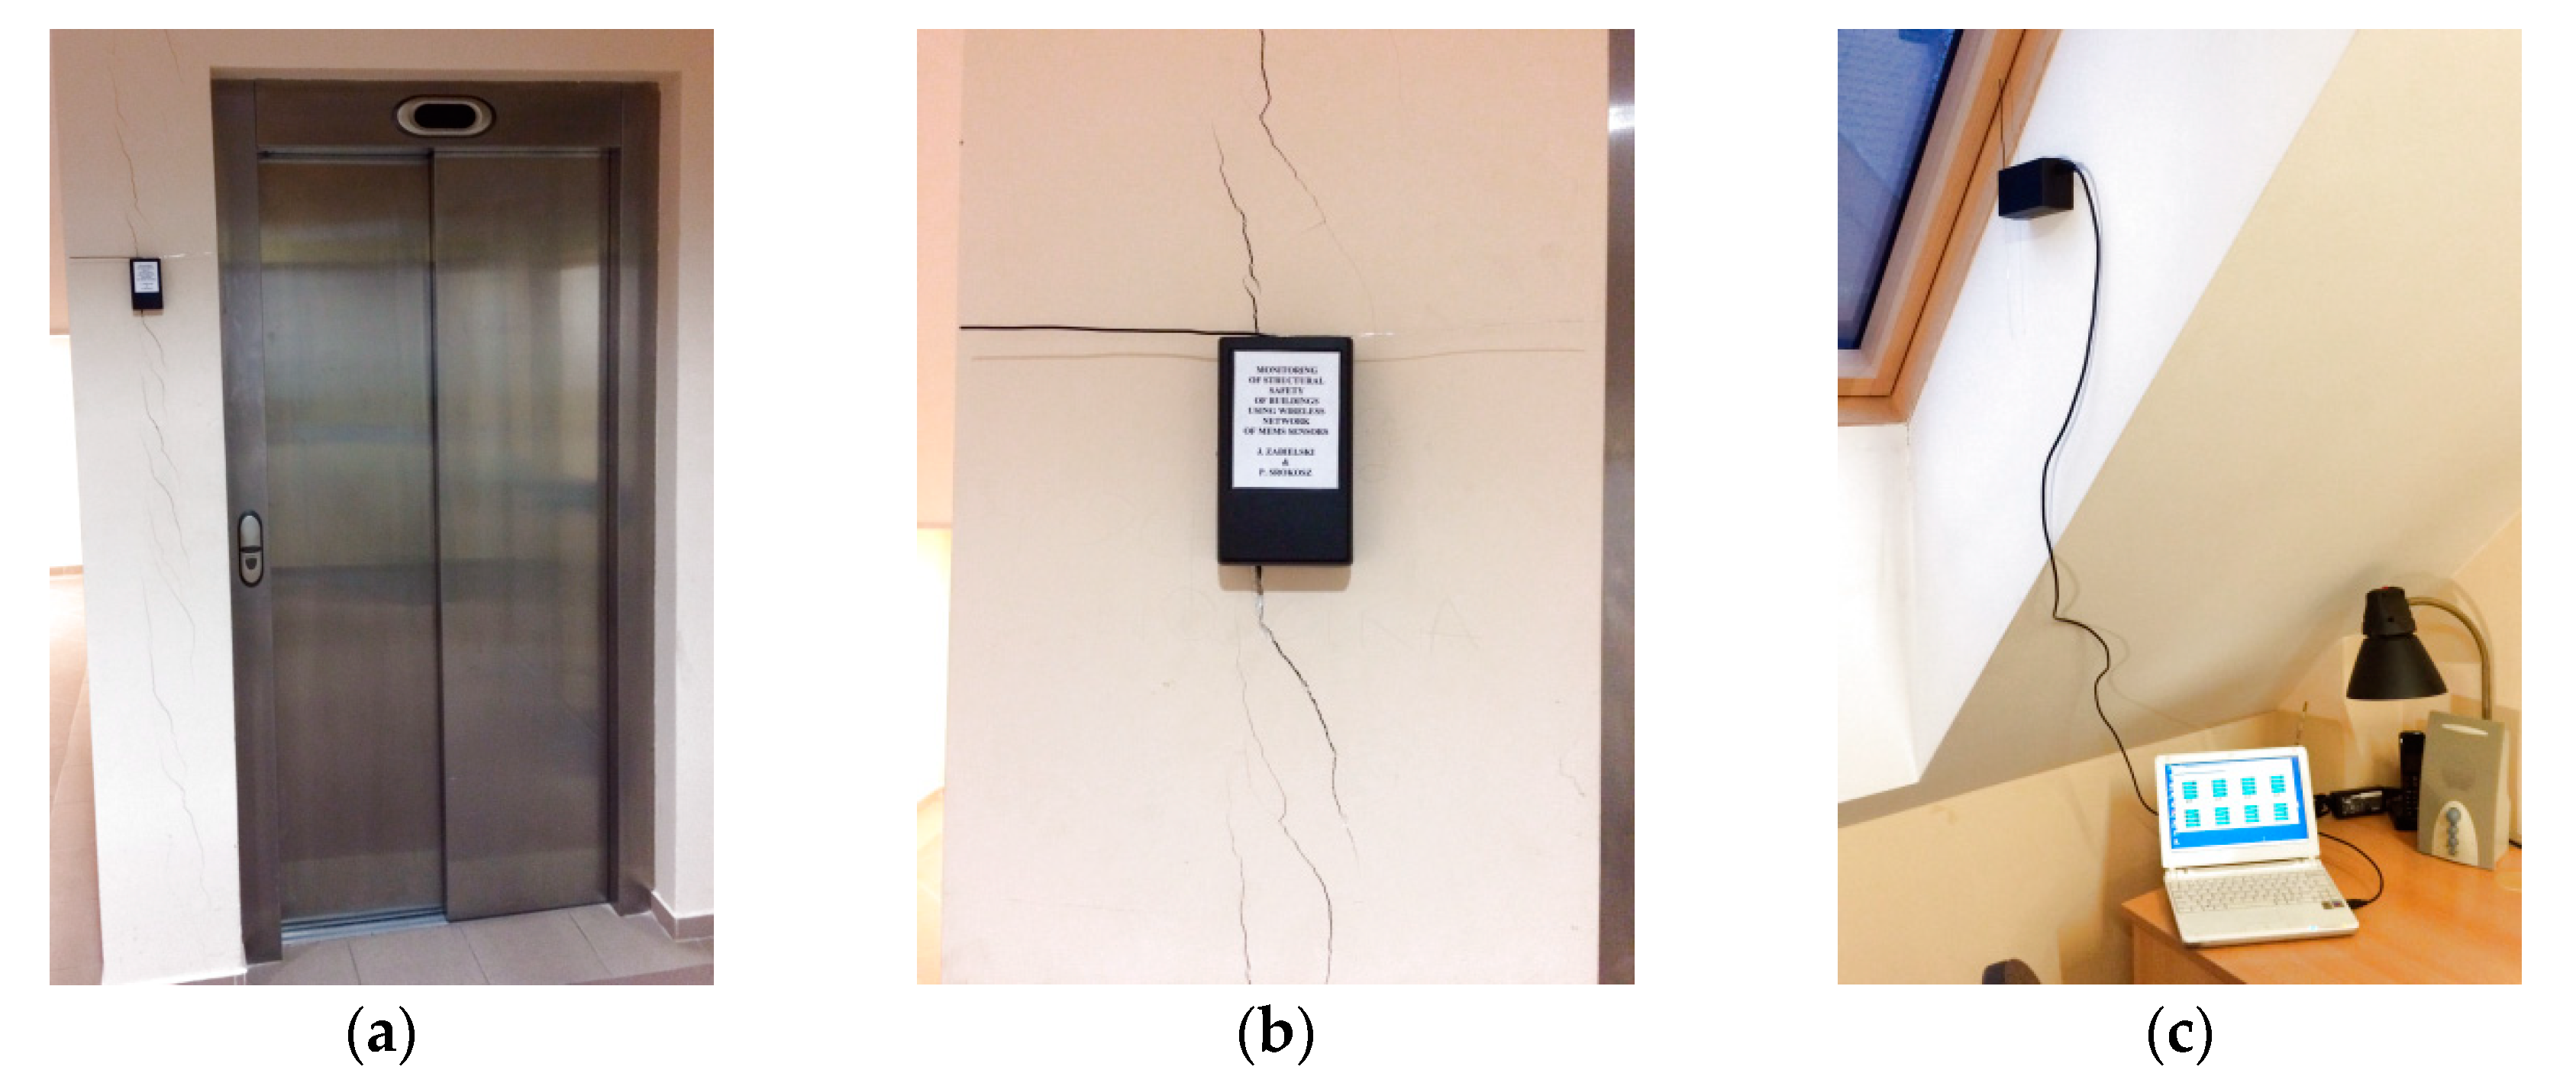
The system was installed in September 2019 in the building and put into use in 2012. Despite careful construction works, the building suffered numerous minor damages, visible in the form of cracks on the walls and pillars (see
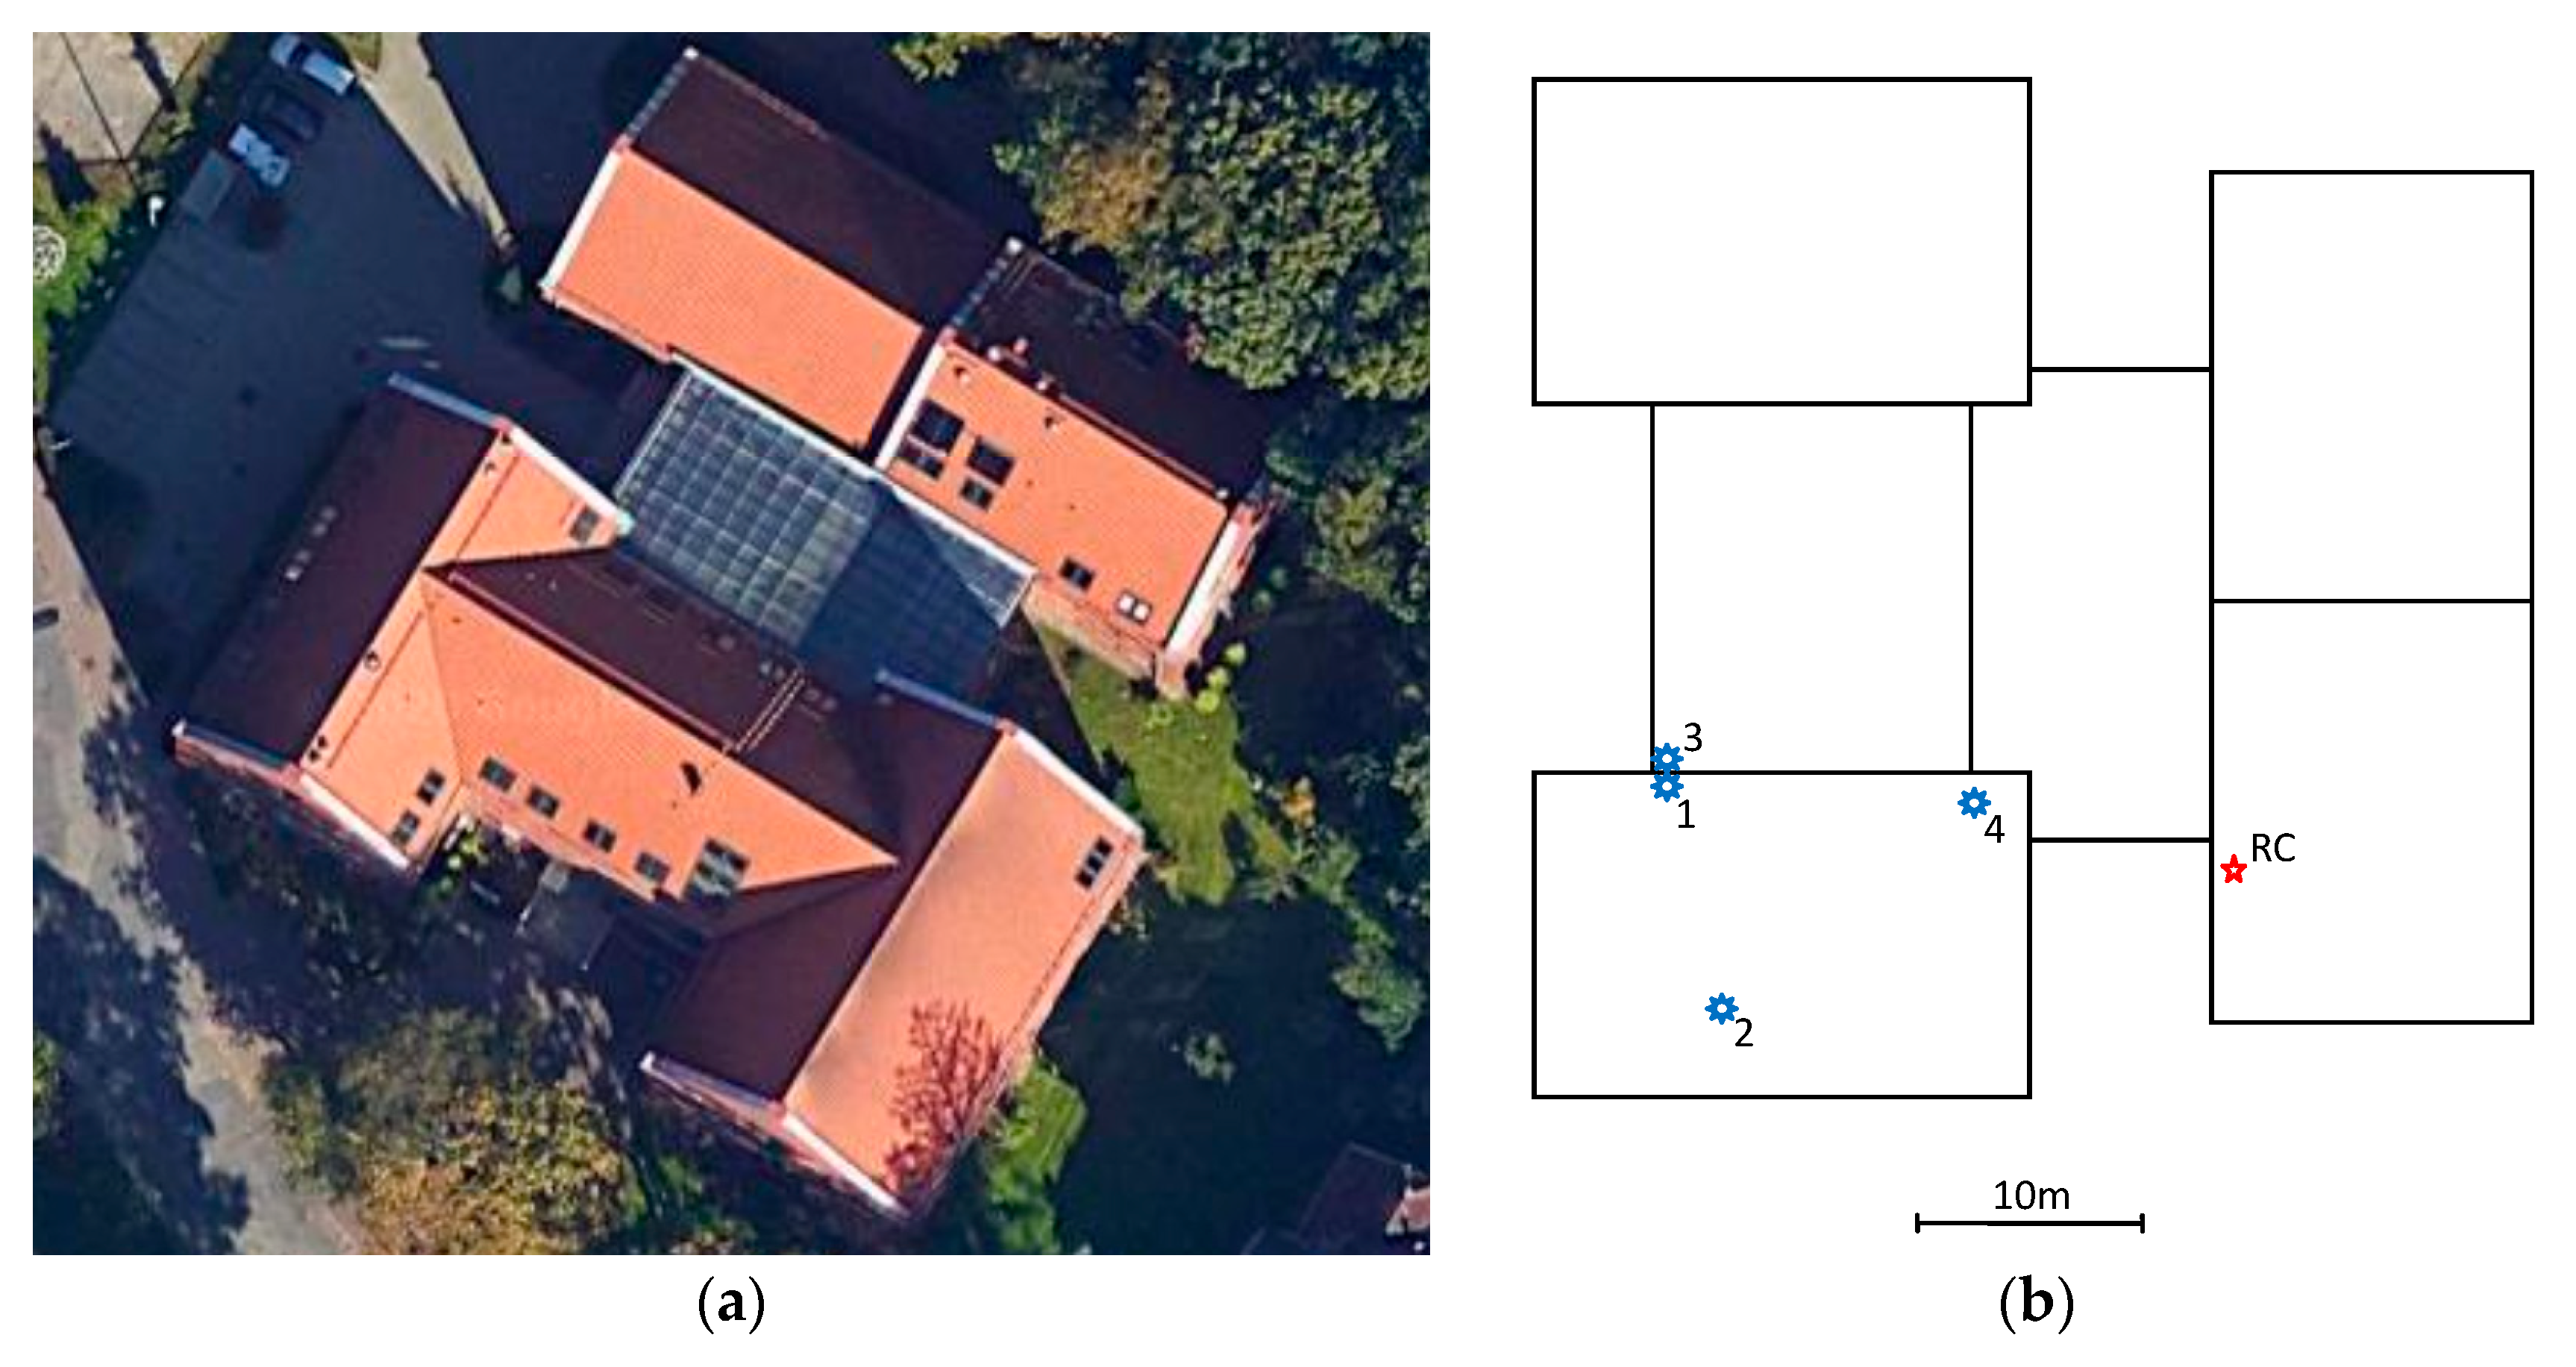
Figure 10b). The damages became noticeable after about 3 years of the building’s operation. However, no corrective action was taken due to uncertainty that the structure has stabilized in terms of displacements. It is well known that in cases where minor damage to building structures is revealed due to excessive displacement, e.g., foundation subsidence, and it does not endanger the safety of the structure; radical measures are not taken to eliminate the causes. In such cases, it is waited until the “state of equilibrium” is achieved, i.e., the entire structure “adjusts” to the operating conditions. Such information on the stabilization of the structure’s operation allows for final repair works that remove the visibility of local damage: gaps and cracks. However, in order to unequivocally determine whether the structure of the building is not at risk and whether it has reached a state of equilibrium in terms of displacements, a monitoring network was installed at the most sensitive points of the facility. The sensing nodes were installed in preselected locations (
Figure 11):
node 1: the elevator shaft in the basement (wall with crack),
node 2: the laser scanning laboratory on the top (2nd) floor (wall with crack),
node 3: the elevator shaft on the top floor (wall without cracks),
node 4: the mezzanine pillar on the first floor (crack).
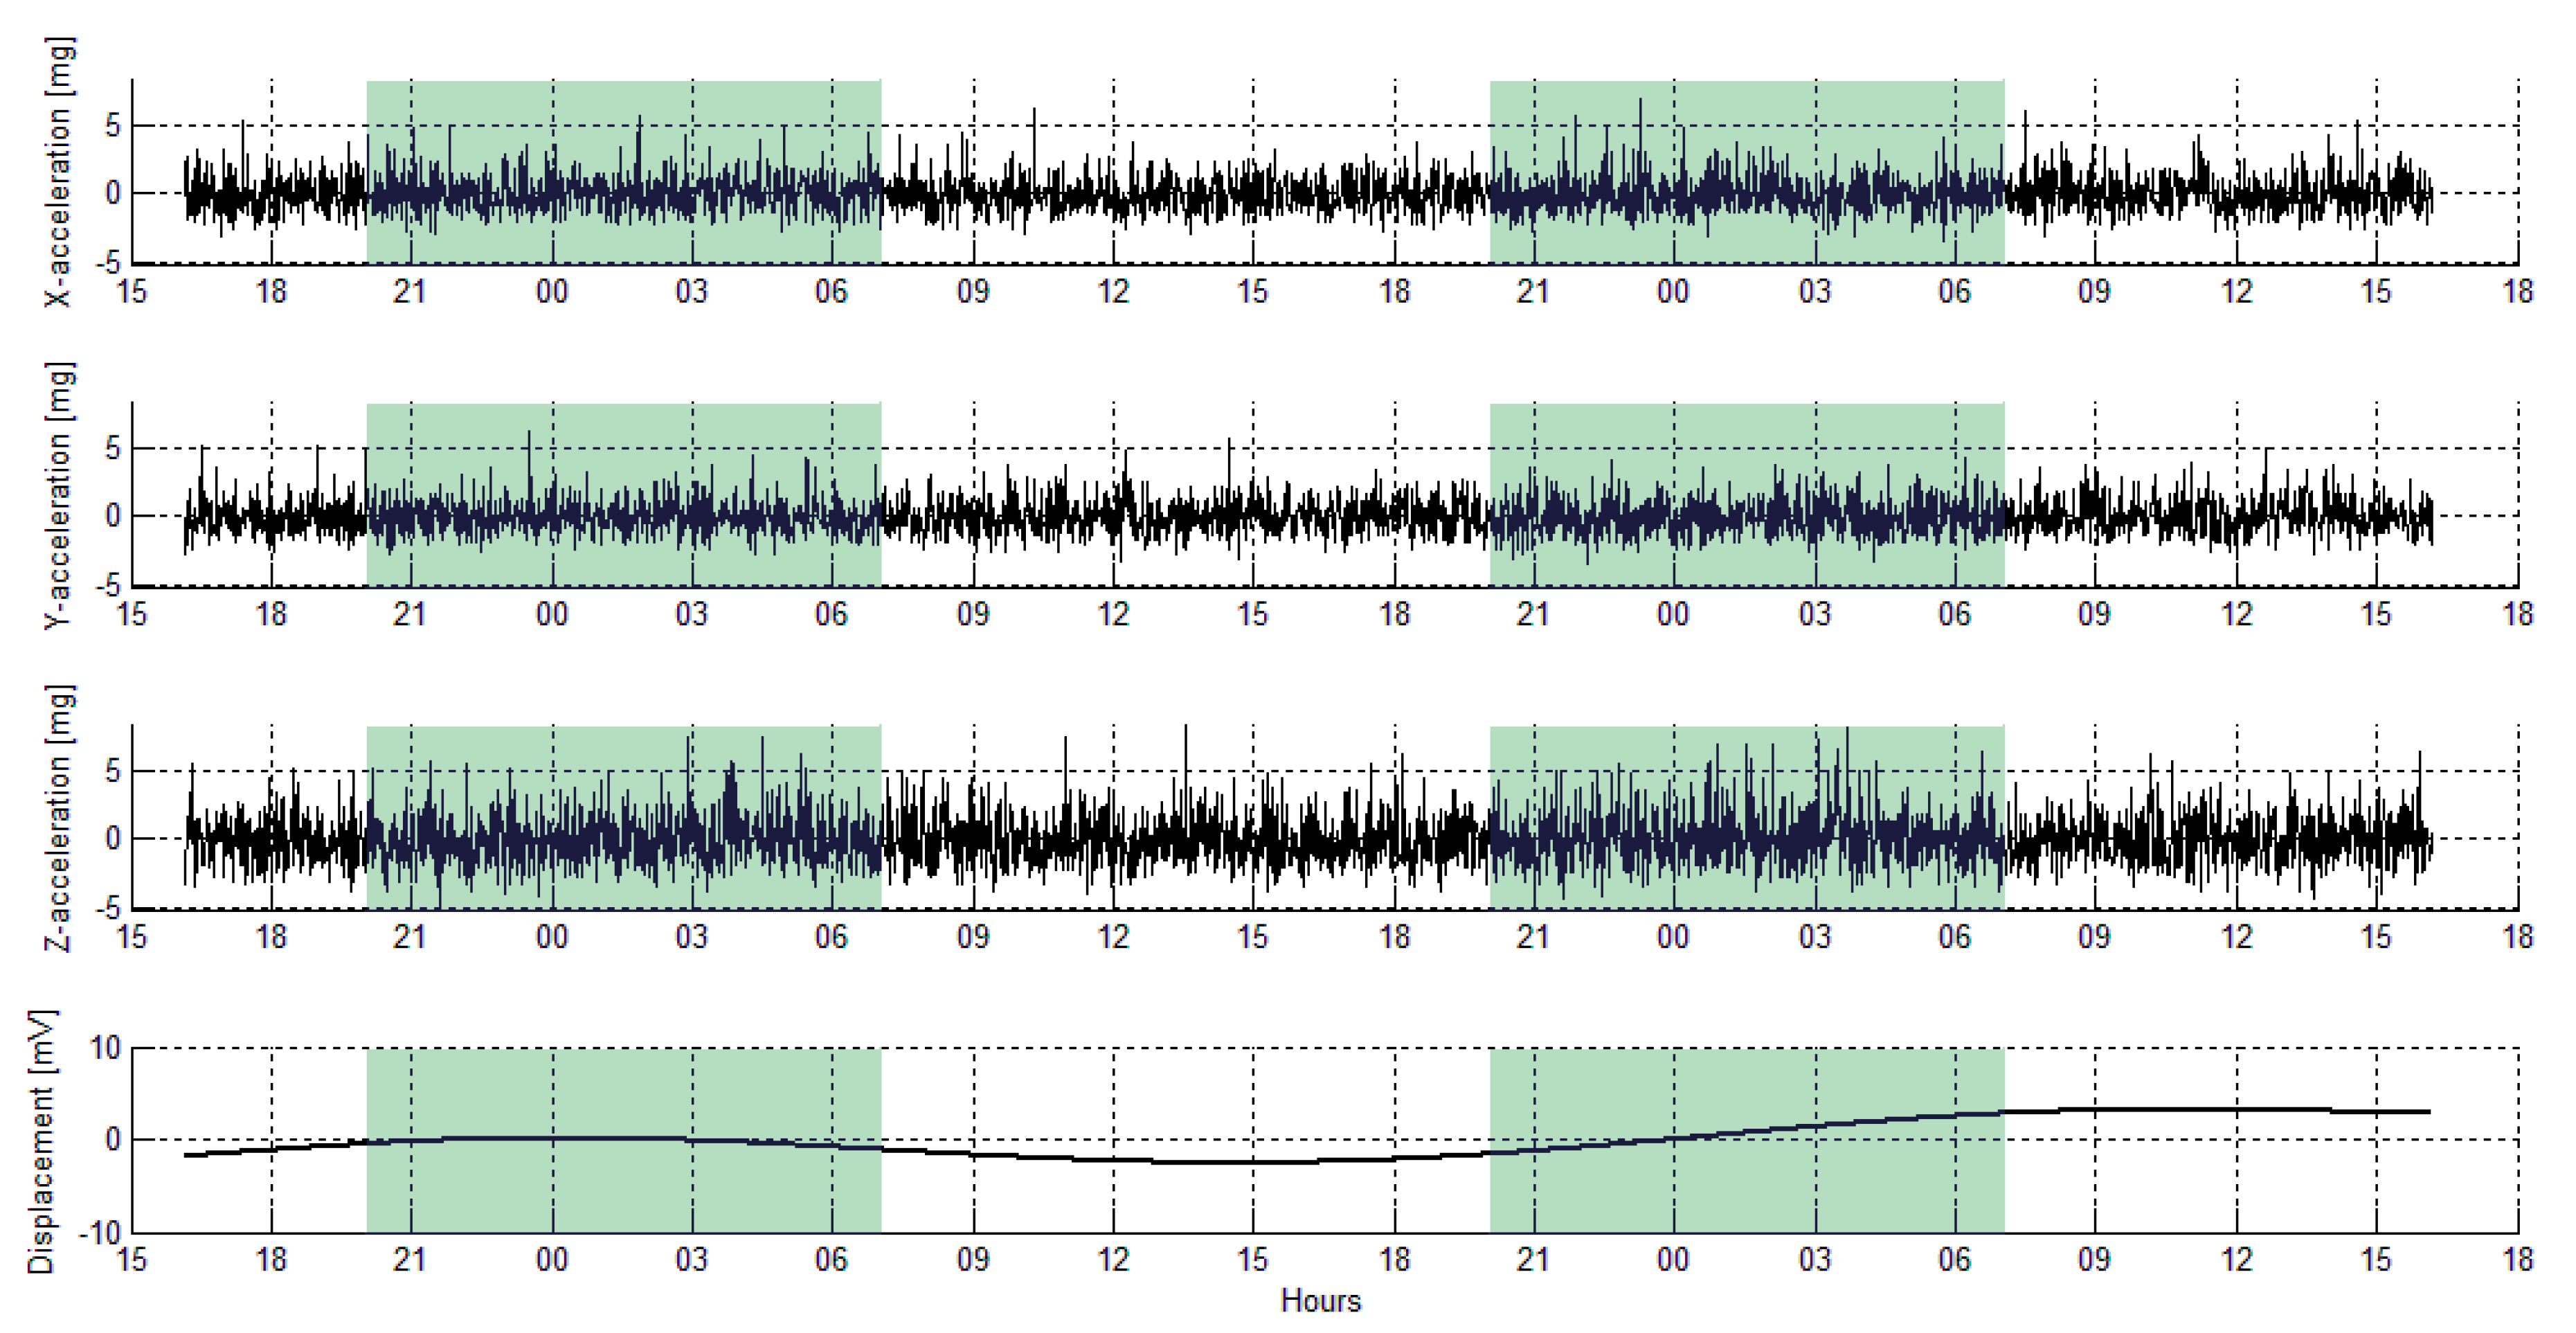
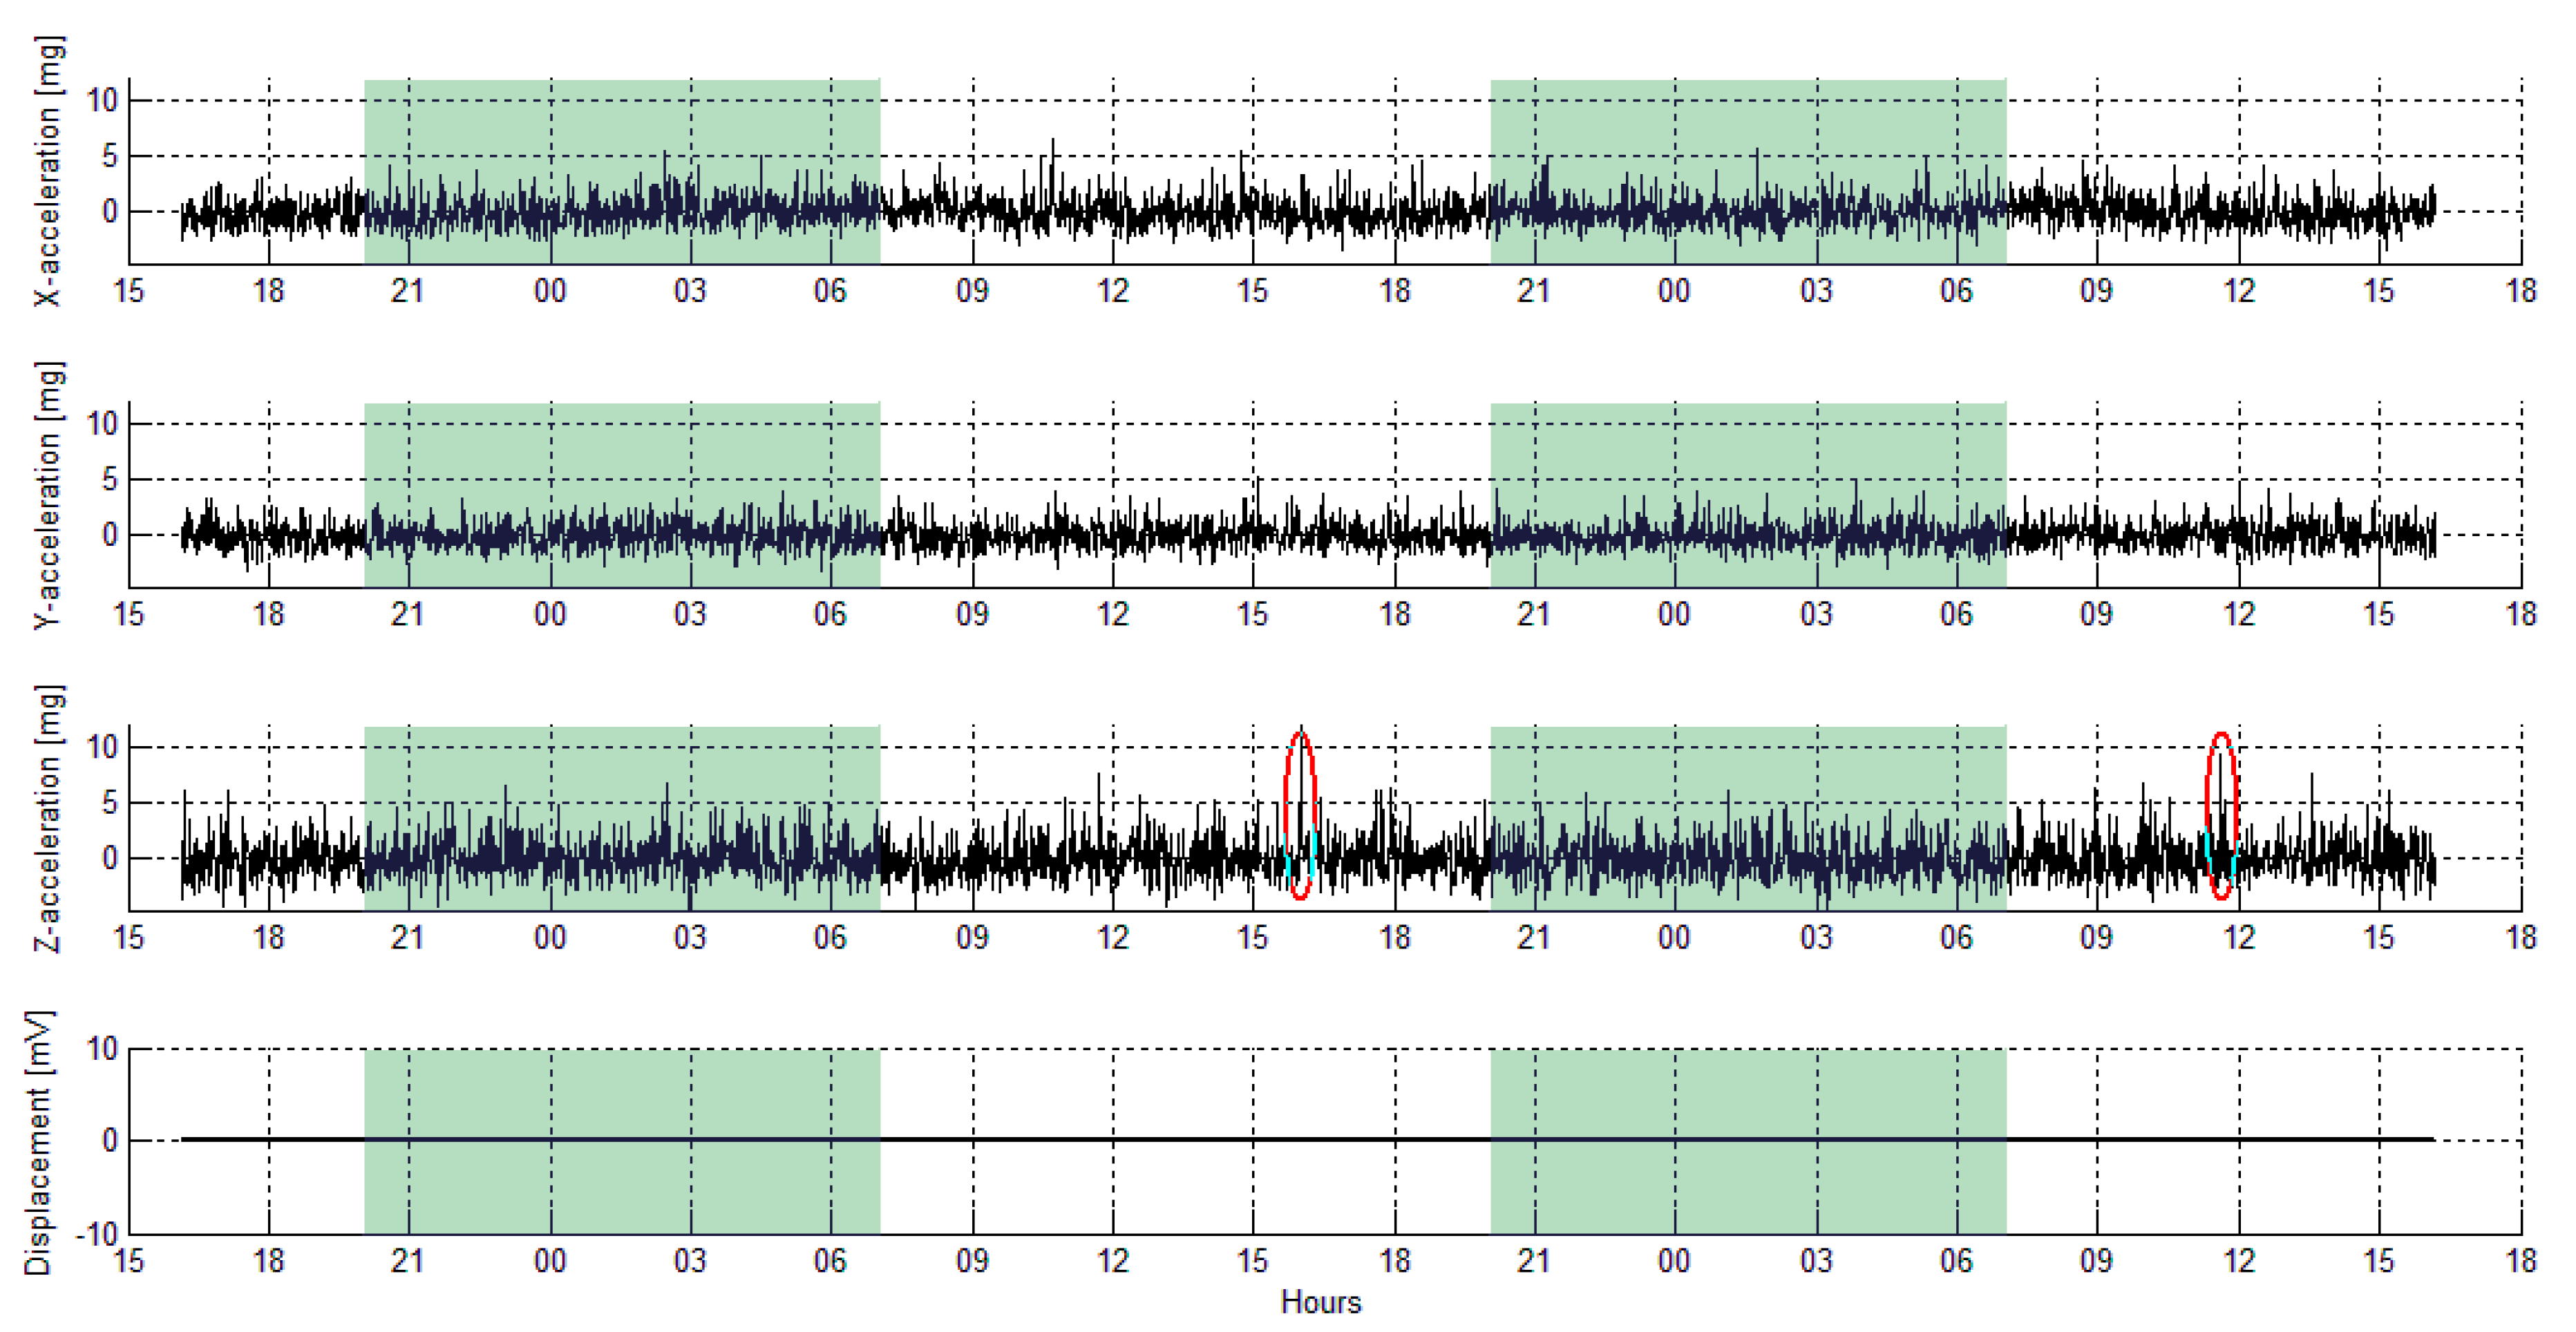
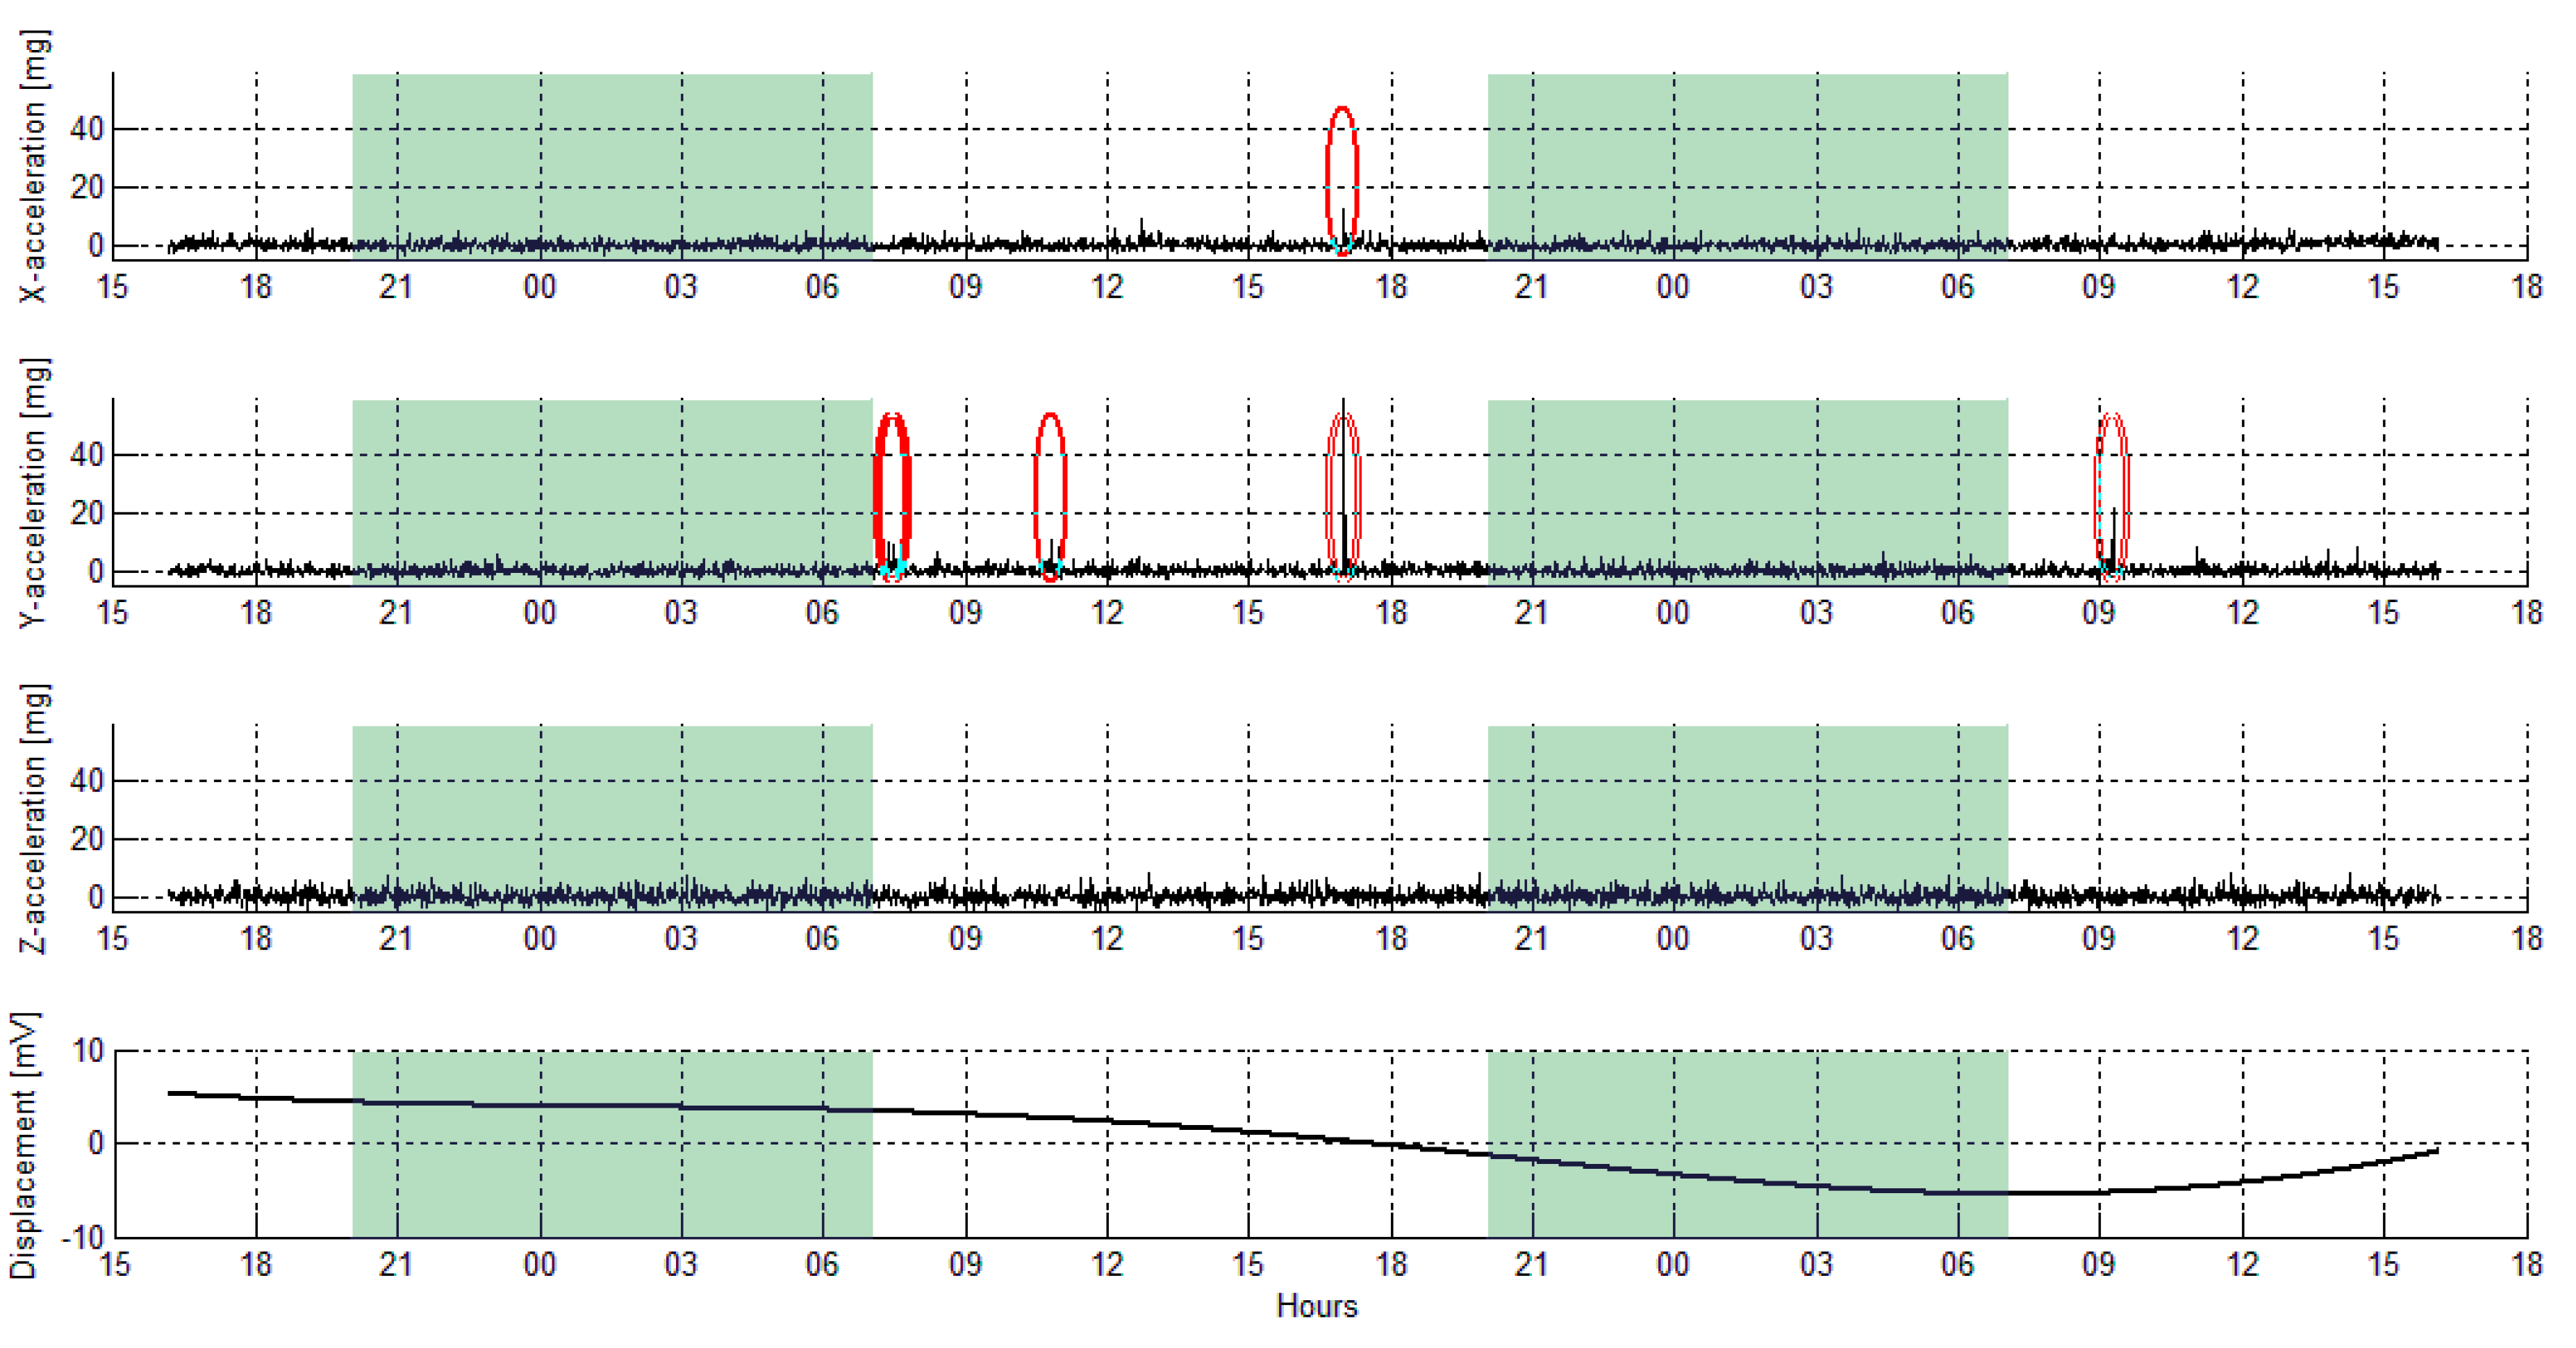
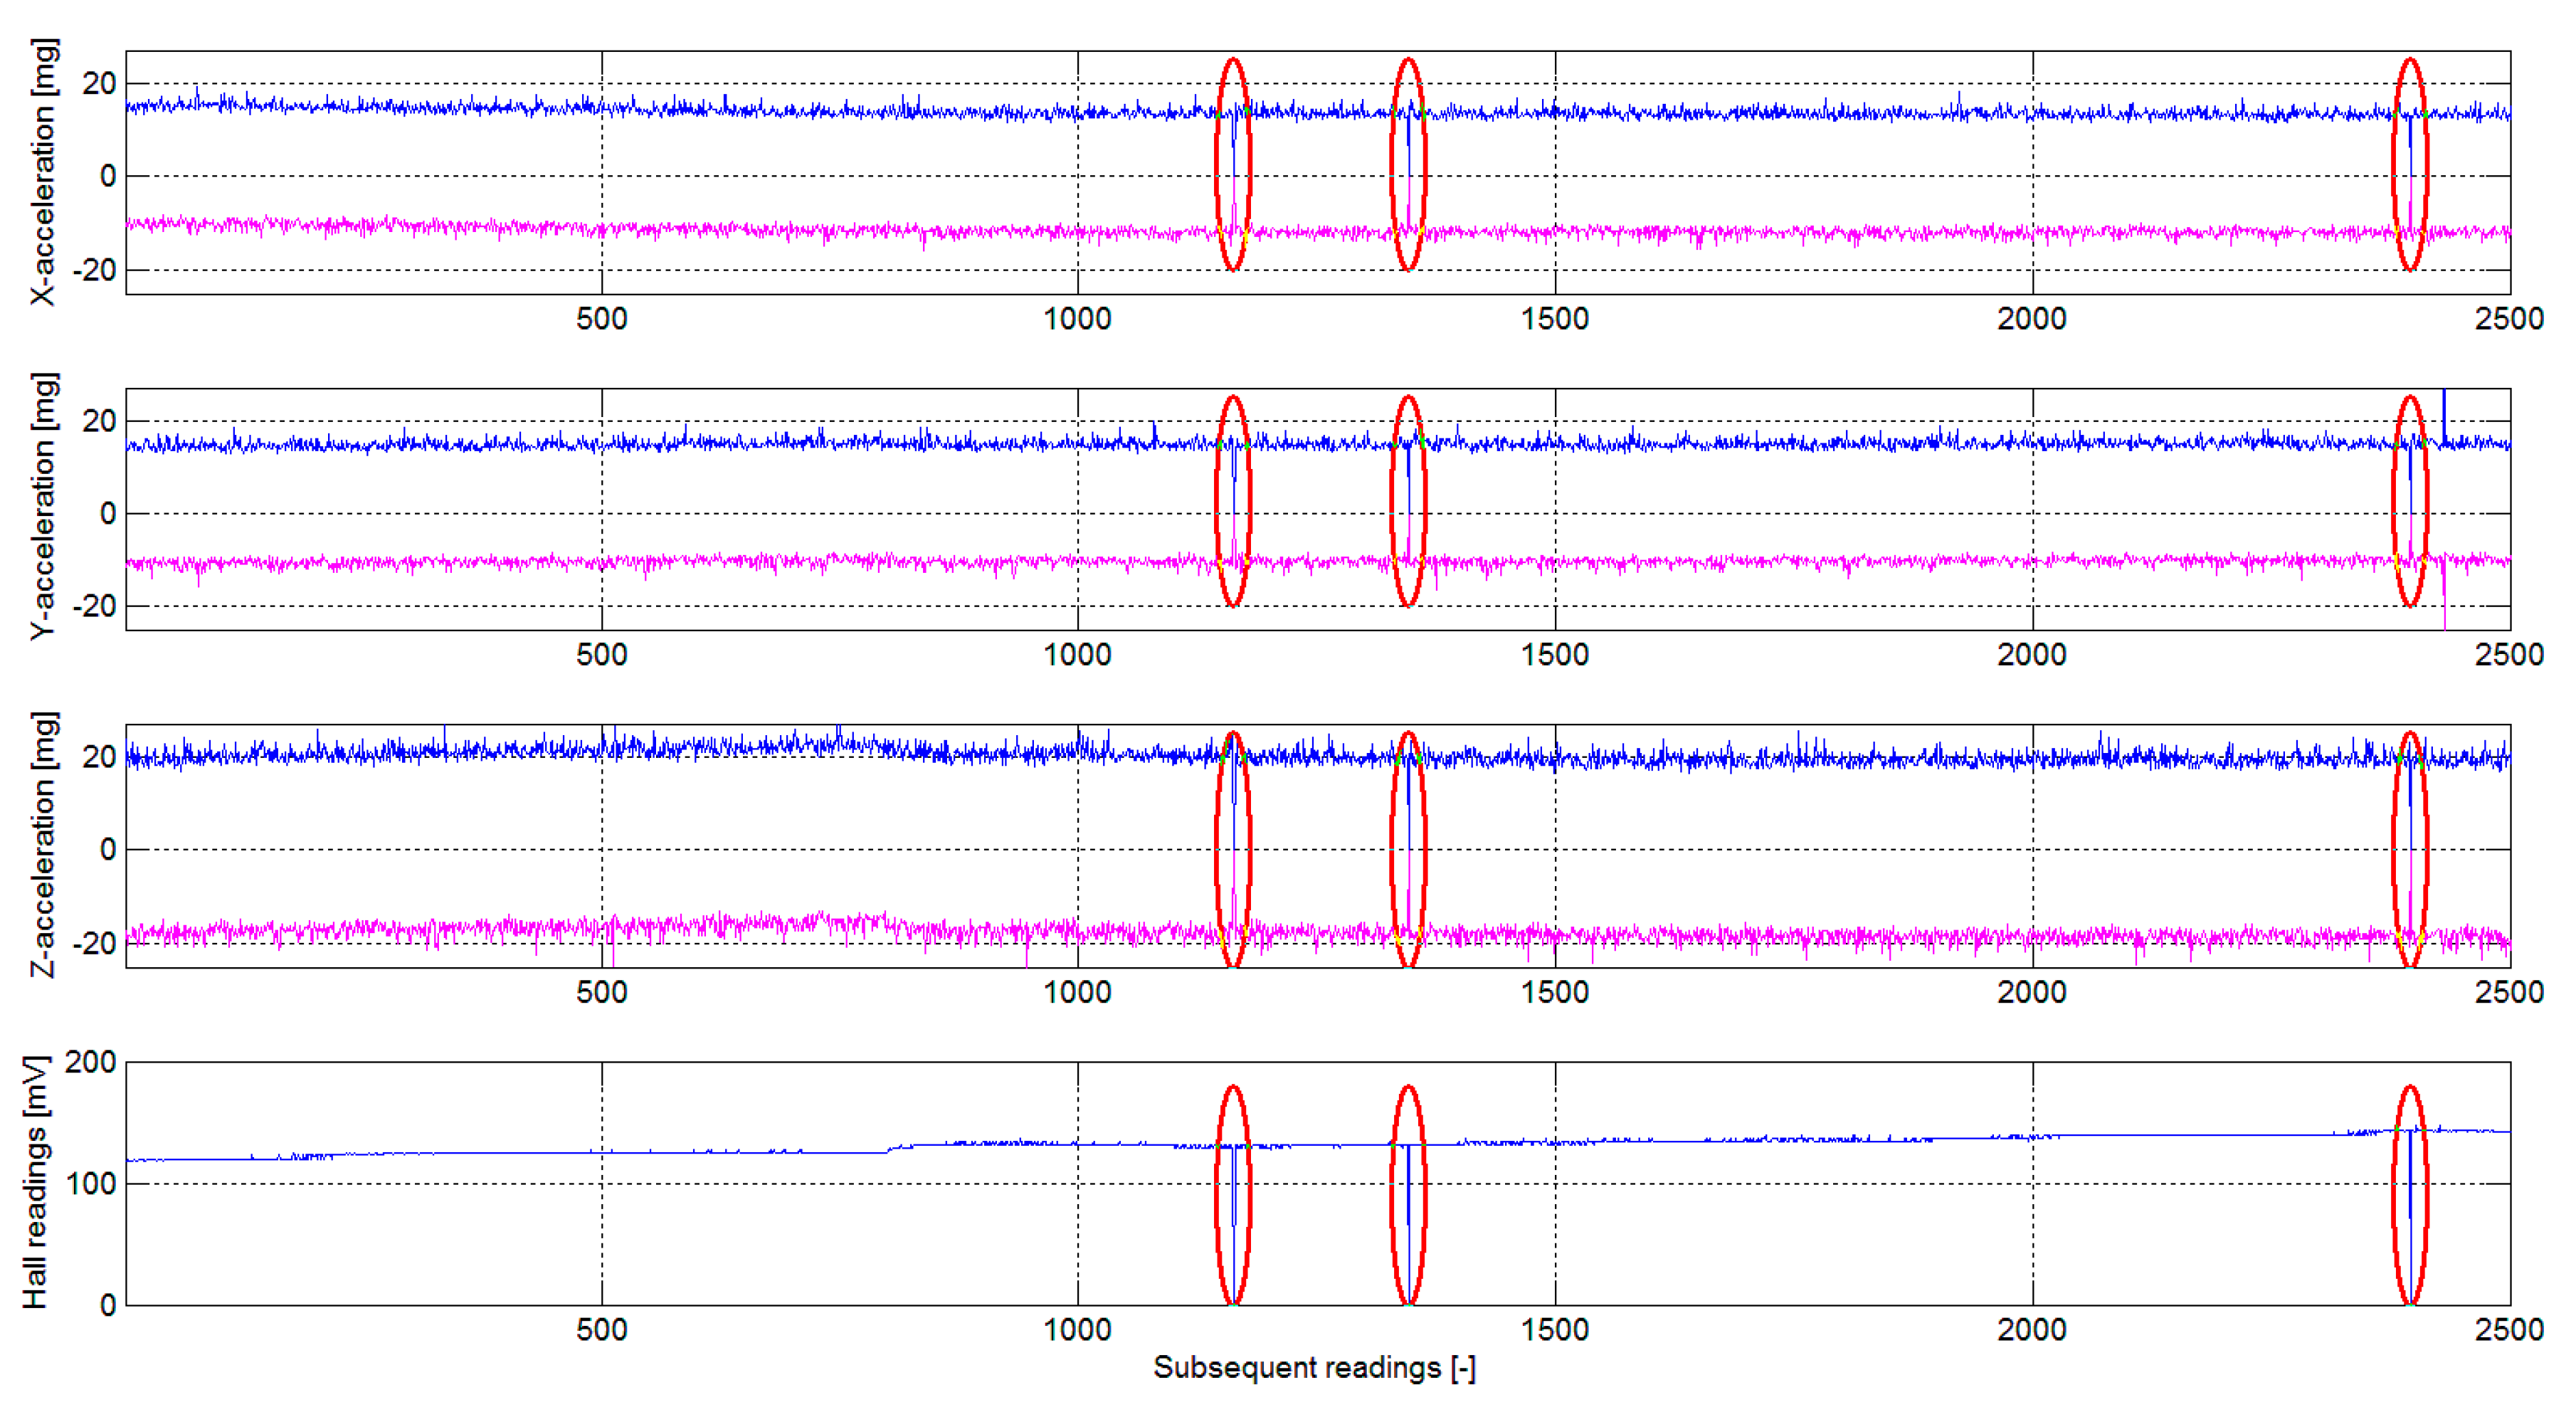
The monitoring process was carried out for several weeks, with the highest intensity of operational loads. During the measurements, no disturbances in data transmission were observed. Typical results recorded by all nodes during observation are shown in
Figure 12,
Figure 13,
Figure 14 and
Figure 15 (accelerations exceeding 10 mg are marked with red ovals, due to the 10-bit resolution of the A/D converter of the Hall sensor—the raw values have been approximated with a 6th degree polynomial).
As it can be easily seen, the dynamic loads have a negligible impact on the building structure. Noticeable changes in acceleration values are recorded during the building’s hours of use; at night the sensors do not record vibrations of significant amplitudes, which is in line with expectations. The width of the cracks changes its value cyclically, which indicates the normal operation of the building structure and does not indicate the development of further discontinuities that could lead to a failure condition. The demonstrated stabilization of the displacements of the building structure elements and the minimal impact of operational loads allowed for the decision to start renovation works.
On the occasion of the conducted measurements, observations made in the laser scanning laboratory confirmed that dynamic interactions coming from users are completely imperceptible. This confirms the correctness of the purpose of this room for a workshop of precise geometric measurements.
The reliability of the information flow in the system was analyzed on the basis of the frequency of transmission errors. LoRa systems based on Semtech Sx1276/1277/1278 chipsets can be programmed for a fixed number of repetitions of attempts to establish contact, as well as time intervals for renewing transmissions. Nevertheless, it may happen that an attempt to establish contact will be unsuccessful, which is manifested by a lack of record in the collected data set (
Figure 16). The occurrence of such errors in the records was negligible and did not exceed 0.1% of the volume of collected data.
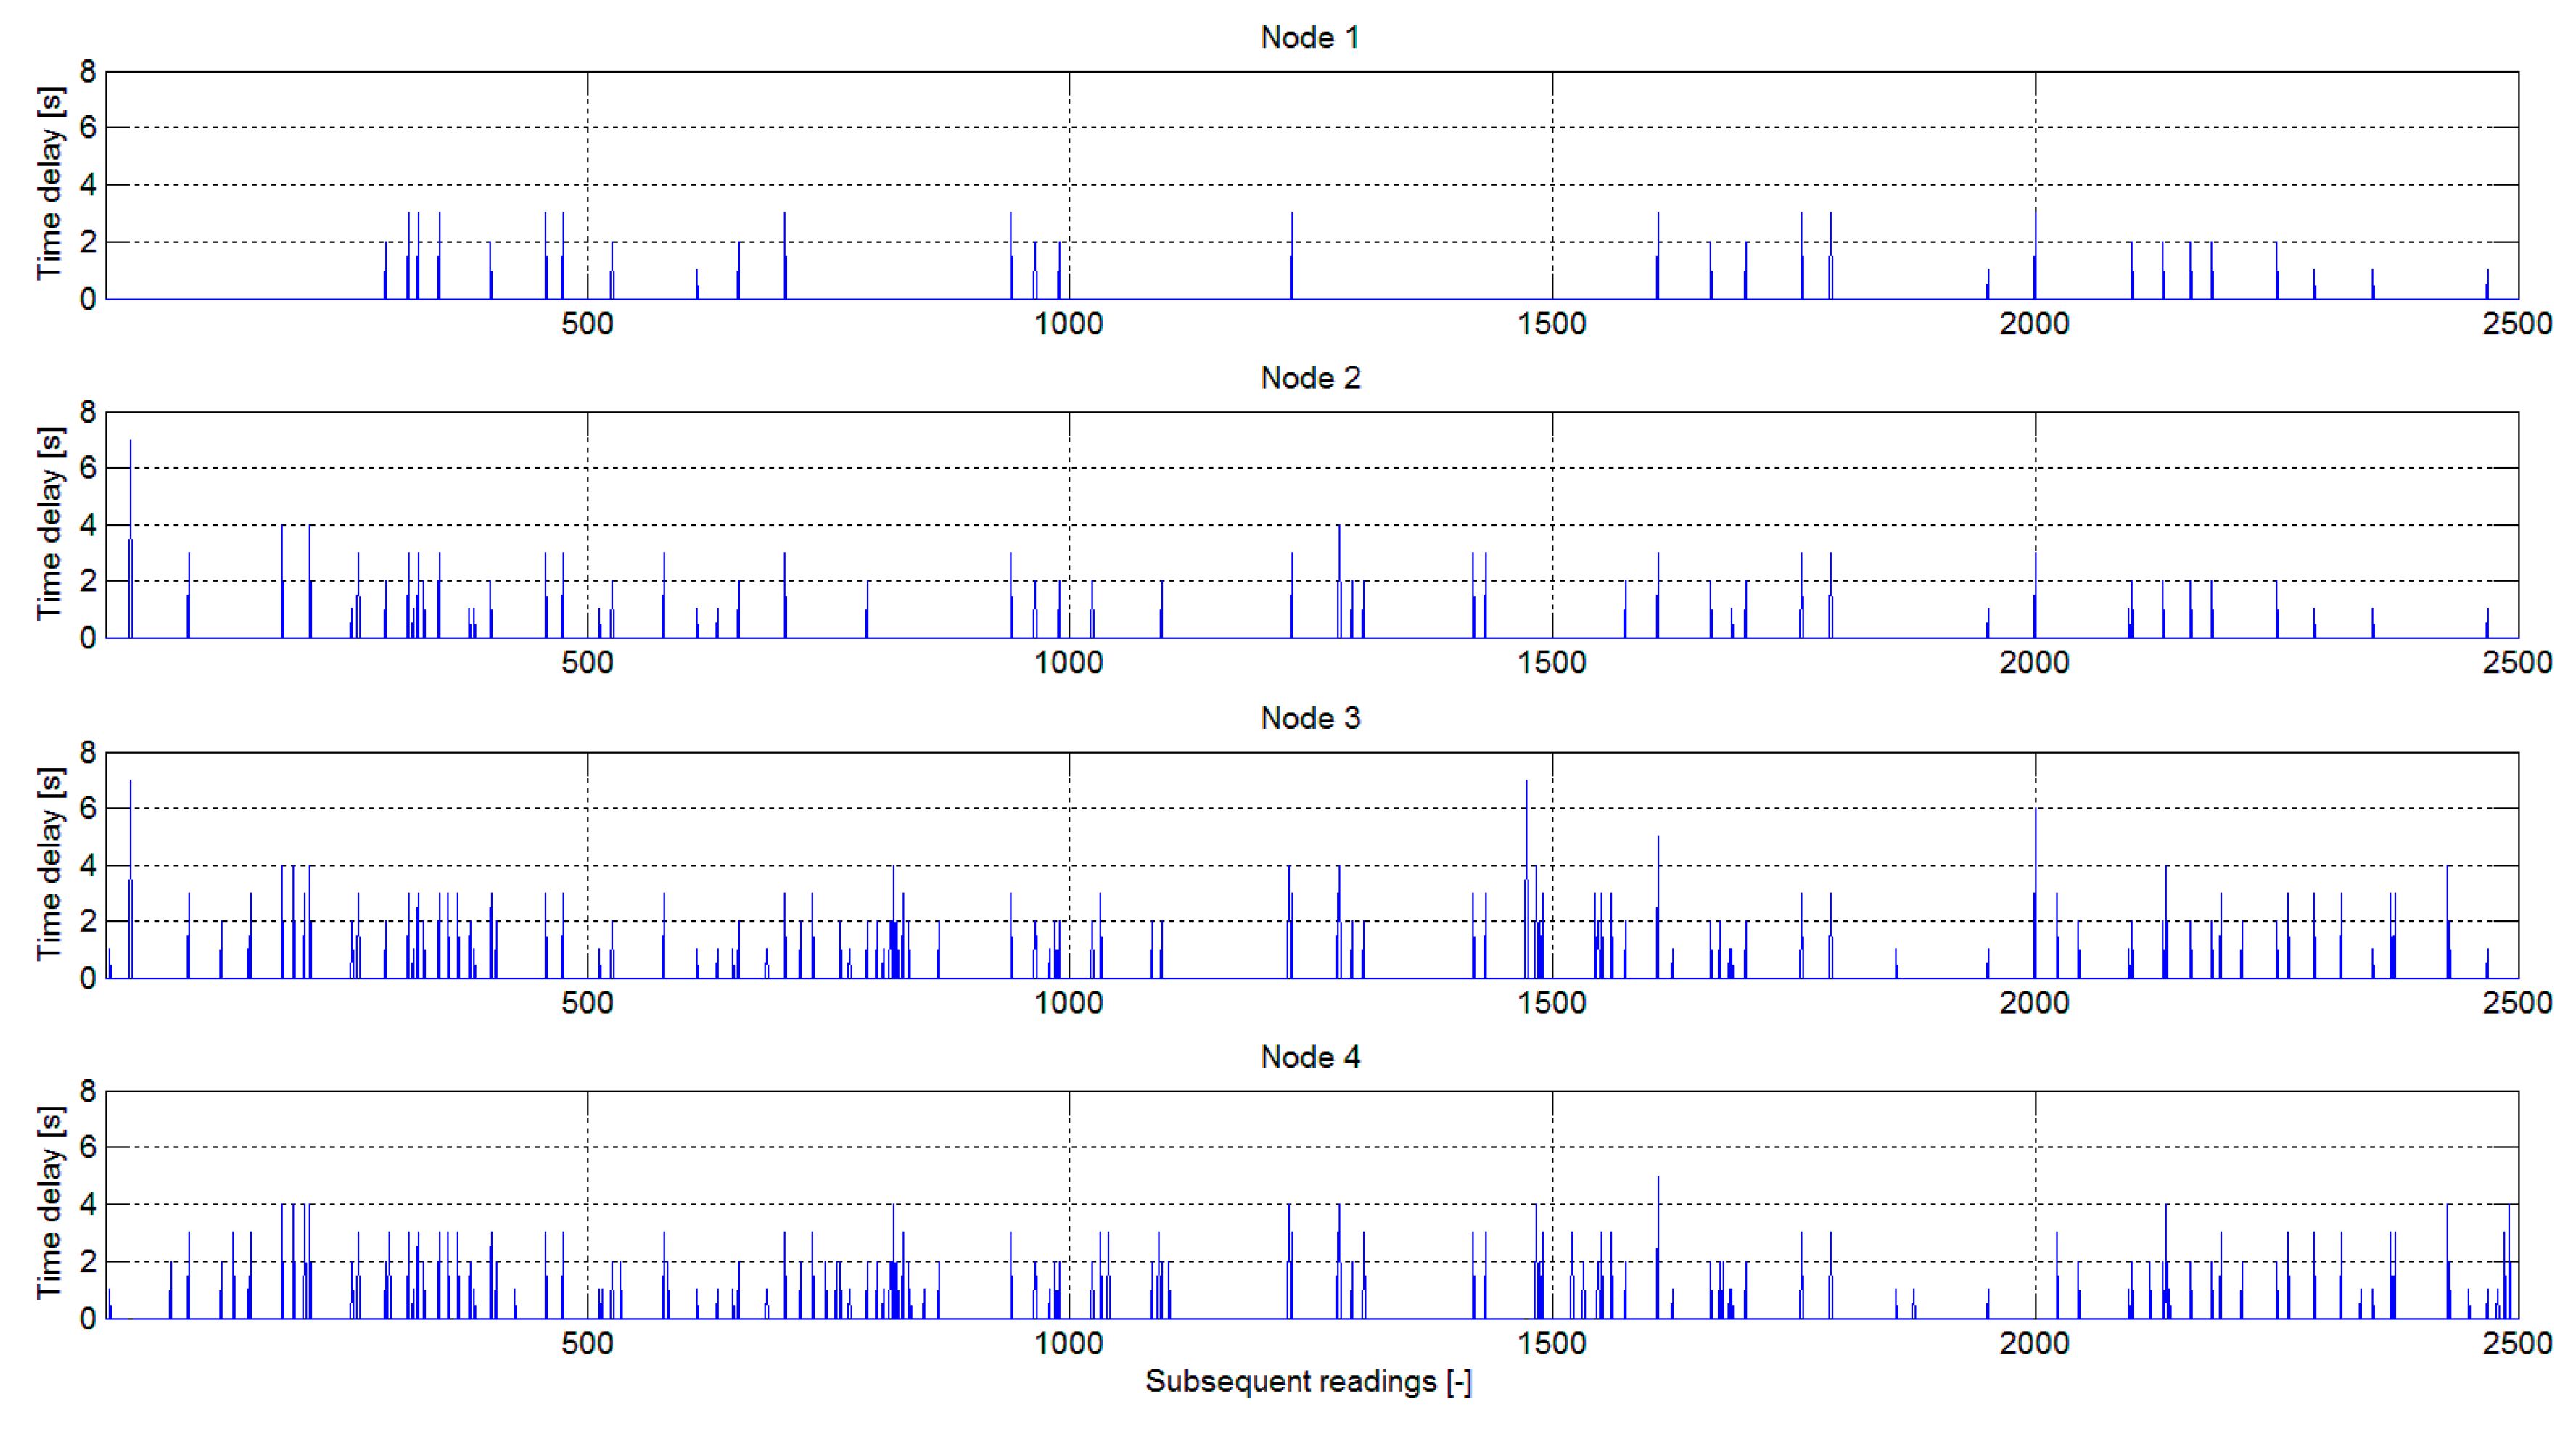
Due to the specific design of the algorithms built into the LoRa Semtech chipset, multiple attempts to establish a connection by nodes resulted in successful sending of data packets to the request center. However, such errors can be easily identified from the time delays in the data delivery.
Figure 17 shows the time anomalies that occurred during data registration in the request center. Such errors occurred quite often (they constituted even about 5% of all measurements), but they are not problematic due to the long, 1-minute intervals between subsequent transmissions (the maximum delay value recorded during the 2-week observation did not exceed 10 s).
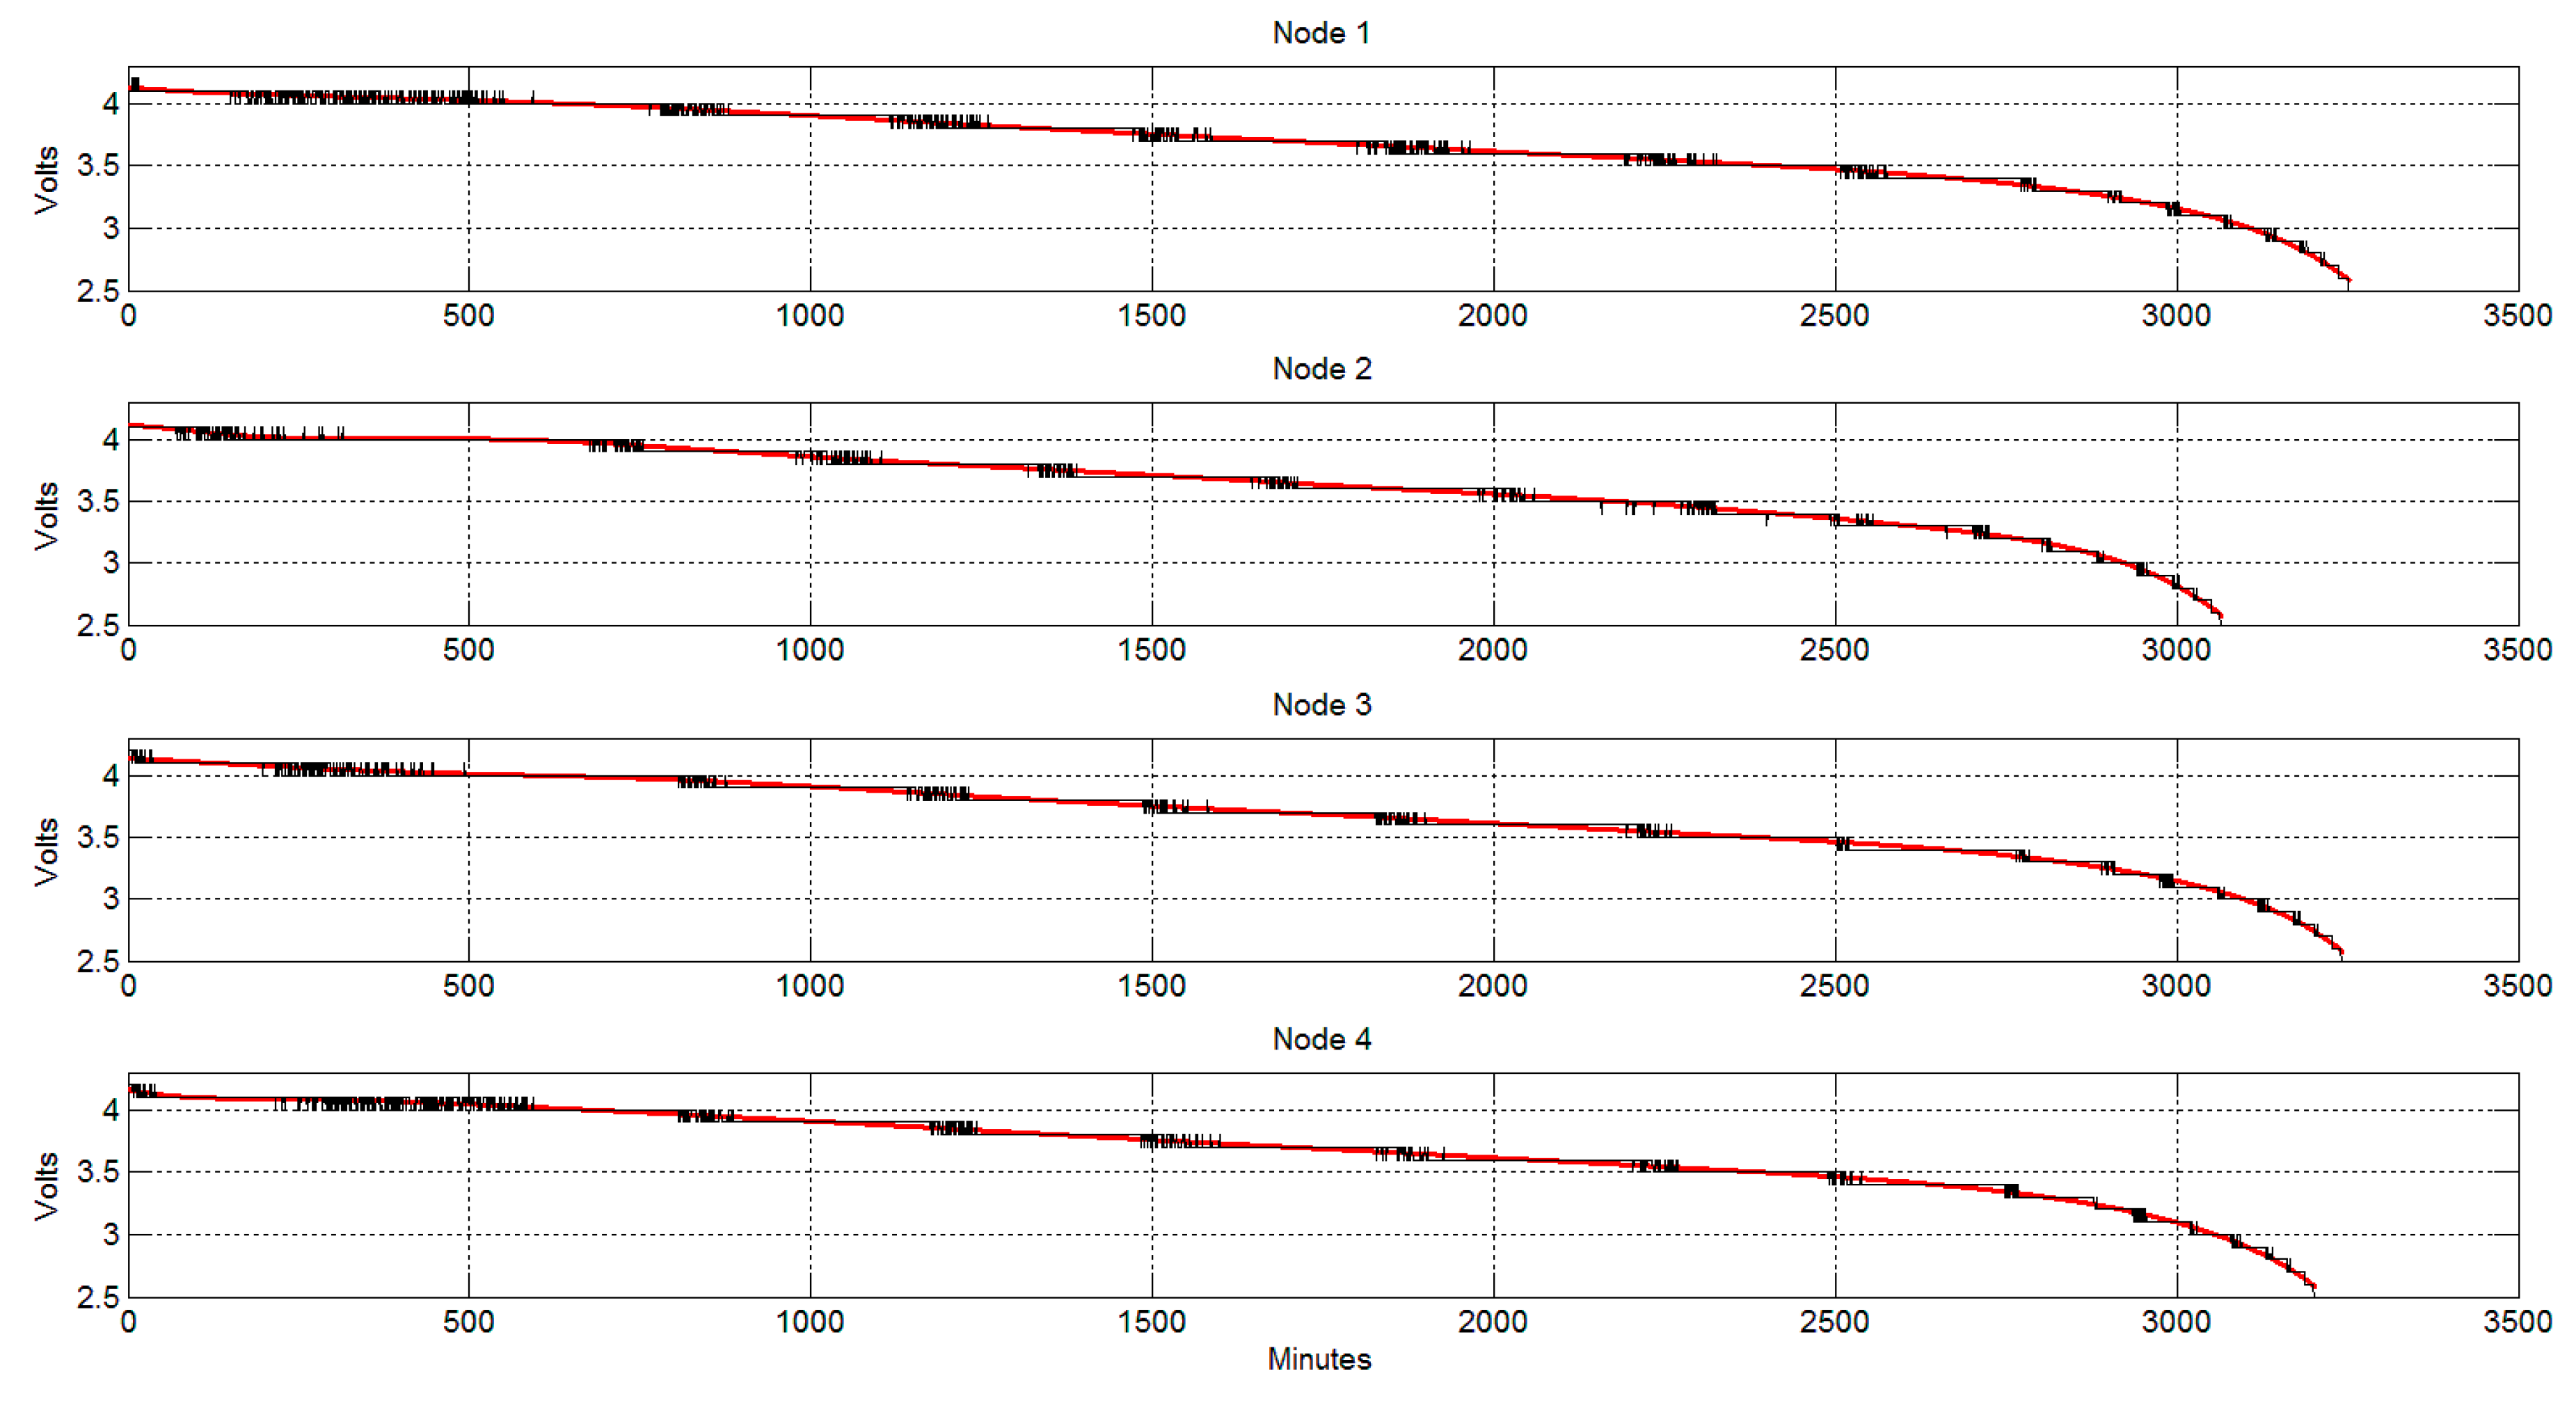
Another aspect of the tests of the constructed system was the assessment of energy consumption of measurement nodes. The analysis of the energy consumption of the wireless nodes consisted in measuring the voltage of the lithium-ion cell supplying each measuring unit during continuous operation, until the current source was completely discharged (
Figure 18). During the tests, the control and transmission circuits did not go into a low energy state (sleep mode) in the intervals between the sensor readings. The average current during the full load of the node (operation of sensors, microcontroller and LoRa transceiver) did not exceed 60 mA. The nodes were powered by an INR18650-35E cells with a nominal capacity of 3500 mAh and a minimum capacity not less than 3350 mAh. Therefore, during the energy consumption tests, the continuous operation time of the device was not shorter than about 2 days. In the normal operation mode, i.e., with the active state of low energy consumption (sleep mode) of the control and transmission circuits occurring during transmission intervals, the period between recharging the batteries increased several dozen times (the lithium-ion cell is charged via a micro USB connector, which can also be used to connect an external larger battery).
There is a possibility of deeper optimization of the system in terms of even greater energy savings, which may include:
reducing the clock frequency of the microcontroller below 1 MHz (several hundred kHz),
using a more economical step-up converter (e.g., TPS61202) to power Hall sensor,
using thresholds and interrupts to generate LoRa transmission.
A prototype of such a module has already been built; the working period between charging the cells is several months.
4. Conclusions
Preliminary results of measurements confirmed the effectiveness of the constructed monitoring system of the building structure. The most important conclusions that can be drawn from ongoing observations are as follows:
LoRa wireless communication systems ensure trouble-free data transmission from sensor networks in high electromagnetic wave conditions (cell phones, WiFi, bluetooth etc.);
cheap MEMS sensors can be successfully used to monitor dynamic effects on building structures;
the monitored building, despite numerous wall cracks, shows no signs of progressing structure degradation;
the system can be used to test selected rooms in buildings to verify the correctness of their purpose and conditions of use;
a constant monitoring network of structures exposed to cracks allows for obtaining information about the time of safe repair and renovation (crack stabilization);
the modular structure of the system enables its easy modernization and improvement, including adaptation to individual needs.
It is obvious that in general cases, observations lasting several weeks may not be enough to formulate recommendations for building safety, but the created network of sensors can certainly act as an early warning system for an impending breakdown or disaster. Based on the data collected so far, the building administrator has made a decision about the need to carry out the necessary repairs to the damage found in the structure of the monitored facility.
One of the most important aspects of evaluating the effectiveness of a remote building monitoring system is real-time wireless transmission performance. LoRa circuits have been set to repeat the transmission 15 times in case of encountered errors, while the maximum time of sending a data packet was set to 1 s from the attempt to establish communication. It is obvious that the wireless early warning system should have a short transmission time. The proposed remote event recording system does not have time synchronization circuits. One of the proposals for supplementing the wireless network are GPS receivers; conceptual work has already begun.


