1. Introduction
In Chile, housing is legally considered a commodity and a good investment as it is a low-regulation market that is organised by real estate market agents, with housing subsidised by the state for lower-income households [
1]. Despite public policy efforts, there is strong evidence that demand-side subsidies for low-income housing projects have ended up increasing the price by contributing to inflation [
2]. This also occurred for urban renewal subsidies, which were initially intended for the middle class, where the subsidy was capitalised by companies that sell housing units, obstructing direct benefits to buyers [
3]. On the one hand, the high value of housing has been explained by actors in the Chilean real estate sector as being a consequence of the high value of land and its scarcity [
4]. On the other hand, in Greater Santiago, where the price of housing has risen the most, the argument on a shortage of land has been contested, indicating the existence of 555 hectares of land located in the urban pericentre of the city that is still available to exploit [
5]. Even so, the amount of available land would exceed the structural demand of 497,560 housing units, which is a very similar situation to the 1998 deficit of 497,012 units [
6]. All of this is despite the fact that from 1998 to December 2018, 2,805,069 new housing units were built [
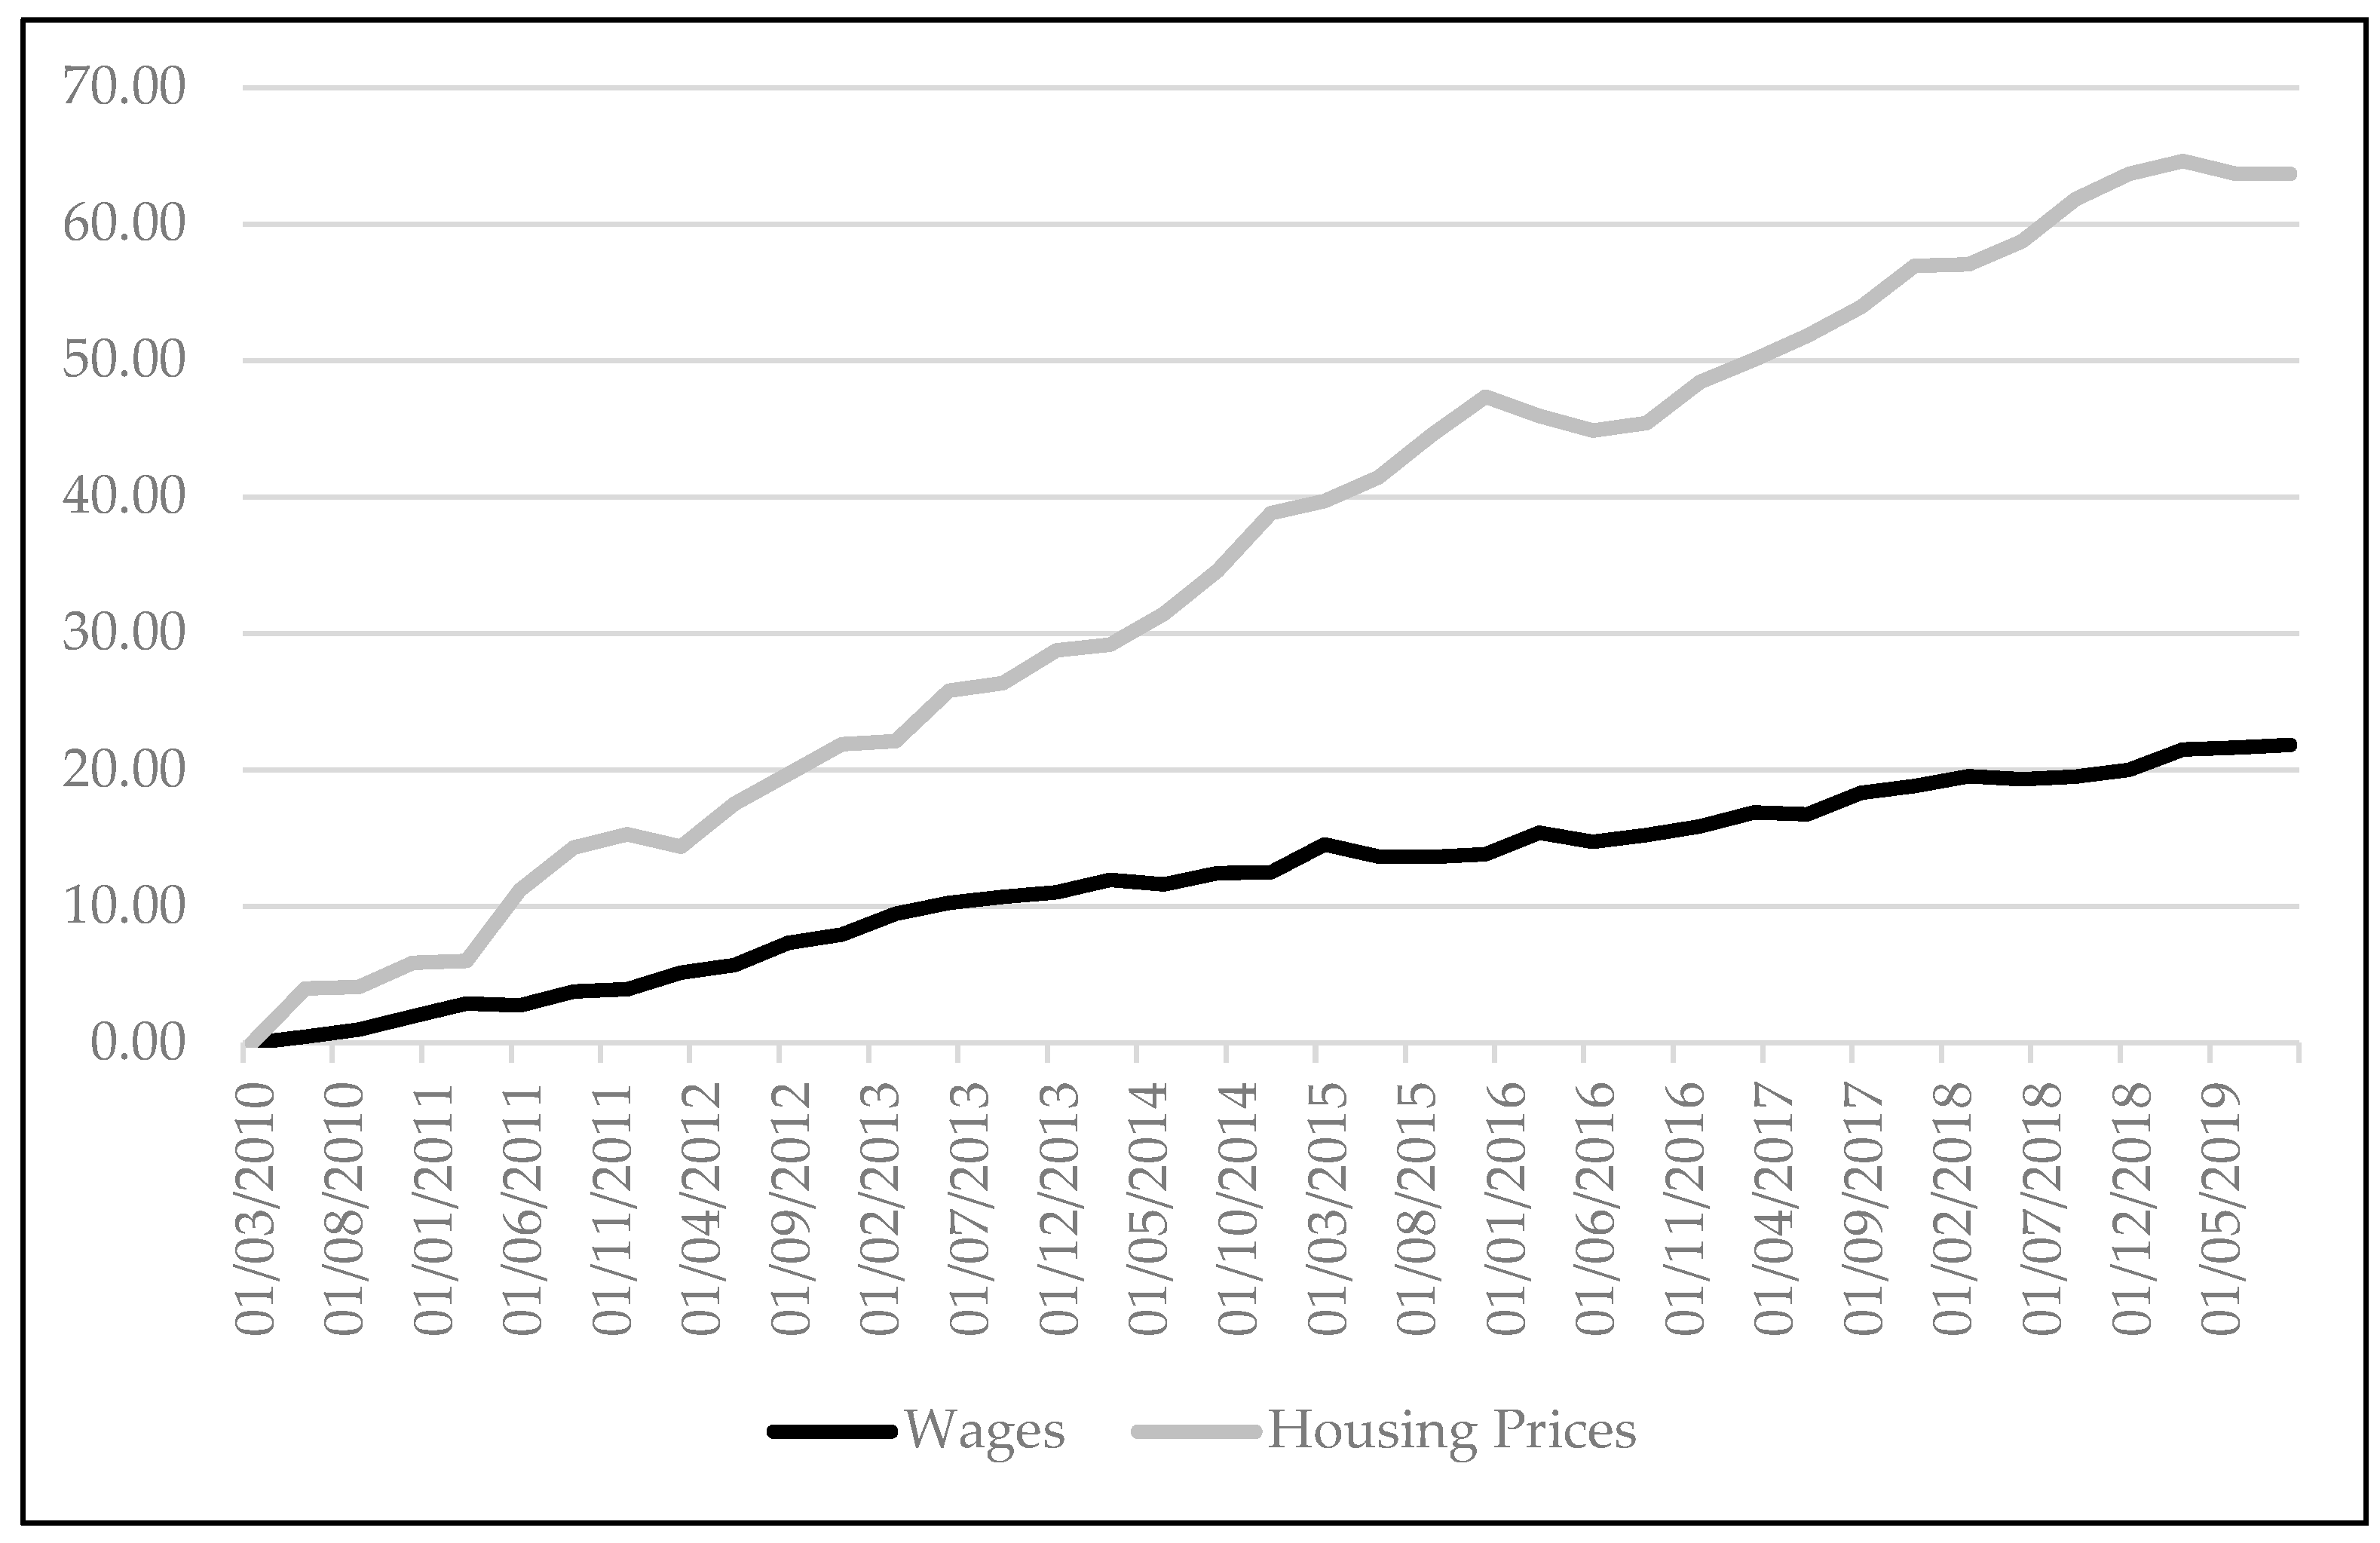
7]. The contradiction between high deficit and high production of housing units requires further discussion. Since 2010, the real housing price index has risen by 63.69%, while workers’ wages have only increased by 21.85% (
Figure 1).
According to the Central Bank of Chile, this situation is worrisome, given that high-income earners are doing some of the purchasing of new housing through debt mechanisms provided by financial institutions. This has been increasing the debt burden of households, where the most significant weight is now due to mortgage loans [
8]. Additionally, housing prices are uneven throughout the city, as is exposed in
Table 1. In this context, the role of financial institutions in the Chilean housing market was strengthened in 2001 through the reform of capital market regulations. Since then, a clear preference has developed among large companies for producing high-rise housing in sectors close to the central business district (CBD) or metropolitan public transport corridors. This has increased the financial exploitation of the land [
9]. The latter constitutes a characteristic of housing financing, in which a house is no longer seen as a home but as a financial investment [
10,
11]. In emblematic boroughs, such as Santiago, financialisation is represented spatially through an accelerated process of verticalisation of housing [
12].
Under the context of low regulation and neoliberalisation of urban development processes, housing is used for speculation [
13], while households face severe difficulties in paying the price of housing. In many cases, this ends up leading to overcrowding or people occupying land and developing informal housing [
14].
As indicated in
Table 2, a large part of households in Chile must spend more than 30% of household income on paying the price of housing, contravening the financial recommendations of households for this monthly expenditure [
16]. In the particular case of Santiago of Chile, the high price of housing against households’ ability to pay could have serious consequences if a housing market bubble is confirmed, as suggested by Gil-Alana, Dettoni, Costamagna and Valenzuela [
17].
Based on the information generated, we sought to contribute to the discussion on public policies that are moving forward the development of affordable housing for households in central boroughs with high urban value, as is the case of Santiago. The methodology was inductive, exploratory and quantitative research, which works with data obtained from unified official files for the specific study of a set of projects of diverse typology located in Santiago. Also, a systematic analysis was developed from the cost flow system on the price structure of high-rise housing projects located in Santiago. With this, the aim was to determine what their expected returns are at the time of elaborating on the proposals and which are the factors that are more likely to explain the price of housing. The results obtained in the study showed that a large part of the housing prices was increased by the expectations that the investors of the project had regarding at its initial. A second part of the study indicated that if the profit expectations are modified, the price of the house would be drastically reduced. The research was relevant due to the lack of data transparency in the Chilean housing market, where access to investment costs, land values, yields and house price formation are not part of the public discussion, even though this implies that many households are facing severe difficulties in paying for access to decent housing.
Study Area
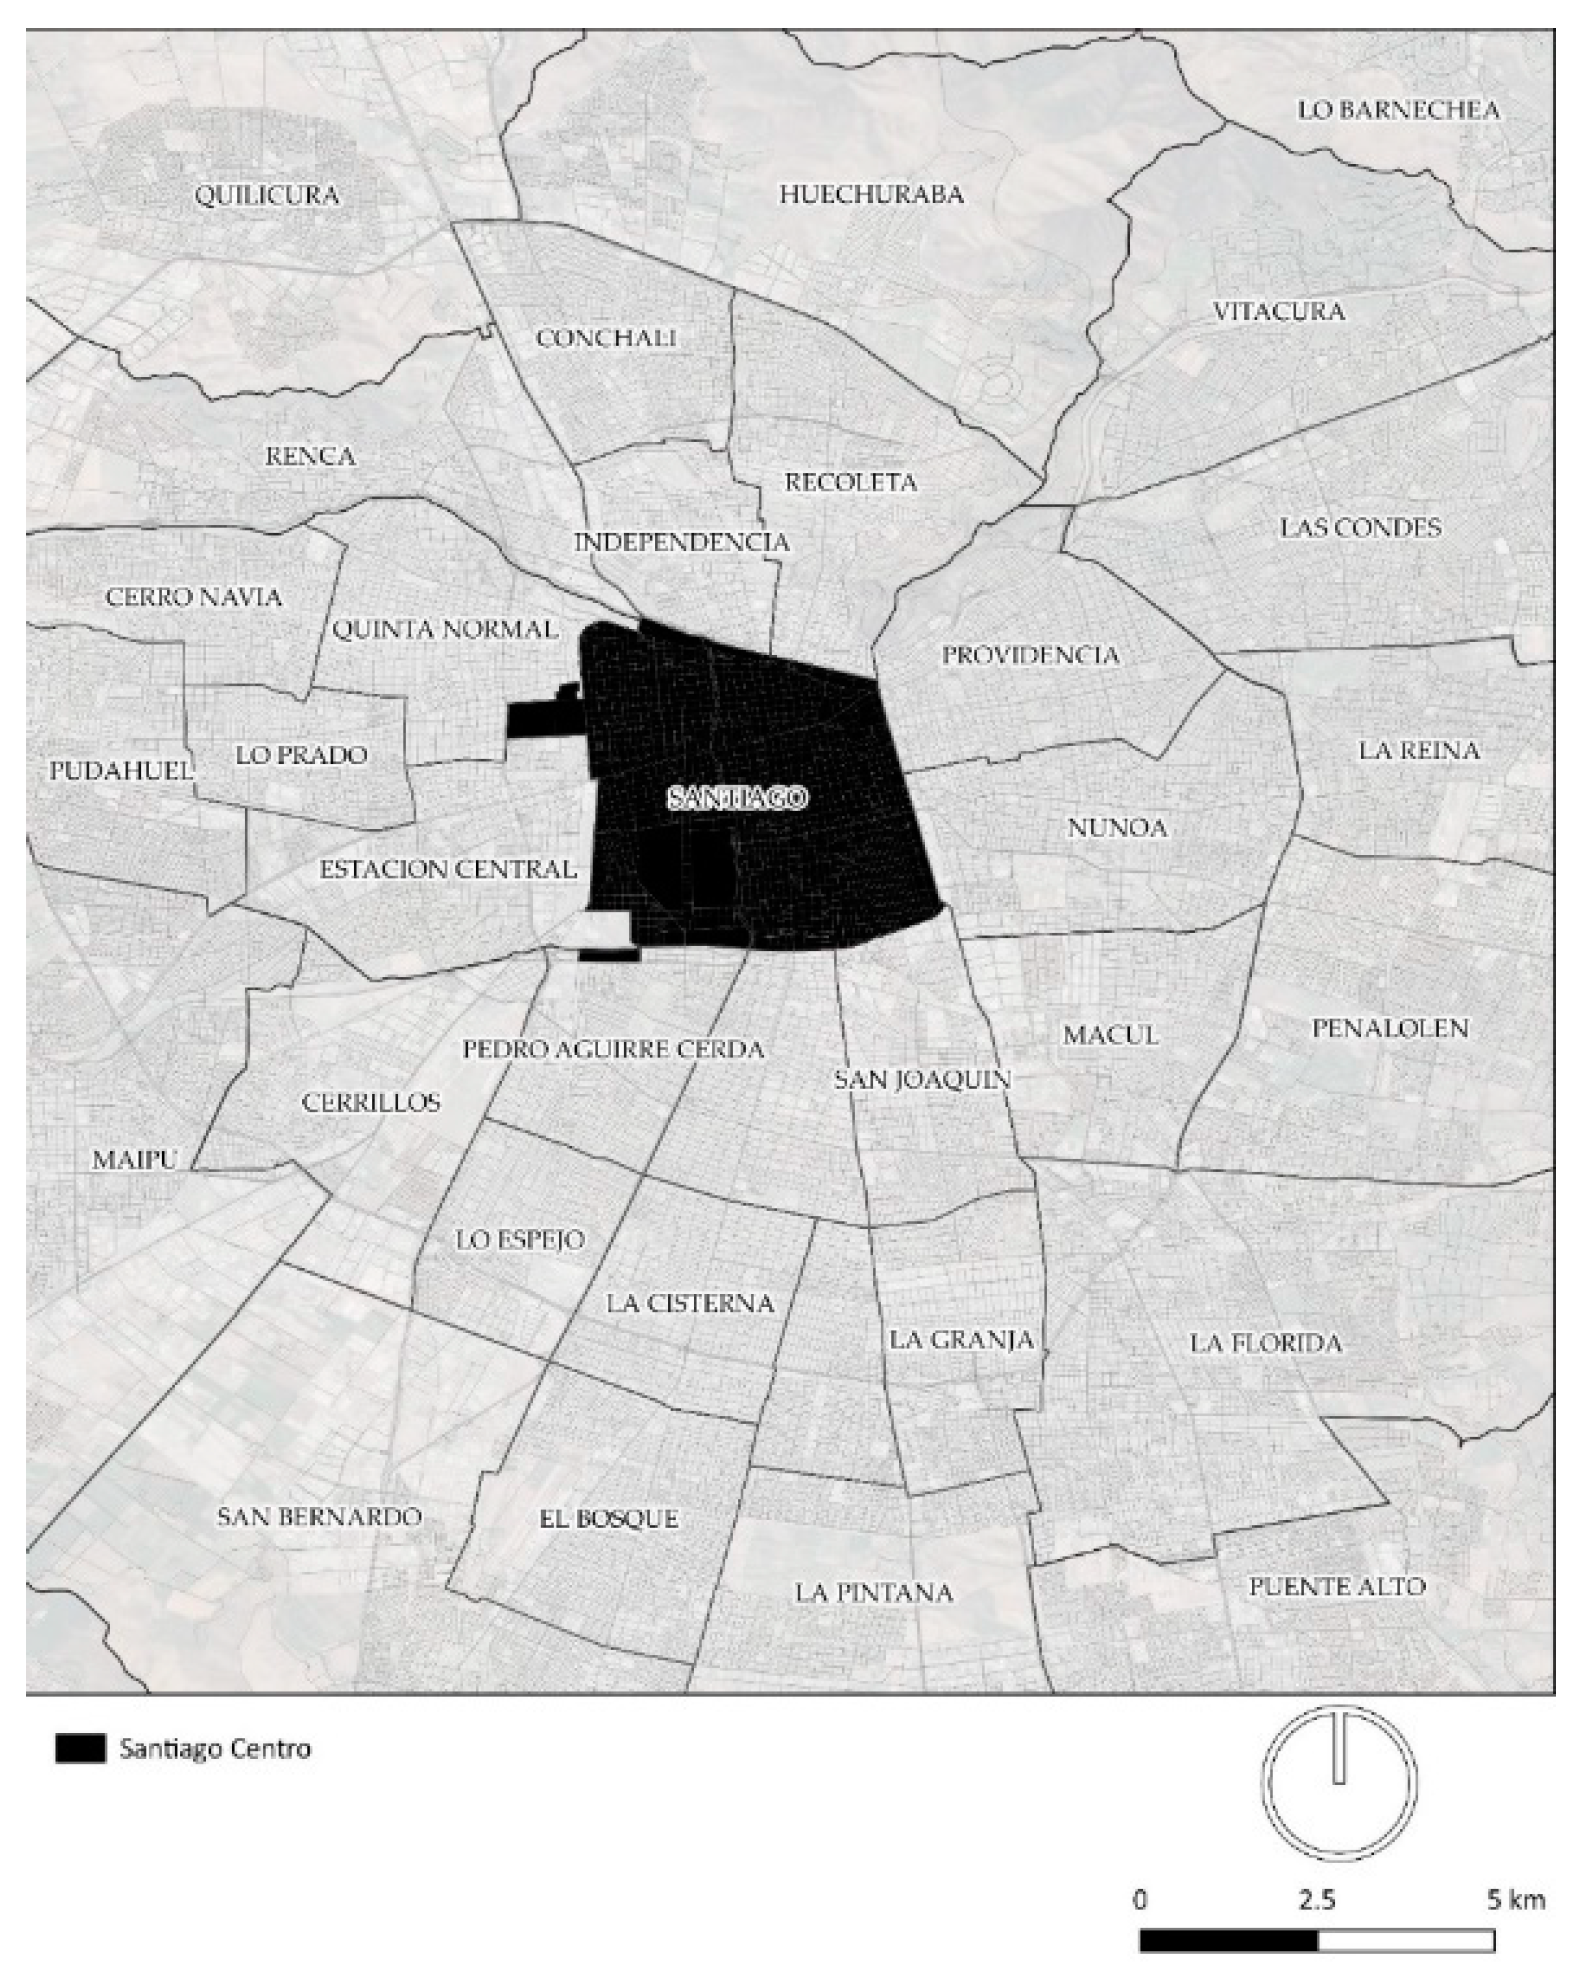
The borough of Santiago (
Figure 2) corresponds not only to the CBD but also to the historical centre of the capital of Chile [
19]. This condition had allowed it to attract the highest amount of urban workers [
20]. It is located in the centre of the Greater Santiago, and it concentrates the political centre of the nation, such as the main ministries, public services and the government palace. Its area is approx. 23 km
2 and its population are 404,495 inhabitants, according to the National Population Census 2017. Moreover, Santiago concentrates on a significant quantity of recent developments as a consequence of the earthquake of the year 1985, in the first instance, and of the aggressive process of urban renovation initiated in the year 2000 [
21].
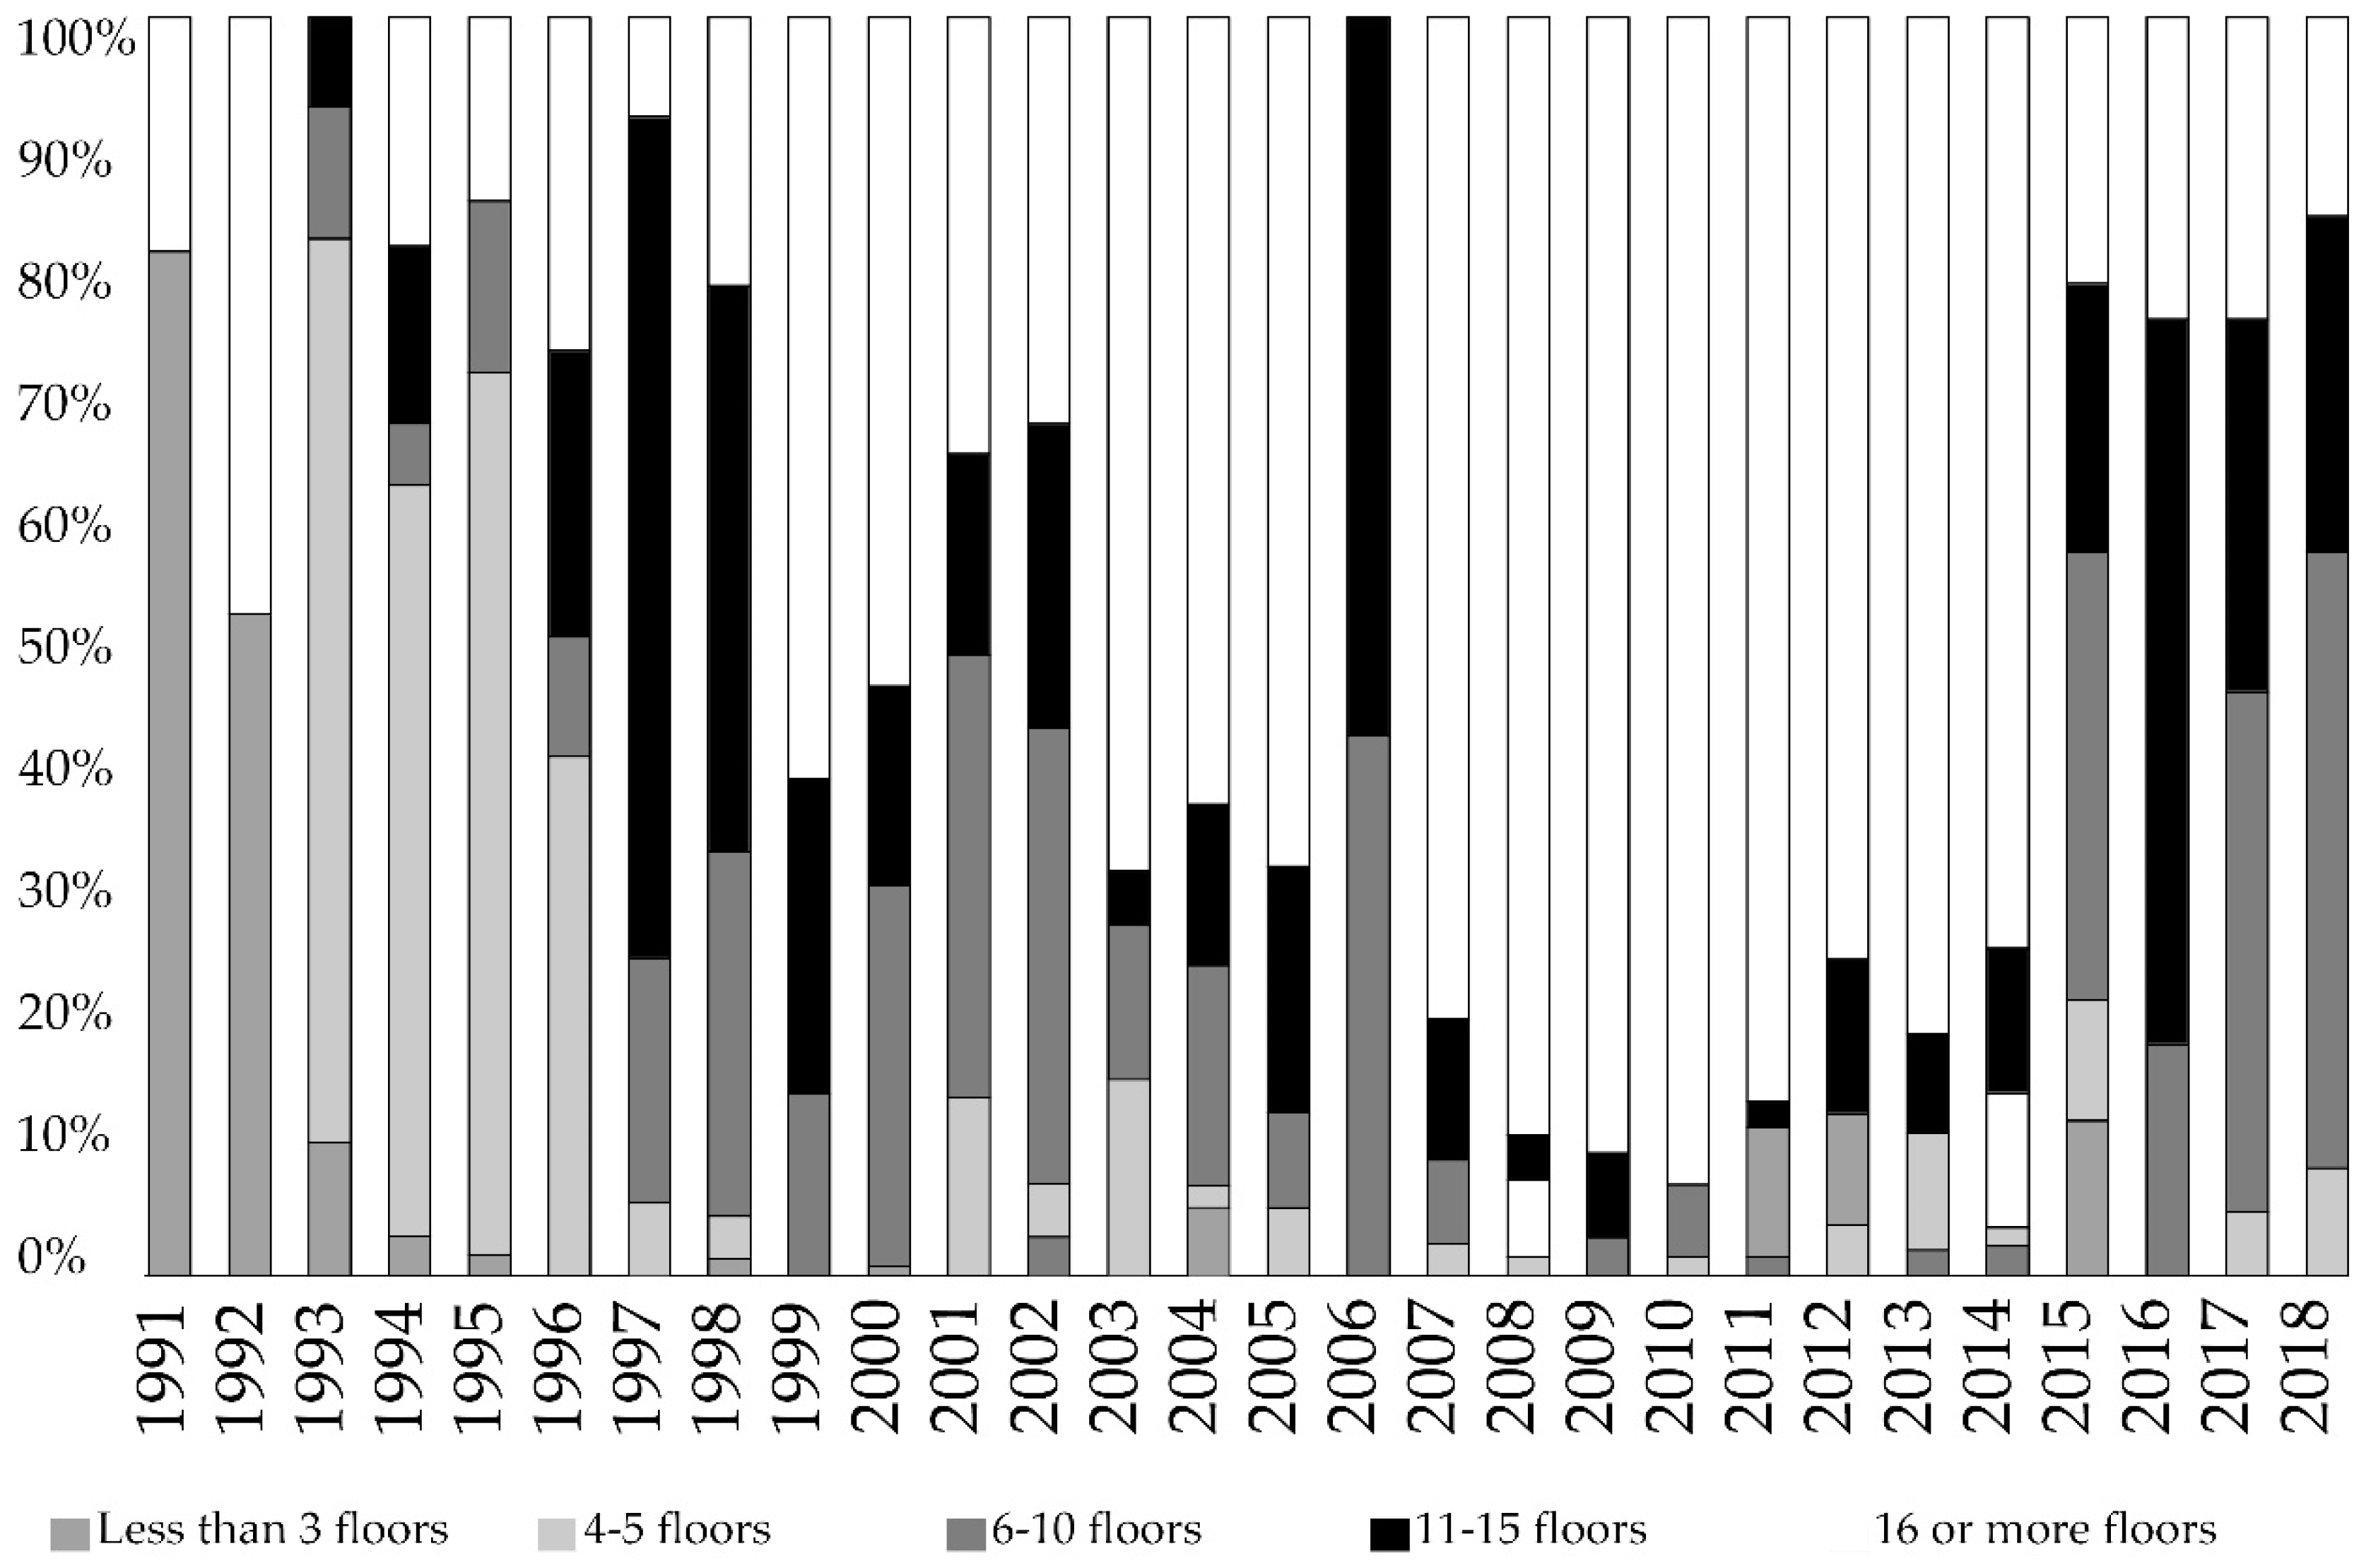
For the earthquake of 1985, Santiago suffered multiple damages in the buildings, at that moment mainly made of adobe, whose reconstruction took years due to the delicate economic situation of the country in those years [
22]. After the beginning of the transition to democracy, which begun in 1990, a repopulation plan was implemented that provided special subsidies for the purchase of apartments in the commune [
23]. This plan made it possible to occupy a large part of the land that had become vacant after the earthquake and generated significant pressure for the purchase of land for the construction of buildings. The typologies of these buildings varied over the years. First, constructions of up to five floors were built, and later, works on higher buildings were started. As can be seen in
Figure 3, there has been an increase in the heights of the approved building, highlighting that after 1995, buildings with less than three floors disappeared. In contrast, from 1995 to 2015, most records indicate that buildings of more than 16 floors predominated, marking a trend in the process of verticalisation of the city.
If we analyse medium-density buildings (up to 10 floors), medium-high-density buildings (those ranging from 11 to 15 floors) and high-density buildings (exceeding 16 floors), we would observe fairly defined cycles of medium and medium-high-density buildings, versus high-density buildings. In the period between 1991 and 2018 (
Figure 4), the presence of low-rise housing was practically nil after 1995. The plan to repopulate downtown Santiago advanced against the city’s expansive tendency towards its borders and determined a new urban form of the historic centre, replacement of residents and increase in the value of land that was capitalised mainly by real estate companies [
17]. In some sectors of the commune, these transformations began a process of gentrification due to the high values of the properties that were built on the land of former residents [
24]. With these socio-spatial conditions, recently developed literature has focused mainly on how subsidiary policies and local regulations have contributed to change the characteristics of the commune. However, little literature has explored how the prices of these new homes are configured in the private world [
24]. In part, this has been difficult due to the limited access to information in the Chilean housing market; however, most of the provision of this good is done by private actors.
2. Methods
The method sought to establish profitability expectations set by real estate agents to decide to invest in projects located in Santiago. For this purpose, a model was developed that consisted of 3 parts: a construction cost model, an income model and finally a general cash flow model of the project; this mechanism has been the most used by real estate companies when deciding whether to invest in a housing project [
25]. With this flow, the expected profitability of the projects was evaluated using a model of total financial efficiency, that is to say, it does not establish the separation between who the recipient of the profit is, if not the total profit for the total sale of the project. This profit was analysed through the internal rate of return (IRR), the net present value (NPV), the estimated periods for the return of the investment and the cost-benefit ratio of the investments from the profitability index (PI) [
26]. The use of this method is defined, to a large extent, by the possibility of accessing the data. It is a method widely validated by real estate developers both in Chile and in other nations, which allows the results to be comparable [
27].
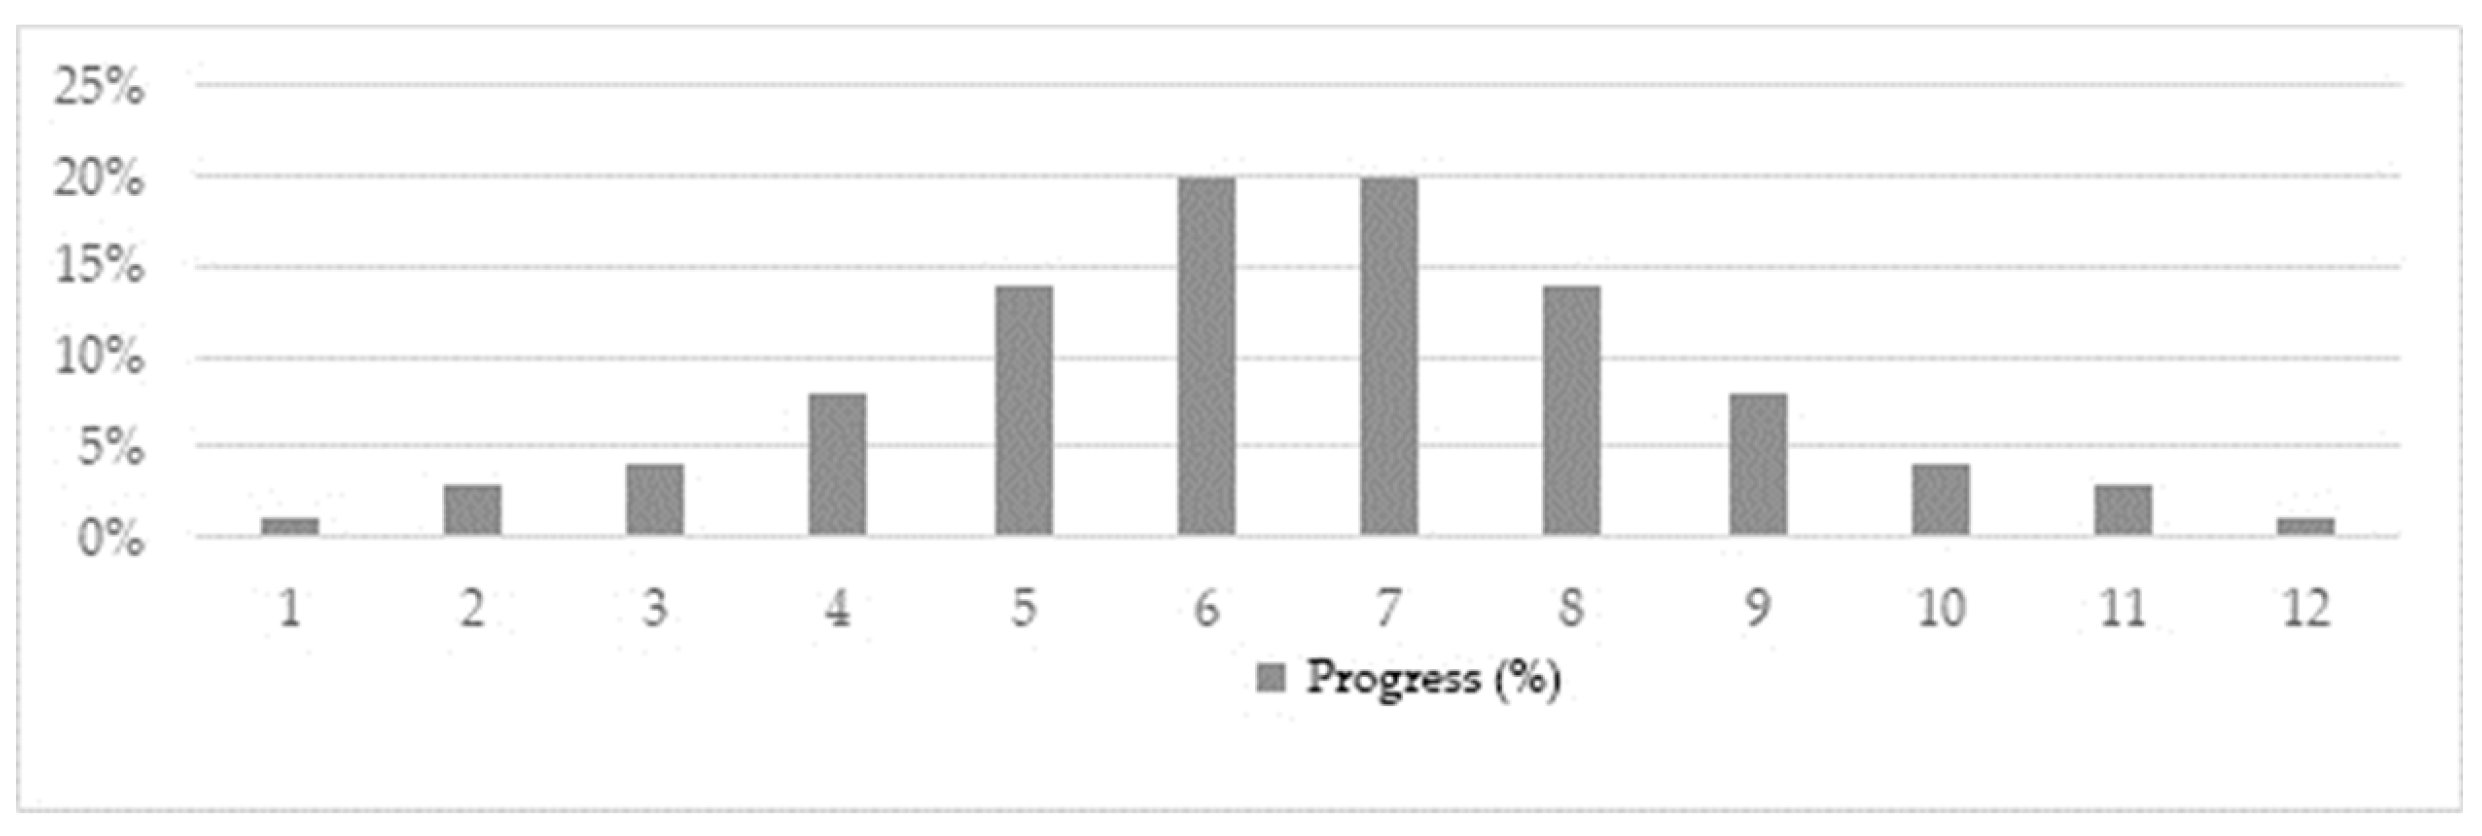
The construction cost model was based on a budget estimate associated with the level of terminations, equivalent to the replacement cost validation model of the Chilean internal revenue service (SII). Also, a rhythmic configuration of work progress was established, which transformed the total construction budget into a flow according to an ideal work progress, characteristic of high-rise construction, based on a S-curve model of construction project planning [
28], where most of the investment was on the temporary half of the project (
Figure 5). Considering the construction speeds in Chile, it is considered that the construction of the building would depend on the number of floors, advancing 1 floor for each month of advance. The rest of the flow was calculated from the sales speed of the project. It is important to mention that the sales speed of the project has also been elaborated based on data from each project. Finally, the profitability calculations of each analysed work were made on these flows.
The revenue model was to determine a start, end and pace of sales in a given period. As an assumption, the sales speed declared in the InCiti platform database was considered and contrasted with the data declared by the Chilean construction chamber. The assumption that monthly sales develop steadily based on the sales rate recorded until the stock of available housing is exhausted was used.
To summarise, there were three key moments in this estimate, the start of green sales, the completion of the work and sales once the work is completed. For the case of Santiago, the start of the construction process also starts the sales (opening of the department for sales or pilot for the third month) to the completion of work and municipal approvals (duration of construction works plus three months). In Chile, it is customary for real estate projects to sell green, accruing 20% of the value of the home in the month of sale and displacing the remaining 80% to the period immediately following the municipal receptions of the terminal works. In other words, the green foot is charged, and the remaining 80% is paid after the municipal reception for the total of the department. We had not considered discounts or offers, but fixed values based on transactions registered at the land registry. After the receptions of finished work, the units are sold, accruing the total of its sale price. For this model, the average cost per square meter of sale was assumed according to the data of each existing department.
The financial evaluation model was carried out through a cash flow construction exercise, considering the initial period (zero), the value of the land purchase, project expenses and permits. For monthly periods, the flow of income and expenses were calculated before the IRR and NPV indicators.
It is important to mention that the housing market in Chile does not function based on transparent data. On the one hand, housing prices are only recorded on paper (not digital) files that are stored by real estate curators, depending on each territory; in this case, Santiago. On the other hand, the amounts of investment in construction are not publicly registered by all companies. This is only mandatory for large projects, which is incorporated into the environmental evaluation system when entering projects to be evaluated and approved. The company itself provides this information. Another limitation is that the fiscal appraisal of real estate is completely distanced from the commercial appraisal of the same. This means that, among other things, real estate transactions pay taxes against the tax assessment, so that the Internal Revenue Service does not necessarily handle information on the commercial costs of building works. This has led to some methodological decisions being made on how to deal with the evaluation of each project.
The following sources were used to obtain the data:
Conservador de Bienes Raíces de Santiago, a public entity that registers property transactions in the city, indicating personal data of those who carry out the transactions, values, dimensions and general characteristics of each property. This information was obtained from data collected by InCiti.com.
Speed of sale of the properties to determine their construction times prepared based on data from the Chilean chamber of construction and the background of project progress collected by InCiti.com.
The definitive amounts of investment by projects were not available for each of the cases, but it served to test the veracity of the data obtained from other sources to review whether the announced investments were in accordance with the calculated returns. For this information, the environmental assessment service of the ministry of the environment was consulted.
For the estimation of construction costs, we developed a calculation based on data obtained from the catalogue of construction activities ONDAC (the national index of construction costs) and the estimation tables developed by the internal revenue service and the ministry of housing and urban development. Depending on the volume constructed, we used a construction value of USD/m2 estimated at 890.5 to 990 for the construction above level 0; and 672 USD/m2 for the construction of subways. These values were net.
For estimating the income from sales projects, the commercial value advertised on specialised websites (portalinmobiliario.com and toctoc.com) was used, contrasting it with the transaction information indicated in InCiti’s databases and in the advertisements of the companies that commercialised their works.
To the final investment costs, the expenses corresponding to advertising and sales, consulting and project design were added.
To illustrate the role of financial entities and their impact on the profitability of a project when it requests bank loans to execute the works, a set of results was developed that exposed some projects with bank financing, indicating their percentage of total investment and others only based on own resources.
More details about the sources of data are presented in
Table A2.
2.1. Reconstruction of the History of Evaluated Projects
Given that the housing market in Chile lacks data transparency, the reconstruction of values for each project followed a detailed process illustrated below based on a case revised (N°1). This is a 1- and 2-bedroom building, from which the real estate company expects profits of UF 60,632,676. In our evaluation, the expected profits were complemented with transactions information, and we corrected the sales amount by 9.09%. The profits above were declared in the annual report of the company for 2018. This report is available in the Chilean commission for the financial market. Having these expectations of profits as a reference, we gathered the info of the project: blueprints, building permits, environmental impact statement and transactions in Santiago’s property registry archive (CBRS). As a general context, the project is regulated by a communal master plan (plan regulador comunal or PRC) of Santiago’s borough. The project we assessed obtained its building permit on 18 June 2018, adopting to the standards indicated in the certificate of previous reports (CIP) number 153.610 of 2016 (declaring that the building was placed in the Zone B of the PRC of Santiago). This project was designed with 546 apartments to be sold, with an estimated cost of 2691 USD/m2 for each one. In other words, the average cost of each apartment of 35 m2 would cost USD 107,888. In the environmental evaluation system (SEA), the company declared that the investment to execute the project was USD 27,481,563, which served to have a general idea of how much money the company invested to the whole production process. To test this amount, the land cost dimensioned in 4.612 m2 was tracked and listed in the register of the Internal Revenue Service with the Indexation Number 634-3 to 634-9. The sale value of the land registered in the CBRS was USD 9,710,885. The features of the building indicated that it had 6 different types of apartments, on 12 floors, covering 19,317 m2 for sale, plus 208 parking lots and warehouses sold at USD 15,831 and USD 2177, respectively. This was the way we approach to gather the whole information about costs and cash-flows. Then, we simulated the profitability of each project, applying a cash-flow analysis.
It was considered a construction flow based on the S-curve model: one floor constructed per month and concentrating the most intensive production in the middle of the timeframe. According to the speed of sale recorded for this project, the sales took 25 months. To calculate the construction costs, we referred to 871 USD/m2 for housing areas and 594 USD/m2 for underground construction. No financial loans were considered for this project.
All data could be consulted in the sources of origin. Finally, the profitability of the project was evaluated by net present value, internal rate of return and cost-benefit analysis. This detailed research procedure was applied to each project presented in the table.
2.2. Analysis Techniques
On the main financial analysis techniques used in this document, the net present value, the internal rate of return and the cost-benefit analysis were detailed.
The net present value is a procedure that calculates the present value of a certain number of future financial flows generated by an investment. It is calculated by applying a current discount rate to all future cash flows, simulating what the gains would be if the cash flows were brought to the present to compare these gains with the initial investment. The discount rate (d) is the result of the product between the weighted average cost of capital (WACC) and the inflation rate for the period. For these projects, a discount rate of 12% was applied based on the reference usually employed in Chilean real estate business assessment [
25]. If the NPV was greater than 0 (i.e., exceeds the initial investment), the project was considered a recommended investment.
The NPV formula is:
where,
For complementing the profitability analysis based on the NPV, a profitability estimate was applied to each project according to the internal rate of return IRR. The internal rate of return reviews the geometric mean of the return on investment to determine the value of the opportunity. The higher the internal rate of return, the higher the expected return on an investment, which thus determines whether the investments are worthwhile or not.
Its calculation is based on the following formula:
where,
Finally, the profitability index (PI) was calculated to determine the cost-benefit ratio of the investment. This is a calculation that is carried out using the NPV and offers a third analysis factor on the profitability of the projects to be analysed. It is a simple method that is developed based on the following formula:
where,
PI = profitability index
NPV = net present value
I = investment I.
Monetary values were expressed in USD. As a synthesis, the evaluation of total construction costs was done following the cost structure model presented by Dr Julio Aznares in a publication that was developed under the auspices of local real estate companies and, therefore, we understood that it was a model validated by the local industry [
25]. The cost structure and details how the data were obtained could be consulted in
Table A3.
From the information of the autonomous income of the household for the Santiago (MIDESO, 2018), it has been possible to determine what the weight of the purchase of the dwelling would be in relation to the payment capacity of the households. In order to carry out this evaluation, a credit with an annual rate of 4% was simulated, for 30 years, for the total cost of ownership. It is important to mention that, since the 2008 crisis, in Chile, financial institutions do not deliver loans for 100% of the value of properties, so this exercise was carried out to represent how much the weight of the housing payment varies in a household when returns are adjusted. For this purpose, a specific exploration was also carried out on the possibility of reducing sales prices to adjust yields measured in CIRR between 12% and 16% while maintaining a positive NPV and PI. These adjustments were made on the sales price per square metre of the projects.
3. Results
The systematic evaluation of 15 projects was carried out in order to ascertain their presumed cost-effectiveness about their initial evaluation.
Table 3 presents the cases, and
Table 4 summarises the expected gains for the projects analysed in the commune of Santiago Centro. On average, the projects evaluated had 16 floors, the earnings measured by the net present value of USD 7,139,245 and a corrected internal rate of return of 88%. Not all projects were evaluated based on bank loans. This was done to illustrate how the profitability and risk of projects varied when incorporating the share of bank financing.
From
Table 4, it could be reviewed that high land value was not necessarily related to the profits obtained and to the same price of the dwelling. In the evaluation of the weight of these values of the housing on the payment capacity of the households, it was identified that they represented 35% of the average of the autonomous income of the household in the commune of Santiago Centro. In an evaluation of the cost of a department of 50 m
2 for the projects, an average price of USD 132,030 was arrived at, which was averagely equivalent to 73 monthly household income, or 6 years of income per household. As a methodological exercise to explore whether companies could offer homes at lower prices without losing investment returns, a change in the selling price per square meter of each project was applied. In average, the reduction of housing prices was 29%, compromising a 25% reduction in profitability measured by PI. The detail of the transformation after lowering the price per square meter sold is presented in
Table 5.
As shown in
Table 5, the price formation for marketing gave an account of prices that could be reduced without sacrificing appropriate profitability. This reduction, then, would be adjusted to the needs of increasing housing accessibility in a context where the structural housing is a deficit in Chile. Moreover, the evaluated commune is Santiago Centro, which concentrates most of the jobs on the metropolitan level with great availability of public goods and also presents significant amounts of investment in urban facilities and infrastructure. It also has a growing rental market [
29], which pushes the price up.
An adjustment in the price of housing would allow the weight of the mortgage payment on the average household budget to fall from an average of 35% to 25%, thus contributing to the development of a better household economy. It is also possible that a reduction in prices could reduce rents and thus improve accessibility in households that do not have the possibility of buying an apartment to live in.
Even so, the problem of the high price of housing in a context of acute structural housing deficit, under a context of price deregulation, would require greater exploration in the area of public policies that tend to improve the competitiveness of housing values, which expands the possibilities of access for middle- and lower-income households to consolidated areas of the city.
4. Conclusions
A report by Leilani Farha (UN special rapporteur on housing) indicates that the commodification of housing in Chile jeopardises its universal access. She argues that the lack of regulation of the housing market harms households stability [
30]. One of the main origins to ensure housing affordability in Chile is related to the high profitability of some companies in the industry. Companies could have lower prices without losing breaking the business. More active involvement of the state is desirable in the formation of prices by, for example, participating in the process of housing production in a non-profit scheme in order to compete with commercial solutions. Nowadays, the law allows this kind of involvement but only at the municipal level, and it would be broadened to benefit other state divisions.
In the 1920s, for example, there was a social organisation in Chile known as the Liga de Arrendatarios (League of Tenants). They organised as a political body to not pay the rent for a few months because it was excessive. For instance, a dwelling without windows exceeded 80% of the worker’s monthly income. This social movement led to the implementation of the Decree-Law number 261/1925, which regulated the price of housing by limiting the housing price according to household income and protected tenants from evictions [
31]. Another relevant example occurred in 1967 when President Eduardo Frei Montalva modified the Constitution through Law 16.615. This law established that private property was subordinated to the social role of land. This modification facilitated the process of planning projects of high public relevance. Among them were diverse, affordable housing projects that until today could be seen in consolidated neighbourhoods of the city of Santiago. In these projects, the state acted as an urban developer, organising the demand but also defining the terms to build new housing. Therefore, the state was more an executor than a controller of the urban process, and even the profitability of business was defined in the contracts [
32]. The state, as a producer of housing rather than a funder or a witness, seems to be key to create more affordable units.
On the other hand, there is a dynamic at the level of business controllers that open up new possibilities for future research. It would be relevant to review the interests of shareholders that have such an impact when it comes to establishing the expected returns for projects. We suggest investigating the board agreements of large companies (all public at the Commission of the Financial Market website). Also, we recommend developing a series of interviews to unpack another aspect of real estate profitability. Possibly, the profitability expectations will depend on company size rather than the scale of individual projects.
Chile subscribed to the New Urban Agenda, where states are called to address the problem of housing affordability and improve the public-private partnership to these objectives [
33]. Part of these commitments are already inscribed in the new National Urban Development Policy [
34]; however, this new regulatory framework has progressed quite timidly. One of its recent advances has been the project to modify the General Law on Urban Planning and Construction. This modification establishes conditions for densifying strategic areas of cities. Nevertheless, this regulation has raised some doubts because of the excessive protagonism given to real estate companies in the design of the norm. Also, the norm gives much decision-making power to the minister of housing and urbanism. In practice, he/she could decide where to change the urban regulation without need to consult local communities [
35]. Even so, the problem of access to housing in Chile is on the current political agenda, and housing prices should not be left out of the discussion in the future development of urban policies.


