Article

Methods for Determining Mold Development and Condensation on the Surface of Building Barriers

by
Aleksander Starakiewicz
,
Przemysław Miąsik
,
Joanna Krasoń
and
Lech Lichołai
*
Department of Building Engineering, Rzeszow University of Technology, ul. Poznańska 2, 35-959 Rzeszów, Poland
*
Author to whom correspondence should be addressed.
Buildings 2020, 10(1), 4; https://doi.org/10.3390/buildings10010004
Submission received: 6 December 2019 / Revised: 23 December 2019 / Accepted: 25 December 2019 / Published: 30 December 2019

Abstract

:
The article presents four equivalent methods for checking mold growth on the surface of building barriers and checking water vapor condensation on their surface. Each method applies to two parallel phenomena that may occur on a building barrier. The first method is to calculate and compare temperature factors. In the second method, the characteristic humidity in the room is calculated and compared. The third method is to calculate and compare the characteristic temperatures in the room. The fourth method is based on the calculation and comparison of characteristic water vapor pressures. Three boundary conditions are presented for each method and phenomenon: when a given phenomenon can occur, when it begins or ends, and when it does not occur. The presented methods systematize the approach to the problem of mold development and surface condensation. The presented calculation results relate to the selected building barrier functioning in specific indoor and outdoor climate conditions. The calculation results confirm the compliance of the presented methods in identifying the phenomenon of mold growth or condensation on the surface of the barrier. A graphical interpretation of the results for each method with periods of occurrence or absence of a given phenomenon is also presented.

1. Introduction

The development of mold and/or condensation on the surface of building barriers are physical phenomena that occur in various types of buildings, mainly on their internal surfaces. These phenomena are harmful to the functioning of building barriers, but also to residents or users due to mold fungi growing on their surface [1]. They cause the formation of disease entities such as allergies and allergic reactions in humans and animals, and the occurrence of a specific smell.
These phenomena occurred very sporadically in the past; nowadays they are quite common in buildings for various reasons [2,3,4]. In the current period, when buildings with a higher number of sealed off areas and thermal insulation of external barriers are erected (more comfortable barriers due to the higher temperature of their internal surfaces), these phenomena appear more often and are even more disturbing [5].
The reasons for these phenomena have been described in the article on alternative methods of determining mold risk [5]. These include: external climate [6], construction [7], geometry, technology, and quality of the barrier [8,9], and the internal microclimate [10,11]. In addition, the way the rooms are used, the arrangement of the furniture and their installation can affect surface condensation and mold growth on the interior surfaces of the walls. In the article [12] an analysis of thermal conditions occurring around built-in furniture in living rooms was carried out. The analysis covered both the summer and winter periods, because during these periods there was a phenomenon of condensation and mold on the internal surfaces of the walls from the construction side. The results confirm that the impact of mold on the internal surface of the walls is influenced by the way the residents use the rooms, as well as the lack of adequate ventilation between the wall surface and furniture. Increasing the temperature of the inner wall surface above 16 °C would reduce the risk of condensation on this surface [12]. In general terms, it comes down to the relationship that occurs between the parameters of the internal microclimate affecting the barrier and temperatures on the surface of the barrier. If mold growth occurs on the barrier surface and the standard parameters of the internal microclimate are maintained, the reason for this phenomenon is usually on the side of the building barrier. The opposite situation may occur when the barrier has standard parameter. The reason then is usually on the side of the internal microclimate. It is often difficult to indicate one cause, as the occurrence of mold growth can be caused by both the building barrier and the internal microclimate. In any case of mold, corrective actions must be taken to eliminate the cause. When the problem of condensation appears in the barrier, various solutions should be applied to repair or modify the structure of the barrier [8,13], at the same time stabilizing the temperature of the internal surface of the barrier, and additives may be applied to modify this barrier [14,15]. Such solutions will also improve the indoor climate, reducing room temperature fluctuations.
Over the past decades, the approach to the design of building barriers has changed in terms of avoiding surface condensation. The standard requirements are also changing, which, due to the need to reduce CO2 emissions to the atmosphere, require newly designed buildings to be more airtight and have better thermal insulation. At the same time, there are still older facilities that do not meet the requirements for new facilities. That is why (with a similar method of use) older buildings function differently due to the lower insulation of external barriers and windows which are not well sealed, as opposed to new buildings with high insulation of external barriers and very well-sealed windows.
In older buildings, a frequent cause of condensation was the thermal bridges at the junctions of the external walls with the horizontal structural elements of the building [16,17].
Currently, the problem is among others, the risk of condensation forming on the outer surface of the window. The authors in article [18] linked the increase in condensation on the external surface to the increase in the insulation of these windows and climate change. To reduce the formation of condensation, additional shading elements on the windows directed towards the sky have been proposed, which would limit the condensation of water vapor on the external surface of the glazing in the morning. In the article [19], the authors attempted to determine the rate of surface condensation on cold glazed surfaces of building elements. The tests were carried out in a full-sized test chamber, using imaging techniques to analyze the appearance and increase of surface condensation on glazed surfaces.
The type of window frame used has an additional effect on the formation of condensation and mold. Appropriate use of profile types will reduce the risk of the above problem. In the article [20], the authors, using computer simulations, compared different types of window frames to assess the risk of surface condensation on the example of double-sliding double-glazed windows.
The thermoplastic spacer with its size optimization and the insulation cover inserted into the window frame and window frame size were evaluated. The biggest impact on reducing the risk of condensation is the introduction of a spacer with a smaller area with an enlarged air gap between the panes and an increase in the size of the window frame. Both of these elements favorably increase the temperature in the areas where the glazing joins the frame.
The problem of mold growth and surface condensation appears periodically, often in buildings after retrofitting of external barriers. This condition is worrying because these phenomena, instead of disappearing completely, actually get worse in some cases. The task to be considered is the adoption of such a method of checking the functioning of the heat and humidity processes of the barrier as to allow a reliable assessment of the possibility of surface condensation and mold growth on the surface of the building component under certain climatic conditions and of the internal microclimate.
To analyze the above problem, various methods can now be used, such as computational [18], experimental [8,19], and computer simulations [21,22,23].
Currently, according to PN-EN ISO 13788 [24], to check the development of mold on the surface of a building barrier, one method is defined and acceptable, while there are no other alternative methods in this area. The method given in the standard [24] boils down to a comparison of two temperature factors: the temperature factor fRsi resulting from the insulation of the barrier (its construction), and the factor fRsi,max resulting from the humidity conditions prevailing in the room in the so-called critical month. In order to meet the design condition (to eliminate the risk of mold growth), the minimum thermal insulation of the barrier RT,min or the maximum value of the heat transfer coefficient Umax need to be calculated. In practice, this involves the need to modernize the barrier, which in turn leads to the generation of costs for the task.
Considering the above, an attempt was made to compare different conditions for mold development and surface condensation and to define when a given phenomenon occurs, when it starts and when it does not occur. Then, for each condition of the occurrence of the relevant phenomenon, what is to be done to eliminate it is given, and calculation algorithms for how to implement it are given. Presented, among others, is the applicable standard condition related to the fRsi parameter, the calculation of internal humidity φi, humidity of the beginning of condensation φi,con, the permissible humidity in the room φi,max, with observance of the standard condition to avoid mold growth, the external temperature eliminating condensation Θe,con, and the minimum thermal insulation of the barrier eliminating condensation Ucon.

2. Materials and Methods

2.1. Methods for Preventing Mold Growth on Building Barriers

Determining the phenomenon of mold development on a building barrier will be presented for four different methods:
  • the first method (M1) involves the procedure for determining the temperature factors fRsi and fRsi,max;
  • the second method (M2) consists of comparing the relative humidity of air φi,max and φi;
  • the third method (M3) uses the comparison of barrier temperatures Θsi and Θsi,min;
  • the fourth method (M4) consists of comparing the air vapor pressures pi,max and pi.
For each of the methods, a design condition was formulated to avoid mold growth on the building barrier.

2.1.1. M1—Avoiding Mold Growth on the Basis of Determining the Minimum Allowable Temperature Factor fRsi,min-Procedure According to PN-EN ISO 13788 [24]

According to this method, in order to avoid mold growth, the relative humidity of the surface should not exceed 0.8 of the actual water vapor pressure in the room for several days [24]. When calculating the risk of mold growth using the standard method, monthly average values (temperature, humidity, etc.) should be used.
For each month of the year:
  • Define the average monthly value of the outside air temperature Θe.
  • Define the outside air humidity: the average monthly water vapor pressure can be calculated using the equations:
    p e = φ e p s a t ( Θ e )
    • pe—average monthly water vapor pressure;
    • φe—average monthly relative humidity of air;
    • psat—pressure of water vapor at saturation;
    • Θe—average monthly value of the outside air temperature
  • Determine the indoor air temperature Θi (according to the purpose of the room according to national standards)
  • Calculate the partial pressure of water vapor in the room pi on the basis of Δp or take the relative humidity in the air-conditioned room as constant, taking into account the correction for the safety margin:
    Based on the internal humidity class (from 1 to 5):
    p i , I S O = p e + Δ p 1.1
    Δp-excess internal water vapor pressure (according to Annex A [24])
    Based on relative humidity in the room (φi):
    p i , I S O = ( φ i + 0.05 ) p s a t ( Θ i )
    φi-assumed average monthly value of relative humidity of the indoor air
  • Calculate the minimum permissible pressure of saturated water vapor on the barrier surface psatsi) (corresponding to the surface temperature, Θsi). The maximum permissible relative humidity on the surface is assumed φsi = 0.8:
    p s a t ( Θ s i ) = p i , I S O 0.8
  • Determination of the minimum permissible barrier surface temperature Θsi, min (based on psat Θsi):
    p s a t ( Θ s i ) ( I S O [ 24 ] A n n e x E ) Θ s i , m i n
  • Calculation of the minimum allowable temperature factor fRsi,min:
    f R s i , m i n = Θ s i , m i n Θ e Θ i Θ e
  • Determination of the critical month and fRsi,max (fRsi,max is the highest value of fRsi,min from 12 months).
  • Design condition:
    f R s i > f R s i , m a x
    f R s i = U 1 R s i U 1 = 1 U R s i 1 U = R T R s i R T
    • RT—thermal resistance of barrier;
    • Riheat transfer resistance on the internal surface.
  • If the design condition is not met, we calculate the minimum thermal insulation of the barrier RT,min, or maximum value of the heat transfer coefficient Umax:
    f R s i , m a x = R T , m i n R s i R T , m i n           R T , m i n = R s i 1 f R s i , m a x
    f R s i , m a x = 1 U m a x R s i 1 U m a x           U m a x = 1 f R s i , m a x R s i
Based on the design condition, it is possible to determine the difference between temperature factors in the following months of the year: ΔfR = fRsi−fRsi,min. A positive value (ΔfR > 0) means no risk of mold growth but also shows a reserve of safe barrier function. However, a negative value (ΔfR < 0) means a threat of mold growth and shows the depth of this phenomenon in the critical month and other months.

2.1.2. M2—Avoiding Mold Growth on the Basis of Determining the Permissible Humidity in the Room φi,max

If there is a risk of mold growth, it is also important to answer the question: “what is the permissible humidity in the room φi,max, so that there is no mold growth on the wall surface and that the standard condition is observed”. According to the standard procedure, if the design condition is not met, the minimum thermal insulation of the barrier or the maximum value of the heat transfer coefficient (Equations (8) and (9)) needs to be calculated. This is a one-way procedure because it gives the user no alternative. It boils down to increasing the thermal insulation of the barrier, that is, carrying out retrofitting. This means that mold development will be eliminated only after these construction works have been carried out. This treatment requires time, an appropriate period of the year to carry it out, permission to perform (historic buildings) and considerable funding. However, the user expects to eliminate this phenomenon as soon as possible, recommendations for use and financial estimates. The following method gives this possibility.
Consider the situation when condensation begins (or ends) on the wall surface, it is possible to write it with the following equation:
Θ c o n =   Θ s i =   Θ d p , c o n
This means that when the condensation start (end) temperature Θcon occurs, the surface temperature of barrier Θsi and the air dew point temperature Θdp,con are equal. Of these three quantities, the easiest way is to determine the surface temperature of barrier Θsi. It is calculated using the temperature factor fRsi or the heat transfer coefficient U. The temperature factor of the barrier fRsi is given by the formula:
f R s i = Θ s i Θ e Θ i Θ e
By transforming Equation (11) and taking into account Equation (10), it is possible to determine the temperature of the barrier surface at which the condensation process begins:
Θ s i   =   f R s i   ( Θ i     Θ e )   +   Θ e   =   Θ c o n =   Θ d p , c o n
Using the heat transfer coefficient U, you can calculate the surface temperature of the barrier at which the condensation process begins using the equation:
Θ s i   =   Θ i U · ( Θ i     Θ e ) · R s i =   Θ c o n =   Θ d p , c o n
Based on the calculated septum temperature Θsi, we determine the condensation pressure pi,con (equal to the saturated water vapor pressure related to the septum surface temperature) [2]:
Θ s i   ( I S O [ 24 ] )   p i , c o n =   p s a t ( Θ s i )
To prevent mold growth, the permissible water vapor pressure in the room, pi,ISO can be 80% of the pressure specified in the formula (14):
p i , I S O   =   0.8 ·   p i , c o n
The moisture reserve assumed by ISO [24] due to the heterogeneity of humidity in the room is: 5% relative humidity φi or 10% moisture increase Δp. The permissible relative humidity of the air in the room φi,max, for a case of 5% moisture, we will determine from the relationship analogous to that in Equation (3):
p i , I S O = ( φ i , m a x + 0.05 ) ·   p s a t ( Θ i )
Because we know how to calculate pi,ISO, comparing Equations (15) and (16) we get:
0.8 · p i , c o n = ( φ i , m a x + 0.05 ) ·   p s a t ( Θ i )
After transforming Equation (17) we get:
φ i , m a x = 0.8 · p i , c o n p s a t ( Θ i ) 0.05
However, the permissible relative humidity of the air in the room φi,max, for a case of 10% moisture increase, we determine from the equation:
φ i , m a x = p i , m a x   p s a t ( Θ i ) = p e + p m a x p s a t ( Θ i )
In order for mold not to develop, the permissible increase in humidity in the room Δpmax, we determine as in Equation (2):
p i , I S O =   ( p e + 1.1 · Δ p m a x )
substituting Equation (15) for pi,ISO, we get:
0.8 · p i , k o n =   ( p e + 1.1 · Δ p m a x )
after conversion:
Δ p m a x = 0.8 p i , k o n p e 1.1
The final formula for the permissible humidity in the room φi,max is obtained after inserting Δpmax (Equation (22)) in Equation (19):
φ i , m a x = p e + Δ p m a x p s a t ( Θ i ) = 0.8 · p i , c o n   + 0.1 · p e 1.1 · p s a t ( Θ i )
Based on the air parameters used in the calculations, it is possible to determine the actual water vapor pressure in the following months:
p i =   p e + Δ p
The relative humidity of the air in the room in the following months will be calculated:
φ i = p i p s a t ( Θ i )
Using the relative humidity of the air, the design condition to avoid mold would be:
φ i , m a x >   φ i
Based on this design condition, it is possible to determine the difference between relative humidity of air in the following months of the year:
Δ φ ( m ) =   φ i , m a x ( m )   φ i ( m )
m-month considered.
A positive value (Δφ(m) > 0) means no risk of mold growth (meeting the design condition) and informs about the value of safe relative humidity in the room. The negative value (Δφ(m) < 0), on the other hand, means that there is a risk of mold growth and informs about what value the maximum humidity has exceeded. If there is a risk of mold growth, we have information not only about the critical month but also about other months in which this threat occurs.

2.1.3. M3—Avoiding Mold Growth on the Basis of Characteristic Temperatures

Another physical quantity that it is possible to use when checking the condition to avoid mold growth on the surface of the barrier is temperature. Based on the knowledge of the barrier surface temperature Θsi and the minimum permissible barrier surface temperature Θsi,min, it is possible to formulate a design condition to avoid mold growth:
Θ s i >   Θ s i , m i n
The barrier surface temperature (Θsi) is calculated from Equation (13):
Θ s i =   Θ i U · ( Θ i Θ e   ) · R s i
The minimum allowable barrier surface temperature Θsi,min will be determined on the basis of the standard procedure given in points 1–6 (Equations (1)–(4b)). If the design condition is not met, we calculate the maximum value of the heat transfer coefficient Umax. This factor is derived from the minimum surface temperature of the barrier and results from the conversion of the modified Equation (29):
Θ s i , m i n =   Θ i U m a x · ( Θ i Θ e   ) · R s i
U m a x = Θ i Θ s i , m i n ( Θ i Θ e ) R s i
Based on this design condition, it is possible to determine the difference between temperatures on the barrier surface in the following months of the year:
Δ Θ i ( m )   =   Θ s i ( m ) Θ s i , m i n ( m )
A positive value (ΔΘi(m) > 0) means no risk of mold growth (meeting the design condition) and informs about the value of a safe surface temperature reserve. However, a negative value (ΔΘi(m < 0) means a threat of mold growth and informs how many degrees the temperature of the barrier is lower in the critical month and in other months in which this threat occurs.
From the point of view of the operation of the building, it is important to note the value of the outside air temperature Θe,min at which mold growth will begin on the barrier surface. To determine it, Equation (29) needs to be modified and then converted.
Θ s i , m i n =   Θ i U · ( Θ i   Θ e , m i n ) R s i
Θ e , m i n = Θ i Θ i Θ s i , m i n U R s i
The value of this temperature is important for the user because it informs when there may be a risk of mold growth on the surface of the barrier. Knowing the course of temperatures in winter, it is possible to estimate the approximate time or period of occurrence of this phenomenon.

2.1.4. M4—Avoiding Mold Growth on the Basis of Determining the Characteristic Water Vapor Pressure

Another physical quantity that is possible to use when checking the condition to avoid mold growth on the surface of the barrier is the water vapor pressure. Based on the knowledge of the actual water vapor pressure pi and the maximum allowable water vapor pressure pi,max, it is possible to formulate a design condition to avoid mold growth:
p i , m a x >   p i
The maximum allowable vapor pressure pi,max is calculated from the equation below, in which the maximum moisture increase Δpmax was determined in Equation (22):
p i , m a x = p e + Δ p m a x = 0.8 · p i , c o n   + 0.1 · p e 1.1
If the relative humidity of the room air is determined φi then the maximum permissible vapor pressure pi,max is calculated from the equation:
p i , m a x = 0.8 · p i , c o n 0.05 p s a t ( Θ i )
However, the actual water vapor pressure pi will be determined from Equation (24).
Table 1 and Table 2 for various physical quantities summarize the conditions that must be met for mold growth, its absence or the beginning (end) to occur on the building barrier.

2.2. Methods for Checking the Presence of Water Vapor Condensation on Building Barriers

The determination of the phenomenon of water vapor condensation on a building barrier will be presented for four different methods.
  • method 1 (M1con) based on a comparison of temperature factors fRsi and fRdp;
  • method 2 (M2con) based on comparison of relative humidity φi,con and φi;
  • method 3 (M3con) involving the comparison of the barrier temperature Θsi and the air dew point temperature Θdp and
  • method 4 (M4con) based on comparing the water vapor pressure of pi,con and pi.
A design condition has been formulated for each method to avoid condensation on the building barrier.

2.2.1. M1con—Avoiding Condensation on the Basis of Determining the Air Dew Point Temperature Factor fRdp

The procedure for checking the condensation of water vapor on a building barrier is based on a comparison of two temperature factors. The temperature factor fRsi resulting from the insulation (construction) of the barrier and the factor fRdp resulting from humidity conditions in the room. To avoid condensation, the air dew point temperature should not exceed the room surface temperature. On this basis, it is possible to formulate a design condition to avoid surface condensation:
f R s i >   f R d p
The temperature factor fRsi can be determined on the basis of the known value of the heat transfer coefficient (U) according to formula (7) or the known value of the barrier surface temperature Θsi according to formula (11). The barrier surface temperature is calculated according to formula (13). The temperature factor fRdp is calculated on the basis of the dew point temperature Θdp according to the formula:
f R d p = Θ d p Θ e Θ i Θ e
The dew point of the air in the room Θdp is determined on the basis of the actual water vapor pressure in the room pi:
p i =   p s a t ( Θ d p )   ( I S O [ 24 ] A n n e x   E )     Θ d p
The actual water vapor pressure in room pi shall be determined on the basis of pressure increase Δp according to formula (24) or on the basis of relative humidity in room φi according to the following formula:
p i =   φ i · p s a t ( Θ i )

2.2.2. M2con—Avoiding Condensation on the Basis of Determining Condensation Humidity φi,con

To avoid condensation on the surface of the barrier, condensation humidity φi,con understood as relative humidity of the surface should not exceed the actual pressure of the water vapor in the room. The design condition to avoid surface condensation can be formulated as follows:
φ i , c o n >   φ i
The humidity of the condensation in the room in the following months will be calculated from the formula:
φ i , c o n = p i , c o n p s a t ( Θ i )
The condensation pressure will be determined according to the formula (29), the surface temperature of the barrier Θsi:
Θ s i ( I S O [ 24 ] A n n e x   E )     p s a t ( Θ d p ) =   p i , c o n
The relative humidity of the air in the room in the following months will be calculated according to the formula (25). The actual water vapor pressure in room pi in this formula is determined on the basis of the pressure increase Δp according to formula (24) or on the basis of relative humidity in the room φi according to formula (40).

2.2.3. M3con—Avoiding Condensation on the Basis of Characteristic Temperatures

Based on the knowledge of the barrier surface temperature Θsi and the air dew point temperature in the room Θdp, it is possible to formulate a design condition to avoid surface condensation:
Θ s i >   Θ d p
The barrier surface temperature Θsi in the following months will be calculated from Equation (29). However, the air dew point temperature in the room Θdp in subsequent months will be determined according to the relationship (39) on the basis of the actual water vapor pressure in the room pi determined according to formulas (24 or 40). Based on this design condition, it is possible to determine the difference between the temperature at the barrier surface and the air dew point temperature in the following months of the year:
Δ Θ ( m )   =   Θ s i ( m ) Θ d p ( m )
A positive value of ΔΘ(m) > 0 means no surface condensation (meeting the design condition) and informs about the value of the safe surface temperature reserve. However, a negative value of ΔΘ(m) < 0 means surface condensation and informs how many degrees the barrier temperature is lower in the months in which this threat occurs.

2.2.4. M4con—Avoiding Condensation on the Basis of Determining the Characteristic Water Vapor Pressure

Based on the knowledge of the actual water vapor pressure pi and the water vapor condensation pressure on the surface of the barrier pi,con, it is possible to formulate a design condition to avoid condensation:
p i , c o n >   p i
The water vapor condensation pressure on the barrier surface pi,con in the following months will be calculated from Equation (43) on the basis of the barrier surface temperature Θsi calculated according to formula (29). However, the actual water vapor pressure in the room (pi) in the following months will be determined according to the formula (24 or 40). Based on this design condition, it is possible to determine the difference between the water vapor condensation pressure on the barrier surface and the air vapor pressure in the following months of the year:
Δ p ( m )   =   p i , c o n ( m ) p i ( m )
A positive value (Δp(m) > 0) means no surface condensation (fulfillment of the design condition) and indicates the value of a safe pressure reserve. The negative value (Δp(m) < 0), on the other hand, means surface condensation and informs about the value of exceeded pressure.
In Table 3 and Table 4 different physical quantities summarize the conditions that must be met in order for the phenomenon of surface condensation on a building barrier: to occur, to have its beginning (end) or not occurring (lack of condensaction).

3. Results and Discussion

For the verification of the presented calculation methods for mold development and surface condensation, the following data was adopted: outdoor air temperature, Θe, and relative humidity of the outdoor air φe, according to the Rzeszów-Jasionka meteorological station [25], indoor air temperature Θi = 20 °C, moisture increase in a room for the 4th class of internal humidity Δp = 10.8 hPa [24], external wall (50 cm thick made of solid brick) with a heat transfer coefficient U = 1.20 W/(m2.K); heat transfer resistance on the internal surface of the barrier Rsi = 0.25 (m2K)/W [24]. Data for calculations are presented in Table 5.
To illustrate the boundary conditions of a given method for each of the two phenomena, all necessary parameters for the twelve consecutive months of the year were calculated and presented in Table 6 and Table 7, respectively.
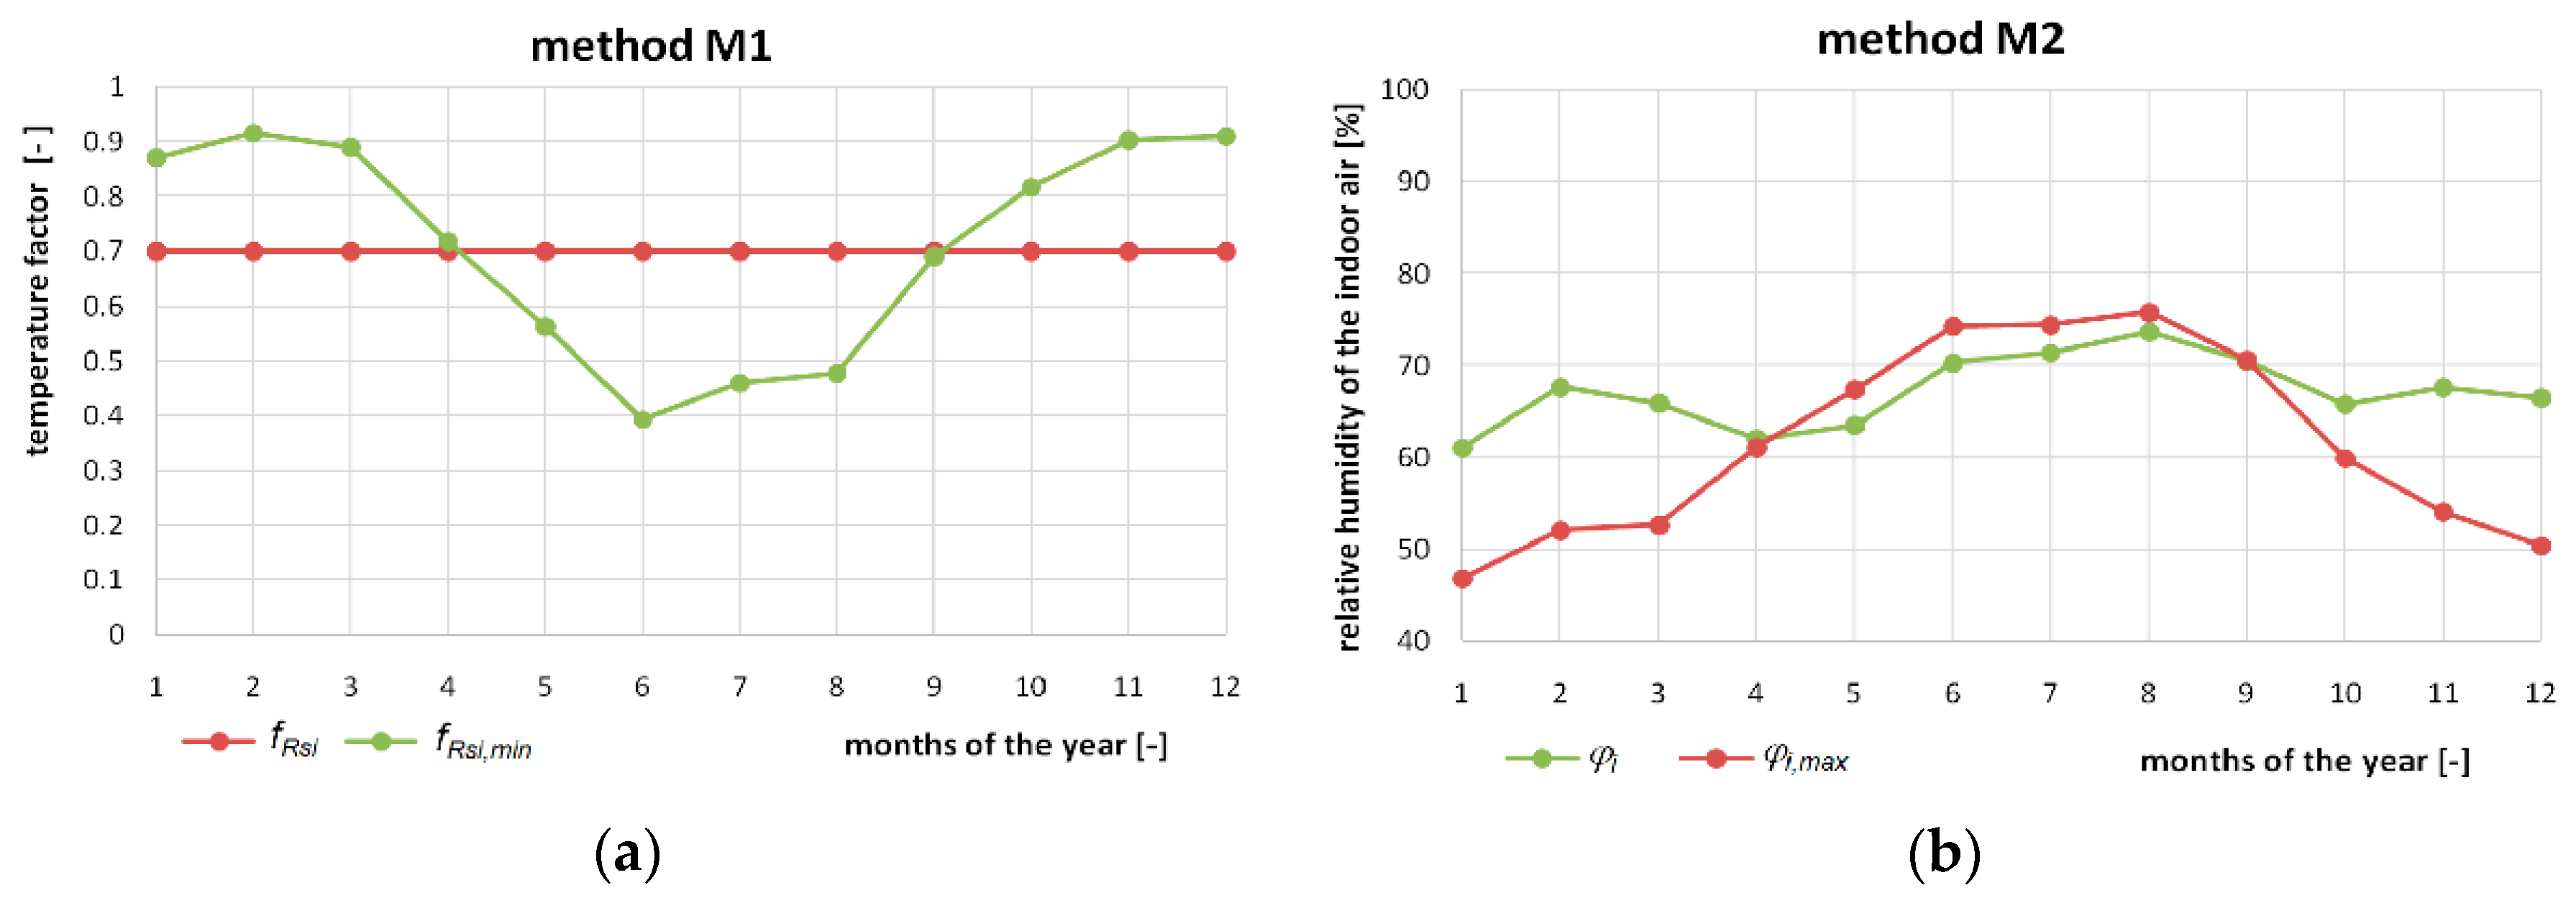
In the phenomenon of mold development, the characteristic parameters resulting from the insulation of the building barrier are: temperature factor of the barrier fRsi; barrier temperature Θsi; maximum water vapor pressure in the room pi,max; maximum relative air humidity in the room φi,max, while for the indoor microclimate it is: minimum permissible barrier temperature factor, fRsi,min; minimum permissible barrier temperature Θsi,min; water vapor pressure in the pi room; relative air humidity in the room φi, (Table 6).
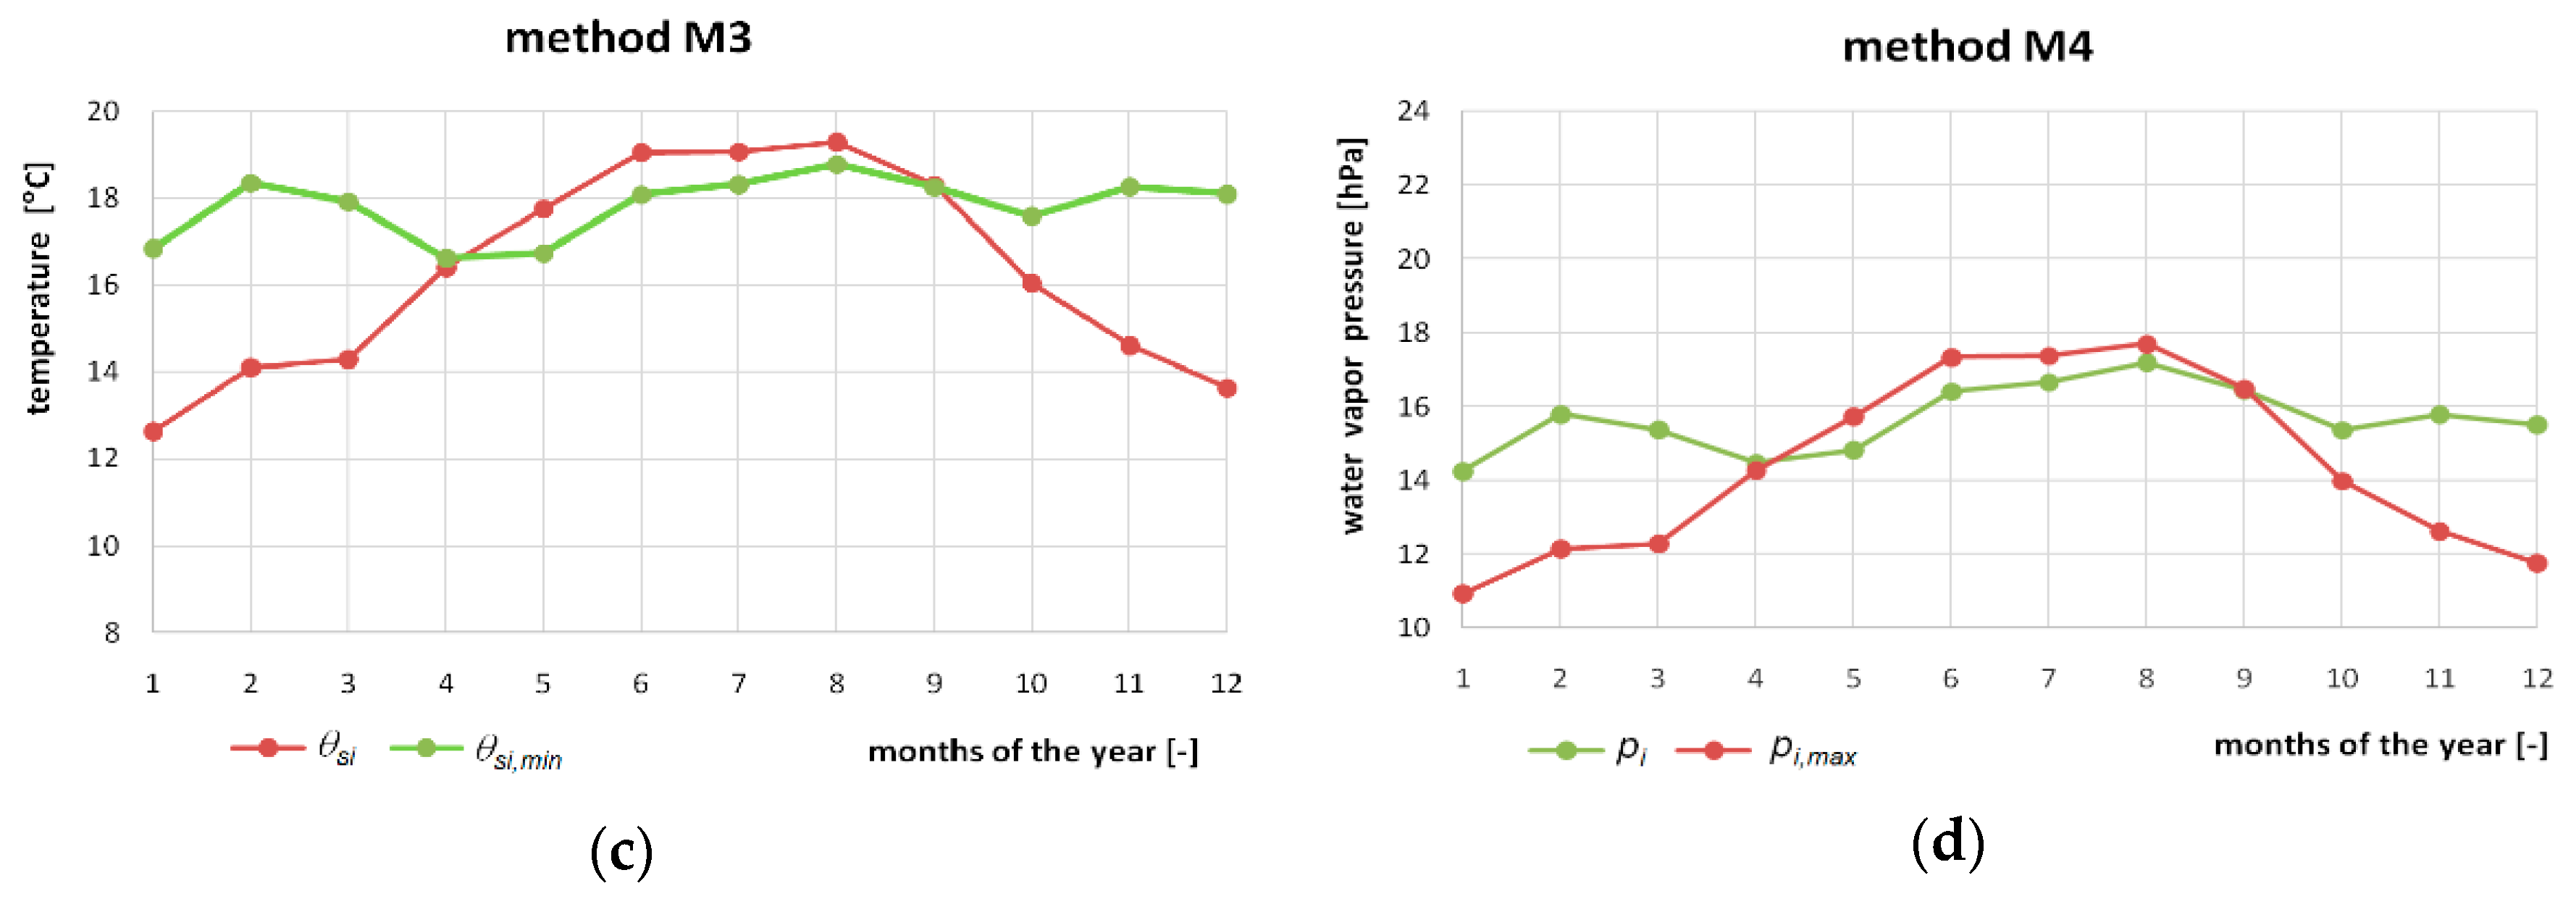
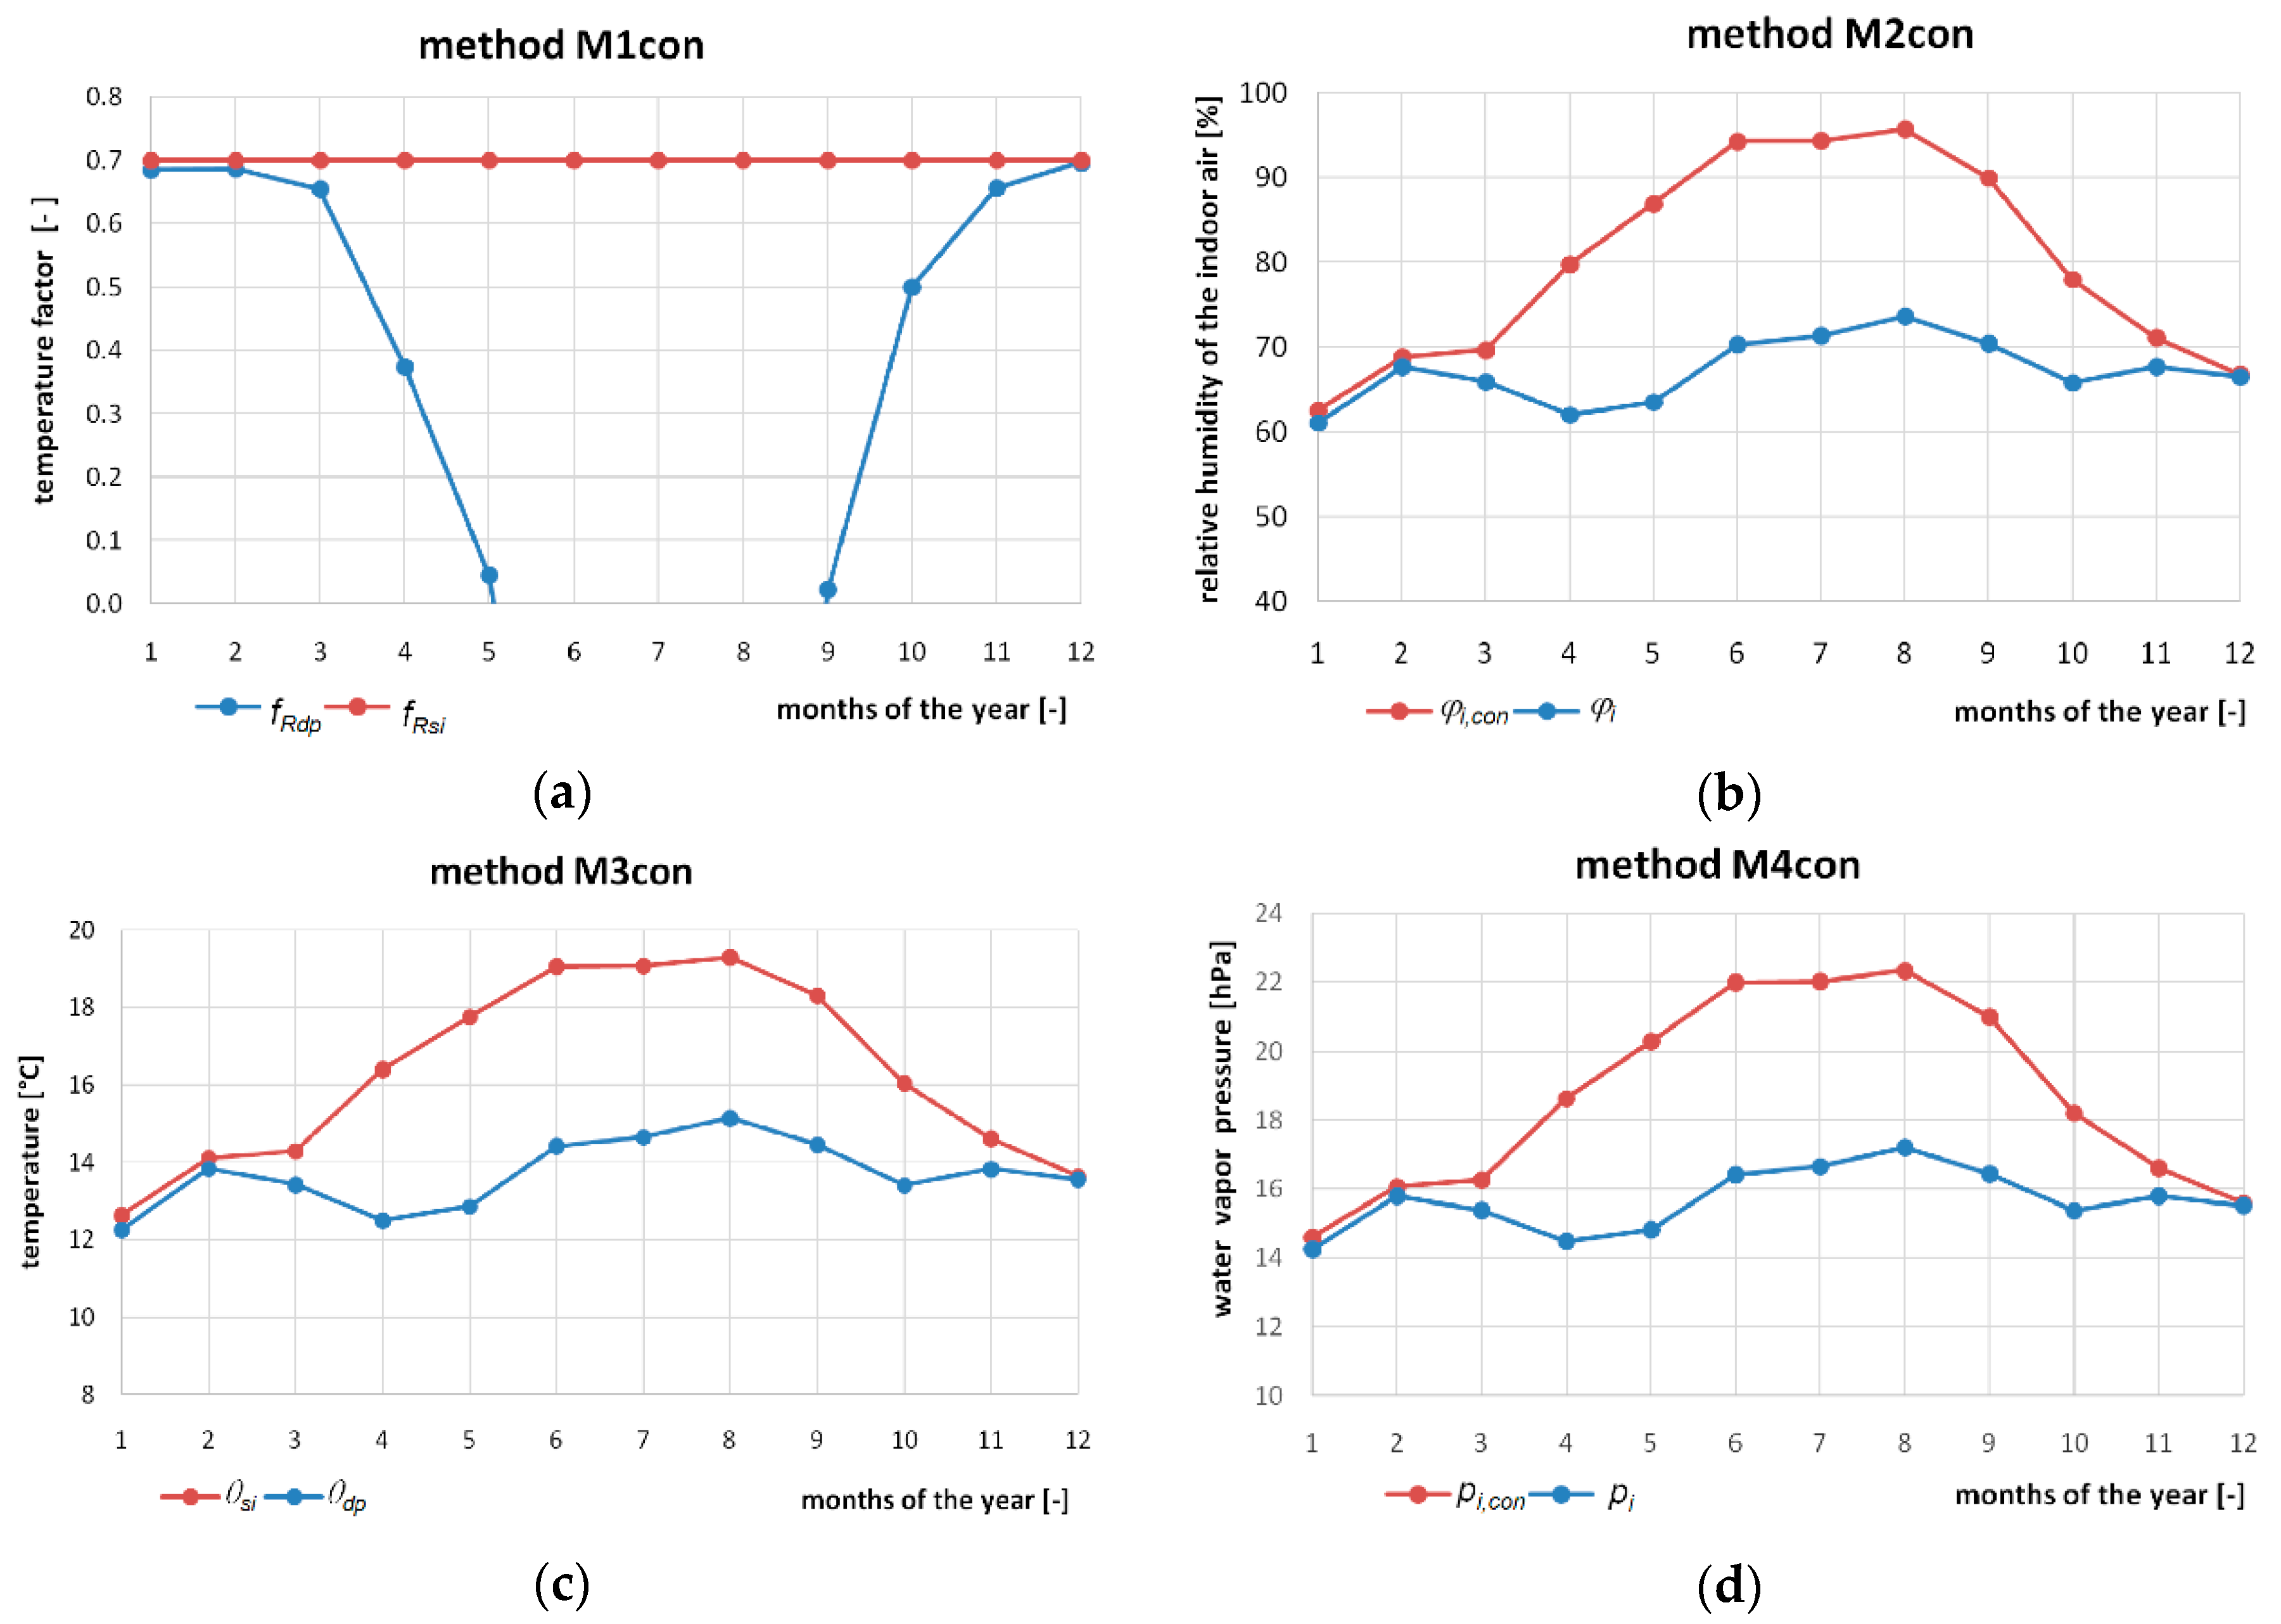
In the phenomenon of surface condensation, the characteristic parameters resulting from the insulation of a building barrier are: the temperature factor of the barrier fRsi; barrier temperature, Θsi; condensation pressure of water vapor pi,con; condensation humidity in the room, φi,con, while for the internal microclimate it is: barrier temperature factor fRdp; dew point temperature Θdp; water vapor pressure in the pi room; relative air humidity in the room φi, (Table 7).
By comparing the relevant parameters characterizing the building barrier with the parameters characterizing the internal microclimate, all boundary conditions for mold development listed in Table 1 and Table 2 and for surface condensation given in Table 3 and Table 4 were checked. Thus, the state of the phenomenon (its occurrence or absence) was determined and the results were presented in Table 7 and Table 8 respectively.

3.1. Mold Growth on the Surface of the Barrier

Table 6 shows the calculated values of all necessary parameters to check mold growth for four methods in the twelve consecutive months of the year.
Table 9 presents the values of parameters necessary to check the boundary conditions of mold development for four methods in the twelve consecutive months of the year.
A graphic interpretation of the characteristic parameters for four methods in the phenomenon of mold development is shown in Figure 1. The intersecting lines in the charts show the occurrence of the phenomenon of mold development.

3.2. Condensation on the Surface of the Barrier

Table 7 shows the calculated values of all necessary parameters needed to check surface condensation for four methods in the twelve consecutive months of the year.
Table 8 presents the necessary parameters to check the surface condensation boundary conditions for four methods in the twelve consecutive months of the year.
A graphic interpretation of the characteristic parameters for the four methods in the phenomenon of surface condensation is shown in Figure 2. The non-intersecting lines in the charts show that there is no surface condensation.

4. Conclusions

In the phenomenon of mold development and surface condensation, depending on the selected calculation method, parameter differences (ΔfR; Δφ; ΔΘ; Δp) having negative values show how much the given quantity has been exceeded, which is associated with the phenomenon of mold or condensation. However, in the case of positive values obtained, they show what given value a supply has in relation to the boundary value. The calculation methods presented allow for a comprehensive assessment of the risk of mold and condensation on the surface of building barriers. Methods not described in the standard (ISO [24]) are of particular importance here. The result of the standard method (in the case of a negative value of the ΔfR coefficient) is the answer in the form of information about the need to retrofit the analyzed building barrier. In contrast, "non-standard" methods allow for a quantitative indication of the cause of the phenomenon (in the form of, for example, too high relative humidity in the room) and protection against the risk of mold and condensation by reducing this humidity in a specific period of time (in months in which the values Δφ are negative). This approach to the problem may be of particular importance in buildings where, for various reasons, the retrofitting of barriers is not possible (e.g., in some historic buildings under conservation protection).

Author Contributions

Conceptualization, A.S.; Data curation, A.S.; Formal analysis, A.S., J.K. and P.M.; Funding acquisition, L.L.; Investigation, A.S.; Methodology, A.S., J.K. and P.M.; Project administration, L.L.; Resources, A.S., J.K. and P.M.; Supervision, L.L.; Validation, A.S., L.L., J.K. and P.M.; Visualization, A.S., J.K. and P.M.; Writing—original draft, A.S., J.K. and P.M.; Writing—review & editing, A.S., J.K. and P.M. All authors have read and agreed to the published version of the manuscript.

Funding

This research received no external funding.

Conflicts of Interest

The authors declare no conflict of interest. The funders had no role in the design of the study; in the collection, analyses, or interpretation of data; in the writing of the manuscript, or in the decision to publish the results.

References

  1. Annila, P.J.; Hellemaa, M.; Pakkala, T.A.; Lahdensivu, J.; Suonketo, J.; Pentti, M. Extent of moisture and mould damage in structures of public buildings. Case Stud. Constr. Mater 2017, 6, 103–108. [Google Scholar] [CrossRef]
  2. Starakiewicz, A.; Szalacha, A. Występowanie i zapobieganie grzybom pleśniowym na przegrodach budowlanych - rozważania na przykładzie lokalu mieszkalnego. Fizyka Budowli w Teorii i Praktyce 2001, t.II, 555–562. (In Polish) [Google Scholar]
  3. Starakiewicz, A.; Lichołai, L.; Szalacha, A.; Warzocha-Laska, M. Kondensacja pary wodnej na przegrodach budowlanych - diagnostyka, likwidacja i zapobieganie. Fizyka Budowli w Teorii i Praktyce 2003, t.II, 436–444. (In Polish) [Google Scholar]
  4. Szyszka, J.; Starakiewicz, A. Problem zawilgocenia stropodachu krytej pływalni. Izolacje 2006, t.I, 54–55. (In Polish) [Google Scholar]
  5. Starakiewicz, A.; Lichołai, L.; Miąsik, P. Metoda określania dopuszczalnej wilgotności w pomieszczeniu jako ochrona przed kondensacją powierzchniową i możliwym rozwojem pleśni. Fizyka Budowli w Teorii i Praktyce 2015, t.VII, 61–66. (In Polish) [Google Scholar]
  6. You, S.; Li, W.; Ye, T.; Hu, F.; Zheng, W. Study on moisture condensation on the interior surface of buildings in high humidity climate. Build. Environ. 2017, 125, 39–48. [Google Scholar] [CrossRef]
  7. Pietrzyk, K. A systemic approach to moisture problems in buildings for mould safety modelling. Build. Environ. 2015, 86, 50–60. [Google Scholar] [CrossRef]
  8. Birchmore, R.; Pivac, A.; Robert Tait, R. Impacts of an Innovative Residential Construction Method on Internal Conditions. Buildings 2015, 5, 179–195. [Google Scholar] [CrossRef]
  9. Dos Santos, G.H.; Mendes, N.; Philippi, P.C. A building corner model for hygrothermal performance and mould growth risk analyses. Int. J. Heat Mass Tranf. 2009, 52, 4862–4872. [Google Scholar] [CrossRef]
  10. Møller, E.B.; Andersen, B.; Rode, C.; Peuhkuri, R. Conditions for mould growth on typical interior surfaces. Energy Procedia 2017, 132, 171–176. [Google Scholar] [CrossRef]
  11. Chen, G.; Luo, Q.; Guo, X.; Liu, X.; Tu, M.; He, Y. Study on mould germination risk in hydroscopic building wall. Procedia Eng. 2017, 205, 2712–2719. [Google Scholar] [CrossRef]
  12. Lee, H.-H.; Oh, H.-R.; Lim, J.-H.; Song, S.-Y. Evaluation of the Thermal Environment for Condensation and Mold Problem Diagnosis Around Built-in Furniture in Korean Apartment Buildings during Summer and Winter. Energy Procedia 2016, 96, 601–612. [Google Scholar] [CrossRef] [Green Version]
  13. Dębska, B.; Lichołai, L.; Miąsik, P. Assessment of the Applicability of Sustainable Epoxy Composites Containing Waste Rubber Aggregates in Buildings. Buildings 2019, 9, 31. [Google Scholar] [CrossRef] [Green Version]
  14. Krasoń, J.; Lichołai, L. Thermal efficiency of a modified thermal storage wall containing phase change material in comparative test periods. E3S Web Conf. 2018, 49, 00059. [Google Scholar] [CrossRef] [Green Version]
  15. Krasoń, J.; Miąsik, P.; Lichołai, L.; Dębska, B.; Starakiewicz, A. Analysis of the Thermal Characteristics of a Composite Ceramic Product Filled with Phase Change Material. Buildings 2019, 9, 217. [Google Scholar] [CrossRef] [Green Version]
  16. Miąsik, P.; Lichołai, L. The influence of a thermal bridge in the corner of the walls on the possibility of water vapour condensation. E3S Web Conf. 2018, 49, 00072. [Google Scholar] [CrossRef] [Green Version]
  17. Fantucci, S.; Isaia, F.; Serra, V.; Dutto, M. Insulating coat to prevent mold growth in thermal bridges. Energy Procedia 2017, 134, 414–422. [Google Scholar] [CrossRef]
  18. Laukkarinen, A.; Kero, P.; Vinha, J. Condensation at the exterior surface of windows. J. Build. Eng. 2018, 19, 592–601. [Google Scholar] [CrossRef]
  19. Nguyen, C.-K.; Teodosiu, C.; Kuznik, F.; David, D.; Teodosiu, R.; Rusaouën, G. A full-scale experimental study concerning the moisture condensation on building glazing surface. Build. Environ. 2019, 156, 215–224. [Google Scholar] [CrossRef] [Green Version]
  20. Park, S.; Koo, S.Y.; Lim, J.-H.; Seong, Y.-B.; Song, S.-Y. Condensation Resistance Evaluation of a Double-sliding Window System for Apartment Buildings. Procedia Eng. 2016, 146, 60–68. [Google Scholar] [CrossRef]
  21. Vereecken, E.; Roels, S. Review of mould prediction models and their influence on mould risk evaluation. Build. Environ. 2012, 51, 296–310. [Google Scholar] [CrossRef] [Green Version]
  22. Thelandersson, S.; Isaksson, T. Mould resistance design (MRD) model for evaluation of risk for microbial growth under varying climate conditions. Build. Environ. 2013, 65, 18–25. [Google Scholar] [CrossRef]
  23. Ma, X.; Li, X.; Shao, X.; Jiang, X. An algorithm to predict the transient moisture distribution for wall condensation under a steady flow field. Build. Environ. 2013, 67, 56–68. [Google Scholar] [CrossRef]
  24. PN-EN ISO 13788: 2013. Hygrothermal Performance of Building Components and Building Elements—Internal Surface Temperature to avoid Critical Surface Humidity and Interstitial Condensation—Calculation methods; ISO: Warsaw, Poland, 2013. (In Polish) [Google Scholar]
  25. Climate Data for Meteorological Station Rzeszow-Jasionka. Available online: https://www.gov.pl/web/fundusze-regiony/dane-do-obliczen-energetycznych-budynkow (accessed on 6 December 2019).
Figure 1. Graphs of characteristic parameters in the phenomenon of mold development; (a) method M1; (b) method M2; (c) method M3; (d) method M4.
Buildings 10 00004 g001aBuildings 10 00004 g001b
Figure 2. Characteristic graphs of parameters in the phenomenon of surface condensation.
Buildings 10 00004 g002
Table 1. Conditions for mold growth on the surface of a building barrier.
No.Mold GrowthBeginning (End) of Mold GrowthDesign Condition (No Mold Development)
1.fRsi < fRsi,minfRsi = fRsi,minfRsi > fRsi,min
2.φi,max < φiφi,max = φiφi,max > φi
3.Θsi < Θsi,minΘsi = Θsi,minΘsi > Θsi,min
4.pi,max < pipi,max = pipi,max > pi
Table 2. Conditions for mold growth on the surface of a building barrier in the form of a parameter difference (Δ).
No.Mold GrowthBeginning (End) of Mold GrowthDesign Condition (No Mold Development)
1.ΔfR = (fR i − fRsi,min) < 0ΔfR = 0ΔfR = (fRsi − fRsi,min) > 0
2.Δφ = (φi,max − φi) < 0Δφ = 0Δφ = (φi,max − φi) > 0
3.ΔΘ = (Θsi − Θsi,min) < 0ΔΘ = 0ΔΘ = (Θsi − Θsi,min) > 0
4.Δp = (pi,max − pi) < 0Δp = 0Δp = (pi,max − pi) > 0
Table 3. Conditions for the occurrence of surface condensation on a building barrier.
No.A Condition of Occurrence of CondensationBeginning (End) of CondensationDesign Condition
(No Condensation)
1.fRsi < fRdpfRsi = fRdpfRsi > fRdp
2.φi,con <φiφi,con =φiφi,con >φi
3.Θsi < ΘdpΘsi = ΘdpΘsi > Θdp
4.pi,con < pipi,con = pipi,con > pi
Table 4. Conditions for the occurrence of surface condensation on a building barrier in the form of a difference of parameters (Δ).
No.A Condition of Occurrence of CondensationBeginning (End) of CondensationDesign Condition
(No Condensation)
1.ΔfRcon = (fRsi − fRdp) < 0ΔfRcon = 0ΔfRcon = (fRsi − fRdp) > 0
2.Δφcon = (φi,con − φi) < 0Δφcon = 0Δφcon = (φi,con − φi) > 0
3.ΔΘcon = (Θsi − Θdp) < 0ΔΘcon = 0ΔΘcon = (Θsi − Θdp) > 0
4.Δpcon = (pi,con − pi) < 0Δpcon = 0Δpcon = (pi,con − pi) > 0
Table 5. Parameters of external and internal climate and building barrier.
MonthΘepsat.eφepe ΔpΘipsat.iURsi
°ChPa%hPahPa°ChPaW/m2Km2K/W
I−4.574.1683.03.4510.802023.351.20.25
II0.336.2582.85.1810.622023.351.20.25
III0.956.5477.95.0910.292023.351.20.25
IV8.0010.7274.67.996.482023.351.20.25
V12.5114.4974.410.784.042023.351.20.25
VI16.8319.1476.814.701.712023.351.20.25
VII16.8719.1978.014.971.692023.351.20.25
VIII17.6520.1679.015.931.272023.351.20.25
IX14.3216.3082.113.383.072023.351.20.25
X6.809.8783.48.237.132023.351.20.25
XI2.037.0786.26.099.702023.351.20.25
XII−1.235.5185.64.7210.802023.351.20.25
Table 6. Parameters for mold development characteristics for four methods.
Monthpi.ISOpsatsi.min)Θsi.minfRsi.minfRsiΘsipiφipi.maxφi.max
hPahPa°C°ChPa%hPa%
I15.3319.1716.80.8710.7012.614.2561.110.9346.8
II16.8621.0818.30.9160.7014.115.8067.712.1652.1
III16.4120.5117.90.8900.7014.315.3865.912.2952.6
IV15.1218.9016.60.7180.7016.414.4762.014.2761.1
V15.2319.0316.70.5630.7017.814.8263.515.7467.4
VI16.5820.7318.10.3940.7019.016.4170.317.3474.3
VII16.8321.0318.30.4600.7019.116.6671.417.3874.4
VIII17.3221.6518.80.4780.7019.317.2073.717.7075.8
IX16.7620.9418.20.6910.7018.316.4570.516.4970.6
X16.0720.0917.60.8170.7016.015.3665.813.9959.9
XI16.7720.9618.30.9030.7014.615.8067.712.6354.1
XII16.6020.7518.10.9100.7013.615.5266.511.7750.4
Table 7. Parameters for surface condensation characteristics for four methods.
MonthΘdpfRdpfRsiΘsipi.conpiφiφi.con
°C°ChPahPa%%
I12.250.6850.7012.614.6014.2561.162.5
II13.830.6860.7014.116.0715.8067.768.8
III13.420.6540.7014.316.2615.3865.969.7
IV12.490.3740.7016.418.6314.4762.079.8
V12.850.0450.7017.820.2914.8263.586.9
VI14.41−0.7620.7019.022.0116.4170.394.3
VII14.65−0.7110.7019.122.0216.6671.494.3
VIII15.14−1.0690.7019.322.3517.2073.795.7
IX14.450.0230.7018.321.0016.4570.589.9
X13.400.5000.7016.018.2015.3665.878.0
XI13.820.6560.7014.616.6115.8067.771.1
XII13.550.6960.7013.615.5915.5266.566.8
Table 8. Parameters for determining the conditions of surface condensation and the state of the phenomenon for four methods.
M1conM2conM3conM4con
MonthfRsifRdp ΔfRconφi.conφi ΔφconΘsiΘdp ΔΘconpi.conpi ΔpPhenomenon
%%%°C°C°ChPahPahPa
I0.700.6850.01562.561.11.512.612.250.3814.6014.250.35lack
II0.700.6860.01468.867.71.214.113.830.2716.0715.800.27lack
III0.700.6540.04669.765.93.814.313.420.8716.2615.380.88lack
IV0.700.3740.32679.862.017.816.412.493.9118.6314.474.15lack
V0.700.0450.65586.963.523.417.812.854.9020.2914.825.47lack
VI0.70−0.7621.46294.370.324.019.014.414.6322.0116.415.59lack
VII0.70−0.7111.41194.371.423.019.114.654.4222.0216.665.36lack
VIII0.70−1.0691.76995.773.722.119.315.144.1622.3517.205.15lack
IX0.700.0230.67789.970.519.518.314.453.8521.0016.454.55lack
X0.700.5000.20078.065.812.216.013.402.6418.2015.362.84lack
XI0.700.6560.04471.167.73.514.613.820.7916.6115.800.81lack
XII0.700.6960.00466.866.50.313.613.550.0815.5915.520.07lack
Table 9. Parameters for determining the boundary conditions for mold development and the state of the phenomenon for four methods - the bold font indicates negative values of the analyzed parameters at which the mold phenomenon occurs.
M1M2M3M4
MonthfRsifRsi.min ΔfRφi.maxφi ΔφΘsiΘsi.min ΔΘpi.maxpi ΔpPheno-menon
%%%°C°C°ChPahPahPa
I0.700.8710.17146.861.114.212.616.84.2110.9314.253.32mold
II0.700.9160.21652.167.715.614.118.34.2412.1615.803.64mold
III0.700.8900.19052.665.913.214.317.93.6312.2915.383.09mold
IV0.700.7180.01861.162.00.916.416.60.2214.2714.470.20mold
V0.700.5630.13767.463.53.917.816.71.0315.7414.820.91lack
VI0.700.3940.30674.370.34.019.018.10.9717.3416.410.93lack
VII0.700.4600.24074.471.43.119.118.30.7517.3816.660.72lack
VIII0.700.4780.22275.873.72.219.318.80.5217.7017.200.50lack
IX0.700.6910.00970.670.50.218.318.20.0516.4916.450.04lack
X0.700.8170.11759.965.85.916.017.61.5413.9915.361.37mold
XI0.700.9030.20354.167.713.614.618.33.6412.6315.803.16mold
XII0.700.9100.21050.466.516.113.618.14.4611.7715.523.75mold

