Article

Risk of Moisture in Diffusionally Open Roofs with Cross-Laminated Timber for Northern Coastal Climates

by
Agnieszka Sadłowska-Sałęga
* and
Krzysztof Wąs
Faculty of Environmental Engineering and Land Surveying, University of Agriculture in Krakow, Al. Mickiewicza 24/28, 31-059 Kraków, Poland
*
Author to whom correspondence should be addressed.
Buildings 2020, 10(1), 10; https://doi.org/10.3390/buildings10010010
Submission received: 28 November 2019 / Revised: 8 January 2020 / Accepted: 9 January 2020 / Published: 14 January 2020
(This article belongs to the Section Building Energy, Physics, Environment, and Systems)

Abstract

:
The paper is an attempt to answer the question whether the material-optimized roof construction using cross-laminated timber (CLT) is safe in terms of moisture content in the demanding northern costal climates. The proposed roof structure meets the strength requirements. The partition is diffusionally open, which facilitates moisture transport. However, there is a concern whether the applied layer system allows maintaining a safe level of moisture content below critical moisture content (CMC), which has been set at 20%. The article presents the annual hygrothermal calculation of the proposed roof slope for four locations of northern Europe and Greenland characterized by costal or subpolar climate. Four scenarios of indoor air relative humidity were considered: free floating, RHmin = 40%RH, RHmin = 50%, RHmin = 60%. In all cases, the minimum indoor temperature was 20 °C. The analysis was carried out using WUFI®Plus software. The calculation results showed that the moisture content did not exceed 20% in the CLT layer at any of the described locations. However, for the two coldest climates the assumed level of safety has been exceeded in the roof oriented strand board (OSB) sheathing.

1. Introduction

Sustainable construction is now becoming one of the most important aspects in the fight against negative changes occurring in the natural environment. Therefore, there is a growing interest in technologies that have a lower environmental impact. Investors are looking for solutions that are ecological. What is becoming increasingly important is the entire “building life cycle”: from the material production process and construction of the building, through cheap exploitation to its utilization. Mass timber products (MTPs); including mainly structural composite lumber (SCL), glued-laminated timber (GLT, glulam), cross-laminated timber (CLT), and nailed-laminated timber (NCL) perfectly correspond to this trend. Moreover, the production process allows for the optimal use of raw materials compared to traditional wooden construction because of the smaller amount of waste remaining from the cross-section of the tree after the production process. MTPs can be prefabricated with precise dimensions and openings in factory, which enables faster assembly with minimal construction waste [1]. Therefore, CLT is capable of obtaining the lowest global warming potential (GWP) of timber structures [2].
The base material for the production of CLT is graded structural timber which is available in a number of strength classes, i.e., classes of structural timber with specified target reference properties as timber density, modulus of elasticity (MOE), and bending or tension strength (MOR). CLT is currently available with numerous different layups, including different number and thicknesses of the individual layers. The different setups might lead to different strength properties, but the differences might be rather small for CLT having homogeneous material, symmetric setups and only rational differences in the layer thicknesses; thus, for the majority of the CLT plates [3,4,5].
The surrounding environment degrades every building from the moment it is erected. Ensuring adequate durability for buildings is a serious technical problem. To determine the durability of a building, it is necessary to know both the initial functional properties and the behavior over time of individual parts of the building, materials, or products. It is necessary to know the appropriate criteria, i.e., the limit values, which, if not exceeded, determines the fulfillment of the requirement for a given useful properties.
Moisture has become a major cause of building damage: it has been estimated [6,7] that 75–80% of all the problems with building envelopes are caused to a certain extent by moisture. Harmful effects include degradation, moisture, deformation, or dimensional change. The wood is affected by degradation mainly as a result of biological corrosion, and thus the destructive effects of fungi and insects. In addition, the exposure of wooden materials to moisture brings the risk of strength and stiffness loss.
Undried, newly sawn timber is usually dried to particular target moisture content in drying kilns. Target moisture content describes the desired average moisture content for a batch of wood and the allowable moisture content of the individual pieces in the batch. It is defined in the standard EN 14298 [8]. The acceptable moisture content in wood depends on the final use of the wood, the type and thickness of the wood, and the average relative humidity (RH) in the environment where the wood is to be used. Based on common guidelines or recommendations, the acceptable moisture content for wood objects used indoors is 9–14% for construction. For the coastal climates, the EMC of wood is higher than the EMC of inland. It ranges from 12.2–16.5% [9].
The equilibrium moisture content (EMC) of wood is a state corresponding to the air temperature and relative moisture, in which the moisture content of the wood remains steady. Pre-dried timber reaches its equilibrium moisture content in a couple of weeks. The saturation point of wood grain means the ratio of moisture in the wood when the cell walls are saturated with water, but no free water appears in the cell lumina. As it dries, wood begins to contract, when its moisture content falls below the saturation point. Correspondingly, as wood gets wet, expansion ends at the saturation point. As wood dries, its strength properties improve significantly when the moisture content falls below the saturation point of the grain. Previous work has shown that moisture content caused by relative humidity of above 65% can reduce the stiffness in CLT [10]. Wood begins to suffer damage if its moisture content (MC) remains at over 20% for long periods of time [9,10,11].
The decisive factor in the development of fungi and putrefactive processes in wooden constructions is excessive humidity. Dry wood does not rot, even if it is infected with fungi. Even if the lowest relative humidity for germination of some species of fungi is 62–65%, experiments on common building and finishing materials indicate that susceptible surfaces can be kept free of fungal growth if the relative humidity is maintained below 75–80% (mold fungi do not grow below relative humidity of 75% within a temperature range of 5–40 °C [12].
In practice, it can be found that the minimum moisture content of wood necessary for mold development is within 22–24%. Wood whose MC does not exceed 20% is protected against any common fungus causing decay [13].
In reality, we observe continual changes in relative humidity and temperature on surfaces and in building structures. The formation of mold depends, therefore, on the type of building material used for the construction, relative humidity, and temperature. Clearly, the impact of the relative humidity of the outdoor climate does not make it possible for the relative humidity in building structures to fall below 75–80%. As a result, it is not practicable to establish a single limit value for the hygrothermal design of building structures. Instead, mold growth formation should be described by dynamic models that take into account fluctuations in relative humidity and the time needed for mold growth on a given material. This requires the use of dynamic data on the relative humidity and temperature in the structure or material. These can be either measured or calculated with simulation tools. Another widely used mold growth model, which is applicable to many materials, is the isopleth model and its extension, the transient biohygrothermal model [14,15]. Isopleths show the mold growth rate and the lowest boundary lines of possible fungus activity. Dynamic mold growth models are very useful in assessing the hygrothermal performance of building assemblies.
Research has found that CLT offers less air permeability and has greater capacity for storing humidity in comparison to light-weight timber construction [16]. The factor that has a key impact on its durability and long-term proper functioning is the moisture level in the material and the environment. It is therefore necessary to design a layer system that will allow proper CLT operation by maintaining a safe level of moisture content in the partition and not allowing condensation inside the structure.
Close consideration must be given to the hygrothermal performance of building assemblies, including mold growth, for the prevention of mold and moisture problems. Several studies on timber products (including CLT and OSB—oriented strand board) using hygrothermal simulations have been carried out [17,18,19,20,21,22,23,24]. In most of them, simulation calculations were performed using the WUFI—a commercial hygrothermal simulation program (developed by Fraunhofer Institute for Building Physics). WUFI®Plus allows fully coupled heat and moisture transport problems to be modeled for different building components, such as exterior or interior walls, ceilings, and floors. Additionally, the software takes into account the heat and moisture sources and sinks located inside rooms, including ventilation, heating, cooling, dehumidification, and humidification processes.
Condensation is a common performance problem in wall structures during cold weather. Despite the possibility of reducing the quantity and occurrence of condensation owing to the air barrier and vapor control layers, it is the use of exterior insulation (even if it is a vapor barrier and/or air barrier) that can warm sensitive surfaces within a wall and consequently decrease or remove condensation risk.
In the case of cold climates, the risk of increasing the moisture content of the partitions is greater because of the intensified diffusion of water vapor. This intensification results from a large difference in partial pressure of water vapor on both sides of the partition caused by a large temperature difference.
Having in mind all the above-mentioned research results, this paper attempts to test the safety in term of moisture content of the material-optimized roof construction using cross-laminated timber (CLT) in the demanding northern costal climates. The proposed roof structure meets the strength requirements. The partition is “diffusively open”, which facilitates moisture transport. However, there is a concern whether the applied layer system allows maintaining a safe level of moisture content below critical moisture content (CMC), which has been set at 20%.

2. Materials and Methods

In order to determine the risk of moisture (CMC exceeding in wooden partition layers) of the proposed structure in cold and humid climates, computer simulations were carried out using the WUFI®Plus program. In addition, an analysis was carried out using the dynamic WUFI®Biomodel.

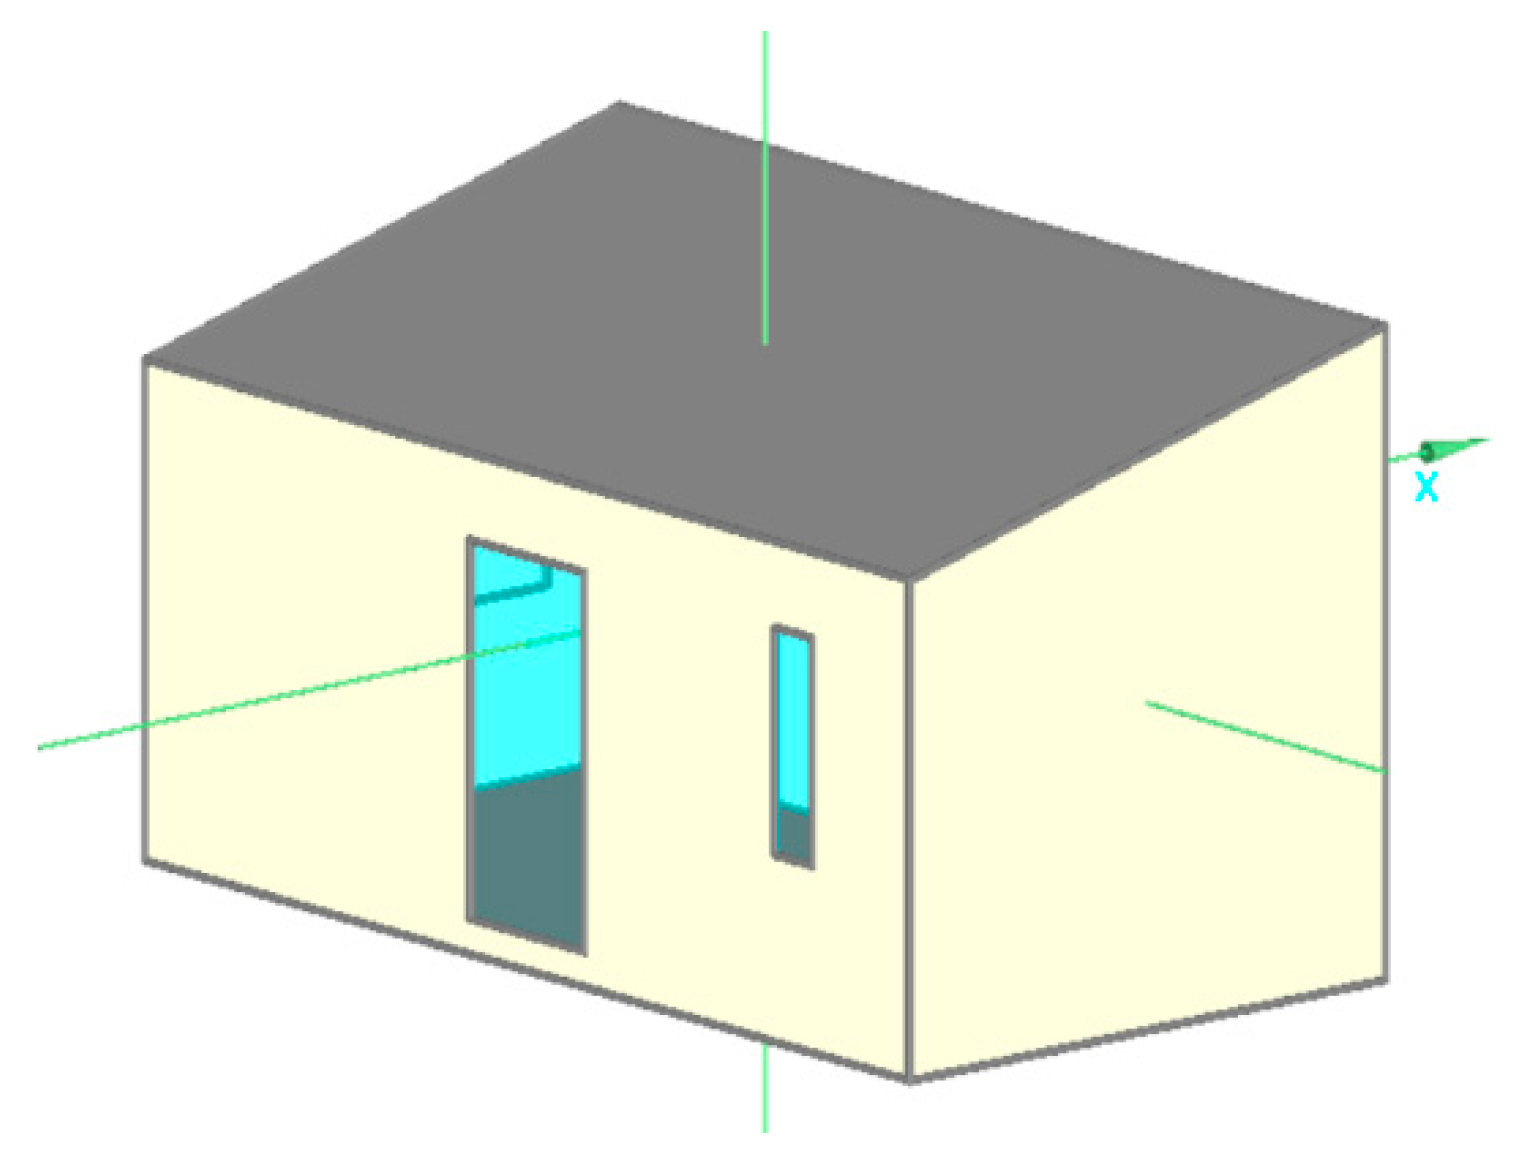
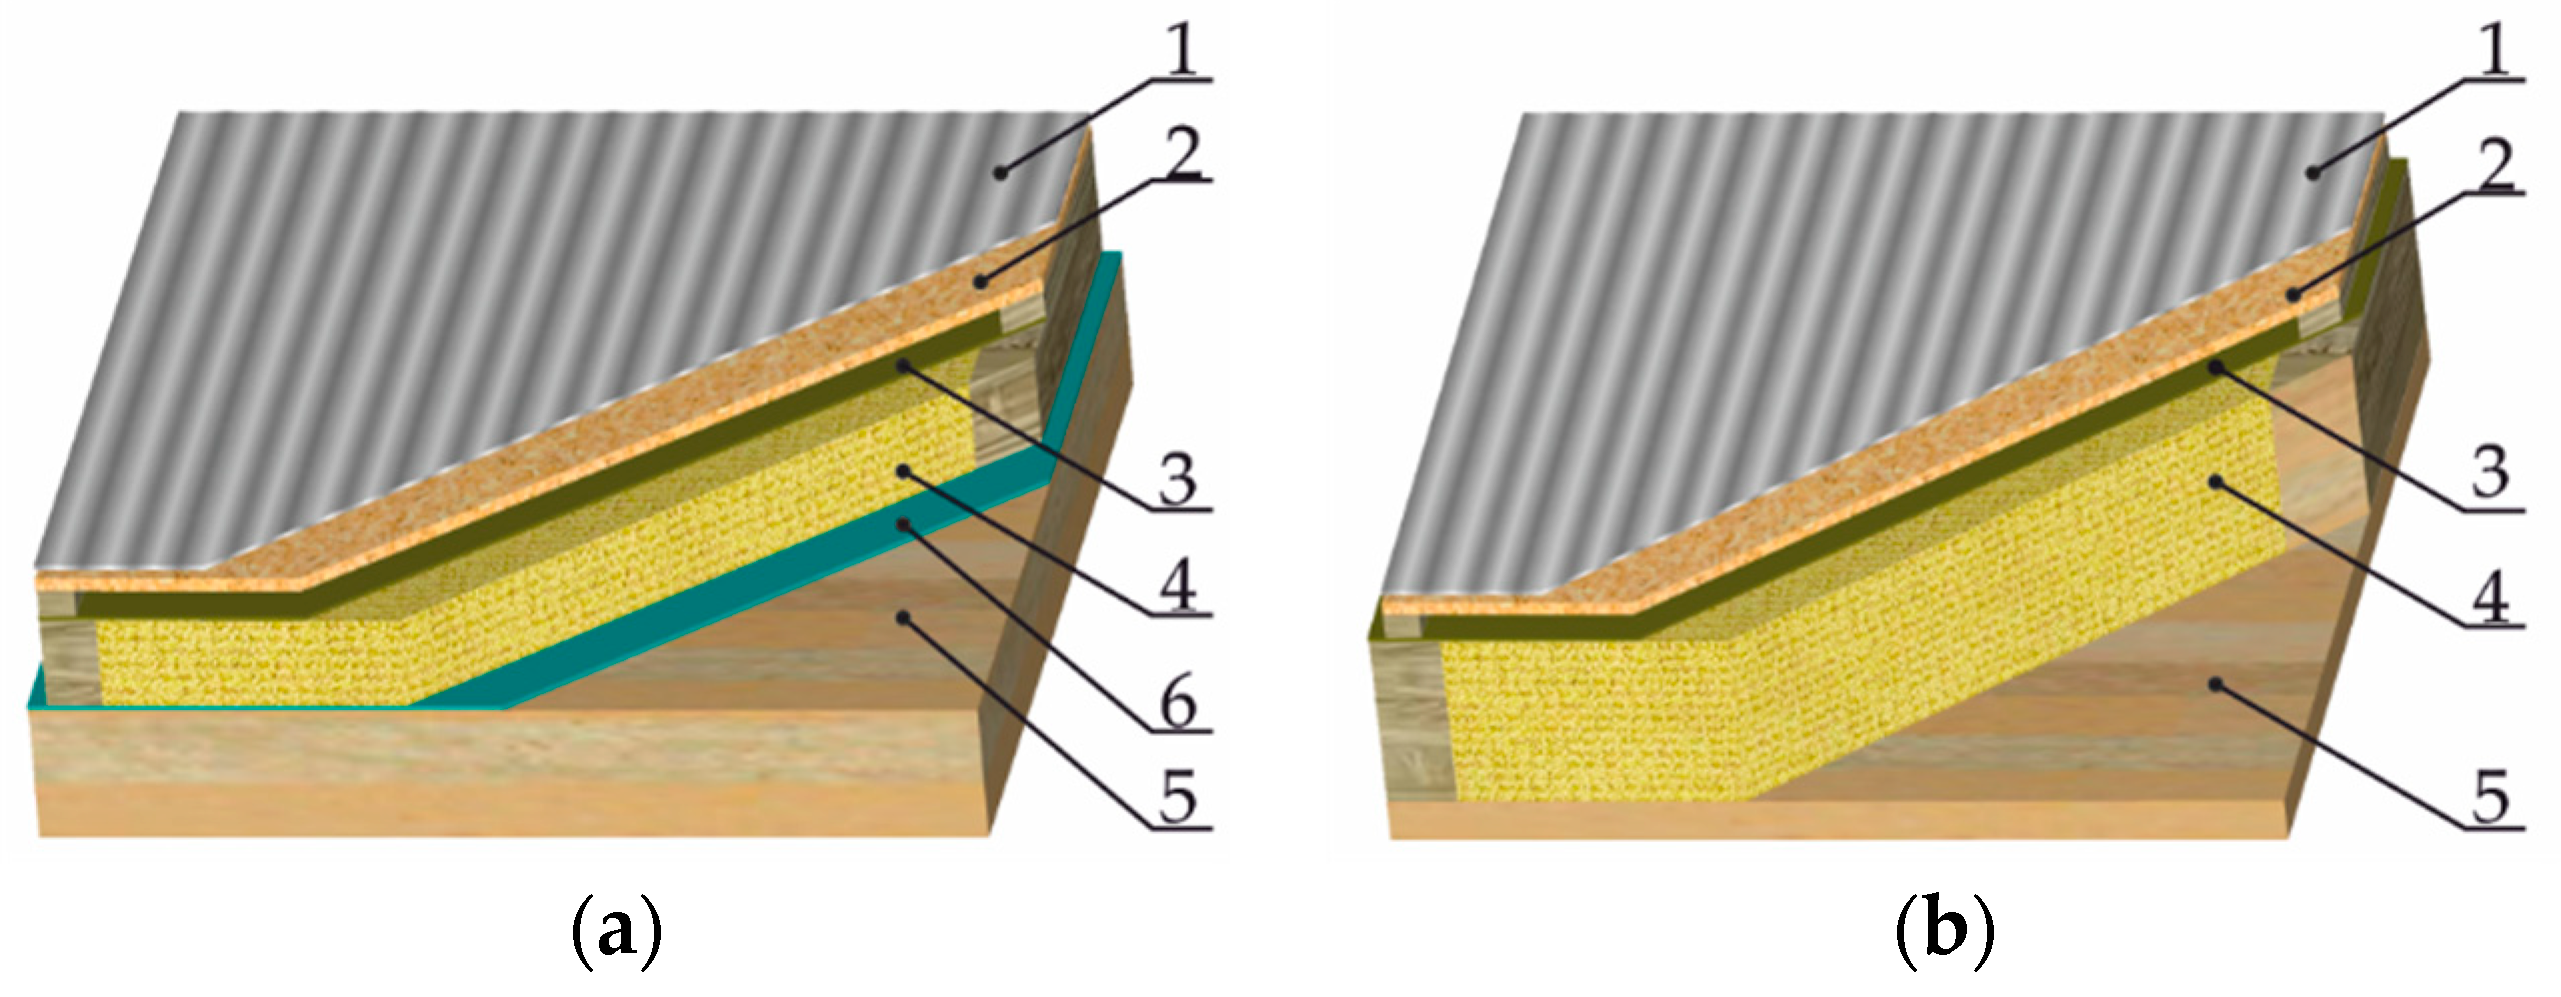
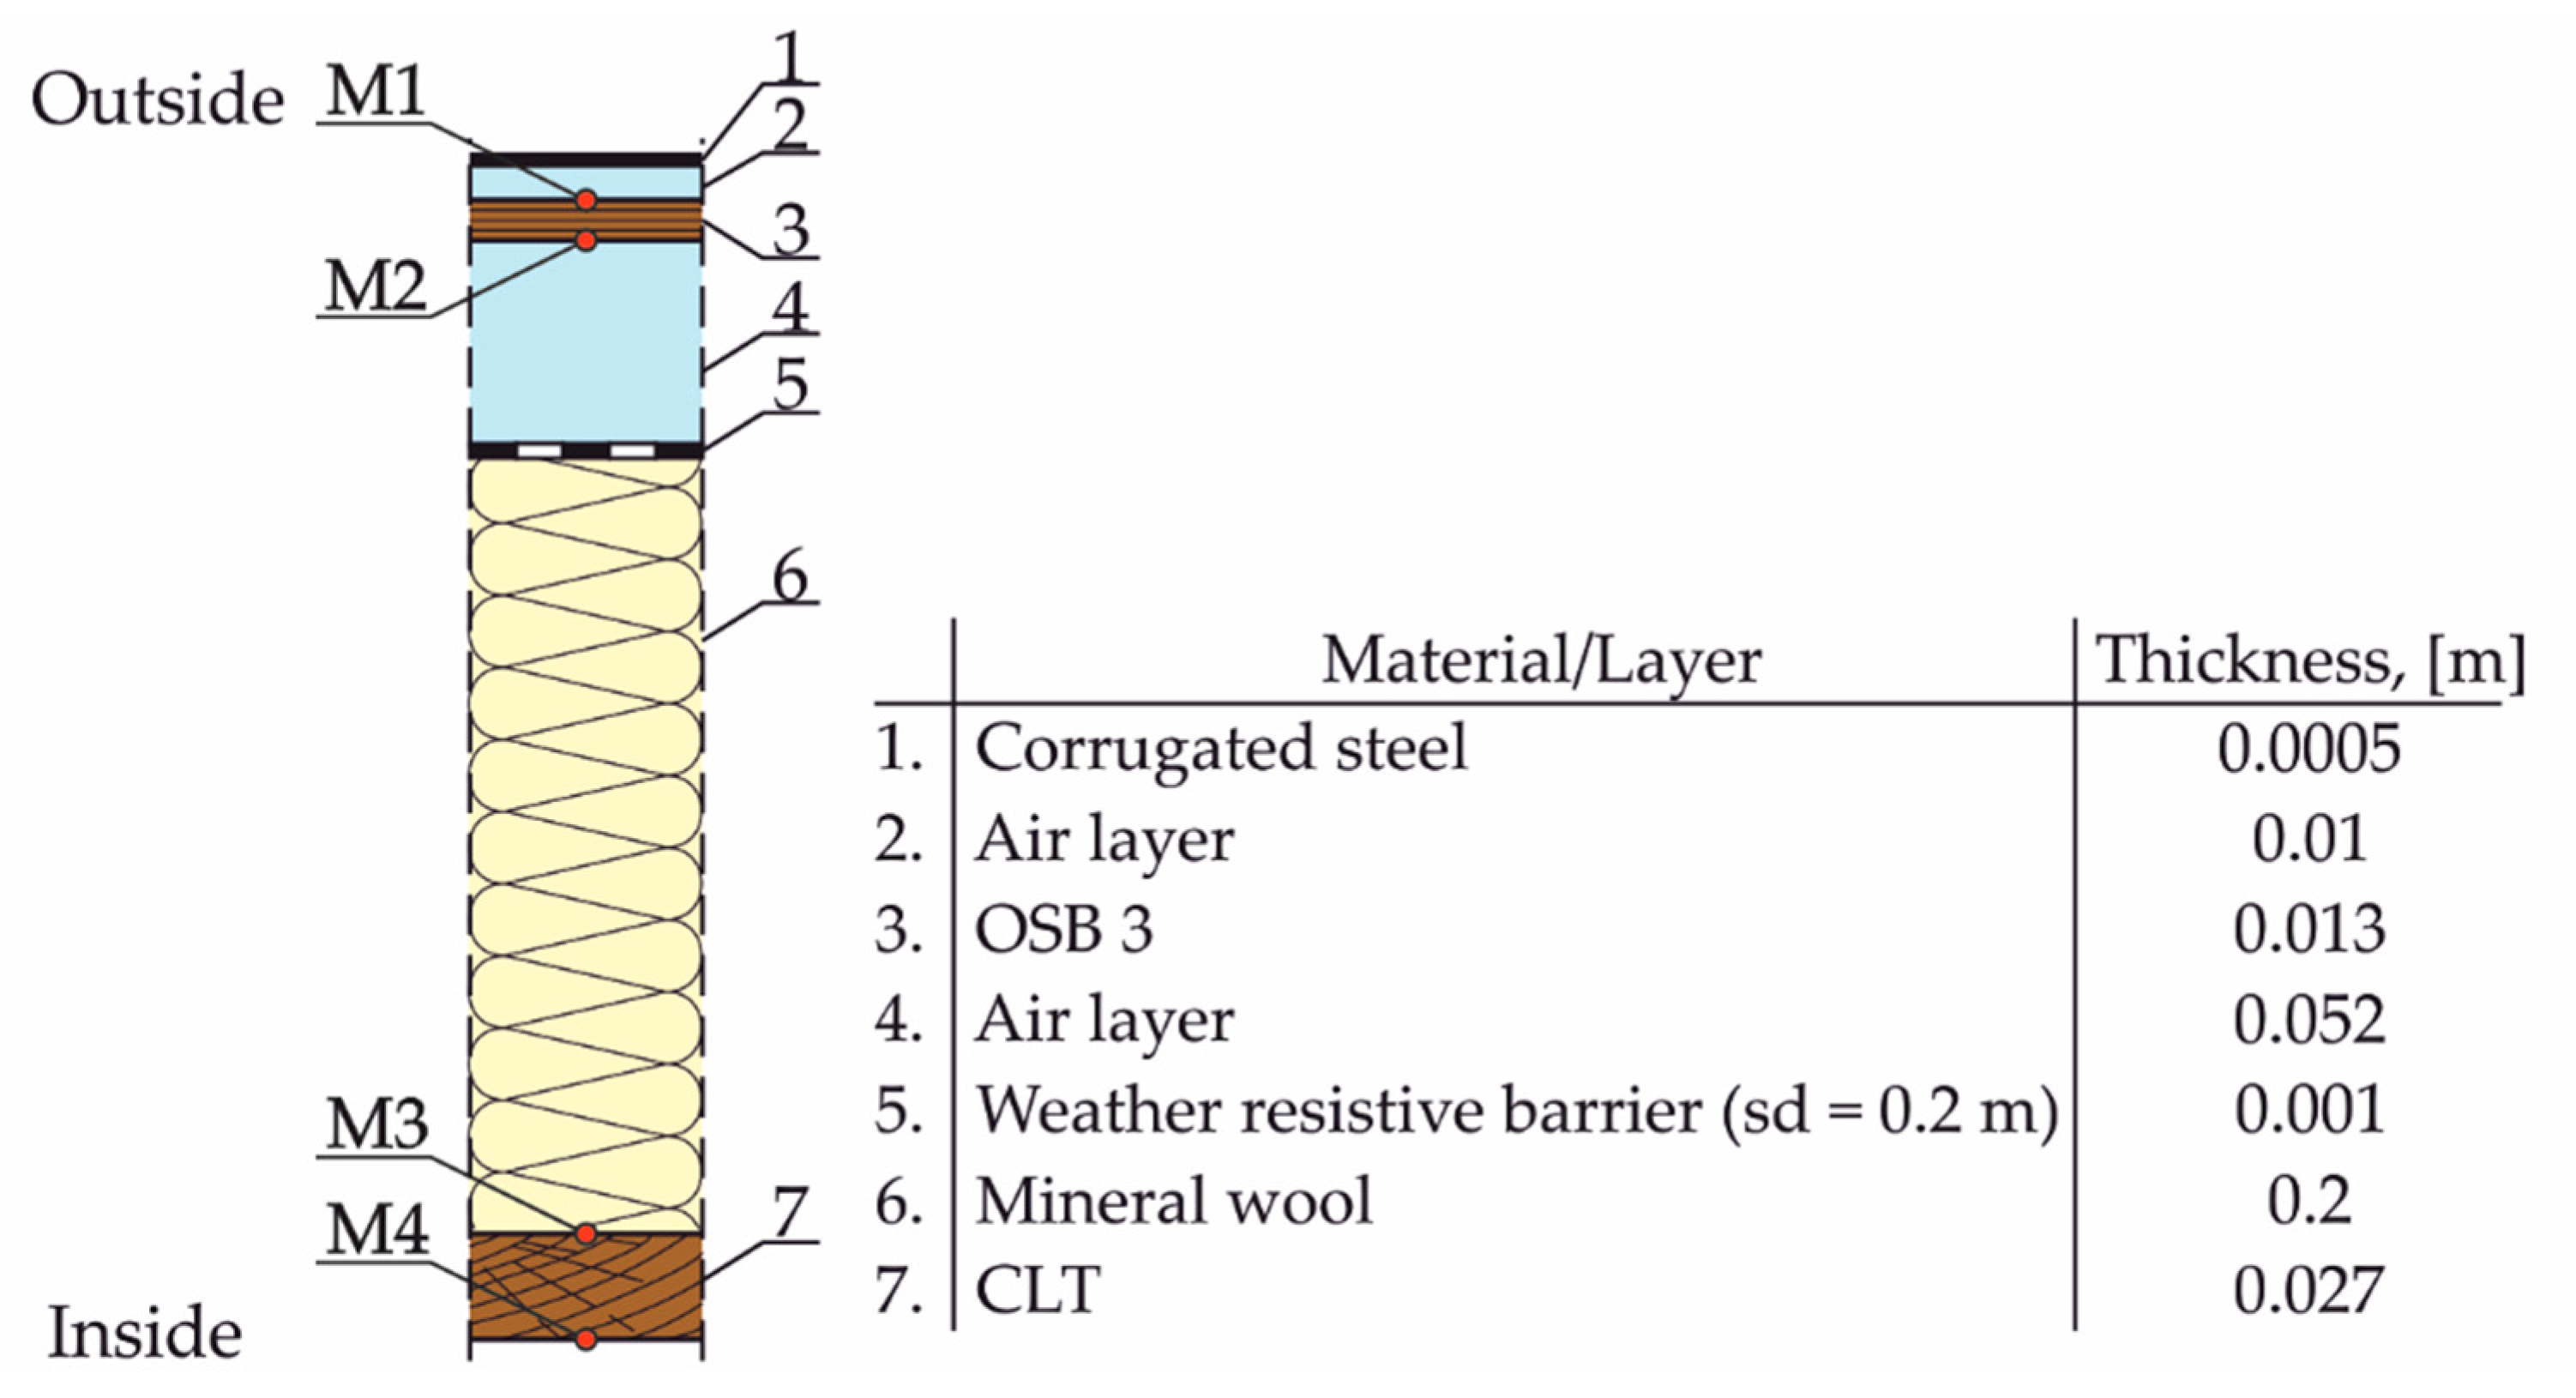
2.1. Model in WUFI®Plus

In order to make calculations, a simplified building model (Figure 1) with an area of 19 m2 and a volume of 31 m3 was created in the WUFI®Plus.
The external walls of the building are made of 68-mm CLT boards, which are the main load-bearing element of the entire structure. The CLT boards are insulated from the outside by a 200-mm layer of mineral wool. The subsequent layers of the wall comprises windproof foil and a wooden grate that is also airtight and well-ventilated. As a result, it can drain the excess moisture outside the partition. Wood siding panels constitute the most external layer of the wall. Windows installed in the building are characterized by heat transfer coefficient of U = 0.79 W · m−2 · K−1.
The floor is made of prefabricated wood panels filled with 200-mm layer of mineral wool. The whole is closed on both sides with a 27-mm thick CLT board. The panels rest on wooden beams, which are separated from the concrete foundations with a layer of waterproofing.
The model was created based on architectural plans of an existing small building that is a module of a larger commercial building. In the simulations, hygrothermal behavior of the roof was tested for various theoretical scenarios of the microclimate control in the room. It was assumed that the permissible range of temperature and RH changes will be maintained by an ideal HVAC system. Thus, the design of the external partitions, other than the roof, did not affect the results.
Typical roof constructions using CLT (Figure 2a) assume that it is the main load-bearing element, which is why CLT boards are used where the thickness exceeds 100 mm and can reach up to 500 mm. In such a solution the rafter structure is replaced by homogeneous construction layer. However, this solution is also material-intensive. The subject structure of the roof slope is a type of hybrid solution in which a traditional rafter structure reinforced with a 27 mm thick CLT panel (three layers, each 9 mm thick) is used (Figure 2b). In traditional solutions, the thick CLT board fulfills the bearing function and is responsible for the rigidity of the structure. In the proposed solution, the rafters provide adequate load bearing capacity, and the thin CLT board is responsible for the rigidity of the structure. This partition structure enables optimal use of the raw material while maintaining the desired strength. In addition, no vapor-tight foil is used in the discussed structure, only a windproof foil with negligible diffusion resistance from the outside of the mineral wool, because of which the structure is diffusively open.
Figure 3 presents the system of layers in the roof partition model. In order to ensure calculation formula simplicity, the non-regular space below the corrugated plate sheet has been replaced by a 10-mm air layer. The subject of the analysis is mainly the risk of moisture condensation on wood-based elements of the rooftop structure. In the model, these elements are represented by an OSB and a CLT layer. Therefore, the model includes “monitors” on the external and internal surfaces of the above layers. The numbering of the monitors is shown in the Figure 3 (M1, M2 for OSB and M3, M4 for CLT).
For the purpose of the calculations, materials, whose properties were closest to the ones used in the building were selected. In the case of some materials, their properties were determined more closely based on the provided technical data sheets. According to research [23], the adoption of data from the WUFI®plus database gives satisfactory results of simulation calculations.

2.2. Bounduary Conditions and Assumptions

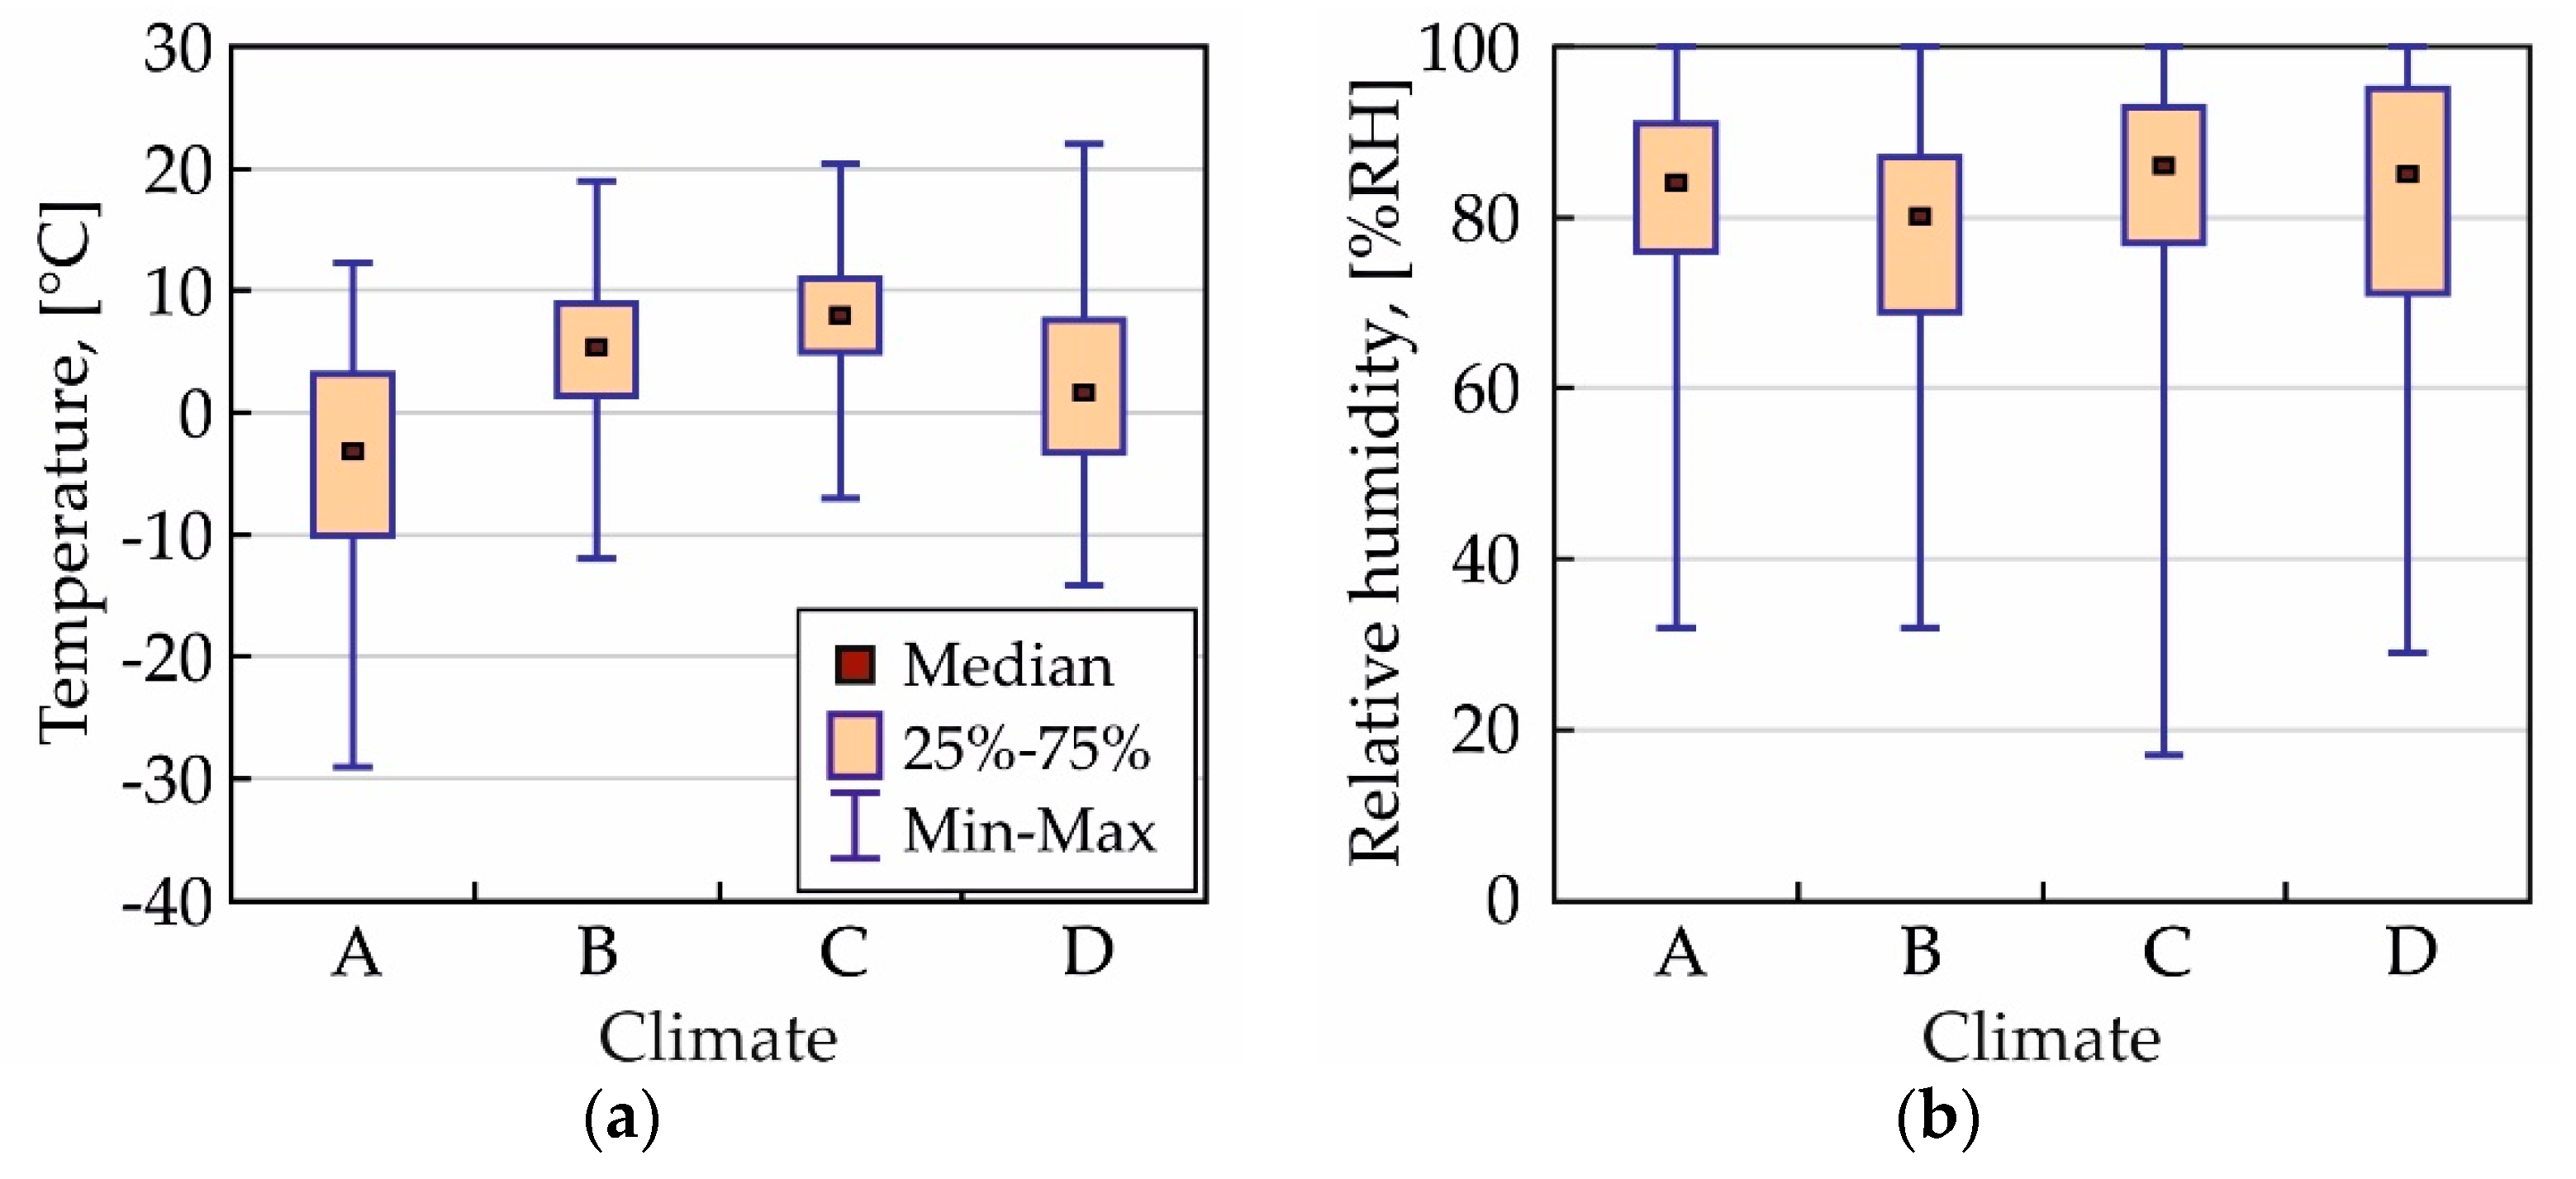
2.2.1. External Climate

Four typical meteorological years (TMY) representing cold coastal European climates were selected for the calculation: Aasiaat-Egedesminde (68°42′35″ N; 52°52′10″ W) for western Greenland (climate A), Reykjavik (64°08′ N; 21°56′ W) for Iceland (climate B), Wick (58.454° N 3.089° W) for northern Scotland (climate C), and Tromsø (69°40′ N 18°56′ E) for northern Norway (climate D). Climates for Greenland (GRL_QA_Aasiaat-Egedesminde.042200_TMYx.epw), Iceland (ISL_HO_Reykjavik.AP.040300_TMYx.epw), and Scotland (GBR_SCT_Wick.AP.030750_TMYx.epw) were taken from the website [25]. The statistical climate for Norway was taken from the WUFI®Plus database.
Climate A is the coldest one of the four climates under research (Figure 4). The minimum temperature according to TMY is −29 °C, the maximum reaches only 12.2 °C (the median equals −3.2°C). The climate D is warmer (median equals 1.6 °C) and with smaller temperature amplitude (−14.2–22.0 °C). The median for climate B is 5.4 °C and the range of temperature changes is −12–19.0 °C. The warmest climate is the climate C (median equals 8.0 °C). It also has the smallest temperature amplitude (−7–20.4 °C).
All climates are humid. As shown in Figure 4, the medians are 84%RH, 80%RH, 86%RH, and 85%RH for climates A, B, C, and D, respectively. The relative humidity amplitudes, except for climate C (amplitude equal to 83%RH), are similar to each other and amount to about 70%RH.
The maximum global solar radiation intensity for all locations does not exceed 785 W · m−2 and almost 50% of the year is without sunlight (Figure 5). All statistical climates used in the simulations contained data on wind direction and speed (3.62 m · s−1 for climate A, 5.8 m · s−1 for climate B, 5.9 m · s−1 for climate C and 3.25 m · s−1 for climate D), as well as rainfall heights (normal rain sum equals: 243.7 mm · a−1 for climate A, 387.9 mm · a−1 for climate B, 747.3 mm · a−1 for climate C, and 1275.8 mm · a−1 for climate D).

2.2.2. Internal Climate

The model assumes an ideal HVAC system that maintains a minimum indoor temperature of 20 °C. Preliminary calculations have shown that, except for the climate C, the sole use of heating in winter keeps the relative humidity below 40%RH:
climate A—RH = 11.3 ÷ 26.5%,
climate B—RH = 23.1 ÷ 37.5%,
climate C—RH = 32.0 ÷ 44.1%,
climate D—RH = 18.0 ÷ 36.0%.
Therefore, variants with year-round air humidification with a set point of minimal relative humidity: 40%RH, 50%RH, and 60%RH as well as RH free floating were tested. Thus, 16 variants of external and internal climates were tested. Their designations are summarized in the Table 1.

2.2.3. Initial Moisture Content in Wooden Elements

In the basic calculations, the initial moisture content in wooden elements of the structure was assumed to be 10% (59.5 kg · m−3 and 41.0 kg · m−3 for OSB and CLT respectively). The effect of increasing the initial MC to 16% (95.2 kg · m−3 and 65.6 kg · m−3 for OSB and CLT respectively) was also investigated.

2.2.4. Air Change Rate

The building design assumes mechanical ventilation. It was assumed that the air change rate (ACH) for the building is equal to 0.6 h−1. This corresponds to the second category of air quality according to EN 16798-1 [26].
When the wind blows at a speed of 2–5 m · s−1, it creates a pressure of 1–6 Pa in the cavities, which in turn causes the flow of ventilating air at a speed of 0.2–0.5 m · s−1 [27]. The minimum area of inlets to the ventilation space is defined by the standard DIN 4108-3 [28] at the level of 2‰ of roof area. Taking this into account, the minimum area of inlets for ventilation slots was determined. Assuming that winds in selected locations blow at average speeds in the 3.25–5.9 m · s−1 range, the ACH in these cavities in the 4 ÷ 7 h−1 range was estimated. However, with proper partition structure and strong winds, ACH may exceed 50 h−1 [29]. The lower the number of air exchanges in the ventilated layer of the partition, the greater the risk of critical moisture content (CMC). Therefore, it was decided to test only poor ventilation of cavities. Two bases ACH was assumed: 3 h−1 and 9 h−1.
In order to examine the effect of ACH increase, calculations were made for the range 10–60 h−1, at intervals of 10 h−1. The minimum exchange rate at which there is no risk of moisture was also specified.

2.2.5. Substrate Class for Mold Growth Prediction

For the biohygrothermal simulations in WUFI®Bio substrate class I (Bio-utilizable substrates, such as wall paper, plaster board, building products made of biologically degradable materials, materials for permanently elastic joints, strongly contaminated surfaces) was assumed.

3. Results and Discussion

To avoid the so-called initial error, preliminary calculations were made for two years. As a result of calculations, variability courses for temperature, relative humidity, and moisture content for individual monitors were obtained. Figure 6 shows examples of annual courses of moisture content variability for the Greenland climate and the lack of relative humidity control in indoor air and for ACH = 3 h−1. These values were compared with critical moisture content CMC = 20%. For OSB it is 119 kg · m−3, while for CLT it is equal 82 kg · m−3.
Calculations have shown (Figure 7) that in the coldest climates, i.e., A and D, with internal air relative humidity over 50%, the moisture content of roof OSB sheathing exceeds 20% (MC for OSB varied within the range 10.0–29.9%). It should be noted that the problem does not apply to the CLT board (Figure 8) where the permissible moisture content level has not been exceeded. In this case, MC varies in the range of 1.9–12.5%. Therefore, further analysis includes changes in moisture content only in OSB.
In the scenario with highest RH, the impact of RH becomes more significant in colder climates (A and D), where the difference in water vapor partial pressure on both sides of the partition triggers most intensive moisture transport through partition. For climate A, the partial pressure of the indoor air is on average 8.8 times (max 80.5) higher than the partial pressure of the indoor air, while for climate D—4.1 times (max 15.4). For climate B and C, these differences are smaller—the average values are 3.0 and 2.4, respectively (with maxima 12.3 and 7.4 times). Figure 9 presents the courses of indoor and outdoor water vapor partial pressure for all four climates for a sample winter month.
As it was expected that an increase in the number of ACH in ventilated layers resulted in a decrease in the moisture content of the tested layer (Figure 10). For ACH = 9 h−1 CMC exceedances were noted only for variants AIV and DIV. For the least favorable option (DIV), the maximum MC slightly exceeds the critical value and amounts to 21.1%.
The annual share of CMC exceedances also decreased. At ACH = 3 h−1 for M2, these exceedances were 27%, 67%, 5%, and 53% for scenarios AIII, AIV, DIII and DIV respectively. At ACH = 9 h−1 only 22% and 5% for AIV and DIV, respectively. For M1, exceedances were reported only at ACH = 3 h−1 for variants AIV and DIV. They amounted to 38% and 29% respectively.

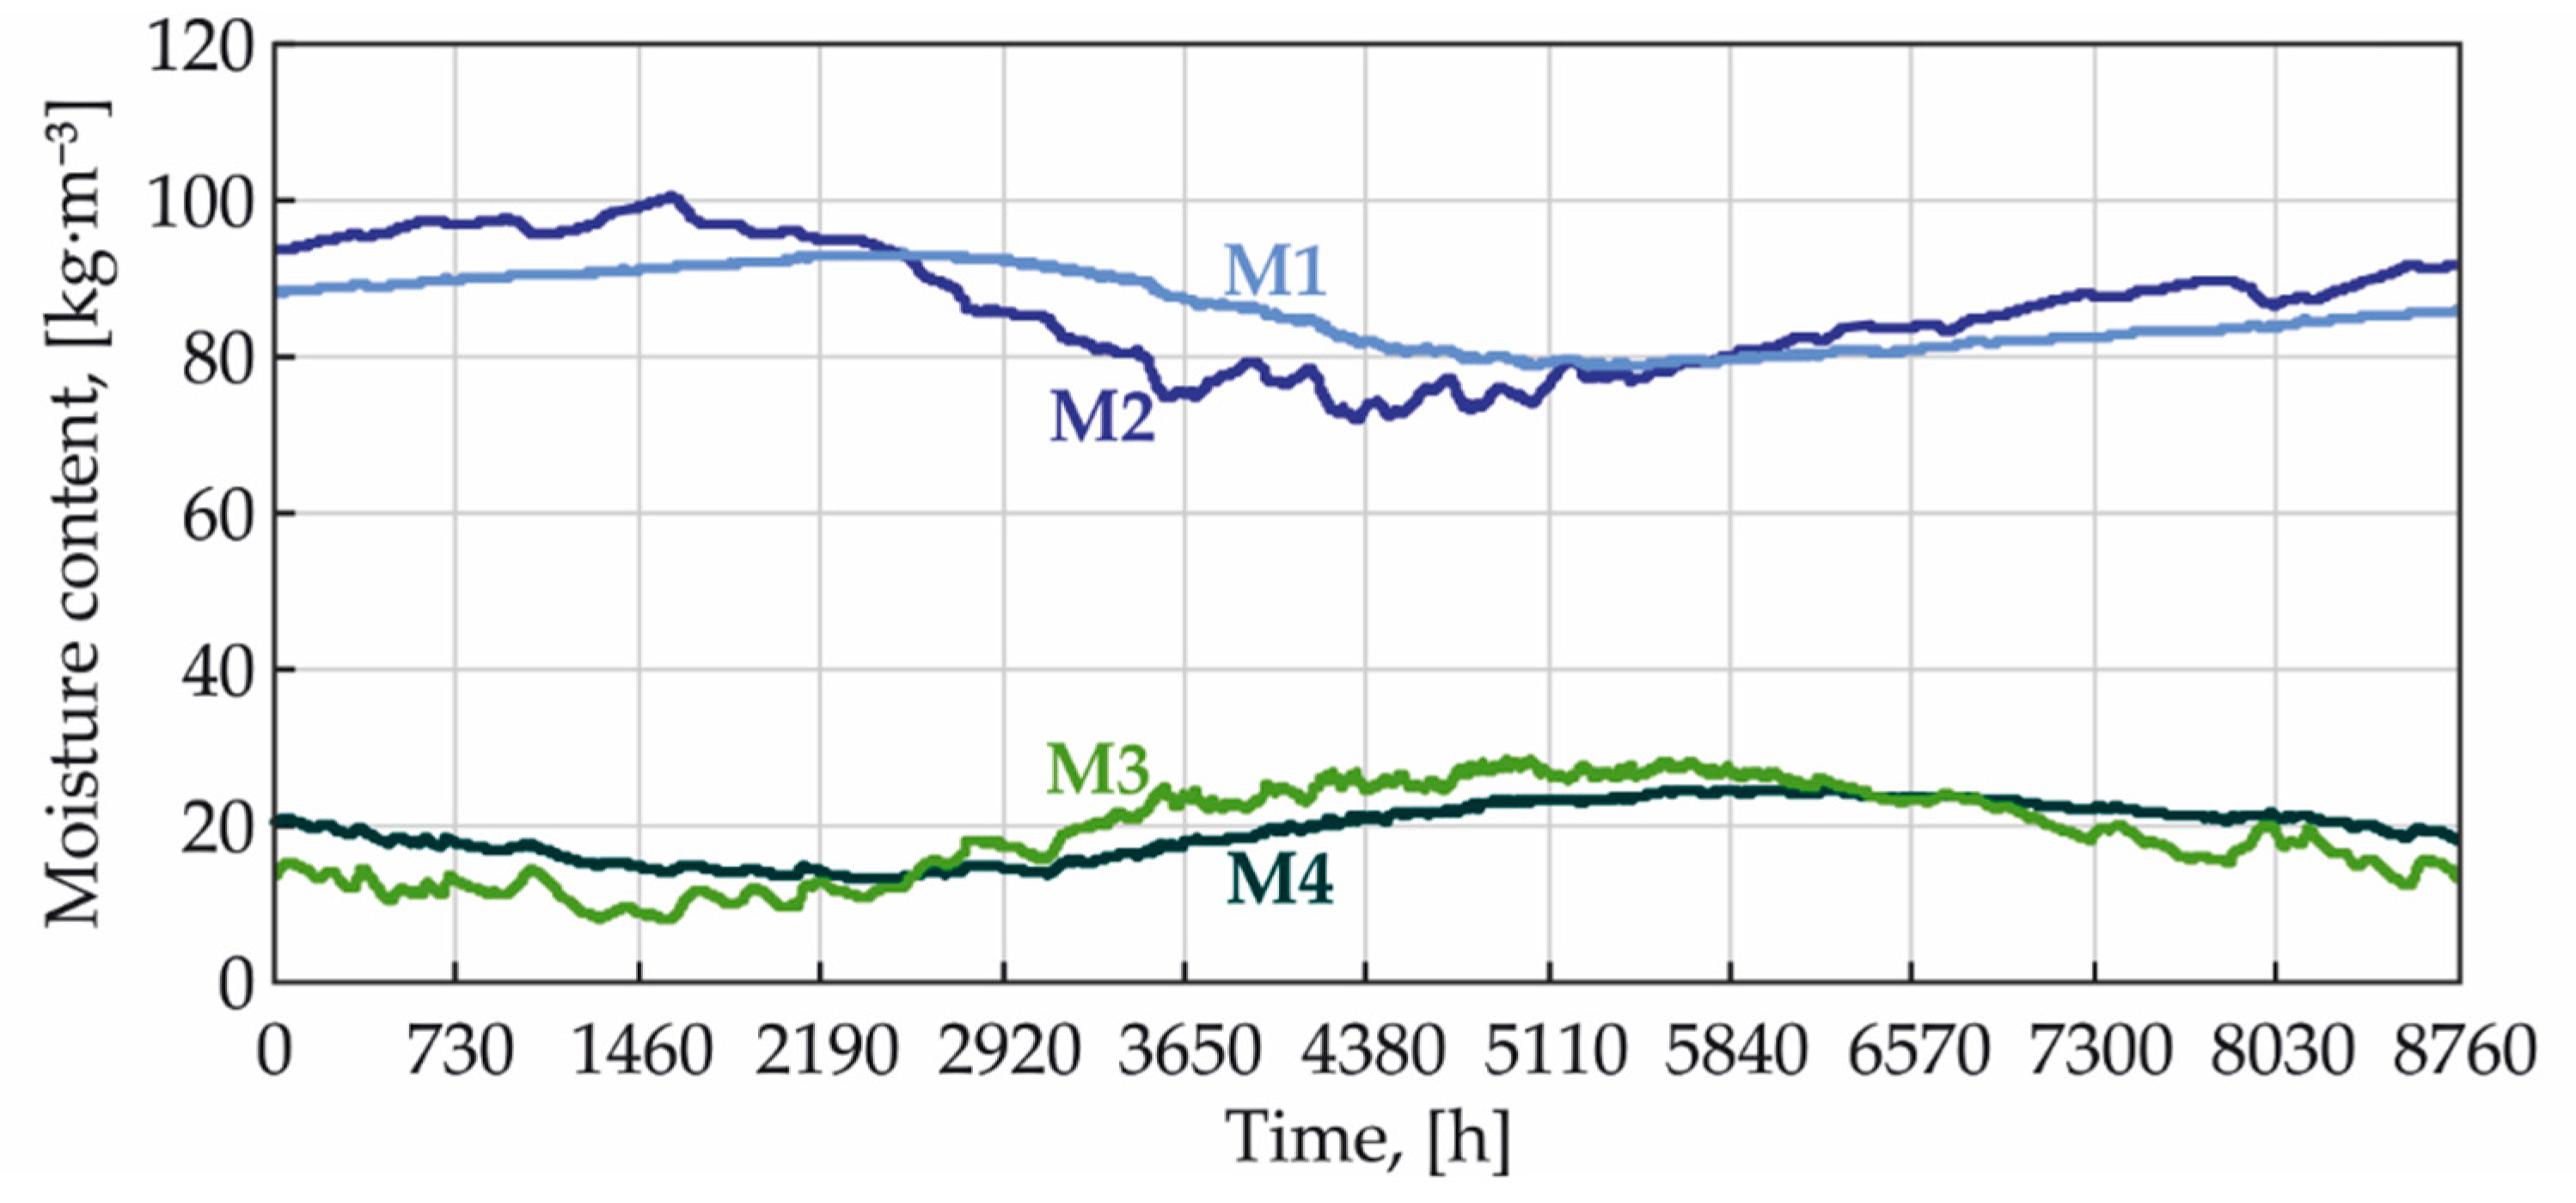
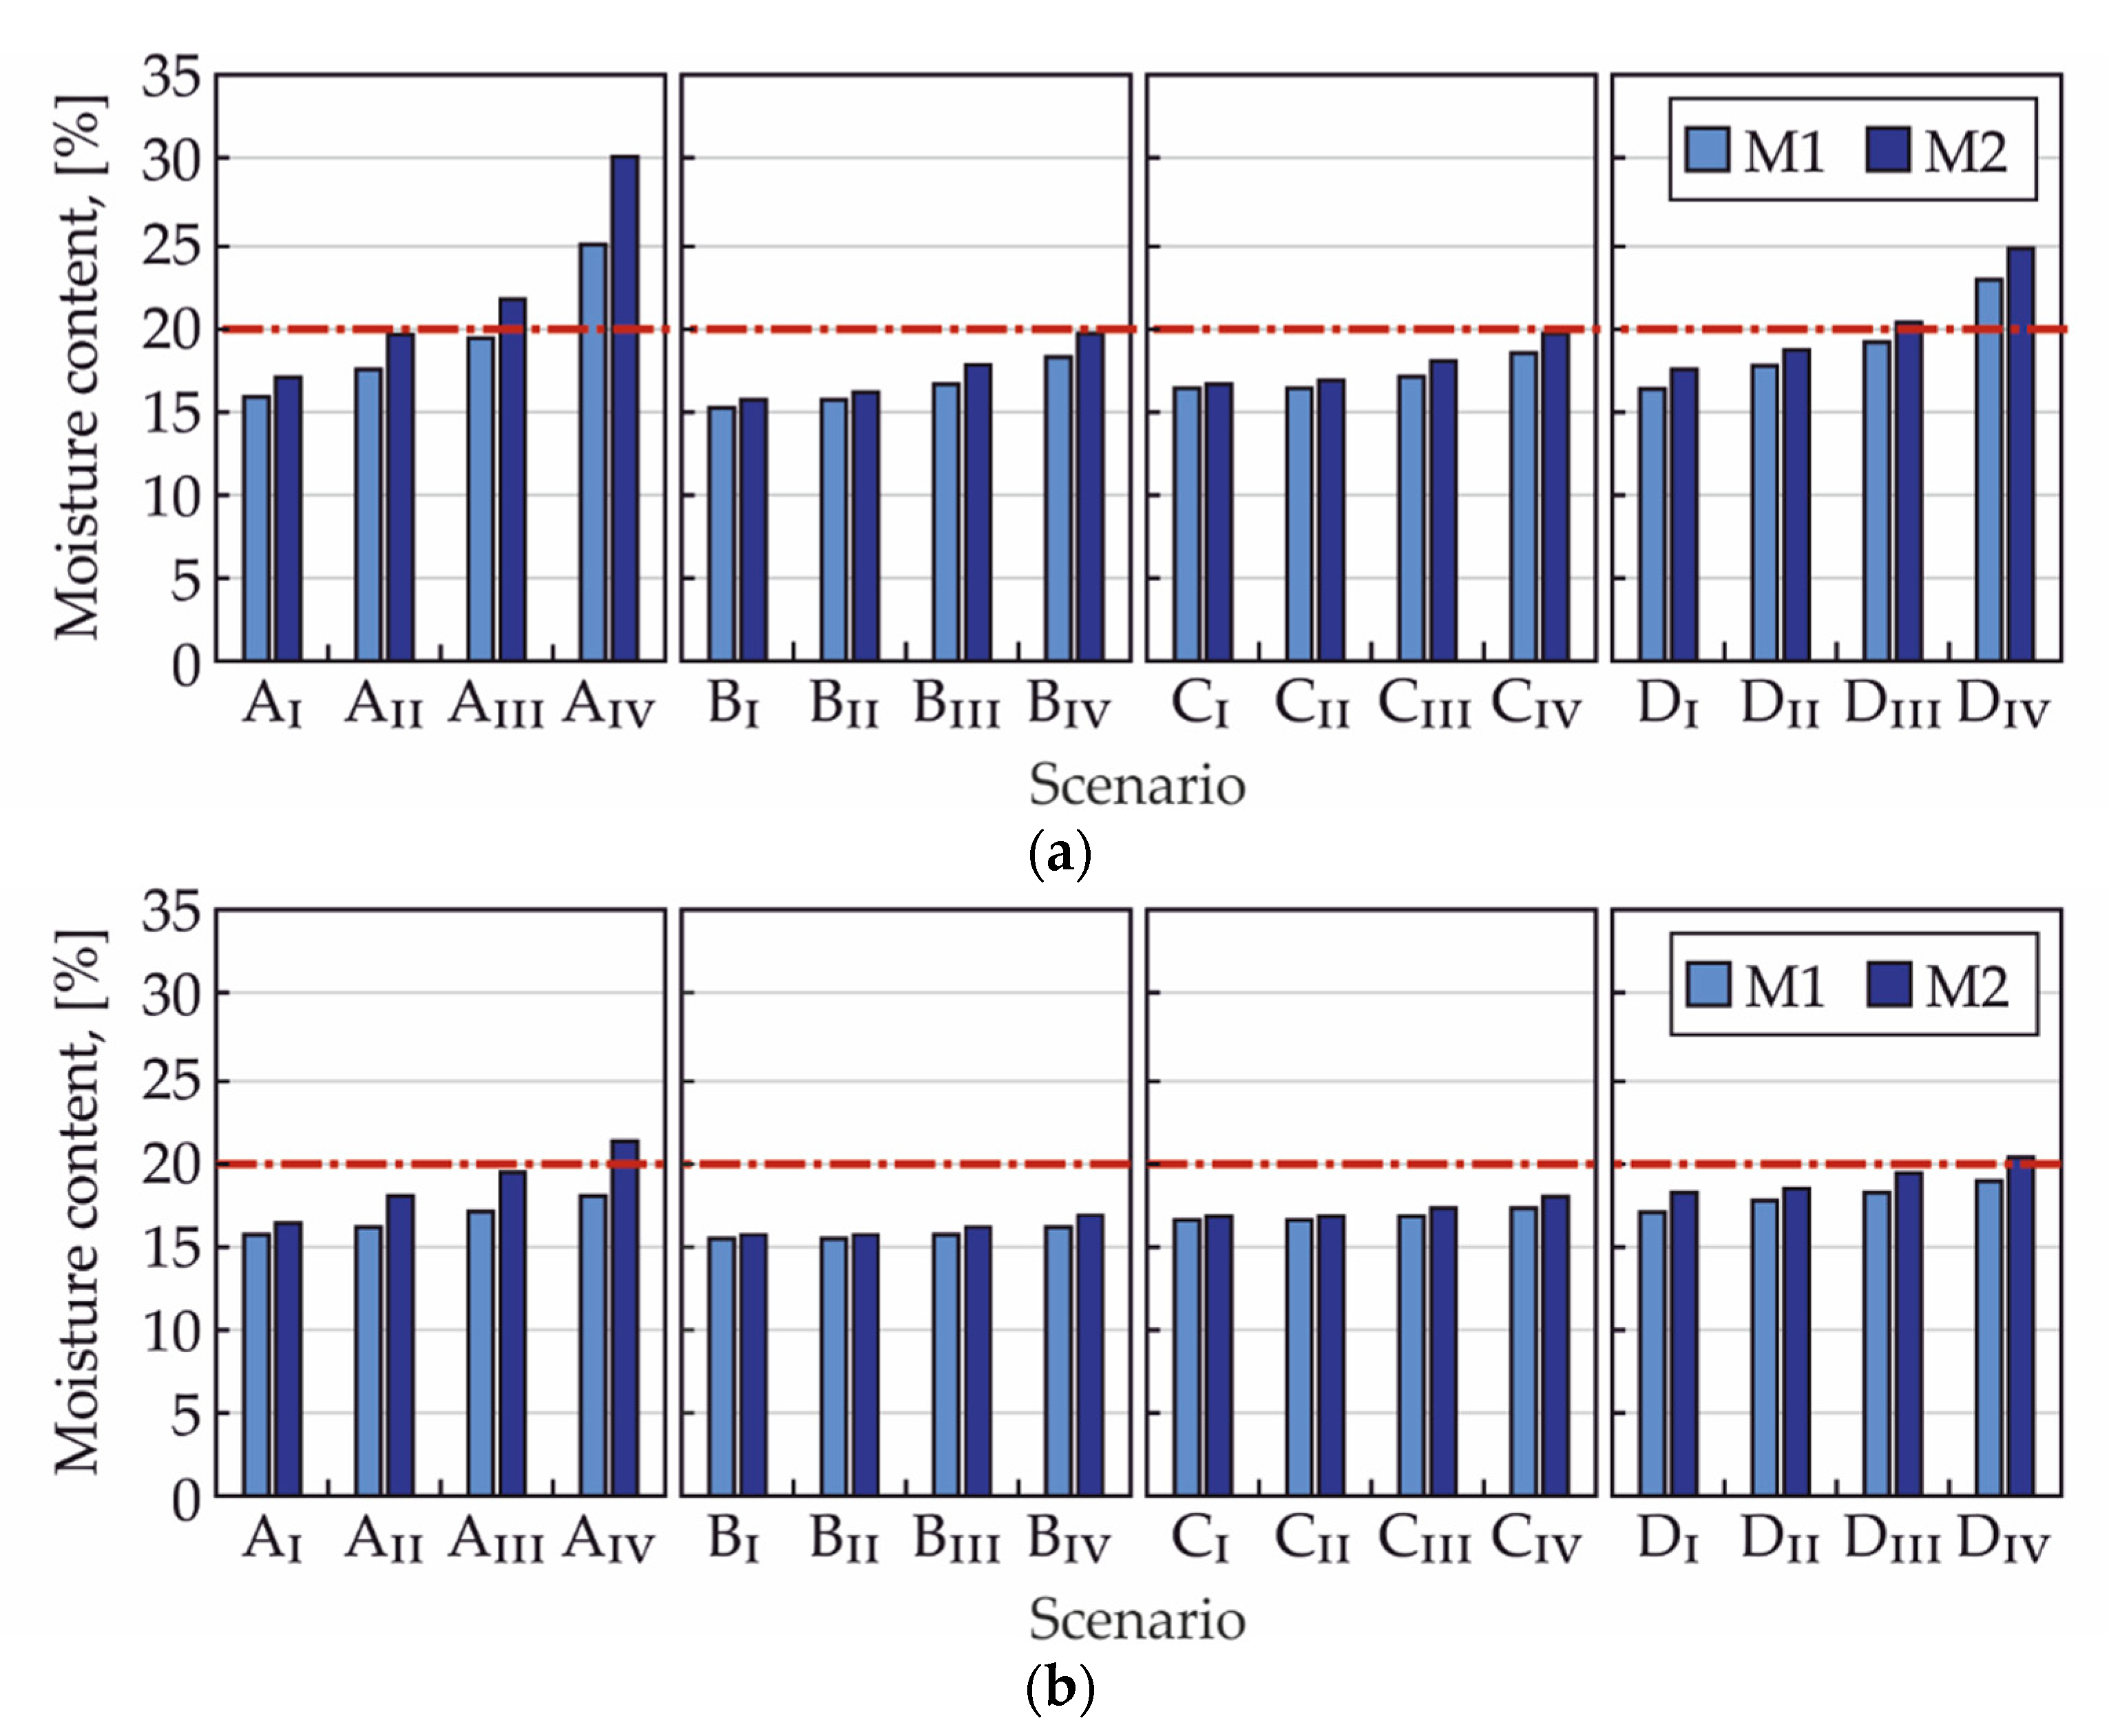
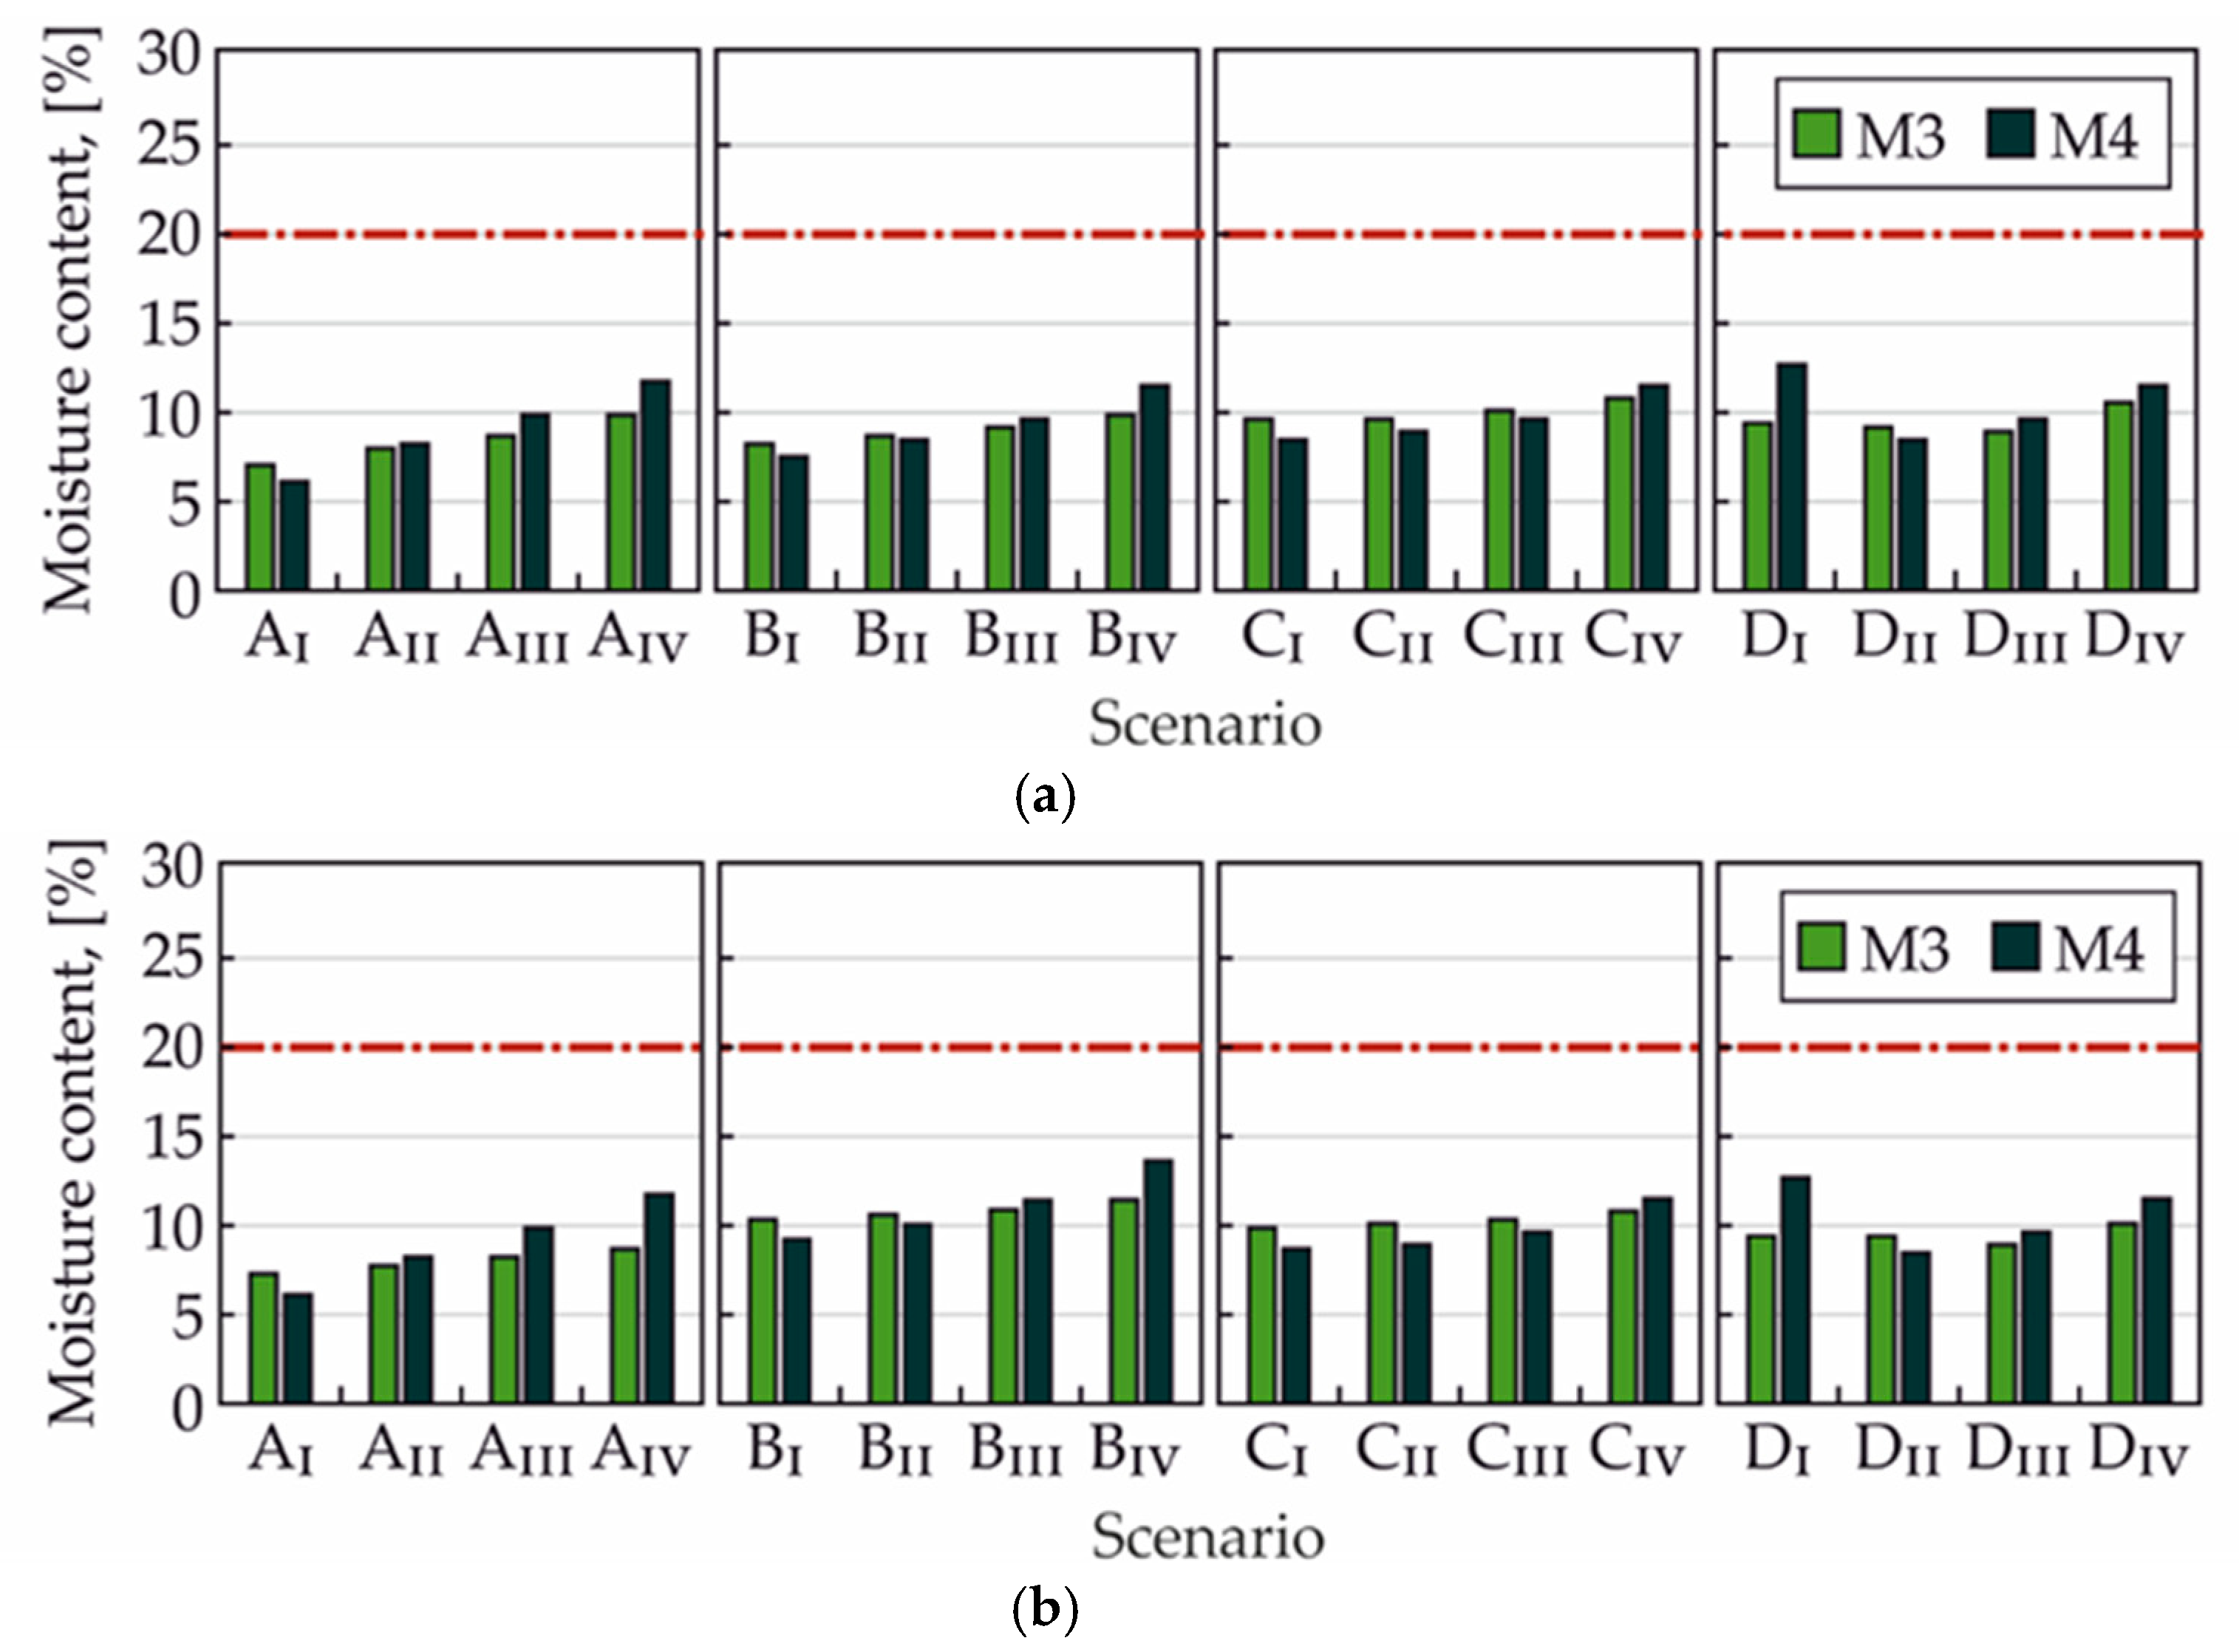
3.1. Impact of Initial Moisture Content

Basic calculations were made for the initial MC, in wood-based elements, equal to 10%. To estimate the effect of increased initial MC, additional calculations were made in which the MC was increased to 16% (for marine climates it can reach 16.5%) [9].
This increase resulted in a significant increase in MC for OSB. In the third year of simulation for variant AIV for ACH = 3 h−1 MC changed in the range 20.6–36.5%. It means that in this variant, the CMC exceeded throughout the year. After increasing the ACH to 9 h−1, the range of MC changes was 13.2–21.7%. For variants I and II, regardless of the external climate and ACH, MC values greater than 20% were not recorded. The moisture content for the CLT layer did not exceed 20% for any variant.

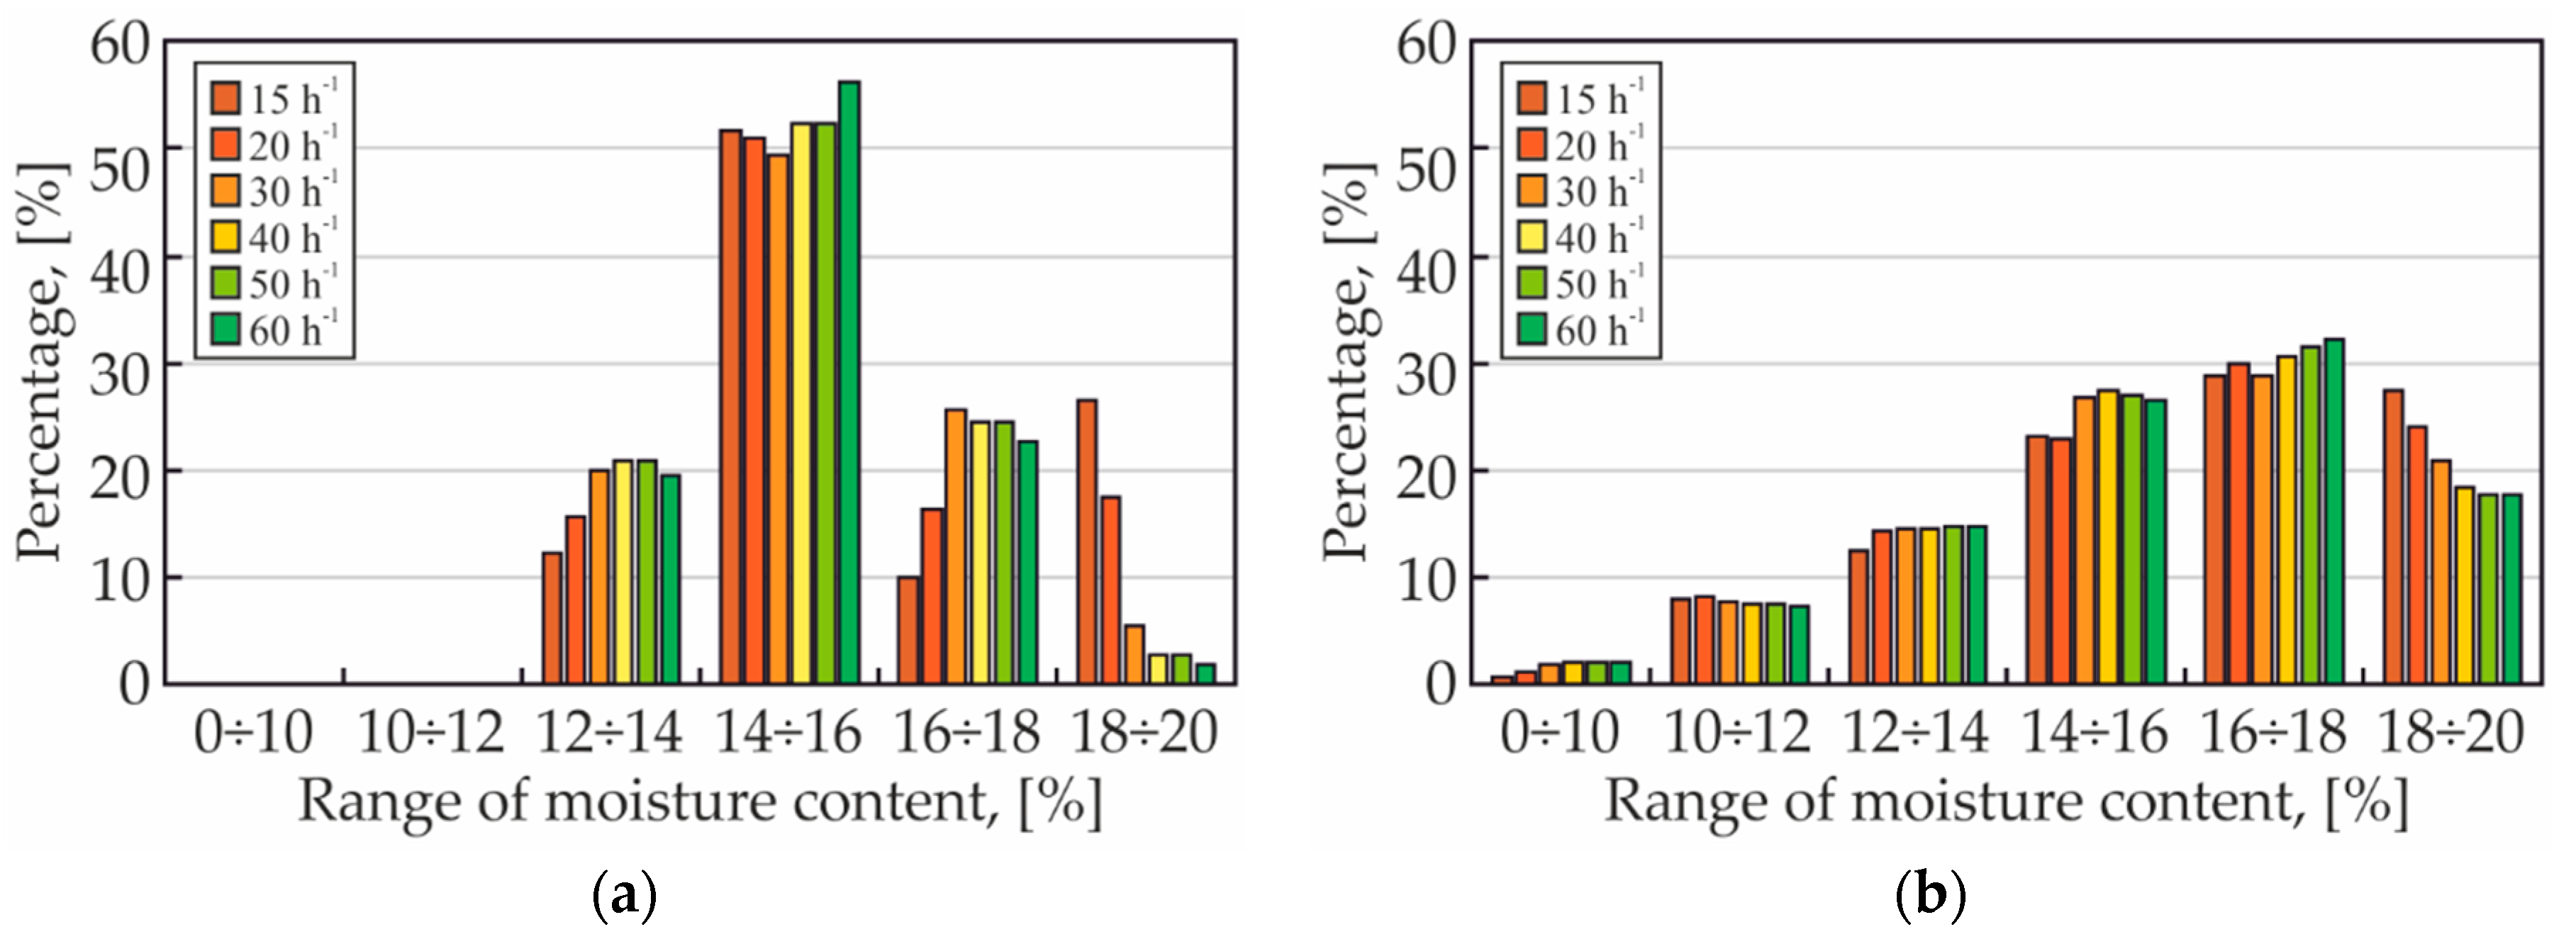
3.2. Impact of Increase in Air Change Rate in Ventilated Cavities

In order to determine the impact of increase in ACH, simulations were carried out with ACH up to 60 h−1 (for AIV and DIV scenarios).
For AIV scenario, the minimum ACH at which MC = 20% did not exceed was 15 h−1. At 20 h−1 there was a decrease in MC to 19%. With a further increase of ACH only a reduction in the annual share of moisture content in range of 18–20% was achieved (Figure 11a).
For the scenario DIV the minimum ACH at which the CMC was not exceeded was 11 h−1. A further increase in ACH resulted in a decrease in the MC annual share in the range of 18–20%. However, starting from ACH = 40 h−1, no further decrease occurred (Figure 11b).

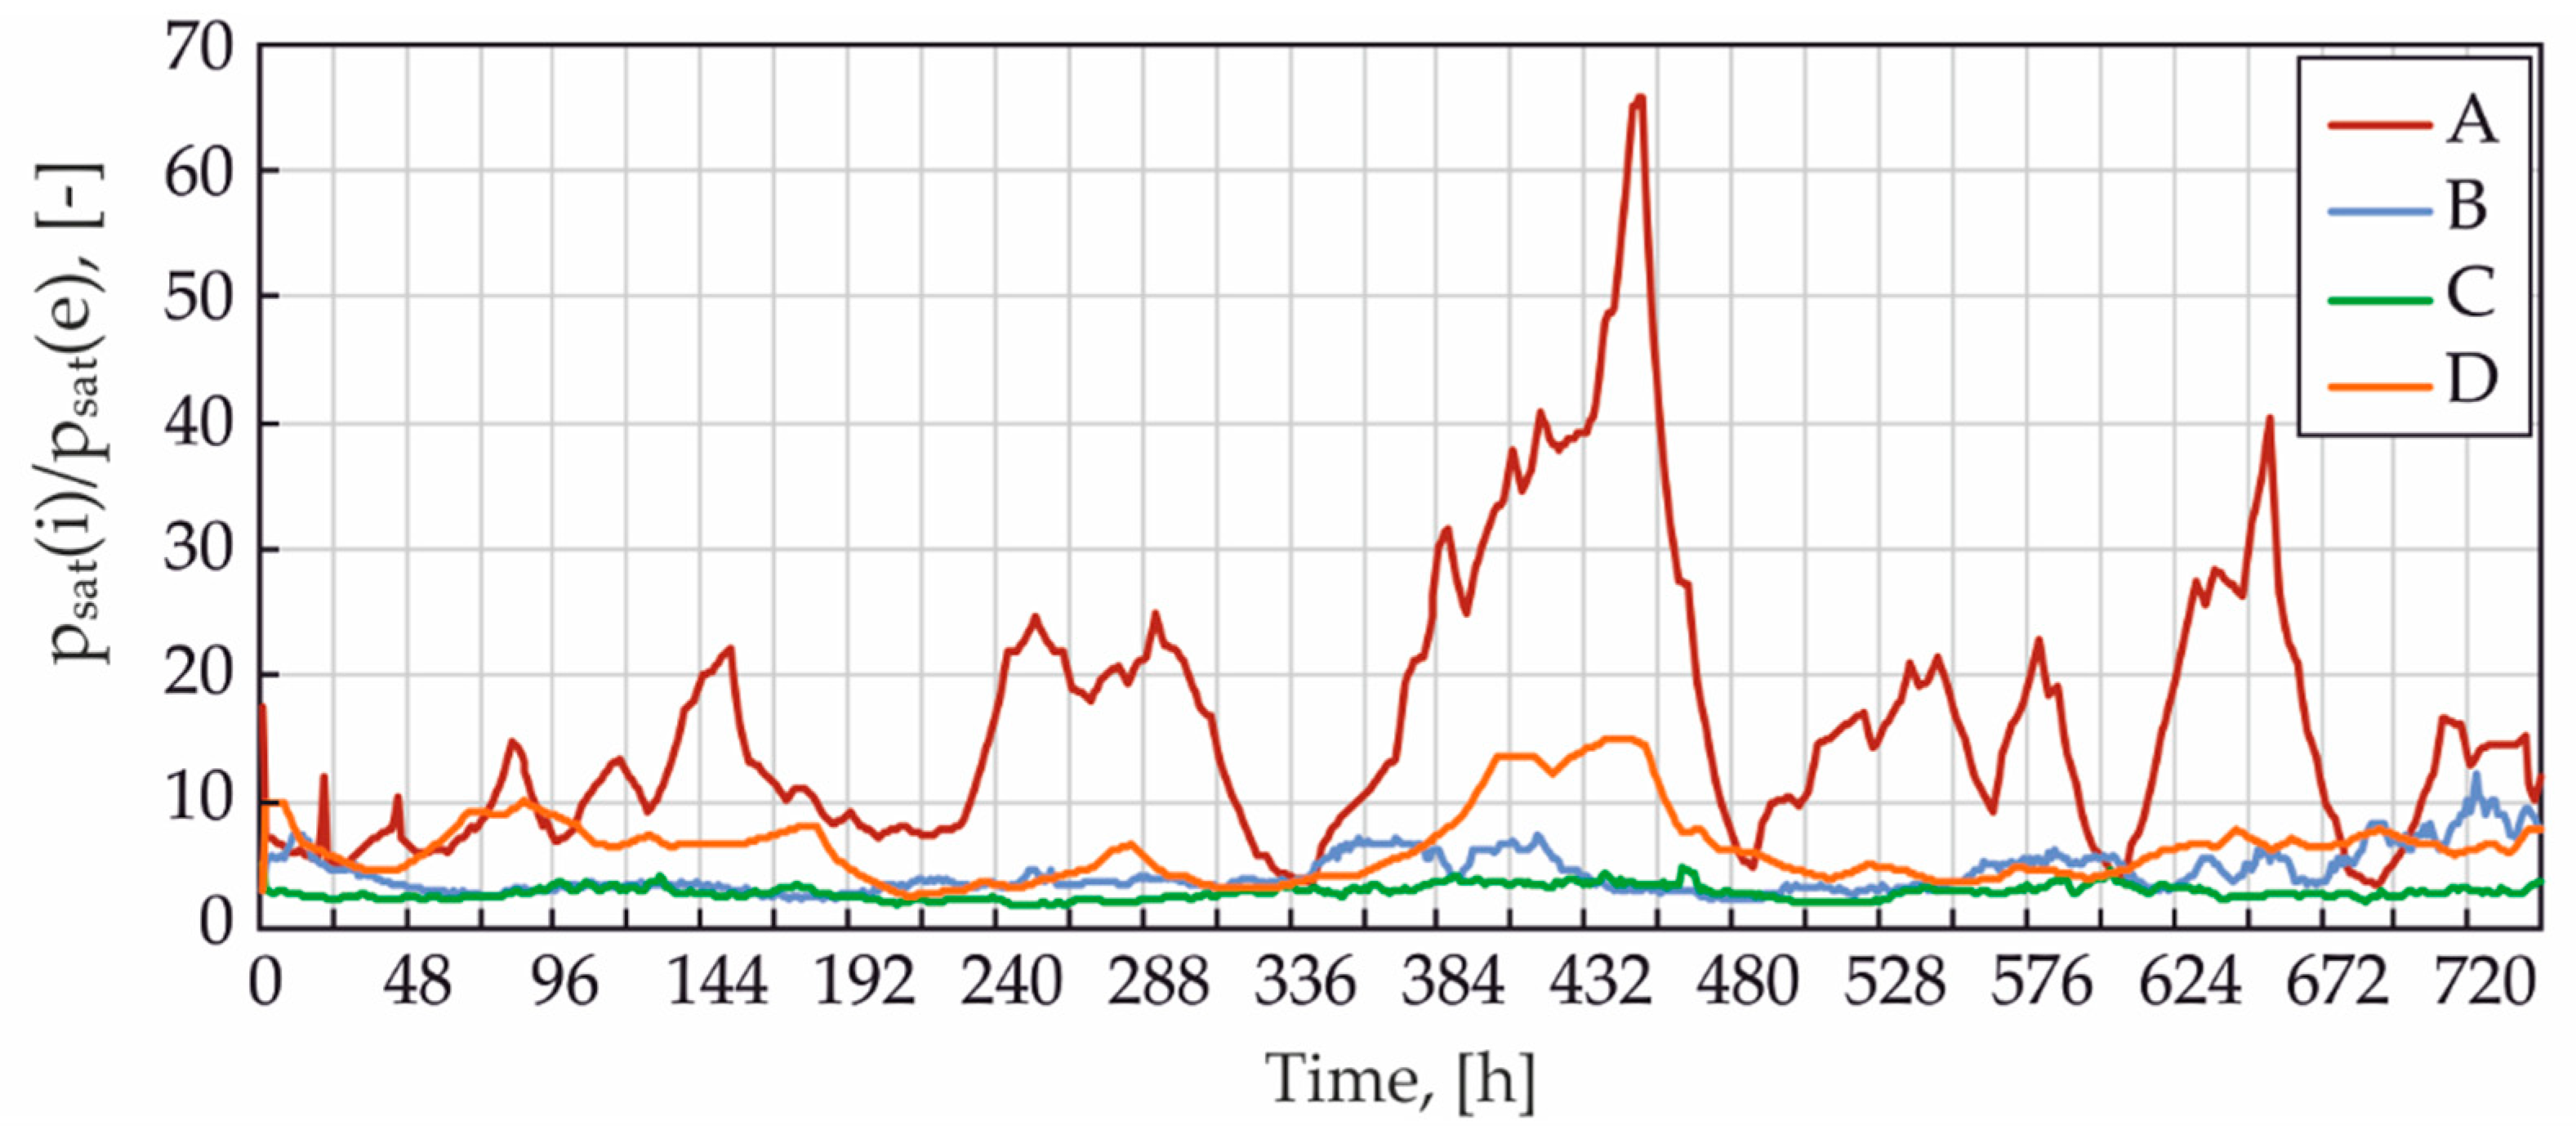
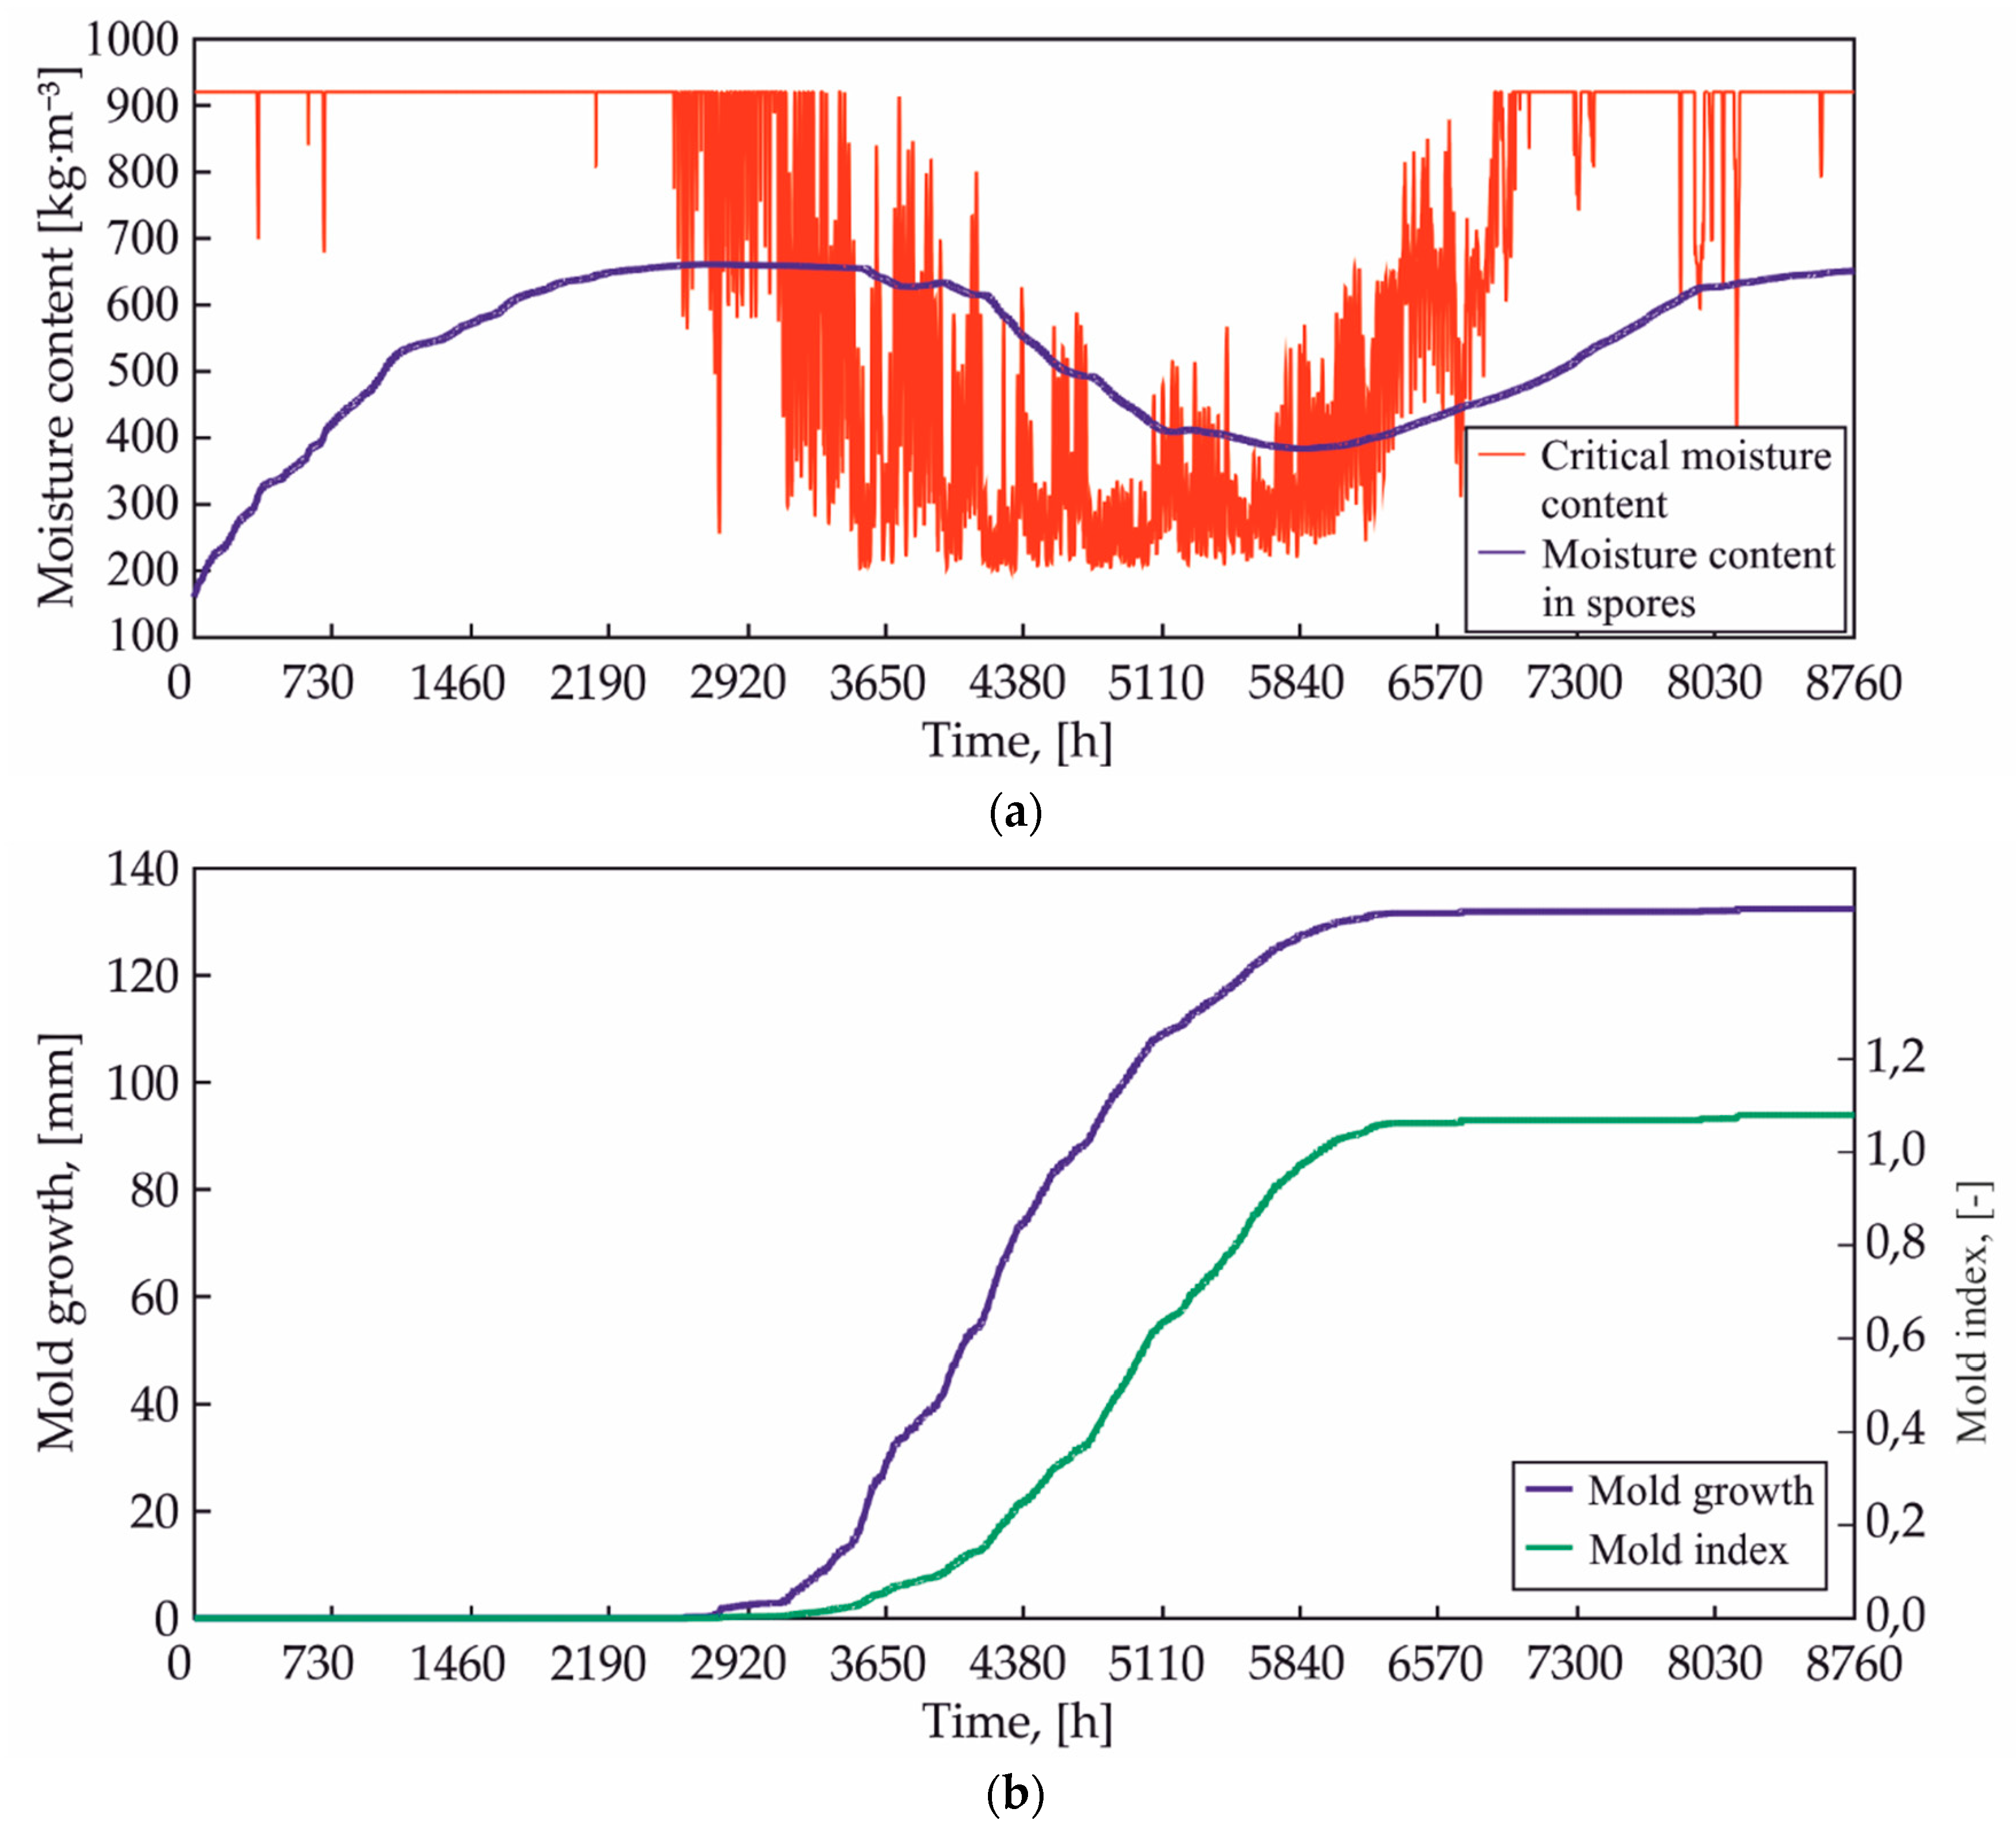
3.3. Risk of Condensation
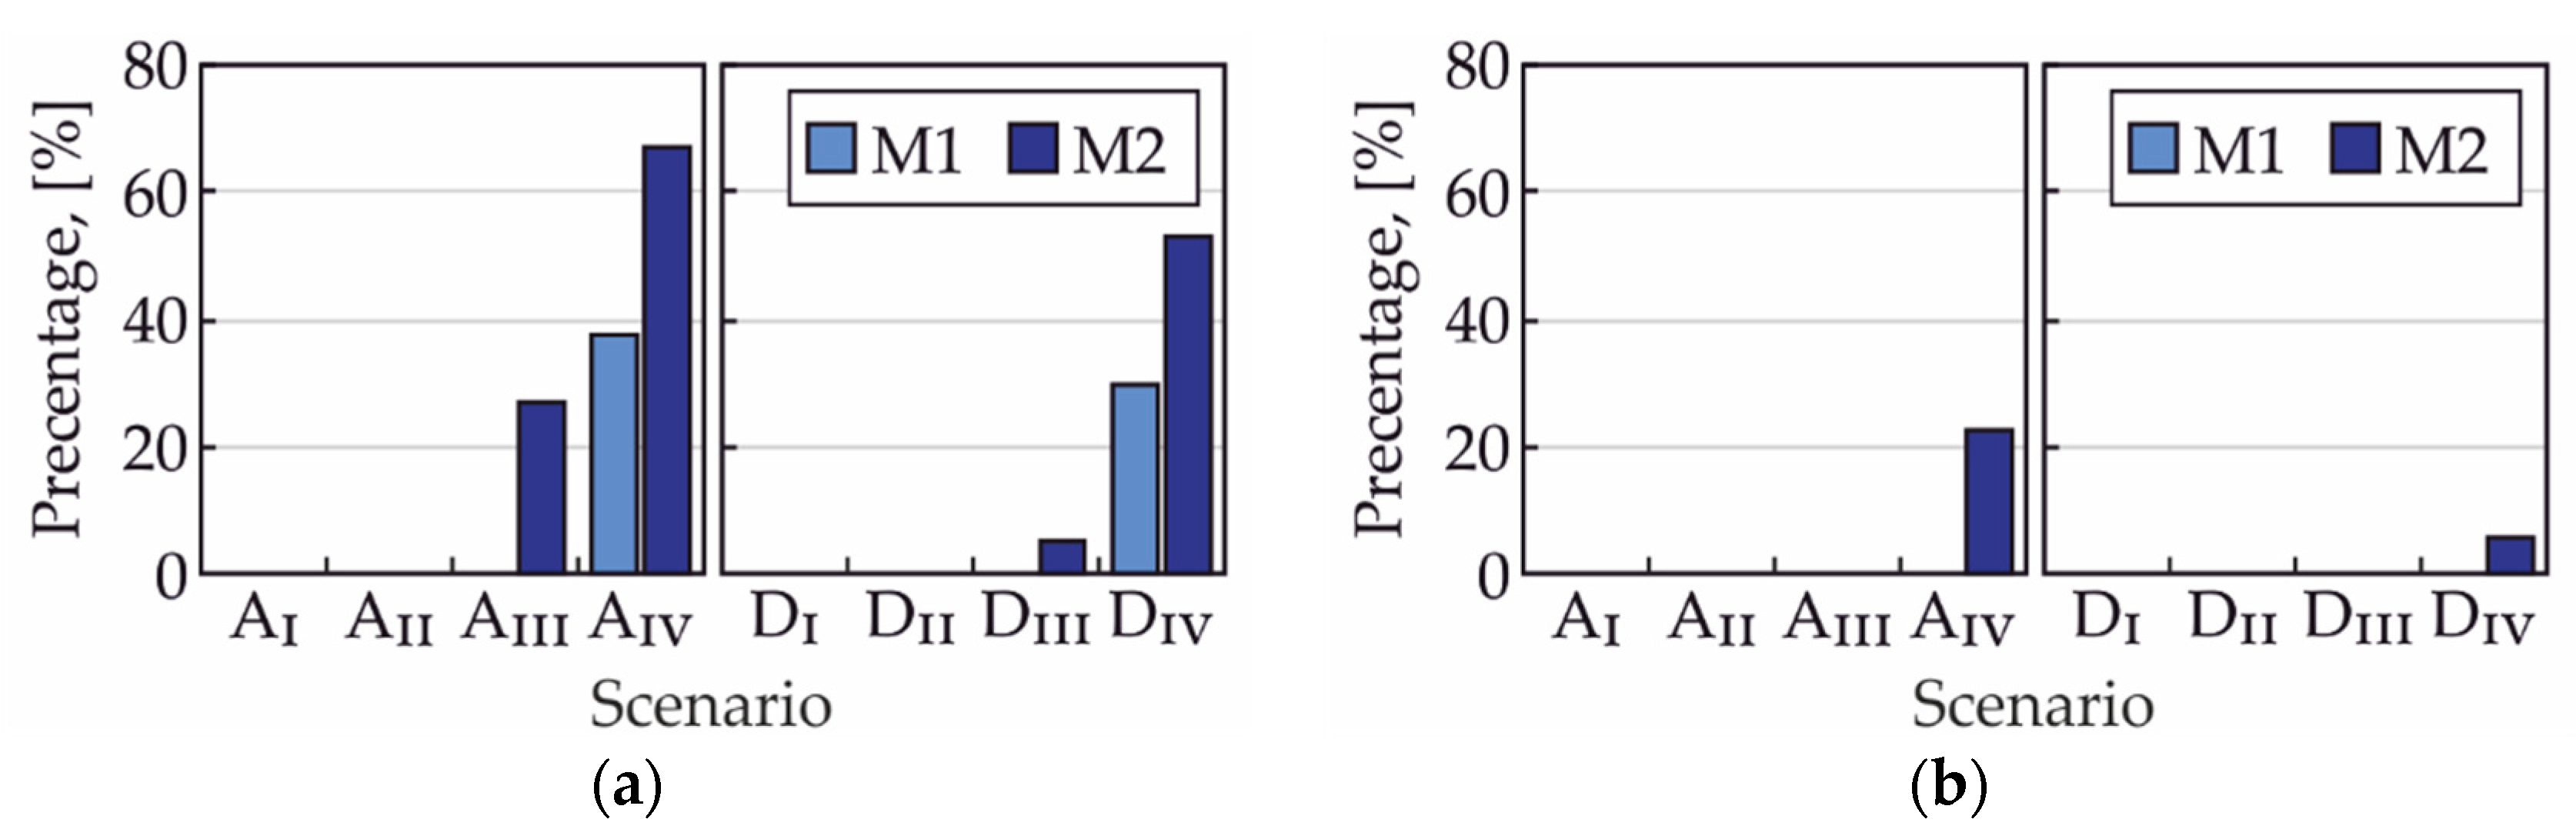
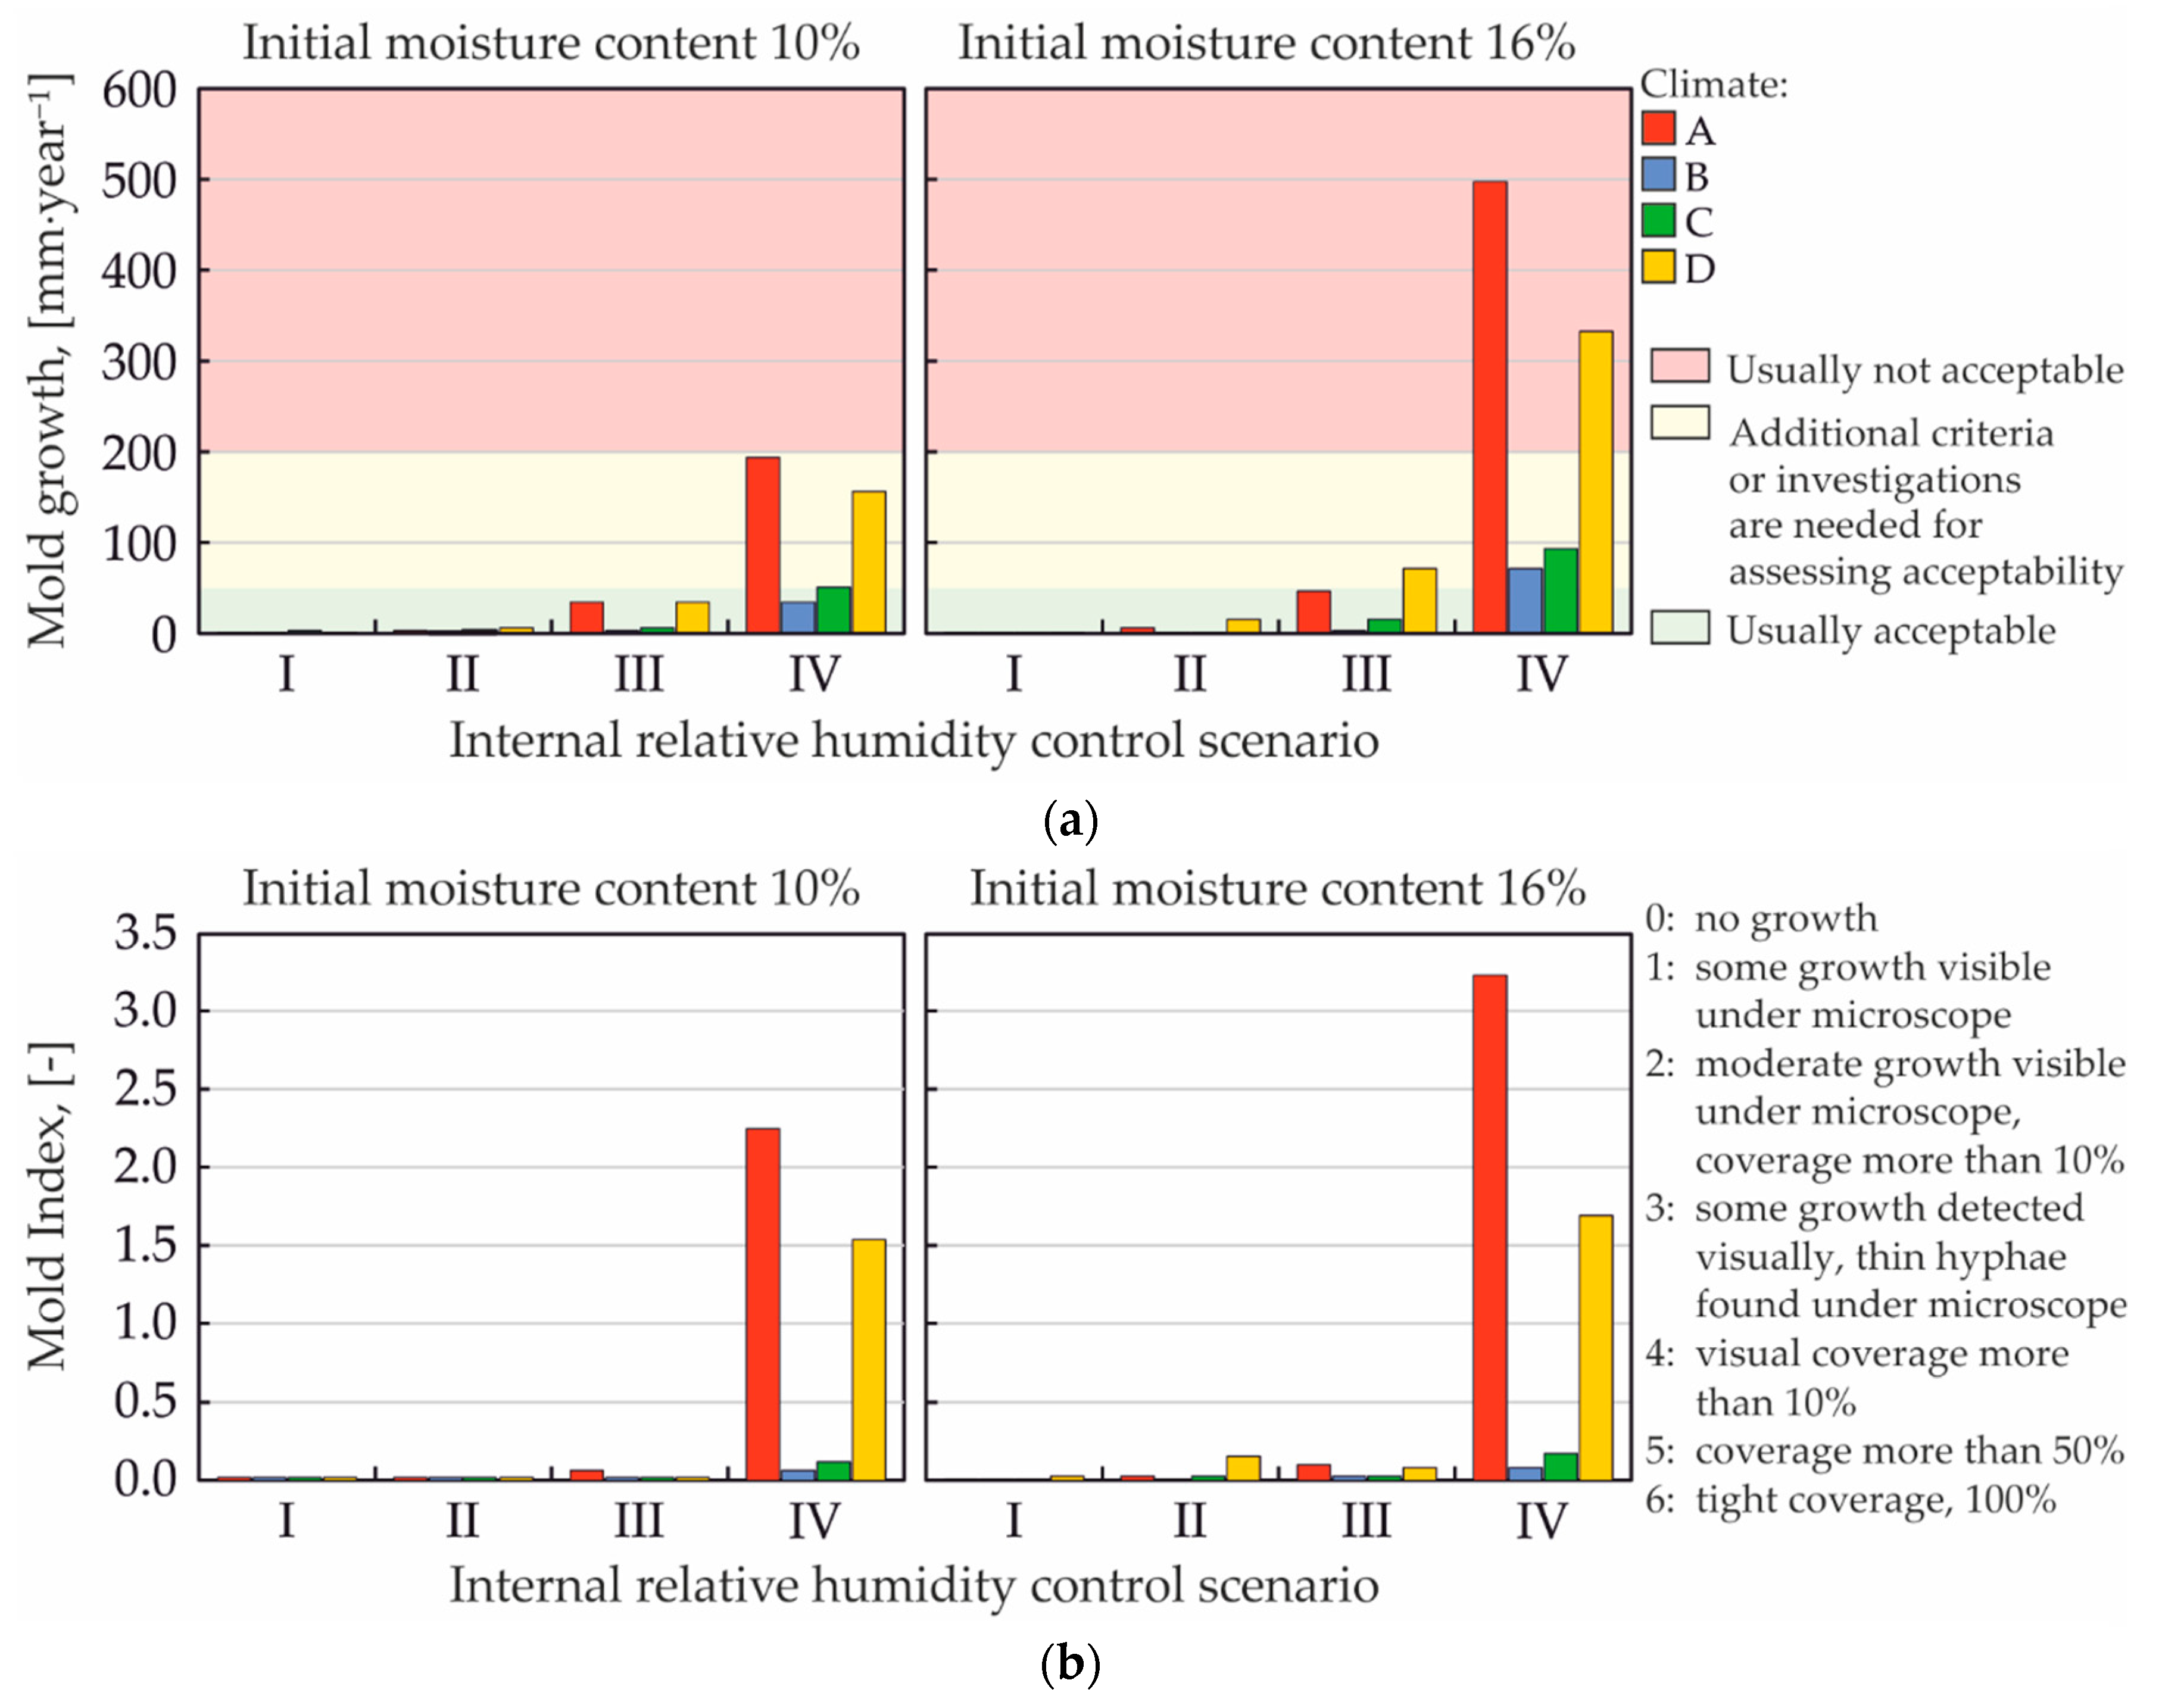
Calculations show that the risk of condensation (from the dew point temperature) is low. For selected monitor positions only for the climates A and C, there were single hours with the potential risk of condensation on the OSB. For the worst case scenario (AIV for ACH = 3 h−1), the share of hours with potential condensation accounted for 0.42% per annum (which is 20 hours in total).

3.4. Mold Growth

The results of calculations carried out at WUFI®Plus were exported to the WUFI®Bio program. Biohygrothermal model used by WUFI®Bio gives the amount of mold in terms of the size of a growing mold blotch and six-level “mold index” (MI) by Viitanen [12] describing the mold-infested fraction of a surface (Figure 12).
Calculations for the CLT panels showed no risk of mold growth for all cases (regardless of ACH in ventilated cavities). For OSB at ACH = 9 h−1 simulations do not predict the risk of mold infection as well.
For OSB at ACH = 3 h−1 (Figure 13) risk of mold growth depends on internal RH control and initial moisture content:
1. In the absence of RH control inside the room, the simulations indicate no mold growth, regardless of the exchange rate in the ventilated layers and the initial moisture content (MI = 0);
2. For the scenario II of RH control predicted mold growth does not exceed and 7 mm · year−1 and 18 mm · year−1 for initial moisture 10% and 16% respectively (MI < 0.015);
3. For scenario III of RH control, the impact of the external climate is more pronounced:
for climates B and C predicted mold growth does not exceed and 7 mm · year−1 and 18 mm · year−1 for initial moisture 10% and 16% respectively (MI < 0.025),
for climates A and D predicted mold growth does not exceed and 34 mm · year−1 and 72 mm · year-1 for initial moisture 10% and 16% respectively (MI < 0.7),
4. For scenario IV of RH control, the results are further differentiated depending on the outdoor climate:
for climate A predicted mold growth does not exceed and 192 mm · year−1 (MI < 2.25) and 500 mm · year−1 (MI < 3.25) for initial moisture 10% and 16% respectively,
for climate B predicted mold growth does not exceed and 34 mm · year−1 (MI < 0.072) and 72 mm · year−1 (MI < 0.07) for initial moisture 10% and 16% respectively,
for climate C predicted mold growth does not exceed and 51 mm · year−1 (MI < 0.13) and 96 mm · year−1 (MI < 0.17) for initial moisture 10% and 16% respectively,
for climate D predicted mold growth does not exceed and 156 mm · year−1 (MI < 1.5) and 336 mm · year−1 (MI < 1.7) for initial moisture 10% and 16% respectively.

3.5. Model Accuracy

In order to increase the accuracy of the model, the so-called model calibration is recommended (based on in-situ measurements). However, the accuracy of calculations with the WUFI program has been repeatedly checked in various studies—also using CLT. With adjusted material properties and properly assigned initial conditions, simulation results were generally in good agreements with field measurements at MCs below 26%. However, simulations tend to overestimate the MC by 5–10% for CLT panels [22]. The assumed model inaccuracy of 10% does not affect the conclusions below.

4. Conclusions

This study numerically analyzes hygrothermal performance of diffusionally open flat roof structure using CLT in cold coastal climates. The main focus is on analyzing risk of moisture condensation on CLT and OSB layers. The calculations were made for four different climates characterized by TMY, four RH internal control scenarios, two ACH variants in ventilated partition layers, and a minimum indoor air temperature of 20 °C. Additionally, the effect of increasing the number of exchanges in ventilated layers and increasing the initial MC was estimated. Obtained results of moisture content on the surfaces of wooden partition elements made of OSB and CLT were compared with critical moisture content for these materials.
Based on the calculations carried out, it can be stated that:
  • No risk of CLT layer moisture was noted (for any calculation variants).
  • In the case of OSB for the two coldest climates at low ACH and at internal RH over 50% moisture content exceeded critical values. According to the authors, for rooms with a relative humidity exceeding 50%, the use of diffusionally open structures is not advisable. Nevertheless, it is possible to use more moisture-resistant OSB4 instead of OSB3 or to increase the area of inlet openings for ventilated spaces, so that in all weather conditions the ACH exceeds 15 h−1 (this solution requires calculations as to whether it is possible to increase the ventilated space for structural reasons). As a last resort, the partition can be sealed with a vapor barrier.
  • Increasing the ACH above 15 h−1 caused the MC to fall below the critical value. Further increase in ACH (up to 40 h−1) caused a further decrease in recorded MC values. Above 40 h−1 no more changes were noted.
  • It is critical to control the moisture content of wood delivered to the construction site and to avoid its moisture during construction. Increasing the initial moisture content of wooden elements to the maximum permissible for coastal climates resulted in a significant increase in MC above the permissible values.
  • For subpolar/subarctic climates with an initial moisture content of wooden construction elements of 10%, the predicted mold growth exceeds 100 mm · year−1. This indicates necessity of additional criteria or further investigations are needed for assessing acceptability. MI = 1.5–2.25 allows to state that there is a moderate risk of mold growth. Increasing the initial MC for these climates may result in an increased risk of mold growth above an acceptable value (>300 mm · year−1).
Considering the above, it can be stated that the risk of excessive moisture in the case of cold and humid climates appears only when high humidity of the indoor air is coupled with a small number of exchanges in ventilated partition walls. However, future experimental studies should be carried out in order to examine and compare with the simulation results.

Author Contributions

Authors equally contributed to the conceptualization, methodology, validation, data curation, writing (original draft preparation and review), editing, and supervision of the paper. All authors have read and agree to the published version of the manuscript.

Funding

This research received no external funding.

Conflicts of Interest

The authors declare no conflict of interest.

References

  1. Wei, P.; Wang, B.J.; Li, H.; Wang, L.; Peng, S.; Zhang, L. A comparative study of compression behaviors of cross-laminated timber and glued-laminated timber columns. Constr. Build. Mater. 2019, 222, 86–95. [Google Scholar] [CrossRef]
  2. Hafnes, A.; Schäfer, S. Environmental aspects of material efficiency versus carbon storage in timber buildings. Eur. J. Wood Wood Prod. 2018, 76, 1045–1059. [Google Scholar] [CrossRef]
  3. Asdrubali, F.; Ferracuti, B.; Lombardi, L.; Guattari, C.; Evangelisti, L.; Grazieschi, G. A review of structural, thermo-physical, acoustical, and environmental properties of wooden materials for building applications. Build. Environ. 2017, 114, 307–332. [Google Scholar] [CrossRef]
  4. Fink, G.; Kohler, J.; Brandner, R. Application of European design principles to cross laminated timber. Eng. Struct. 2018, 171, 934–943. [Google Scholar] [CrossRef]
  5. Viau, C.; Doudak, G. Behaviour and modeling of cross-laminated timber panels with boundary connections subjected to blast loads. Eng. Struct. 2019, 197, 109404. [Google Scholar] [CrossRef]
  6. Bomberg, M.T.; Brown, W.C. Building envelope and environmental control: Part 1—Heat, air and moisture interactions. Constr. Can. 1993, 35, 15–18. [Google Scholar]
  7. Tye, R.P. Relevant moisture properties of building construction materials. In Moisture Control in Buildings; Trechsel, H.R., Ed.; American Society for Testing and Materials: Philadelphia, PA, USA, 1994. [Google Scholar]
  8. EN 14298: 2017. Sawn Timber. Assessment of Drying Quality; European Committee for Standardization: Brussels, Belgium, 2017. [Google Scholar]
  9. Loffer, L. Acceptable Moisture Levels in Wood—Knowing the Moisture Content. Available online: http://www.wagnermeters.com/moisture-meters/wood-info/acceptable-moisture-levels-wood (accessed on 12 October 2019).
  10. Gülzow, A.; Richter, K.; Steiger, R. Influence of wood moisture content on bending and shear stiffness of cross laminated timber panels. Eur. J. Wood Wood Prod. 2011, 69, 193–197. [Google Scholar] [CrossRef] [Green Version]
  11. Moisture Properties of Wood. Available online: https://www.woodproducts.fi/content/moisture-properties-wood (accessed on 1 October 2019).
  12. Viitanen, H.; Ritschkoff, A.C. Mould Growth in Pine and Spruce Sapwood in Relation to Air Humidity and Temperature; Swedish University of Agricultural Sciences: Uppsal, Swedish, 1991. [Google Scholar]
  13. Stankiewicz, H. Zabezpieczenie Budowli Przed Wilgocią, Wodą Gruntową I Korozją (Protection of Buildings Against Moisture, Ground Water and Corrosion); Arkady: Warszawa, Poland, 1984. [Google Scholar]
  14. Sedlbauer, K. Prediction of Mould Fungus Formation on the Surface of and Inside Building Components. Ph.D. Thesis, Universität Stuttgart, Stuttgart, Germany, 2001. [Google Scholar]
  15. Sedlbauer, K.; Krus, M.; Breuer, K. Mould Growth Prediction with a New Biohygrothermal Method and its Application in Practice Materials. In Proceedings of the IX Polska Konferencja Naukowo-Techniczna Fizyka Budowli w Teorii i Praktyce, Lodz, Poland, 10–13 June 2003. Available online: https://docplayer.net/92192580-Mould-growth-prediction-with-a-new-biohygrothermal-method-and-its-application-in-practice.html (accessed on 11 November 2019).
  16. Brandner, R.; Flatscher, G.; Ringhofer, A.; Schickhof, G.; Thiel, A. Cross laminated timber (CLT): Overview and development. Eur. J. Wood Wood Prod. 2016, 74, 331–351. [Google Scholar] [CrossRef]
  17. Alev, U.; Kalamees, T. Avoiding mould growth in an interiorly insulated log wall. Build. Environ. 2016, 105, 104–115. [Google Scholar] [CrossRef]
  18. Goto, Y.; Wakili, K.G.; Ostermeyer, Y.; Frank, T.; Ando, N.; Wallbaum, H. Preliminary investigation of a vapor-open envelope tailored for subtropical climate. Build. Environ. 2011, 46, 719–728. [Google Scholar] [CrossRef]
  19. Häglund, M. Moisture content penetration in wood elements under varying boundary conditions. Wood Sci. Technol. 2007, 41, 477. [Google Scholar] [CrossRef]
  20. Hameury, S. Moisture buffering capacity of heavy timber structures directly exposed to an indoor climate: A numerical study. Build. Environ. 2005, 40, 1400–1412. [Google Scholar] [CrossRef]
  21. Kalamees, T.; Vinha, J. Hygrothermal calculations and laboratory tests on timber-framed structures. Build. Environ. 2003, 38, 689–697. [Google Scholar] [CrossRef]
  22. McClung, R.; Ge, H.; Straube, J.; Wang, J. Hygrothermal performance of cross-laminated timber wall assemblies with built-in moisture: Field measurements and simulation. Build. Environ. 2014, 71, 95–110. [Google Scholar] [CrossRef]
  23. Öberg, J.; Wiege, E. Moisture Risks with CLT-Panels Subjected to Outdoor Climate during Construction-Focus on Mould and Wetting Processes. Bachelor’s Thesis, KTH Royal Institute of Technology Stockholm, Stockholm, Sweden, June 2018. [Google Scholar]
  24. Setter, L.; Smoorenburg, E.; Wijesuriya, S.; Taberes-Velasco, P.C. Energy and hygrothermal performance of cross laminated timber single-family homes subjected to constant and variable electric rates. J. Build. Eng. 2019, 25, 100784. [Google Scholar] [CrossRef]
  25. Climate.OneBuilding. Available online: http://climate.onebuilding.org/WMO_Region_6_Europe/default.html (accessed on 11 November 2019).
  26. European Committee for Standardization. Energy Performance of Buildings. Ventilation for Buildings. Indoor Environmental Input Parameters for Design and Assessment of Energy Performance of Buildings Addressing Indoor Air Quality, Thermal Environment, Lighting and Acoustics; European Committee for Standardization: Brussels, Belgium, 2019; EN 16798-1:2019. [Google Scholar]
  27. Patoka, K. Wentylacja Dachów I Stropodachów. Poradnik (Ventilation of Roofs and Flat Roofs. Guide); Dom Wydawniczy MEDIUM: Warsaw, Poland, 2019; ISBN 978-83-926815-6-4. [Google Scholar]
  28. German Institute for Standardization. Klimabedingter Feuchteschutz; Anforderungen, Berechnungsverfahren und Hinweise für Planung und Ausführung (Climate-Related Moisture Protection; Requirements, Calculation Methods and Notes for Planning and Execution); German Institute for Standardization: Berlin, Germany, 1996; DIN 4108-3: 1996. [Google Scholar]
  29. Künzel, H.M.; Karagiozis, A.N.; Kehrer, M. Assessing the Benefits of Cavity Ventilation by Hygrothermal Simulation. 2018. Available online: https://wufi.de/literatur/K%C3%BCnzel,%20Karagiozis%20et%20al%202008%20-%20Assessing%20the%20benefits%20of%20cavity.pdf (accessed on 11 November 2019).
Figure 1. Building model in WUFI®plus software.
Buildings 10 00010 g001
Figure 2. Typical cross-laminated timber (CLT) roof construction (a), modified CLT roof structure (b); 1—corrugated steel, 2—oriented strand board (OSB), 3—weather resistive barrier, 4—mineral wool, 5—CLT, 6—vapor retarder; (own drawing).
Buildings 10 00010 g002
Figure 3. Basic parameters for the roof layers and positioning of monitors (M1, M2, M3, and M4).
Buildings 10 00010 g003
Figure 4. Median, extremes and the 25th and 75th percentile for assumed outdoor climates (A—Greenland, B—Iceland, C—Scotland, D—Norway) for temperature (a) and for relative humidity (b).
Buildings 10 00010 g004
Figure 5. Share of global radiation range for external climates.
Buildings 10 00010 g005
Figure 6. Moisture content for monitors for AI scenario and air change rate (ACH) = 3 h−1.
Buildings 10 00010 g006
Figure 7. Maximal moisture content for OSB (M1 and M2) for ACH = 3 h−1 (a) and ACH = 9 h−1 (b).
Buildings 10 00010 g007
Figure 8. Maximal moisture content for CLT (M3 and M4) for ACH = 3 h−1 (a) and ACH = 9 h−1 (b).
Buildings 10 00010 g008
Figure 9. Multiplicity of partial pressure on the internal side (psat(i)) in relation to the partial pressure on the external side (psat(e)) for January.
Buildings 10 00010 g009
Figure 10. Annual share of critical moisture content exceedances for ACH = 3 h−1 (a) and ACH = 9 h−1 (b).
Buildings 10 00010 g010
Figure 11. Annual share of moisture content range when increasing the ACH in ventilated rooftop layers for scenario AIV (a) and DIV (b) scenarios.
Buildings 10 00010 g011
Figure 12. Results of WUFI®Bio simulation for scenario AIV, ACH = 3 h−1 and initial moisture content of 10%: Critical moisture content and moisture content in spores (a). Predicted mold growth and mold index (b).
Buildings 10 00010 g012
Figure 13. Predicted risk of mold contamination for wooden partition layers depending on the external climate and RH control scenario (ACH = 3 h−1): mold growth (a), mold Index (b).
Buildings 10 00010 g013
Table 1. External and internal climates variants.
Indoor Air Relative Humidity ScenariosClimates
GreenlandIcelandScotlandNorway
(A)(B)(C)(D)
Free floating (I)AIBICIDI
RHmin = 40% (II)AIIBIICIIDII
RHmin = 50% (III)AIIIBIIICIIIDIII
RHmin = 60% (IV)AIVBIVCIVDIV

