Article

Investigation of Geometric Characteristics in Curved Surface Laser Cladding with Curve Path

1
School of Mechanical and Automotive Engineering, Fujian University of Technology, Fuzhou 350118, China
2
Digital Fujian Industrial Manufacturing IoT Lab, Fuzhou 350118, China
3
School of Engineering + Technology, Western Carolina University, Cullowhee, NC 28723, USA
*
Author to whom correspondence should be addressed.
Metals 2019, 9(9), 947; https://doi.org/10.3390/met9090947
Submission received: 18 July 2019 / Revised: 21 August 2019 / Accepted: 26 August 2019 / Published: 29 August 2019

Abstract

:
Laser cladding on curved surfaces is essential in industrial applications for restoration and remanufacturing of high-value parts. This study investigated the influence of different factors on clad width, clad height, and dilution rate in curved surface laser cladding with curved path. Mathematical models were developed using central composite designs to predict these geometric characteristics by controlling laser power, scanning speed, gas flow, and altering the outside radius of the cylindrical substrate. Analysis of variance and response surface methodology indicated that clad width increased with increasing laser power and reducing scanning speed. Clad height positively correlated to laser power and negatively correlated to the outside radius of the cylindrical substrate. Increasing the laser power while decreasing the scanning speed led to an increase in dilution rate. Afterwards, the geometric characteristics of the clad were improved by optimizing these factors with the target to maximize clad width and height as well as to minimize dilution rate. The difference between model predictions and experimental validations for clad width, clad height, and dilution rate were 3.485%, 3.863%, and 6.566%, respectively. The predicted accuracy was verified with these models, and they were able to provide theoretical guidance to predict and control the geometric characteristics of curved surface laser cladding with a curved path.

1. Introduction

Laser cladding is an advanced surface modification technology that was introduced in 1980s for producing metallurgical bond coating. Laser cladding is an additive manufacturing technology that melts the cladding power by the laser energy and deposits the coating on the substrate. It is a complex process because clad properties are affected by thermodynamics, fluid dynamics, energy absorption, bonding properties, and wettability [1,2]. Because of the high energy density during the process, coatings are deposited with precise dimensions and a high production efficiency with minor heat-affected zones, low dilution rates, and outstanding metallurgical bonding. Hence, this technology has been widely used in remanufacturing and restoration of important high-value parts [3,4,5,6].
The correlation between laser cladding processing parameters and the properties of the clad had been investigated by different groups of researchers. Erfanmanesh et al. used regression methods to study the correlation between key processing parameters (laser power, scanning speed, and powder feeding rate) and geometrical characteristics (height, width, dilution, and wetting angle) for single-track clads. Optimum laser cladding processing parameters were obtained to acquire a high-quality clad with minimized porosity [7]. Yu et al. applied Taguchi and grey relational analysis methods to study the relationship between similar processing parameters (laser power, scanning speed, and powder feeding rate) and the responses (clad width, clad height, and dilution rate). Grey relational analysis was applied to combine these three responses into a single grey relational grade and to acquire the optimized clad layer [8]. Farahmand and Kovacevic used response surface methodology embedded with a central composite design module to investigate the influences of laser power, powder flow rate, and scanning speed on the clad height, heat-affected zone height, and clad microhardness. A multiple regression analysis was used to establish the models, and the accuracy of the models was validated by analysis of variance [9].
Laser cladding on curved surfaces has also drawn research attention because of its demand in industrial applications. Torims et al. studied common defects in marine engine crankshafts and compared laser cladding with traditional restoration methods of marine engine crankshafts. They found laser cladding to be a promising method of repairing and renovating with technological advantages. Their investigation provided the feasibility of conducting laser cladding on curved surfaces [10,11]. Wang et al. proposed a path planning method for laser cladding remanufacturing. Their research indicated the surface data acquired through 3D scanning was able to contribute to complex laser nozzle movement by analyzing the differential geometric characteristics. The reliability and practicability of their method were validated by the clad deposited on a curved surface, which had outstanding bonding with the substrate and favorable mechanical properties [12]. Barr et al. studied the influences of different material compositions on clad quality by altering different processing parameters (laser power, traverse speed, and powder feed rate). They found that increasing the laser interaction time during the cladding process can avoid cracking in the clad [13].
There are numerous studies focusing on the optimization of processing parameters in laser cladding, but their research was primarily concentrated on the analysis and optimization of flat surface laser cladding [7,8,9]. Although research on curved surfaces has been started, primary investigation has focused on circumferential cladding paths [10,11,12,13]. The study of complex curved surface laser cladding is still necessary to provide theoretical foundations of curved path laser cladding on cylindrical surfaces. Therefore, in the setting of facial cotton pad die-cutting tool manufacturing, this study targeted curved surface laser cladding with a curved path onto an AISI/SAE 1045 steel cutter body (Figure 1). Investigation of the correlation between processing factors (laser power, scanning speed, gas flow, and outside radius of cylindrical substrate) and clad geometric characteristics (width, height, and dilution rate) was accomplished through response surface methodology. The mathematic models obtained in this study provide the theoretical basis for shaping control in curved surface laser cladding.

2. Materials and Methods

The substrates selected in this study, AISI/SAE 1045 steel tubes, were 70 mm in length and had a 5 mm wall thickness with different outside diameters. During the laser cladding process, the laser beam diameter was adjusted to 3 mm. The cladding powder was high-speed steel powder (W6Mo5Cr4V2), which was produced by Chengdu Huayin Powder Technology CO., LTD (Chengdu, China). The particle size of the high-speed steel powder ranged from 48 to 106 μm, fulfilling the requirement of powder feeding in the laser cladding system. Table 1 shows the elemental composition of W6Mo5Cr4V2 high-speed steel powder.
Figure 2 illustrates the laser cladding system used in this study, which consisted of a continuous wave laser system with 1064 nm wavelength (YLS-3000, IPG, Burbach, Germany), laser cladding nozzle with 300 mm focal length and 0.6 mm focal spot diameter (FDH0273, Lasermech, Novi, MI, USA), industrial robot (M-710iC/50, FANUC, Yamanashi, Japan), water cooling system (TFLW-4000WDR-01-3385, Sanhe Tongfei, Sanhe, China), powder feeding system (CR-PGF-D-2, Songxing, Fuzhou, China), a three-jaw universal chuck operated by a computer control system (PLC, Mitsubishi, Japan), and a laser pulse control system (SX14-012PULSE, IPG, Burbach, Germany). Argon gas was used as carrier and protective gas during the cladding process.
Before conducting the cladding process, the substrate surface was cleaned with absolute ethanol. The high-speed steel powder was dried in a vacuum dryer at 120 °C for 30 min to prevent clogging in the powder feeding system. The central composite design (CCD) module was selected to develop the experiment design in Design Expert software (version 10.0). Laser power (LP), scanning speed (SS), and gas flow (GF) were the selected as the processing parameters to be altered in this study. The AISI/SAE 1045 steel tubes with different outside diameters was another factor to be investigated to provide an industrial application reference. In this paper, the outside diameter of the substrate was represented by an outside radius of the cylindrical substrate (RC), hereinafter referred to as the outside radius. Table 2 shows the experimental design matrix consisting of selected factors and their five individual levels [14,15,16].
Thirty experimental runs were conducted following the setup in Table 3. The responses investigated in this study were clad width, clad height, and dilution rate. The illustration of the schematic cladding path is shown in Figure 3a, which was designed for use as a potential industrial die-cutting tool for facial cotton pad manufacturing according to Figure 1. This curved laser cladding path was completed by controlling the rotational and translational movements of the three-jaw universal chuck. Figure 3b shows a detailed view of the actual clad deposited on the substrate.
After completion of the laser cladding process, the samples were prepared by cutting, setting, grinding, and polishing. Cutting was conducted circumferentially at the marked location like Figure 3a. The cross-section after sample preparation is shown below in Figure 4, where CZ stands for the cladding zone, MZ represents the melted zone, and HAZ is the heat-affected zone. A scanning electron microscope (SEM) TM3030Plus (HITACHI, Tokyo, Japan) was used to obtain the morphology of the cross-section. A KH-1300 3D microscope (Hirox Co Ltd., Tokyo, Japan) was utilized to measure the following geometric characteristics: clad width (W), clad height (H), area of cladding zone (A1), and area of substrate melted zone (A2). Averages were calculated by multiple measurements in the same region to reduce error. Equation (1) was used to calculate the dilution rate afterwards [17,18]. The measured and calculated geometric characteristic results are also shown in Table 3.
Then, response surface methodology (RSM) was used to establish mathematical models between the input variables and responses [19]. Analysis of variance (ANOVA) was used to verify and analyze the fitted models. The significance level (α) was set at 0.05, which is a commonly used level in significance tests [9,20,21]. Experimental validation to verify that the optimized processing parameters and substrate size was conducted with targeting on the desired geometric characteristics.
θ = A 2 A 1 + A 2 × 100 % .

3. Results and Discussion

3.1. Analysis of Variance

The mathematical models for clad width, clad height, and dilution rate established from response surface methodology are shown below in Equations (2)–(4). The corresponding ANOVA results are shown in Table 4, Table 5 and Table 6.
ANOVA results of the clad width model in Table 4 indicated a high fitting accuracy because its p value was less than 0.0001, and the lack-of-fit p value was higher than the significance level. ANOVA results also demonstrate the rationality of factor selections in the mathematical model. The adequate precision (signal-to-noise ratio) value of 19.768 is larger than 4, showing the outstanding accuracy of this model. The difference between adjusted R-square and predicted R-square values was less than 0.2. Moreover, all of the determination coefficients (R-square, adjusted R-square, and predicted R-square) were close to 1. These results demonstrate the remarkable fitting accuracy of this regression model. Therefore, this model can be used to effectively investigate the influence of selected factors on the clad width in the laser cladding process. Similarly, the models for clad height and dilution rate also meet these expectations.
From Table 4, it can be seen that clad width was affected by the following factors: laser power, scanning speed, outside radius, the interaction term of laser power and gas flow, the interaction term of scanning speed and gas flow, and the quadratic term of the outside radius. In the clad height model, the factors that had significant influences were laser power, scanning speed, outside radius, the interaction term of laser power and gas flow, and the quadratic term of gas flow (Table 5). Similarly, laser power, scanning speed, gas flow, outside radius, the interaction term of laser power and outside radius, the interaction term of scanning speed and gas flow, and the interaction term of gas flow and outside radius were the factors that had a significant impact on the dilution rate, as shown in Table 6.
Width = 11.813 1.989 × LP 0.827 × SS 5.439 × 10 3 × GF 0.110 × RC + 2.191 × 10 3 × LP × GF + 4.188 × 10 4 × SS × GF + 3.713 × 10 3 × SS × RC + 7.474 × 10 4 × RC 2 .
Height = 0.124 0.765 × LP + 0.223 × SS + 3.495 × 10 3 × GF 0.029 × RC + 1.598 × 10 3 × LP × GF 5.819 × 10 3 × SS × RC 2.460 × 10 6 × GF 2 + 4.246 × 10 4 × RC 2 .
Dilution   Rate = 197.067 15.178 × LP 12.001 × SS 0.120 × GF 2.494 × RC + 0.727 × LP × RC + 8.377 × 10 3 × SS × GF + 1.130 × 10 3 × GF × RC .

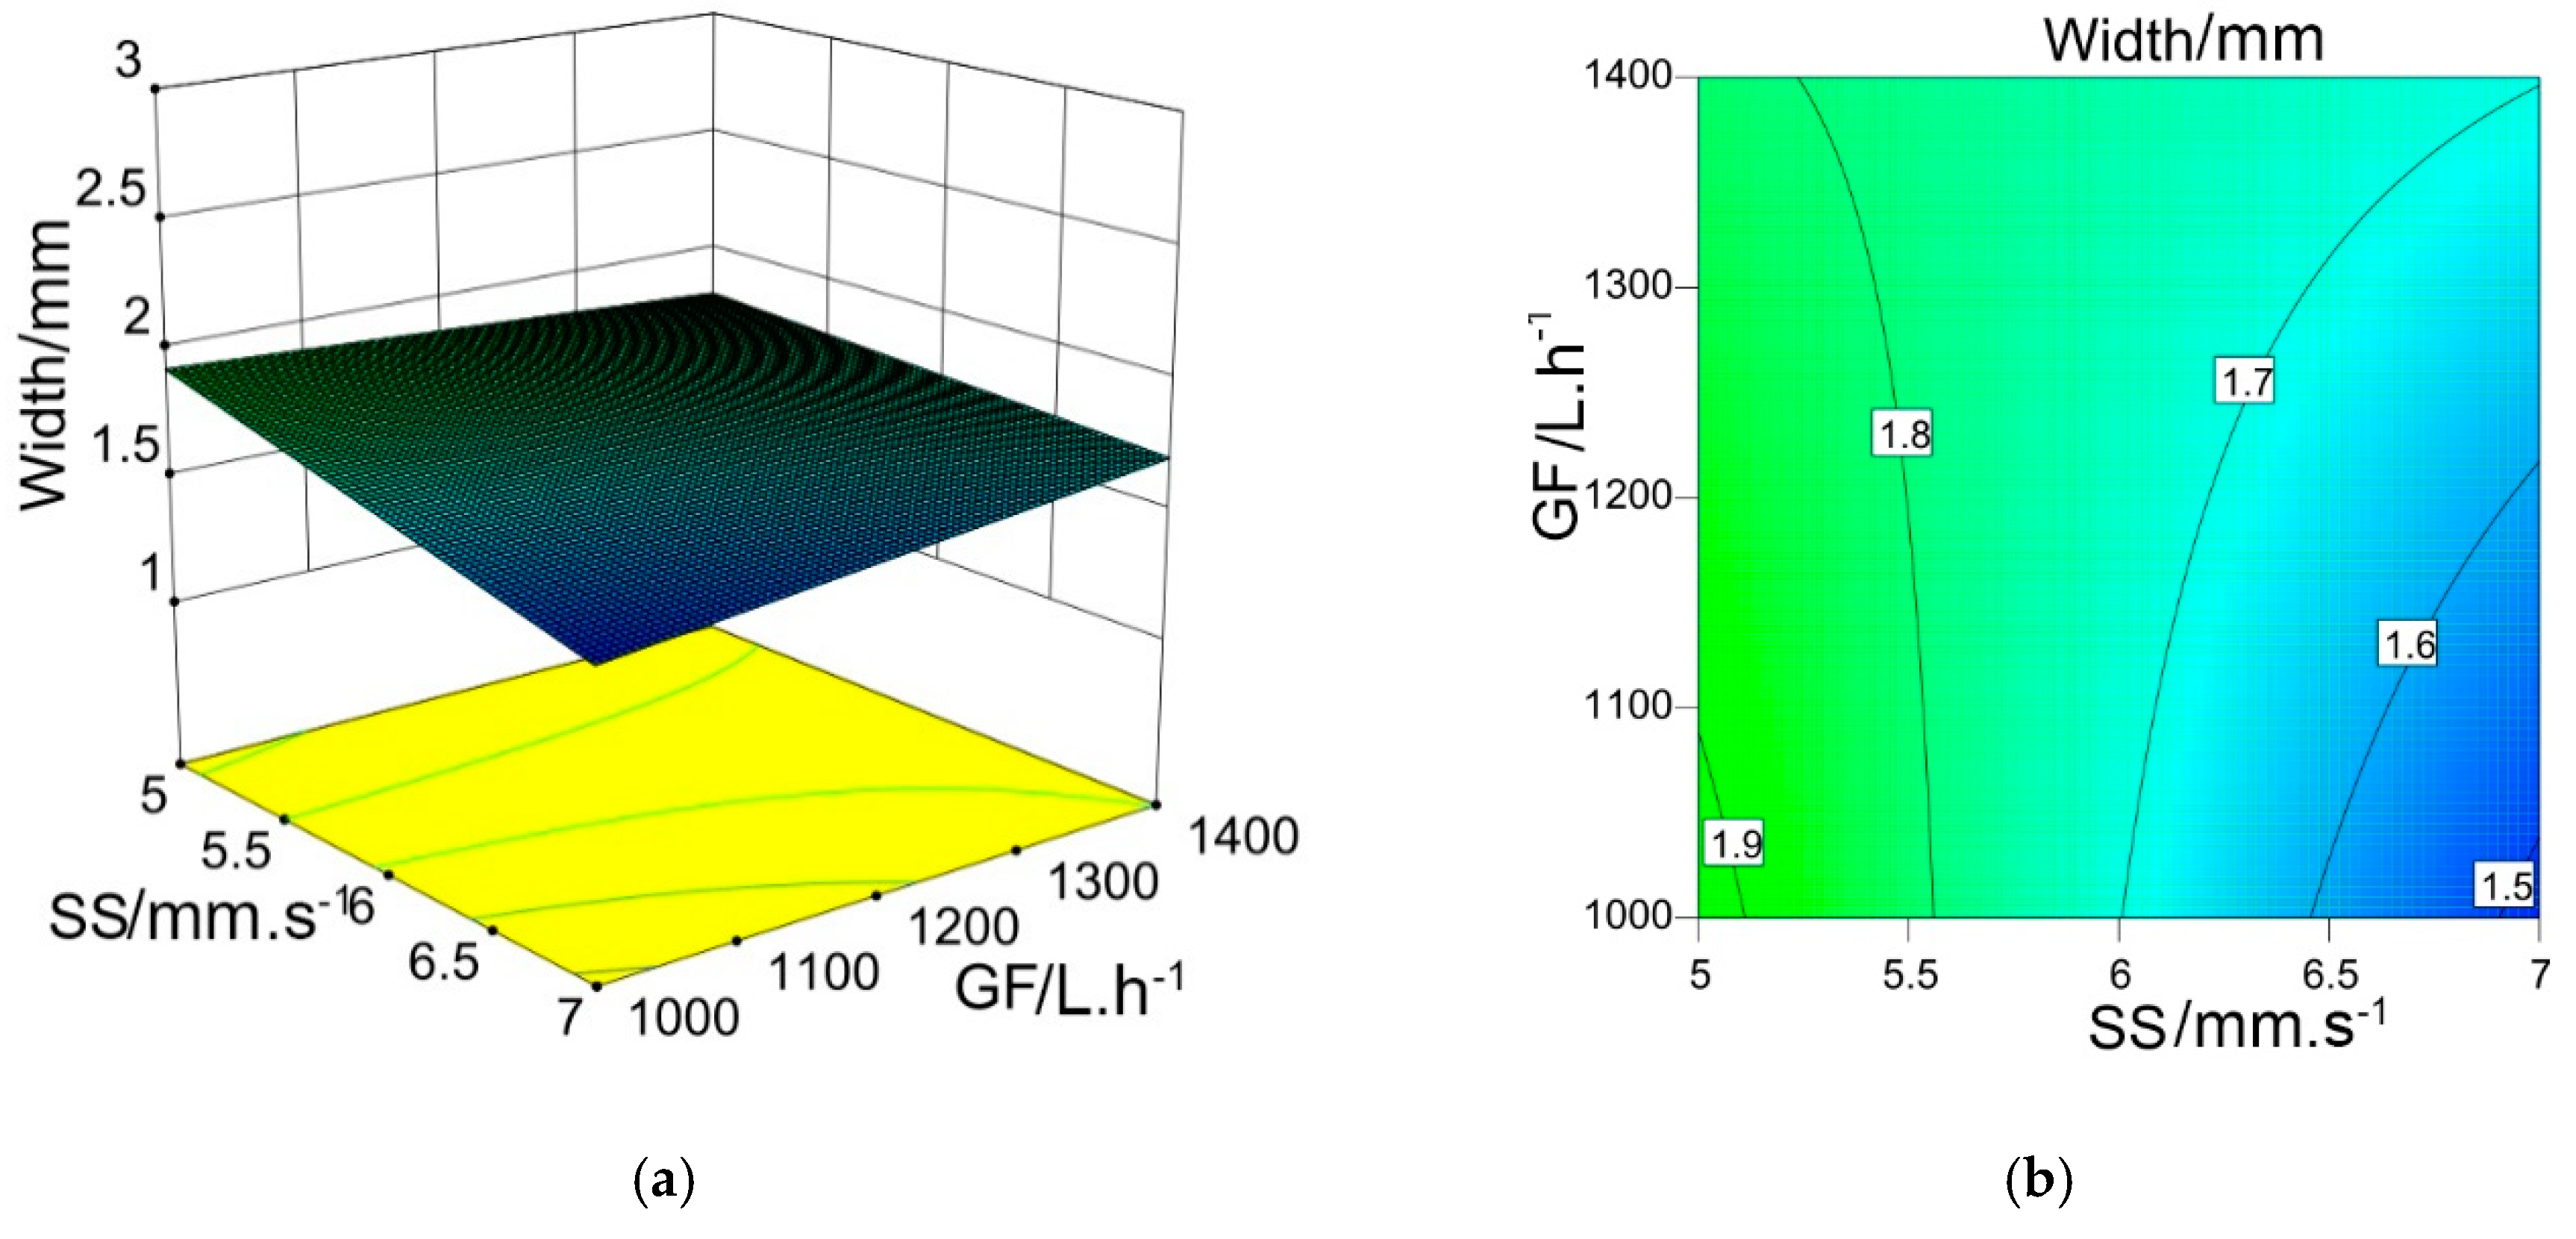
3.2. Analysis of Clad Width

Figure 5a shows the normal plot of residuals for the clad width model. All residuals of the 30 specimens had a near linear distribution, which indicated the favorable fitting of the clad width model. The dark line in Figure 5b serves as the reference where the predicted value equals the actual experimental value. It can be seen that all data points were distributed close to the reference line, which demonstrates that the model can reveal the relation between clad width and the key factors with a satisfactory prediction accuracy.
Figure 6 displays the clad width influenced by the interaction between laser power and gas flow in the form of a 3D response surface and contour line. From the observations of the contour line and response surface, under a relatively large gas flow, a positive, linear correlation existed between the clad width and laser power. Although a larger gas flow delivered more cladding powder into the laser deposition system, all the fed powder could not be melted under a lower laser power. With the larger laser power provided, the increased cumulated energy effectively promoted more powder to melt. In addition, the increased laser power contributed to extend the convection in the molten pool by absorbing more energy. These facts led to the increase of clad width. Under a relatively low gas flow, laser power showed a minor influence on the clad width. Since less powder was delivered under the relatively low gas flow, less energy was required to adequately melt the powder. Increasing the laser power in this condition only promoted convection in the molten pool. Therefore, under a low gas flow, clad width slightly increased with increasing laser power. Similarly, clad width expanded by increasing the gas flow under a relatively high laser energy, as the larger amount of powder brought by the gas flow was melted to contribute to the cladding zone. However, with a relatively low laser power, a slightly negative correlation was observed between gas flow and clad width. This was caused by excessive fed powder blocking the laser beam to a certain extent, leading to a slight reduction in the absorbed energy. As a summary, simultaneously increasing the laser power and gas flow increased the clad width.
The response surface and contour line showing the effects of scanning speed and gas flow on clad width are shown in Figure 7. The clad width displayed a trend of reduction with simultaneous increases in scanning speed and gas flow. Scanning speed determined the duration of the molten pool exposed under laser energy, and gas flow determined the amount of powder fed as well as protective gas. Increasing scanning speed denoted a shorter laser irradiation duration on the molten pool. The increased gas flow brought excessive cladding powder, which blocked the laser irradiation. Plus, the endothermic process was caused by volume expansion of the increasingly compressed protective argon fed into chamber that consumed the laser energy. These factors shortened the lifetime of the molten pool and led to the reduction of fluidity of the molten pool, which resulted in the decrease of clad width.
Figure 8 exhibits the influence of selected factors on clad width. The laser power had a positive, linear correlation with clad width. The gas flow also displayed a positive, linear correlation with clad width at a relatively lower level compared to laser power. The scanning speed showed a negative, linear correlation with clad width. The outside radius indicated a negative, quadratic relation with the clad width. The initial increase of the outside radius caused a reduction of clad width, while further increase of the outside radius did not have a significant impact.

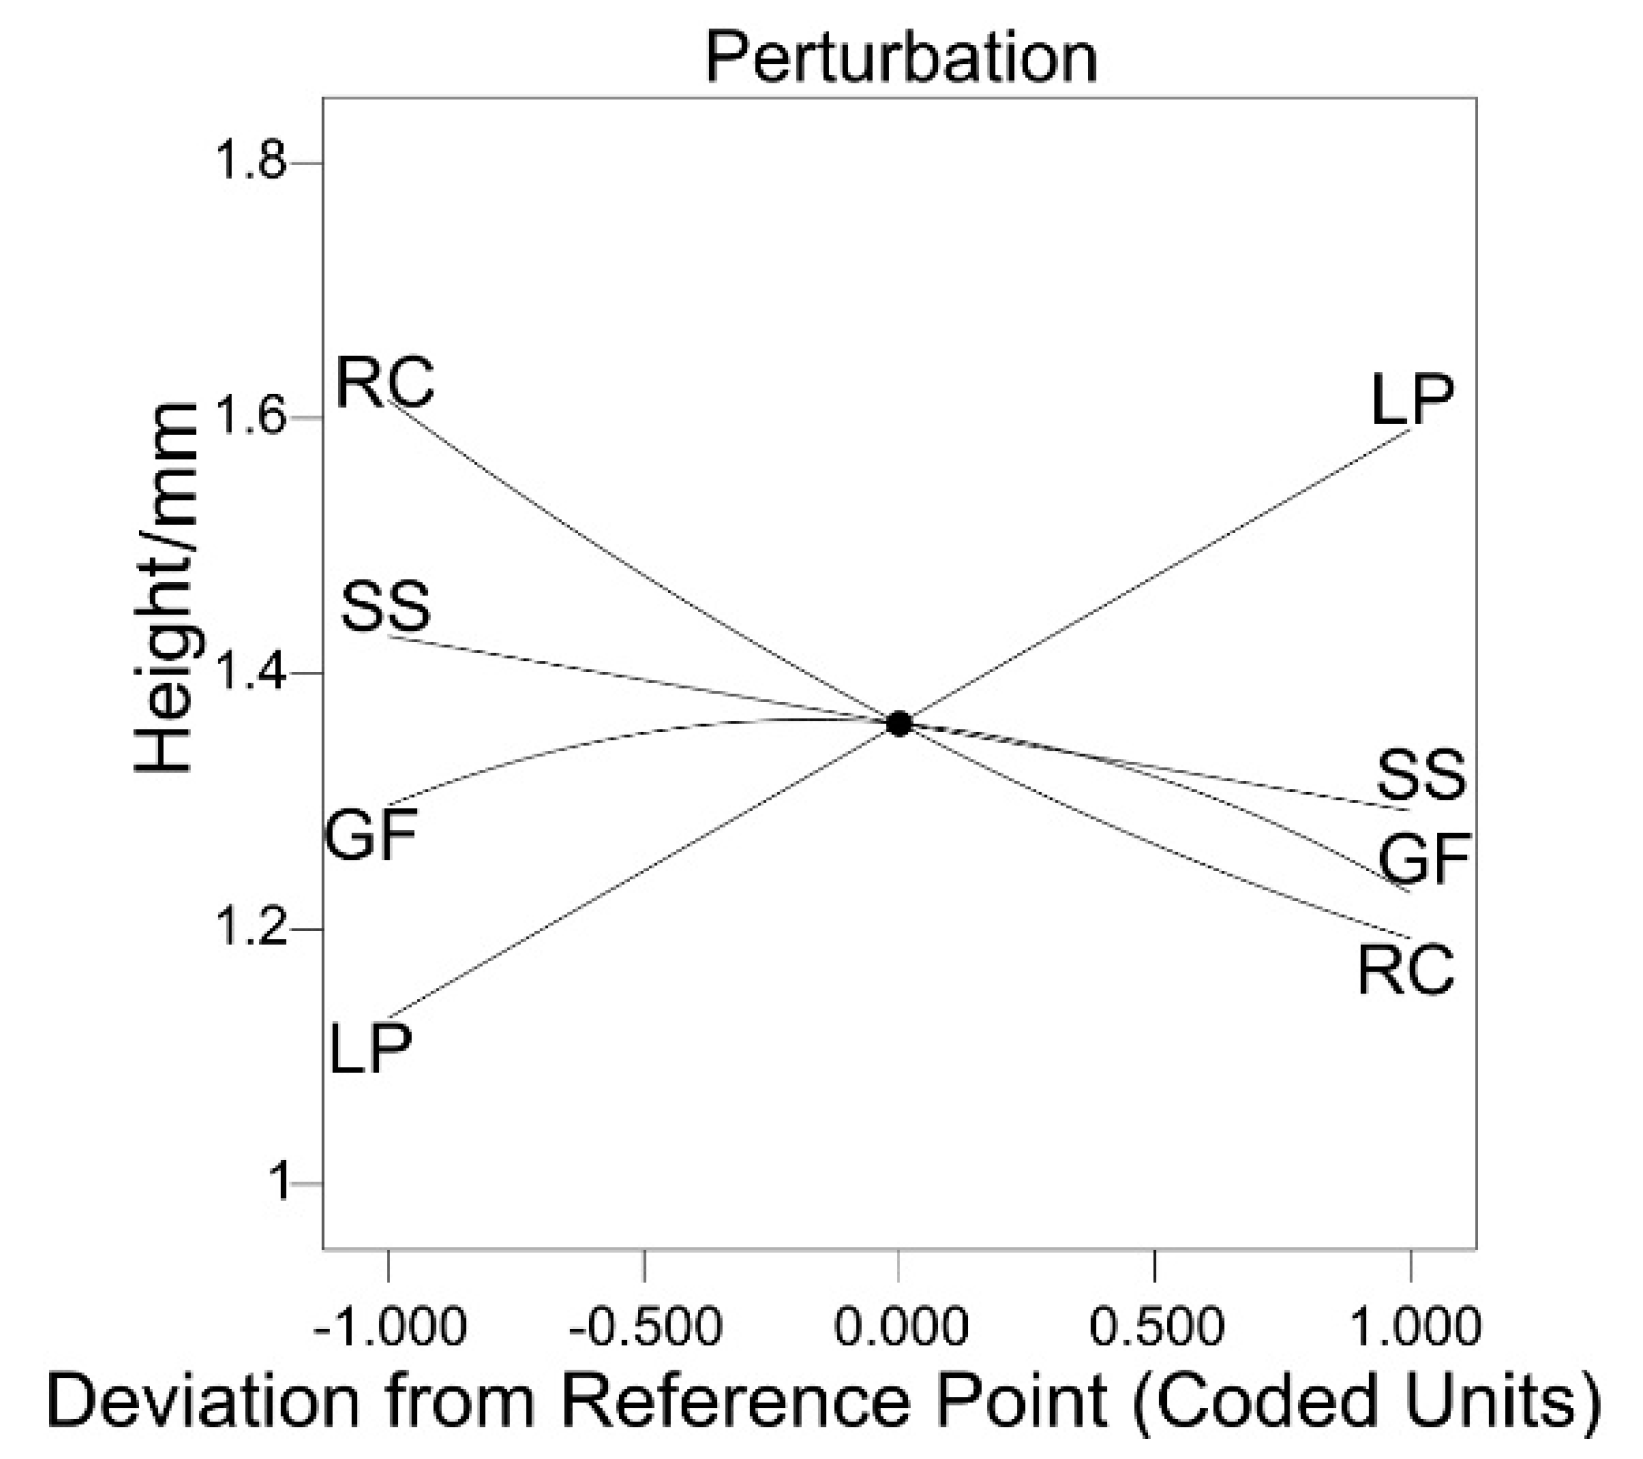
3.3. Analysis of Clad Height

The nearly linear distribution of the residual plot indicates the rationality of the clad height model in Figure 9a. The small-scale error displayed in Figure 9b demonstrates the prediction accuracy of the clad height model.
The response surface and contour lines in Figure 10 show the linear correlation between clad height and laser power. It is evident that the clad height increased with a larger laser power, since a larger laser power denoted more laser energy that could melt the cladding powder and build up the cladding zone. The gas flow displayed a nonlinear correlation and an insignificant impact on clad height. As shown in Figure 10a, the clad height initially increased then decreased with the increasing gas flow, which determined the amount of powder being fed. Initially, the laser power was adequate to melt the fed powder and build up the cladding zone, and it caused an increase in clad height. With a further increase of the powder feeding amount, the laser energy became inadequate to melt the fed powder amount, and the excessively fed powder also blocked the laser irradiation. In addition, the volume expansion during delivery of the compressed argon gas generated an endothermic process, which further consumed the inadequate laser energy. Unmelted powder under the inadequate laser energy did not contribute to the cladding process, which reduced the clad height. As a summary, the clad height can be increased by properly increasing the laser power and gas flow.
From the observation of the response surface and contour lines in Figure 11, the clad height negatively correlated with the scanning speed. Since the scanning speed affected the duration of laser irradiation, a slower scanning speed denoted longer exposure of laser energy onto the cladding zone, which was beneficial to build up the cladding zone. Thus, the clad height increased with a reduction in the scanning speed. A negative correlation was also observed between the outside radius and clad height. A larger outside radius implied a larger substrate volume and thermal conduction capability, which caused a reduction of effective laser energy intensity because of the rapid energy transfer. Thus, the effective laser energy needed to melt the cladding powder was reduced, and the clad height decreased. Therefore, a simultaneous reduction in the scanning speed and outside radius was able to generate a larger clad height.
The influence of the selected factors on clad height is shown in Figure 12 A positive, linear correlation was observed between laser power and clad height. Scanning speed exhibited a negative, linear correlation with clad height. Properly increasing the gas flow contributed to an increase of the clad height, while excessive gas flow reduced the clad height. Increasing the outside radius reduced the clad height initially, and then this trend flattened with further increase.

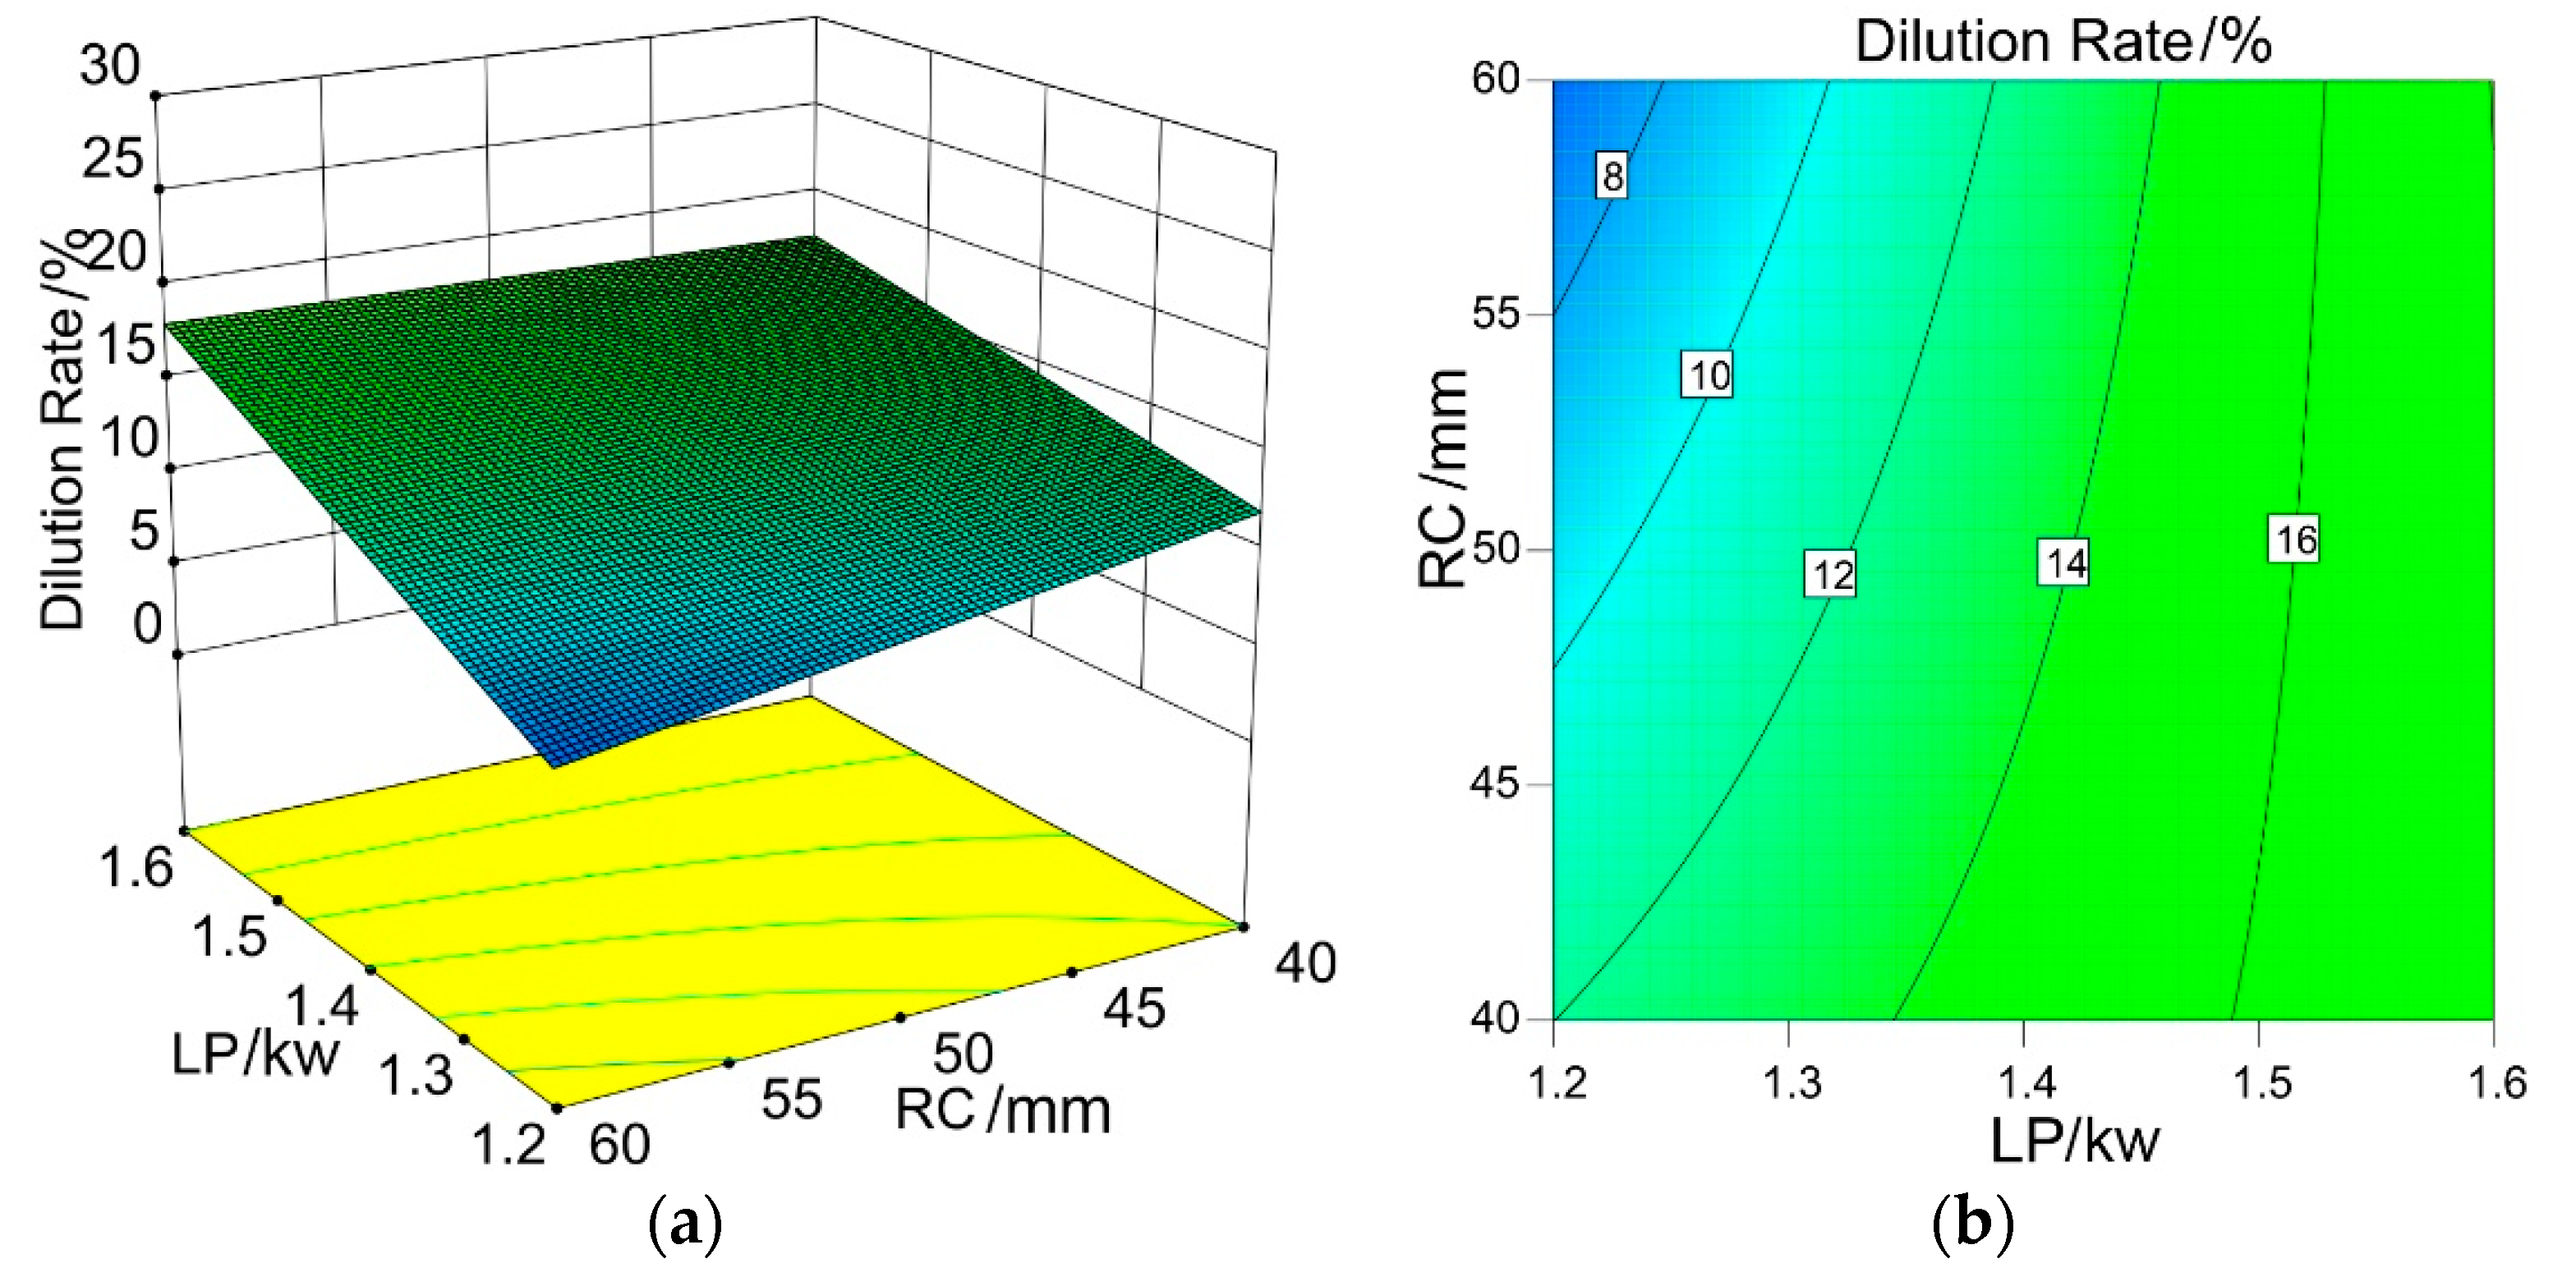
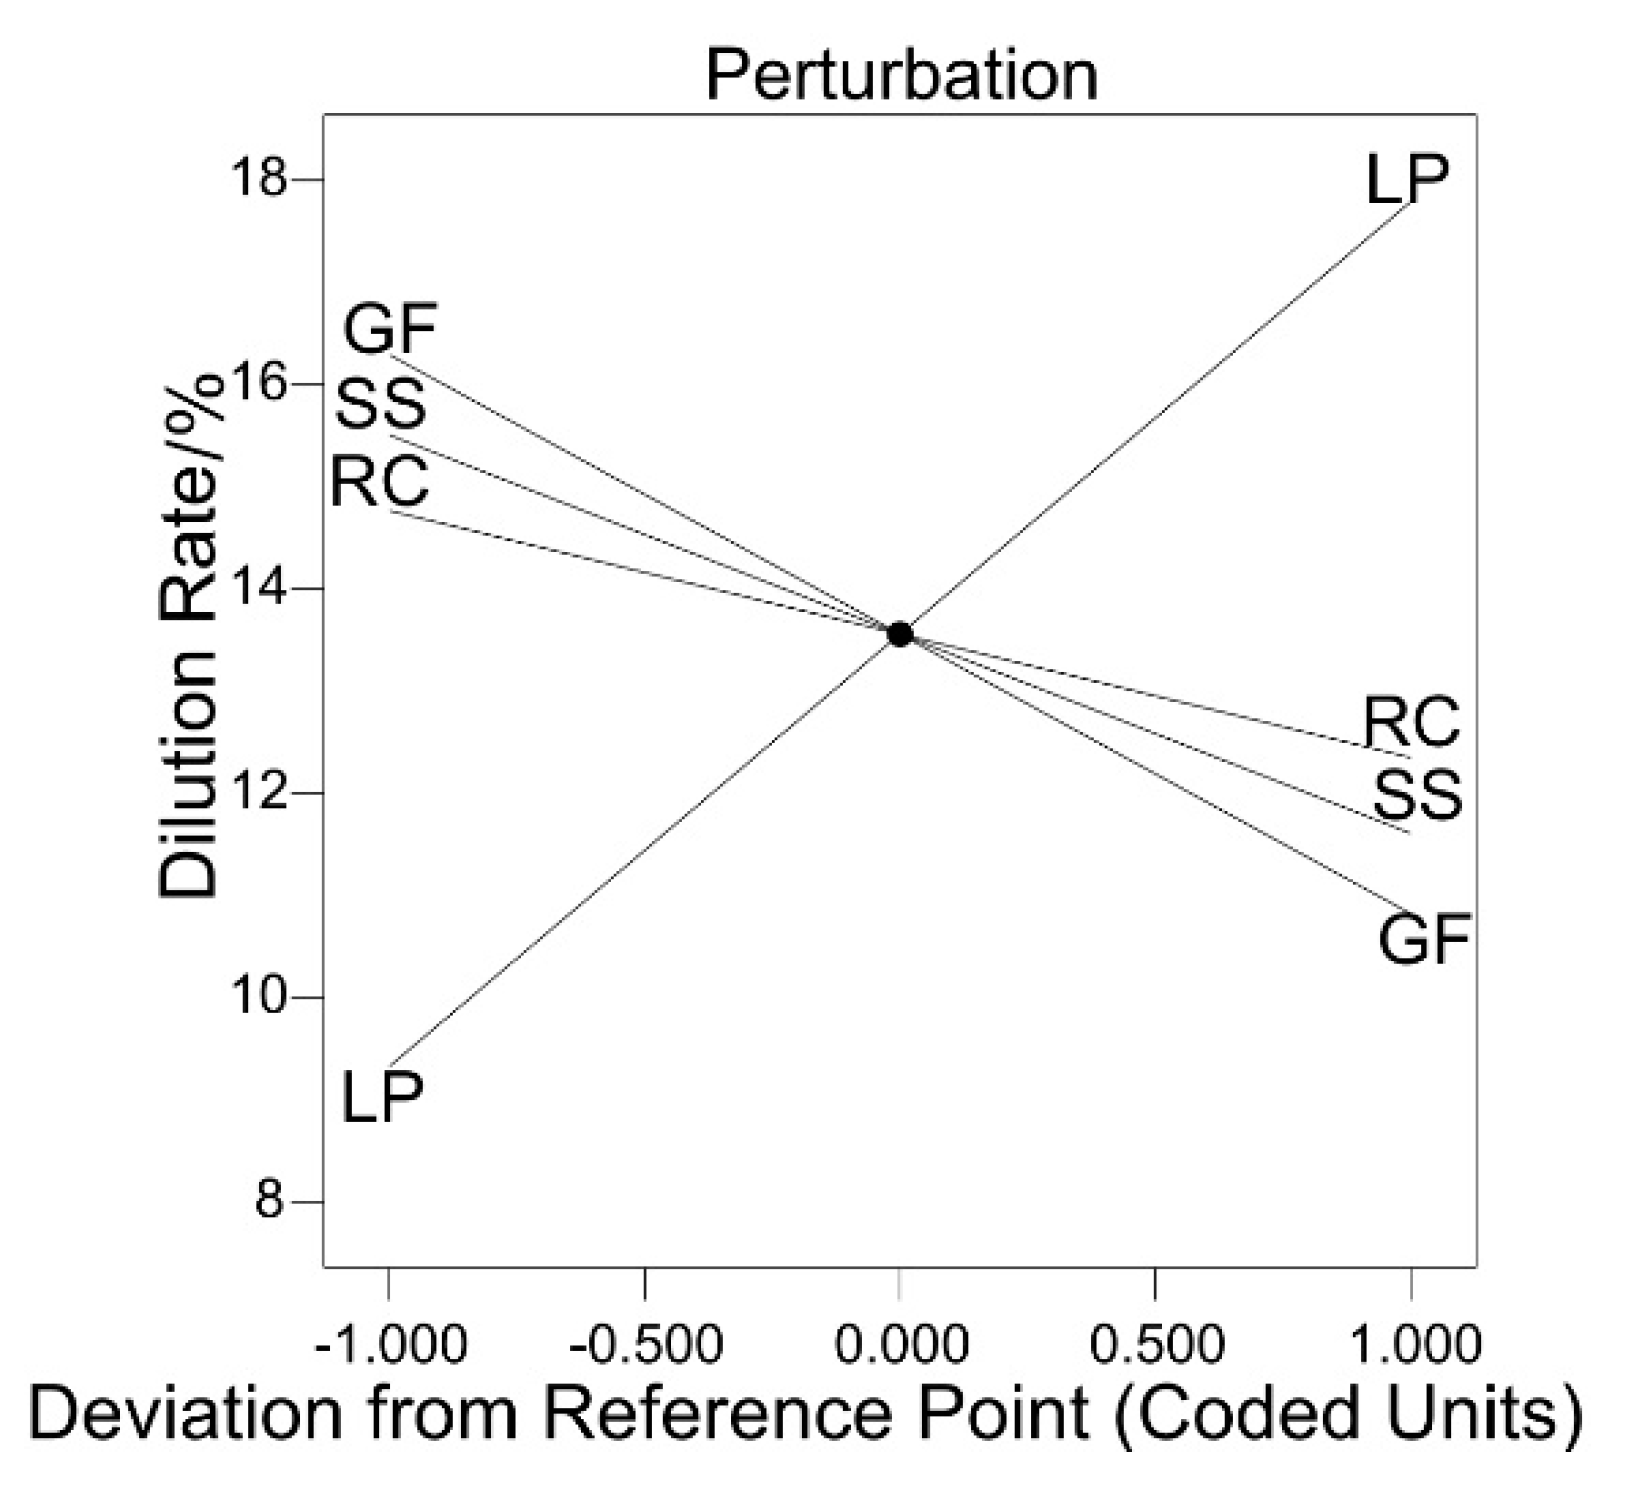
3.4. Analysis of Dilution Rate

The selection of factors for the dilution rate model was verified by the residual plots in Figure 13a, which displayed a nearly linear distribution. The small-scale difference between predicted dilution rates and the actual experimental dilution rates in Figure 13b demonstrated the reliability of this model, which was able to illustrate a correlation between dilution rate and the selected factors in the laser cladding process.
A linear correlation between laser power and dilution rate is evident in Figure 14. The dilution rate increased with an increasing laser power because the larger laser power allowed for more energy to be absorbed in the cladding zone. A larger laser absorption resulted in an increase of laser energy that was irradiated on the cladding powder and transmitted into the substrate. The increased transmitted energy led to an increase of the substrate melted zone area (A2). In addition, the increased laser power extended the lifetime of the molten pool, which further increased the area of the substrate melted zone (A2) [22,23,24]. Thus, the dilution rate increased according to Equation (1).
The influence of the outside radius on dilution rate varied depending on the amount of laser power. Under relatively low laser power, a negative, linear correlation existed between the outside radius and dilution rate. Likewise, a smaller outside radius indicated a smaller substrate volume, which caused an accumulation of more condensed laser energy, resulting in a larger substrate melted zone area (A2). Hence, the dilution rate increased according to Equation (1). Under relatively high laser power, the influence of the outside radius on the dilution rate was negligible. Since the cladding powder was adequately melted under relatively high laser power, the molten pool energy was not significantly affected by the heat transfer and absorption caused by the difference of the outside radii. Therefore, a simultaneous increase in laser power and decrease in the outside radius led to an increase in dilution rate.
It can be seen that the dilution rate increased with a reduction of the scanning speed in Figure 15. The reduced scanning speed denoted an increased duration of the substrate exposed under laser energy. Hence, the lifetime and fluidity of the molten pool was increased. The substrate melted zone area (A2) increased due to the energy transmitted from the molten pool to the substrate, which led to the increase of dilution rate. Additionally, Figure 15 indicated a negative, linear correlation between gas flow and dilution rate. During the cladding process, the compressed argon gas used as carrier gas expanded in the chamber, which caused an endothermic process and consumed a portion of the laser energy. In addition, the larger gas flow brought more cladding powder, which required extra energy to melt these powders. Correspondingly, the energy transmitted to the substrate was reduced. Therefore, the simultaneous reduction of gas flow and scanning speed contributed to the increase of dilution rate.
Linear correlations were found between the selected factors and the dilution rate in Figure 16. Laser power showed a positive correlation with the dilution rate. All other factors implied negative correlations with the dilution rate.

3.5. Optimization of Selected Factors and Experimental Validation

To support the potential industrial application of this study, optimization of the selected factors is necessary to achieve the targets of maximizing clad width and height as well as minimizing the dilution rate, since a low dilution rate indicates less influence on the substrate during laser cladding. Therefore, the optimization criteria and target are set in Table 7. The importance of input variables was assigned a default value of 3. Because shaping precision was the most important factor in the die-cutting tool, the importance for clad width and height was set at 5, which is the maximum level that could be assigned.
The optimized factors and the corresponding predicted responses are shown in Table 8. The processing parameter setup providing the maximal expectance was 1.6 kW laser power, 5 mm/s scanning speed, 1400 L/h gas flow, and 40 mm outside radius. Validation experiments with this setup were conducted to verify the three mathematical models by comparing the response values from the model predictions and experiment measurements (Table 8). The error percentage was calculated using the absolute difference between prediction and validation values divided by the prediction value. The calculated errors were 3.485%, 3.863%, and 6.566% for clad width, clad height, and dilution rate, respectively. The small-scale error rate validated that the prediction accuracy was satisfactory, which provides theoretical guidance for controlling the shaping on curved surfaces during laser cladding.

4. Conclusions

This study utilized a central composition design based response surface methodology to establish mathematical models that related the selected factors (laser power, scanning speed, gas flow, and outside radius) and geometric characteristics (clad width, clad height, and dilution rate) in curved surface laser cladding with curved paths. Optimized factors were experimentally validated, which provides theoretical guidance for the prediction and shaping control in curved surface laser cladding. Conclusions are addressed as follows:
  • A wider clad can be obtained by increasing the laser power and decreasing the scanning speed. Increasing the gas flow is also beneficial to improve the clad width, at a relatively lower level compared to the laser power and scanning speed. An initial increasing outside radius reduces the clad width; the influence was weakened with further increase.
  • A positive, linear correlation existed between laser power and clad height. Scanning speed shows a negative correlation with clad height. The clad height increased initially, then decreased afterwards with a continuously increasing gas flow. Increasing the outside radius causes an initial reduction of clad height, and then this trend becomes flattened.
  • The correlation between dilution rate and selected factors appears to be linear. Laser power has a major influence and positively impacts the dilution rate, while all the other factors are negatively correlated.
  • The optimized factors were acquired to maximize width and height while minimizing the dilution rate. The error rates of clad width, clad height, and dilution were 3.485%, 3.863%, and 6.566%, respectively.

Author Contributions

Methodology, G.L. and H.Z.; experiment, H.Z.; analysis, G.L., H.Z., Y.Z., X.H., C.C. and J.J.; writing—original draft preparation, G.L. and H.Z.; writing—review and editing, G.L. and Y.Z.; supervision, G.L. and Y.Z.

Funding

This research was funded by the National Natural Science Foundation of China, grant number 51575110.

Acknowledgments

The authors gratefully acknowledge the support from the Public Service Platform for Technical Innovation of Machine Tool Industry in Fujian Province at Fujian University of Technology.

Conflicts of Interest

The authors declare no conflict of interest.

References

  1. Wirth, F.; Wegener, K. A physical modeling and predictive simulation of the laser cladding process. Addit. Manuf. 2018, 22, 307–319. [Google Scholar] [CrossRef]
  2. Kovalev, O.; Bedenko, D.; Zaitsev, A. Development and application of laser cladding modeling technique: From coaxial powder feeding to surface deposition and bead formation. Appl. Math. Modell. 2018, 57, 339–359. [Google Scholar] [CrossRef]
  3. Hongyu, L.; Hui, C.; Ying, W.; Yong, C.; Wei, Y. Prediction of two-dimensional topography of laser cladding based on neural network. Int. J. Mod. Phy. B 2019, 33, 1940034. [Google Scholar] [CrossRef]
  4. Koruba, P.; Wall, K.; Reiner, J. Influence of processing gases in laser cladding based on simulation analysis and experimental tests. Procedia CIRP 2018, 74, 719–723. [Google Scholar] [CrossRef]
  5. Li, Y.; Dong, S.; Yan, S.; He, P.; Xu, B. Phase evolution of ductile iron during laser cladding processing. Surf. Coat. Technol. 2018, 339, 37–47. [Google Scholar] [CrossRef]
  6. Tanigawa, D.; Abe, N.; Tsukamoto, M.; Hayashi, Y.; Yamazaki, H.; Tatsumi, Y.; Yoneyama, M. The effect of particle size on the heat affected zone during laser cladding of Ni–Cr–Si–B alloy on C45 carbon steel. Opt. Lasers Eng. 2018, 101, 23–27. [Google Scholar] [CrossRef]
  7. Erfanmanesh, M.; Abdollah-Pour, H.; Mohammadian-Semnani, H.; Shoja-Razavi, R. An empirical-statistical model for laser cladding of WC-12Co powder on AISI 321 stainless steel. Opt. Laser Technol. 2017, 97, 180–186. [Google Scholar] [CrossRef]
  8. Yu, T.; Yang, L.; Zhao, Y.; Sun, J.; Li, B. Experimental research and multi-response multi-parameter optimization of laser cladding Fe313. Opt. Laser Technol. 2018, 108, 321–332. [Google Scholar] [CrossRef]
  9. Farahmand, P.; Kovacevic, R. Parametric study and multi-criteria optimization in laser cladding by a high power direct diode laser. Lasers Manuf. Mater. Process. 2014, 1, 1–20. [Google Scholar] [CrossRef]
  10. Torims, T.; Pikurs, G.; Ratkus, A.; Logins, A.; Vilcans, J.; Sklariks, S. Development of technological equipment to laboratory test in-situ laser cladding for marine engine crankshaft renovation. Procedia Eng. 2015, 100, 559–568. [Google Scholar] [CrossRef]
  11. Torims, T.; Bruckner, F.; Ratkus, A.; Fokejevs, A.; Logins, A. The Application of Laser Cladding to Marine Crankshaft Journal Repair and Renovation. In Proceedings of the ASME 2014 12th Biennial Conference on Engineering Systems Design and Analysis, Copenhagen, Denmark, 25–27 June 2015. Paper No: ESDA2014-20001, V001T13A001. [Google Scholar]
  12. Wang, X.; Sun, W.; Chen, Y.; Zhang, J.; Huang, Y.; Huang, H. Research on trajectory planning of complex curved surface parts by laser cladding remanufacturing. Int. J. Adv. Manuf. Technol. 2018, 96, 2397–2406. [Google Scholar] [CrossRef]
  13. Barr, C.; Da Sun, S.; Easton, M.; Orchowski, N.; Matthews, N.; Brandt, M. Influence of macrosegregation on solidification cracking in laser clad ultra-high strength steels. Surf. Coat. Technol. 2018, 340, 126–136. [Google Scholar] [CrossRef]
  14. Liu, Y.; Zhang, J.; Pang, Z.; Wu, W. Investigation into the influence of laser energy input on selective laser melted thin-walled parts by response surface method. Opt. Lasers Eng. 2018, 103, 34–45. [Google Scholar] [CrossRef]
  15. Vidyarthy, R.S.; Dwivedi, D.K.; Muthukumaran, V. Optimization of A-TIG process parameters using response surface methodology. Mater. Manuf. Process. 2018, 33, 709–717. [Google Scholar] [CrossRef]
  16. Yaakob, K.; Ishak, M.; Quazi, M.; Salleh, M. Optimizing the pulse wave mode low power fibre laser welding parameters of 22Mnb5 boron steel using response surface methodology. Measurement 2019, 135, 452–466. [Google Scholar] [CrossRef]
  17. Liu, H.; Hu, Z.; Qin, X.; Wang, Y.; Zhang, J.; Huang, S. Parameter optimization and experimental study of the sprocket repairing using laser cladding. Int. J. Adv. Manuf. Technol. 2017, 91, 3967–3975. [Google Scholar] [CrossRef]
  18. Li, N.; Xiong, Y.; Xiong, H.; Shi, G.; Blackburn, J.; Liu, W.; Qin, R. Microstructure, formation mechanism and property characterization of Ti+ SiC laser cladded coatings on Ti6Al4V alloy. Mater. Charact. 2019, 148, 43–51. [Google Scholar] [CrossRef]
  19. Jeyaprakash, N.; Duraiselvam, M.; Aditya, S. Numerical modeling of WC-12% Co laser alloyed cast iron in high temperature sliding wear condition using response surface methodology. Surf. Rev. Letters 2018, 25, 1950009. [Google Scholar] [CrossRef]
  20. Alam, M.K.; Urbanic, R.J.; Nazemi, N.; Edrisy, A. Predictive modeling and the effect of process parameters on the hardness and bead characteristics for laser-cladded stainless steel. Int. J. Adv. Manuf. Technol. 2018, 94, 397–413. [Google Scholar] [CrossRef]
  21. Sun, Y.; Hao, M. Statistical analysis and optimization of process parameters in Ti6Al4V laser cladding using Nd: YAG laser. Opt. Lasers Eng. 2012, 50, 985–995. [Google Scholar] [CrossRef]
  22. Atabaki, M.M.; Ma, J.; Liu, W.; Kovacevic, R. Pore formation and its mitigation during hybrid laser/arc welding of advanced high strength steel. Mater. Des. 2015, 67, 509–521. [Google Scholar] [CrossRef]
  23. Lei, T.; Rong, Y.; Xu, J.; Huang, Y. Experiment study and regression analysis of molten pool in laser welding. Opt. Laser Technol. 2018, 108, 534–541. [Google Scholar] [CrossRef]
  24. Gopinath, M.; Thota, P.; Nath, A.K. Role of molten pool thermo cycle in laser surface alloying of AISI 1020 steel with in-situ synthesized TiN. Sur. Coat. Technol. 2019, 362, 150–166. [Google Scholar] [CrossRef]
Figure 1. Schematic illustration of a facial cotton pad die-cutting tool.
Metals 09 00947 g001
Figure 2. Schematic illustration of a laser cladding system.
Metals 09 00947 g002
Figure 3. (a) Schematic cladding path. (b) Sample clad on a curved surface.
Metals 09 00947 g003
Figure 4. (a) Schematic cross-section of the clad. CZ, cladding zone; MZ, melting zone; and HAZ, heat-affected zone. (b) Cross-section of the clad under SEM.
Metals 09 00947 g004
Figure 5. (a) Clad width model plot of residuals. (b) Clad width model prediction and actual comparison.
Metals 09 00947 g005
Figure 6. (a) 3D response surface showing the influence of laser power and gas flow on clad width. (b) Contour line of the response surface.
Metals 09 00947 g006
Figure 7. (a) 3D response surface showing the influence of scanning speed and gas flow on clad width. (b) Contour line of the response surface.
Metals 09 00947 g007
Figure 8. The influence of selected factors on clad width.
Metals 09 00947 g008
Figure 9. (a) Clad height model plot of residuals. (b) Clad height model prediction and actual comparison.
Metals 09 00947 g009
Figure 10. (a) 3D response surface showing the influence of laser power and gas flow on clad height. (b) Contour line of the response surface.
Metals 09 00947 g010
Figure 11. (a) 3D response surface showing the influence of scanning speed and outside radius on clad height. (b) Contour line of the response surface.
Metals 09 00947 g011
Figure 12. The influence of selected factors on clad width.
Metals 09 00947 g012
Figure 13. (a) Dilution rate model plot of residuals. (b) Dilution rate model prediction and actual comparison.
Metals 09 00947 g013
Figure 14. (a) 3D response surface showing the influence of laser power and outside radius on dilution rate. (b) Contour line of the response surface.
Metals 09 00947 g014
Figure 15. (a) 3D response surface showing the influence of scanning speed and gas flow on dilution rate. (b) Contour line of the response surface.
Metals 09 00947 g015
Figure 16. The influence of selected factors on dilution rate.
Metals 09 00947 g016
Table 1. Elemental composition (wt.%) of W6Mo5Cr4V2 high-speed steel powder.
CSiMnCrMoVWFe
0.8–0.90.15–0.40.2–0.453.8–4.44.5–5.51.75–2.25.5–6.75Rest
Table 2. Levels of laser cladding processing parameters and substrate size in the central composite design (CCD).
VariablesNotationUnitLevels of Input Variables
−2−1012
Laser PowerLPkW11.21.41.61.8
Scanning SpeedSSmm/s45678
Gas FlowGFL/h8001000120014001600
Outside Radius of Cylindrical substrateRCmm3040506070
Table 3. Experimental design and results.
RunLP
(kW)
SS (mm/s)GF (L/h)RC (mm)Width (mm)Height (mm)Dilution Rate (%)
11.461200302.4261.91715.594
21.481200501.5261.05212.064
31.251000601.7851.2458.114
41.651400601.9931.51517.027
51.271400401.6351.3536.510
61.461200501.6841.53113.055
71.671000601.4461.27414.926
81.651400402.2321.96410.677
91.271000401.5541.3749.928
101.461200501.8311.47412.182
111.271000601.4530.8886.458
121.251000402.1071.35622.467
131.46800501.6590.96218.071
141.461200701.6931.02410.224
151.461200501.8551.26713.846
161.461600501.7030.8526.610
17161200501.4390.8694.594
181.671000401.5841.76718.432
191.671400401.9911.69312.693
201.461200501.6911.21018.113
211.441200501.9221.46520.825
221.671400601.8971.15718.227
231.651000601.9541.32320.657
241.461200501.8151.30913.739
251.861200502.0531.86722.349
261.251400601.5180.8767.264
271.251400401.8611.0538.036
281.651000402.1361.75626.536
291.461200501.7631.32413.205
301.271400601.4760.7674.349
Table 4. Analysis of variance of clad width.
SourceSum of SquaresDegrees of FreedomMean SquareF Valuep-Value
Prob > F
Comments
Model1.6880.2133.4<0.0001significant
LP0.3910.3962.48<0.0001
SS0.4710.4773.94<0.0001
GF0.01910.0192.990.0985
RC0.3910.3961.34<0.0001
LP × GF0.1210.1219.520.0002
SS × GF0.1110.1117.830.0004
SS × RC0.02210.0223.500.0752
RC20.1610.1625.56<0.0001
Residual0.13216.294 × 10−3
Lack of Fit0.11166.598 × 10−31.240.4382nonsignificant
R-Square0.9271Pred R-Square0.8160
Adeq Precision19.768Adj R-Square0.8994
Table 5. Analysis of variance of clad height.
SourceSum of SquaresDegrees of FreedomMean SquareF Valuep-Value
Prob > F
Comments
Model2.9680.3726.52<0.0001significant
LP1.2811.2891.46<0.0001
SS0.1110.118.040.0099
GF0.02810.0282.030.1686
RC1.0711.0776.40<0.0001
LP × GF0.06510.0654.690.0420
SS × RC0.05410.0543.880.0621
GF20.2810.2819.750.0002
RC20.05110.0513.680.0689
Residual0.29210.014
Lack of Fit0.22160.0130.880.6204nonsignificant
R-Square0.9099Pred R-Square0.8144
Adeq Precision20.304Adj R-Square0.8756
Table 6. Analysis of variance of dilution rate.
SourceSum of SquaresDegrees of FreedomMean SquareF Valuep-Value
Prob > F
Comments
Model896.017128.0031.92<0.0001significant
LP429.761429.76107.17<0.0001
SS91.17191.1722.74<0.0001
GF179.621179.6244.79<0.0001
RC35.03135.038.740.0073
LP × RC33.80133.808.430.0082
SS × GF44.91144.9111.200.0029
GF × RC81.72181.7220.380.0002
Residual88.22224.01
Lack of Fit66.39173.910.890.6124nonsignificant
R-Square0.910Pred R-Square0.8227
Adeq Precision21.901Adj R-Square0.8818
Table 7. Optimization criteria and targets.
Variables/Responses Input/Output CriterionLimitImportance
LowerUpper
VariableLaser Power (kW)In range1.21.63
Scanning Speed (mm/s)In range573
Gas Flow (L/h)In range100014003
Outside Radius of Cylindrical substrate (mm)In range40603
ResponseClad width (mm)Maximize1.4392.4265
Clad height (mm)Maximize0.7671.9645
Dilution rate (%)Minimize4.34926.5364
Table 8. Comparison between predicted optimization results and experimental validation.
Comparison LP
(kW)
SS (mm/s)GF
(L/h)
RC (mm)Width (mm)Height (mm)Dilution Rate (%)DesirabilityComments
Prediction1.6005.0001400.00040.0002.2671.78612.8240.773Selected
Validation1.6005.0001400.00040.0002.1881.85511.982--

