Article

Mathematical Model and Verification of Residual Stress Induced by Water Jet Peening

1
School of Mechanical Engineering, Zhengzhou University, Zhengzhou 450001, China
2
Henan Key Engineering Laboratory for Anti-Fatigue Manufacturing Technology, Zhengzhou 450001, China
3
Ministry of Education & Hubei Key Laboratory of Mechanical Transmission and Manufacturing Engineering, Wuhan University of Science and Technology, Wuhan 430080, China
*
Authors to whom correspondence should be addressed.
Metals 2019, 9(9), 936; https://doi.org/10.3390/met9090936
Submission received: 29 July 2019 / Revised: 17 August 2019 / Accepted: 19 August 2019 / Published: 27 August 2019
(This article belongs to the Special Issue Advanced Surface Modification Technologies)

Abstract

:
The water jet peening (WJP) technology can induce compressive residual stress (RS) in metal surfaces and, thus, improve the fatigue life of components. In this paper, a mathematical model is proposed for calculating the RS induced by WJP. To validate the proposed mathematical model, experimental and finite element simulation verifications were carried out on Al6061-T6. The distribution of RS along the depth direction, the maximum compressive RS, and the depth of the compressive RS layer were also investigated based on the mathematical model. Results showed that the error of maximum compressive RS between the mathematical model and experiment was within 9% under a jet pressure of 60 MPa, and the error of depth of the compressive RS layer between the mathematical model and experiment was within 13% under a jet diameter of 0.3 mm. Hence, the mathematical model is reliable and accurate. The maximum compressive RS increases with the increase in jet pressure, and the depth of the compressive RS layer approximately linearly increases with the increase in jet diameter.

1. Introduction

Water jet peening (WJP) technology is a surface modification technology that was initiated in the 1980s [1]; it uses a high-energy water jet to impact the surface of metallic components to form plastic deformation below the recrystallization temperature, thus inducing compressive residual stress (RS) so as to improve the fatigue life of components. In addition to its high energy density, low cost, and environmental protection, WJP can precisely control the injection position to avoid “unpeened” regions, leading to WJP attracting extensive research attention.
Epp et al. [2] used a water jet to impact the surface of 18CrNiMo7-6, and the maximum compressive RS induced on the surface of the peened specimen was as high as −1000 MPa under a jet pressure of 450 MPa. Azmir et al. [3] used a water jet to impact the surface of AISI304, and a compressive RS of −470 MPa was induced on the surface of the peened specimen under a jet pressure of 200 MPa. Lieblich et al. [4] used a water jet to impact the surface of Ti6Al4V, and a compressive RS of −410 MPa was induced on the surface of the peened specimen under a jet pressure of 240 MPa. Alora et al. [5] used a water jet to impact the surface of commercially pure titanium, and a compressive RS of −180 MPa was induced on the surface of the peened specimen under a jet pressure of 280 MPa. He et al. [6] used a water jet to impact the surface of Al6061-T6 alloy, and a compressive RS of −124 MPa was induced on the surface of the peened specimen under a jet pressure of 40 MPa, while the compressive RS layer depth of the peened specimen reached 200 μm.
Masataka et al. [7] used a water jet to impact the surface of SCM435, and the maximum compressive RS induced on the surface of the peened specimen was as high as −358 MPa. Madhulika et al. [8] used a water jet to impact the surface of AISI304, and the surface of the peened specimen was transformed from an initial tensile RS of 222 MPa to a compressive RS of −513 MPa.
In addition to experimental methods, mathematical modeling and finite element simulation models were also used to study the RS induced by WJP. Kunaporn et al. [9] used ANSYS to simulate the process of WJP on Al7075-T6 alloy; it was found that the simulation model results of the RS field were almost consistent with the experimental results. Subsequently, Kunaporn et al. [10] proposed a mathematical model capable of predicting critical standoff distance under different WJP conditions. Rajesh et al. [11,12] proposed a finite element method that considers the jet pressure distribution of high-velocity droplets impacting on the target surface rather than the stationary pressure distribution, and used ANSYS to simulate the process of WJP on Al6063-T6 alloy; the RS obtained by the simulation model was compared with the experimental results, and the deviation was about 10%. Based on the quasi-static pressure distribution and the nonlinear axial symmetry plane distributed load, Dong et al. [13] used ANSYS to simulate the process of WJP on Al2A11 alloy under different pressures, and obtained the distribution of the RS field and the variation law of RS along the layer depth and radial direction. Hsu et al. [14] used the coupled Euler–Lagrangian (CEL) method of ABAQUS to simulate the dynamic process of WJP; the water hammer pressure and stagnation pressure obtained by the simulation model were theoretically confirmed, and further verified by Obara’s experiment [15]. Cho et al. [16] used ANSYS to simulate the impact of water droplets on AL6061-T6, whereas He et al. used ABAQUS to simulate the impact of a water jet on AL6061-T6 alloy. They all found that the plastic deformation and RS occurred only when the jet velocity was beyond a certain critical value. Kunaporn et al. [17] used ANSYS to simulate the process of WJP on Al7075-T6 alloy with quasi-static pressure distribution, and obtained the variation law of the stress–strain field during the peening process.
However, the induced RS after WJP in the above studies was mostly obtained via simulation models and experiments, whereas it was not found directly using a mathematical model. In addition, most of the above simulation models of WJP used only single-point fixed impact, which is not consistent with the actual working conditions because WJP features multiple-pass impact. Therefore, a mathematical model is proposed in this study for calculating the RS induced by WJP. To validate the proposed mathematical model, experimental and finite element simulation verifications were carried out on Al6061-T6. The distribution of RS along the depth direction, the maximum compressive RS, and the depth of the compressive RS layer were also investigated based on the mathematical model.

2. Mathematical Model for Calculating RS after WJP

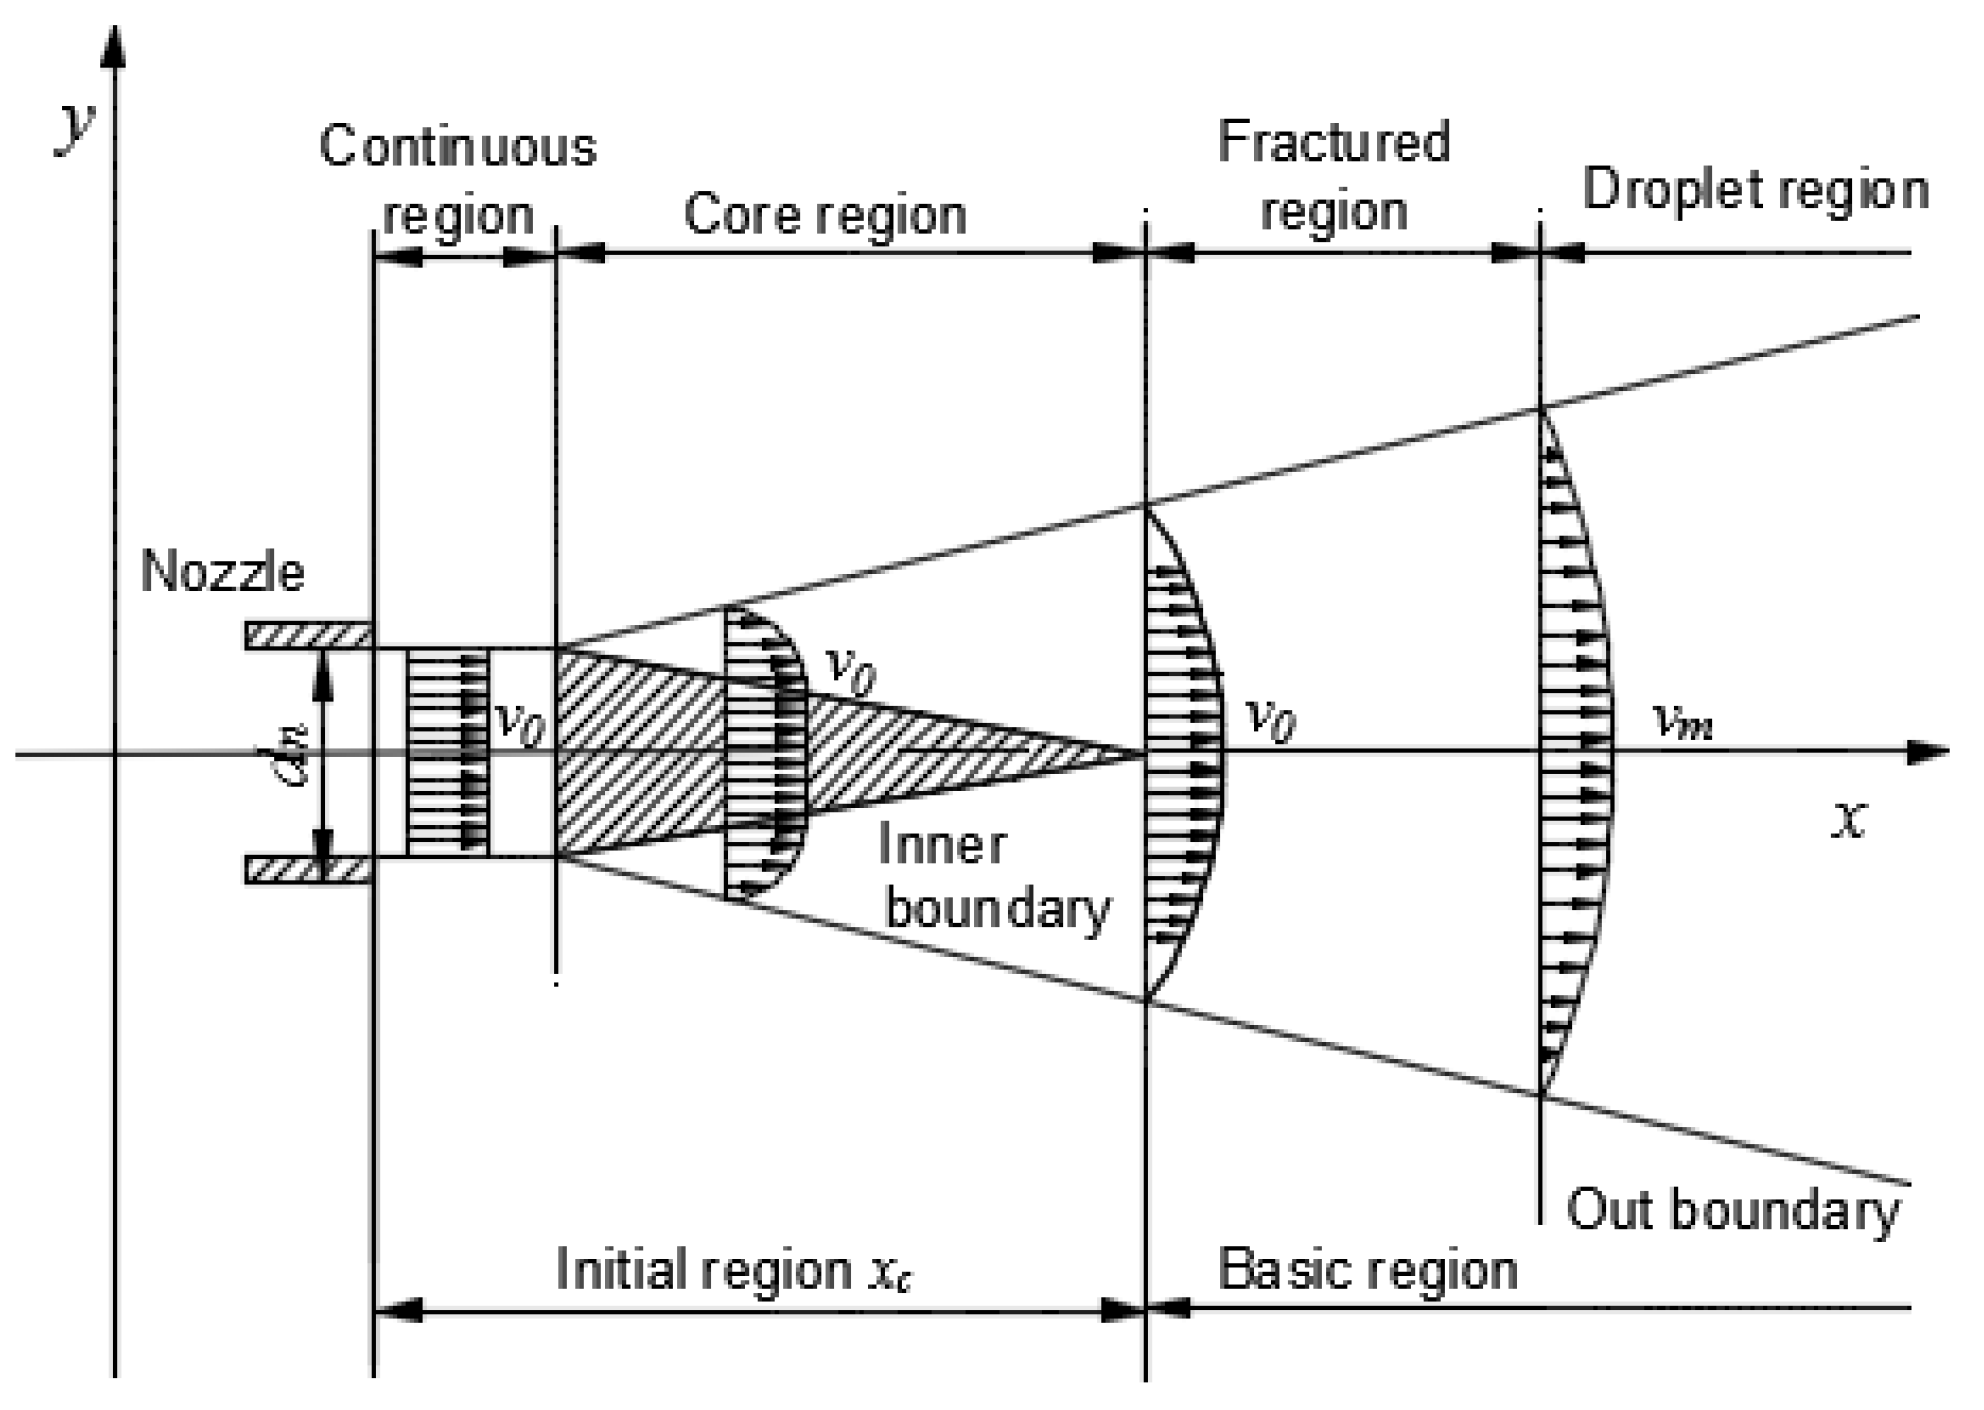
2.1. Impact Pressure

As shown in Figure 1, the water jet can be divided into two regions along the impact direction: the initial region and basic region. The initial region can be divided into a continuous region and a core region, and the basic region can be divided into a fractured region and a water droplet region [6]. The energy of the initial region is concentrated, which is beneficial for strengthening. Therefore, it is better to locate the target surface that needs strengthening in the initial region; the length of initial region xc [6] is determined as follows:
x c = ( 63 ~ 135 ) d n ,
where dn is the nozzle diameter; dn = 0.3 mm in this paper.
According to Equation (1), the length of the initial region is 19.5–40.5 mm. Meanwhile, the standoff distance is only 3 mm, which is much less than xc; thus, it can be considered that the jet is located in the continuous region.
Among these four regions, the continuous region is close to the nozzle and the jet remains continuous. In this case, the jet almost does not diverge when it reaches the target surface, and the jet velocity has almost no attenuation. Moreover, the jet velocity is the same at an arbitrary point on a certain cross-section and it is equal to the velocity of nozzle exit.
Therefore, it can be considered that the jet diameter d is equal to the nozzle diameter dn, and the jet velocity v is uniformly distributed and equal to v0.
According to liquid impact theory, when the impact pressure of a water jet acts on a target surface, the impact pressure includes two phases: the water-hammer pressure (PC) phase and the stagnation pressure (PS) phase [17,18]. During the water-hammer pressure phase, the jet peening on the solid surface occurs in a compressible manner and produces high pressure, which makes the jet act on the target surface like a “water hammer”, thereby inducing stress inside the target. Water-hammer pressure PC can be expressed as follows:
P c = ρ v c 1 ,
where ρ is the density of water, v is the jet velocity, and c1 is the shock velocity of water. c1 can be expressed as follows:
c 1 = c 0 + k v ,
where v is the jet velocity, c0 is the acoustic velocity of water (around 1500 m/s), and k is a coefficient with a value of about 2 for v ≤ 1000 m/s.
The duration τ of water-hammer pressure can be expressed as follows:
τ = d 2 c 1 .
As shown in Figure 2, after the water-hammer pressure phase, the impact pressure decreases and reaches a steady state, which becomes the stagnation pressure PS. From the Bernoulli equation, PS can be expressed as follows:
P s = 1 2 ρ v 2 .

2.2. Mathematical Model of RS

The continuous region was applied in the experiment of WJP, whereby the axial dynamic pressure of the water jet was constant and the radial dynamic pressure was hardly attenuated. Therefore, the impact pressure of the water jet acting on the target surface was assumed to be uniformly distributed [17] (i.e., the pressure at each point in the jet coverage region was equal to the water-hammer pressure) (Figure 3). In addition, during the WJP process, the formation of the RS field was the result of the water-hammer pressure [6,19]; thus,
P ( r ) = P c ,
where r is the distance from any point on the jet cross-section to the center; rmax is one-half of jet diameter d.
The contact center between the jet and target surface was taken as the coordinate origin O, whereas the Z-axis direction was the depth direction of the target. According to the Hertzian theory, the elastic stress field of the target along the Z-axis direction is expressed as follows:
σ X e = σ Y e = p c { 1 + 2 μ 2 ( 1 + μ ) Z ( r 2 + Z 2 ) 1 2 + Z 3 2 ( r 2 + Z 2 ) 3 2 } ,
σ Z e = p c { 1 Z 3 ( r 2 + Z 2 ) 3 2 } ,
where σ k e ( k = X Y Z ) is the principal stress, μ is the Poisson’s ratio of the target material, PC is the water-hammer pressure, r is the jet radius, and Z is the depth from the target surface.
The von Mises equivalent stress ( σ i e ) can be calculated from the principal stress, expressed as follows:
σ i e = 1 2 [ ( σ X e σ Y e ) 2 + ( σ Y e σ Z e ) 2 + ( σ Z e σ X e ) 2 ] 1 2 .
According to Hooke’s law, the principal strains of the target are expressed as follows:
ε X e = ε Y e = 1 E [ σ X e μ ( σ Y e + σ Y e ) ] ,
ε Z e = 1 E ( σ Z e 2 μ σ X e ) ,
where E is the Young’s modulus of the target material.
The equivalent strain ε i e can be directly obtained by Hooke’s law as follows:
ε i e = σ i e E .
The target was treated as a bilinearly reinforced elastic–plastic body, and its stress–strain relationship is shown in Figure 4, where σ s and ε s are the yield stress and yield strain, respectively, σ b and ε b are the ultimate tensile stress and plastic strain corresponding to σ b , respectively, H 1 is the linear strain-hardening rate of the target material, and σ i p and ε i p are the plastic stress and plastic strain, respectively.
An arbitrary point was taken on the Z-axis; the point was in an elastic state when ε i e < ε s , and the point was in an elastic–plastic state when ε i e ε s . The empirical formula for elastic–plastic strain proposed by Li et al. [20] is as follows:
ε i p = { ε i e ε s + α ( ε i e ε s )   ε i e < ε s ε i e ε s ,
where α = r/R ≈ 0.39, r is the jet radius, and R is the radius of the region affected by the jet impact pressure [14].
The yield strain ε s is expressed as follows:
ε s = σ s E .
Then, from the elastic–plastic stress–strain curve of the target material, σ i p can be obtained, which corresponds to ε i p .
σ i p = { σ i e σ s + H 1 ( ε i p ε s ) σ b ε i p < ε s    ε s ε i p < ε b ε i p ε b ,
H 1 = σ b σ s ε b ε s .
To facilitate the calculation of the stress after unloading, the deformation of the target caused by WJP was neglected. In addition, the unloading process before the start of reverse yielding was considered as the elastic deformation process.
Obviously, for isotropic strengthening materials, the residual stress can be expressed as follows:
When σ i e < σ s ,
σ i r = 0 .
When σ s σ i e < 2 σ i p ,
σ X r = σ Y r = 1 3 ( σ i p σ i e ) ,
σ Z r = 2 σ X r .
When 2 σ i p σ i e ,
σ X r = σ Y r = 1 3 ( σ i p 2 σ i p Δ σ i p ) ,
σ Z r = 2 σ X r .
After the WJP strengthens a region, it can be considered that the stress–strain field formed on target surface is uniform and stable. According to the research results in the literature [21], the average value of RS ( σ i n d ) of the entire peened region can be expressed as follows:
σ X i n d = σ Y i n d = 1 + μ 1 μ σ X r ,
σ Z i n d = 0 .

3. Simulation Model and Experimental Procedures

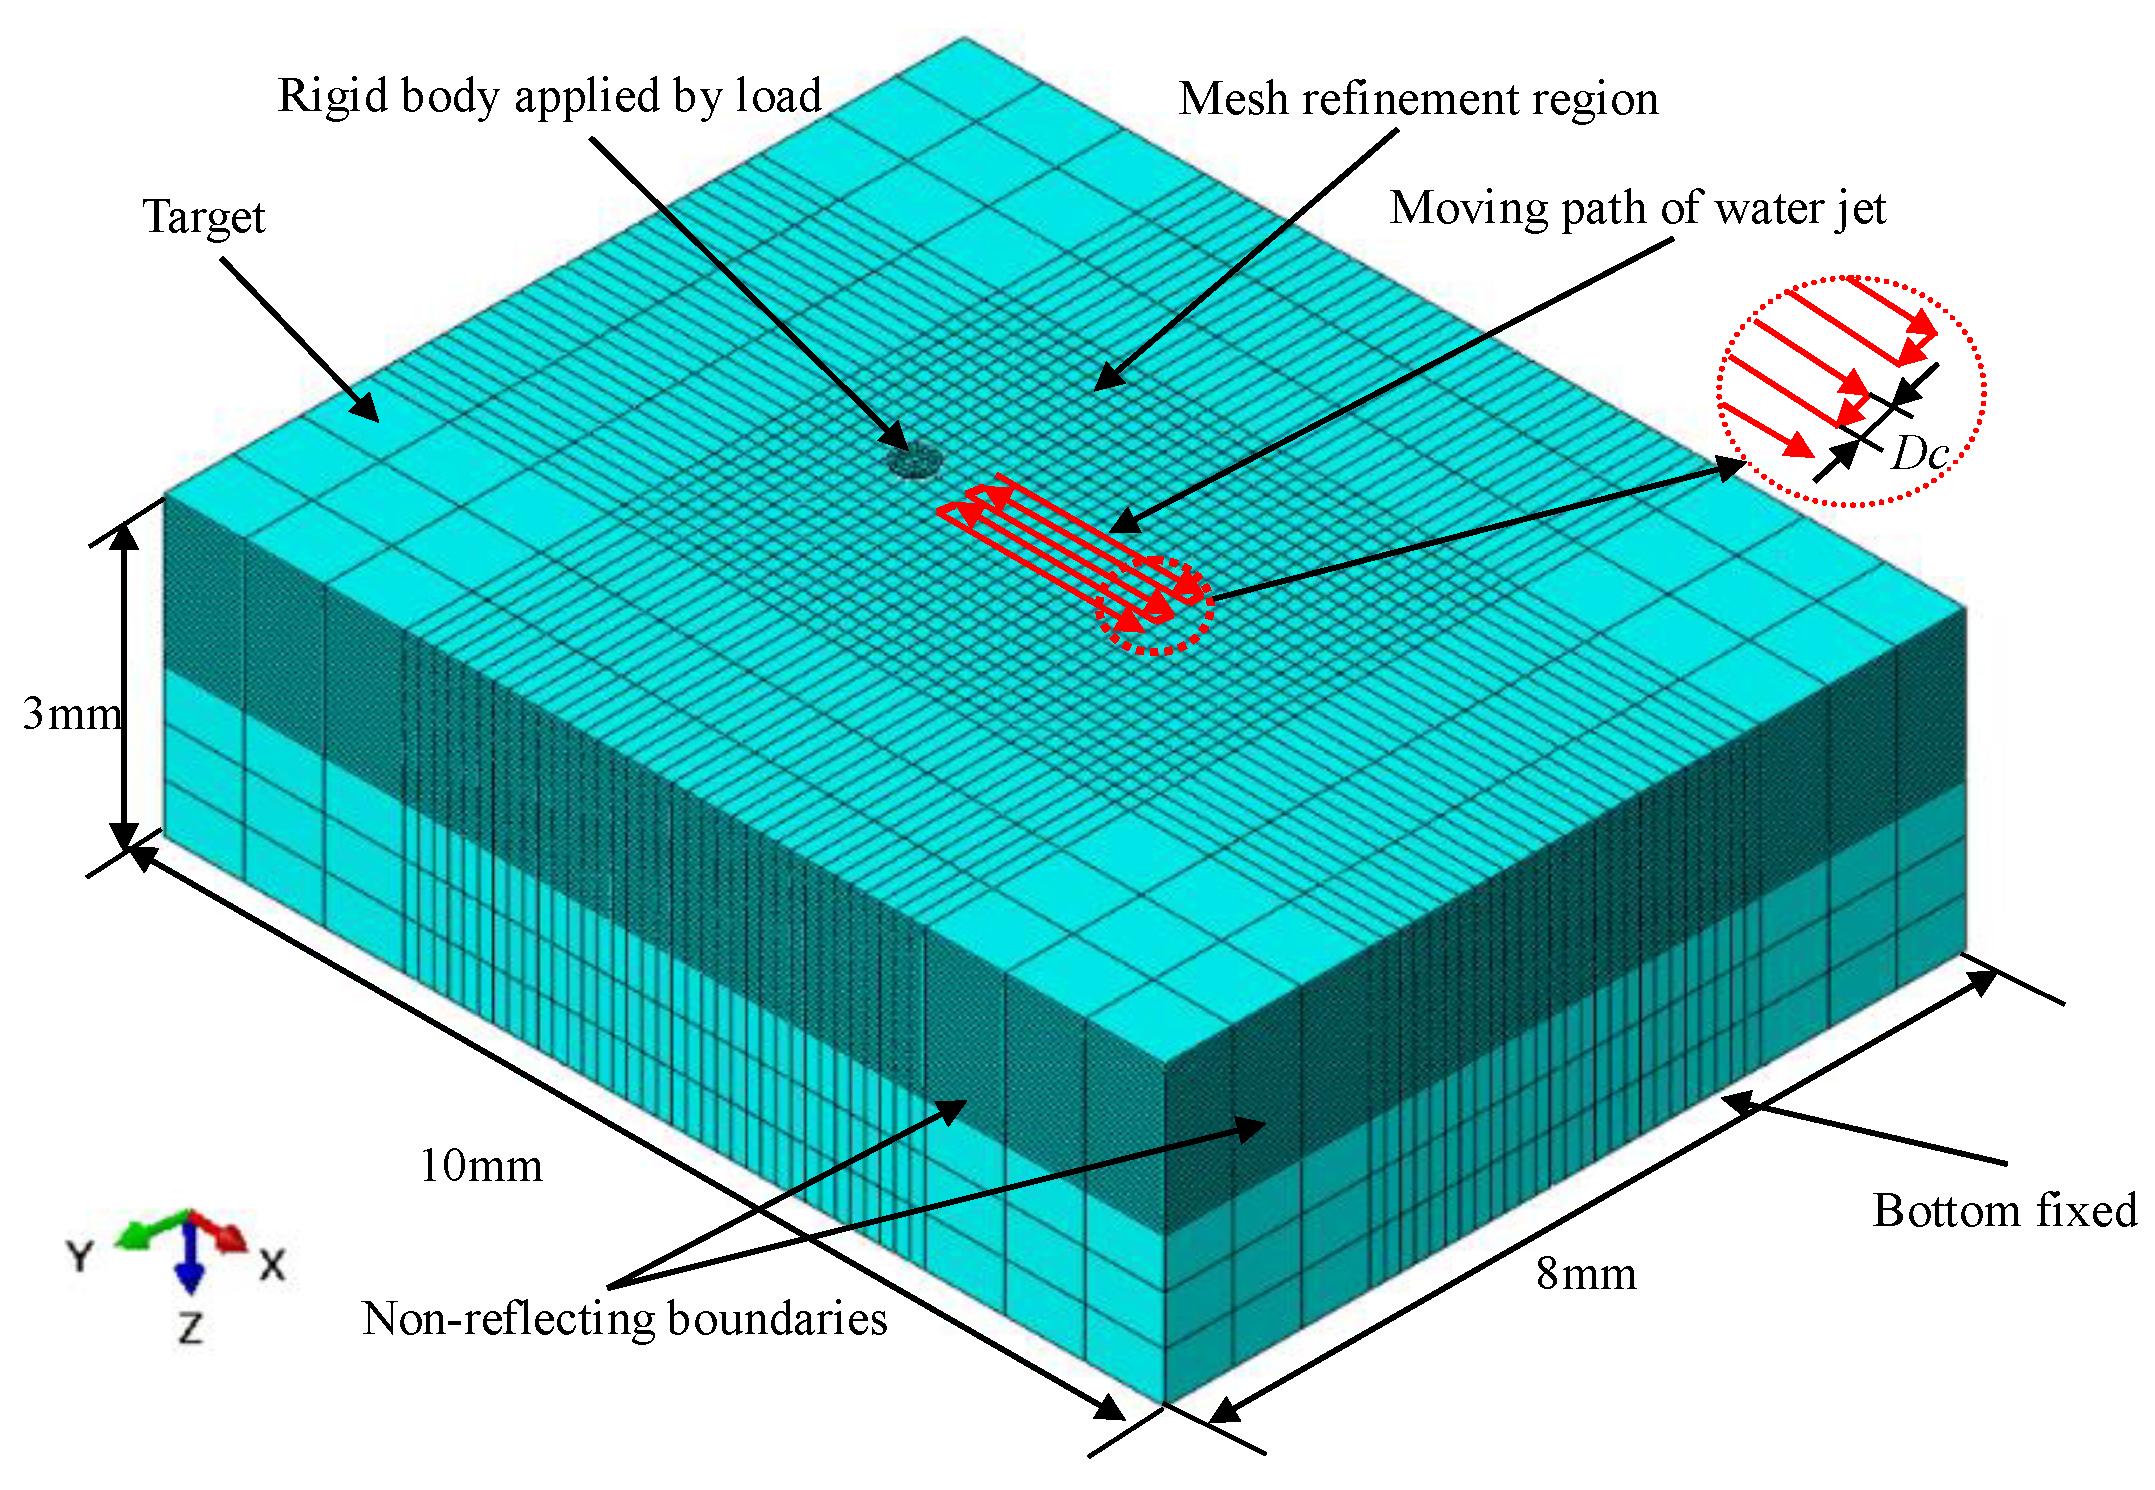
3.1. Finite Element Simulation Model

A simulation model of multiple-pass WJP is developed in this section. To simplify the calculation, some basic assumptions are proposed as follows:
  • The target material is isotropic elastic–plastic.
  • Consistent with the mathematical model in Section 2.2, the impact pressure acting on the target surface is also assumed to be uniformly distributed [9,10,17,22].
  • Previous work decreased the erosion to a minimum (i.e., erosion can be almost neglected) by increasing jet traverse velocity and adjusting other parameters [6]. In addition, Rajesh [12], Hsu [14], and Cho [16] et al. neglected erosion when studying WJP; thus, erosion was neglected in the finite element model.

3.1.1. Mesh and Boundary Conditions

According to the actual diameter of the water jet, a pressure distribution of 0.3 mm in diameter was determined; a target model of 10 mm in length, 8 mm in width, and 3 mm in height (Figure 5) was established. The chosen element type of the target was linear hexahedral with reduced integration (i.e., C3D8R). A discrete rigid body was selected as the applied body, and its chosen element type was bilinear rigid quadrilateral (i.e., R3D4); all nodes on the bottom surface of the target were completely fixed. All four sides of the target model were specified as non-reflecting boundaries to eliminate the reflection of stress waves. Furthermore, in the load acting region, the target model was meshed by elements of 0.15 mm in the X- and Y-directions, and 0.04 mm in the Z-direction. The rest of the target model was meshed by elements of 0.5 mm, and the rigid body was meshed by elements of 0.04 mm, as shown in Figure 5.

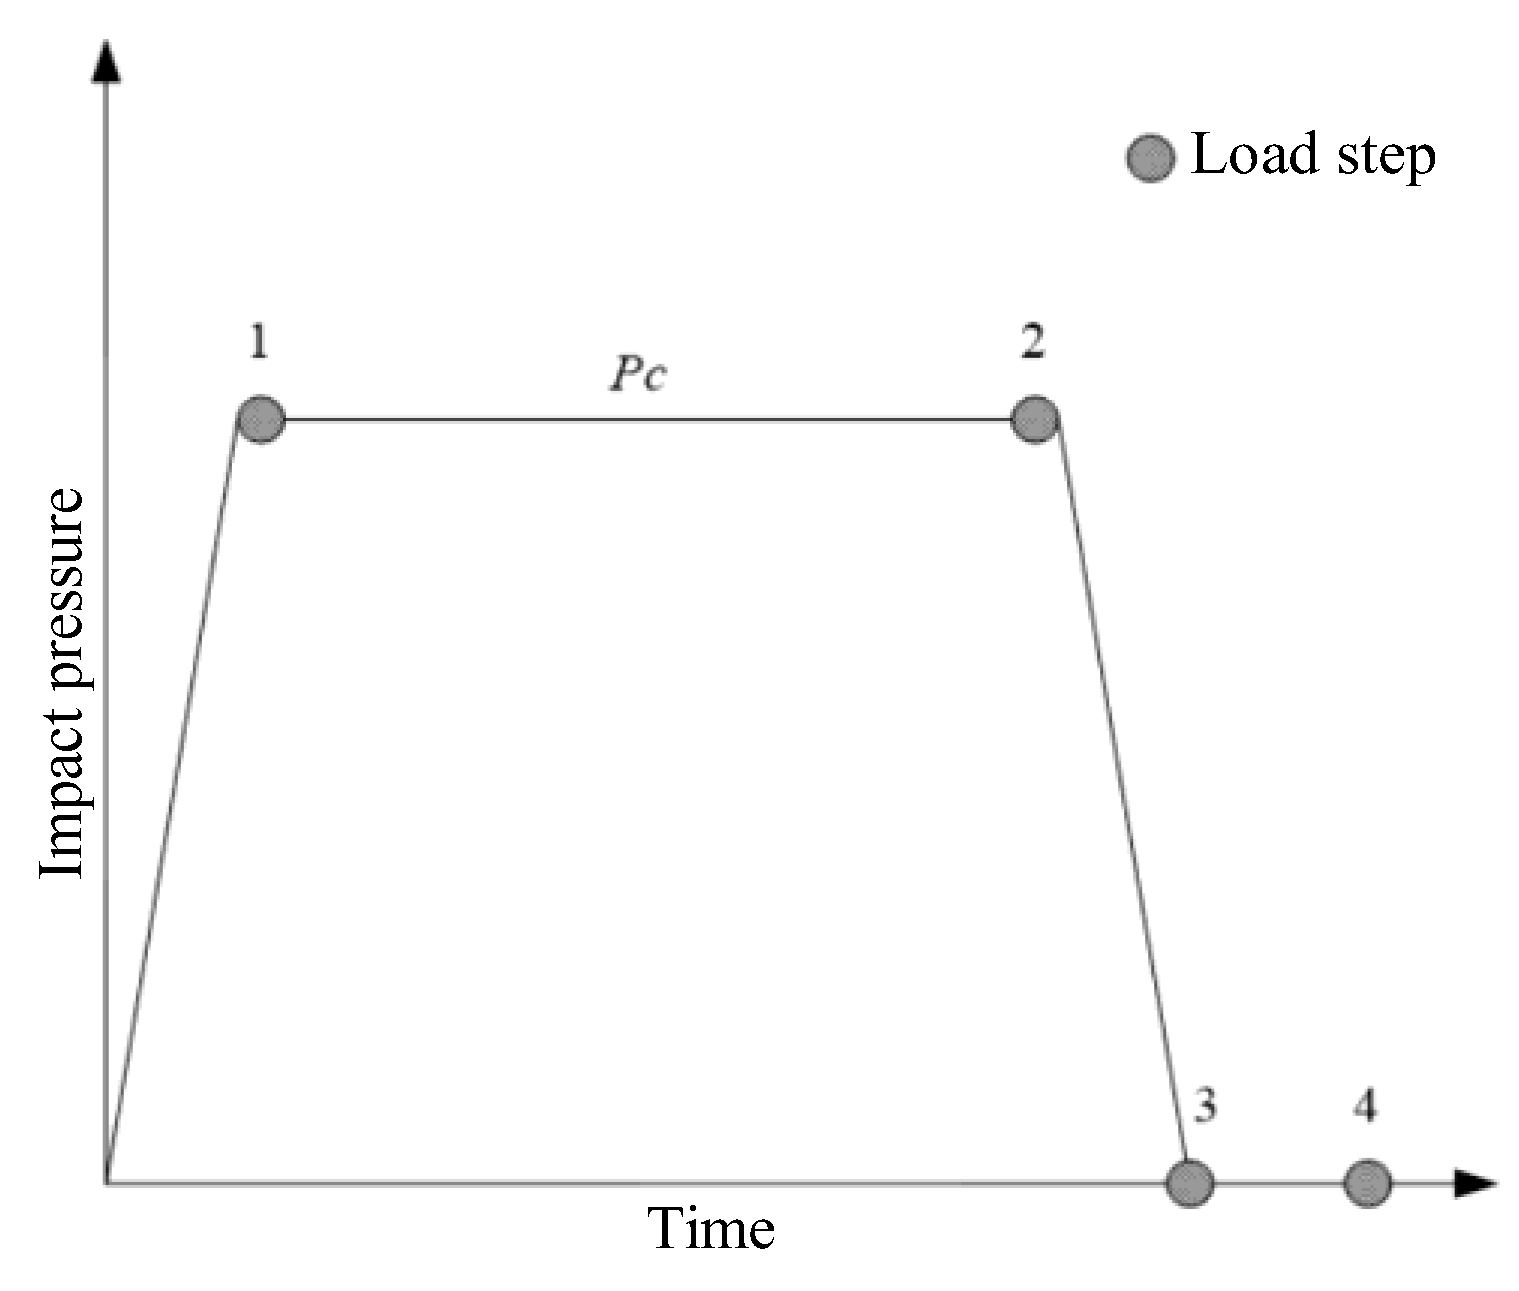
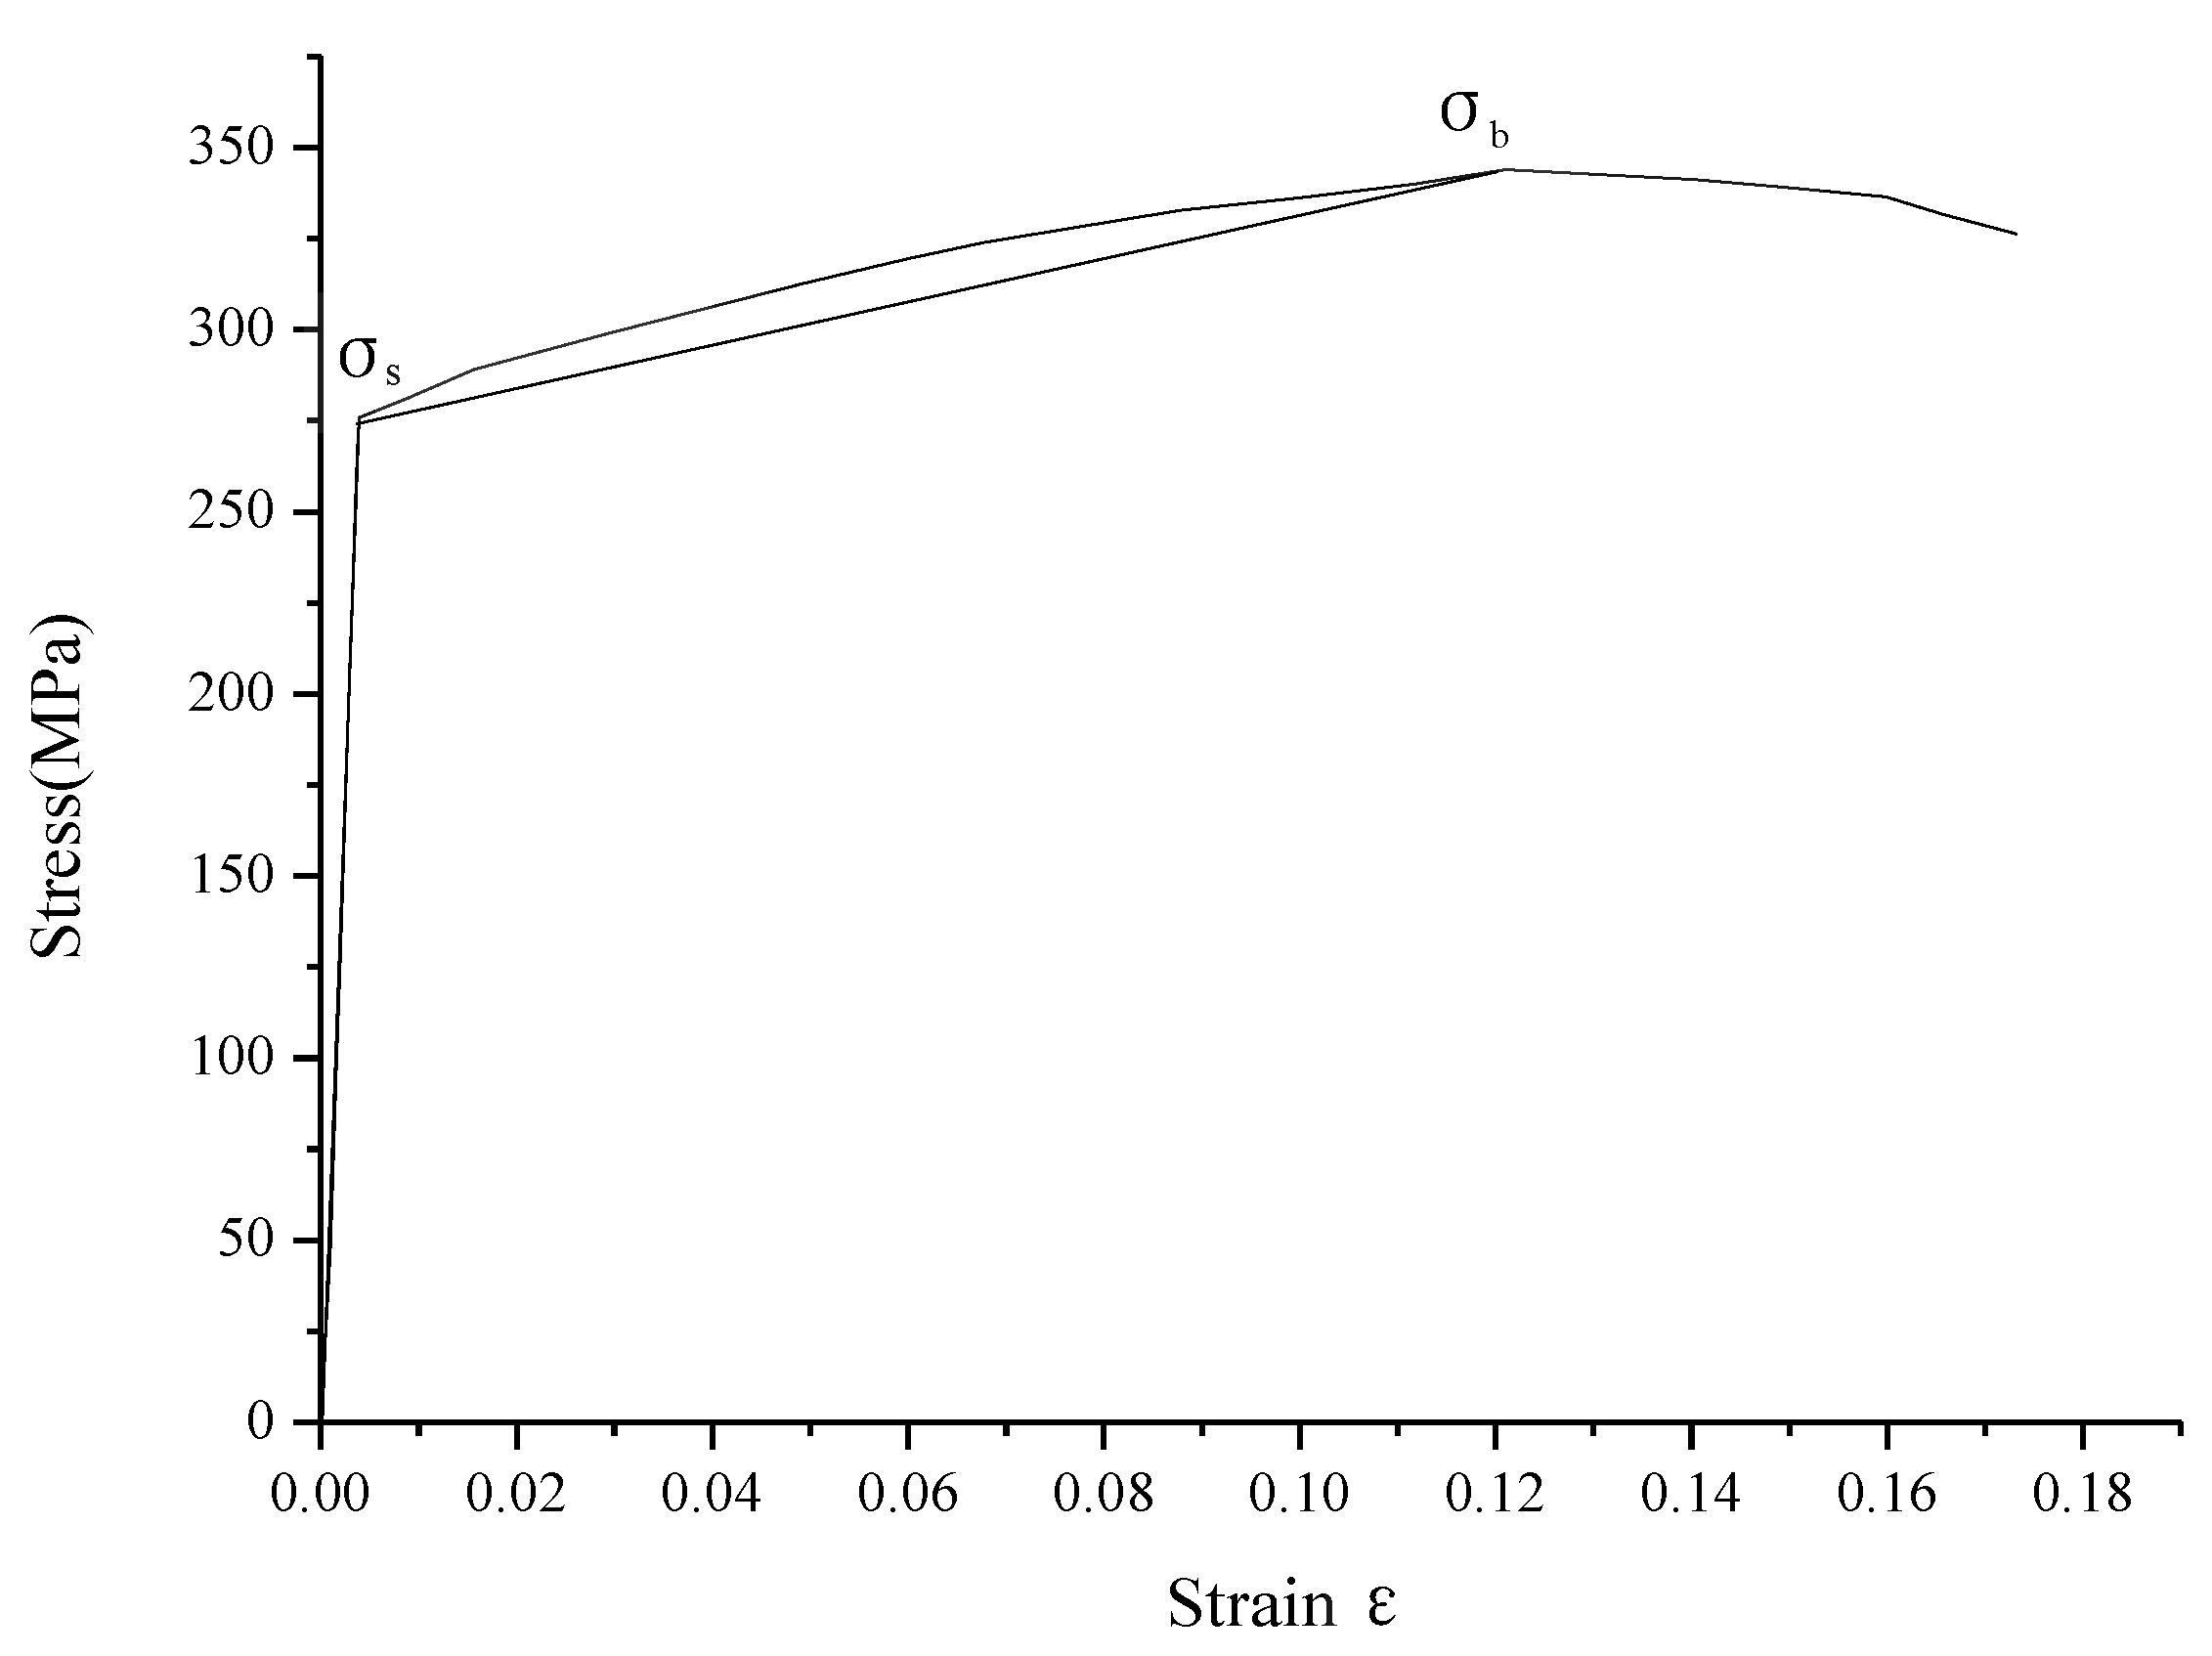
3.1.2. Material and Load

Al6061-T6 alloy was selected as the target material, which has a yield stress of 265 MPa, Young’s modulus of 69 GPa, Poisson’s ratio of 0.33, and density of 2900 kg/m3. To remain consistent with Section 2.2, a bilinear isotropic strengthened elastic–plastic model was also selected as the constitutive model of the target material [23,24]. The stress–strain relationship of the Al6061-T6 alloy was input into ABAQUS.
Because the formation of the RS field is the result of water-hammer pressure, it was used as the load of the simulation model. In addition, jet pressures of 20, 26, 33, 44, 50, 60, 72, and 80 MPa were taken; the corresponding water-hammer pressure was firstly calculated using Equations (2) and (3) in Section 2.1, and then applied to the bottom surface of the discrete rigid body shown in Figure 4. Its direction was along the Z-axis direction (i.e., the depth direction).
For the convergence of the simulation model, four load steps were set: loading phase, sustaining phase, unloading phase, and elastic recovering phase, as shown in Figure 6. The detailed parameters of the simulation model of WJP are shown in Table 1.
In the actual process of WJP, the jet needs to strengthen the entire region. Only when the water jet completes multiple passes in a Z-shape (Figure 5), instead of peening a straight line, can the strengthening of the whole region be realized.
The multiple-pass impact was realized by introducing the stress–strain field of the previous impact into the simulation model of the next impact through the “create a predefined field” of the load module in ABAQUS. Combined with the authors’ previous work [6] and other studies [4,22], the distance between the center of the adjacent water jets DC was set as 0.15 mm.

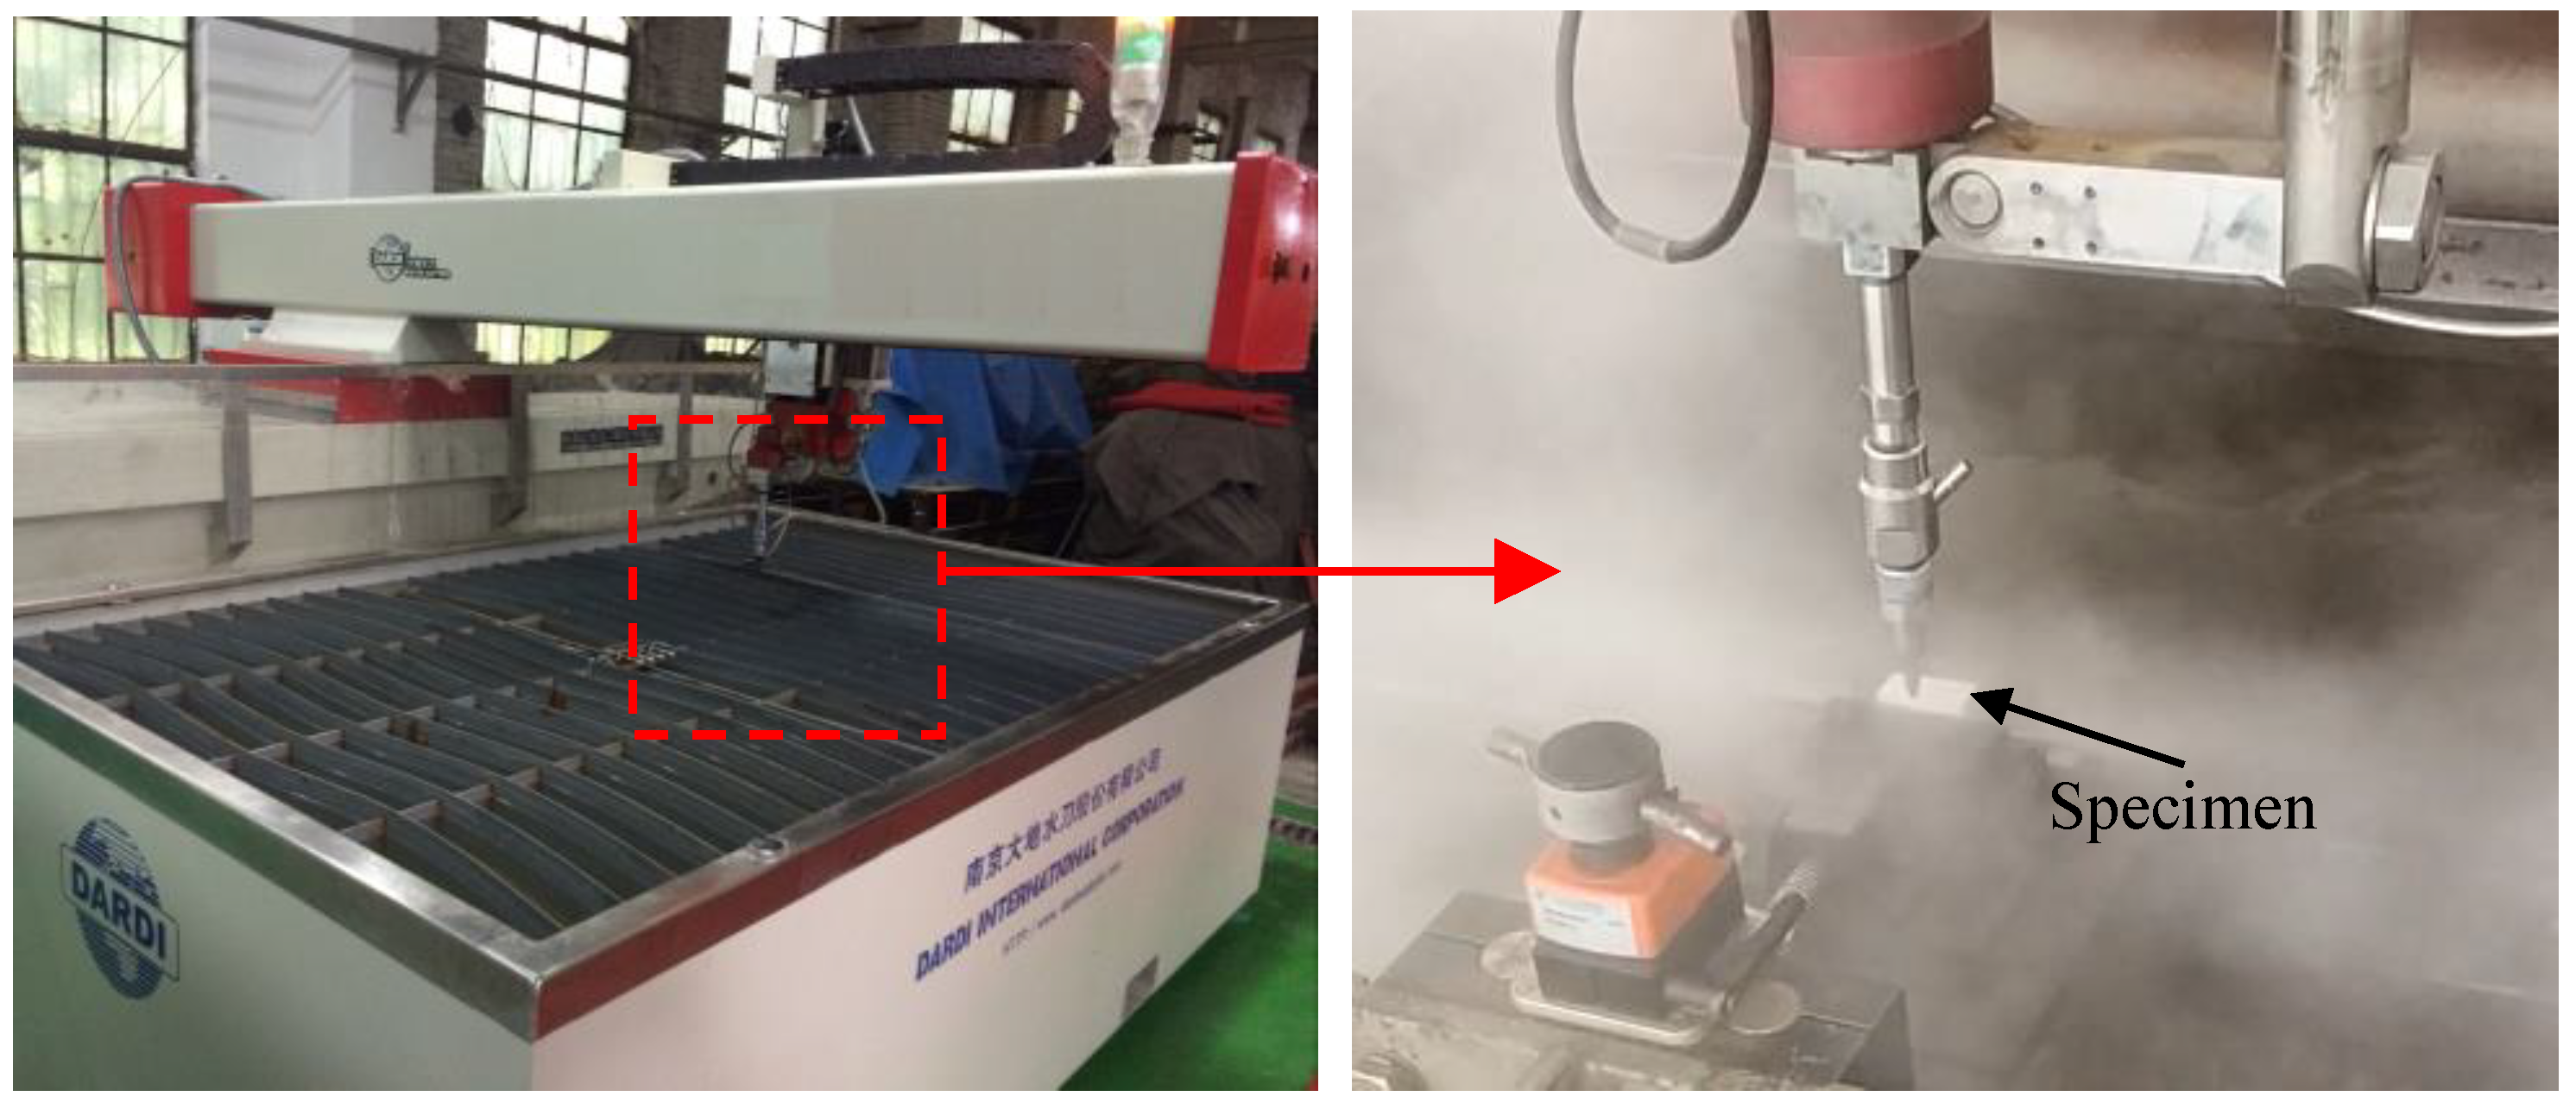
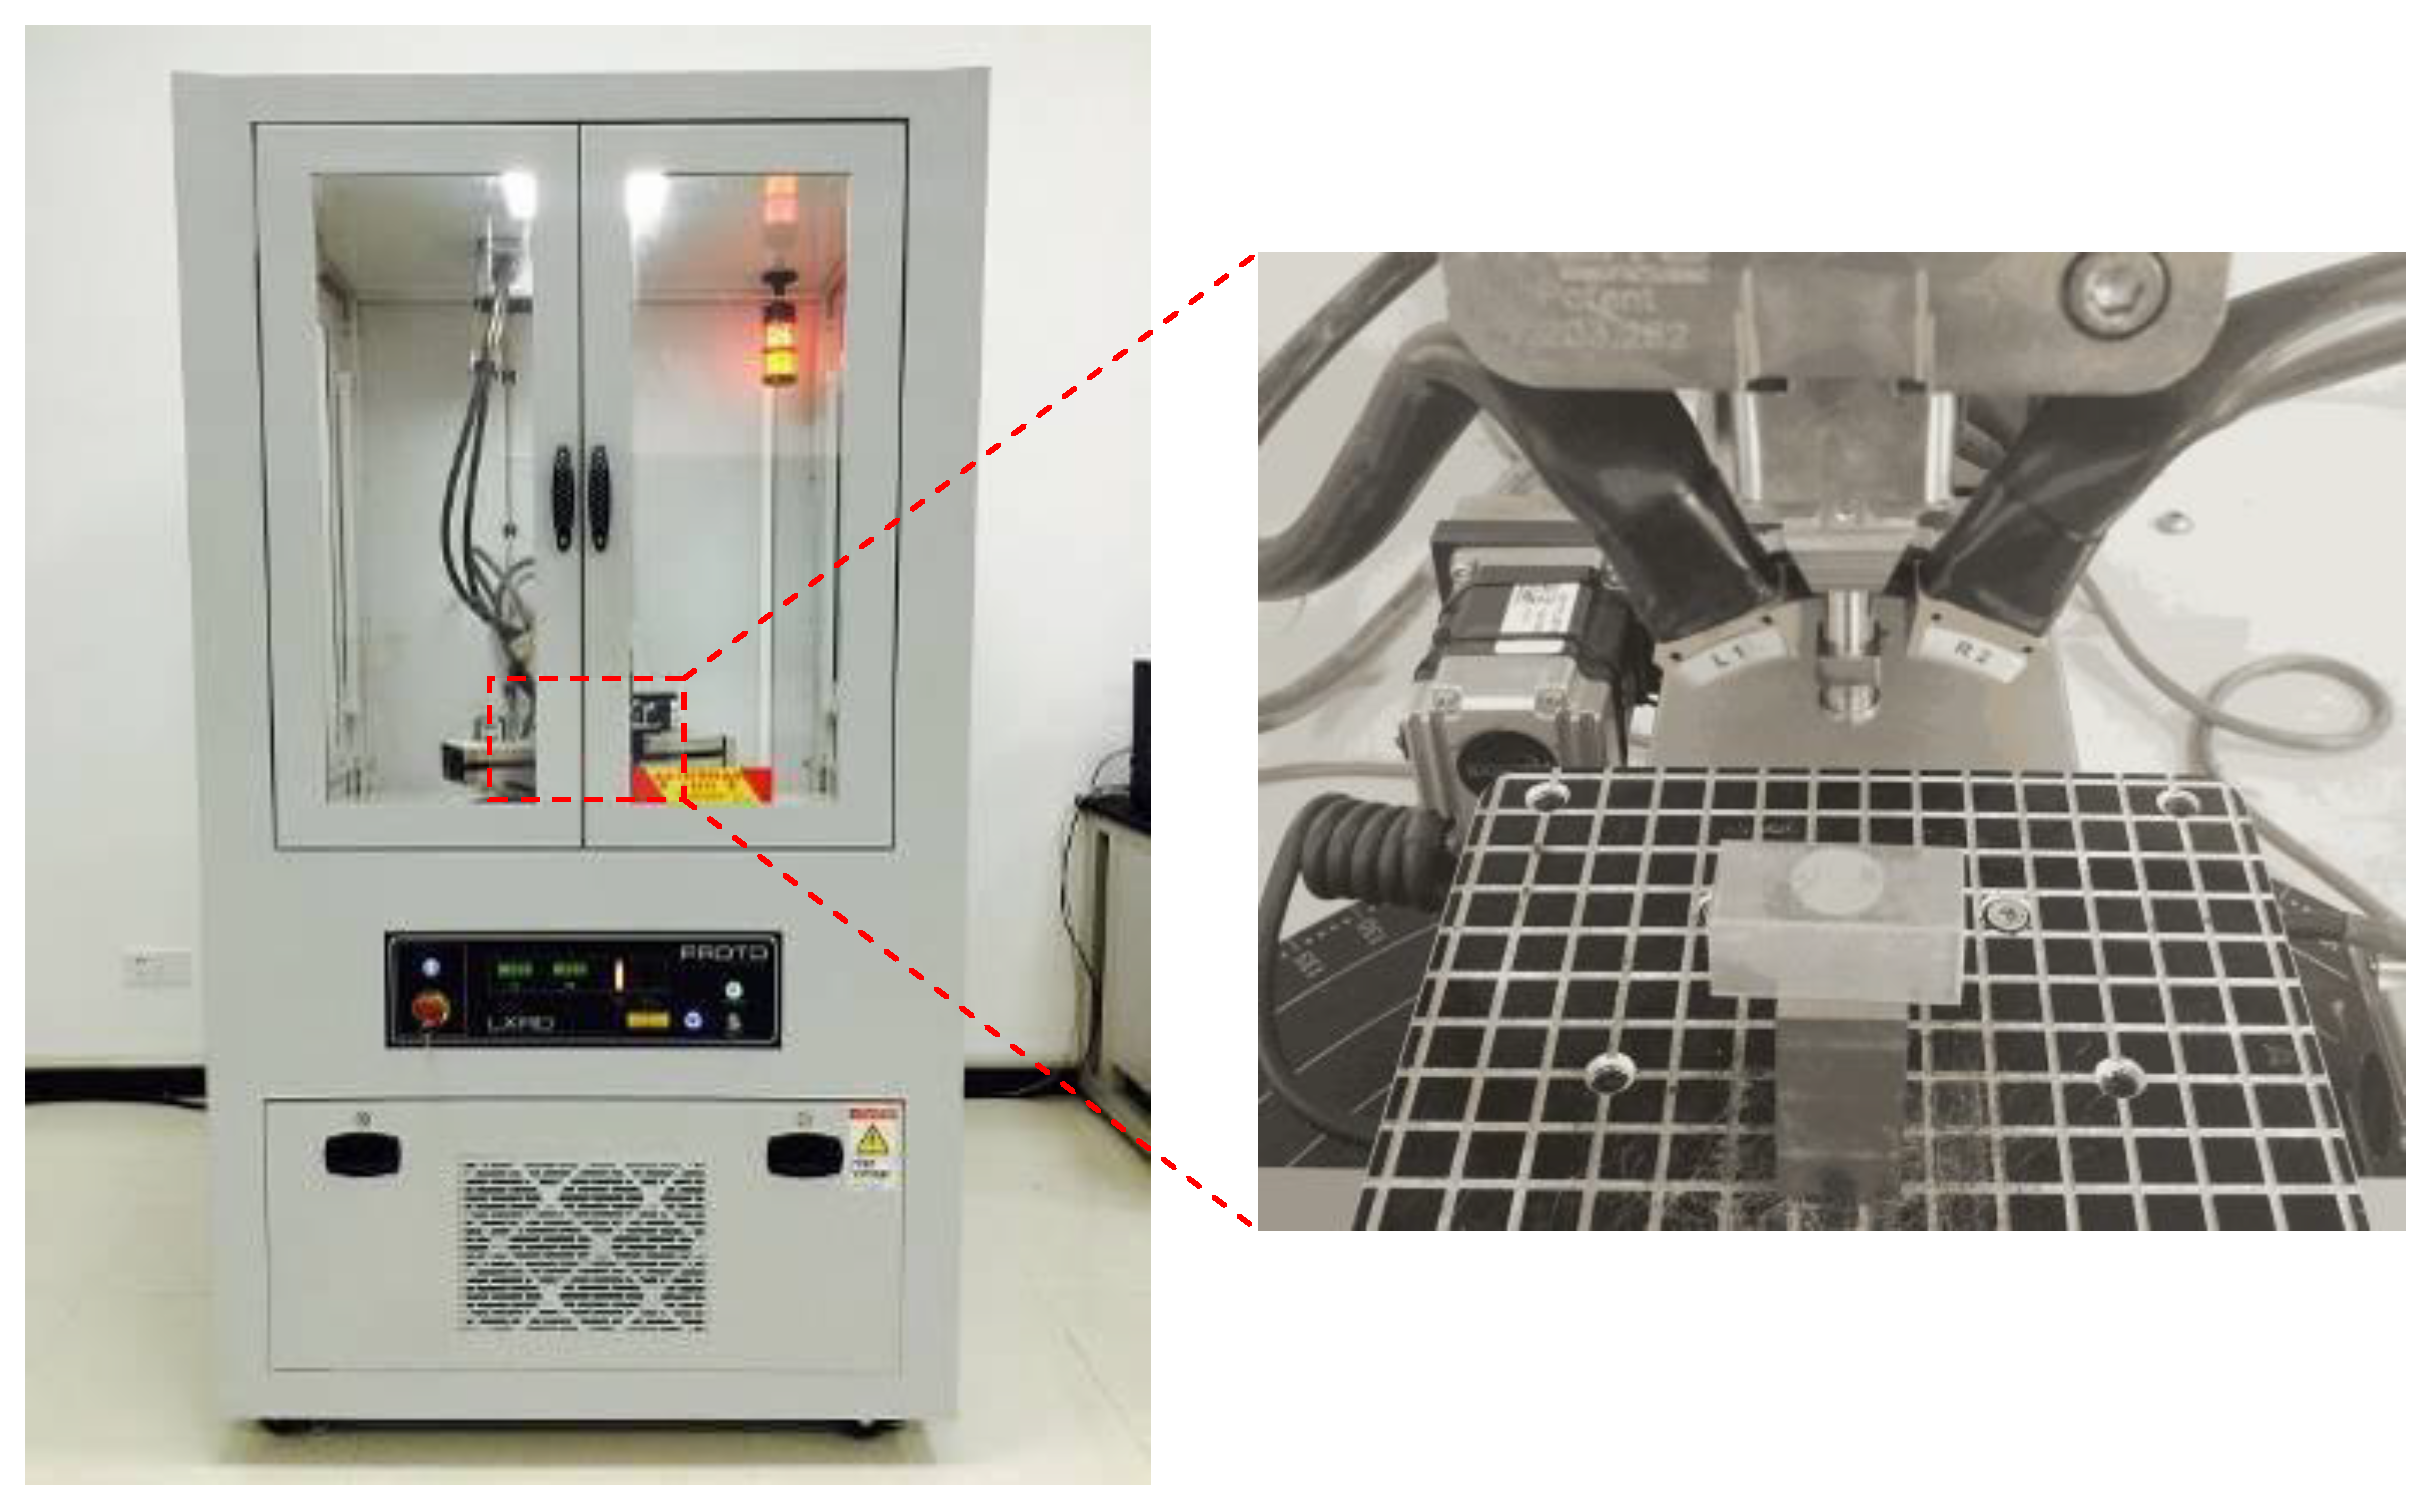
3.2. Experimental Procedure

Al6061-T6 alloy was selected as the target material, and the stress–strain curve of Al6061-T6 alloy was obtained by a tensile test, as shown in Figure 7. Its chemical composition and mechanical properties are shown in Table 2 and Table 3, respectively. The selected specimen was 40 mm in length, 18 mm in width, and 18 mm in height. In order to better observe the peened specimens, the specimens were polished one by one with 600/800/1000/1200 grit paper and ultrasonically cleaned with absolute ethanol to eliminate the machining trace on the target surface.
The WJP experiments were carried out on the apparatus (DWJ1525-FC) (Figure 8); the nozzle diameter dn was 0.3 mm, the distance from the nozzle to the target surface (i.e., standoff distance) was 3 mm, and the number of jet passes n was 5. The water jet peening impacted vertically on the target surface.
By adjusting the pump pressure, the jet pressure was controlled and its influence on the RS of the target was investigated. The detailed parameters of the WJP experiment are shown in Table 4. In practical engineering applications, through multiple-pass WJP, the entire region is peened, as shown in Figure 9.
After the WJP experiment, the RS of the peened region was measured by using the X-ray diffraction (XRD) stress analysis apparatus (PROTO-LXRD) manufactured in Canada (Figure 10), which employs Cr-Kα radiation. An X-ray beam with a diameter of 2 mm, wavelength of 2.2910 Å, and gain voltage of 20 kV was used in the measurements. Meanwhile, a beta angle of 5° and a Bragg angle of 139° were set to control the concussion range, whereas the diffraction phase of the {311} plane was used in the stress calculation [25]. The RS was measured using the conventional sin2Ψ method, whereby each point on the surface was scanned for tilt angles of ψ = ± 27°. To obtain the distribution of RS along the depth direction, electrolytic polishing was used to remove the peened region of the target surface layer by layer, depth was measured once for each layer of material removed, and RS was measured again. Three points were measured in each measurement region after the removal of a layer, and then the average value was taken as the RS of this depth. In addition, saturated brine was selected as the electrolyte during electrolytic stripping. The stripped region was a circular region with a diameter of 15 mm, and each stripping depth was 20 μm. Meanwhile, the voltage of the electrolytic polishing apparatus was set to 10 V, and the electrolytic time was set to 10 s.

4. Results and Discussion

According to the optimal process parameters of WJP (P = 60 MPa, DC = 0.15 mm, n = 5, and vf = 4000 mm/min) determined in the authors’ previous work [6] and other studies [4,26], a comparison among the distribution of RS along the depth direction obtained by the mathematical model, simulation model, and experiment was conducted to verify the validity of the mathematical model. In addition, as it is mainly influenced by jet pressure, the maximum compressive RS was investigated under different jet pressures based on the mathematical model. Meanwhile, the depth of the compressive RS layer was investigated under different jet diameters based on the mathematical model because it is mainly influenced by jet diameter [6].

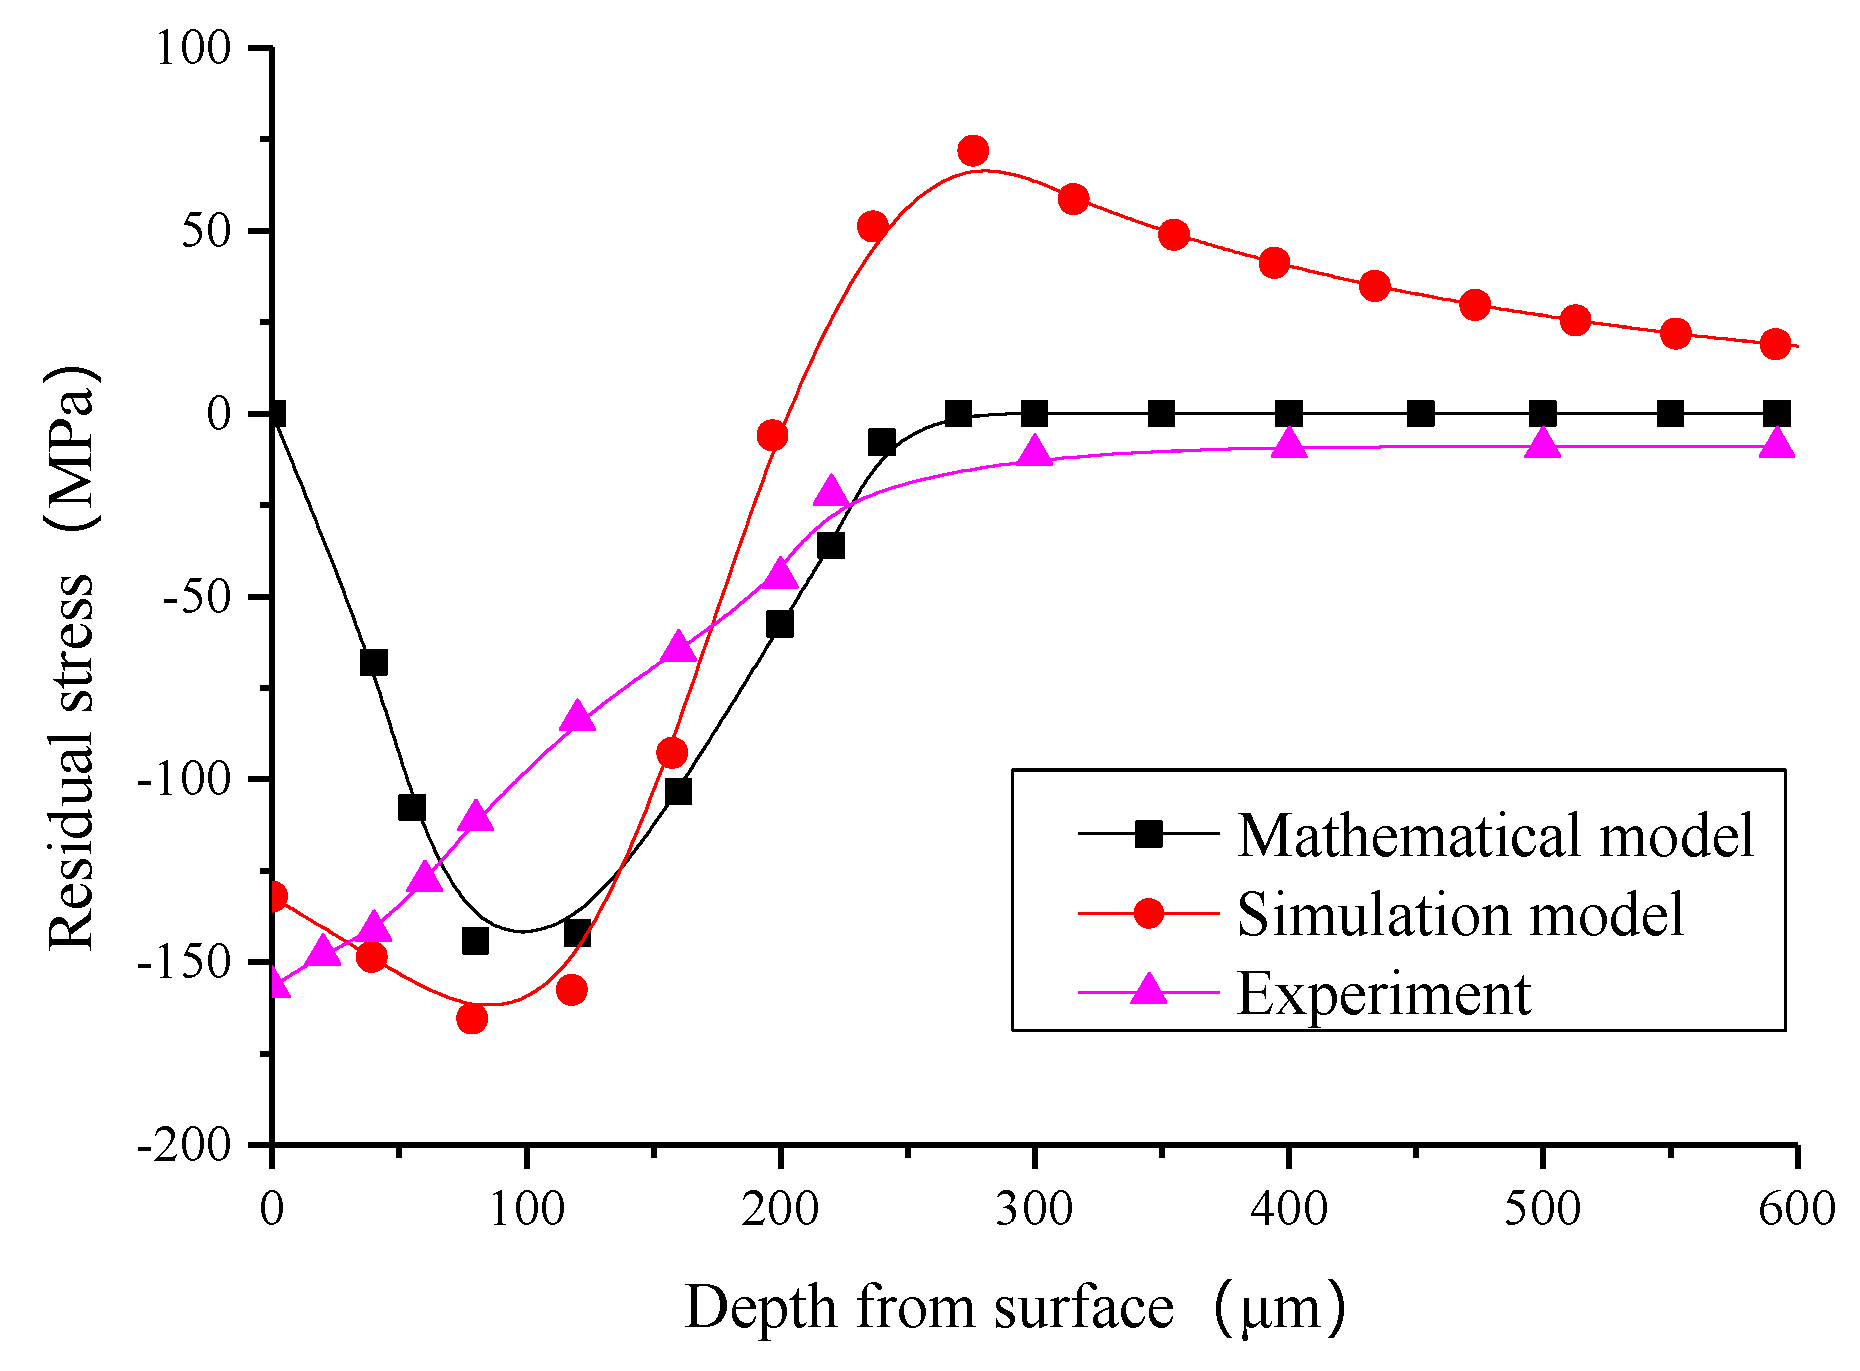
4.1. Comparison of Distribution of RS

Figure 11 shows the distribution of the RS field after WJP obtained by the simulation model, where the red frame is the peened region, (i.e., the region between the center of the first and last pass). It can be seen that a continuous and uniform compressive RS field was formed in the peened region, where the compressive RS gradually decreased until it transformed into tensile RS along the depth direction of the target. The RS layer was eventually formed, composed of upper compressive RS and lower tensile RS.
Figure 12 shows the distribution curve of the RS obtained by the mathematical model, simulation model, and experiment when DC = 0.15 mm, vf = 4000 mm/min, and P = 60 MPa. The RS on each mesh layer obtained by the simulation model was averaged as the RS value for this depth. It can be seen that the distribution of RS along the depth direction obtained by the mathematical model was almost consistent with that obtained by the simulation model and experiment. The mathematical results were especially consistent with the simulation results, whereby the compressive RS increased along the depth direction in both cases, and reached the maximum at depths of 80 μm and 79 μm (i.e., −144.3 MP and −168.9 MPa), respectively. After reaching the maximum compressive RS, the compressive RS began decreasing until it disappeared, and the depths of the compressive RS layers were 248 μm and 200 μm, respectively. Overall, the values were almost consistent. The mathematical results were more consistent with the experimental results in terms of maximum compressive RS and depth of the compressive RS layer, with maximum compressive RS of −144.3 MPa and −157.7 MPa, respectively. Meanwhile, the depths of the compressive RS layers were 248 μm and 220 μm, respectively. Overall, the values were almost consistent.
In addition, within the depth of 20 μm, the experimental results were slightly larger than the mathematical results and the simulation results. This is because the as-machined specimen induced a certain compressive RS within the depth of 20 μm in the previous machining process. However, the experimental results were smaller at depths of more than 20 μm; because of the weak divergence of the water jet in the air, the actual water-hammer pressure acting on the target surface was smaller than the mathematical results, leading to a smaller RS.
In summary, the distribution of RS obtained by the mathematical model was almost consistent with that obtained by the simulation model and experiment, which verifies the validity of the mathematical model.

4.2. Maximum Compressive RS under Different Jet Pressures

Figure 13 shows the maximum compressive RS obtained by the mathematical model, simulation model, and experiment under different jet pressures when DC = 0.15 mm, vf = 4000 mm/min, and d = 0.3 mm. It can be seen that RS was induced only when the jet pressure was beyond a certain critical value. Because plastic deformation occurs only when the von Mises stress caused by the water-hammer pressure is beyond the yield strength of the target material, RS is induced only when the jet pressure is beyond a certain critical value. The critical jet pressures obtained by the mathematical model and simulation model were 22 MPa and 20 MPa, respectively; the values were almost consistent. Moreover, the maximum compressive RS obtained by the mathematical model, simulation model, and experiment increased with the increase in jet pressure in all cases. This is because the water-hammer pressure increased with the increase in jet pressure, leading to the increase in plastic deformation in the peened region. Thus, as large a jet pressure as possible should be selected to obtain larger RS. Although the maximum compressive RS obtained using different methods had certain errors, the experimental results were between the mathematical results and the simulation results. For example, under jet pressure P = 60 MPa, the maximum values of compressive RS obtained by the mathematical model, simulation model, and experiment were −144.3 MPa, −168.9 MPa, and −157.7 MPa, respectively. In summary, the maximum compressive RS obtained by the mathematical model, simulation model, and experiment was almost consistent, which further verifies the validity of the mathematical model.

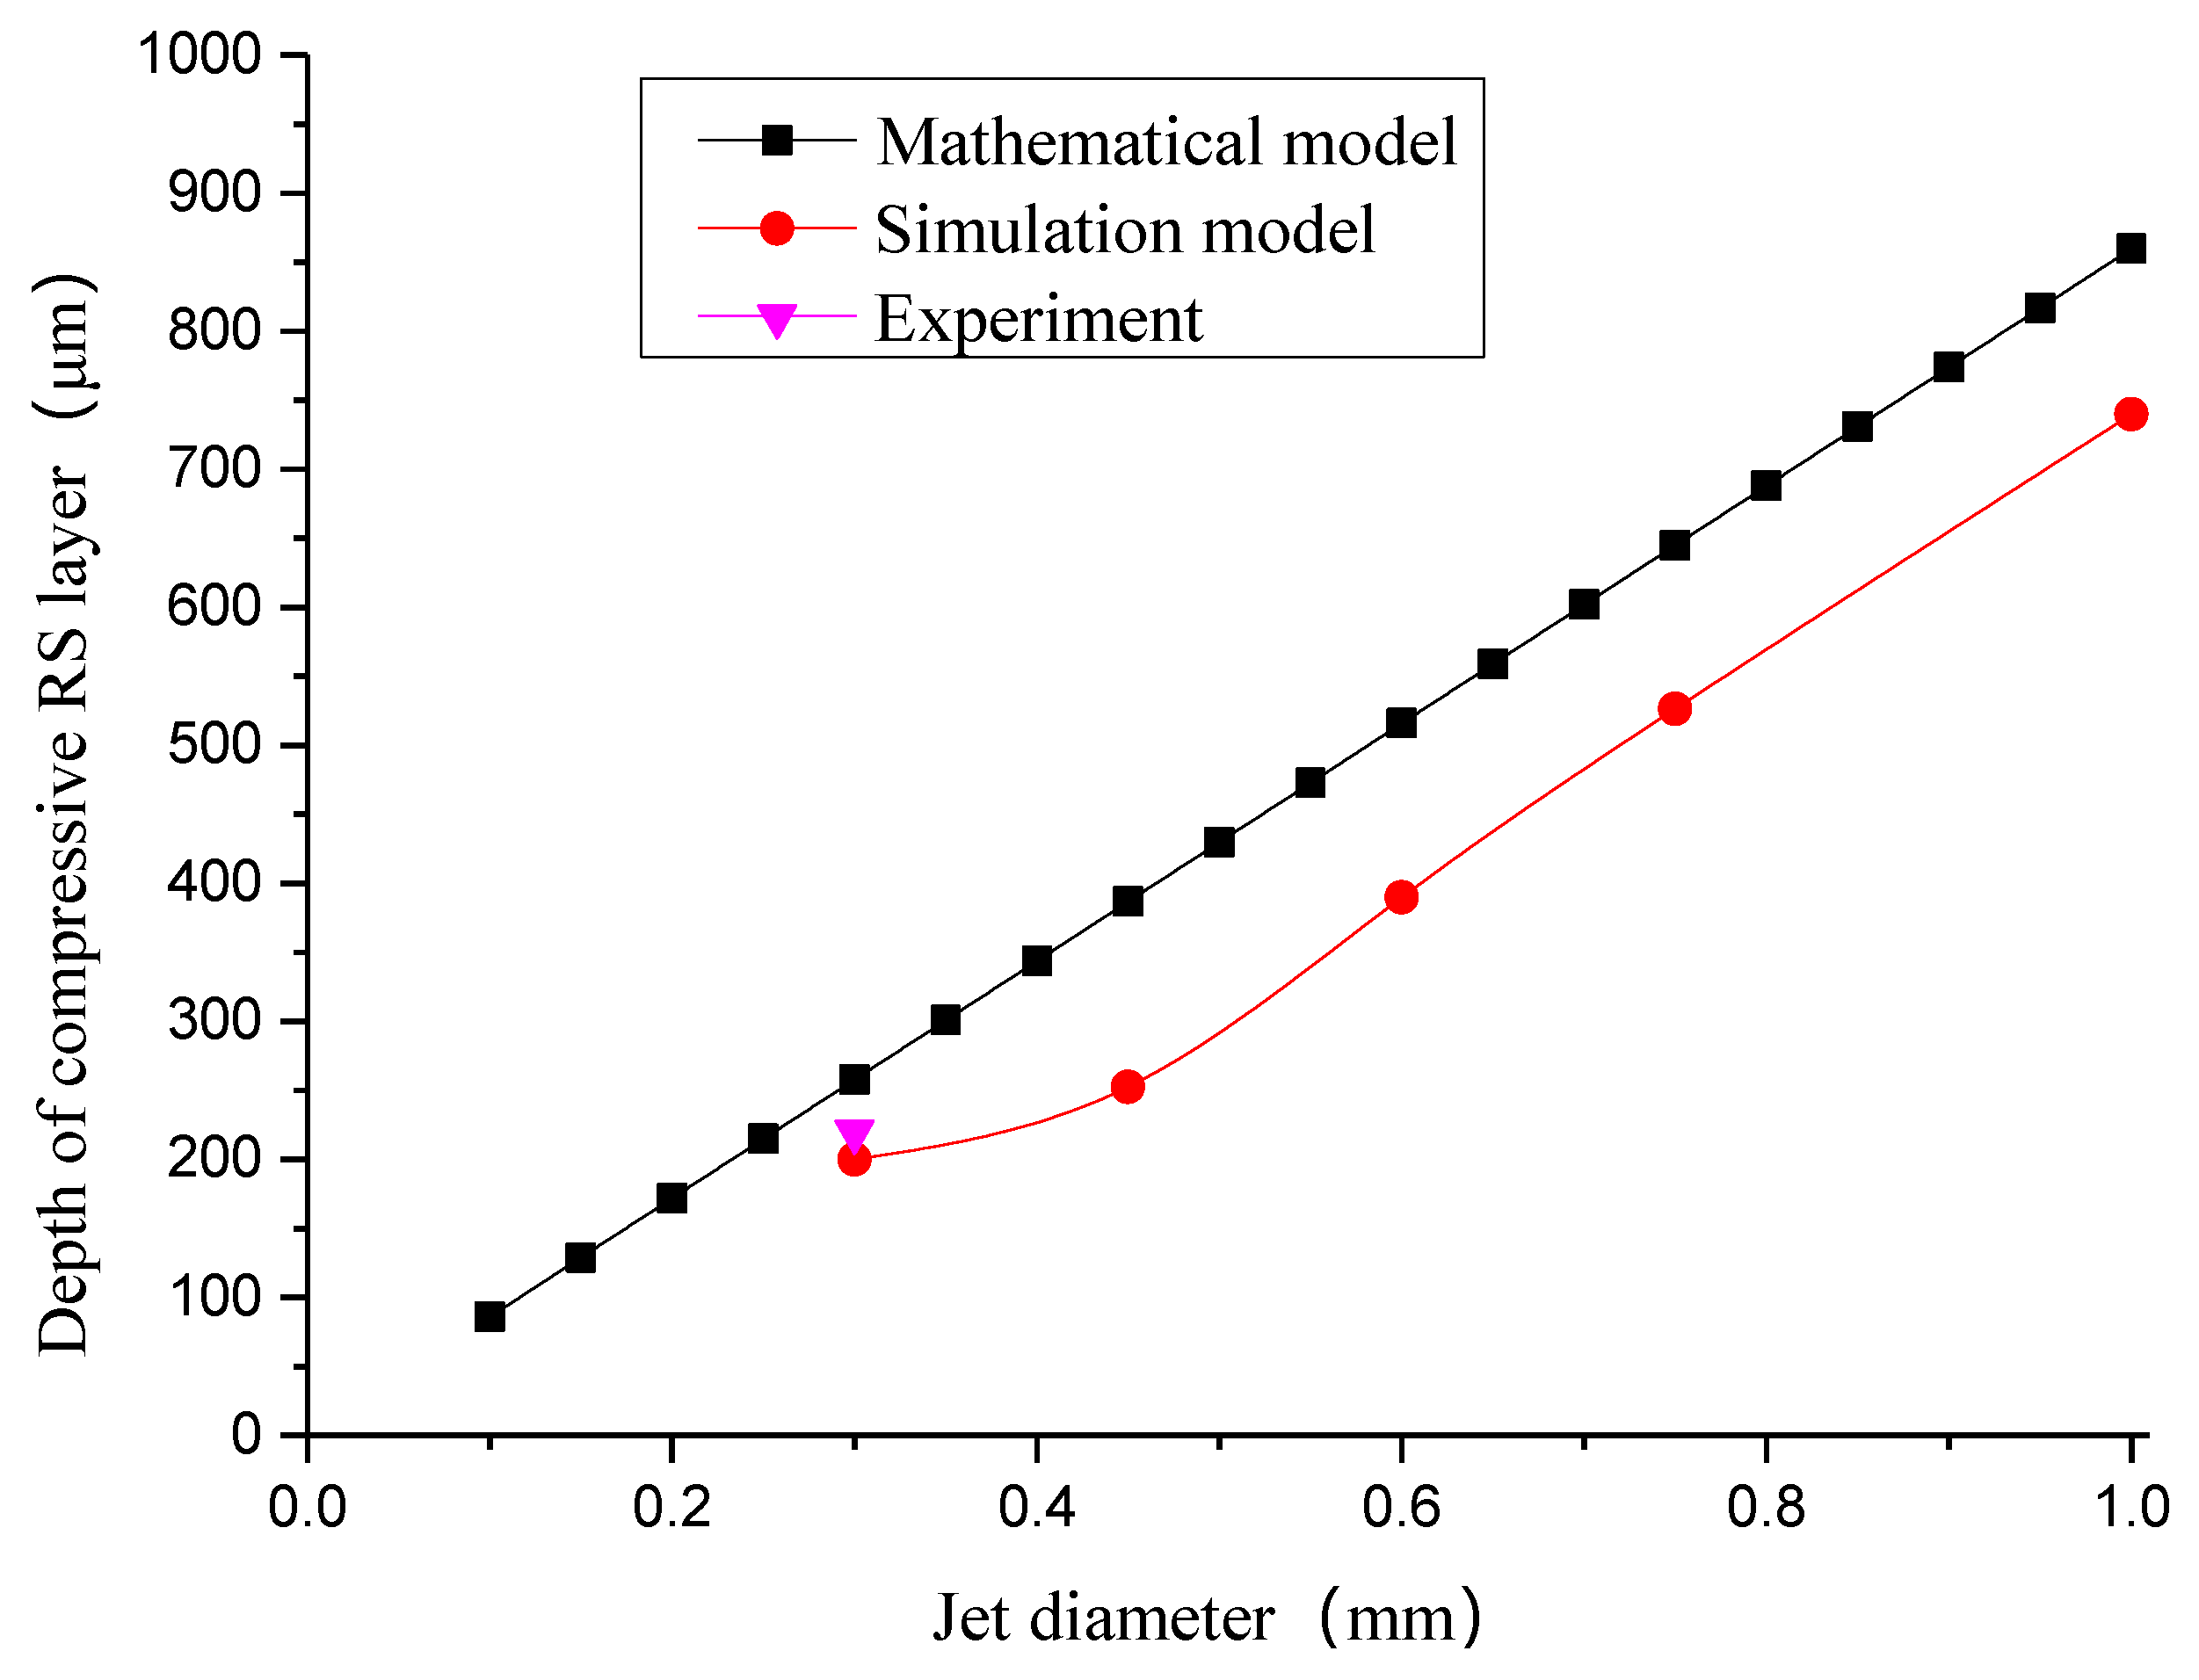
4.3. Depth of Compressive RS Layer under Different Jet Diameters

Figure 14 shows the depth of the compressive RS layer obtained by the mathematical model, simulation model, and experiment under different jet diameters when DC = 0.15 mm, vf = 4000 mm/min, and P = 60 MPa. It can be seen that the depth of the compressive RS layer obtained by the mathematical model and simulation model both approximately linearly increased with the increase in jet diameter, whereby the increasing slope and the specific value were almost consistent. This is because, when the jet pressure is constant, the jet action area increases with the increase in jet diameter; thus, the area of the impact region also increases, leading to an increase in plastic deformation in the peened region. Therefore, as large a jet diameter as possible should be selected to obtain a larger depth of the compressive RS layer. In addition, when d = 0.3 mm, the depth of the compressive RS layer obtained by the experiment (i.e., 220 μm) was between that obtained by the mathematical model (i.e., 248 μm) and the simulation model (i.e., 200 μm), and the values were almost consistent, which further verifies the validity of the mathematical model.

5. Conclusions

In this paper, a mathematical model was proposed for calculating the RS induced by WJP. To validate the proposed mathematical model, experimental and finite element simulation verifications were carried out on Al6061-T6. The error of maximum compressive RS between the mathematical model and experiment was within 9% under a jet pressure of 60 MPa, and the error of depth of the compressive RS layer between the mathematical model and experiment was within 13% under a jet diameter of 0.3 mm. Hence, the mathematical model is reliable and accurate. The distribution of RS along the depth direction, the maximum compressive RS, and the depth of the compressive RS layer were also investigated based on the mathematical model. The maximum compressive RS increased with the increase in jet pressure, and the depth of the compressive RS layer approximately linearly increased with the increase in jet diameter.

Author Contributions

Conceptualization, Z.H.; investigation, Z.H., C.L., and S.Z.; writing–original draft preparation, Z.H., C.L., and S.Z.; writing–review and editing, Z.H., C.L., and S.Z.; supervision, B.C., H.Y., and L.C.; funding acquisition, Z.H., D.L., and T.F.

Funding

This research was funded by the National Natural Science Foundation of China (grant number U1804254), the Key Project of Higher Education of Henan Province (grant number 15A460029), and the Open Fund of Hubei Key Laboratory of Mechanical Transmission and Manufacturing Engineering in Wuhan University of Science and Technology (grant number 2017A02).

Conflicts of Interest

The authors declare no conflict of interest.

References

  1. Salko, D. Peening by Water. In Proceedings of the Second International Conference on Shot Peening (ICSP), Chicago, IL, USA, 14–17 May 1984; pp. 37–38. [Google Scholar]
  2. Epp, J.; Zoch, H.W. Comparison of alternative peening methods for the improvement of fatigue properties of case-hardened steel parts. HTM J. Heat Treat. Mater. 2016, 71, 109–116. [Google Scholar] [CrossRef]
  3. Azhari, A.; Schindler, C.; Godard, C.; Gibmeier, J.; Kerscher, E. Effect of multiple passes treatment in waterjet peening on fatigue performance. Appl. Surf. Sci. 2016, 388, 468–474. [Google Scholar] [CrossRef]
  4. Lieblich, M.; Barriuso, S.; Ibáñez, J.; Rui-de-Lara, L.; Diaz, M.; Ocaña, J.L.; Alberdi, A.; González-Carrasco, J.L. On the fatigue behavior of medical Ti6Al4V roughened by grit blasting and abrasiveless waterjet peening. J. Mech. Behav. Biomed. Mater. 2016, 63, 390–398. [Google Scholar] [CrossRef] [PubMed]
  5. Arola, D.; McCain, M.L.; Kunaporn, S.; Ramulu, M. Waterjet and abrasive waterjet surface treatment of titanium: a comparison of surface texture and residual stress. Wear 2001, 249, 943–950. [Google Scholar] [CrossRef]
  6. He, Z.S.; Zhao, S.S.; Fu, T.; Chen, L.; Zhang, Y.X.; Zhang, M.; Wang, P.Z. Experimental and numerical analysis of water jet peening on 6061 aluminum alloy. J. Pressure Vessel Technol. 2018, 140, 021406. [Google Scholar] [CrossRef]
  7. Ijiri, M.; Yoshimura, T. Sustainability of compressive residual stress on the processing time of water jet peening using ultrasonic power. Heliyon 2018, 4, e00747. [Google Scholar] [CrossRef] [PubMed] [Green Version]
  8. Srivastava, M.; Hloch, S.; Tripathi, R.; Kozak, D.; Chattopadhyaya, S.; Dixit, A.R.; Foldyna, J.; Hvizdos, P.; Fides, M.; Adamcik, P. Ultrasonically generated pulsed water jet peening of austenitic stainless-steel surfaces. J. Manuf. Processes 2018, 32, 455–468. [Google Scholar] [CrossRef]
  9. Kunaporn, S.; Ramulu, M.; Jenkins, M.G.; Hashish, M. Residual stress induced by waterjet peening: a finite element analysis. J. Pressure Vessel Technol. 2004, 126, 333–340. [Google Scholar] [CrossRef]
  10. Kunaporn, S.; Ramulu, M.; Hashish, M. Mathematical modeling of ultra-high-pressure waterjet peening. J. Eng. Mater. Technol. 2005, 127, 186–191. [Google Scholar] [CrossRef]
  11. Rajesh, N.; Veeraraghavan, S.; Babu, N.R. A novel approach for modeling of water jet peening. Int. J. Mach. Tools Manuf. 2004, 44, 855–863. [Google Scholar] [CrossRef]
  12. Rajesh, N.; Babu, N.R. Multidroplet impact model for prediction of residual stresses in water jet peening of materials. Mater. Manuf. Processes 2006, 21, 399–409. [Google Scholar] [CrossRef]
  13. Dong, X.; Zhang, H.L.; Duan, X. Finite element simulation model of residual stress field with water jet peening strengthening. J. Mech. Eng. 2010, 46, 189–194. [Google Scholar] [CrossRef]
  14. Hsu, C.Y.; Liang, C.C.; Teng, T.L.; Nguyen, A.T. A numerical study on high-speed water jet impact. Ocean Eng. 2013, 72, 98–106. [Google Scholar] [CrossRef]
  15. Obara, T.; Bourne, N.K.; Field, J.E. Liquid-jet impact on liquid and solid surfaces. Wear 1995, 186–187, 388–394. [Google Scholar] [CrossRef]
  16. Cho, J.R. Simulation model of the repeated waterdrop impact onto the AL6061-T6. J. Mech. Sci. Technol. 2015, 29, 3679–3683. [Google Scholar] [CrossRef]
  17. Kunaporn, S. An experimental and numerical analysis of waterjet peening of 7075-T6 Aluminum Alloy. Ph.D. Thesis, University of Washington, Seattle, WA, USA, 22 August 2002. [Google Scholar]
  18. Field, J.E. ELSI conference: invited lecture: Liquid impact: theory, experiment, applications. Wear 1999, 233–235, 1–12. [Google Scholar] [CrossRef]
  19. Muruganandhan, R.; Mugilvalavan, M.; Thirumavalavan, K.; Yuvaraj, N. Investigation of water jet peening process parameters on AL6061-T6. Surf. Eng. 2018, 34, 330–340. [Google Scholar] [CrossRef]
  20. Li, J.K.; Yao, M.; Wang, D.; Wang, R.Z. Mechanical approach to the residual stress field induced by shot peening. Mater. Sci. Eng. A 1991, 147, 167–173. [Google Scholar] [CrossRef]
  21. Miao, H.Y.; Larose, S.; Perron, C.; Lévesque, M. An analytical approach to relate shot peening parameters to Almen intensity. Surf. Coat. Technol. 2010, 205, 2055–2066. [Google Scholar] [CrossRef]
  22. Han, Y.Q.; Xie, Y.H.; Zhang, D. Numerical study on high-speed impact between a water droplet and a deformable solid surface. In Proceedings of the ASME Turbo Expo 2012, Copenhagen, Denmark, 11–15 June 2012. GT2012-69700. [Google Scholar]
  23. Zhang, M.; He, Z.S.; Zhang, Y.X.; Wang, X.D.; Zhao, S.S.; Fu, T.; Chen, L. Theoretical and finite element analysis of residual stress field for different geometrical features after abrasive waterjet peening. J. Pressure Vessel Technol. 2019, 141, 011401-4. [Google Scholar] [CrossRef]
  24. Zhang, M.; Liu, Z.H.; Deng, J.; Yang, M.J.; Dai, Q.L.; Zhang, T.Z. Optimum design of compressive residual stress field caused by ultrasonic surface rolling with a mathematical model. Appl. Math. Modell. 2019, 76, 800–831. [Google Scholar] [CrossRef]
  25. Liu, X.L.; Xie, P.; Wimpory, R.; Li, W.Y.; Lai, R.L.; Li, M.J.; Chen, D.F.; Liu, Y.T.; Zhao, H.Y. Residual stress, microstructure and mechanical properties in thick 6005A-T6 Aluminium alloy friction stir welds. Metals 2019, 9, 803. [Google Scholar] [CrossRef]
  26. Salimianrizi, A.; Foroozmehr, E.; Badrossamay, M.; Farrokhpour, H. Effect of laser shock peening on surface properties and residual stress of Al6061-T6. Opt. Lasers Eng. 2016, 77, 112–117. [Google Scholar] [CrossRef]
Figure 1. Schematic diagram of the impact morphology of a water jet in the air.
Metals 09 00936 g001
Figure 2. Phase change of impact pressure.
Metals 09 00936 g002
Figure 3. Schematic diagram of the load distribution of impact pressure.
Metals 09 00936 g003
Figure 4. Schematic diagram of the elastic–plastic model of AL6061-T6 alloy with isotropic hardening.
Metals 09 00936 g004
Figure 5. Simulation model of multiple-pass water jet peening (WJP).
Metals 09 00936 g005
Figure 6. Impact pressure loading diagram.
Metals 09 00936 g006
Figure 7. Stress–strain curve of Al6061-T6 alloy and a simplified bilinear elastic–plastic hardening model.
Metals 09 00936 g007
Figure 8. Experimental apparatus for WJP.
Metals 09 00936 g008
Figure 9. A specimen after WJP.
Metals 09 00936 g009
Figure 10. X-ray diffraction (XRD) stress analysis apparatus.
Metals 09 00936 g010
Figure 11. Distribution contour of the residual stress (RS) field along the depth direction after WJP (P = 60 MPa, DC = 0.15 mm, n = 5, and vf = 4000 mm/min).
Metals 09 00936 g011
Figure 12. Distribution curve of RS along the depth direction.
Metals 09 00936 g012
Figure 13. Maximum compressive RS under different jet pressures.
Metals 09 00936 g013
Figure 14. The depth of the compressive RS layer under different jet diameters.
Metals 09 00936 g014
Table 1. Parameters of simulation model.
Jet Diameter d
(mm)
Water-Hammer Pressure PC
(MPa)
Jet Traverse Velocity vf
(mm/min)
0.3/0.45/0.6/0.75/1403/450/515/622/676/755/859/9204000 [6]
Table 2. Chemical composition of Al6061-T6 alloy.
MaterialSiFeCuMnMgCrZnTiAl
Al6061-T60.4–0.80.70.15–0.40.150.8–0.120.004–0.30.250.15Allowance
Table 3. Mechanical properties of Al6061-T6 alloy, data from [23].
MaterialAl6061-T6 Alloy
Destiny ρ s (kg/m3)2900
Elastic Modulus E (GPa)69
Poisson’s ratio μ0.33
Yield stress σ s (MPa)265
Yield strain ε s 0.38%
Ultimate tensile stress σ b (MPa)345
Plastic strain ε b corresponding to σ b 0.2
Hardening parameter H 1 283
Table 4. Experiment process parameters of water jet peening (WJP).
Jet Pressure P (m/s)Jet Center Distance DC (mm)Jet Traverse Velocity vf (mm/min)Jet Passes nNozzle Diameter dn (mm)Standoff Distance (mm)
33/44/50/600.15400050.33

