Pitting Corrosion Resistance and Repassivation Behavior of C-Bearing Duplex Stainless Steel


 , ,
, , 
Abstract
:1. Introduction
2. Materials and Methods
3. Results
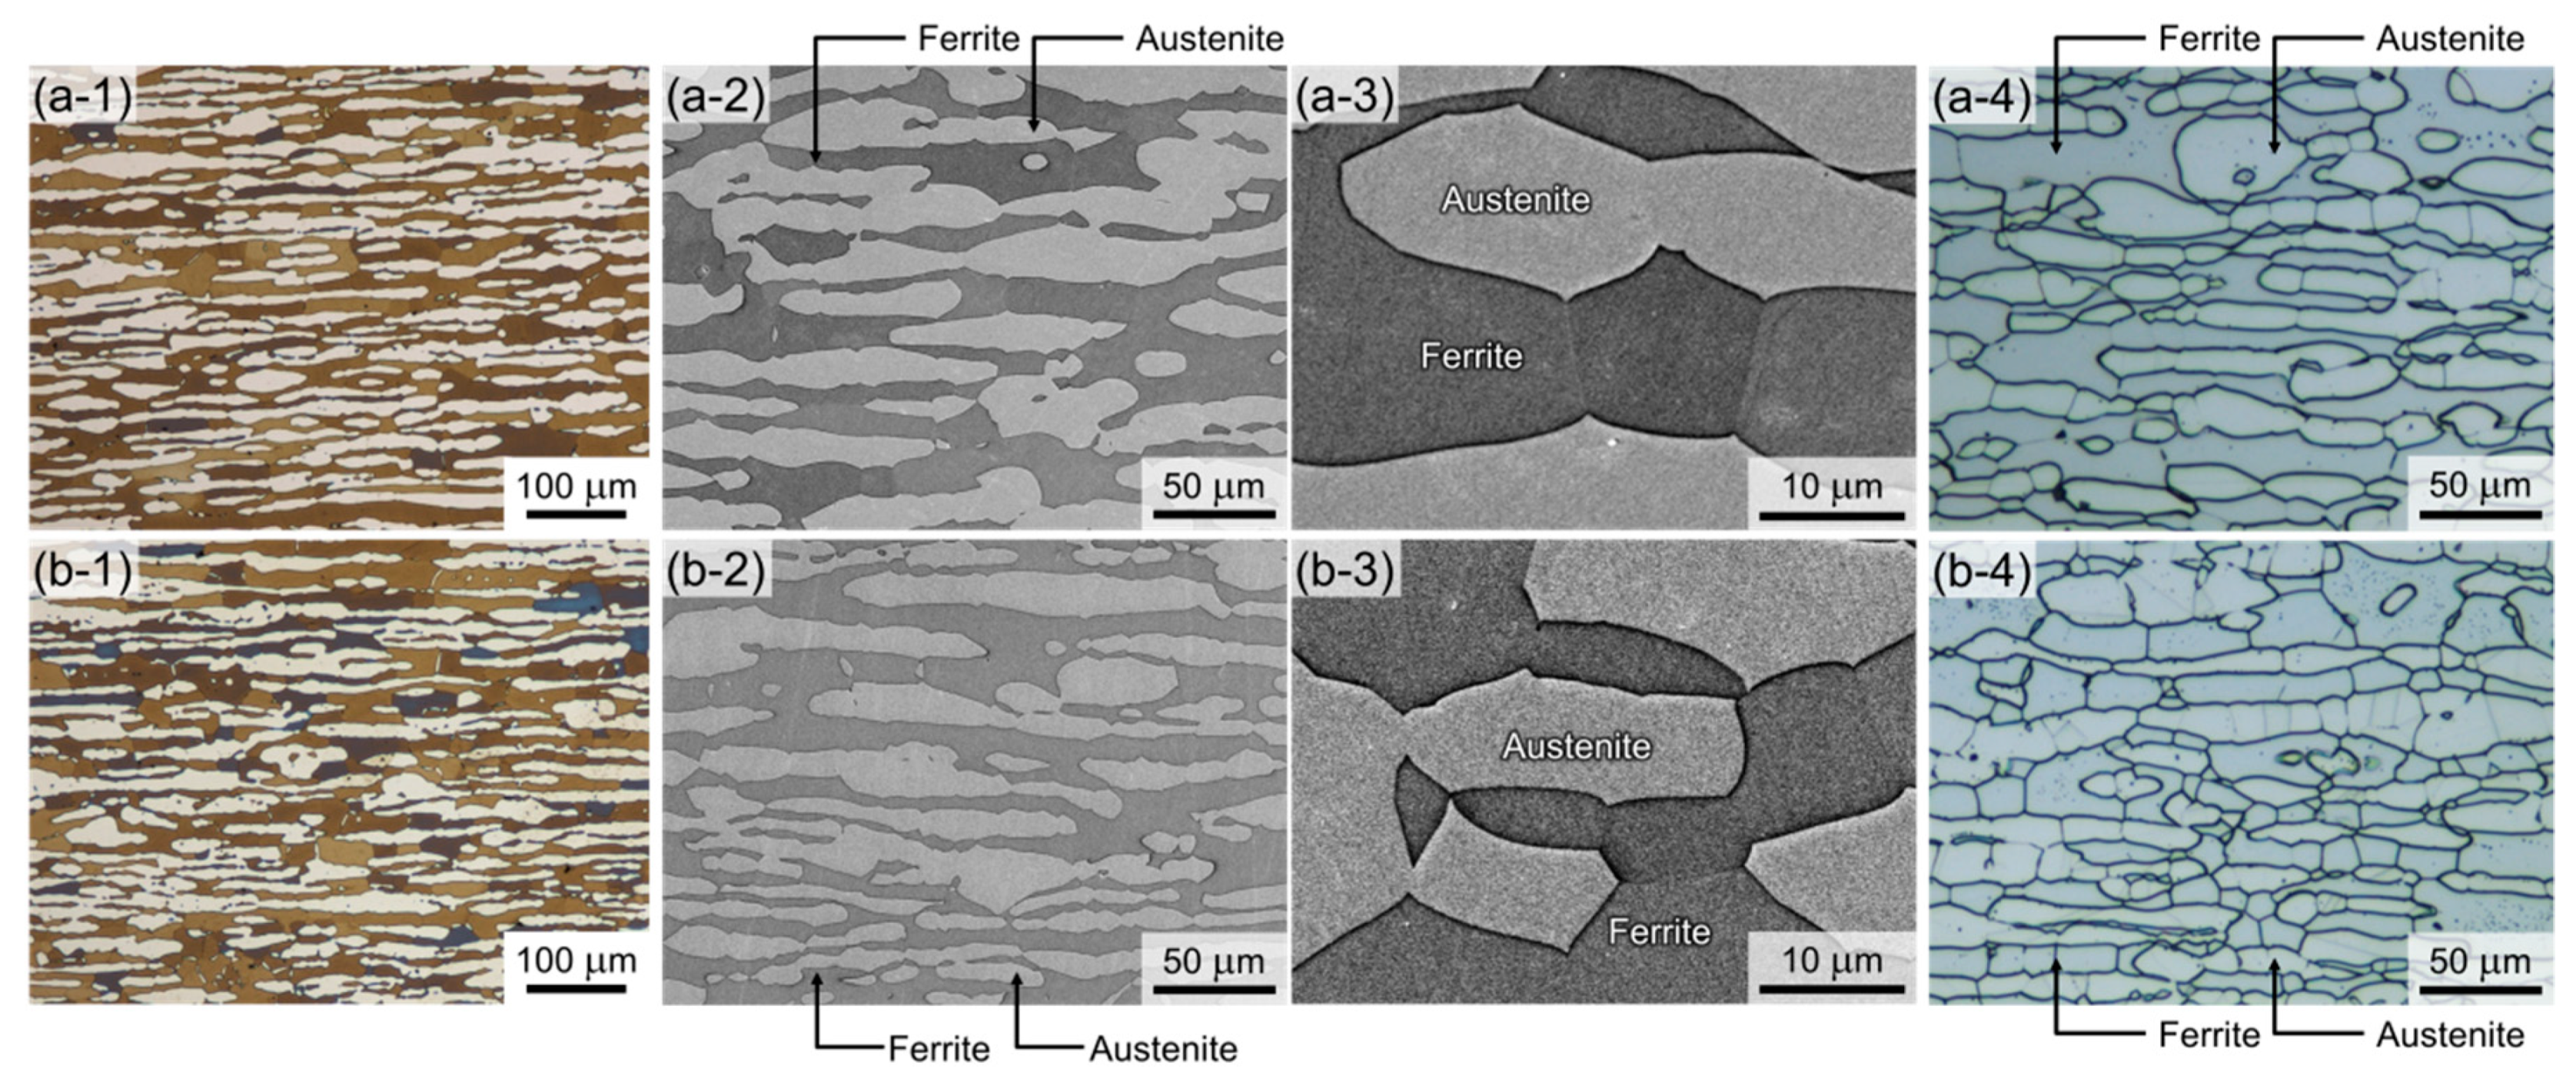
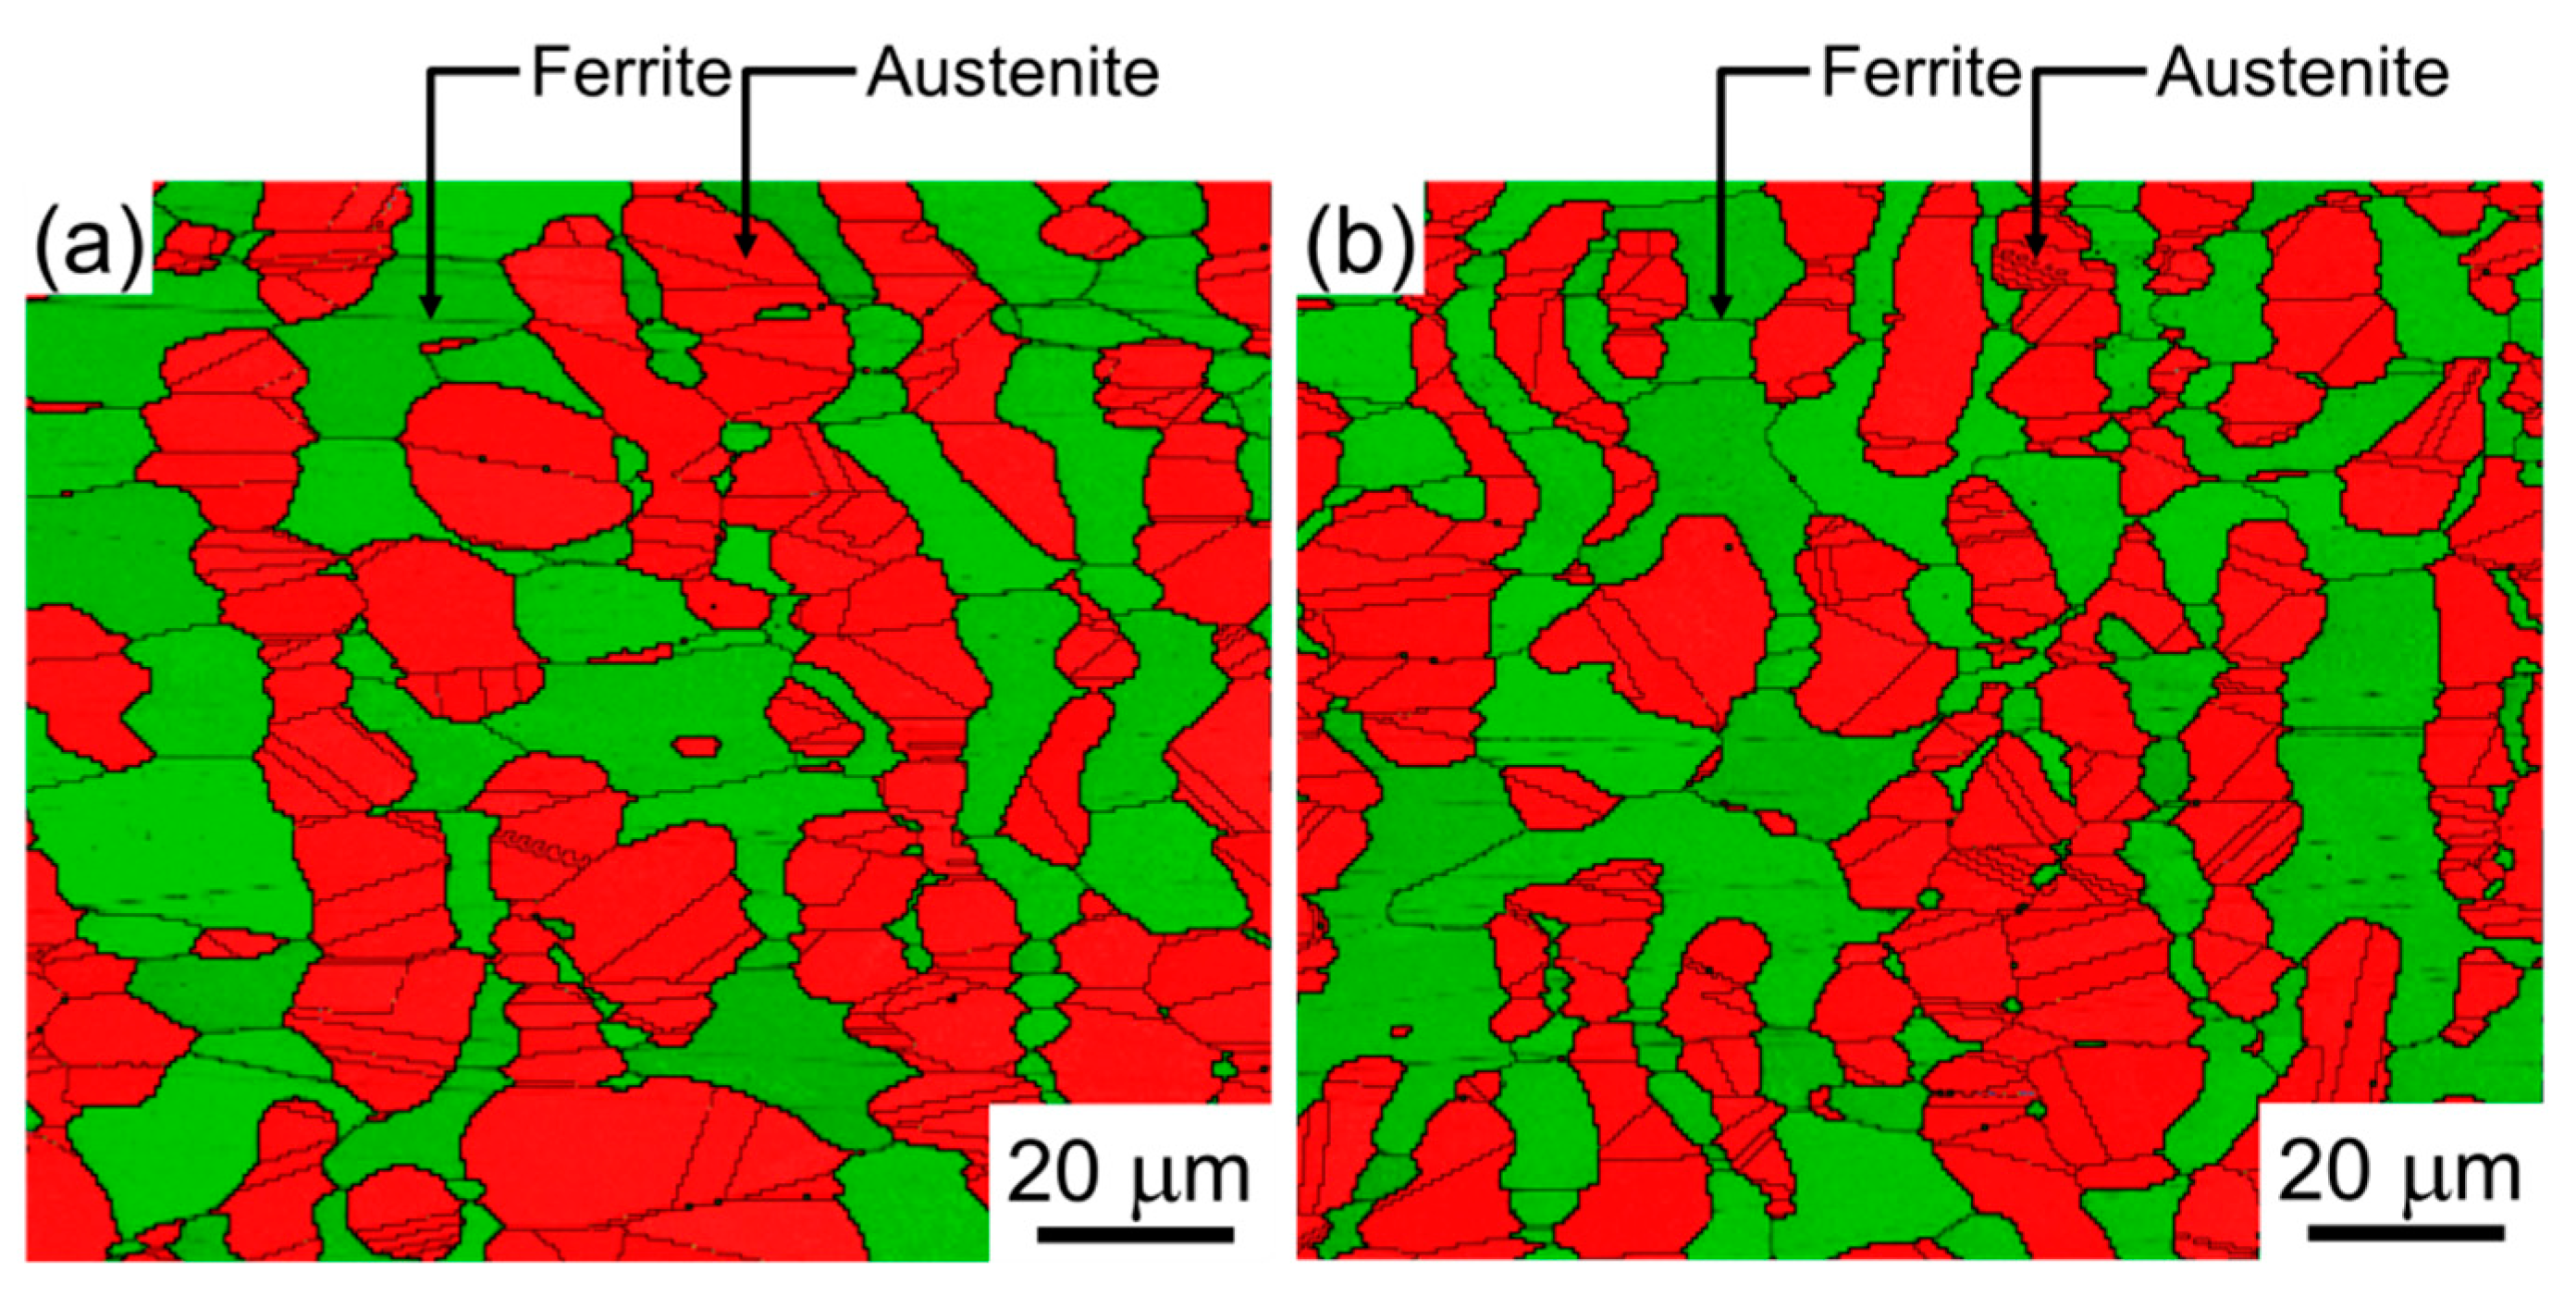
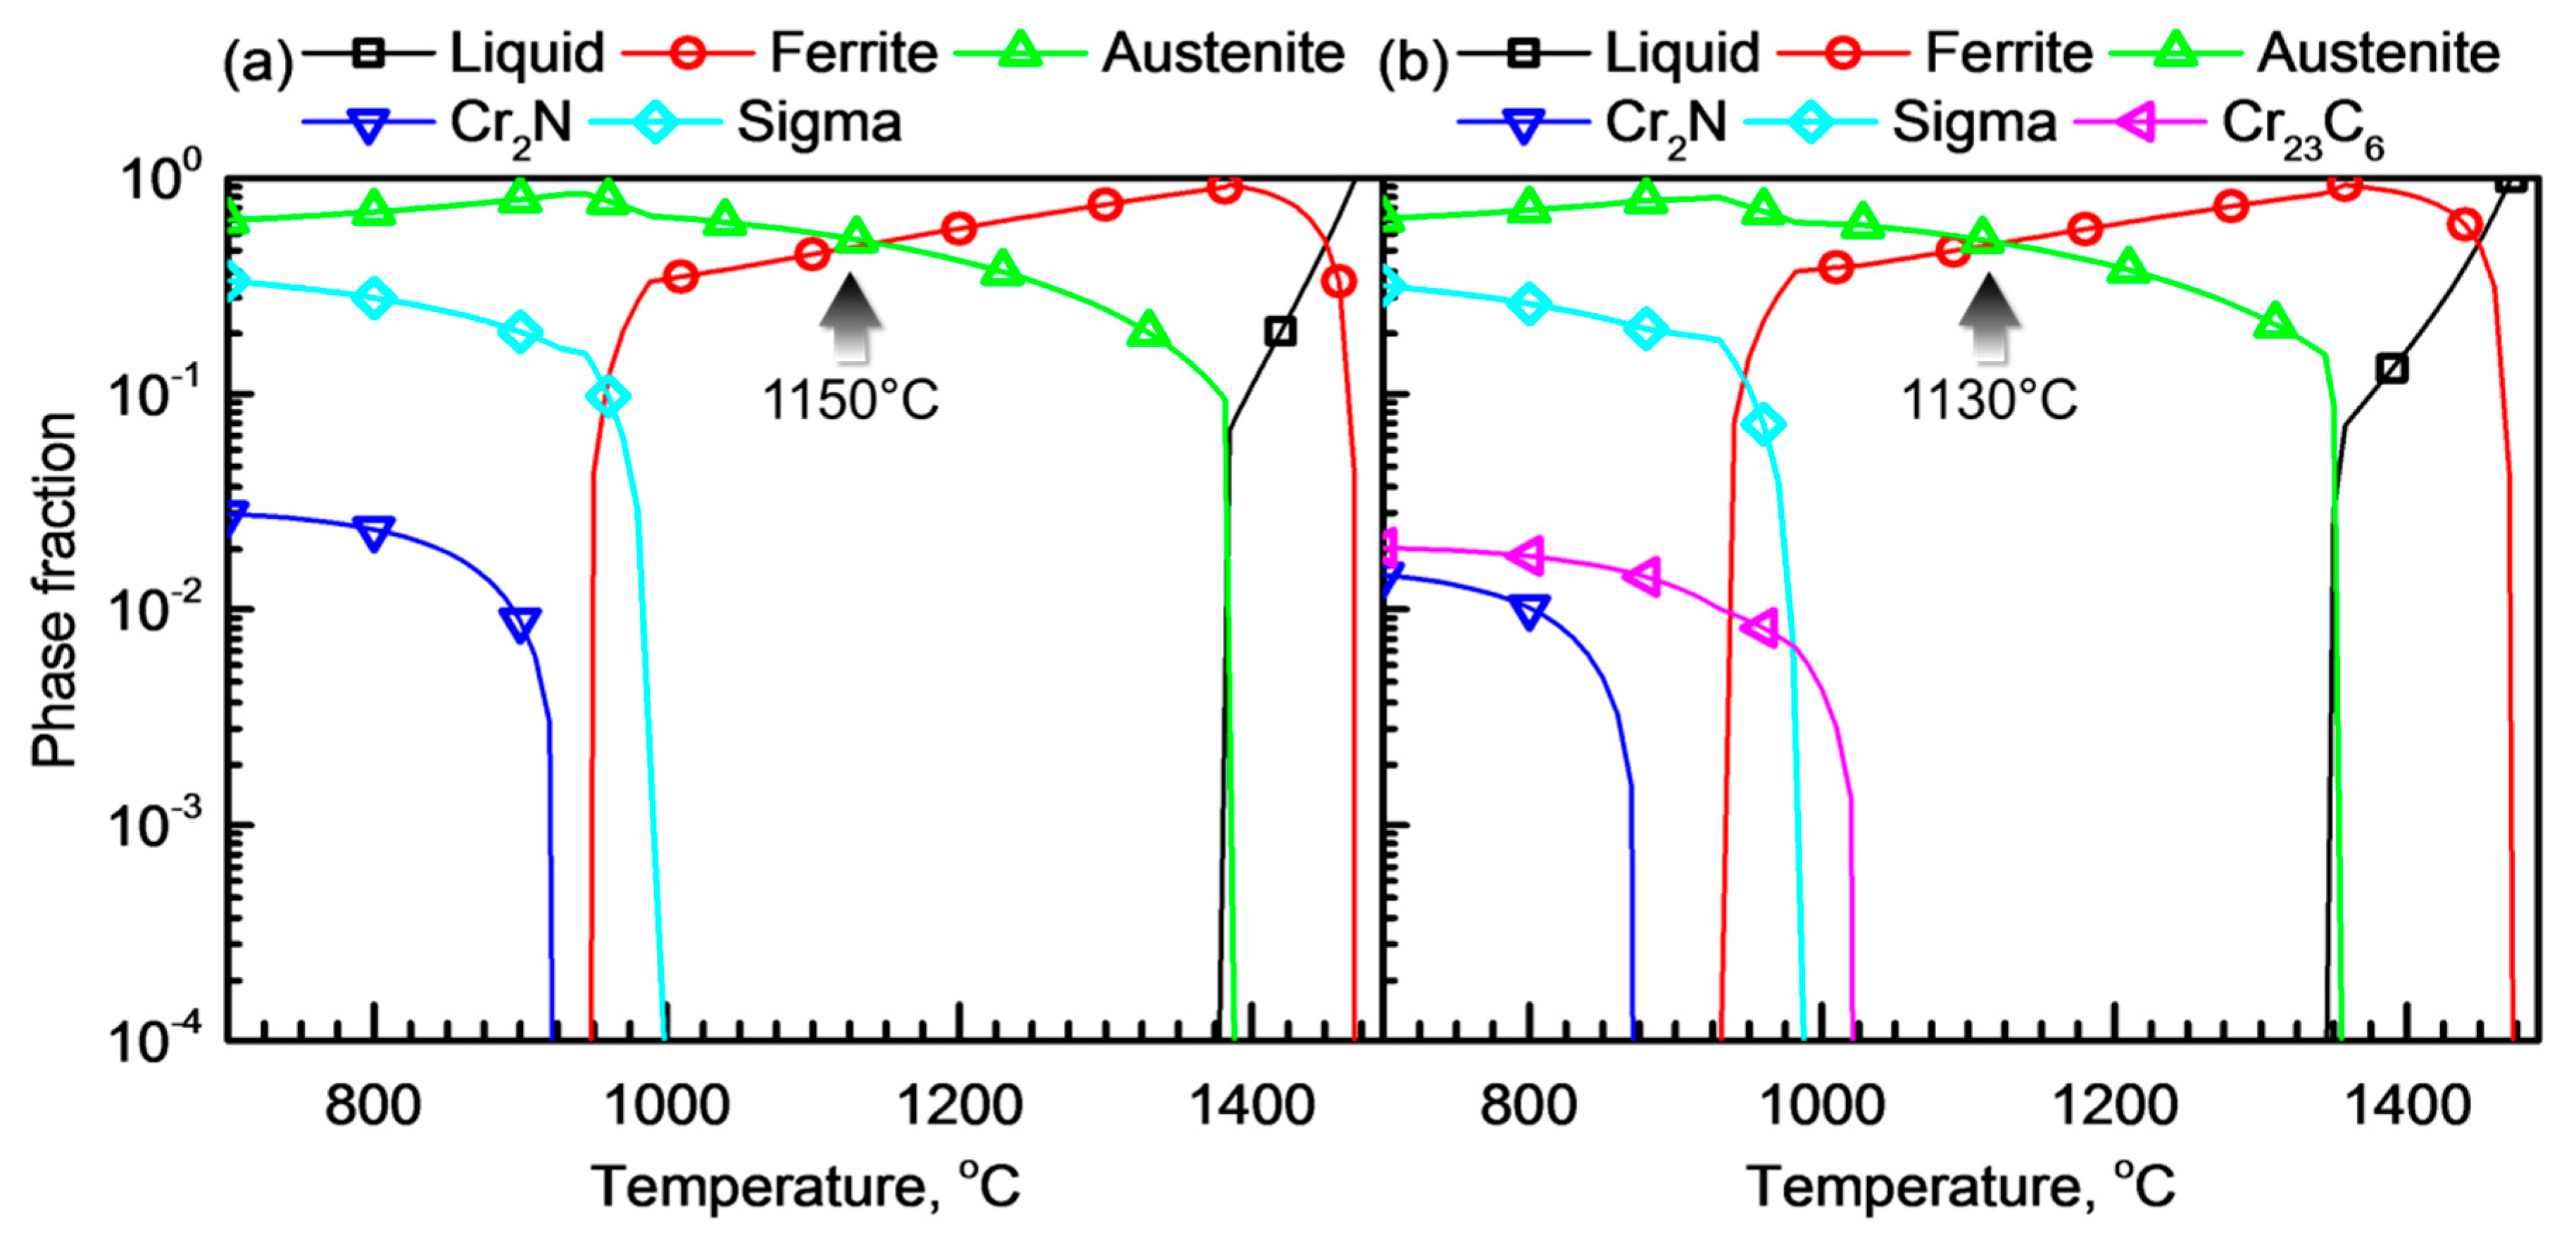
3.1. Microstructure
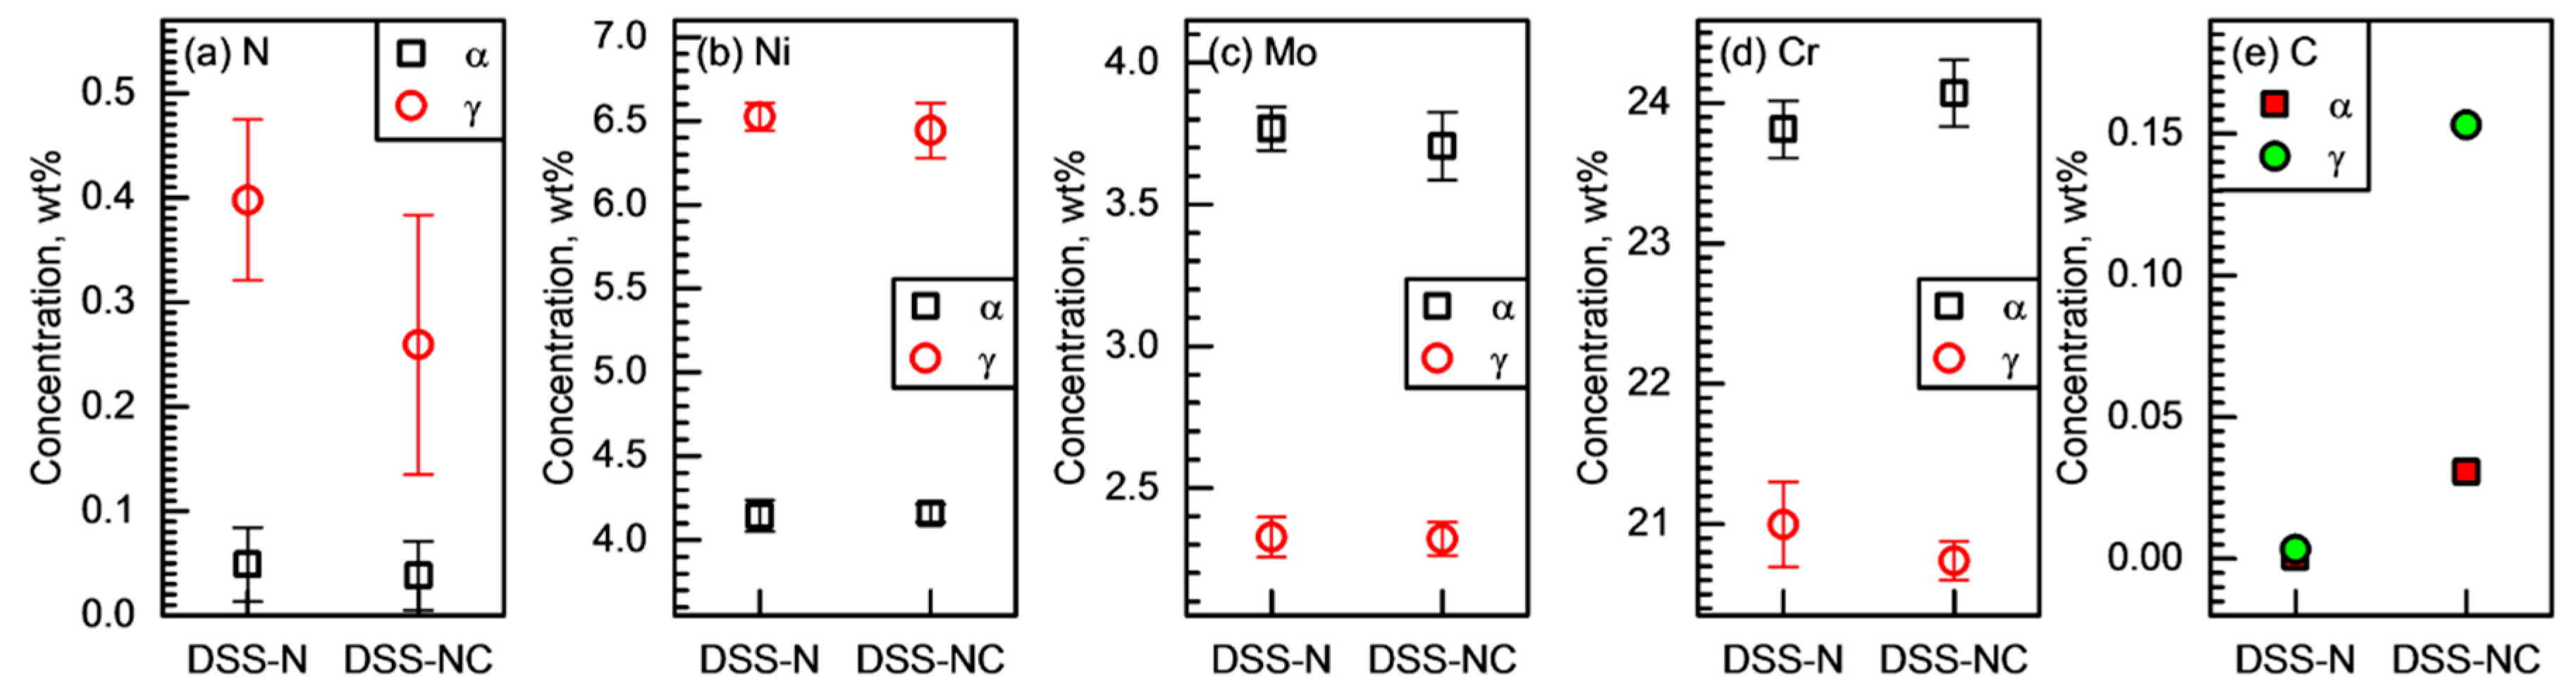
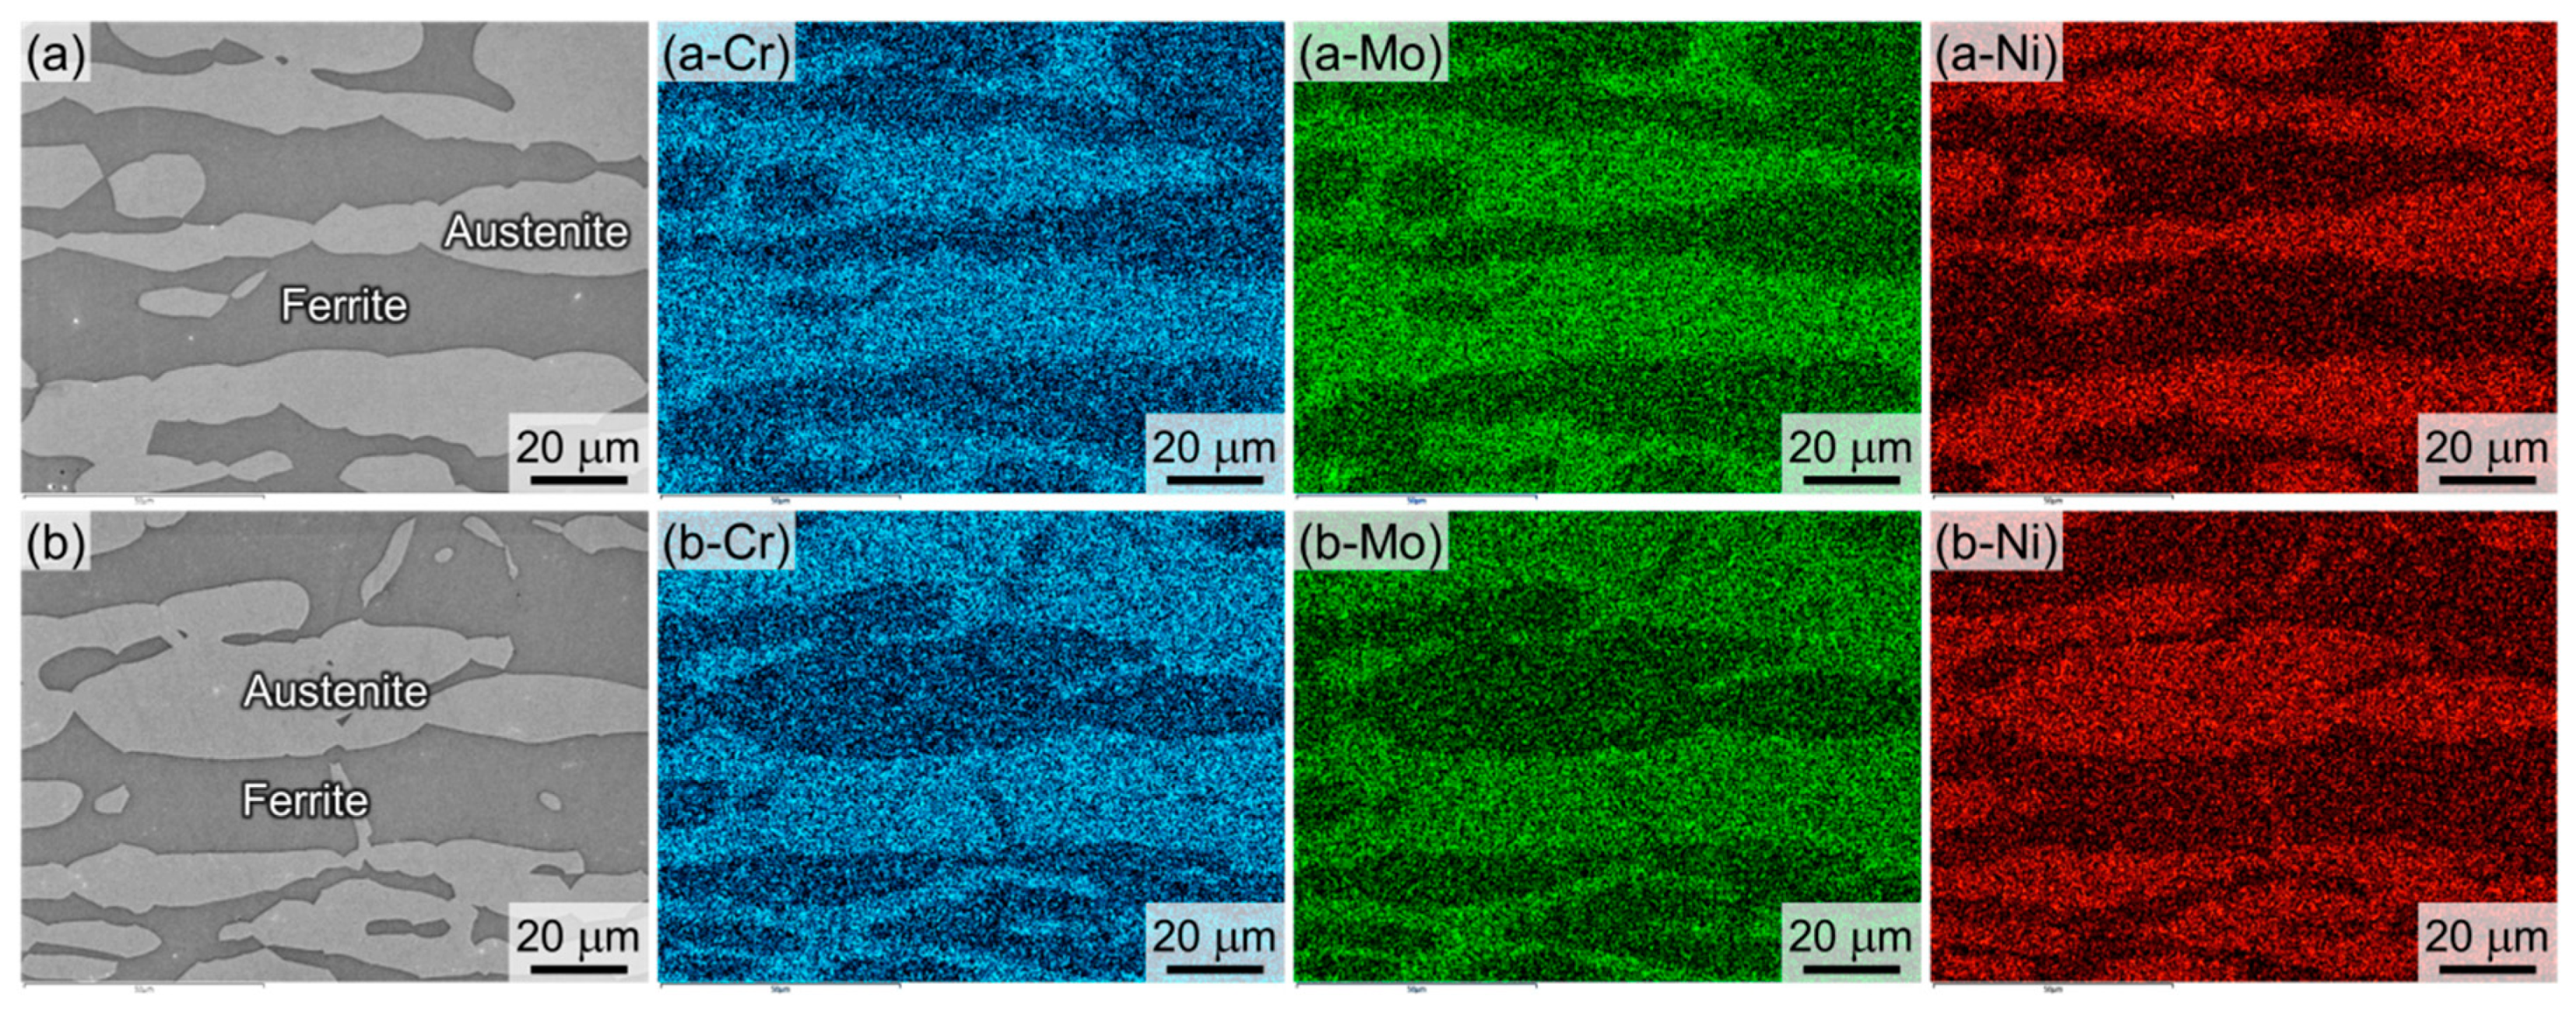
3.2. Partitioning of Alloying Elements
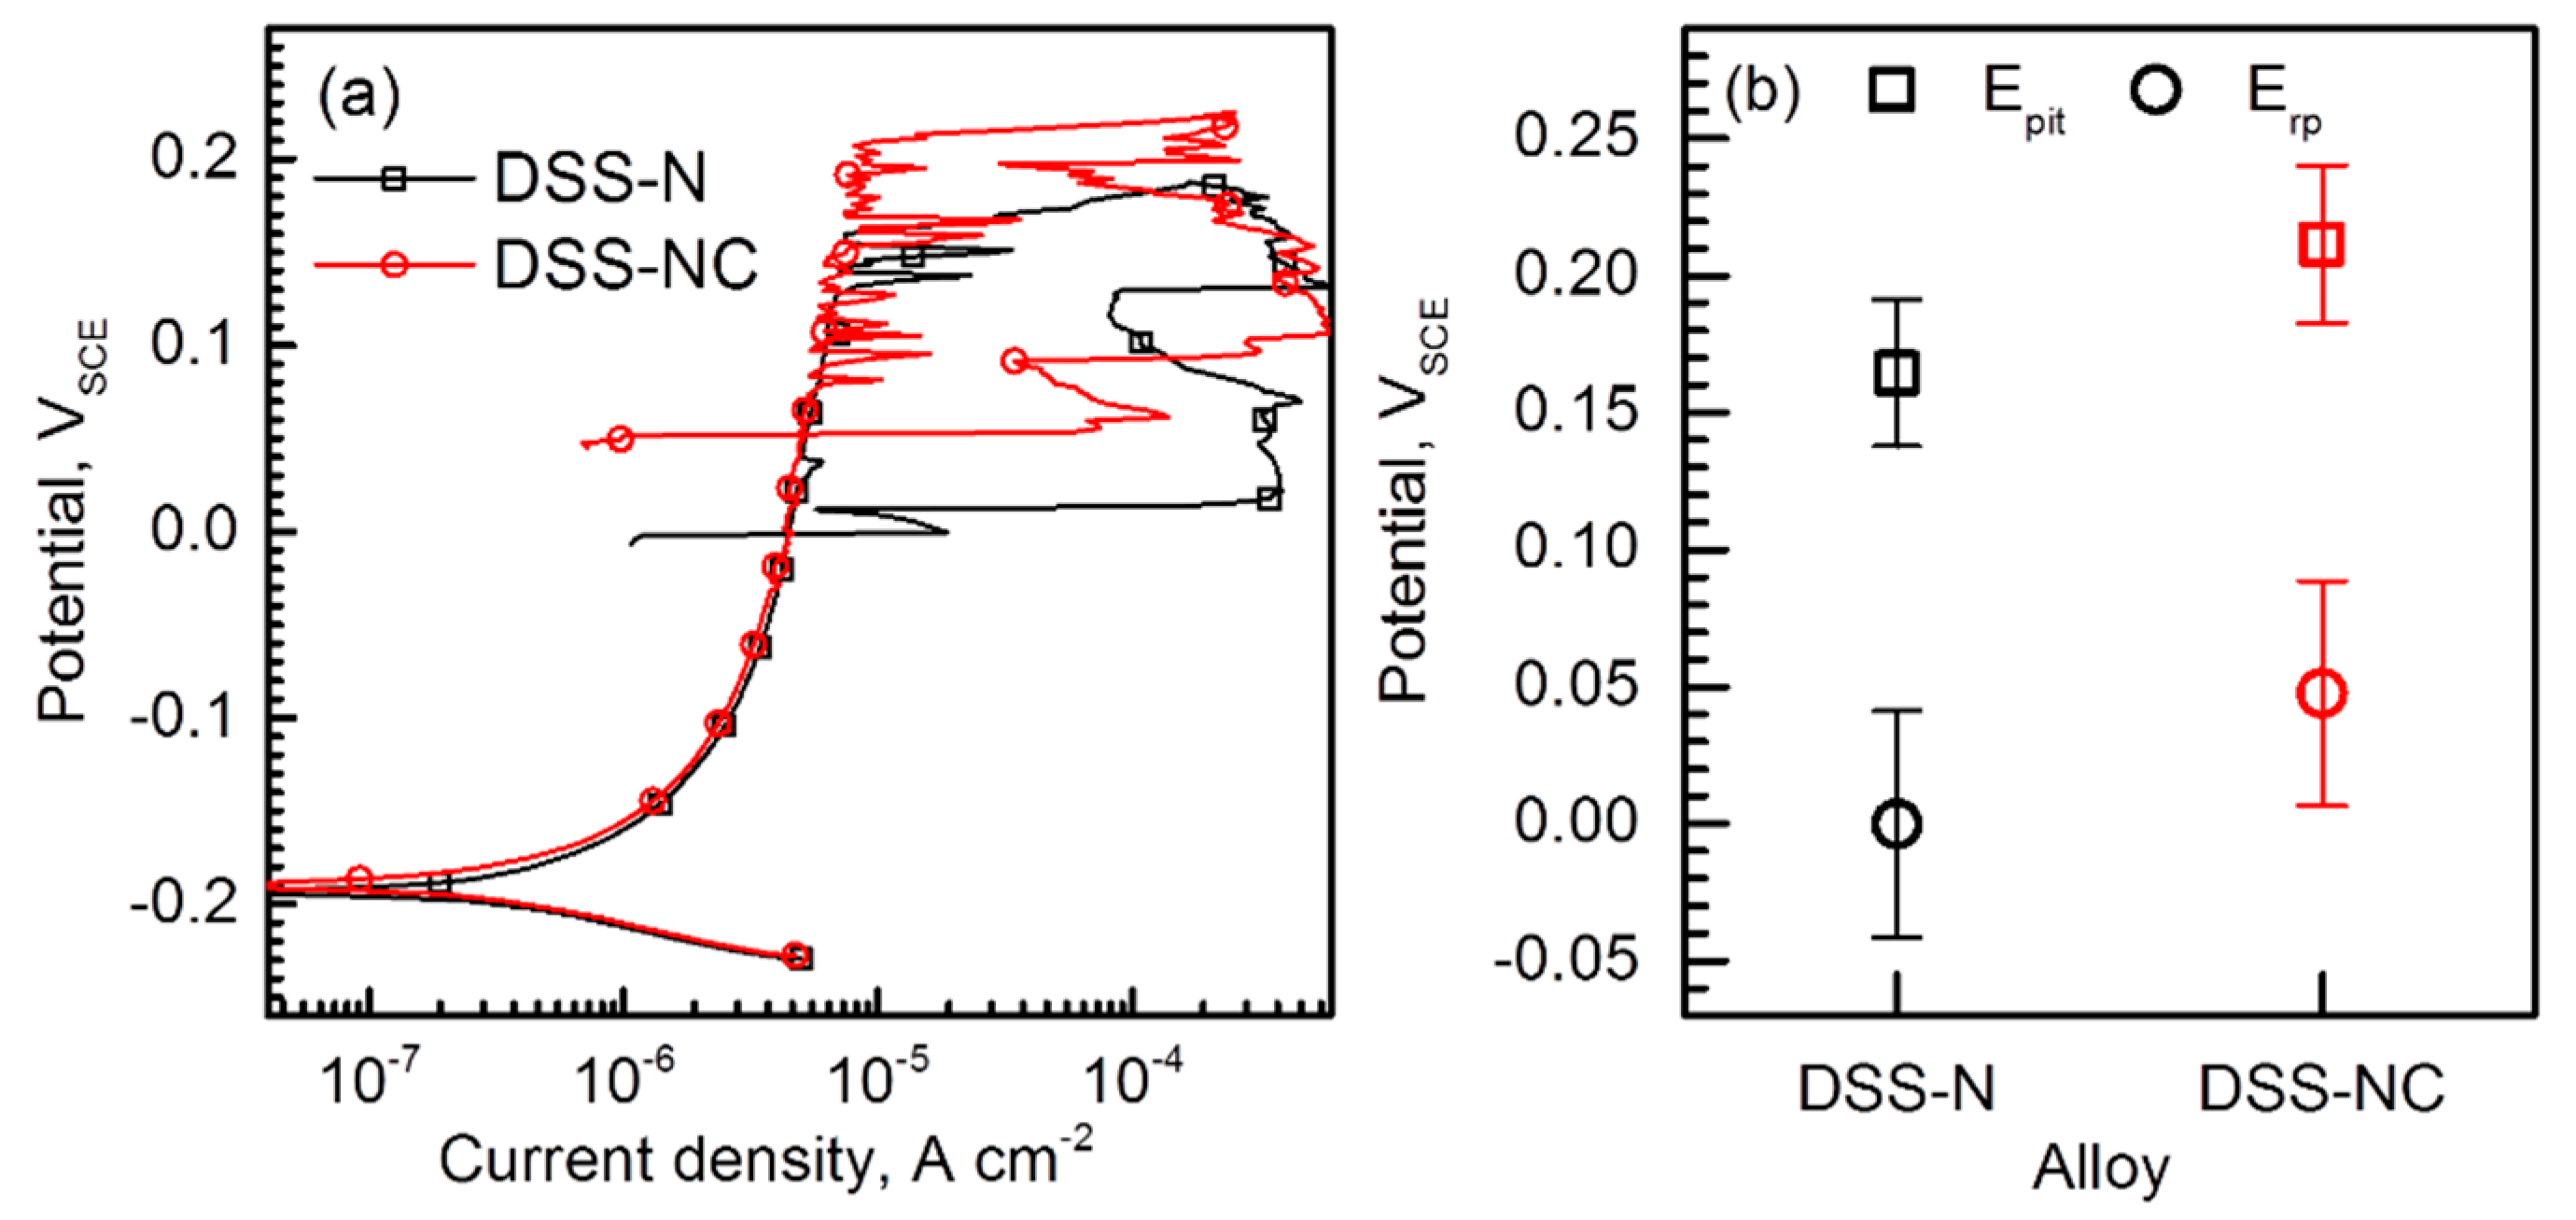
3.3. Resistance to Pitting Corrosion
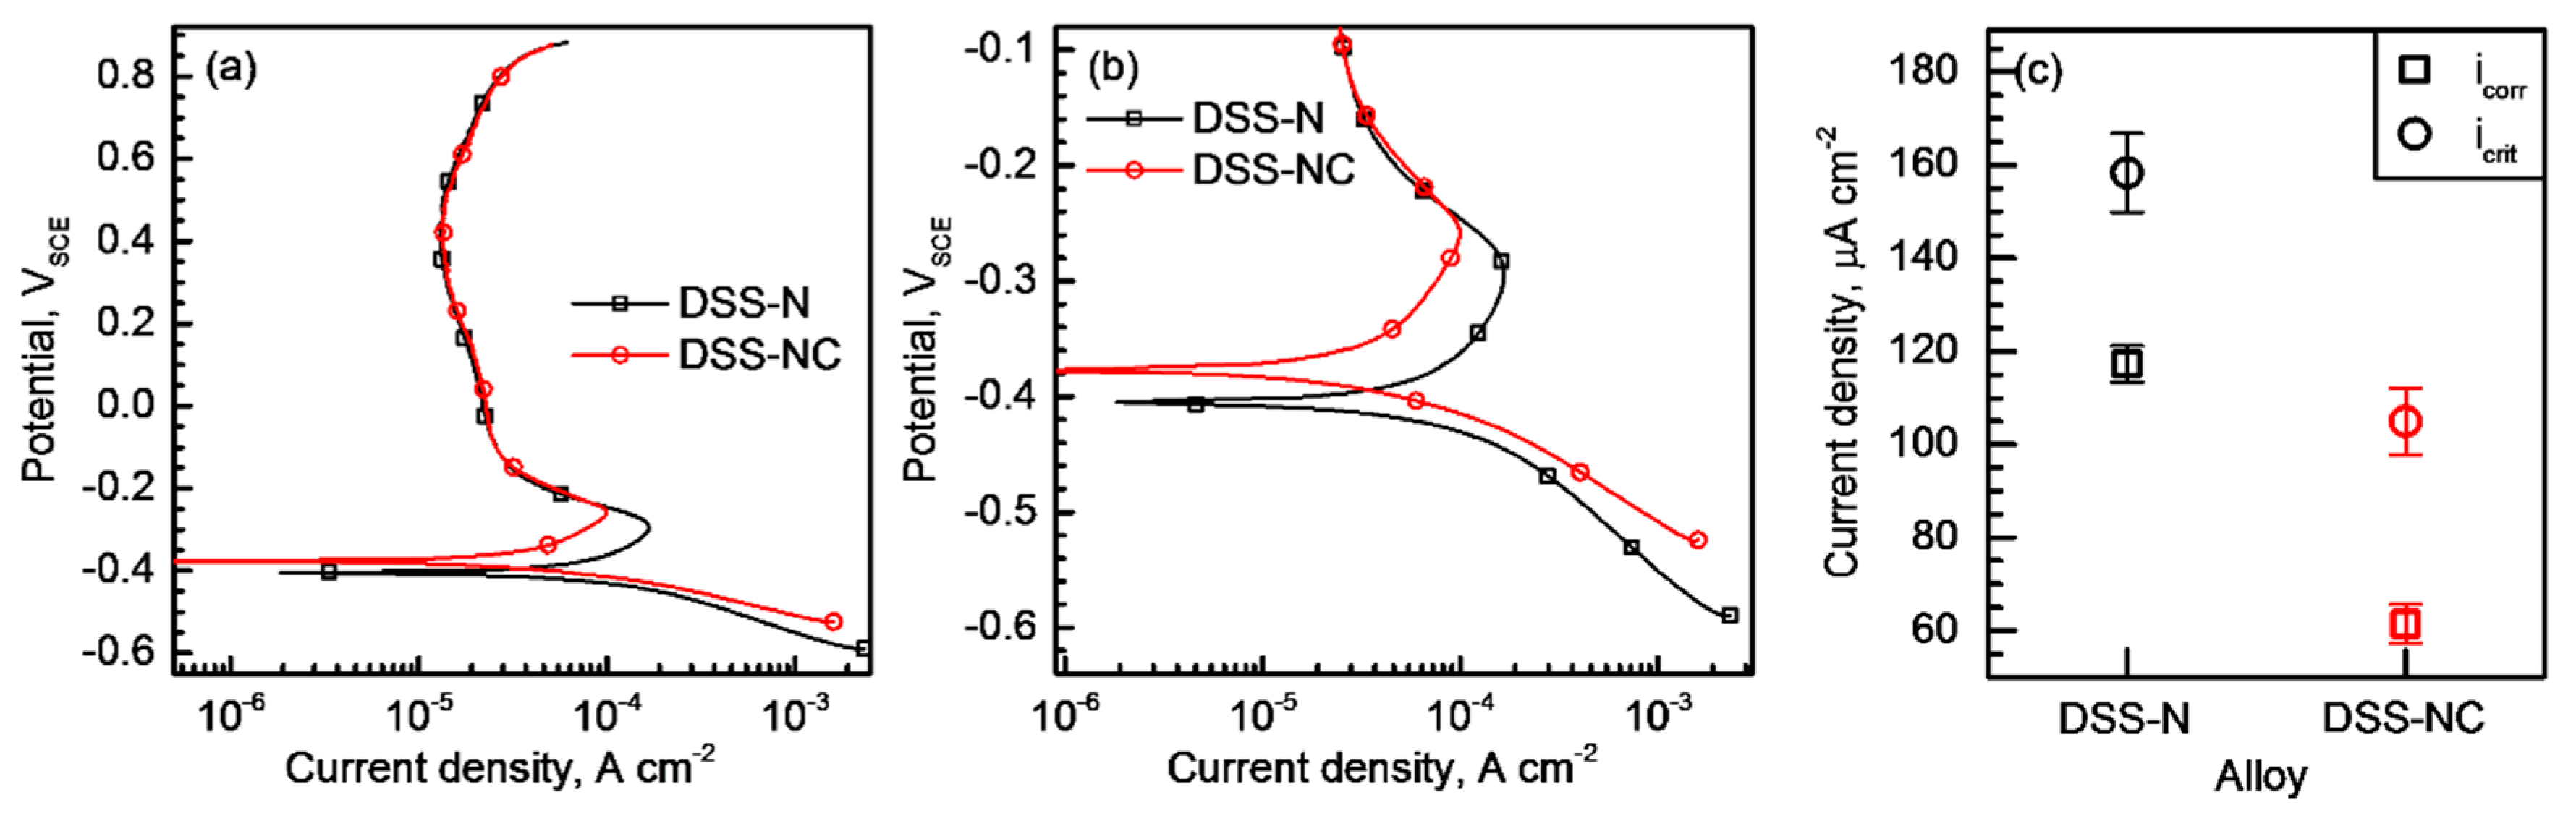
3.4. Resistance to Uniform Corrosion
3.5. Galvanic Corrosion Between the Two Constituent Phases
4. Discussion
5. Conclusions
- (1)
- The microstructural analyses revealed that the two DSSs after solution treatments had dual-phase microstructures without non-metallic inclusions and precipitates. They had similar initial microstructure, such as grain sizes and phase fractions. Cr partitioning was promoted by C-substitution for N in the DSS, and the γ phase of DSS-NC contained N with a meaningful amount of C (0.26N-0.15C wt%) while that of the DSS-N had N only (0.40 wt%).
- (2)
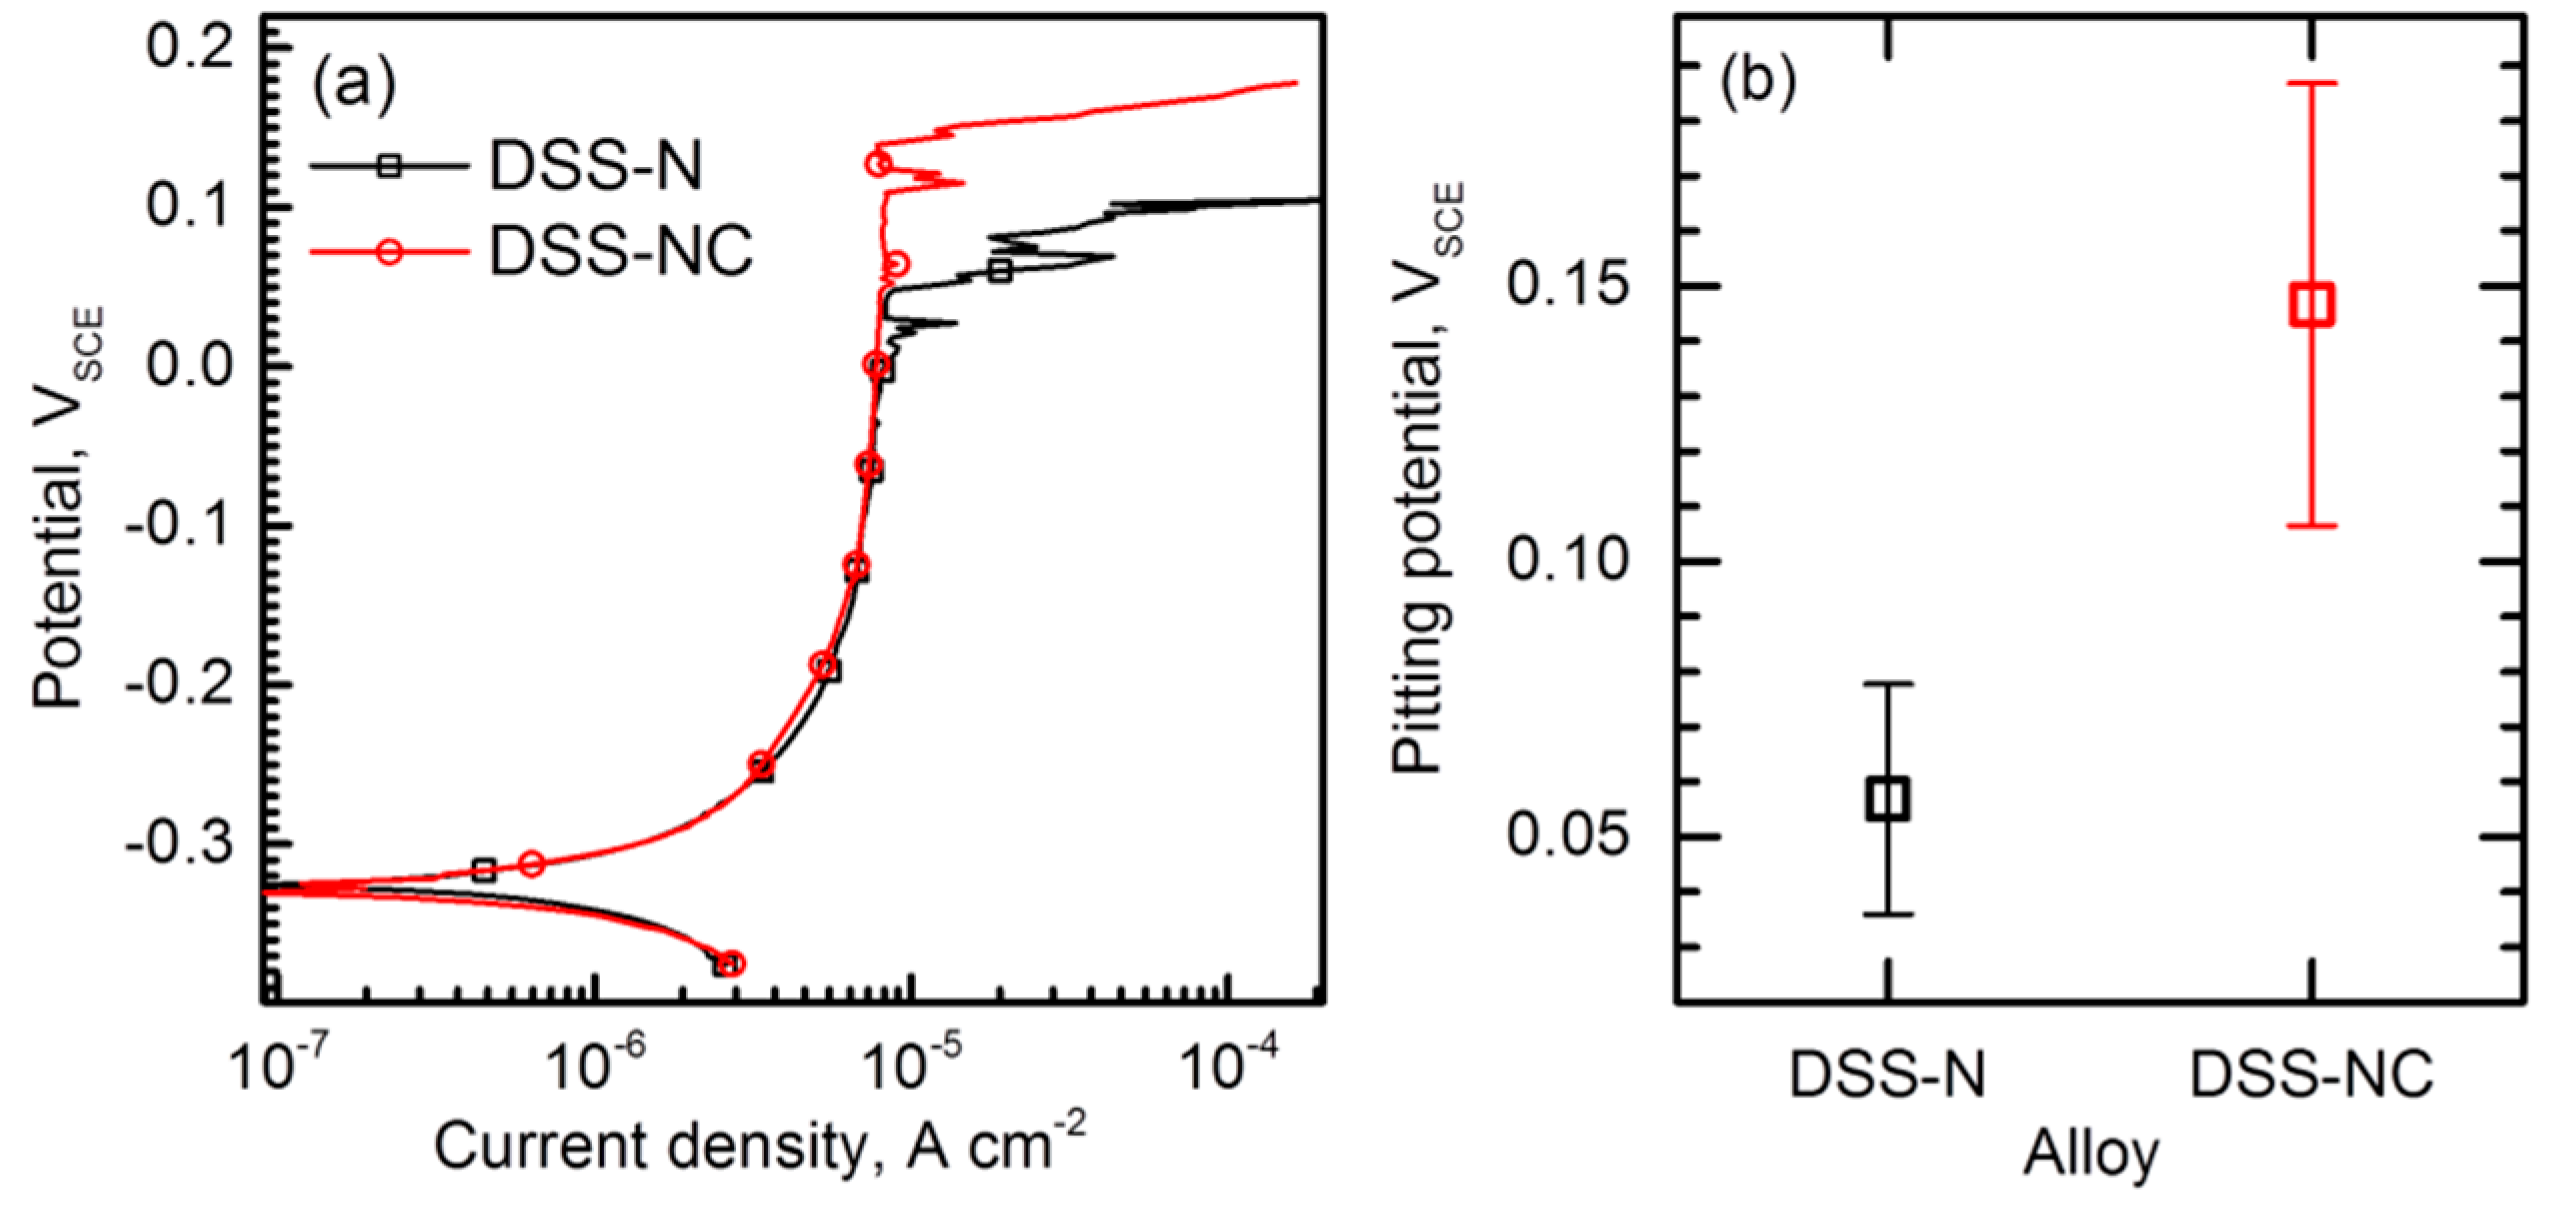
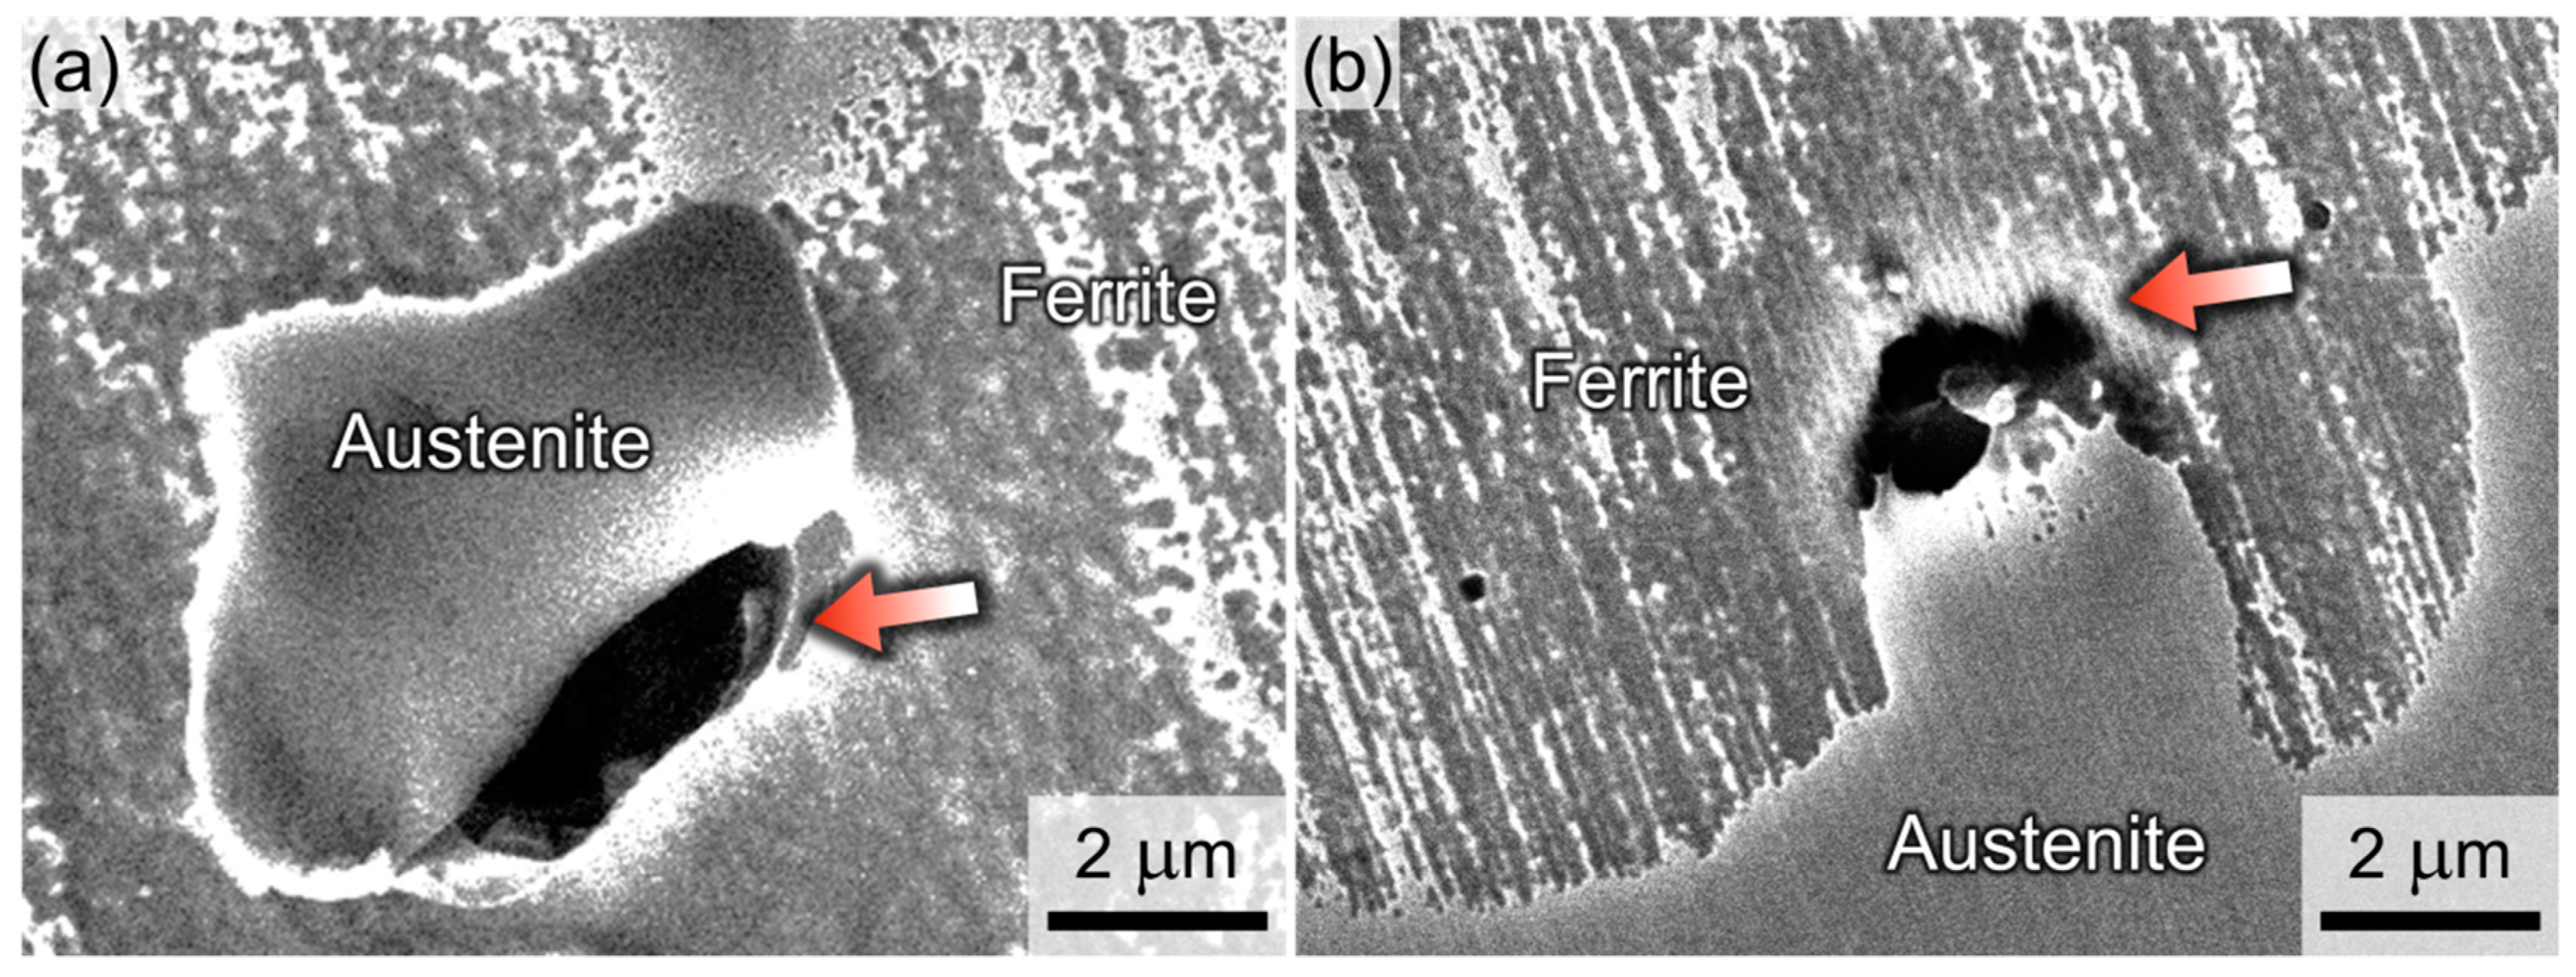
- Polarization tests performed in 2–5 M NaCl solutions and immersion tests in a 6% FeCl3 + 1% HCl solution revealed that the DSS-NC possessed higher resistance to stable pitting corrosion and repassivation tendency than the DSS-N. Furthermore, the corrosion pits initiated and propagated to less a corrosion resistant phase (i.e., α phase).
- (3)
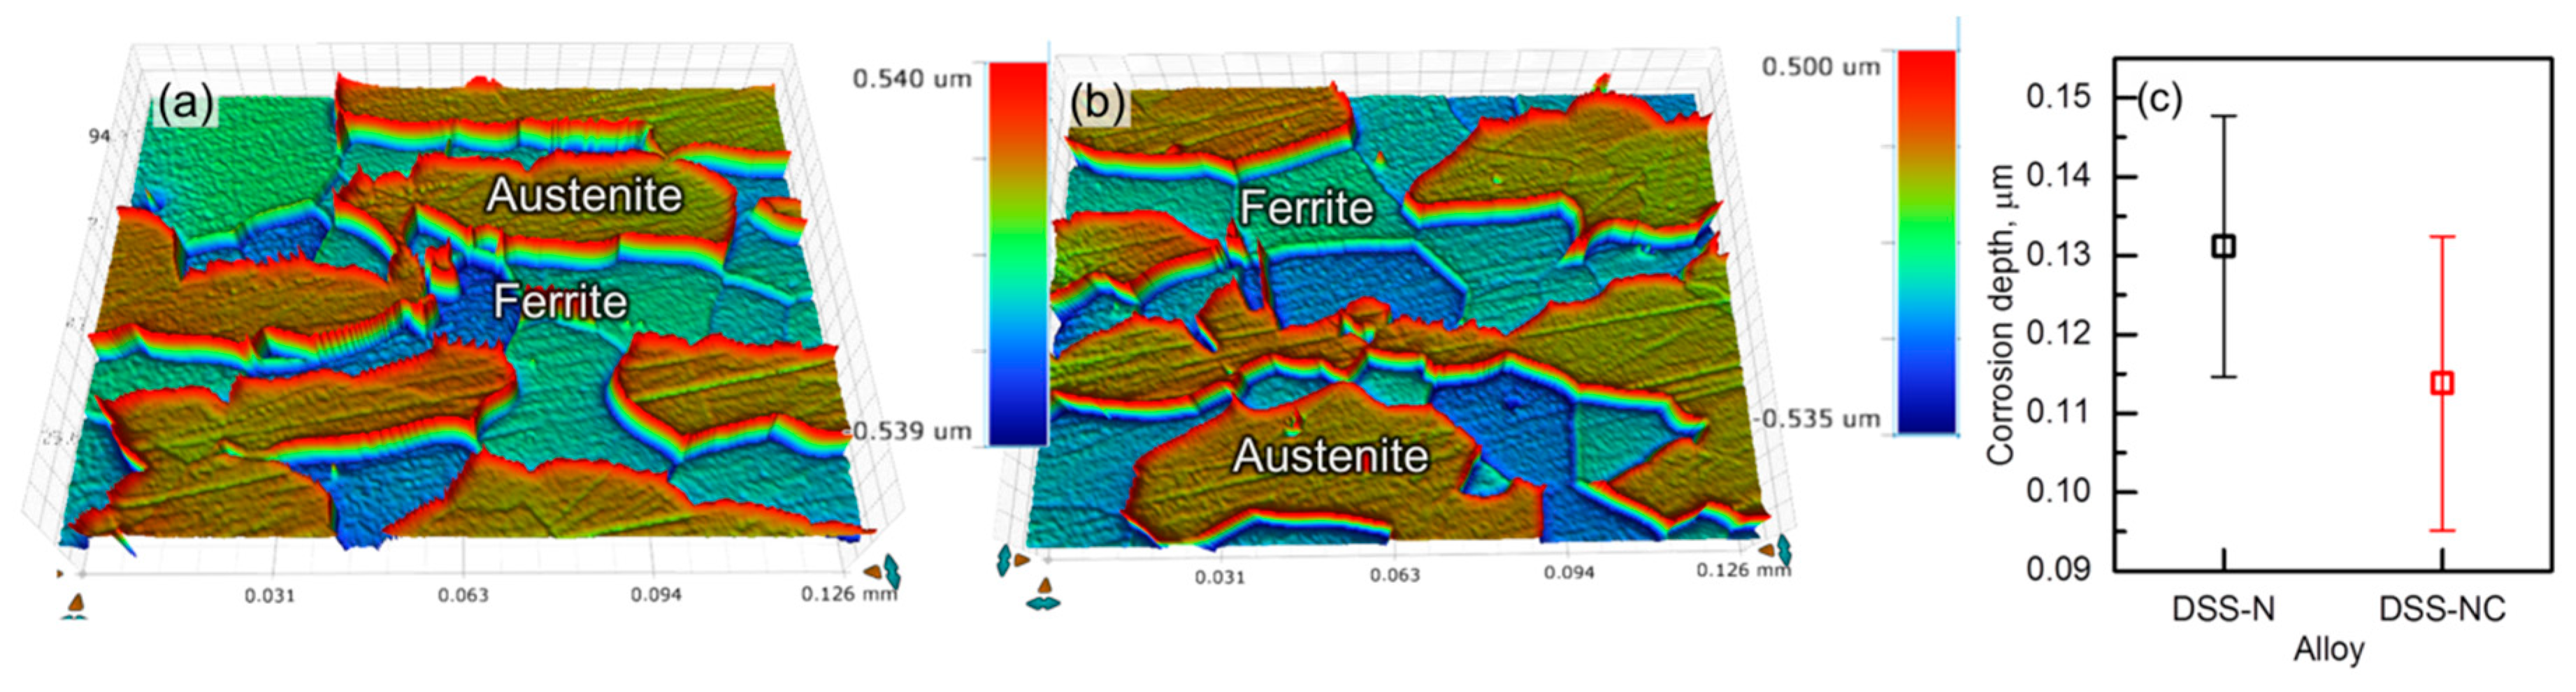
- Polarization tests and corrosion depth measurements conducted in a HCl solution indicated that the DSS-NC exhibited a lower galvanic corrosion rate between the α and γ phases than the DSS-N. Therefore, the growth rate of pit embryo was lowered in the DSS-NC, which shifted the potentials for the stable pit initiation and the pit extinction to the higher values.
Author Contributions
Funding
Conflicts of Interest
References
- Levey, P.R.; van Bennekom, A. A mechanistic study of the effects of nitrogen on the corrosion properties of stainless steels. Corrosion 1995, 51, 911–921. [Google Scholar] [CrossRef]
- Simmons, J.W. Overview: High-nitrogen alloying of stainless steels. Mater. Sci. Eng. A 1996, 207, 159–169. [Google Scholar] [CrossRef]
- Jargelius-Pettersson, R.F.A. Electrochemical investigation of the influence of nitrogen alloying on pitting corrosion of austenitic stainless steels. Corros. Sci. 1999, 41, 1639–1664. [Google Scholar] [CrossRef]
- Mudali, U.K. Nitrogen—A Boon to the Metals Industry. Mater. Manuf. Process. 2004, 19, 1–5. [Google Scholar] [CrossRef]
- Sumita, M.; Hanawa, T.; Teoh, S.H. Development of nitrogen-containing nickel free austenitic stainless steels for metallic biomaterials-review. Mater. Sci. Eng. C 2004, 24, 753–760. [Google Scholar] [CrossRef]
- Speidel, M.O. Nitrogen containing austenitic stainless steels. Mat. Wiss. Und Werkstofftech. 2006, 37, 875–880. [Google Scholar] [CrossRef]
- Oshima, T.; Habara, Y.; Kuroda, K. Efforts to save nickel in austenitic stainless steels. ISIJ Int. 2007, 47, 359–364. [Google Scholar] [CrossRef]
- Ha, H.Y.; Jang, H.J.; Kwon, H.S.; Kim, S.J. Effects of nitrogen on the passivity of Fe–20Cr alloy. Corros. Sci. 2009, 51, 48–53. [Google Scholar] [CrossRef]
- Ha, H.-Y.; Lee, T.-H.; Kim, S.-J. Role of nitrogen in the active–passive transition behavior of binary Fe-Cr alloy system. Electrochim. Acta 2012, 80, 432–439. [Google Scholar] [CrossRef]
- Seifert, M.; Siebert, S.; Huth, S.; Theisen, W.; Berns, H. New developments in martensitic stainless steels containing C + N. Steel Res. Int. 2015, 86, 1508–1516. [Google Scholar] [CrossRef]
- Gavrilyuk, V.G.; Berns, H. High-strength austenitic stainless steel. Met. Sci. Heat Treat. 2007, 49, 566–568. [Google Scholar] [CrossRef]
- Thomann, U.I.; Uggowitzer, P.J. Wear–corrosion behavior of biocompatible austenitic stainless steels. Wear 2000, 239, 48–58. [Google Scholar] [CrossRef]
- Rawers, J.C. Alloying effects on the microstructure and phase stability of Fe–Cr–Mn steels. J. Mater. Sci. 2008, 43, 3618–3624. [Google Scholar] [CrossRef]
- Gavriljuk, V.G.; Shanina, B.D.; Berns, H. A physical concept for alloying steels with carbon + nitrogen. Mater. Sci. Eng. A 2008, 481, 707–712. [Google Scholar] [CrossRef]
- Ha, H.-Y.; Lee, T.-H.; Oh, C.-S.; Kim, S.-J. Effects of combined addition of carbon and nitrogen on pitting corrosion behavior of Fe–18Cr–10Mn alloys. Scr. Mater. 2009, 61, 121–124. [Google Scholar] [CrossRef]
- Ha, H.-Y.; Lee, T.-H.; Oh, C.-S.; Kim, S.-J. Effects of carbon on the corrosion behaviour in Fe-18Cr-10Mn-N-C stainless steels. Steel Res. Int. 2009, 80, 488–492. [Google Scholar]
- Lee, T.H.; Shin, E.; Oh, C.S.; Ha, H.Y.; Kim, S.J. Correlation between stacking fault energy and deformation microstructure in high-interstitial-alloyed austenitic steels. Acta Mater. 2010, 58, 3173–3186. [Google Scholar] [CrossRef]
- Schymura, M.; Stegemann, F.; Fischer, A. Crack propagation behavior of solution annealed austenitic high interstitial steels. Int. J. Fatigue 2015, 79, 25–35. [Google Scholar] [CrossRef]
- Ha, H.Y.; Lee, T.H.; Kim, S.J. Effect of C fraction on corrosion properties of high interstitial alloyed stainless steels. Metall. Mater. Trans. A 2012, 43A, 2999–3005. [Google Scholar] [CrossRef]
- Niederhofer, P.; Richrath, L.; Huth, S.; Theisen, W. Influence of conventional and powder-metallurgical manufacturing on the cavitation erosion and corrosion of high interstitial CrMnCN austenitic stainless steels. Wear 2016, 360, 67–76. [Google Scholar] [CrossRef]
- Ha, H.Y.; Kwon, H.S. Effects of Cr2N on the pitting corrosion of high nitrogen stainless steels. Electrochim. Acta 2007, 52, 2175–2180. [Google Scholar] [CrossRef]
- Zhang, S.; Li, H.; Jiang, Z.; Zhang, B.; Li, Z.; Wu, J.; Fan, S.; Fen, H.; Zhu, H. Effects of Cr and Mo on precipitation behavior and associated intergranular corrosion susceptibility of superaustenitic stainless steel S32654. Mater. Charact. 2019, 152, 141–150. [Google Scholar] [CrossRef]
- Lee, T.H.; Kim, S.J. Phase identification in an isothermally aged austenitic 22Cr-21Ni-6Mo-N stainless steel. Scr. Mater. 1998, 39, 951–956. [Google Scholar] [CrossRef]
- Rasouli, D.; Kermanpur, A.; Ghassemali, E.; Najafzadeh, A. On the reversion and recrystallization of austenite in the interstitially alloyed Ni‑free nano/ultrafne grained austenitic stainless steels. Met. Mater. Int. 2019, 25, 846–859. [Google Scholar] [CrossRef]
- Davison, R.M.; Redmond, J.D. A guide to using duplex stainless steels. Mater. Des. 1991, 12, 187–192. [Google Scholar] [CrossRef]
- Nilsson, J.O. Super duplex stainless steels. Mater. Sci. Technol. 1992, 8, 685–700. [Google Scholar] [CrossRef]
- Jonsson, J.Y.; Thulin, A.; Hagg, S.; Pettersson, R. The two phased optimization of duplex stainless steel. ACOM 2013, 3–4, 1–9. [Google Scholar]
- Olsson, J.; Snis, M. Duplex—A new generation of stainless steels for desalination plants. Desalination 2007, 205, 104–113. [Google Scholar] [CrossRef]
- Bernard, F.; Rao, V.S.; Kwon, H.-S. A study on the repassivation kinetics and SCC behavior of duplex stainless steel in chloride solution. J. Electrochem. Soc. 2005, 152, B415–B420. [Google Scholar] [CrossRef]
- Lee, T.-H.; Ha, H.-Y.; Kang, J.-Y.; Hwang, B.; Woo, W.; Shin, E. In situ and ex situ neutron diffraction study on deformation behavior of high-nitrogen, Ni-free duplex stainless steel. Scr. Mater. 2012, 67, 141–144. [Google Scholar] [CrossRef]
- Lee, T.-H.; Ha, H.-Y.; Hwang, B.; Kim, S.-J. Isothermal decomposition of ferrite in a high-nitrogen, nickel-free duplex stainless steel. Metall. Mater. Trans. A 2012, 43, 822–832. [Google Scholar] [CrossRef]
- Park, Y.-H.; Lee, Z.-H. The effect of nitrogen and heat treatment on the microstructure and tensile properties of 25Cr-7Ni-1.5Mo-3W-xN duplex stainless steel castings. Mater. Sci. Eng. A 2001, 297, 78–84. [Google Scholar] [CrossRef]
- Yoon, Y.-S.; Ha, H.-Y.; Lee, T.-H.; Kim, S. Comparative study of stress corrosion cracking susceptibility of Fe18Cr10Mn- and Fe18Cr10Mn1Ni-based high nitrogen stainless steels. Corros. Sci. 2014, 88, 337–348. [Google Scholar] [CrossRef]
- Son, J.; Kim, S.; Lee, J.; Choi, B. Effect of N addition on tensile and corrosion behaviors of CD4MCU cast duplex stainless steels. Metall. Mater. Trans. A 2003, 34A, 1617–1625. [Google Scholar] [CrossRef]
- Lee, T.-H.; Ha, H.-Y.; Kim, S.-J. Precipitation of Second Phases in High-Interstitial-Alloyed Austenitic Steel. Metall. Mater. Trans. A 2011, 42, 3543–3548. [Google Scholar] [CrossRef] [Green Version]
- Lopez, N.; Cid, M.; Puiggali, M. Influence of σ-phase on mechanical properties and corrosion resistance of duplex stainless steels. Corros. Sci. 1999, 41, 1615–1631. [Google Scholar] [CrossRef]
- Ha, H.-Y.; Lee, T.-H.; Bae, J.-H.; Chun, D.W. Molybdenum effects on pitting corrosion resistance of FeCrMnMoNC austenitic stainless steels. Metals 2018, 8, 653. [Google Scholar] [CrossRef]
- Ha, H.-Y.; Lee, T.-H.; Lee, C.-G.; Yoon, H. Understanding the relation between pitting corrosion resistance and phase fraction of S32101 duplex stainless steel. Corros. Sci. 2019, 149, 226–235. [Google Scholar] [CrossRef]
- Ramirez, A.J.; Lippold, J.C.; Brandi, S.D. The relationship between chromium nitride and secondary austenite precipitation in duplex stainless steels. Metall. Mater. Trans. A 2003, 34A, 1575–1597. [Google Scholar] [CrossRef]
- Santos, T.F.A.; Marinho, R.R.; Paes, M.T.P.; Ramirez, A.J. Microstructure evaluation of UNS S32205 duplex stainless steel friction stir welds. Metall. Mater. 2013, 66, 187–191. [Google Scholar] [CrossRef] [Green Version]
- Tan, H.; Jiang, Y.; Deng, B.; Sun, T.; Xu, J.; Li, J. Effect of annealing temperature on the pitting corrosion resistance of super duplex stainless steel UNS S32750. Mater. Charact. 2009, 61, 1049–1054. [Google Scholar] [CrossRef]
- Yang, Y.; Tan, H.; Zhang, Z.; Wang, Z.; Jiang, Y.; Li, J. Effect of annealing temperature on the pitting corrosion behavior of UNS S82441 duplex stainless steel. Corrosion 2013, 69, 167–173. [Google Scholar] [CrossRef]
- Ha, H.-Y.; Jang, M.-H.; Lee, T.-H.; Moon, J. Interpretation of the relation between ferrite fraction and pitting corrosion resistance of commercial 2205 duplex stainless steel. Corros. Sci. 2014, 89, 154–162. [Google Scholar] [CrossRef]
- Newman, R. Pitting corrosion of metals. Electrochem. Soc. Interf. 2010, 19, 33–38. [Google Scholar] [CrossRef]
- Frankel, G.S. Pitting corrosion of metals a review of the critical factors. J. Electrochem. Soc. 1998, 145, 2186–2198. [Google Scholar] [CrossRef]
- Ha, H.-Y.; Jang, M.-H.; Lee, T.-H.; Moon, J. Understanding the relation between phase fraction and pitting corrosion resistance of UNS S32750 stainless steel. Mater. Charact. 2015, 106, 338–345. [Google Scholar] [CrossRef]
- Yin, Z.F.; Zhao, W.Z.; Lai, W.Y.; Zhao, X.H. Electrochemical behaviour of Ni-base alloys exposed under oil/gas field environments. Corros. Sci. 2009, 51, 1702–1706. [Google Scholar] [CrossRef]
- Kwon, H.S.; Cho, E.A.; Yeom, K.A. Prediction of stress corrosion cracking susceptibility of stainless steels based on repassivation kinetics. Corrosion 2000, 56, 32–40. [Google Scholar] [CrossRef]


| Alloy | Fe | Cr | Ni | Mo | Mn | N | C | S | P |
|---|---|---|---|---|---|---|---|---|---|
| DSS-N | Balanced | 22.48 | 5.17 | 3.10 | 1.46 | 0.24 | 0.002 | 0.005 | 0.005 |
| DSS-NC | 22.43 | 5.18 | 3.14 | 1.46 | 0.13 | 0.090 | 0.006 | 0.004 |
| Purpose | Experiment | Test Condition | |
|---|---|---|---|
| Evaluation of resistance to pitting corrosion | Measurement of Epit | Linear potentiodynamic polarization test | Solution: 5 M NaCl (50 °C) Potential sweep rate: 2 mV s−1 |
| Measurements of Epit and Erp | Cyclic potentiodynamic polarization test | Solution: 2 M NaCl (50 °C) Potential sweep rate: 2 mV s−1 | |
| Measurement of weight loss | Immersion test | solution: 6% FeCl3 + 1% HCl (50 °C) Immersion time: 12 h | |
| Observation of pit initiation sites | Immersion test | Solution: 0.2 M HCl (25 °C) Immersion time: 4 h | |
| Evaluation of resistance to uniform corrosion | Measurement of Ecorr, icorr, and icrit | Linear potentiodynamic polarization test | Solution: 0.2 M HCl (25) Potential sweep rate: 2 mV s−1 |
| Evaluation of galvanic corrosion rate | Immersion test | Solution: 0.2 M HCl (25 °C) Immersion time: 40 min | |
| Test Condition | 5 M NaCl at 50 °C | 2 M NaCl at 50 °C | |||||
|---|---|---|---|---|---|---|---|
| Alloy | Ecorr, VSCE | Epit, VSCE | ipassive at −0.1 VSCE, μA cm−2 | Ecorr, VSCE | Epit, VSCE | Erp, VSCE | ipassive at −0.1 VSCE, μA cm−2 |
| DSS-N | −0.326 | 0.057 | 6.997 | −0.192 | 0.164 | 0.001 | 2.696 |
| DSS-NC | −0.324 | 0.147 | 6.875 | −0.189 | 0.211 | 0.048 | 2.471 |
| Alloy | Ecorr, VSCE | icorr, μA cm−2 | Polarization Resistance, Ohm cm−2 | Corrosion Rate, Milli-Inches per Year | icrit, μA cm−2 |
|---|---|---|---|---|---|
| DSS-N | −0.405 | 117.29 | 355.35 | 54.18 | 158.32 |
| DSS-NC | −0.377 | 61.44 | 517.25 | 28.38 | 104.94 |
© 2019 by the authors. Licensee MDPI, Basel, Switzerland. This article is an open access article distributed under the terms and conditions of the Creative Commons Attribution (CC BY) license (http://creativecommons.org/licenses/by/4.0/).
Share and Cite
Yoon, H.; Ha, H.-Y.; Lee, T.-H.; Kim, S.-D.; Jang, J.H.; Moon, J.; Kang, N. Pitting Corrosion Resistance and Repassivation Behavior of C-Bearing Duplex Stainless Steel. Metals 2019, 9, 930. https://doi.org/10.3390/met9090930
Yoon H, Ha H-Y, Lee T-H, Kim S-D, Jang JH, Moon J, Kang N. Pitting Corrosion Resistance and Repassivation Behavior of C-Bearing Duplex Stainless Steel. Metals. 2019; 9(9):930. https://doi.org/10.3390/met9090930
Chicago/Turabian StyleYoon, Hanme, Heon-Young Ha, Tae-Ho Lee, Sung-Dae Kim, Jae Hoon Jang, Joonoh Moon, and Namhyun Kang. 2019. "Pitting Corrosion Resistance and Repassivation Behavior of C-Bearing Duplex Stainless Steel" Metals 9, no. 9: 930. https://doi.org/10.3390/met9090930
APA StyleYoon, H., Ha, H.-Y., Lee, T.-H., Kim, S.-D., Jang, J. H., Moon, J., & Kang, N. (2019). Pitting Corrosion Resistance and Repassivation Behavior of C-Bearing Duplex Stainless Steel. Metals, 9(9), 930. https://doi.org/10.3390/met9090930