Article

Cooling Behavior and Microstructure of Semisolid A201 Aluminum Alloy Prepared by the SEED Process

1
National Engineering & Technology Research Center for Nonferrous Metal Matrix Composites, General Research Institute for Nonferrous Metals, Beijing 100088, China
2
School of Materials Science and Engineering, University of Science and Technology Beijing, Beijing 100083, China
3
Department of Mechanical and Energy Engineering, Southern University of Science and Technology, Shenzhen 518055, China
*
Authors to whom correspondence should be addressed.
These authors contribute equally to this work.
Metals 2019, 9(9), 922; https://doi.org/10.3390/met9090922
Submission received: 23 July 2019 / Revised: 13 August 2019 / Accepted: 21 August 2019 / Published: 23 August 2019
(This article belongs to the Special Issue Net-Shape Die Casting of Semi-solid Alloys)

Abstract

:
The biggest challenge in semisolid processing of high-performance aluminum alloys is the narrow temperature processing windows of these alloys, and as a result, the preparation of qualified semisolid slurries is very important. High solid fraction slurries of high-strength A201 alloy were prepared by the Swirled Enthalpy Equilibration Device (SEED) process. The cooling behavior and microstructures of the A201 slurries produced by the standard, as well as a modified, SEED process were investigated. The results show that qualified A201 slurry can be produced by decreasing the pouring temperature and controlling the processing time in the SEED process. The modified SEED process significantly reduced the radial temperature gradient of the melt, due to the slow cooling rates involved, with the resulting slurries being more uniform, with more spherical microstructures, as compared to those produced by the standard SEED process. The formation of the nondendritic grain structure in the SEED process is attributed to the uniformly distributed large number of nuclei within the melt and the slow cooling of the melt in the containing crucible.

1. Introduction

Semisolid processing (SSP) is commercially a relatively new metal-forming technology, although it was first introduced in the early 1970s, which competes directly with conventional casting and/or die-casting processes to produce near-net-shape components. SSP can be divided into two major routes: rheocasting, which involves forming the semisolid slurry of nondendritic microstructure directly from a controlled partially solidified melt in one single step, and thixoforming, which involves processing the melt in a separate stage, solidifying the melt completely, and then reheating the slugs back into the semisolid state, followed by the forming operation [1,2,3,4].
Recently, SSP has also been categorized into two further processes according to the solid fraction content of the slurries: the high solid fraction process with about 40–60% of solid, and the low solid fraction process with around 5–20% of solid [5]. The thixoforming route belongs to the high solid fraction processes, while most of the rheocasting routes used, such as the gas-induced semisolid (GISS) rheocasting [6], new rheocasting (NRC) [7], air-cooled stirring rod (ACSR) process [8], forced convection stirring (FCS) [9], and so forth, are low solid fraction processes. Several low solid fraction rheological high pressure die casting (Rheo-HPDC) processes have been industrialized, producing high volume products with substantial reduction of internal porosity and improved mechanical properties of parts compared to conventional HPDC [10]. Nevertheless, due to the turbulent flow of the low solid fraction slurries in high-pressure die casting, porosity is still a problem in these castings [11] and could lead to blistering after full heat treatment [12]. Clearly there are still challenges in producing high-quality structural parts using low solid fraction Rheo-HPDC processes. However, in high solid fraction die casting, the slurry flows in a laminar manner, resulting in near porosity-free castings of sound mechanical properties and high quality, like structural parts for the automobile industry, an industry with high demands on mechanical properties as well as elongation [13,14,15]. Yet, thixoforming is not very competitive because it involves a high premium in feedstock preparation due to extra processing steps like magnetohydrodynamic stirring (MHD), and in addition, the material cannot be directly recycled [16,17,18].
The Swirled Enthalpy Equilibration Device (SEED) technology is a rheocasting process that is able to produce high solid fraction slurries, as shown schematically in Figure 1. In the past decade, SEED has already been well demonstrated as a commercially viable technology for producing semisolid parts of high integrity, sophisticated geometry, and complex contours, as well as improved mechanical properties [19,20,21]. The quality of the parts is comparable to thixoformed parts. At present, the aluminum alloys used in industrial applications employing the SEED technique for producing the feedstock are almost exclusively 3XX casting alloys and these alloys cannot respond to the challenge of the growing market demand for higher performance requirements. Considerable investigations on how to commercialize thixoforming of high-performance alloys including 2XXX, 6XXX, and 7XXX wrought alloys and high-strength 2XX cast alloys with impressive mechanical properties have been carried out and the results published [2,18,22,23,24,25], indicating that these alloys are possible candidates for alternative high solid fraction processes like the SEED process.
A major challenge of semisolid processing high-performance alloys is that these alloys tend to have a high solid fraction sensitivity between 0.4 fraction solid and 0.6, which makes slurry preparation very difficult in practice. Several studies conducted on semisolid slurry preparation of attractive alloys, such as high-strength alloy 206 and wrought alloy 6061, used the SEED technique on an R&D basis with promising results reported [21,26]. However, further technical improvements and more work on high-performance alloys are deemed necessary for possible commercial exploitation of the SEED process. For example, the temperature distribution and evolution within the melt during the SEED process, which are important factors for semisolid processability of high-performance alloys, and improvement of microstructure uniformity of slurries must be fully studied for a range of candidate alloys to provide consistent and reliable property databases, as well as further understanding of the microstructure formation mechanism of the SEED process.
The primary aim of this study is to develop a modified SEED process to improve the quality of prepared semisolid slurries and the processability of high-performance alloys, improving the SEED technique on an R&D basis. A201 aluminum alloy was chosen as the model material and its semisolid process window was analyzed. The cooling behavior and microstructure of A201 slurries during the standard, as well as the modified, SEED process were investigated and the microstructure formation mechanism of the SEED process was also discussed.

2. Materials and Methods

2.1. Material and Thermodynamic Analyses

The chemical composition of the A201 alloy adopted in this study was measured by using optical emission spectroscopy (OES, SPECTRO, Kleve, Germany). The nominal composition of the alloy is also given in Table 1 for comparison. The relationship between the liquid mass fraction and temperature of the A201 alloy was determined by DSC (differential scanning calorimetry) analyses. The calorimetric tests during the solidification of the A201 alloys were performed in an argon atmosphere with cooling rates of 1, 5, 10, and 15 K/min. The tangent method (TM) was used to determine the solidus and liquidus temperatures at different cooling rates. The heat flow vs temperature curves were adopted to calculate the liquid fraction vs temperature curves by integrating the heat flow curves. The effects of cooling rate on the semisolid processing window of the A201 alloy were discussed. Thermodynamic predictions for the A201 alloy were carried out using the Thermo-Calc software package (version 2019a, Thermo-Calc Software, Solna, Sweden), combined with database TCAL5. Both Scheil and Equilibrium models were adopted in this work. According to the Equilibrium model, the solute completely diffuses following the lever rule during solidification, while using the Scheil model, it is assumed that there is no back diffusion of solute in the solid phase.

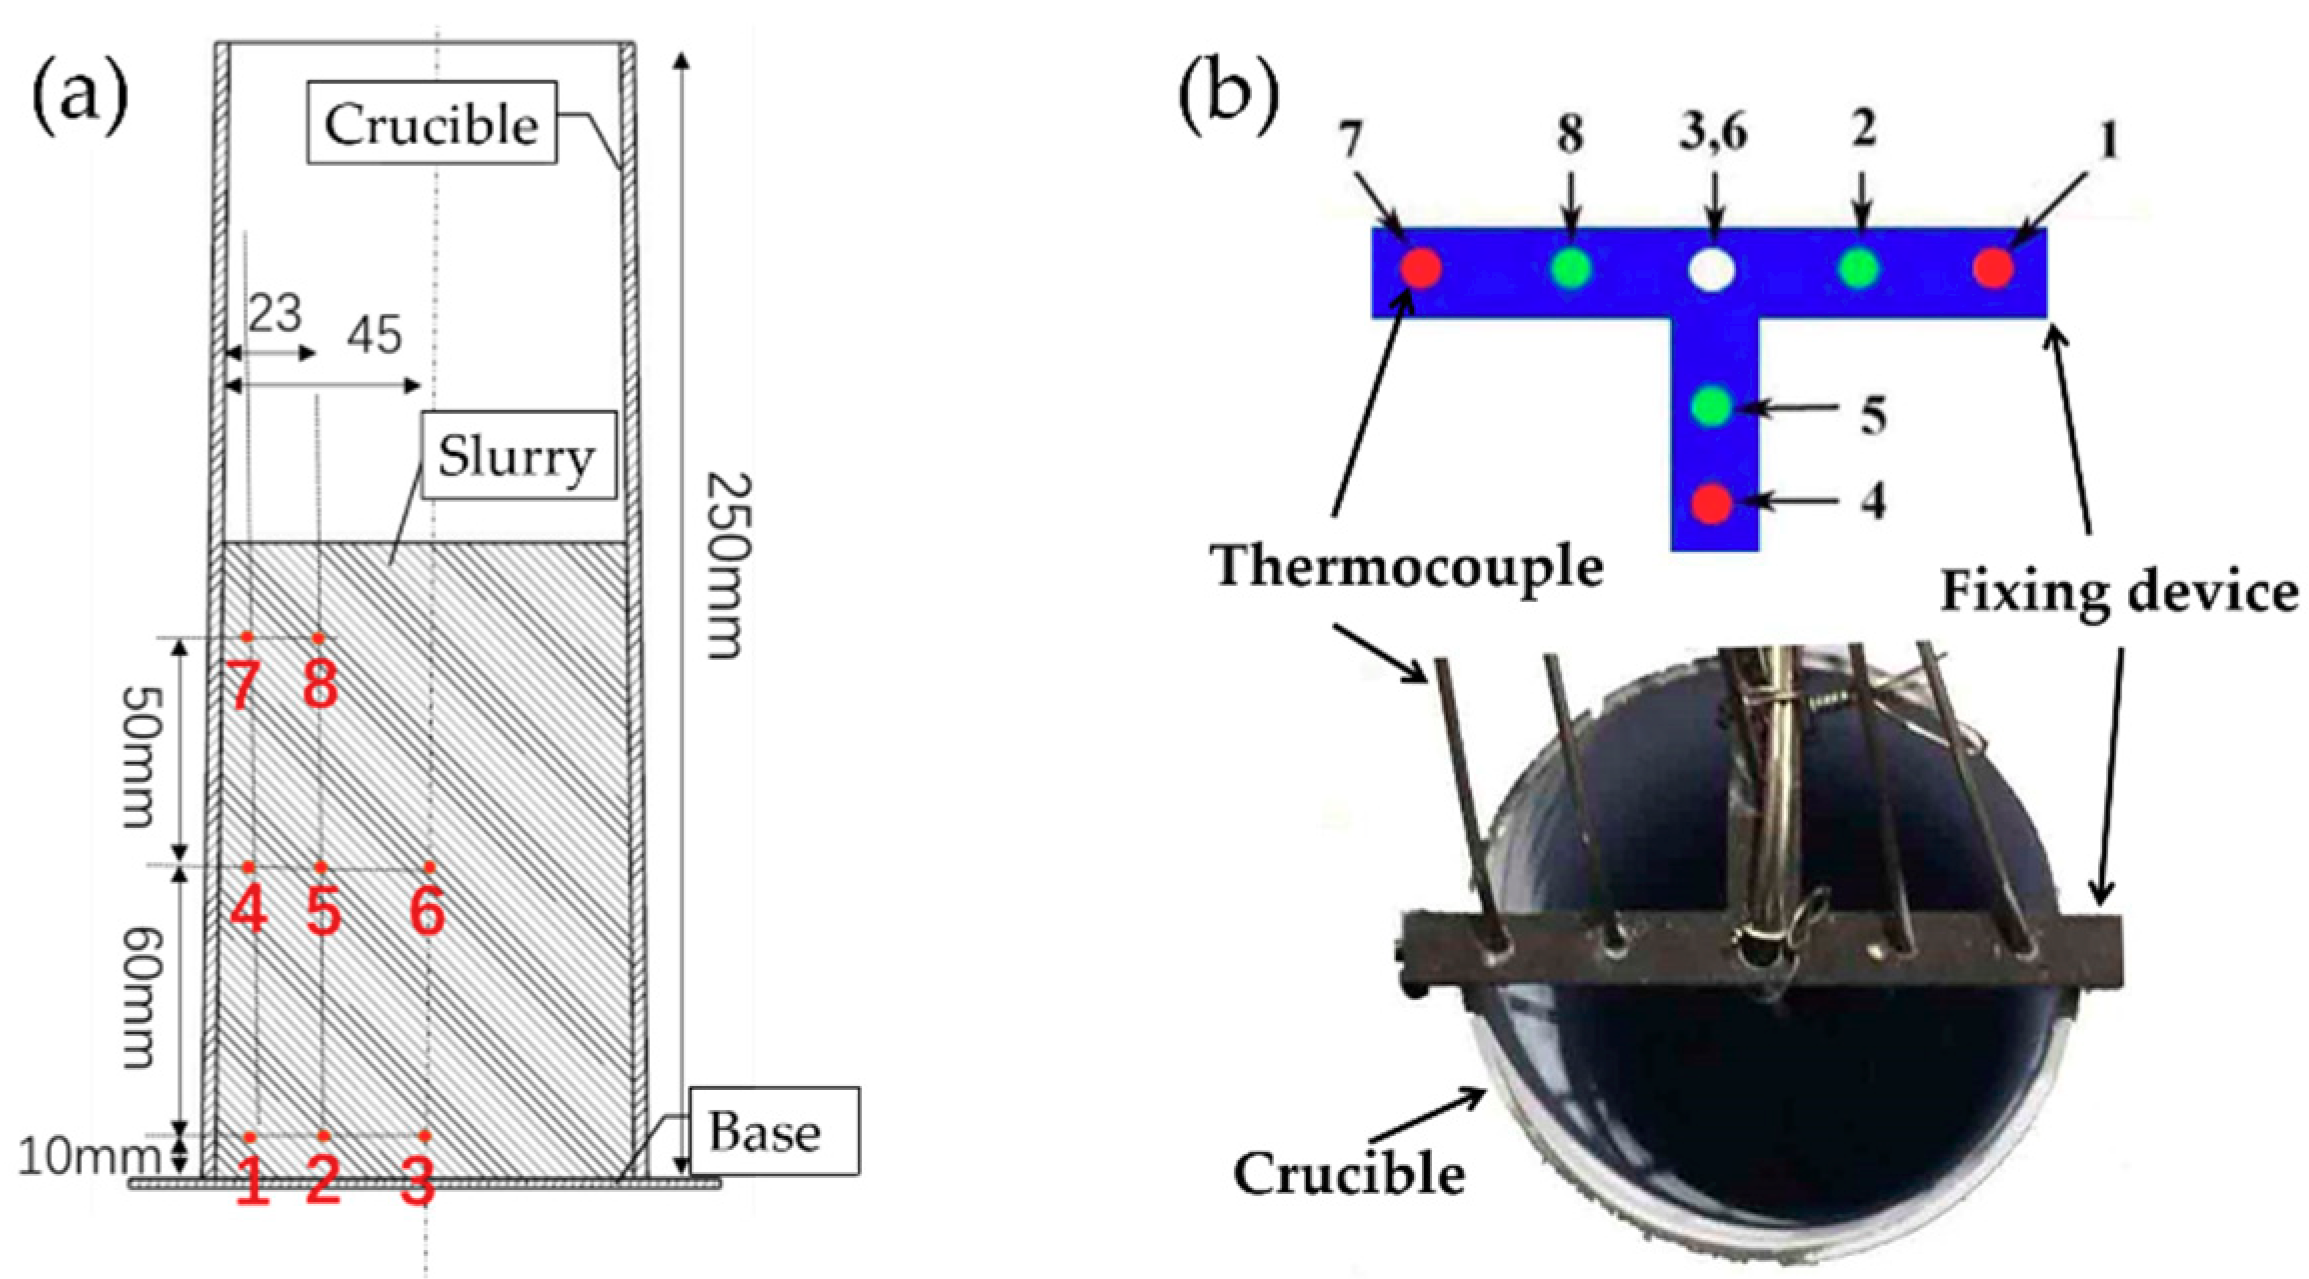
2.2. Slurry Preparation and Temperature Data Collection

A201 ingots were melted in a 50 kg capacity graphite crucible using an electric resistance furnace at the temperature of 720 °C. After spinning rotor degassing and drossing, the molten alloy was cooled to 690 °C. The molten alloy was poured carefully at different temperatures into tilted crucibles (Figure 1a). The crucibles used in this study were 90 mm in diameter and 250 mm in depth, as shown in Figure 2a. The mass of the melt poured was about 2.7 kg in each test. After pouring, the molten alloy was swirled immediately using the SEED process (Figure 1b). After swirling for a certain time, the semisolid slurry was demolded from the crucible (Figure 1c).
For temperature–time history data collection, eight K-type thermocouples were placed in the crucible prior to pouring and the data were collected by a temperature recorder. The positions of the eight measured points for the melt temperature are illustrated in Figure 2a. A specially designed fixing device was used to ensure that the eight thermocouples were fixed in the crucible during swirling, as seen in Figure 2b.

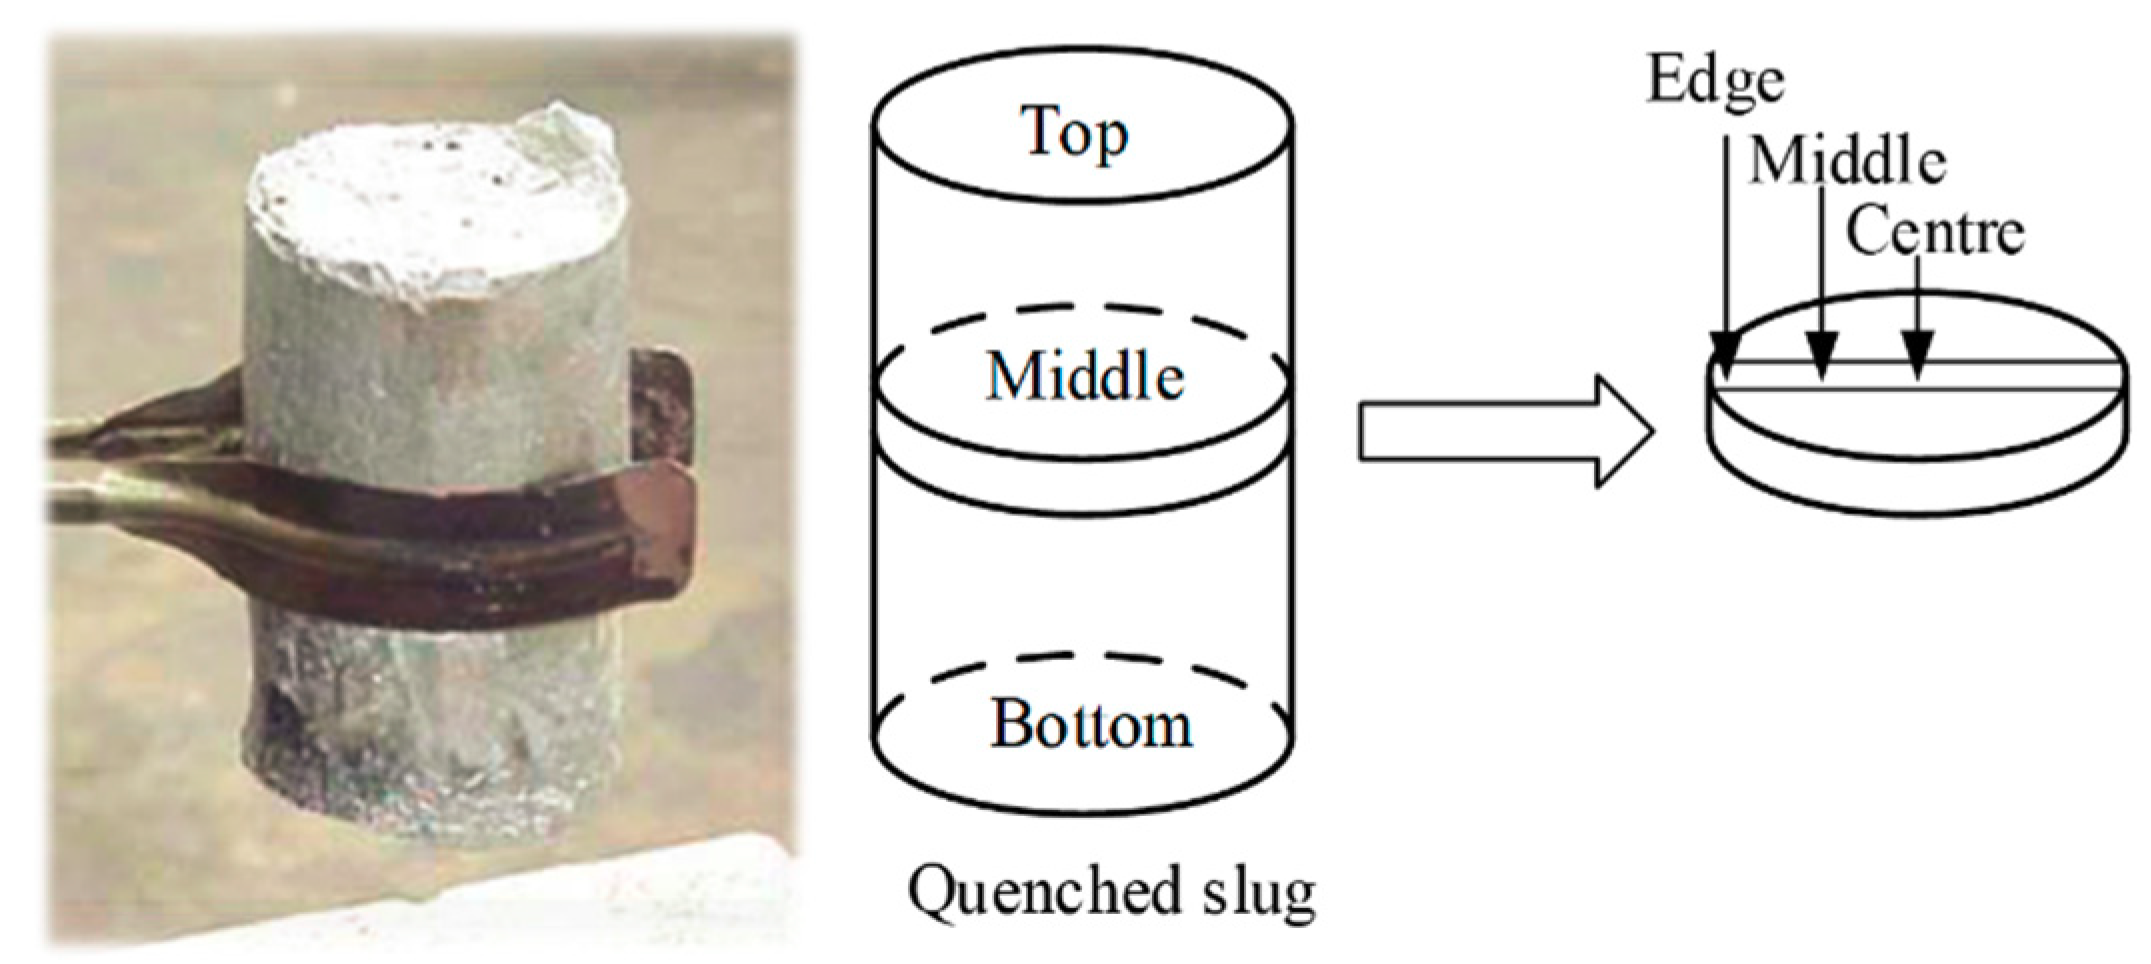
2.3. Microstrucutral Observations

For microstructural observations, the prepared slurries were water quenched promptly. Metallographic samples were then cut from the middle slice of the quenched slugs. As shown in Figure 3, the microstructures at the positions across the radius were examined. A color metallographic technique was used to identify the primary α-Al grains. The samples were ground and polished using standard metallographic procedures and then electrolytically etched in a 2.5 vol.% HBF4 solution for 130 s at a constant voltage of 20 V. The microstructures were observed and photographed using a Carl Zeiss optical microscope equipped with a polariscope. The Intercept Procedure was used to measure the average grain size of the primary α-Al, according to ASTM E112. The shape factor of the grains was calculated using the formula:   Shape   factor = 4 π A r e a / P e r i m e t e r 2 , where a shape factor of 1 indicates a completely spherical particle.

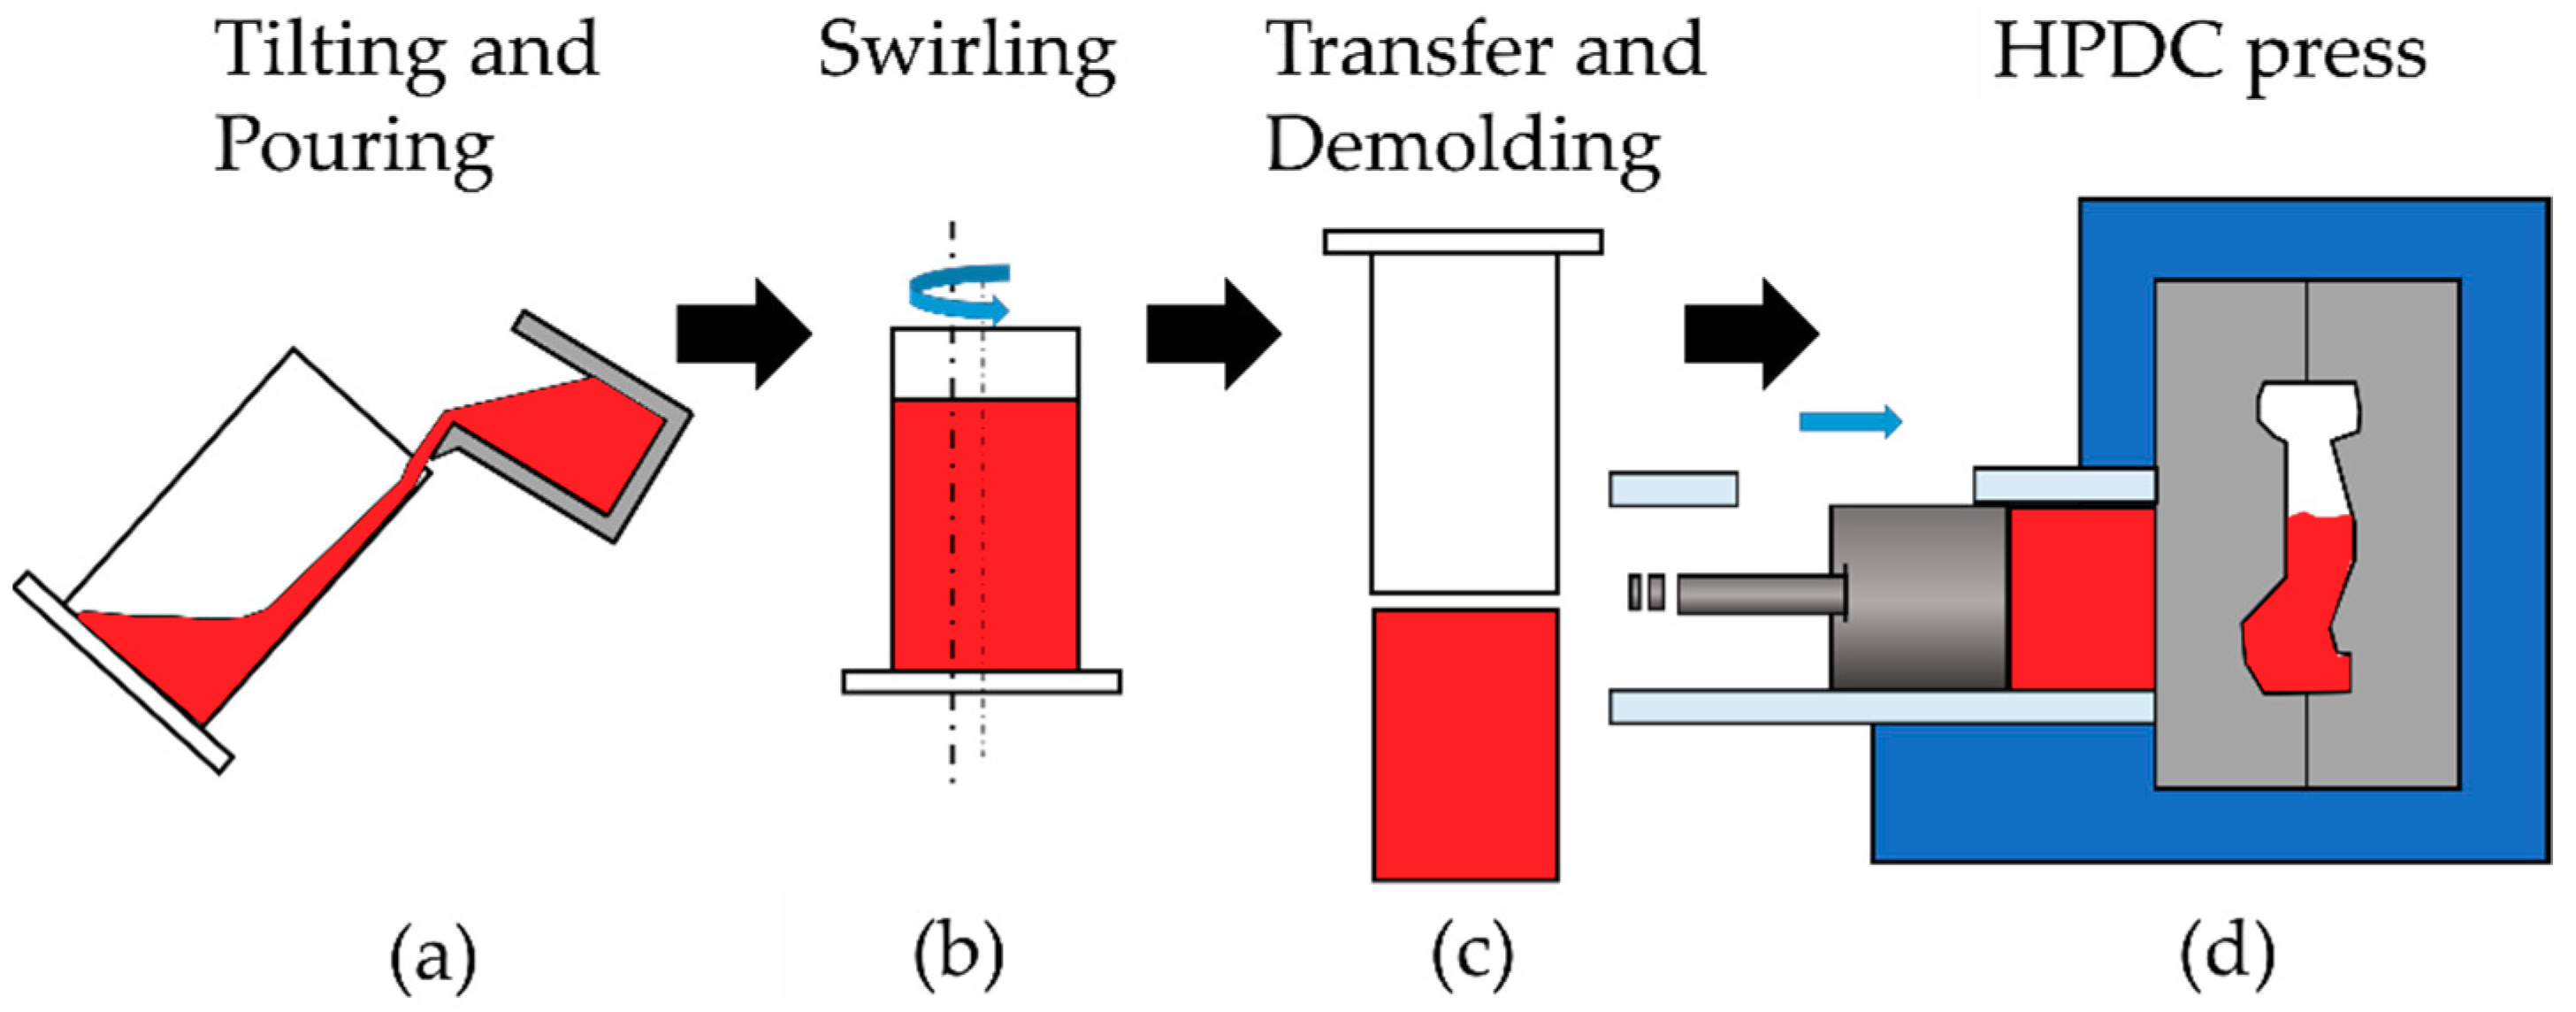
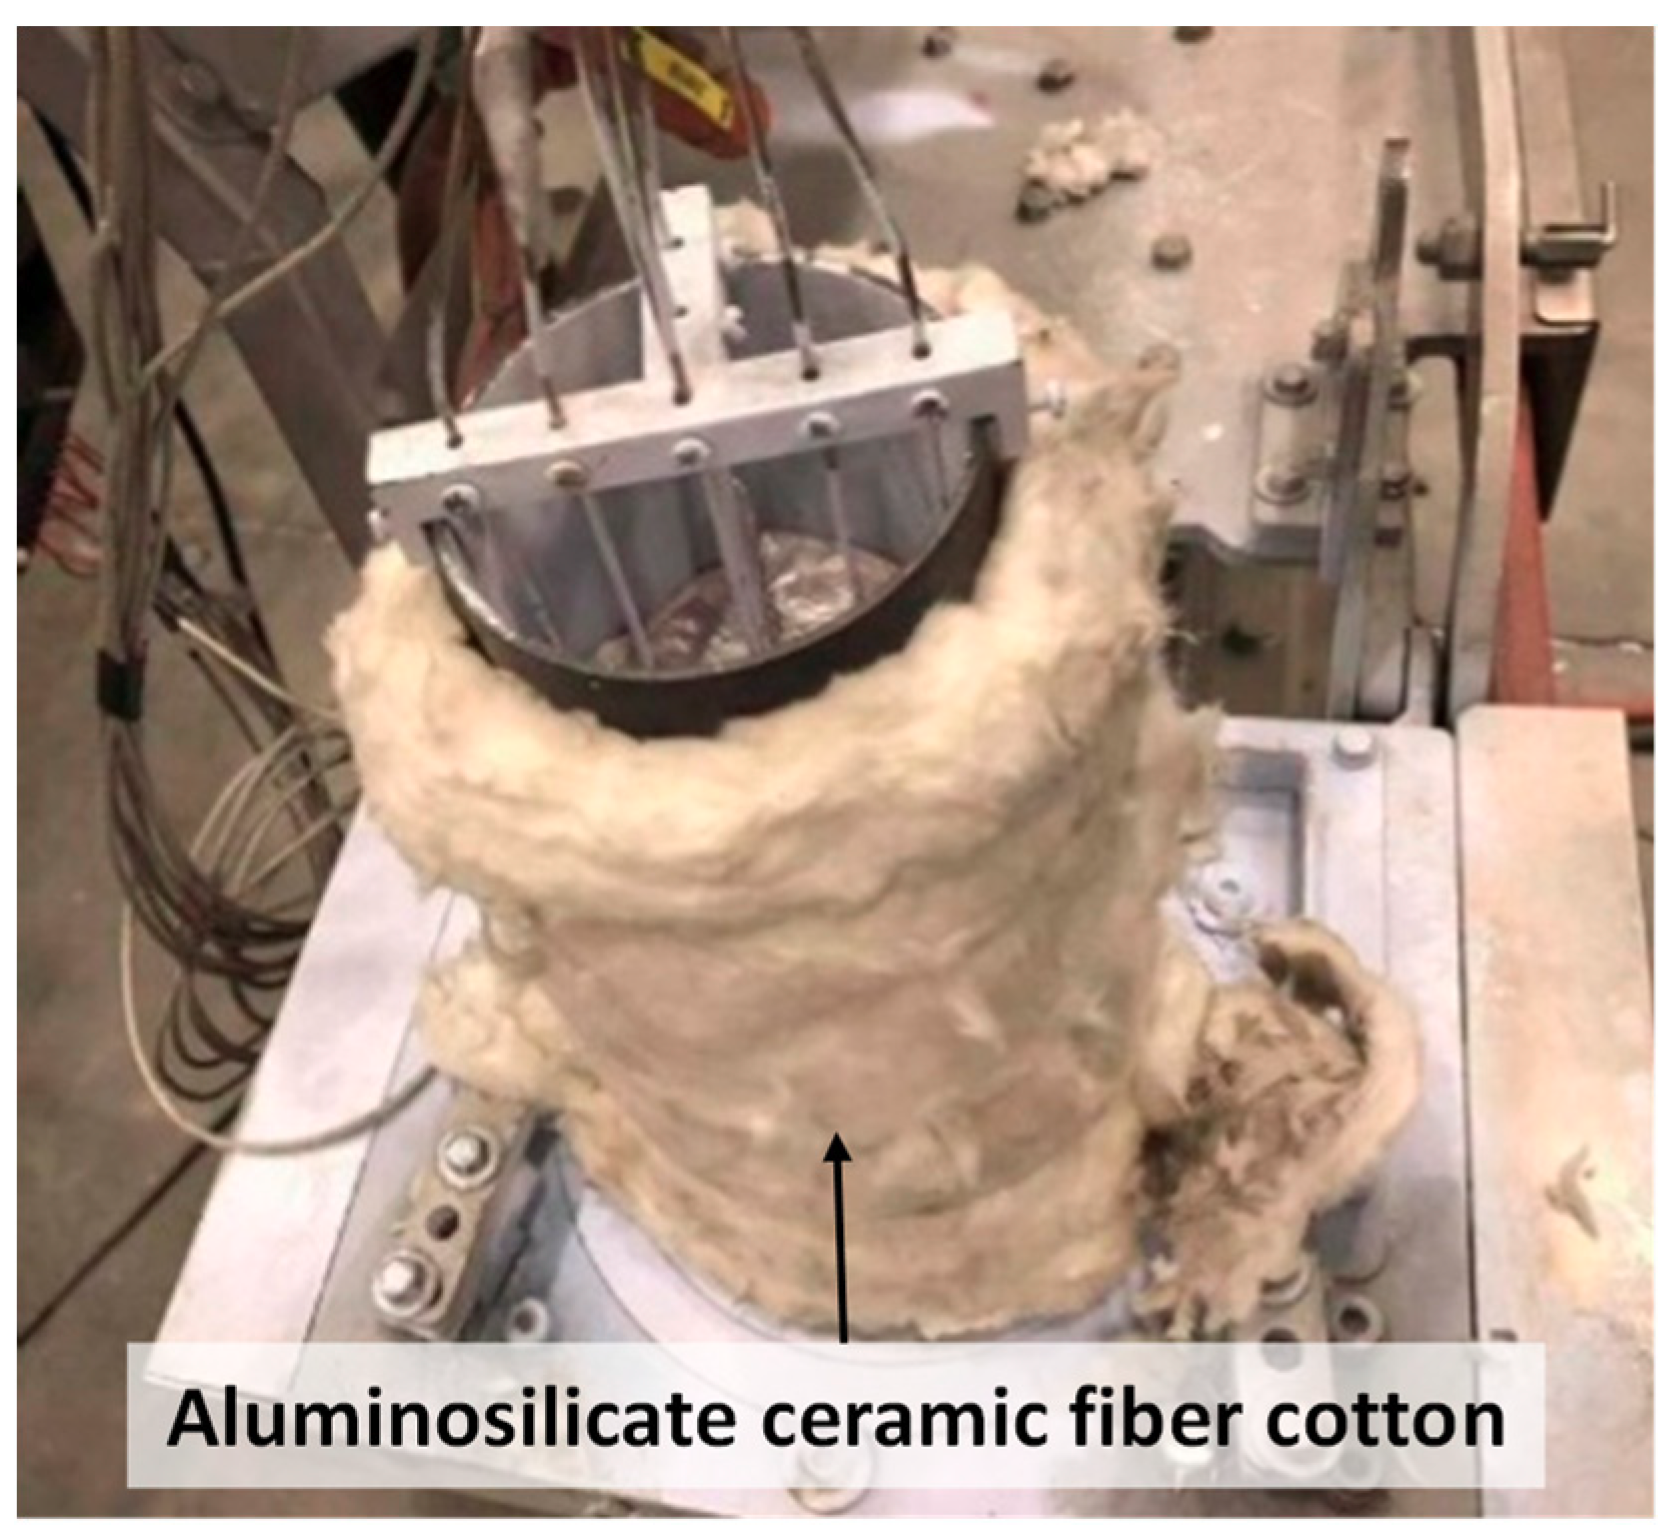
2.4. Modification of the SEED Process

In order to improve the processability of A201 semisolid slurries, the SEED process was modified by having the crucible wall wrapped around by aluminosilicate ceramic fiber cotton to reduce the rate of heat loss in the slurry preparing system, as shown in Figure 4. The detailed reasons for this modification are discussed in Section 3.1. The cooling behavior and microstructures of the slurry in the modified SEED process were investigated using the same procedures as with the standard SEED process, as described above.

3. Results and Discussion

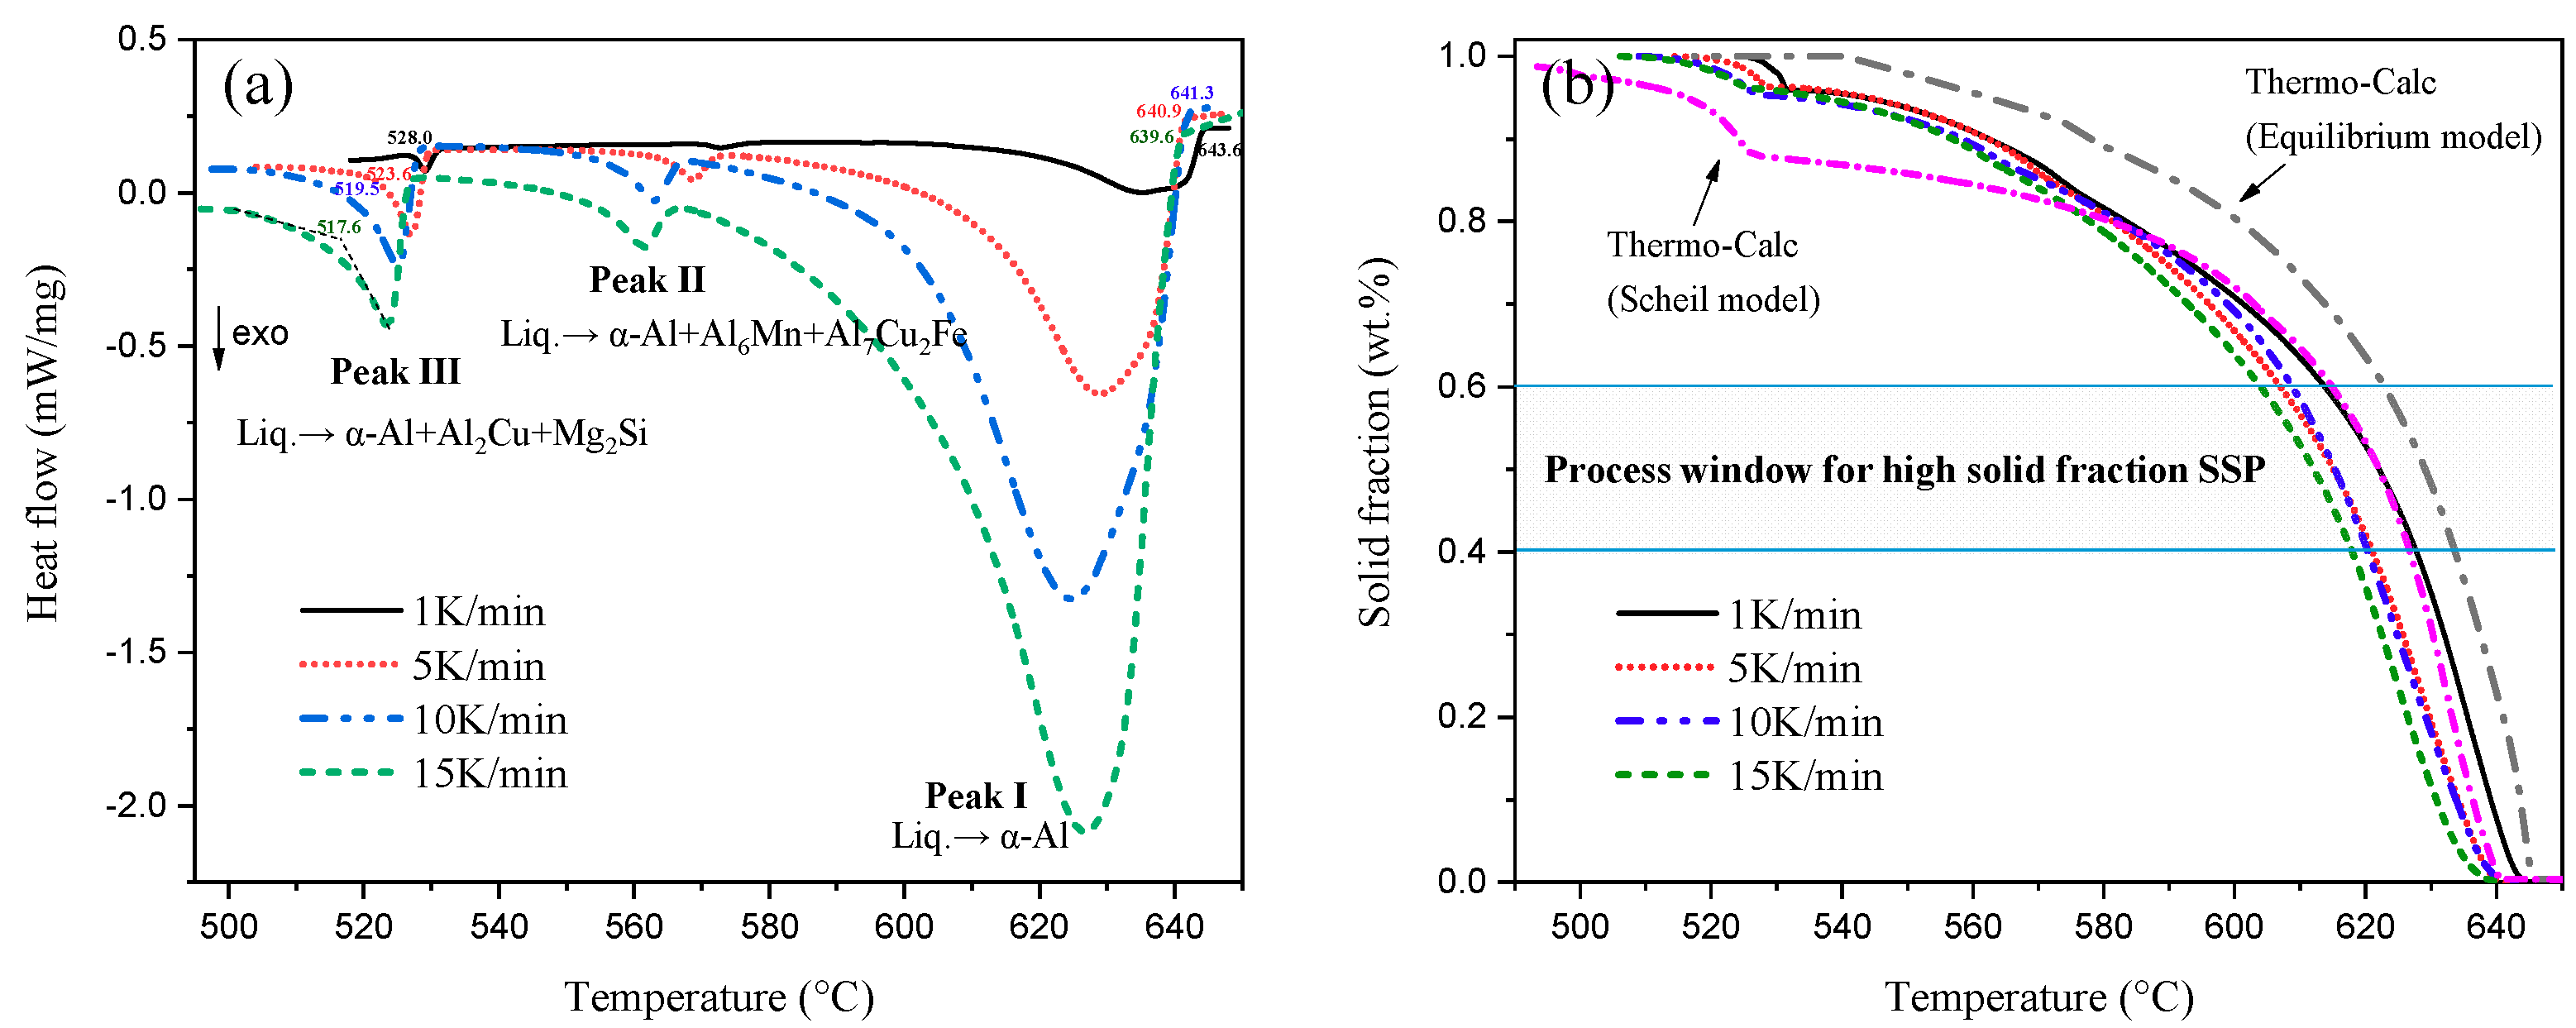
3.1. Process Window of A201 Alloy

Taking into account that the rheo-manufacturing routes involve controllable cooling from the liquid state into the semisolid temperature range, the solidification behavior of the A201 alloy was analyzed by DSC tests. The heat flow curves of A201 at different cooling rates are shown in Figure 5a. There are three distinct peaks observed at all the heat flow curves. According to the thermodynamic prediction based on the Scheil model, the phase transformations were identified and are illustrated. With increasing cooling rates, the temperature of the heat flow peaks slightly decreases, indicating an increase in the solidification interval. The solid mass fraction curves were further derived based on experimental measurements; thermodynamic predictions are also presented for reference. In general, the “process window” refers to a temperature range for a given solid fraction of the slurry that is suitable for semisolid forming; for high solid fraction rheoforming, slurries containing between 0.4 and 0.6 solid are usually preferable [27]. The process windows of A201 alloy at different kinetic conditions as well as the assumptions are listed in Table 2. As discussed above, the solidification interval increases with increasing cooling rate, while the temperature window for solid fraction from 0.4 to 0.6 keeps relatively constant as compared with the variation of the solidification interval. The targeted solid fraction window is obtained within the transformation of peak Ⅰ where the primary α-Al precipitates from the melt. The kinetic behavior of the alloying elements at this stage has practically no effects.
Kazakov [28] firstly identified the slope of liquid fraction curve dfL/dT as a key parameter for assessing the processability of semisolid slurries (i.e., the ability to practically control the liquid fraction within semisolid state). Lower values of dfL/dT indicate less liquid fraction sensitivity to temperature variation and thus it is easier to practically hold the liquid fraction at a desired level by temperature control. Atkinson et al. [29] have further suggested that the temperature sensitivity of liquid should be less than 0.03 K−1 in order to ensure acceptable processability. For the A201 alloy, assuming that the liquid fraction vs temperature curve between 0.4 and 0.6 fraction liquid is a straight line, all the temperature sensitivities at different kinetic conditions investigated in the current study are below this criterion (see Table 2), indicating that the A201 alloy is a potential candidate material for semisolid processing.
In practice, during the SEED process, the exterior of the slug is chilled by the vessel, whilst the interior heat must be conducted out. This takes a finite period of time as the exterior is still solidifying. If the solid fraction in the outer “skin” exceeds 0.6, then the slug is likely to be too hard to be formed. Meanwhile, the interior temperature may not have decreased to a level such that the liquid at the center will not drip off when demolding. High temperature sensitivity renders the slurry preparation process difficult to control. The above thermodynamic analysis indicates that the cooling rate causes no obvious influence on the temperature sensitivity but extends the process time (i.e., swirling time in the SEED process), allowing longer time for heat transfer from the center to the edge of the slurry. The time windows for semisolid processing the A201 alloy at different cooling rates are listed in Table 2. In conclusion, reducing the rate of heat losses (i.e., cooling rate) in the slurry preparation system may improve the temperature uniformity of the slurry and improve the controllability of the SEED process in practice.

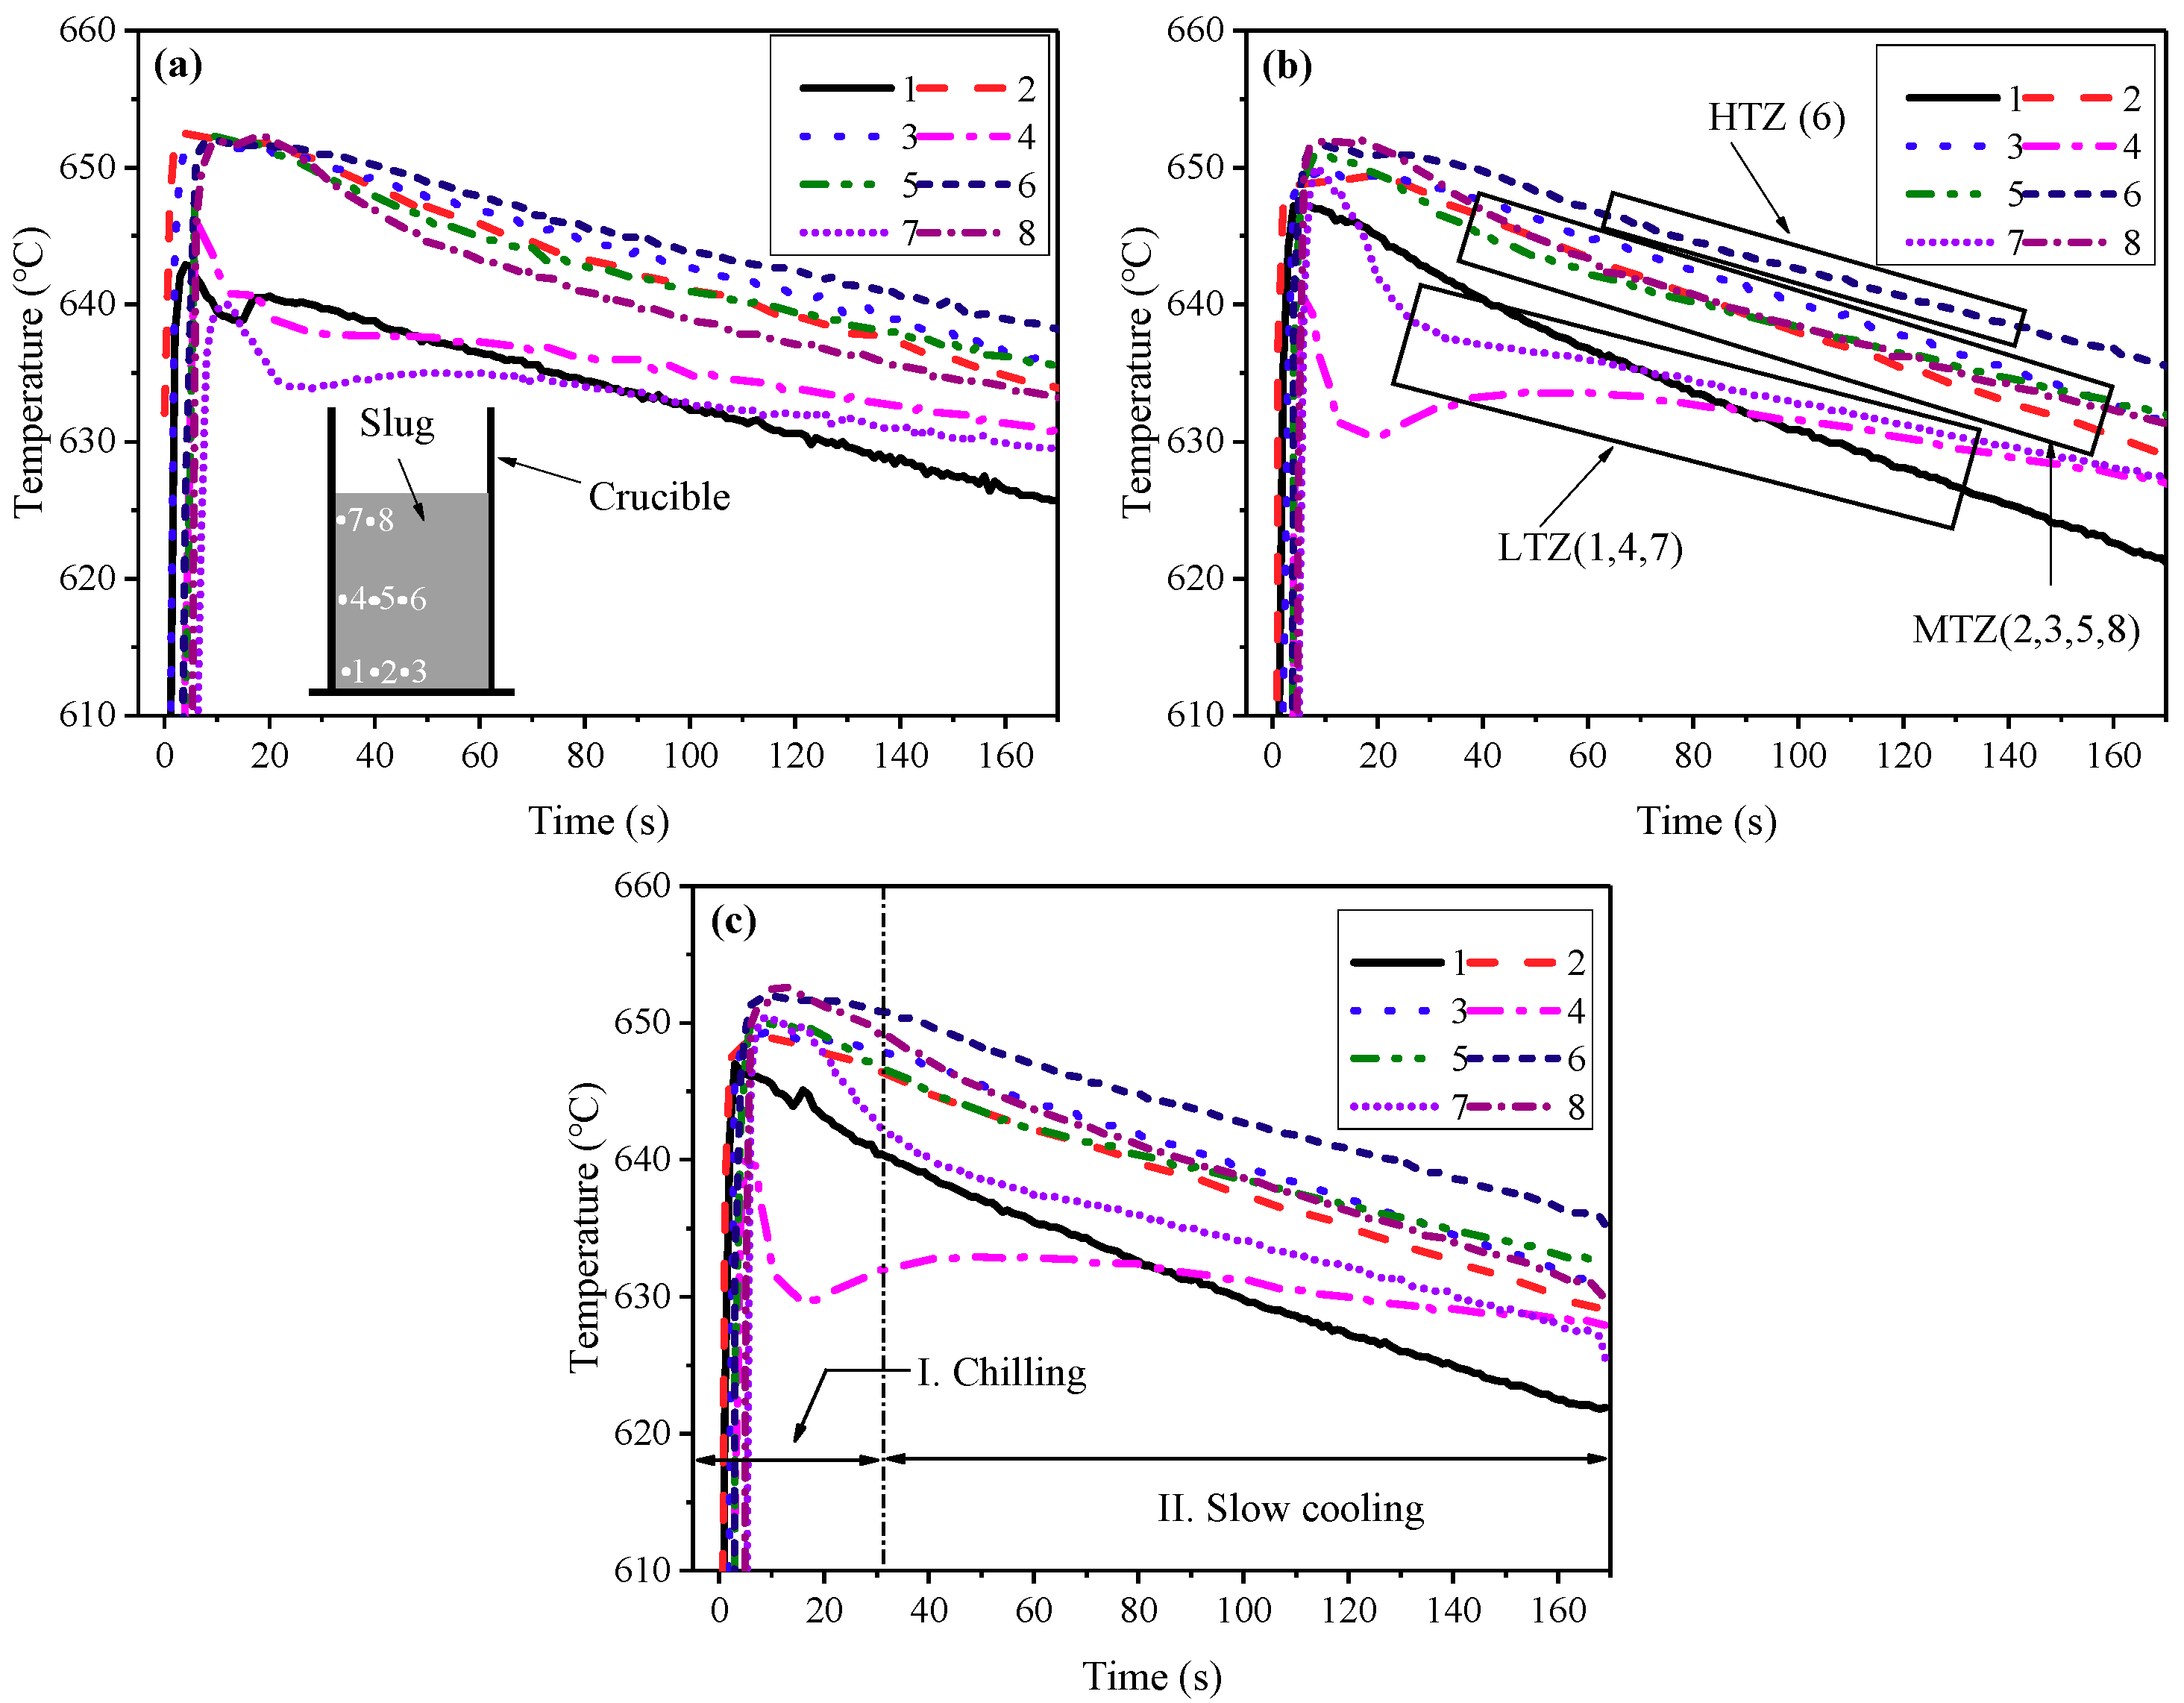
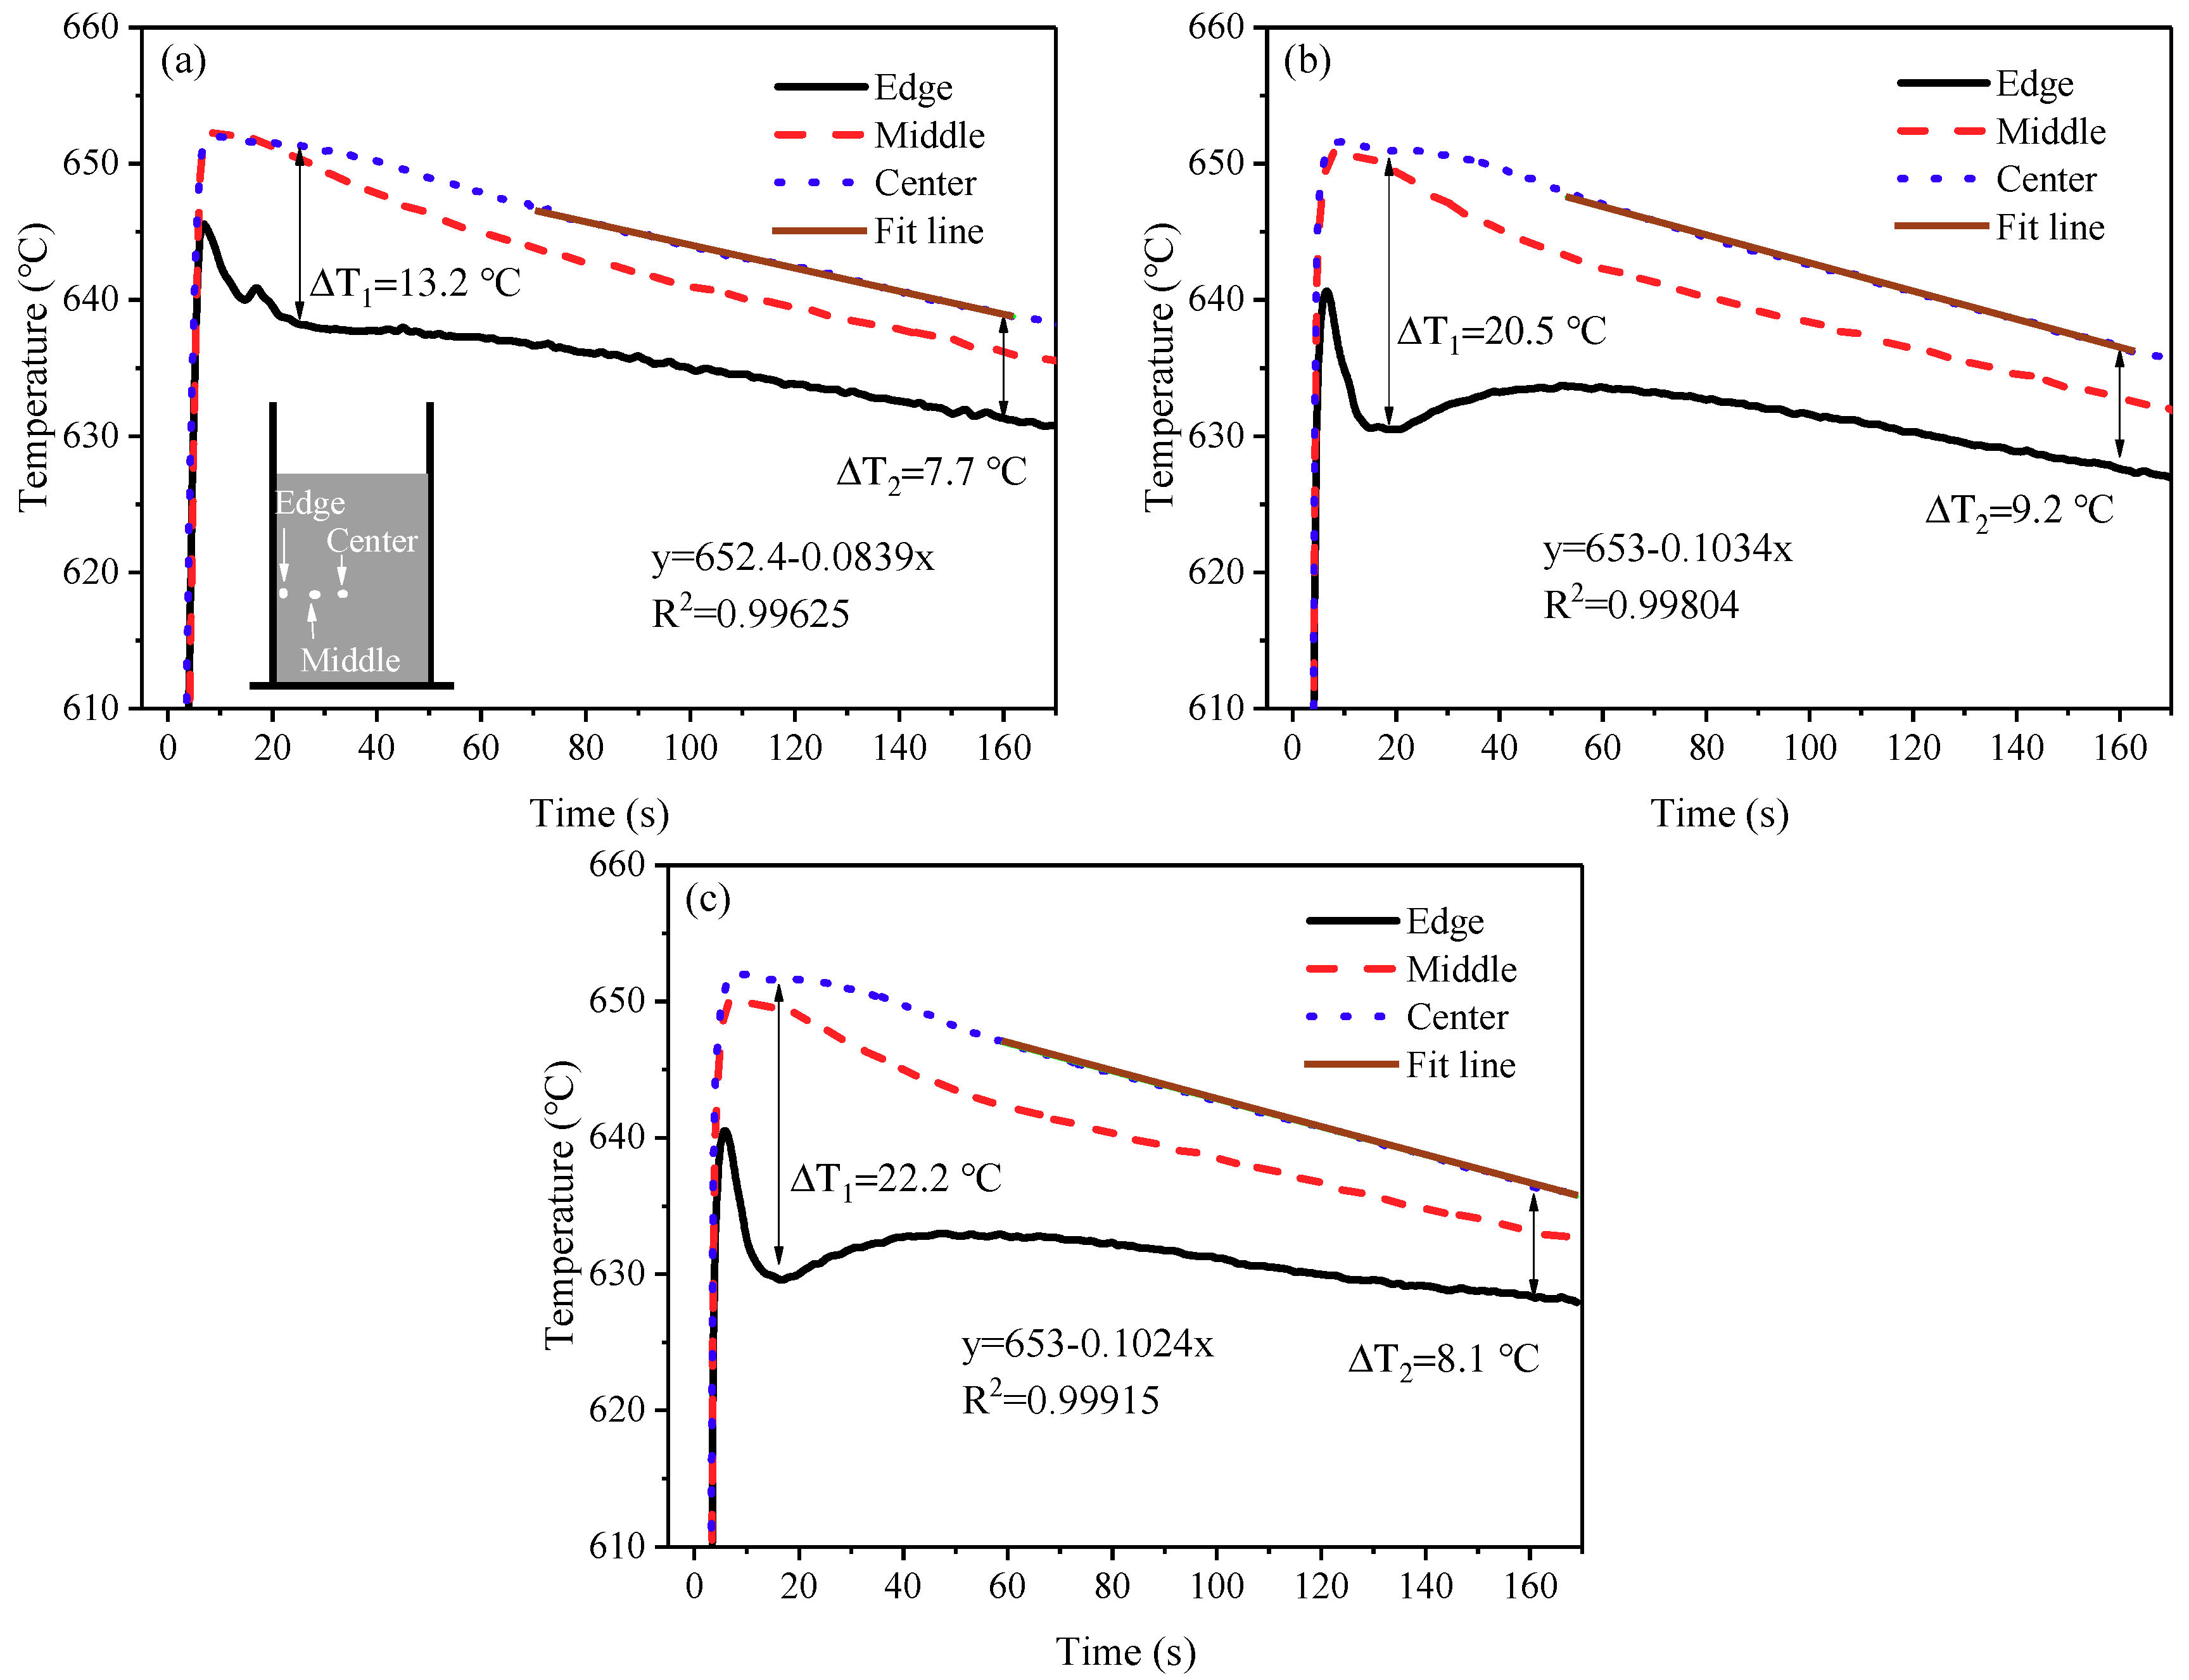
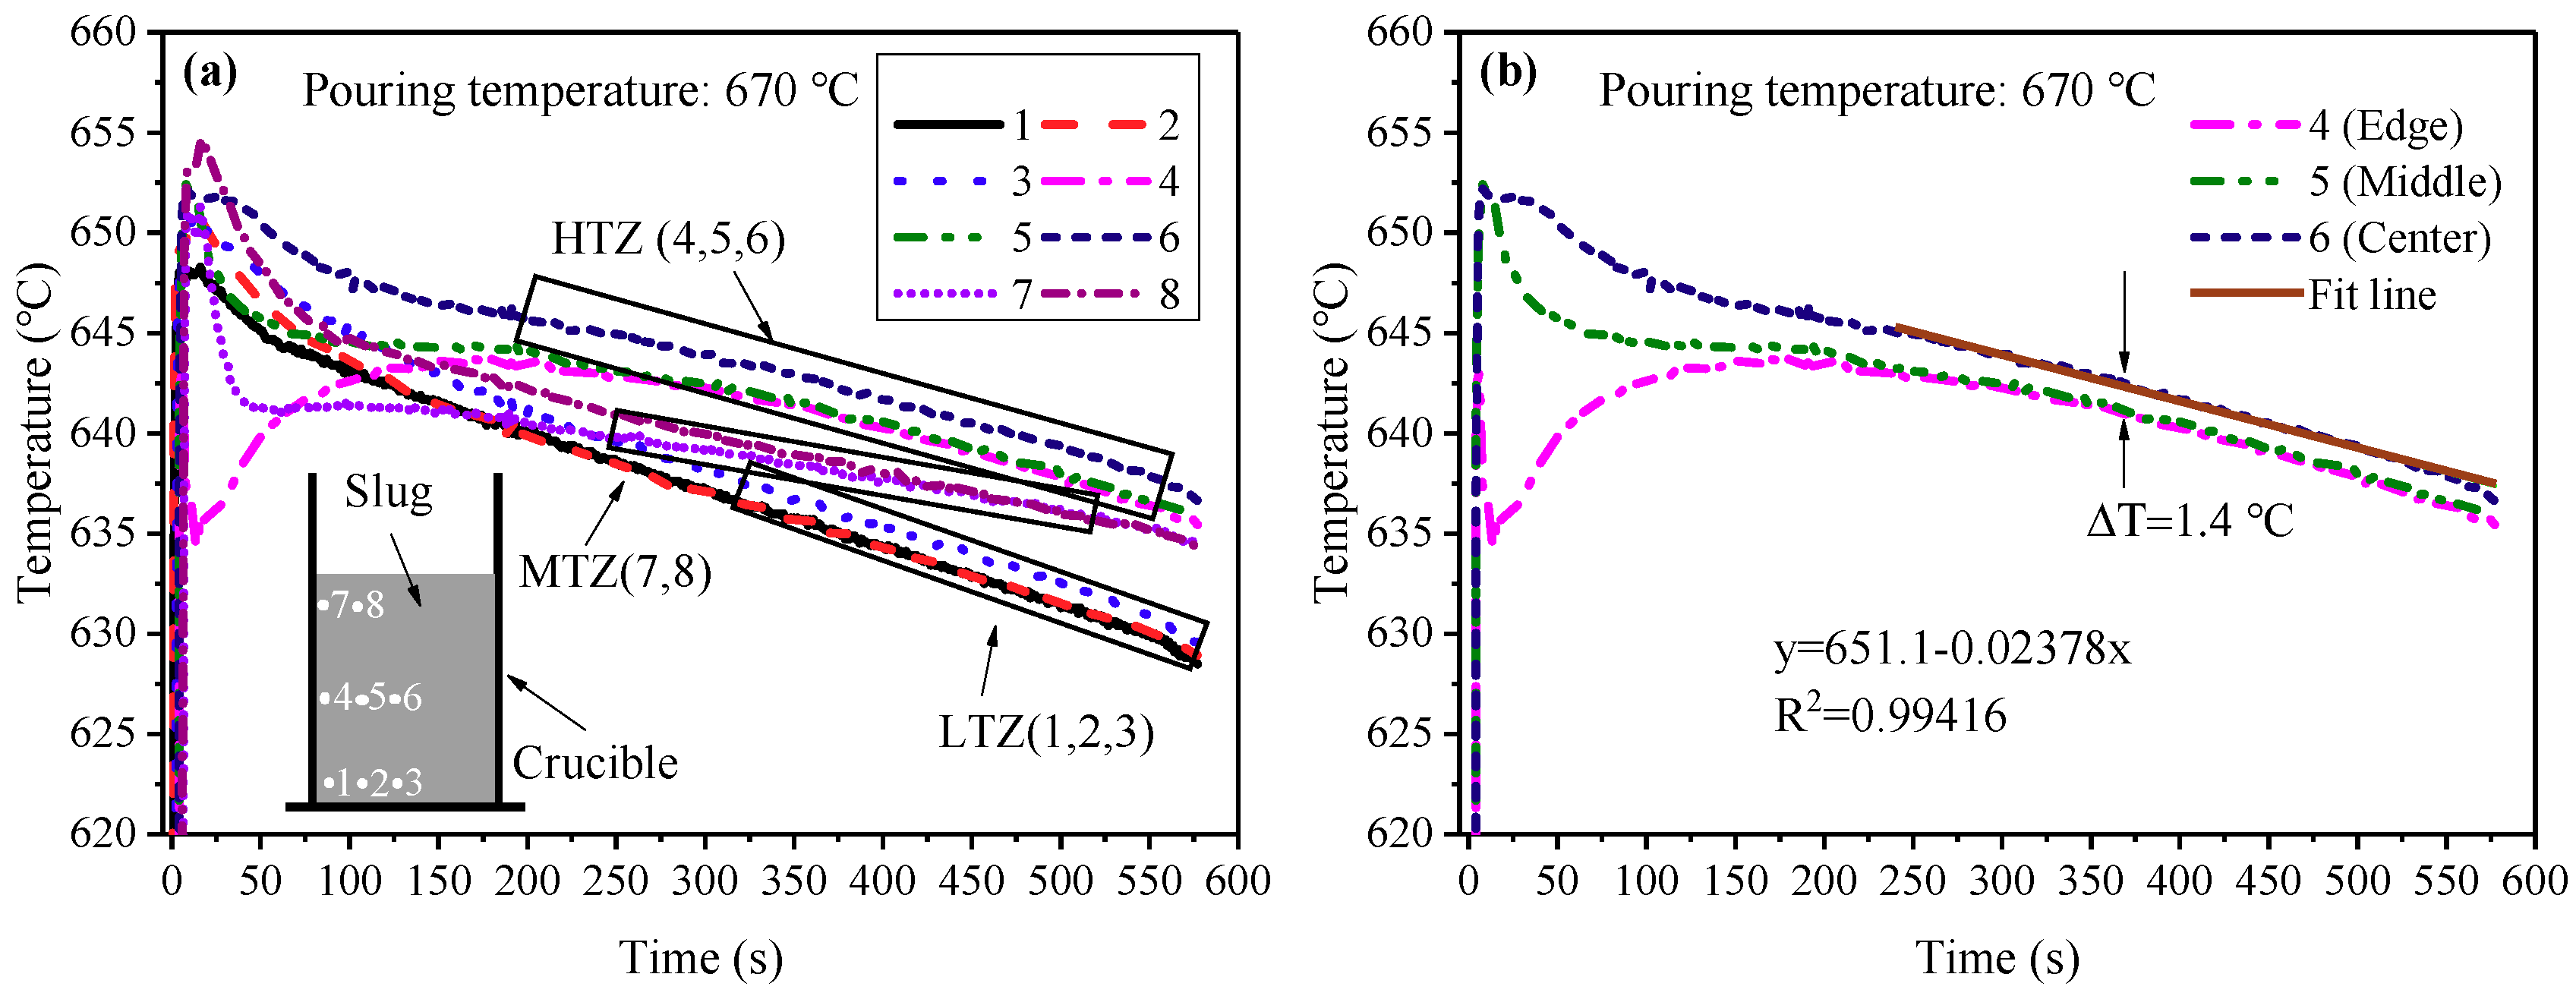
3.2. Cooling Behavior of the Slurry duing the SEED Process

Figure 6 displays the temperature vs time curves (cooling curves) for different positions of the A201 slurry during the SEED process at different pouring temperatures. It can be seen that the temperature field distribution in the slurry can be roughly divided into three zones according to the temperature of the melt at different positions: the low temperature zone (LTZ) (including positions 1, 4, and 7), the high temperature zone (HTZ) (including position 6), and the medium temperature zone (MTZ) (including positions 2, 3, 5, and 8), as depicted in Figure 5b. According to the evolution of the cooling curves of the melt, the process can be divided into two stages: the chilling stage and the slow cooling stage, as depicted in Figure 6c.
Once the superheated melt is poured along the crucible wall into the room-temperature steel crucible, the chilling stage begins. At this stage, the temperature drop of the melt is rapid due to the nonsteady heat transfer from the melt to the crucible. After about 30 s, the temperature decrease becomes slow and the process starts entering the slow cooling stage. The temperature of the LTZ decreases more slowly than that of the HTZ and the MTZ, gradually reducing the temperature difference between the LTZ and the HTZ (Figure 6b). However, the temperature of position 1 drops much faster than those of the other six positions; this is attributed to the fact that the crucible is fixed by a pair of metal clamps during swirling with the contact point of the clamps and the crucible being very close to position 1. The metal clamps that are connected to the rotating platform are virtually a heat transfer channel for the melt near position 1, accelerating the heat loss rate at this area. Using insulating material clamps instead of metal clamps should further improve the performance of the SEED equipment.
In order to analyze the temperature distribution of the melt in the radial direction and its evolution with time, the cooling curves of points 4, 5, and 6 were selected from Figure 6 and are drawn in Figure 7. The edge, the middle, and the center in Figure 7 represent positions 4, 5, and 6 in Figure 6, respectively.
Figure 7 reveals that as the pouring temperature decreases from 680 °C to 670 °C and 660 °C, the maximum melt temperatures at the center are substantially the same at about 652 °C, while the minimum melt temperature of the edge at the chill stage decreases gradually to 637.7, 630.5, and 629.5 °C, respectively, and the maximum temperature difference between the edge and the center gradually increases to 13.2, 20.5, and 22.2 °C, respectively. Within the initial stage of chilling, the temperature gradient from the edge to the center is large due to the temperature difference between the crucible and the alloy melt. With increasing cooling time, the radial temperature gradient of the melt initially decreases quickly and then gradually as the process enters the slow cooling stage. After 160 s, the temperature difference between the edge and the center decreases to 7.7, 9.2, and 8.1 °C, respectively. It can be seen that the cooling curve of the edge shows an inflection at the chilling stage, and that as the pouring temperature lowers, the inflection is more obvious. This is due to the heat transfer from the center to the edge of the slurry and the release of latent heat, the latent heat being released as the melt solidifies. The faster the solidification process, the faster the release of latent heat, and the more obvious the inflection is on the cooling curve. Compared with the pouring temperature of 680 °C, the inflection on the cooling curve is more obvious with the pouring temperatures of 660 °C and 670 °C, proving that a higher nucleation rate is obtained under lower superheat pouring.
It can also be seen from Figure 7 that the temperature at the slow cooling stage is basically linear with respect to time. Moreover, the slope of the linear equation is very low, about 0.08–0.1 °C/s, that is, the cooling rate of the slurry is low. It is therefore possible to control the temperature of the semisolid slurry by controlling the cooling time to obtain slurries with different solid fractions. However, for alloys whose solid fraction is sensitive to temperature changes, such as the A201 aluminum alloy, the controllable range of time is very narrow, because of the temperature difference between the edge and the center. This may occur even if the center temperature is high, but a thick solidified shell has already developed at the edge due to the prolonged cooling time. Therefore, for the A201 alloy, a good semisolid slurry can be obtained by lowering the pouring temperature and reducing the cooling time during the SEED process.

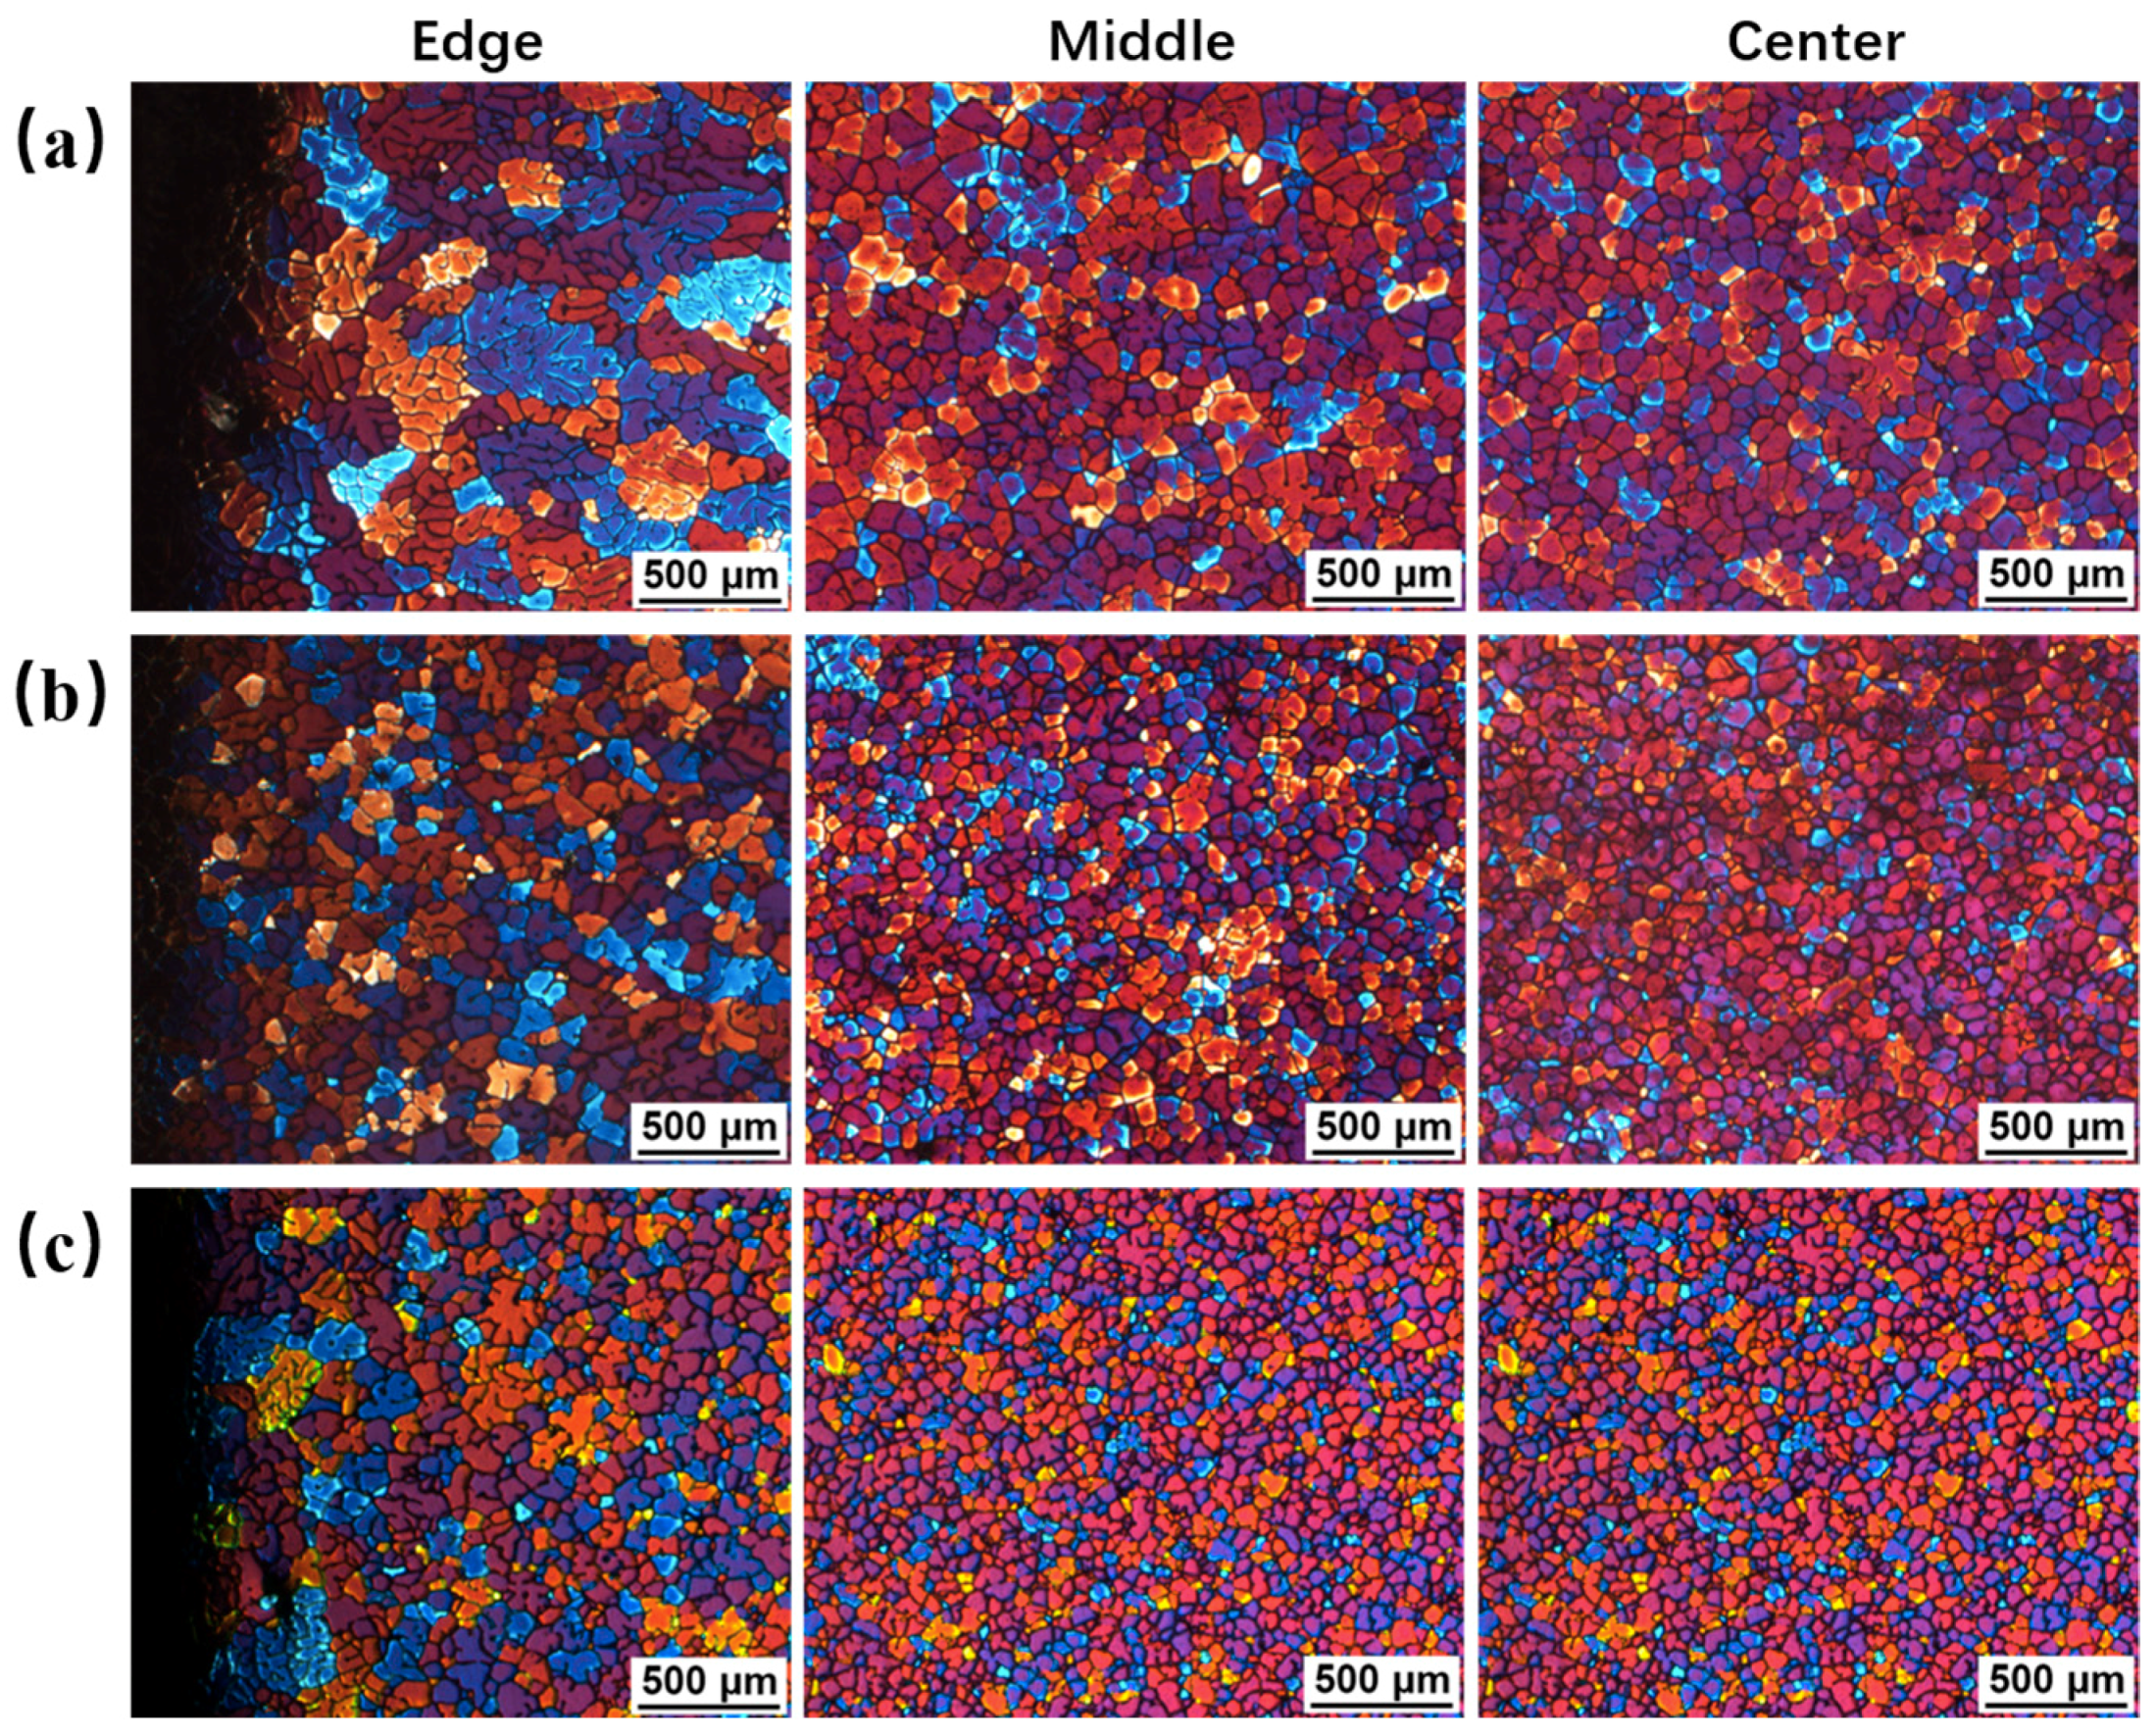
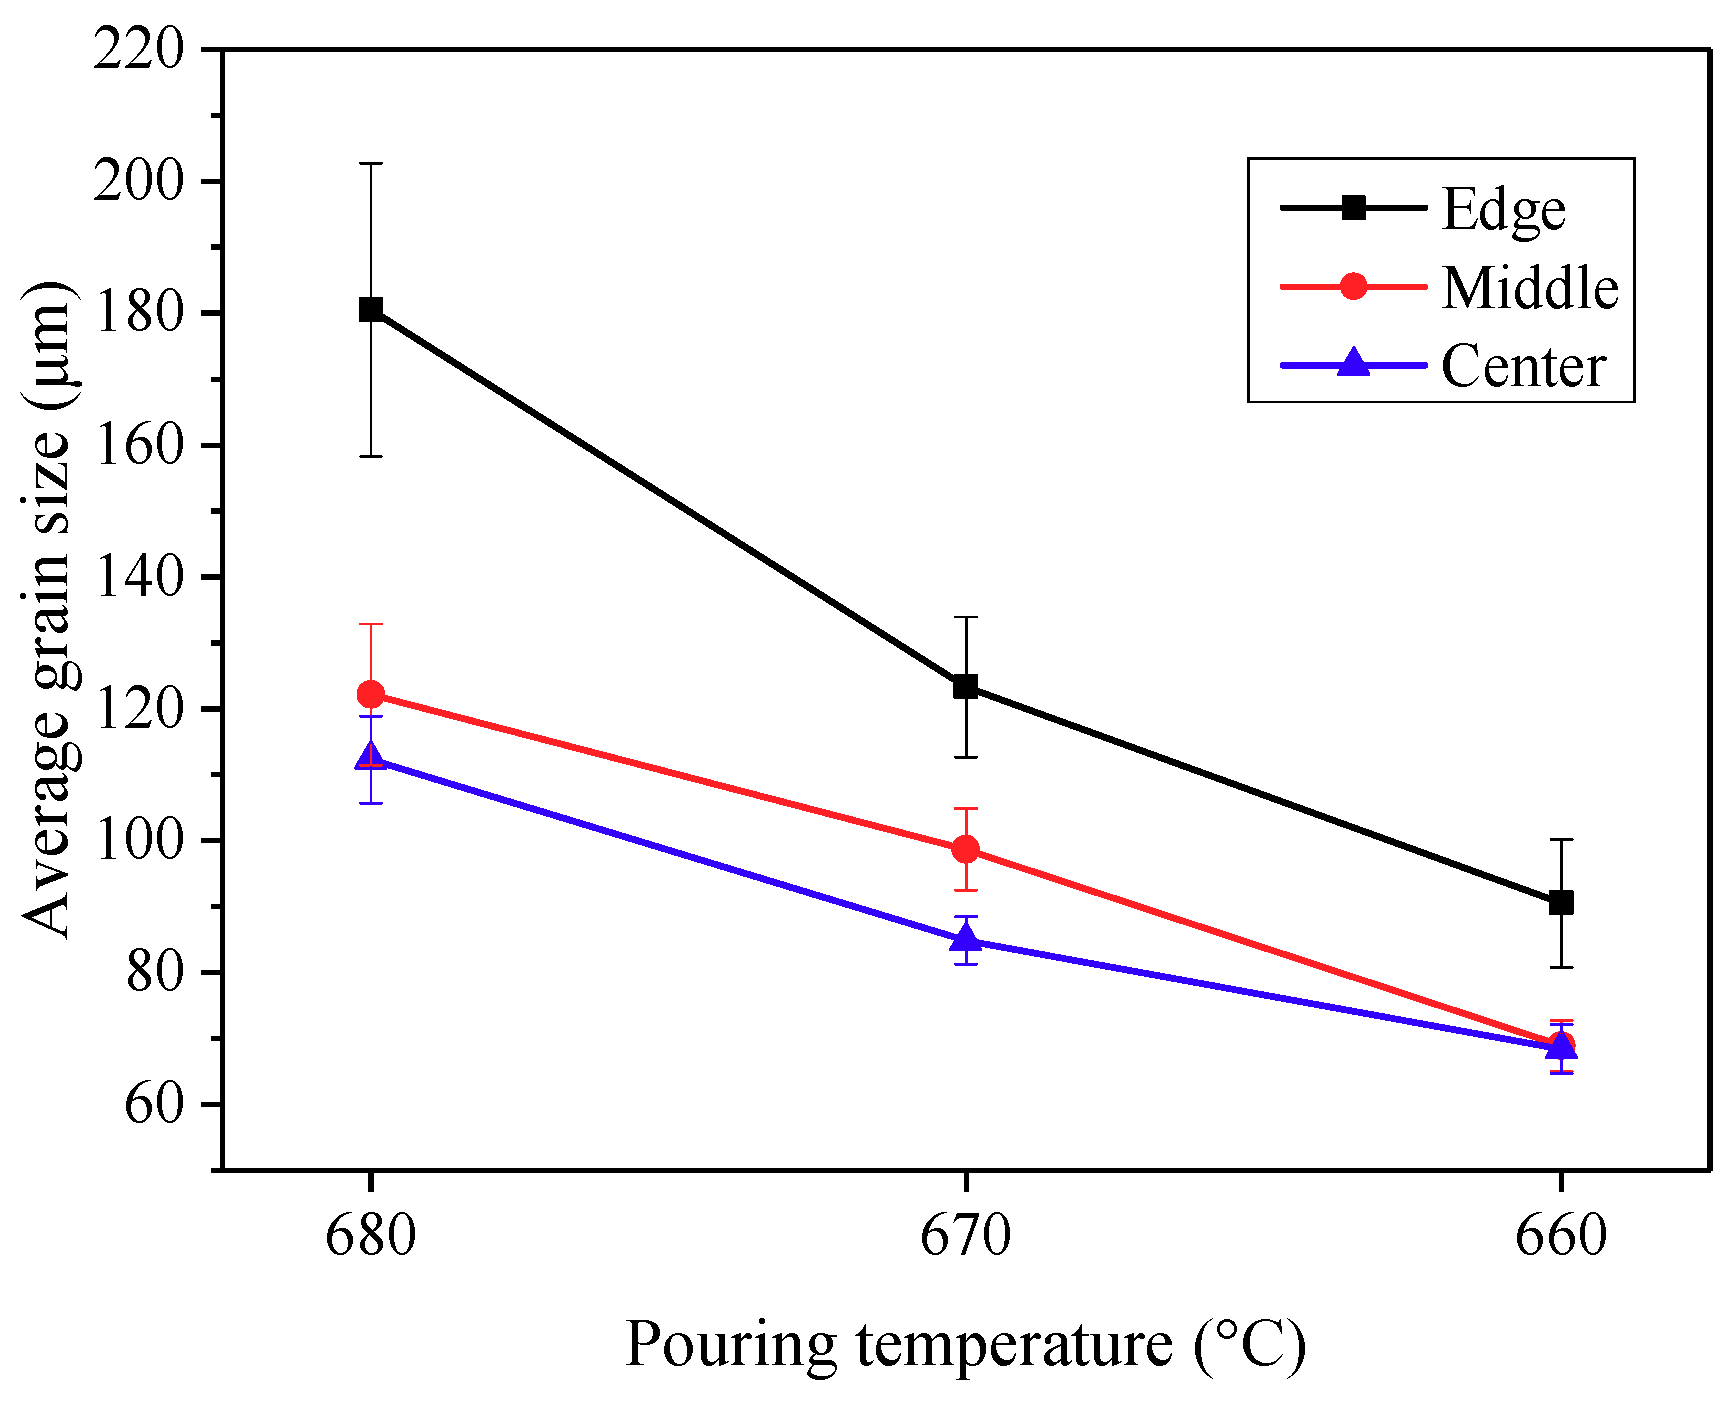
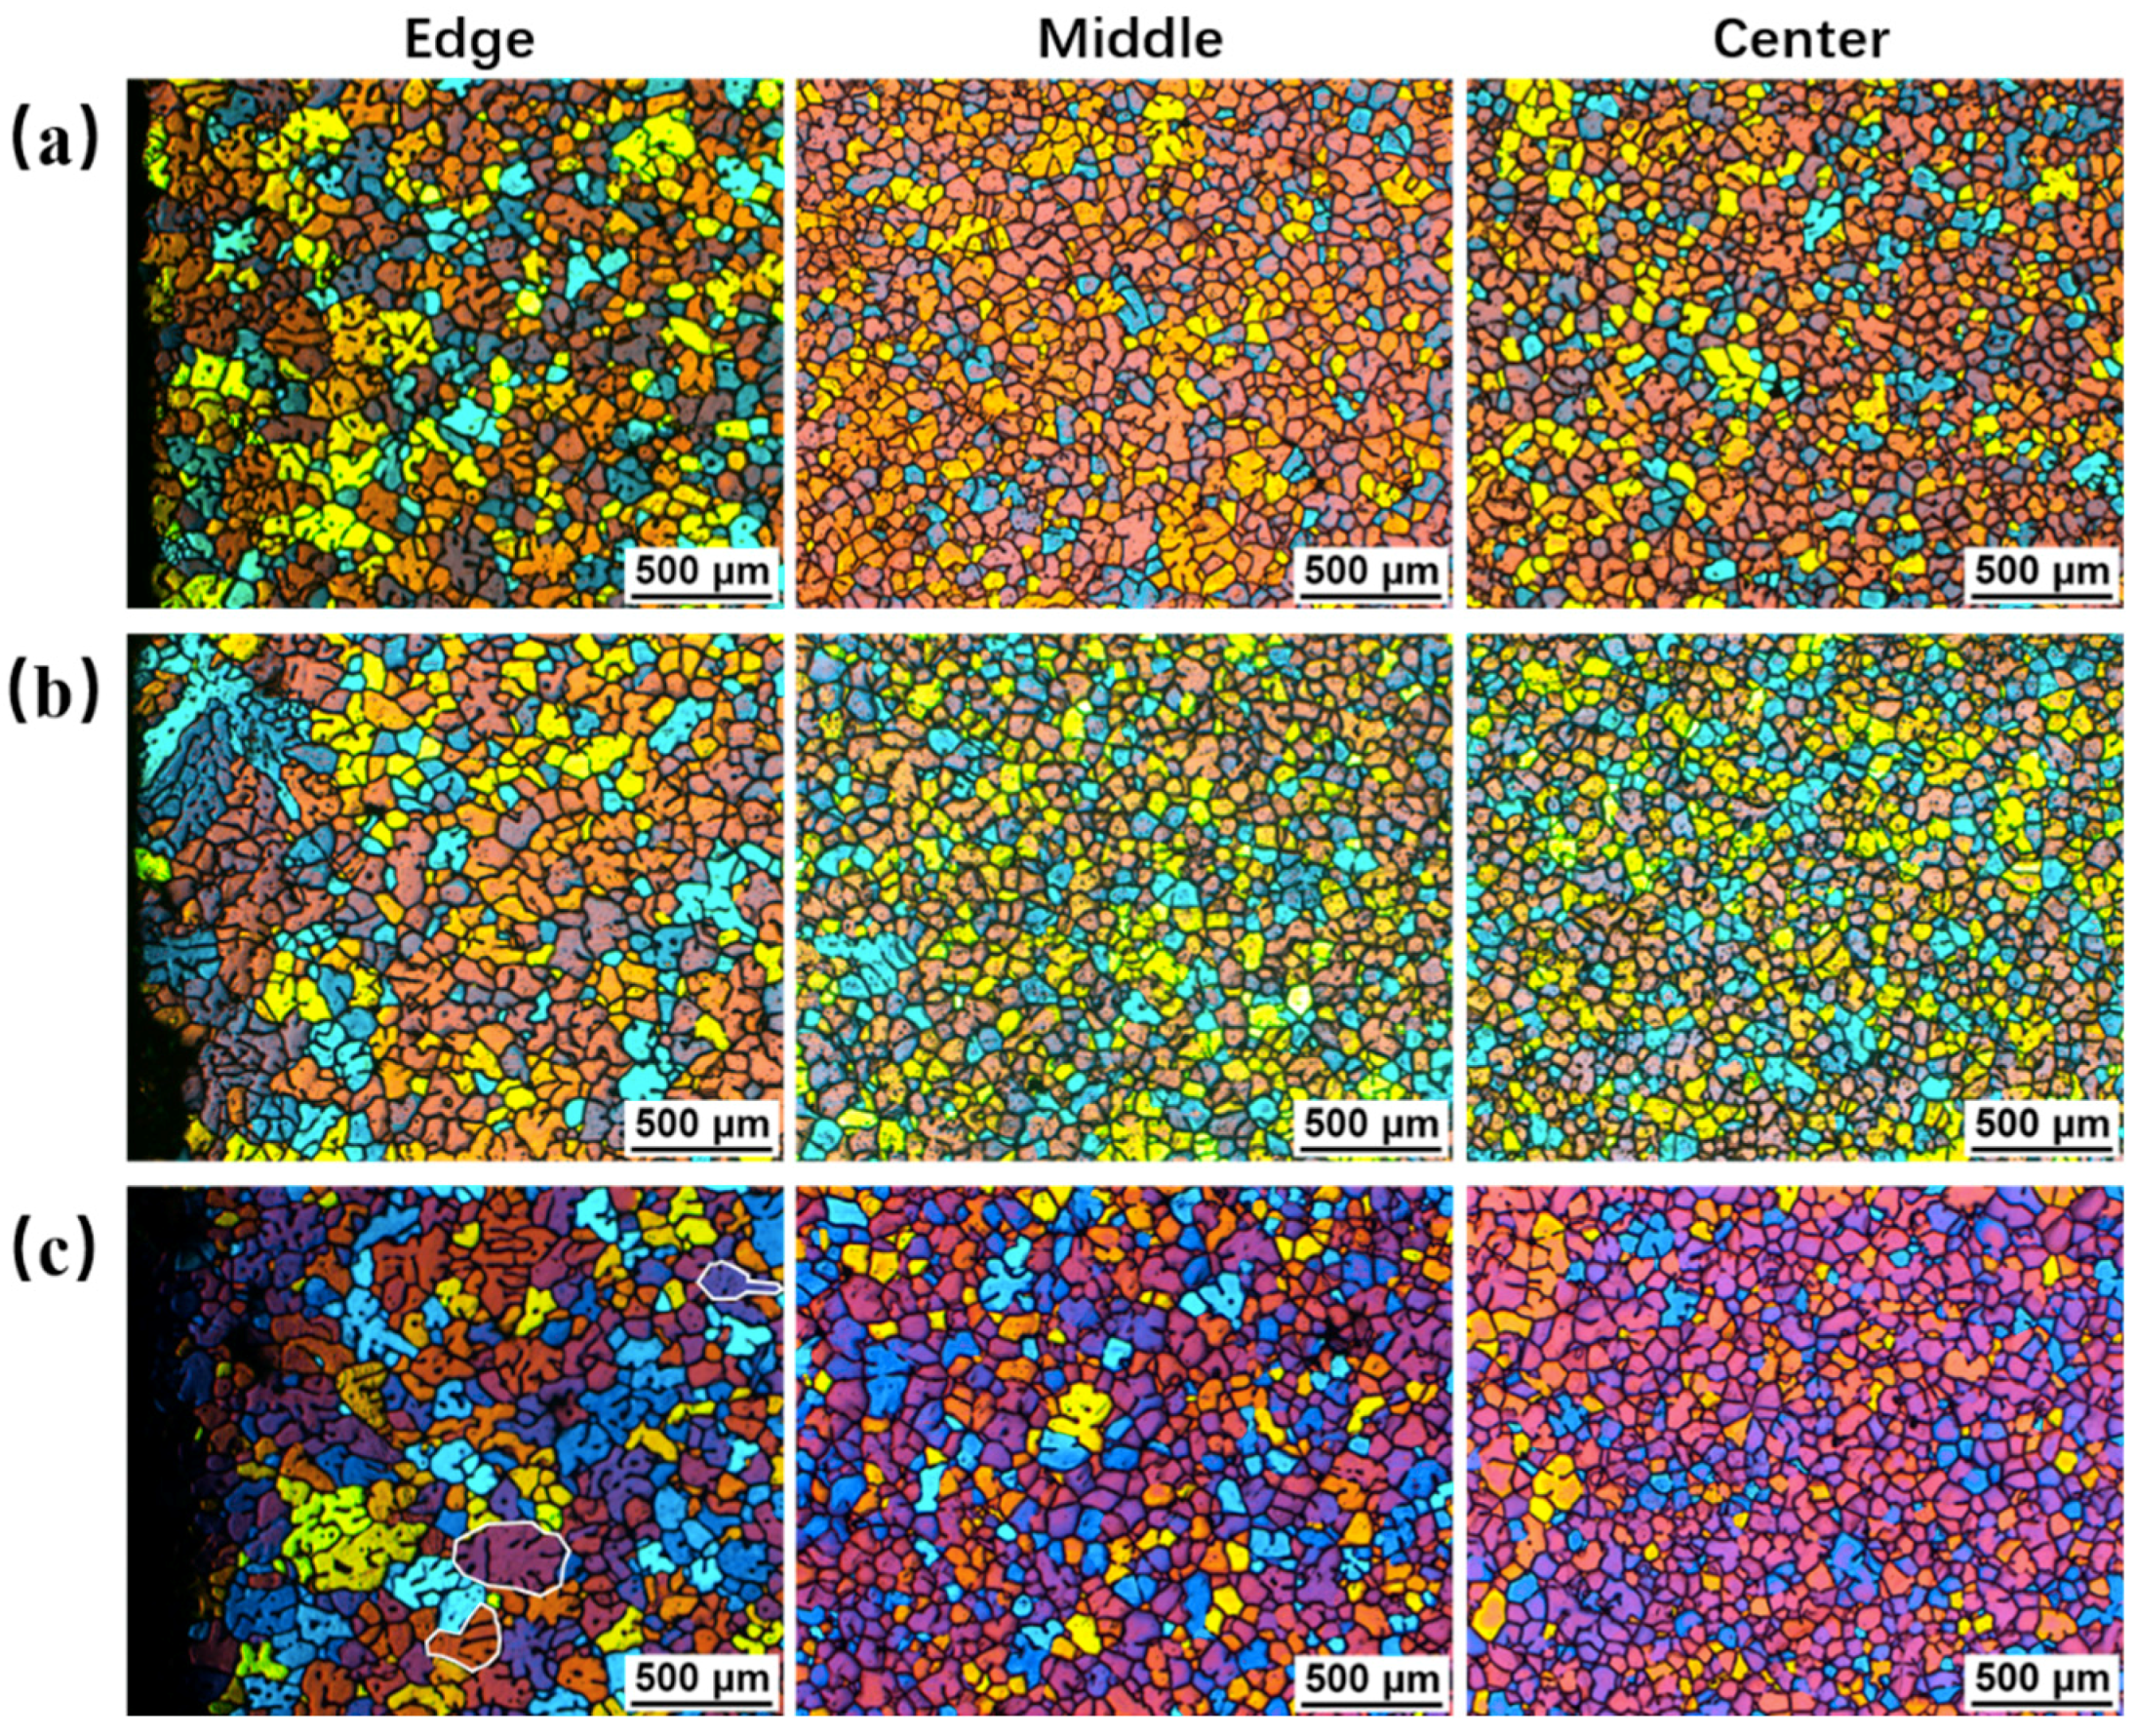
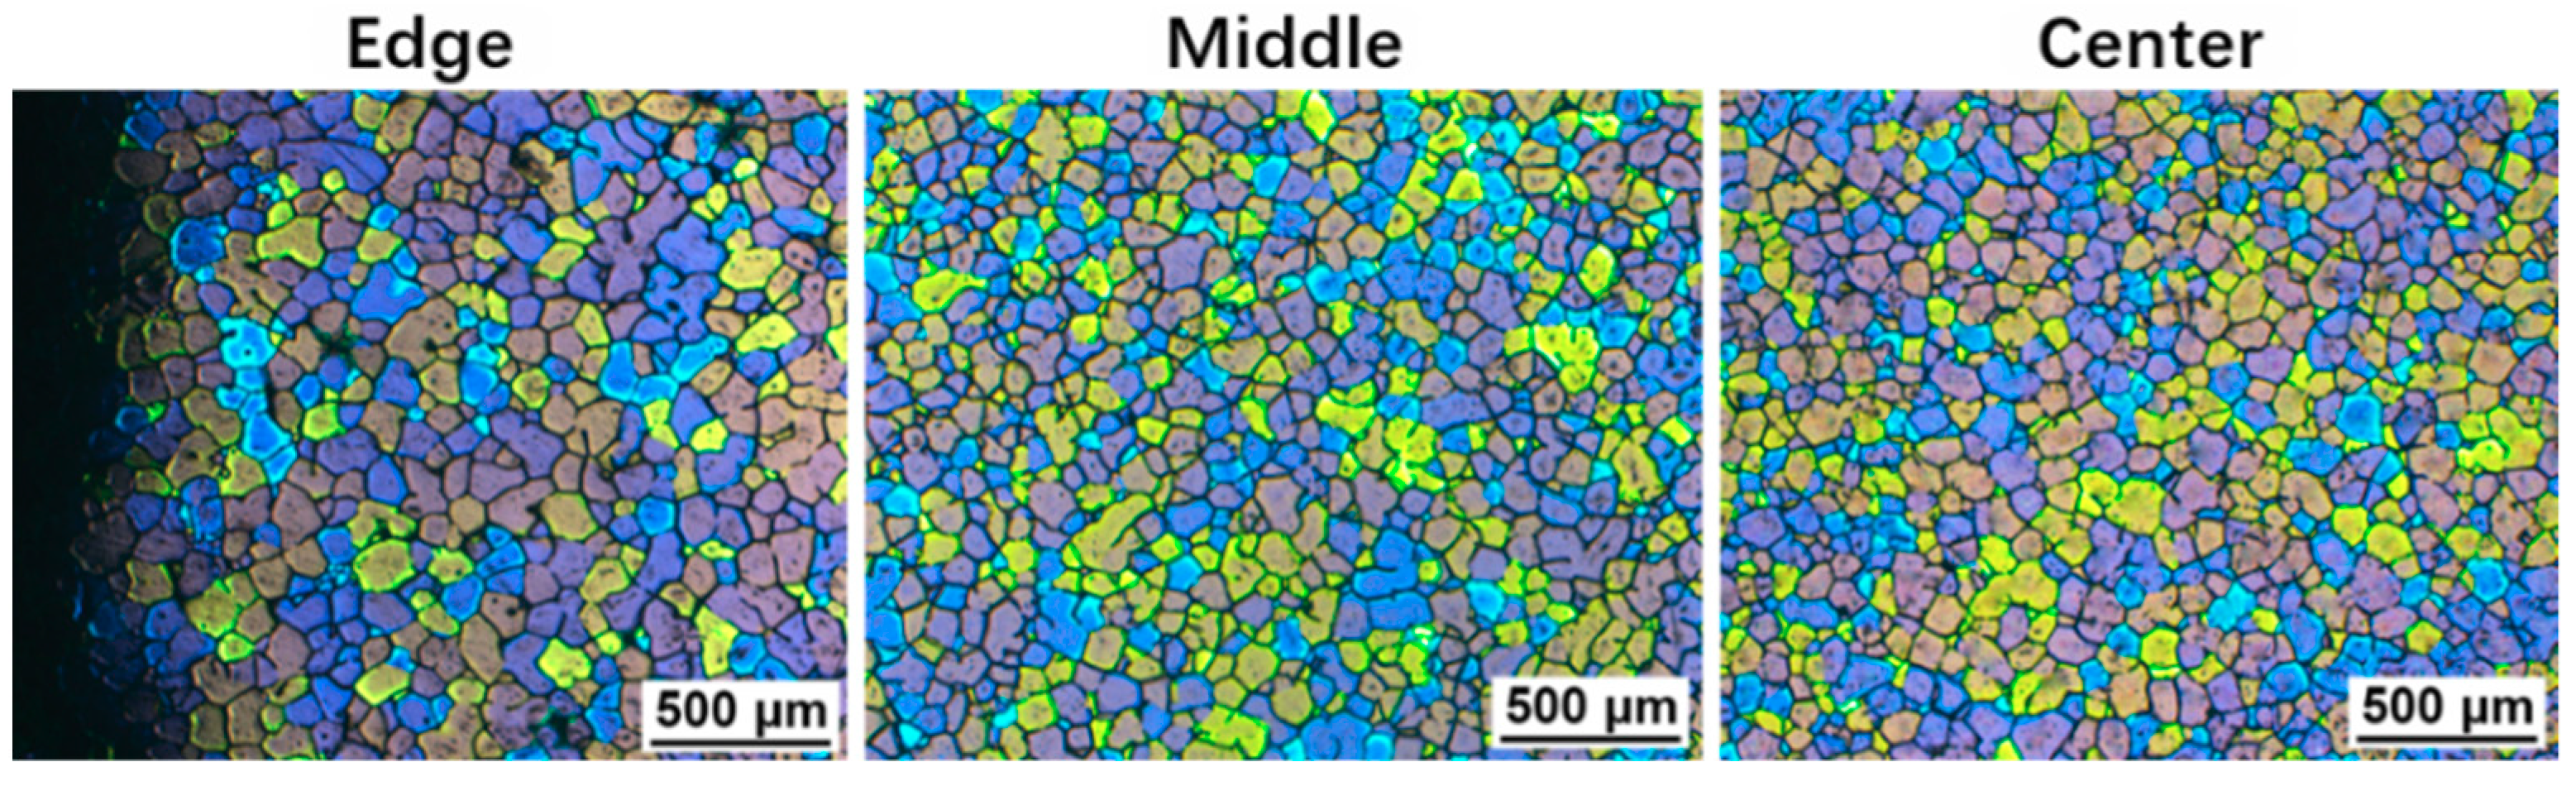
3.3. Effects of Pouring Temperature on Semisolid Microstructure

Figure 8 shows the microstructure at the edge, middle, and center of A201 semisolid slugs produced at different pouring temperatures of 680, 670, and 660 °C; the corresponding processing times are 80, 70, 65 s, respectively. The colored particles are the primary α-Al phase. It can be seen that when the pouring temperature is 680 °C, the microstructure at the edge consists mainly of developed α-Al dendrites, the dendritic layer being about 2.5 mm thick. At the middle and center regions, the grain morphology becomes rosette-like or nearly spherical. When the pouring temperature decreases to 670 °C, the microstructure at the edge mainly consists of rosette-like grains and a few small dendrites. At the middle/center, the morphology of α-Al is similar to that at 680 °C, but the size has decreased. When the pouring temperature drops to 660 °C, the number of primary particles has clearly increased and the grains are greatly refined and more spherical; the morphological differences from the edge to the center are much smaller. There is still a dendritic layer at the very edge, but these dendrites are smaller and the dendritic layer is only about 1 mm thick.
The average grain size of the microstructures at different pouring temperatures has been illustrated in previous work [30] and is presented here in Figure 9. The graph clearly shows that the α-Al particles, at all three positions of the slug, become more refined with decreasing pouring temperature; for example, when the pouring temperature decreases from 680 °C to 670 and 660 °C, the average grain size at the center decreases from 112 to 85 and 68 μm, respectively. Furthermore, the differences of grain size from the edge to the center appear smaller under lower pouring temperatures.
The formation of α-Al particles during the SEED process is attributed to heterogeneous nucleation. When the superheated melt is poured into the crucible, superheat is dissipated by the crucible and melts of lower temperatures are favorable to form more nuclei (higher nucleation rates) on the crucible walls. In addition, under low pouring temperatures, the melt at the edge quickly cools to or below the liquidus, as shown in Figure 6, so more nuclei can be retained. Meanwhile, fluid convection introduced by swirling renders the surviving nuclei uniformly dispersed in the melt. The forced convection also facilitates more homogeneous temperature and composition fields, which promote spherical growth of copious nuclei instead of growth of dendrites. Nevertheless, due to the weak convection and marked temperature gradient at the edge of the slurry, the growth of grains at the edge quickly becomes directional. These grains develop arms which grow in a direction parallel and opposite to the heat-flux direction [31], that is, from the edge to the center. In this case, the outer dendritic zone is formed. Under higher pouring temperatures, the time for the development of dendritic arms becomes longer, leading to a thicker dendritic layer (Figure 8a). This dendritic layer is undesirable for SSP, however, a well-designed die runner and gating system can prevent the outer “skin” of the semisolid slug from entering the die cavity and being incorporated into the final cast part [27,32].

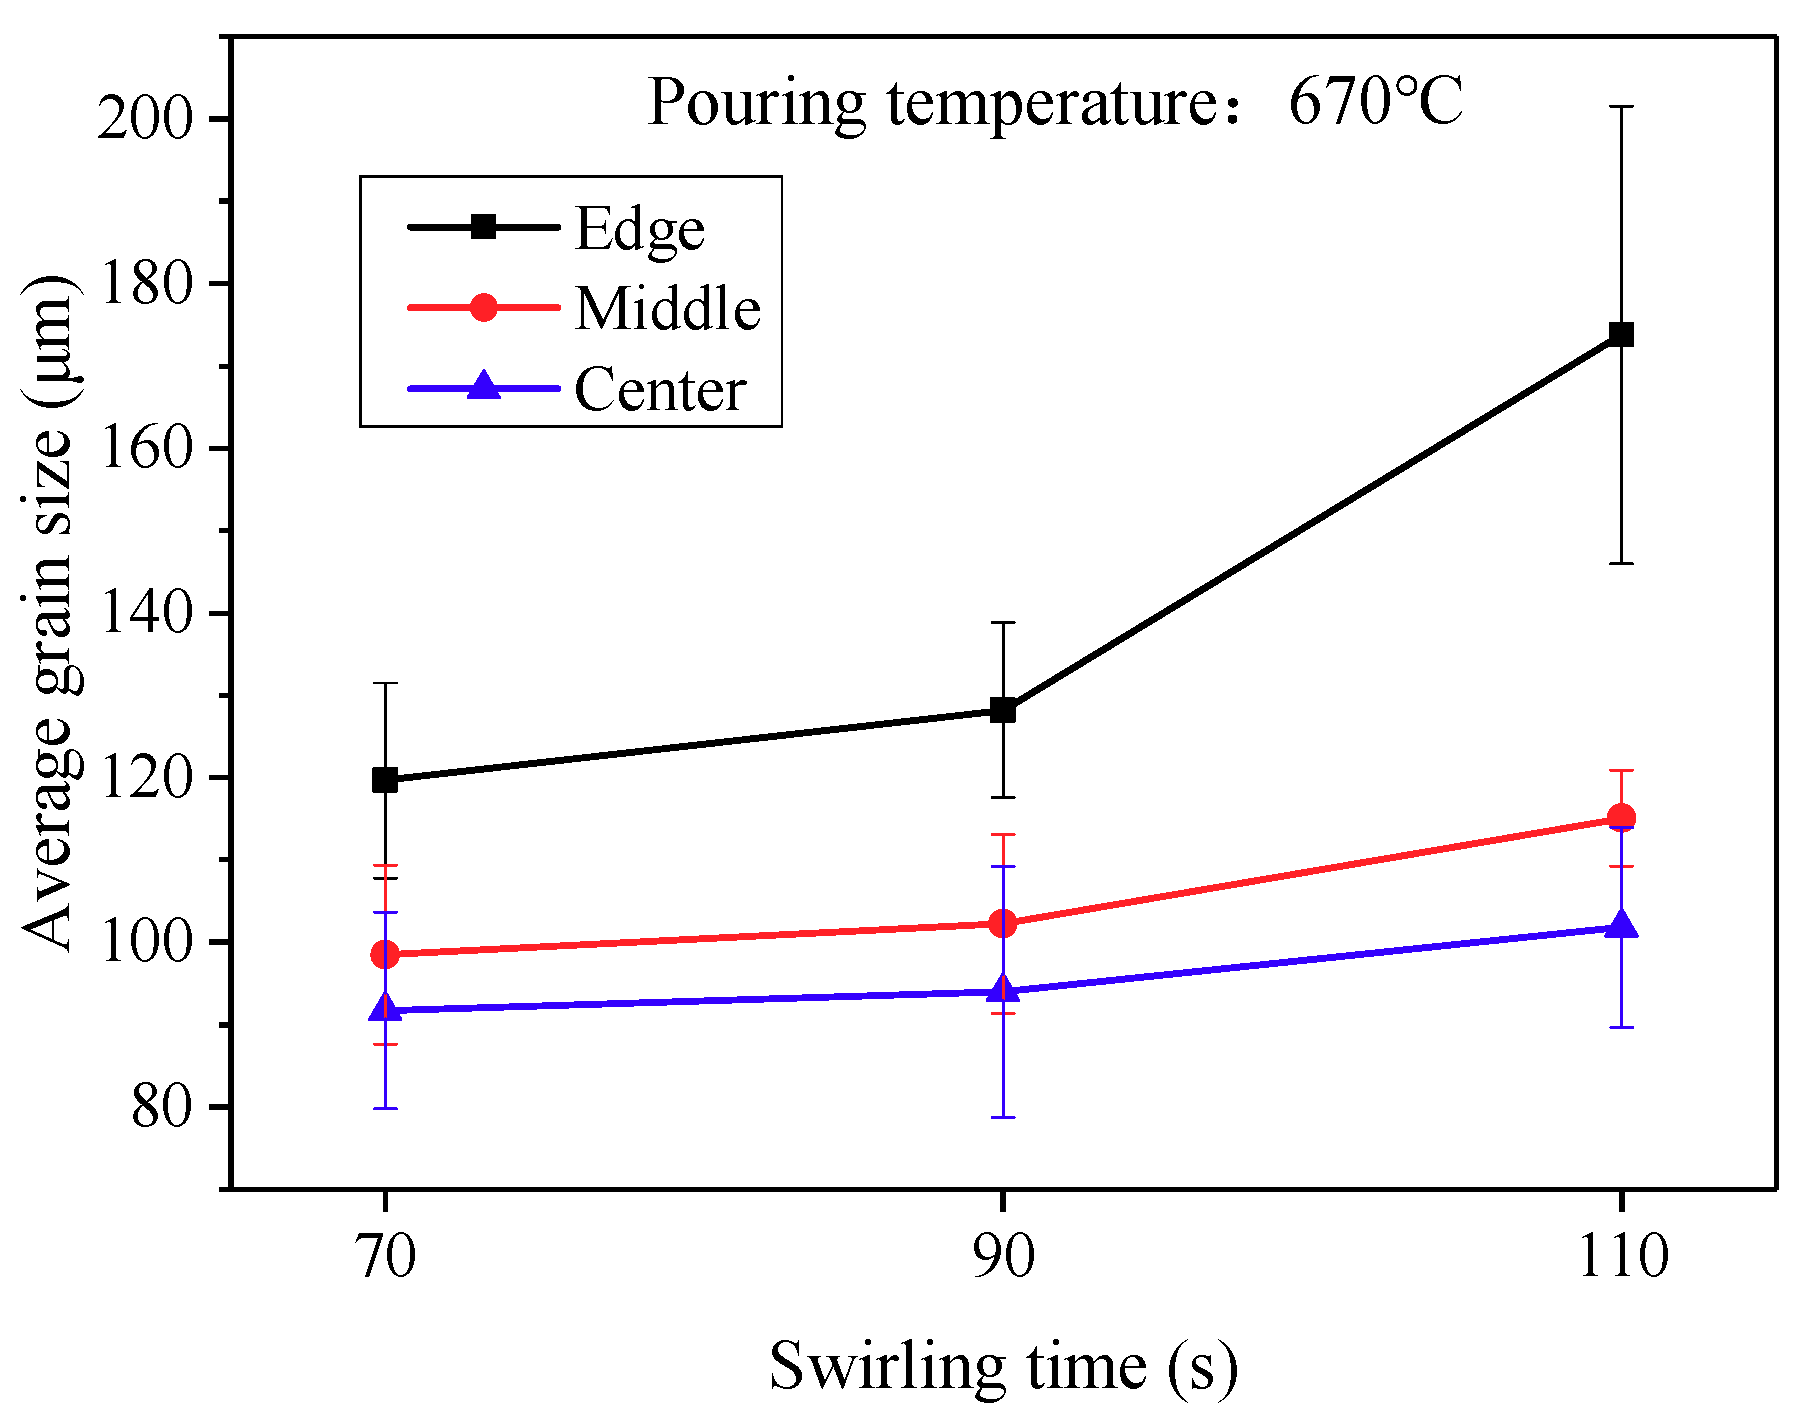
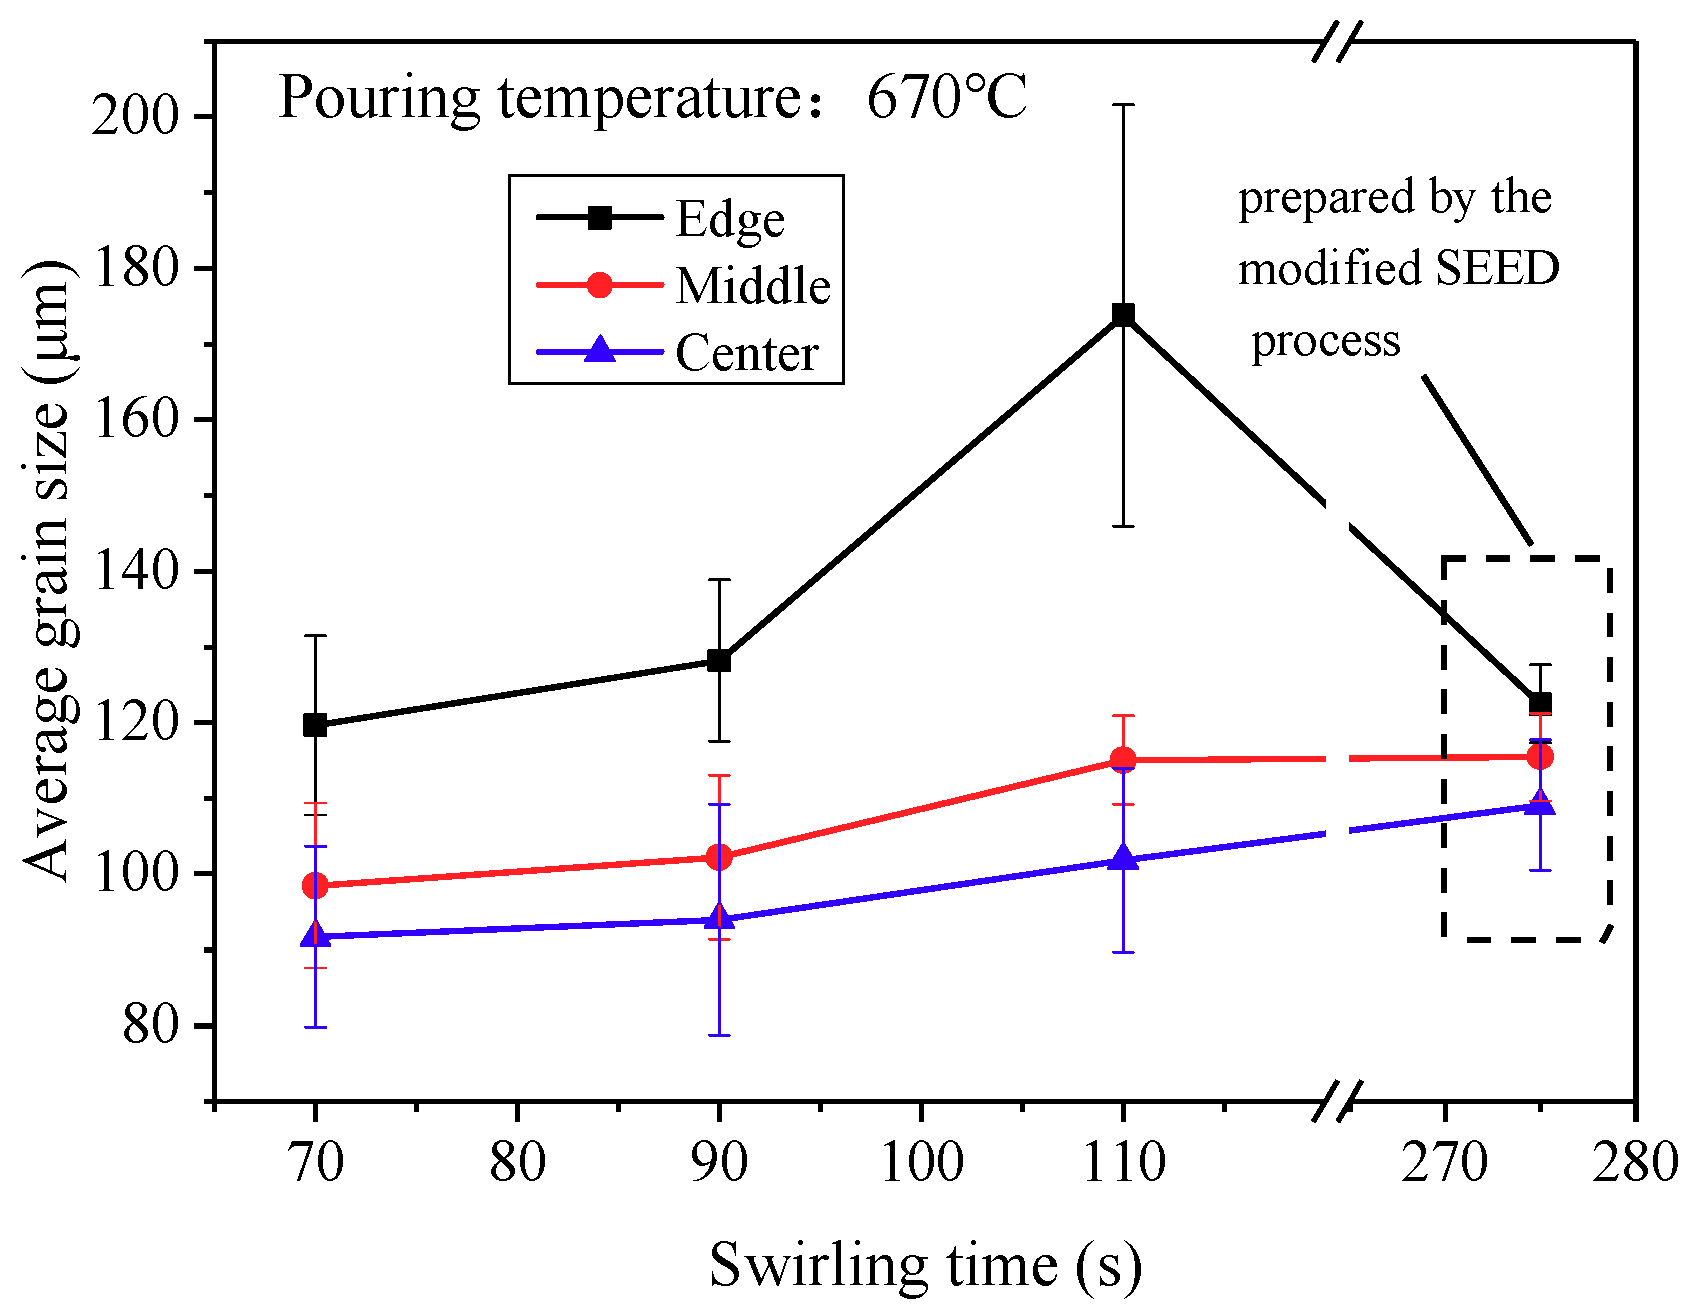
3.4. Effects of Processing Time on Semisolid Microstrutures

The effects of processing time on the microstructures of A201 SEED slugs at the pouring temperature of 670 °C are shown in Figure 10. The relationship between the average size of the primary α-Al and the processing time is shown in Figure 11. It can be seen that with an increase in processing time, the microstructural morphology does not show significant changes and grain size increases slightly at the middle and center while the microstructure at the edge changes more drastically. The prolonged processing time promotes the α-Al at the edge to develop into coarse dendrites. These coarse dendrites develop arms toward the center (i.e., opposite to the heat-flux direction), as seen in Figure 10c. As discussed above, the heat of the melt is mainly dissipated by the crucible, resulting in a steeper temperature gradient across the melt near the crucible walls. In this case, the primary α-Al eventually evolves into a well-developed dendritic morphology.
It should be noted here that although the quenching microstructure of A201 SEED slugs at a processing time of 90 s is not much different from that at 70 s, in fact, by this time, the outer part of the slug has already become too stiff for SSP. Therefore, for alloys with narrow processing windows, like the A201 alloy, in order to prepare acceptable semisolid slurries by the SEED method, one has to lower the pouring temperature and restrict the processing time.

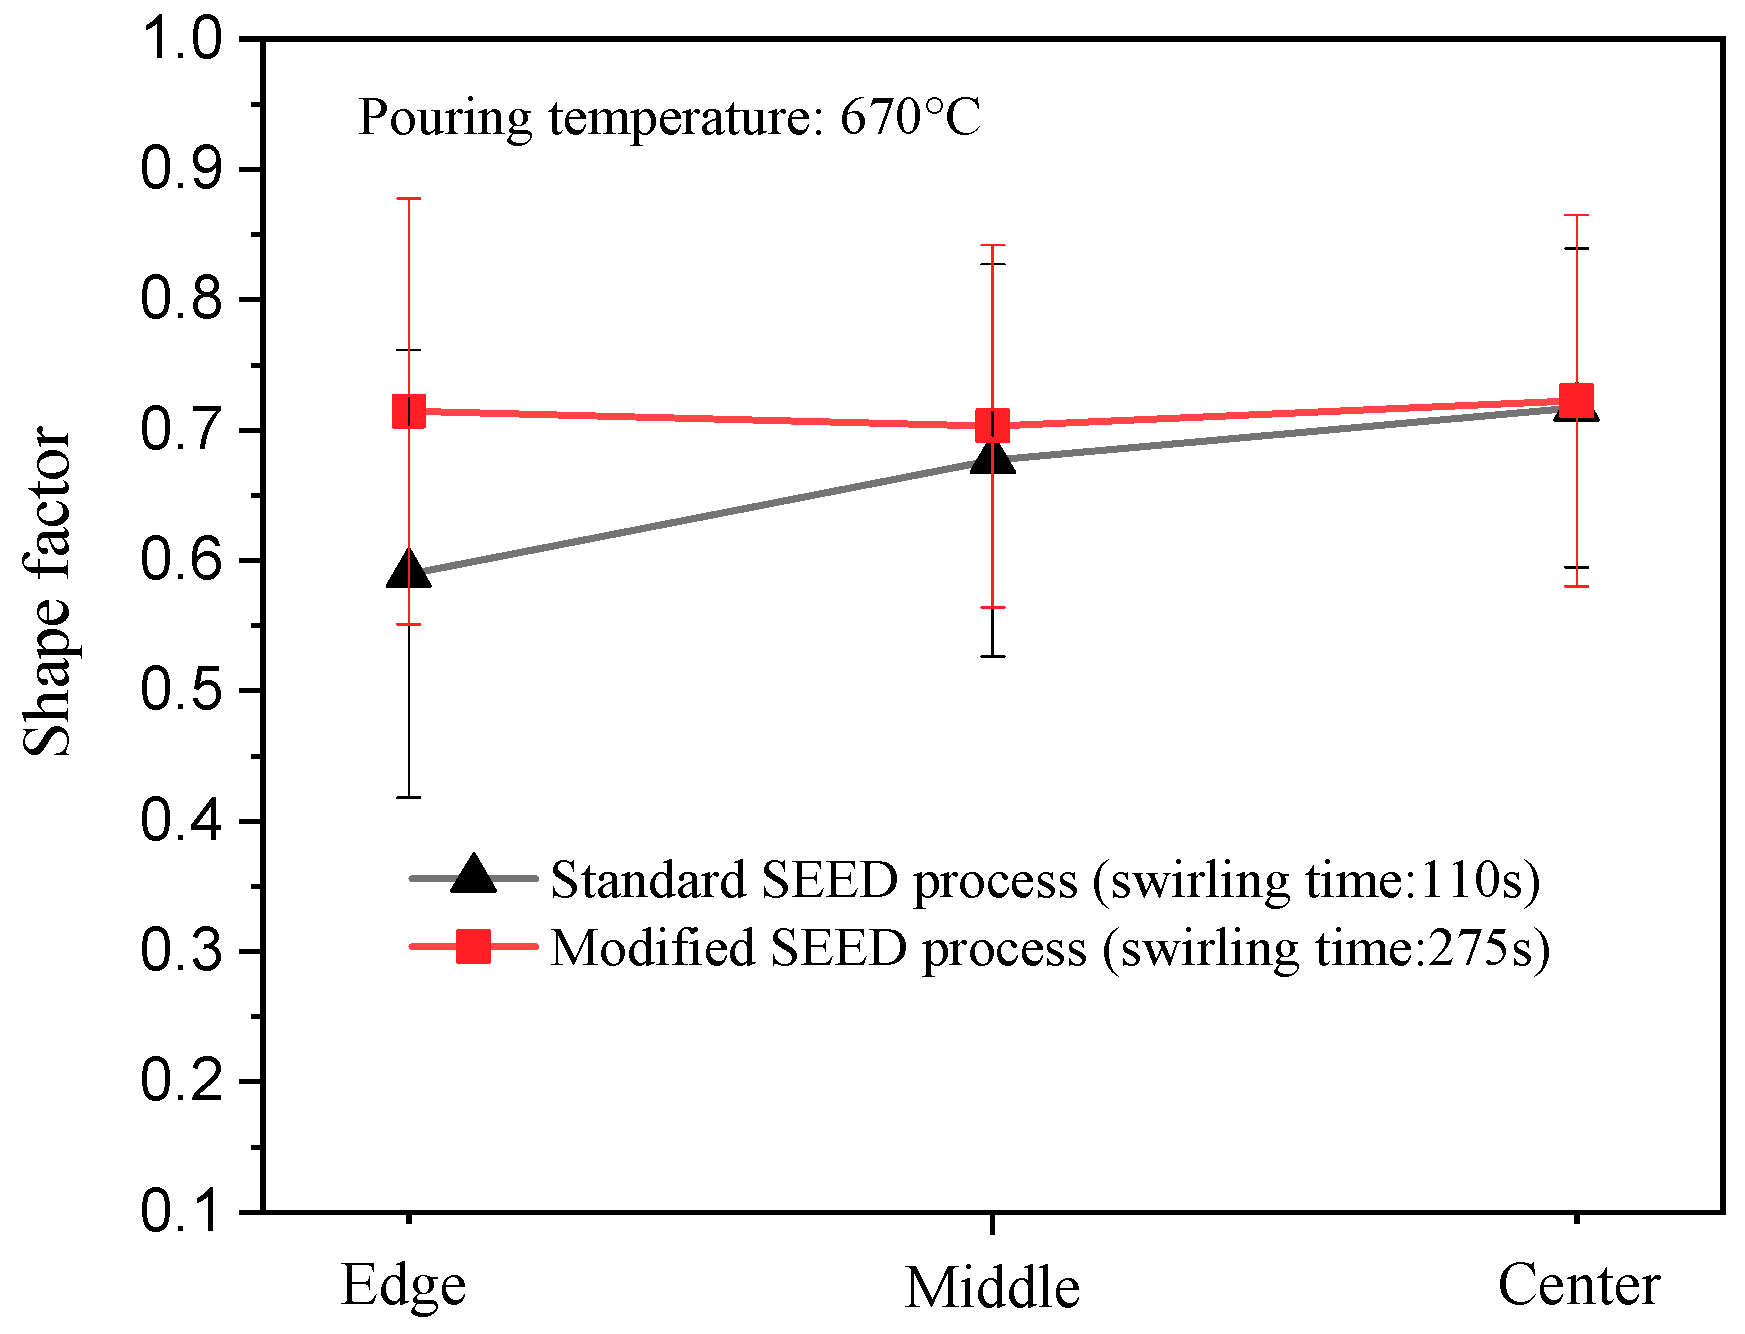
3.5. Cooling Behavior and Microstructures in the Modified SEED Process

Figure 12 shows the cooling curves at different positions of A201 slurry during the modified SEED process at a pouring temperature of 670 °C. In the modified process, the temperature field distribution in the slurry can still be roughly divided into three zones: the LTZ, the MTZ, and the HTZ. Unlike the standard SEED process, however, the LTZ includes positions 1, 2, and 3, the MTZ includes positions 7 and 8, and the HTZ includes positions 4, 5, and 6 (see Figure 12a), suggesting that the main temperature gradient direction inside the slugs in the modified SEED process is axial rather than radial as in the standard process. The temperature difference from the edge to the center at the slow cooling stage is only about 1.4 °C, as shown in Figure 12b. A linear fit to the cooling curve at the center shows that the slope of the equation is very slow and the cooling rate at the center is about 1.43 °C/min.
Figure 13 shows the microstructure of an A201 slug at the pouring temperature of 670 °C prepared by the modified SEED process; the processing time was 275 s. It can be seen that the microstructure at the edge consists mainly of cellular and nearly spherical α-Al grains and that there is no dendritic layer present at the very edge. The morphology of the grains is almost identical from the edge to the center and the α-Al grains in Figure 13 are more uniform and rounded in comparison with those in Figure 10. It is also apparent from Figure 12 that in the modified process, the radial temperature gradient is significantly reduced and the cooling curves of the edge and the middle almost coincide, suppressing the development of dendrites. The low cooling rate in the modified process also promotes more uniform temperature and composition fields close to the solid/liquid interface as well as limiting the constitutional undercooling. Thus, lower cooling rates increase the interface stability and inhibit the preferred growth, thereby promoting spherical growth [33].
The average grain size of the slugs was measured and compared with those of the standard SEED process, shown in Figure 14. It can be seen that although the processing time was increased to 275 s, the grain size of the slug obtained by the modified SEED process did not increase significantly. This is because a high number of solid nuclei were generated at the chilling stage and uniformly distributed in the melt due to the strong flow convection. Therefore, the spacing among the nuclei is small, limiting the growth of the grains. Figure 15 compares the grain shape factors of the quenched slurries produced by standard and modified SEED processes. Here, the pouring temperature was 670 °C and the slurries were cooled to the same temperature at the center before being water quenched. It is observed that the shape factors at the middle and center of the slurries produced by both processes have no obvious differences, while at the edge, the grains prepared by the modified process have equal shape factors to those at the middle and center locations but higher ones than those at the edge of the slurry produced by the standard process. This should be attributed to the improved temperature uniformity by the decreasing heat loss rate and the extended heat transfer time in the modified process.

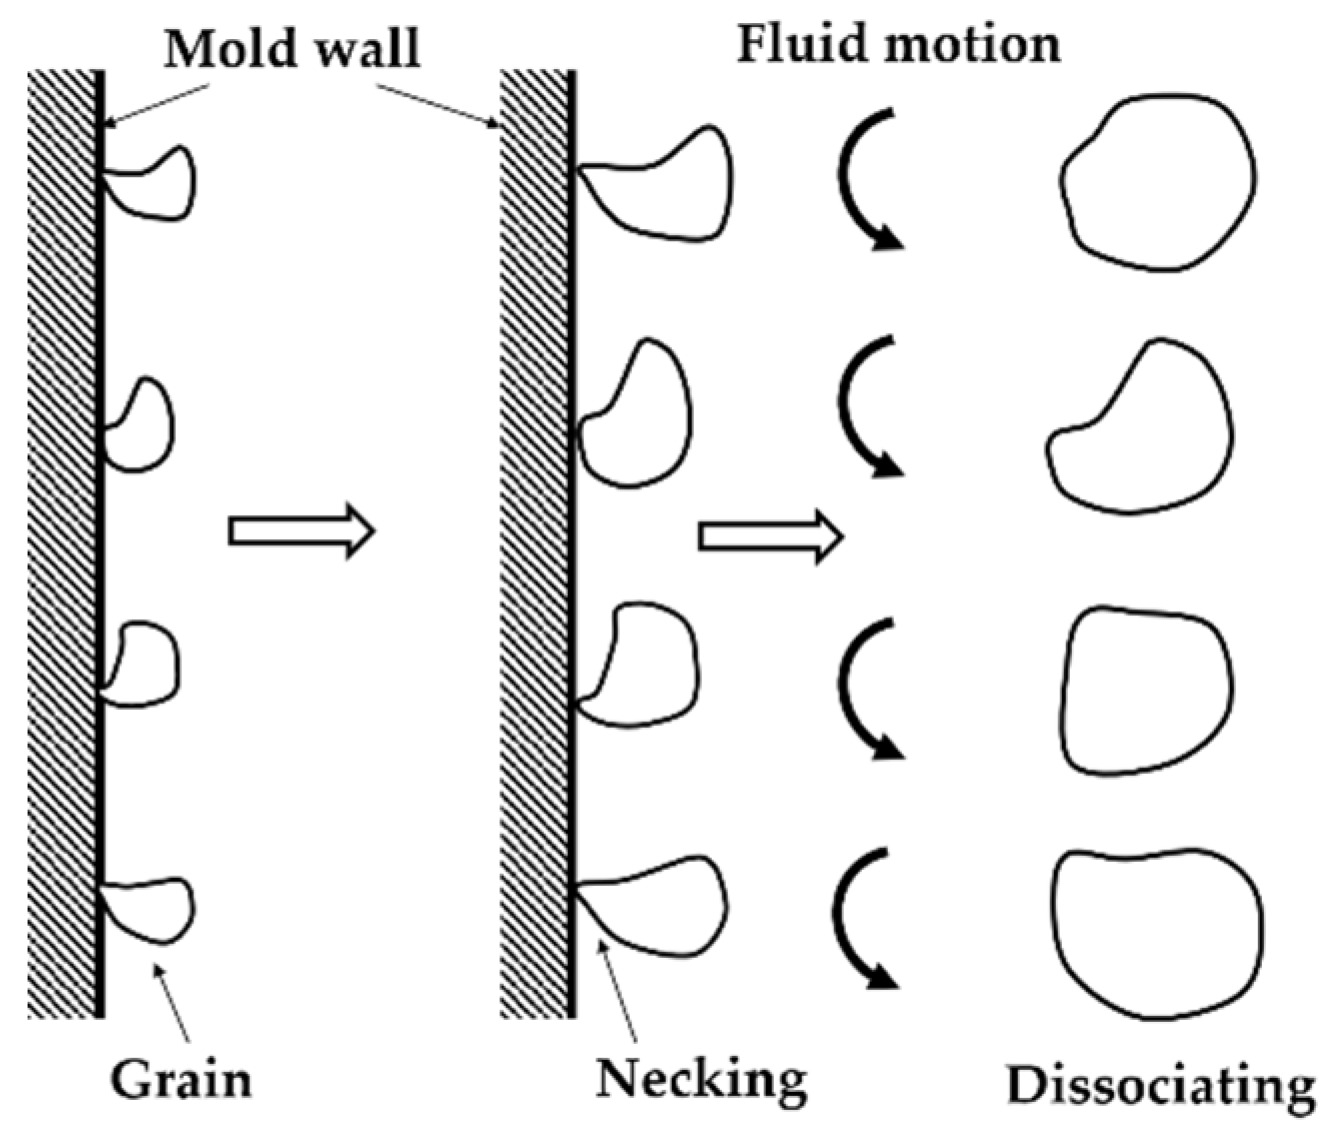
3.6. Microstructure Formation Mechanism of the SEED Process

The formation of nuclei in the SEED process is attributed to heterogeneous nucleation at a relatively small undercooling. When the superheated melt is poured into the crucible, the melt close to the crucible wall rapidly cools below the liquidus due to the chilling of the crucible, as seen in Figure 6. A copious number of effective crystal seeds, which are potential nuclei, are generated in the melt simultaneously in the undercooled melt, according to the “big bang” nucleation theory [34]. On the other hand, the crucible wall provides heterogeneous catalytic sites for nucleation. Ohno [35] proposed that the grains formed on the mold wall can be dissociated from the wall by necking and enter the melt under the strong liquid convection that exists at the early stages of solidification, as illustrated in Figure 16. For the SEED process, the forced fluid convection introduced by swirling facilitates heterogeneous nucleation on the crucible wall and disperses the newly formed nuclei into the melt, greatly increasing the nucleation rate. Some of the nuclei will be melted by the superheated melt and others will survive. At lower pouring temperatures, a larger number of nuclei are generated and fewer are remelted, resulting in more abundant solid nuclei in the melt.
Once generated, the stable nuclei commence to grow promptly. Based on the M–S stability theory proposed by Mullins and Sekerka [36,37], a small stable nucleus initially grows in a nondendritic globular shape, as the Gibbs–Thomson effect plays a dominant role in the solid/liquid interface stability. However, when the solid globule reaches a certain size, its morphology may turn into a dendritic structure, as the Gibbs–Thomson undercooling becomes negligible. In the SEED process, due to the forced convection and relatively slow cooling, the composition and temperature fields are relatively uniform, limiting the constitutional undercooling and thereby promoting further globular growth. In the modified SEED process, the composition and temperature fields are even more uniform due to the lower cooling rates and this leads to a lower constitutional undercooling around the solid/liquid interface, which favors the spherical growth of the grains [33]. Molenarr [38] reported that floating particles rotate as they grow under convection, suppressing dendritic growth. With the increase in SEED processing time, convection is weakened as the grains grow. The temperature gradient around the grains will still decrease, due to the interaction of the thermal diffusion fields of the numerous individual grains, helping to stabilize the solid/liquid interface [39]. All of the above comprise the mechanism for the formation of nondendritic globular grains during the SEED process.
Due to the high cooling intensity and high temperature gradient of the melt close to the crucible wall in the standard SEED process, dendrites are formed at the very edge of the slug. At long processing times, dendrite arms grow in the opposite direction of the heat flux, contacting and colliding with each other under forced convection, resulting in the bending of dendrite arms, as shown in Figure 17. The bending arms may be pinched-off, based on the dendrite fragmentation mechanism suggested by Vogel et al. [40,41], as a result of solute-rich liquid soaking the root of the arms.

4. Conclusions

From the analysis and discussion of the results presented in this work, the following conclusions can be drawn:
(1) Cooling rate has no obvious effect on the temperature process window of A201 alloy, at solid mass fraction 0.4 to 0.6, but has significant influence on the processing time. Lower cooling rates cause longer time process windows, leading to improved temperature uniformity and controllability of the SEED process.
(2) During the SEED process, the temperature evolution of the melt can be divided into two stages: the chilling stage and the slow cooling stage. At the slow cooling stage, the melt temperature is approximately linear with respect to time. Three temperature zones are formed inside the slurry: the high temperature zone (HTZ), the medium temperature zone (MTZ), and the low temperature zone (LTZ). The temperature difference among the three zones gradually decreases with increasing processing time. The temperature difference between the edge and the center of slugs decreases to 7.7–9.2 °C after 160 s under different pouring temperatures, narrowly matching the semisolid process window for the A201 alloy. The cooling curves at the edge show that the melt has a larger degree of undercooling at lower pouring temperatures, resulting in higher nucleation rates.
(3) With decreasing pouring temperatures, the primary α-Al grains are finer and more spherical, and the structure morphology more uniform from the edge to the center of the A201 slugs. Increasing processing time does not significantly change the microstructural morphology at the edge and center but leads to coarser dendritic structures at the very edge of the slugs. In order to prepare acceptable A201 semisolid slurries through the SEED process, one has to lower the pouring temperature and restrict the processing time.
(4) In the modified SEED process, the cooling rate of the melt is much slower and the radial temperature gradient is decreased due to the reduced heat losses at the crucible wall, in which case, no dendritic layer exists at the very edge of the slugs. The resulting grains are more spherical and more uniform as compared to those obtained by the standard SEED process. The results indicate that the SEED process can be improved by redesigning the crucible (changing the thickness in different parts of the crucible wall, reducing the surface coefficient of heat transfer of the crucible, etc.) to achieve a more uniform temperature field inside the melt. This is especially important for the preparation of premium-quality slurries for high-performance alloys that have relatively narrow process windows.
(5) In the SEED processes, the formation of nondendritic microstructures is the result of a large number of uniformly distributed nuclei within the melt and the slow cooling rate of the melt.

Author Contributions

Conceptualization, Q.Z. and D.L.; Data curation, Writing – original draft, and Validation, J.G.; Formal analysis, J.G. and X.H.; Funding acquisition, D.L.; Investigation, J.G. and X.H.; Methodology, Y.K.; Project administration, and Resources, D.L.; Software, X.H.; Supervision, Q.Z. and Y.K.; Writing – review & editing, X.H. and Q.Z.

Funding

This research was funded by the National Key Research and Development Program of China, grant number 2016YFB0301001; projects of Shenzhen Science and Technology Innovation Commission, grant numbers KQJSCX20170328155402991, JCYJ20170817110144233, and KQTD20170328154443162.

Acknowledgments

The authors would like to thank STAS for providing the SEED portable unit used in this study. We also thank Min Luo and Hong Zhang for their help during the course of these experiments and Plato Kapranos for help in revising the English of the manuscript.

Conflicts of Interest

The authors declare no conflict of interest.

References

  1. Flemings, M.C.; Riek, R.G.; Young, K.P. Rheocasting. Mater. Sci. Eng. 1976, 25, 103–117. [Google Scholar] [CrossRef]
  2. Kirkwood, D.H.; Suéry, M.; Kapranos, P.; Atkinson, H.V.; Young, K.P. Semi-Solid Processing of Alloys, 1st ed.; Springer: London, UK, 2010. [Google Scholar] [CrossRef]
  3. Zoqui, E.J. 5.09—Alloys for Semisolid Processing. In Comprehensive Materials Processing; Hashmi, S., Batalha, G.F., Van Tyne, C.J., Yilbas, B., Eds.; Elsevier: Oxford, UK, 2014; pp. 163–190. [Google Scholar] [CrossRef]
  4. Fan, Z. Semisolid metal processing. Int. Mater. Rev. 2002, 47, 49–85. [Google Scholar] [CrossRef]
  5. Li, D.Q.; Zhang, F.; Midson, S.P.; Liang, X.K.; Yao, H. Recent Developments of Rheo-Diecast Components for Transportation Markets. Solid State Phenom. 2019, 285, 417–422. [Google Scholar] [CrossRef]
  6. Wannasin, J.; Fuchs, M.; Lee, J.Y.; Lee, C.U.; Narasimha Rao, T.V.L.; Flemings, M.C. GISS Technology: Principle and Applications in Die Casting. Solid State Phenom. 2019, 285, 470–475. [Google Scholar] [CrossRef]
  7. UBE Industries Ltd. Method and Apparatus of Shaping Semisolid Metals. European Patent EP0745694A1, 4 December 1996. [Google Scholar]
  8. Qi, M.F.; Kang, Y.L.; Zhu, G.M. Microstructure and properties of rheo-HPDC Al-8Si alloy prepared by air-cooled stirring rod process. Trans. Nonferrous Met. Soc. China 2017, 27, 1939–1946. [Google Scholar] [CrossRef]
  9. Zhou, B.; Kang, Y.L.; Qi, M.F.; Zhang, H.H.; Zhu, G.M. R-HPDC Process with Forced Convection Mixing Device for Automotive Part of A380 Aluminum Alloy. Materials 2014, 7, 3084–3105. [Google Scholar] [CrossRef] [PubMed] [Green Version]
  10. Qi, M.F.; Kang, Y.L.; Zhou, B.; Liao, W.N.; Zhu, G.M.; Li, Y.D.; Li, W.R. A forced convection stirring process for Rheo-HPDC aluminum and magnesium alloys. J. Mater. Process. Technol. 2016, 234, 353–367. [Google Scholar] [CrossRef]
  11. Janudom, S.; Wannasin, J.; Basem, J.; Wisutmethangoon, S. Characterization of flow behavior of semi-solid slurries containing low solid fractions in high-pressure die casting. Acta Materialia 2013, 61, 6267–6275. [Google Scholar] [CrossRef]
  12. Hu, X.G.; Zhu, Q.; Midson, S.P.; Atkinson, H.V.; Dong, H.B.; Zhang, F.; Kang, Y.L. Blistering in semi-solid die casting of aluminium alloys and its avoidance. Acta Mater. 2017, 124, 446–455. [Google Scholar] [CrossRef] [Green Version]
  13. Zhu, Q.; Midson, S.P. Semi-solid moulding: Competition to cast and machine from forging in making automotive complex components. Trans. Nonferrous Met. Soc. China 2010, 20, 1042–1047. [Google Scholar] [CrossRef]
  14. Wallace, G.; Jackson, A.P.; Midson, S.P.; Zhu, Q. High-quality aluminum turbocharger impellers produced by thixocasting. Trans. Nonferrous Met. Soc. China 2010, 20, 1786–1791. [Google Scholar] [CrossRef]
  15. Pola, A. Correlation between Microstructure and Properties of Semi-Solid Products. Solid State Phenom. 2019, 285, 12–23. [Google Scholar] [CrossRef]
  16. Hu, X.G.; Zhu, Q.; Lu, H.X.; Zhang, F.; Li, D.Q.; Midson, S.P. Microstructural evolution and thixoformability of semi-solid aluminum 319s alloy during re-melting. J. Alloys Compd. 2015, 649, 204–210. [Google Scholar] [CrossRef]
  17. Winklhofer, J. Semi-Solid Casting of Aluminium from an Industrial Point of View. Solid State Phenom. 2019, 285, 24–30. [Google Scholar] [CrossRef]
  18. Kapranos, P. Thixoforming of Aluminum A201-Expectations and Fulfilment. Solid State Phenom. 2019, 285, 476–488. [Google Scholar] [CrossRef]
  19. Langlais, J.; Lemieux, A. The SEED Technology for Semi-Solid Processing of Aluminum Alloys: A Metallurgical and Process Overview. Solid State Phenom. 2006, 116–117, 472–477. [Google Scholar] [CrossRef]
  20. Côté, P.; Larouche, M.E.; Chen, X.G. New Developments with the SEED Technology. Solid State Phenom. 2013, 192–193, 373–378. [Google Scholar] [CrossRef]
  21. Lemieux, A.; Langlais, J.; Bouchard, D.; Chen, X.G. Effect of Si, Cu and Fe on mechanical properties of cast semi-solid 206 alloys. Trans. Nonferrous Met. Soc. China 2010, 20, 1555–1560. [Google Scholar] [CrossRef] [Green Version]
  22. Mohammed, M.N.; Omar, M.Z.; Salleh, M.S.; Alhawari, K.S.; Kapranos, P. Semisolid Metal Processing Techniques for Nondendritic Feedstock Production. Sci. World J. 2013, 2013, 752175. [Google Scholar] [CrossRef]
  23. Chayong, S.; Atkinson, H.V.; Kapranos, P. Multistep induction heating regimes for thixoforming 7075 aluminium alloy. Mater. Sci. Technol. 2004, 20, 490–496. [Google Scholar] [CrossRef]
  24. Liu, D.; Atkinson, H.V.; Kapranos, P.; Jirattiticharoean, W.; Jones, H. Microstructural evolution and tensile mechanical properties of thixoformed high performance aluminium alloys. Mater. Sci. Eng. A 2003, 361, 213–224. [Google Scholar] [CrossRef]
  25. Liu, D.; Atkinson, H.V.; Kapranos, P.; Jones, H. Effect of heat treatment on properties of thixoformed high performance 2014 and 201 aluminium alloys. J. Mater. Sci. 2004, 39, 99–105. [Google Scholar] [CrossRef]
  26. Langlais, J.; Andrade, N.; Lemieux, A.; Chen, X.G.; Bucher, L. The Semi-Solid Forming of an Improved AA6061 Wrought Aluminum Alloy Composition. Solid State Phenom. 2008, 141–143, 511–516. [Google Scholar] [CrossRef]
  27. Hu, X.G.; Zhu, Q.; Atkinson, H.V.; Lu, H.X.; Zhang, F.; Dong, H.B.; Kang, Y.L. A time-dependent power law viscosity model and its application in modelling semi-solid die casting of 319s alloy. Acta Mater. 2017, 124, 410–420. [Google Scholar] [CrossRef] [Green Version]
  28. Kazakov, A. Alloy Compositions for Semisolid Forming. Adv. Mater. Process. 2000, 157, 31–34. [Google Scholar]
  29. Liu, D.; Atkinson, H.V.; Jones, H. Thermodynamic prediction of thixoformability in alloys based on the Al–Si–Cu and Al–Si–Cu–Mg systems. Acta Mater. 2005, 53, 3807–3819. [Google Scholar] [CrossRef]
  30. Gao, J.Z.; Zhu, Q.; Li, D.Q.; Hu, X.G.; Luo, M.; Kang, Y.L. Slurry Preparation and Hot Tearing Susceptibility of A201 Aluminum Alloy in Rheological Die Casting. Solid State Phenom. 2019, 285, 311–317. [Google Scholar] [CrossRef]
  31. Kurz, W.; Fisher, D.J. Fundamentals of Solidification, 4th revised ed.; Trans Tech Publications: Zürich, Switzerland, 1998; pp. 5–11. [Google Scholar]
  32. Kang, C.G.; Seo, P.K.; Kim, B.M. Determination of Die Design Rules for Semi-Solid Die Casting Process and Its Experimental Investigation. Mater. Sci. Forum 2005, 475–479, 2533–2538. [Google Scholar] [CrossRef]
  33. Uggowitzer, P.J.; Kaufmann, H. Evolution of globular microstructure in new rheocasting and super rheocasting semi-solid slurries. Steel Res. Int. 2004, 75, 525–530. [Google Scholar] [CrossRef]
  34. Chalmers, B. Principles of Solidification. In Applied Solid State Physics; Low, W., Schieber, M., Eds.; Springer: Boston, MA, USA, 1970; pp. 161–170. [Google Scholar] [CrossRef]
  35. Ohno, A. Solidification—The Separation Theory and Its Practical Applications, 1st ed.; Springer: Berlin, Germany, 1987. [Google Scholar] [CrossRef]
  36. Mullins, W.W.; Sekerka, R.F. Morphological Stability of a Particle Growing by Diffusion or Heat Flow. J. Appl. Phys. 1963, 34, 323–329. [Google Scholar] [CrossRef]
  37. Mullins, W.W.; Sekerka, R.F. Stability of a Planar Interface During Solidification of a Dilute Binary Alloy. J. Appl. Phys. 1964, 35, 444–451. [Google Scholar] [CrossRef]
  38. Molenaar, J.M.M.; Katgerman, L.; Kool, W.H.; Smeulders, R.J. On the formation of the stircast structure. J. Mater. Sci. 1986, 21, 389–394. [Google Scholar] [CrossRef]
  39. Doherty, R.D.; Lee, H.-I.; Feest, E.A. Microstructure of stir-cast metals. Mater. Sci. Eng. 1984, 65, 181–189. [Google Scholar] [CrossRef]
  40. Vogel, A.; Doherty, R.D.; Cantor, B. Solidification and Casting of Metals; The Metals Society: London, UK, 1979; pp. 518–525. [Google Scholar]
  41. George, S.L.; Knutsen, R.D. Composition segregation in semi-solid metal cast AA7075 aluminium alloy. J. Mater. Sci. 2012, 47, 4716–4725. [Google Scholar] [CrossRef]
Figure 1. Schematic of the SEED process (ac) and HDPC press (d).
Metals 09 00922 g001
Figure 2. Schematic of (a) the dimensions of the crucible and the temperature measurement points in the melt, and (b) the fixing device for thermocouples.
Metals 09 00922 g002
Figure 3. Schematic of the sampling positions for metallographic analyses.
Metals 09 00922 g003
Figure 4. The modified SEED process.
Metals 09 00922 g004
Figure 5. (a) Heat flow of A201 alloy during solidification at different cooling rates, (b) solid fraction curves of A201 alloy calculated by calorimetric experiments and thermodynamic predictions.
Metals 09 00922 g005
Figure 6. Measured temperature curves of A201 semisolid slurry during SEED process with different pouring temperatures: (a) 680 °C, (b) 670 °C, and (c) 660 °C.
Metals 09 00922 g006
Figure 7. Temperature curves at the edge, middle, and center of A201 semisolid slurry during the SEED process with different pouring temperatures: (a) 680 °C, (b) 670 °C, and (c) 660 °C.
Metals 09 00922 g007
Figure 8. Microstructures of A201 semisolid slugs at different pouring temperatures: (a) 680 °C, (b) 670 °C, and (c) 660 °C.
Metals 09 00922 g008
Figure 9. Effect of pouring temperature on the average grain size of A201 semisolid slugs [30].
Metals 09 00922 g009
Figure 10. Microstructures of A201 semisolid slugs at different processing times: (a) 70 s, (b) 90 s, and (c) 110 s.
Metals 09 00922 g010
Figure 11. Effect of processing time on the average grain size of A201 semisolid slugs.
Metals 09 00922 g011
Figure 12. Measured temperature curves of A201 semisolid slurry during the modified SEED process: (a) temperatures at positions 1–8; (b) temperatures at the edge, middle, and center.
Metals 09 00922 g012
Figure 13. Microstructure of A201 semisolid slugs prepared by the modified SEED process.
Metals 09 00922 g013
Figure 14. Average grain sizes of A201 semisolid slugs prepared by the modified and the standard SEED processes.
Metals 09 00922 g014
Figure 15. Shape factors of A201 semisolid slugs prepared by the modified and the standard SEED processes.
Metals 09 00922 g015
Figure 16. Schematic of crystal dissociation.
Metals 09 00922 g016
Figure 17. Dendritic structure at the edge of a slug prepared by the standard SEED process. (See also Figure 10.)
Metals 09 00922 g017
Table 1. Chemical composition of the A201 alloy (wt.%).
AlloyCuMgAgSiFeTiMnAl
A2014.0–5.20.15–0.550.4–1.0<0.1<0.150.15–0.350.20–0.50Bal.
This study4.80.250.560.090.150.250.29Bal.
Table 2. Process windows and assumptions for the A201 alloy at different kinetic conditions.
Cooling Rate (K/min)Solidification Interval (°C)Temperature Window (°C)Temperature SensitivityTime Window (s)
1115.614.20.014852
5117.314.00.014168
10121.813.70.01770.2
15122.414.10.01456.4
Equilibrium104.810.70.019/
Scheil model146.011.90.017/

