Article

Model-Based Analysis of Factors Affecting the Burden Layer Structure in the Blast Furnace Shaft

1
School of Metallurgy, Northeastern University, Shenyang 110819, Liaoning, China
2
Key Laboratory for Ecological Metallurgy of Multimetallic Mineral (Ministry of Education), Northeastern University, Shenyang 110819, Liaoning, China
3
Thermal and Flow Engineering Laboratory, Åbo Akademi University, Biskopsgatan 8, FI-20500 Turku, Finland
*
Authors to whom correspondence should be addressed.
Metals 2019, 9(9), 1003; https://doi.org/10.3390/met9091003
Submission received: 21 August 2019 / Revised: 9 September 2019 / Accepted: 11 September 2019 / Published: 12 September 2019
(This article belongs to the Special Issue Advanced Simulation Technologies of Metallurgical Processing)

Abstract

:
The distribution of burden layers in an ironmaking blast furnace strongly influences the conditions in the upper part of the process. The bed permeability largely depends on the distribution of ore and coke in the lumpy zone, which affects the radial gas flow distribution in the shaft. Along with the continuous advancement of technology, more information about the internal conditions of the blast furnace can be obtained through advanced measurement equipment, including 2D profiles and 3D surface maps of the top burden surface. However, the change of layer structure along with the burden descent cannot be directly measured. A mathematical model predicting the burden distribution and the internal layer structure during the descending process is established in this paper. The accuracy of the burden distribution model is verified by a comparison with experimental results. A sensitivity study was undertaken to clarify the role of some factors on the arising layer distribution, including the descent-rate distribution, the initial burden surface profile, and the charging direction through the charging matrix. The findings can be used as a theoretical basis to guide plant operations for optimizing the charging.

1. Introduction

A proper distribution of burden materials in an ironmaking blast furnace (BF) has been commonly recognized as a basic prerequisite for an appropriate distribution of burden permeability, which, in turn, facilitates the distribution of the ascending gas originating in the raceways. The radial gas distribution is one of the key factors that determine the utilization of both thermal and chemical energy embodied in the gas phase. As a result, the burden distribution plays an important role in the overall performance of the BF, and, in particular, in the fuel rate and productivity [1]. After screening the burden material, which mainly includes iron oxides (commonly referred to as “ore”, but consisting of sinter, pellets, or lump ore), coke and flux are supplied in separate dumps. In modern BFs, the (Paul Wurth) bell-less charging system is applied, where a dump is split into rings charged at desired radial coordinates by a rotating chute. The bell-less charging technology provides a set of advantages over the traditional bell-type charging system, including higher circumferential uniformity, reduced grain size segregation, less pushing effects, and a high flexibility in the design of burden layers. It is still worth noting that the initial burden layers formed by the bell-less charging system are strongly affected by the initial burden surface profile in the BF throat and, furthermore, that the layers undergo changes as the burden descends, thus reshaping every layer. Therefore, it is important to clarify the governing mechanisms underlying the formation and reshaping process during and after burden charging in order to be able to design efficient charging programs and to make appropriate adjustments of the burden distribution to increase the efficiency of the BF operation.
In modern BFs, the top gas temperature and composition are routinely measured, often across one or two diagonals of the throat by above-burden probes. Information about the initial burden level is usually obtained locally by using mechanical stock rods or sometimes even more advanced techniques, such as laser or radar sensors. The thermal profile of the burden surface may furthermore be measured by IR cameras [2]. In the lumpy zone where the burden descends, direct measuring or monitoring techniques are still limited to in-burden probes that can occasionally measure the radial distribution of gas temperature and composition. Because of the hostile environment, on-line sensors cannot be permanently placed in this region of the BF. As a consequence, most of the studies on the conditions of the burden in the lumpy zone [3,4,5,6,7,8,9,10,11,12,13,14,15,16,17,18,19,20,21,22,23] have been based on laboratory-scale experiments or mathematical modeling. Such studies have, e.g., [3,4,5], presented correlations between the charging pattern and the burden structure in the lumpy zone. However, since direct measurements of the layers in the shaft are lacking, the modeling results have usually only been verified for the top layers in the throat or indirectly through gas temperature and composition measurements in the throat. Compared with physical experiments, mathematical modeling [3] has gained popularity due to its lower cost and higher flexibility. The mathematical modeling approaches [4,5] regarding the BF burden distribution (corresponding to the bell-less charging system) can basically be categorized as volume-based simplified models or classical (continuum) force models [6,7,8,9,10,11,12,13,14], data-driven models [15,16], or hybrid models [17,18], as well as the more computationally expensive models based of the discrete element method (DEM) [19,20,21,22,23]. Among these models, the classical force model has advantages in terms of its simple model formulation and fast computation, which are readily suitable for online implementation. Over the years, the classical force model has been continuously improved by different researchers (groups). In order to consider the non-uniform distribution of the burden descending speed, Fu et al. [24] extended the classical force model by assuming a potential flow of burden and that the boundary profile of each individual layer was polygonal. A more practical burden descending speed with different ore-to-coke ratios has been predicted and an online version of the model has been developed and utilized in some operating BFs [13]. Extensive efforts have also been put into estimating the effects of charging patterns on the burden trajectory, burden surface profile, and position of each layer in the descending process [11,12]. As for the charging pattern, however, the influence of charging direction (i.e., inward charging from the wall to center or outward charging from the center to wall) is yet to be clarified, even though some industrial trials of changing the charging direction have shown promising results [12]. In addition, it should be pointed out that the repose angle of each burden material was given a specific value in those models reported. This seems to be questionable, since the repose angle may vary owing to the change of chute angle, the non-uniform descending of the burden surface, and the blocking and rebounding effect of the non-flat burden surface and furnace wall.
Based on the above reviews, a mathematical model using the Polygonal Line (PL) method of the burden surface profile has been verified in a reduced-scale (1:10) experiment [12] and applied for the automatic generation of charging programs satisfying certain criteria concerning the radial distribution of the burden [25]. In the present work, a more comprehensive mathematical model based on the aforementioned PL method has been developed and further extended by adding functions to analyse the influence of different boundary conditions, such as the initial burden surface, the descending velocity profile, and the charging direction (inward and outward). Finally, some conclusions and suggestions for future work are presented.

2. Mathematical Model

The mathematical model developed considers the process of burden formation in the BF with the bell-less charging system [26] (cf. Figure 1), by including five fundamental steps: free falling of particles from the hopper onto the chute, particle sliding along the chute, free falling from the chute tip, burden surface formation, and burden layer descent.

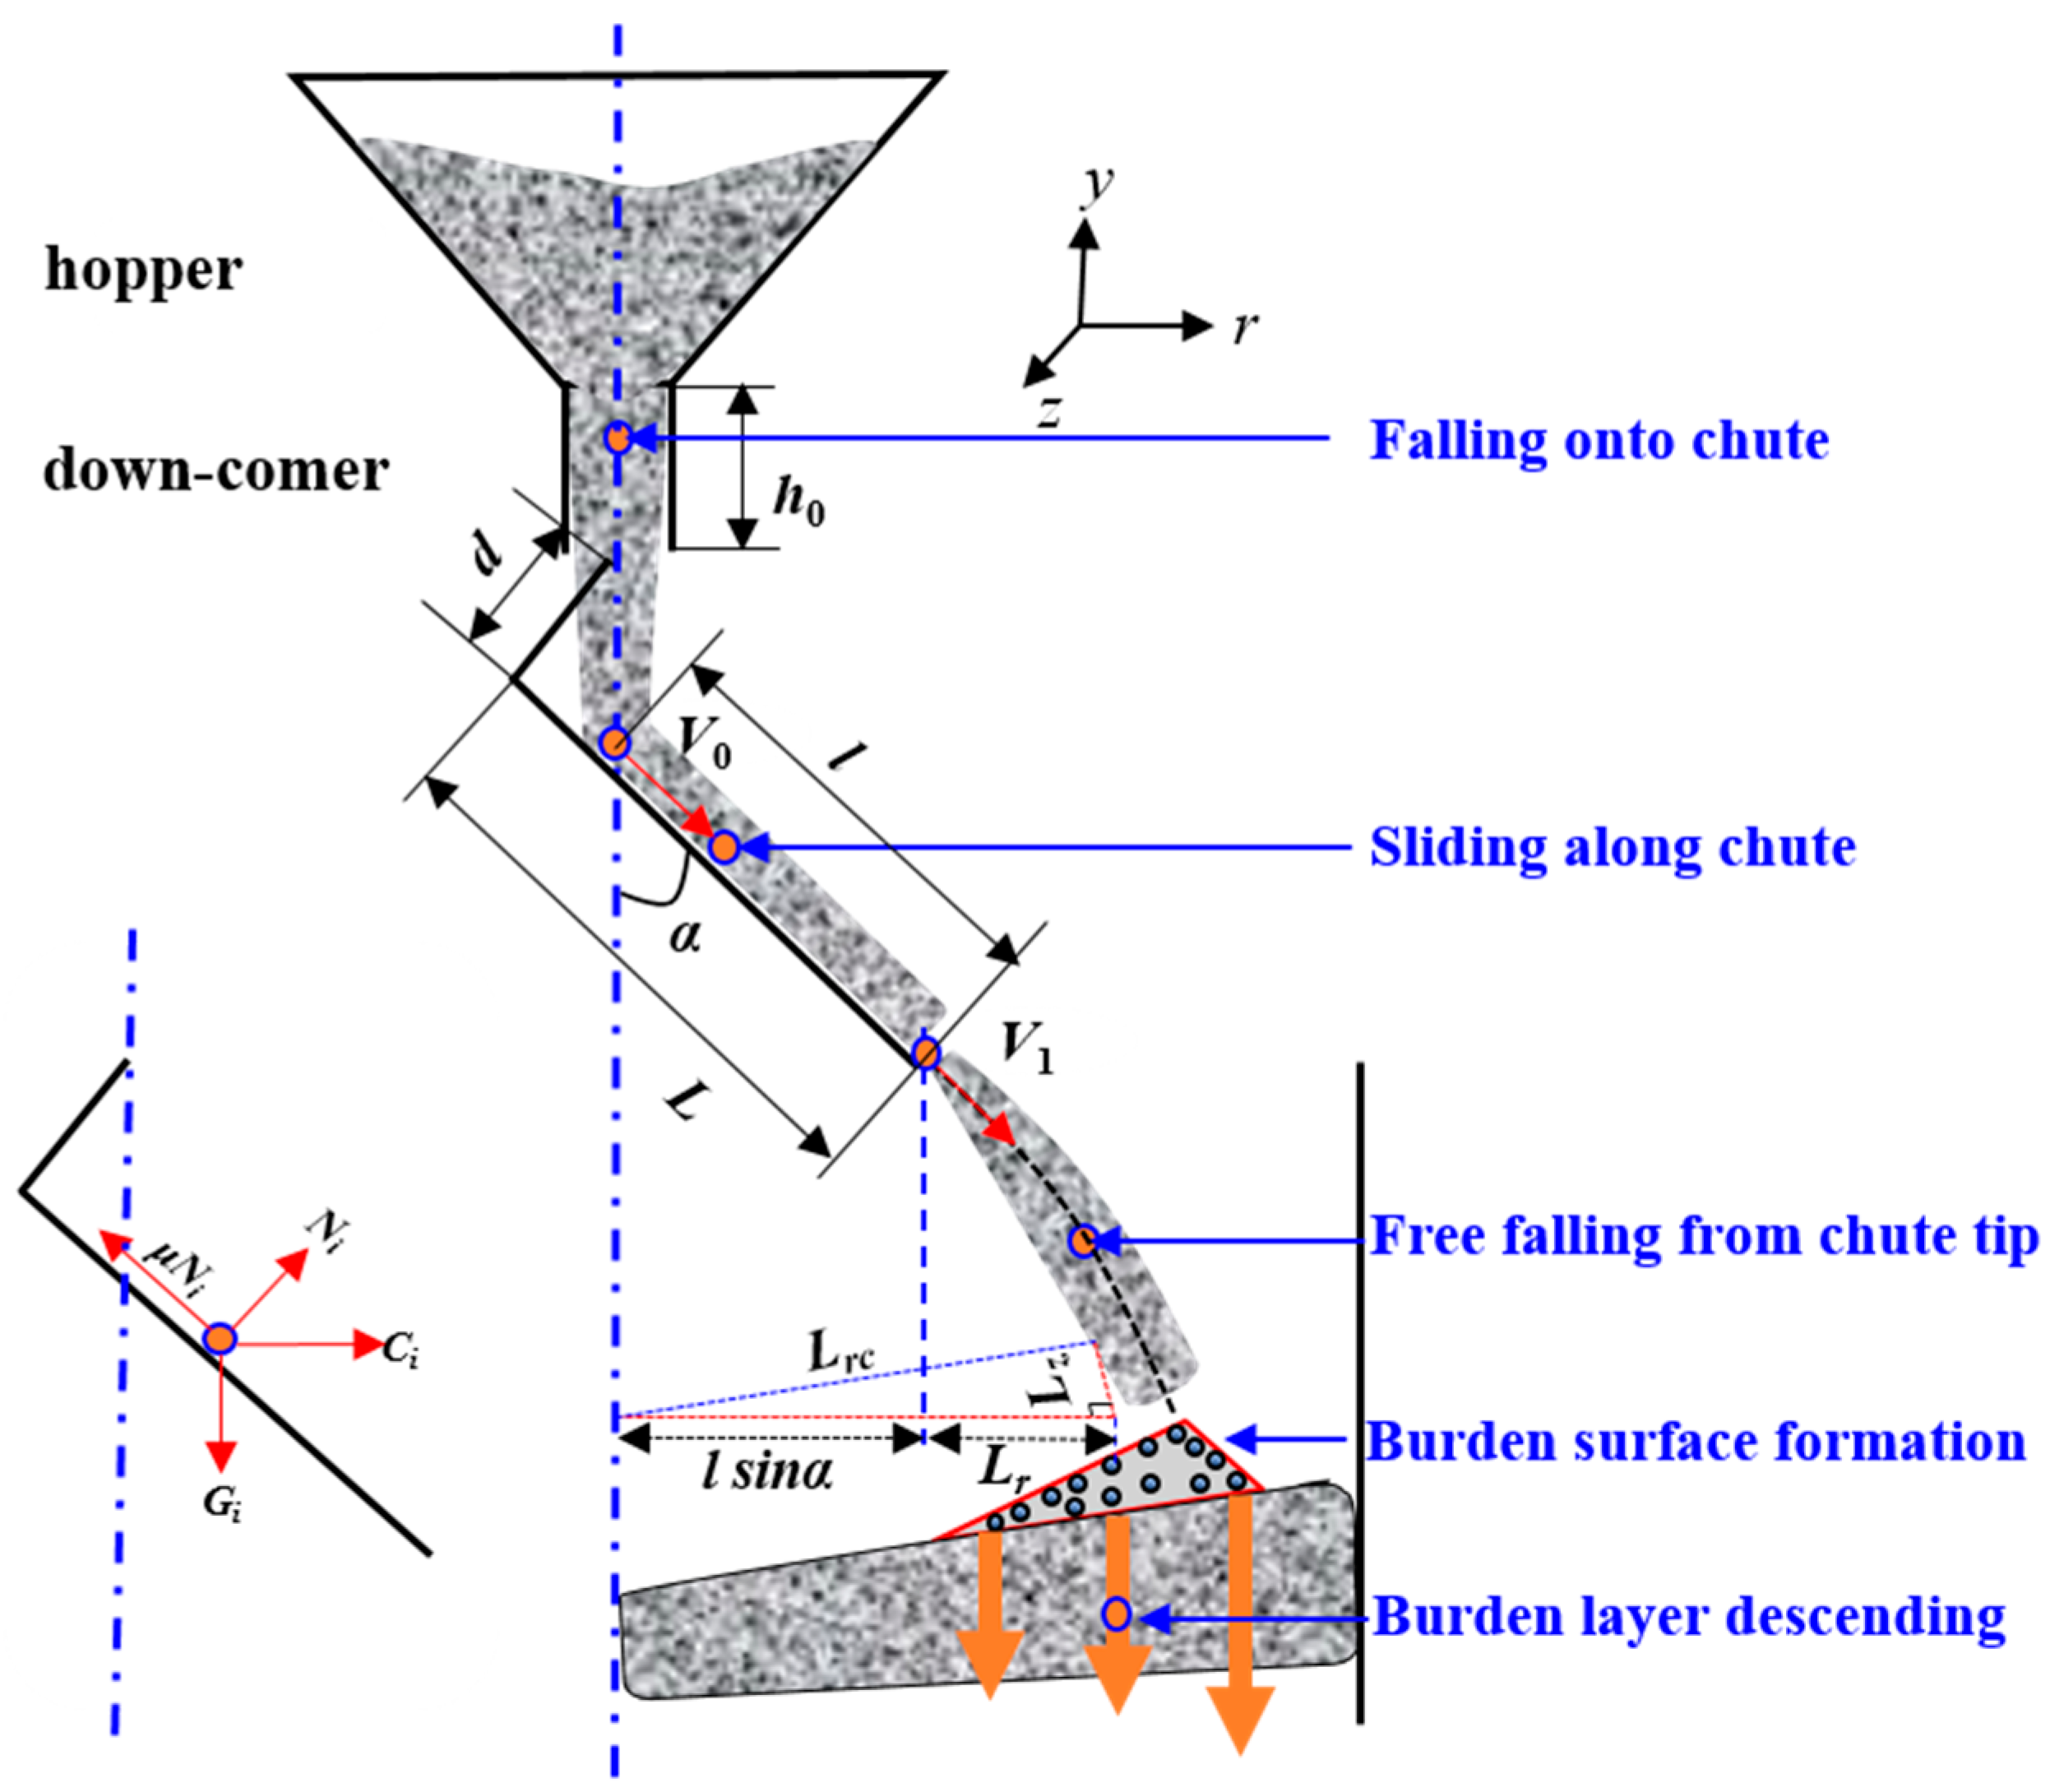
2.1. Free Falling from the Hopper onto the Chute

Particles of the burden material stored in the hopper fall onto the rotating chute through the down-comer. This motion is simplified by assuming that the flow of bulk stream is similar to the one of an individual particle, which is stationary when leaving the hopper and gains an exit velocity V0 along the direction of the chute:
V 0 = k 1 , i cos α 2 g ( h 0 + d sin α ) ;   i = coke ,   ore
where a correction coefficient, k_(1,i), is introduced to take into account the collision of the falling particles, which has been neglected in previous studies.

2.2. Sliding along the Chute

When the bulk stream strikes the chute, the velocity component perpendicular to the chute is assumed to be lost and all the particles slide along the chute over an effective distance, depending on the chute inclination ( l   =   L d / sin α ). Along this distance, the forces on each individual particle include the gravity force ( G i = m i g ), centrifugal force ( C i = m i ω 2 l sin α ), counteracting force ( N i = m i g sin α m i ω 2 l sin α cos α ), and frictional force corresponding to the sliding between the particle and chute inner wall ( f i = μ i N i = μ i m i sin α ( g ω 2 l cos α ) ). The resulting net force is thus
F i = m i g cos α μ i   m i sin α ( g ω 2 l cos α ) ;   i = coke ,   ore
The velocity at the end of chute is then obtained as
V 1 = V 0 2 + ω 2 sin α ( sin α + μ i cos α ) l 2 + 2 g ( cos α + μ i sin α ) l ;   i = coke ,   ore

2.3. Free Falling from the Chute Tip

Upon leaving the chute tip, the velocity of the bulk stream in the furnace throat is decomposed into three components in the vertical direction ( V r   =   V 1 sin α ), horizontal direction ( V y   =   V 1 cos α ), and rotation direction ( V z   =   ω   l sin α ). The distance from the stream center to the symmetric plane of the hopper (cf. Figure 1) can be expressed as
L r c = k 2 , i L r 2 + L z 2 = k 2 , i ( l sin α + t V 1 sin α ) 2 + ( t   l sin α ω ) 2   ;   i = coke ,   ore
with the specific time expressed as
t = ( V 1 cos α ) 2 + 2 g H V 1 cos α g   ;   i = coke ,   ore
where a correction coefficient, k_(2,i), is introduced to consider the effect of drag due to the ascending gas. The distances Lr and Lz (cf. Figure 1) are given as
L r = l sin α + t V 1 sin α
L z = t   l sin α   ω
with reference to the axes, and the trajectory of the bulk stream in the free board is therefore derived as
y = L r 2 ( g 2 V 1 2 sin 2 α ) r r ( 1 tan α ( g l V 1 2 sin α ) ) ( g l 2 2 V 1 2 + d sin α )

2.4. Burden Surface Formation

If the top surface of the burden in the BF is known at the moment when the bulk stream falls from the chute tip, the impact point can be obtained as the intersection of the top surface with the trajectory of the bulk stream. The impact point is then used as the radial coordinate for the apex of the burden layer to be formed. The surface of the newly formed layer can thus be shaped with the impact point and the repose angle (RA) of each specific material to be charged [11,14]. It should be kept in mind that the aforementioned RA is different from the so-called natural repose angle because the former one usually depends on the constraints associated with the furnace wall, the shape of the initial burden surface, and the ascending gas. Additionally, the RA varies as charging proceeds, thus leading to different growth mechanisms of the burden layer. The RAs are calculated as
β in = β in , max
β out = β in , max ( β in , max β out , min ) α α min α max α min
Other details concerning the treatments of the formation of the burden layer can be found in [12].

2.5. Burden Layer Descent

The behavior of burden descent in the BF has been studied extensively and intensively in the literature [1,3,6,11,12,27,28,29,30,31]. The path lines of the solid in the BF can be generally assumed as depicted in Figure 2, where plug flow is the main solid flow pattern in the upper and middle zones (i.e., lumpy zone), while a slight convergent flow and a dead man zone dominate in the lower bosh zone. In the current work, the classical central radiation approach [27,28] that generally reflects the solid flow pattern in the BF lumpy zone is adopted to track each individual burden layer as it descends. It can be seen from the figure that materials charged into a certain radial region (e.g., 0.4 R–0.6 R) will preserve their relative radial position and continue to descend along the shaded area in the figure, thus gradually stretching in the horizontal direction. As the volume of a layer is assumed to remain constant, the layer gradually becomes thinner upon descent. A function (cf. Equation (11)) was built to allow for a specified radial distribution of the burden descent rate and to update the positions of the edges of the layers during the descent, thus tracking the layers.
u y = a + b   r / R
These five fundamental steps, as well as their mathematical description, form the basis for the present model of the BF burden distribution, which is designed as three modules: a burden charging module, a descending module, and a layer structure module. Figure 3 shows a flowchart that outlines the working principles of the modules. In a normal calculation, a base bed is initiated in the simulated region. After entering the charging matrix and some other parameters required, a dump is “charged” by turning on the module of burden charging, which estimates the layer formed on top of the initial bed. Then, the module of burden descending is triggered and the bed is lowered slowly at the bottom, followed by the descent of the overlaying layers, until the stock line (at a given radial position) is below a given set point (i.e., similar to the logics built based on radar signals in the real process). Then, the dump layer is charged, the procedure is repeated, and so on, until a quasi-stationary state is reached, and local information on the ore-to-coke ratio and volume fraction of the burden is extracted using the module of the burden structure.
In a normal calculation, a base bed is initiated in the simulated region. After entering the charging matrix and some other parameters required, a dump is “charged” by turning on the module of burden charging, which estimates the layer formed on top of the initial bed. Then, the module of burden descending is triggered and the bed is lowered slowly at the bottom, followed by the descent of the overlaying layers, until the stock line (at a given radial position) is below a given set point (i.e., similar to the logics built based on radar signals in the real process). Then, the dump layer is charged, the procedure is repeated, and so on, until a quasi-stationary state is reached, and local information on the ore-to-coke ratio and volume fraction of the burden is extracted using the module of the burden structure.

3. Results

3.1. Initial and Boundary Conditions

As outlined in the calculation flow chart of Figure 3, the input boundary parameters include the furnace geometry parameters, the physical property parameters of the burden materials, the charging matrix, the shape of the initial burden surface, and the descent-rate profile. For a specific BF, the first two parameter sets are fixed, while the other three are decided by the operators. Table 1 shows an example of a charging matrix, which reports the different materials charged, the “dump size” (expressed as mass), and how the different rings of burden are charged by the chute. Practically always, for the convenience of the operator, the chute angle is discretized into a number (typically 10–12) of settings, and the number of rings for each chute setting is reported. In addition to this information, a stand has to be taken on the charging level (stock line level at the moment of charging) and the chute direction (wall to center, or center to wall).

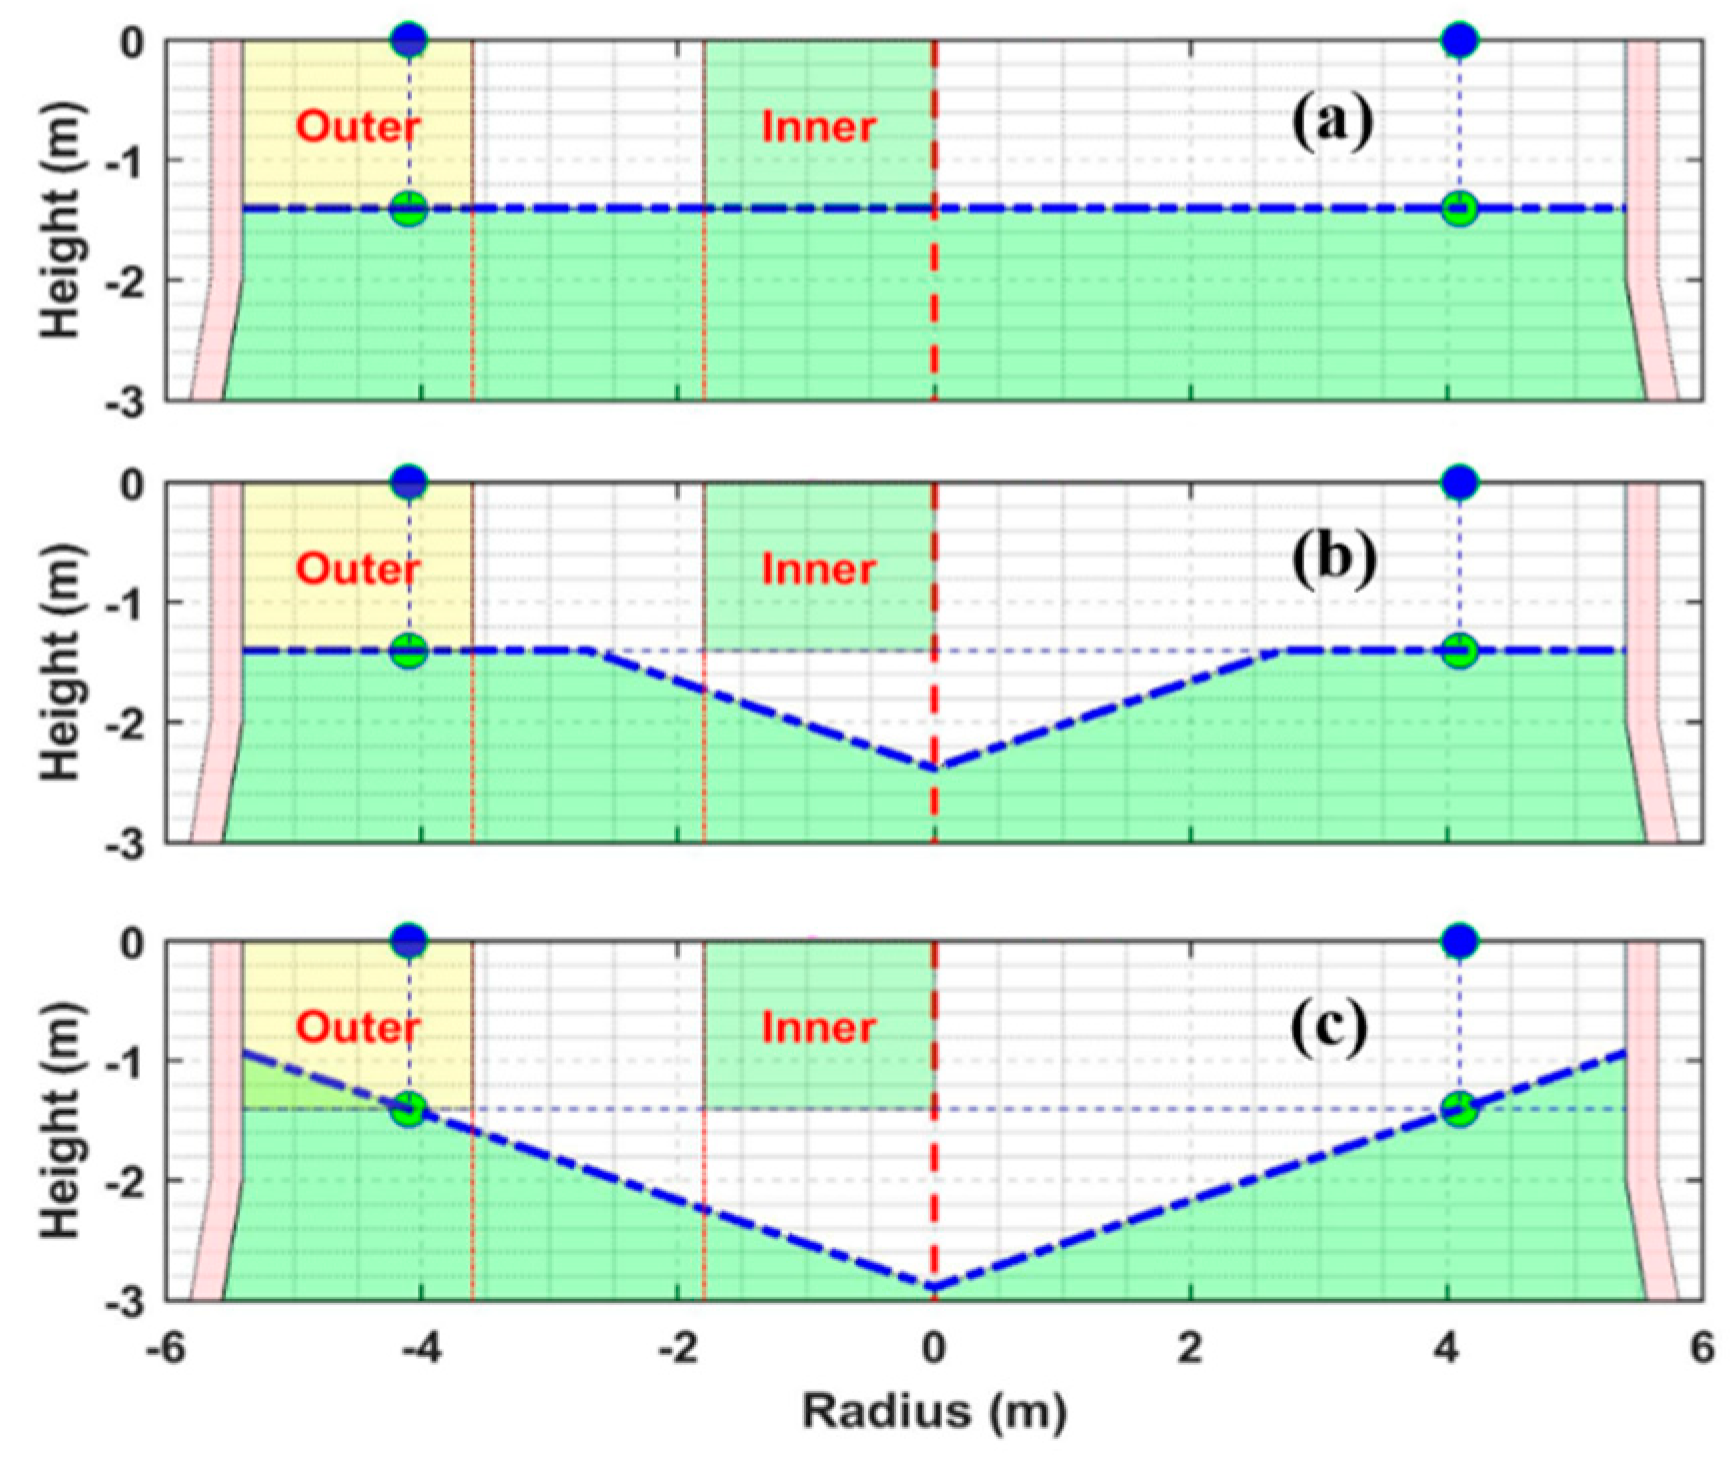
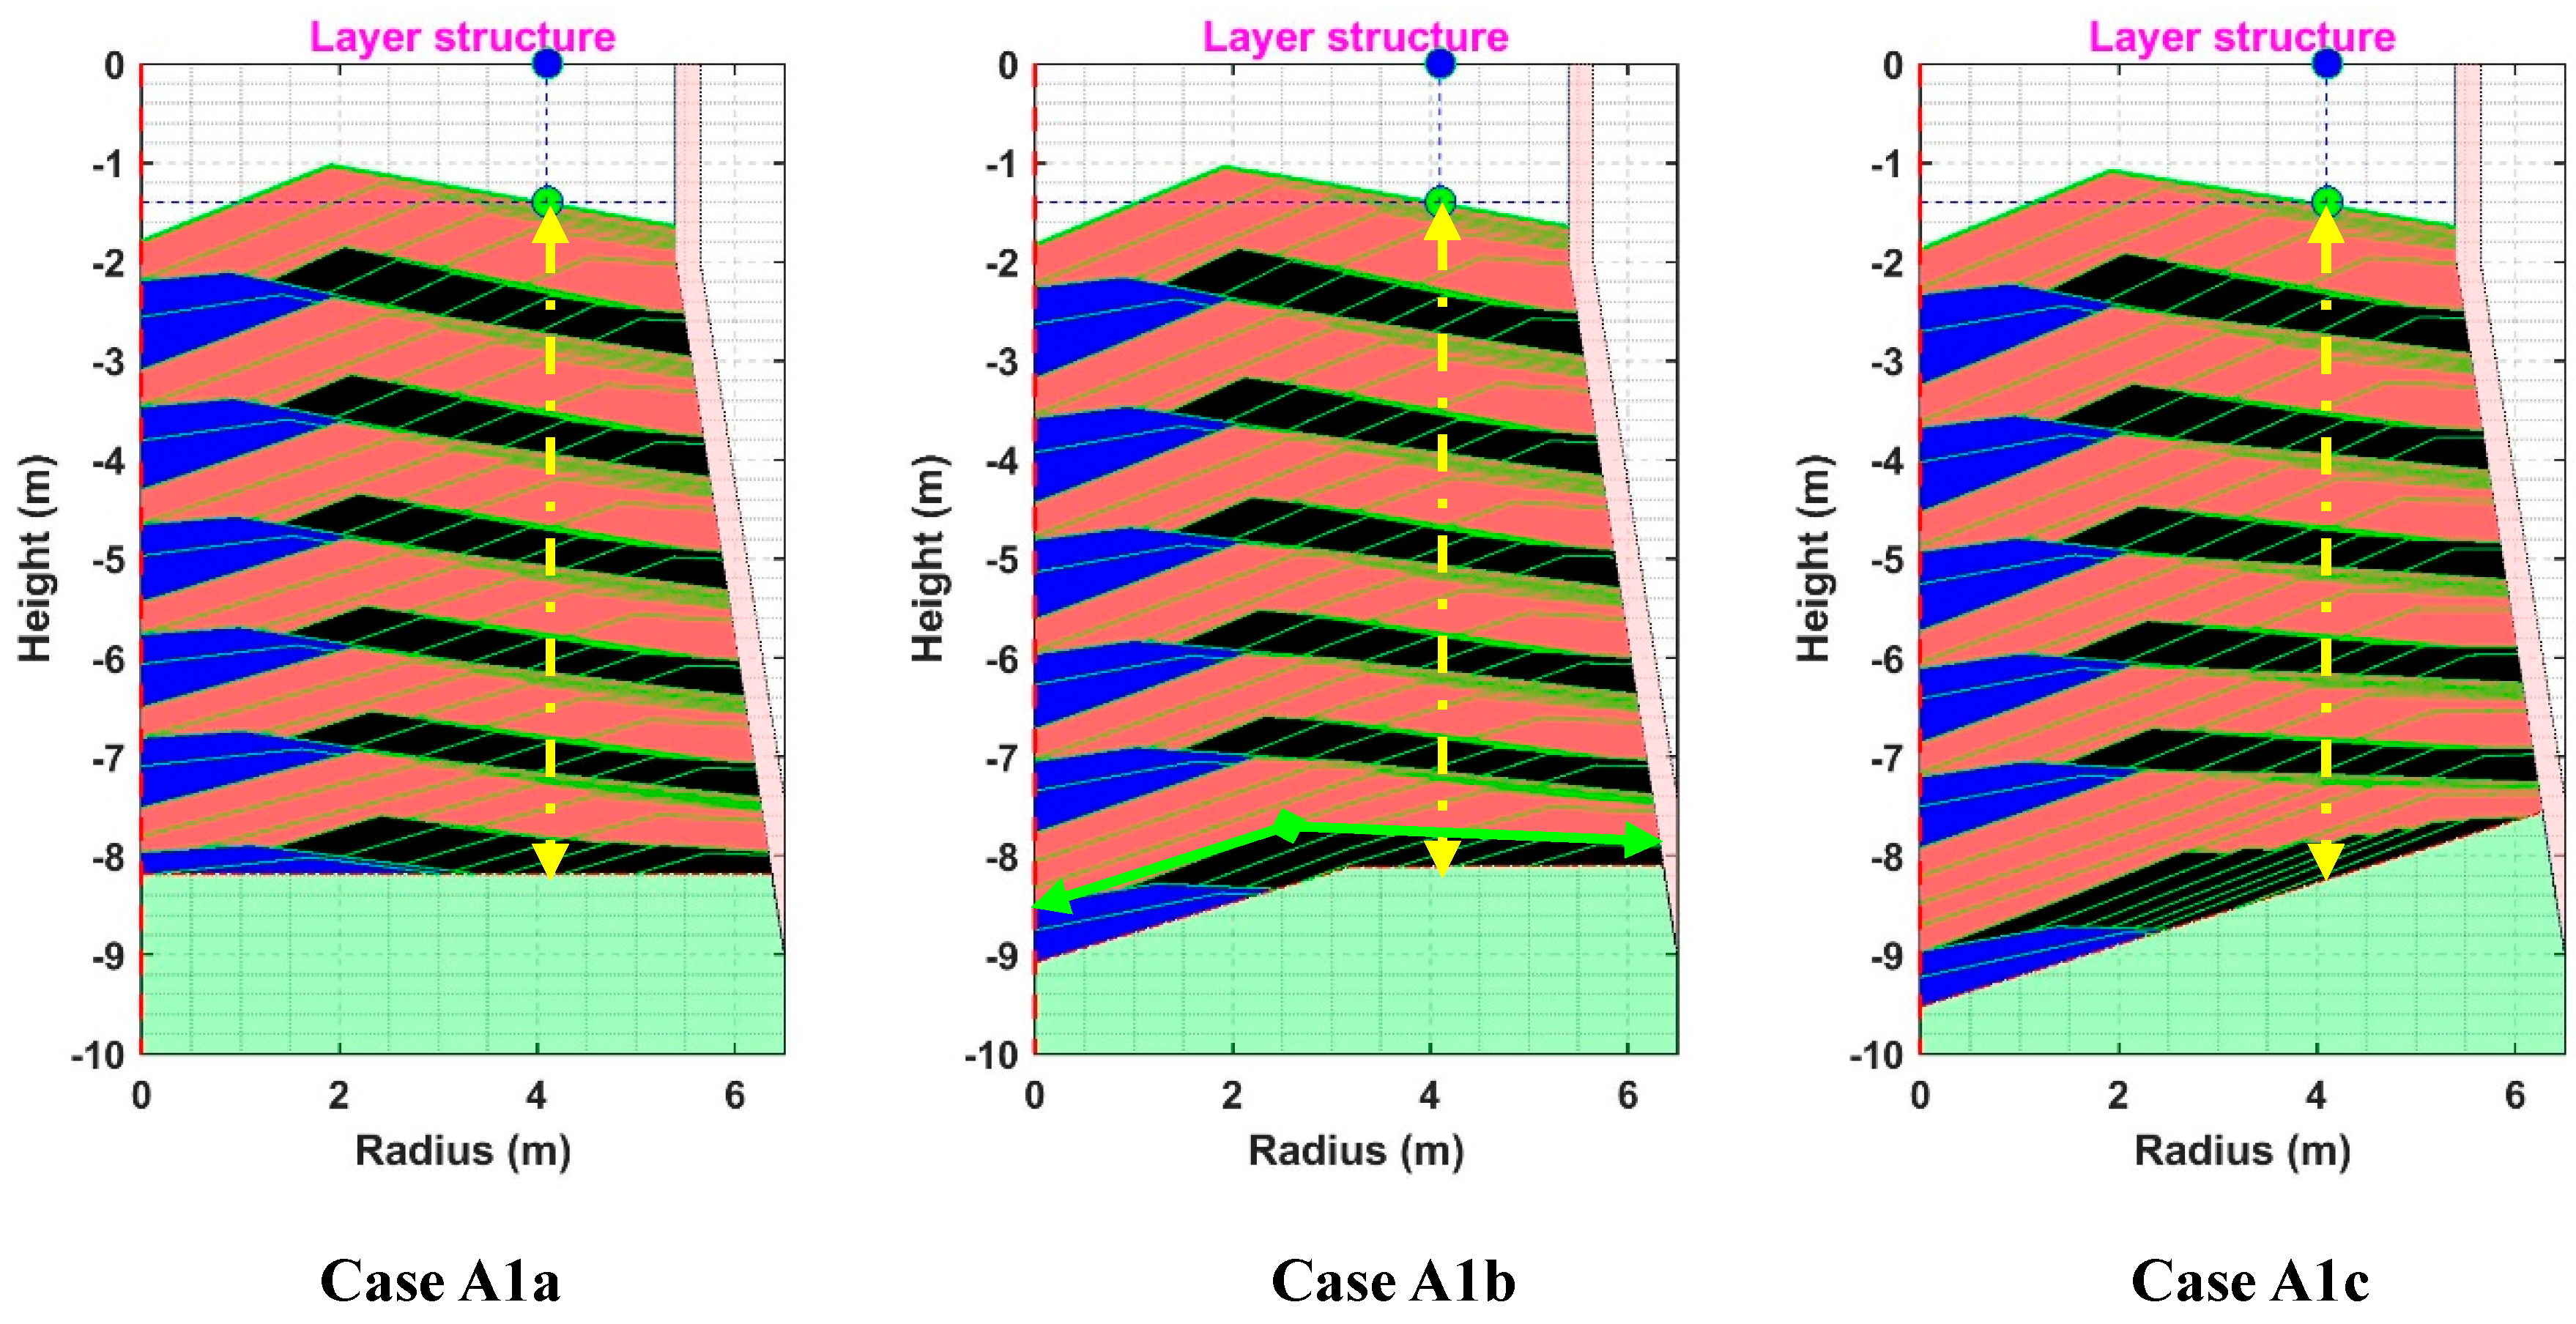
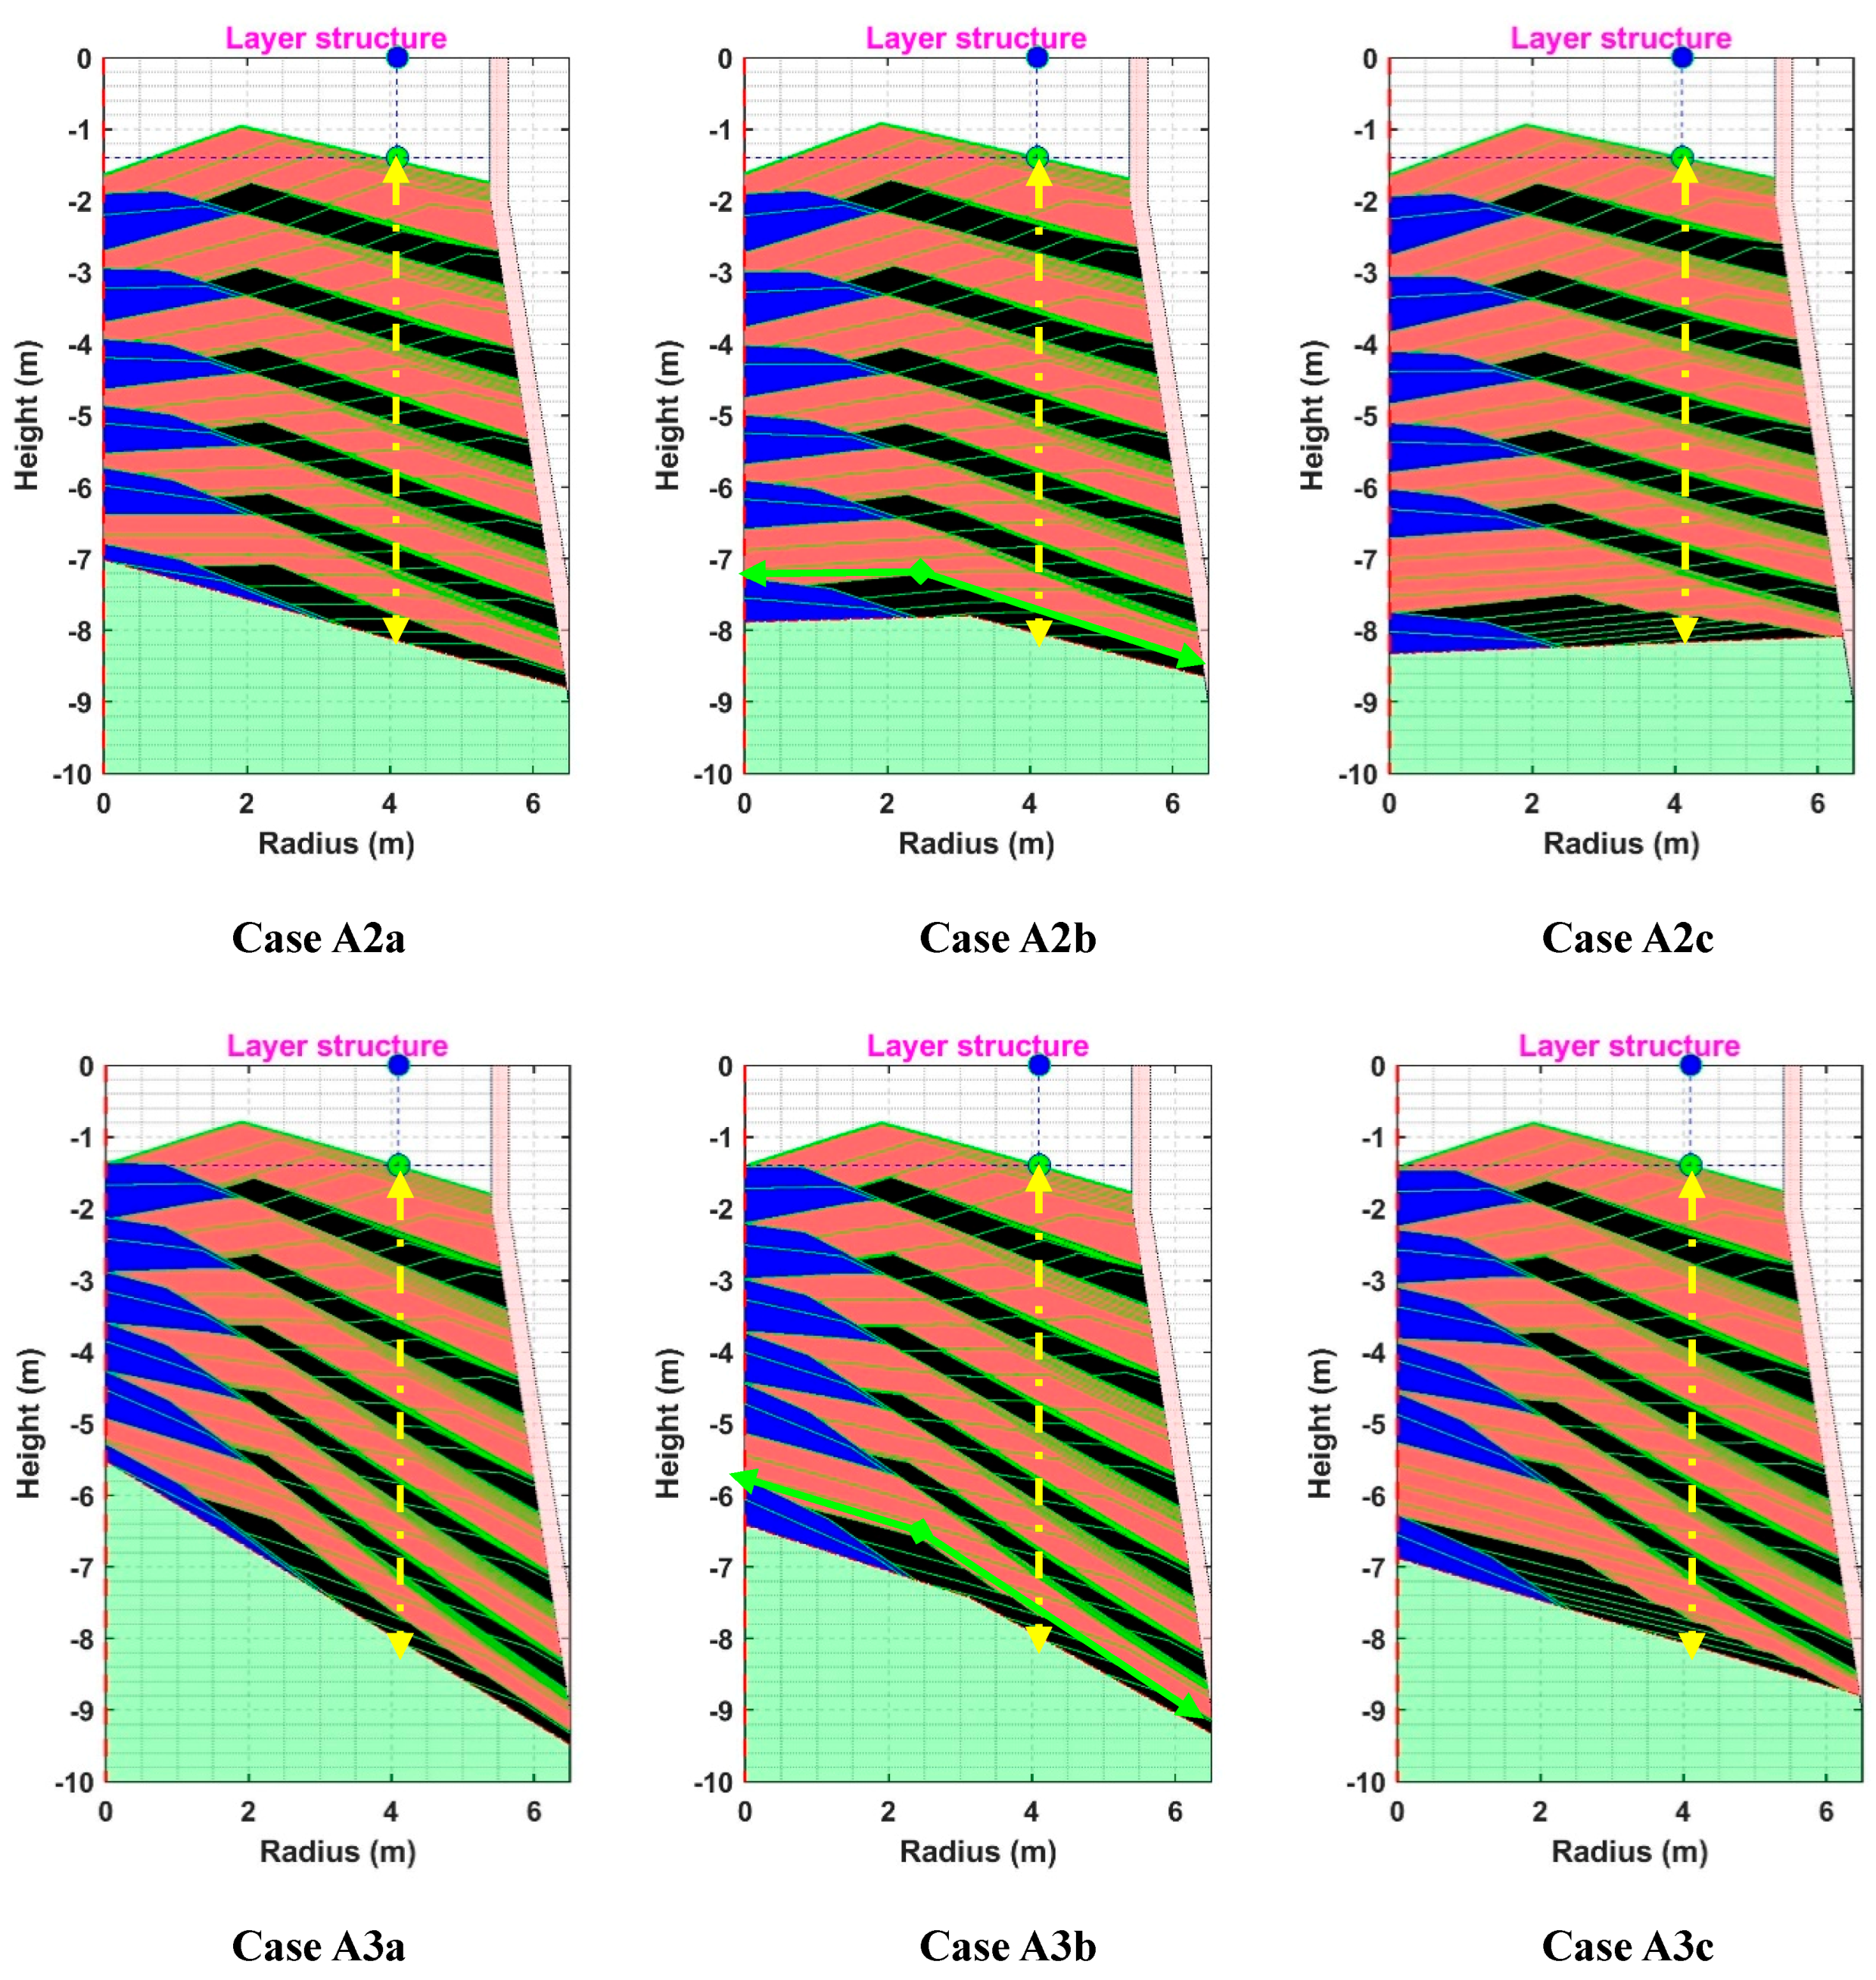
3.2. Effect of Burden Descent-Rate Distribution and Initial Surface

Profile meter measurements [2,27,28,29] have indicated that the burden descent rate is usually larger in the peripheral area than in the central area. Different burden descent models have been proposed [13,24,30,31]. In this paper, a classical “central radiation method” [12,31] was adopted to study the burden descent. Even though the model may consider an arbitrary distribution of the descent rate, in the examples to be illustrated, we use the three relative descent-rate distributions depicted in Figure 4.
The shape of the initial burden surface has a significant influence on the distribution of the material layers. Therefore, to replicate the state under a stable operation, the model has to be run a sufficient number of passes (periods or batches) through the charging program to eliminate the effect of the initial state. As an example, three kinds of initial burden surface profiles are shown in Figure 5, which will be used to illustrate the effect. These initial states can be characterized by the size of the plateau part, which, in the first case, extends over the whole radius and, in the second case, represents half of the radius, while the final case shows no plateau.
In order to illustrate the model, the cases shown in Table 2 were studied to investigate the influence of the initial burden surface and the descent-rate profile on the arising layer structure in the shaft, using the three descent-rate profiles of Figure 4 and three initial burden surfaces of Figure 5. In the cases studied, the charging matrix of Table 1 was applied, charging a new dump when the burden surface at the point of the (simulated) radar reached the set point (z = 1.4 m) indicated by the green solid circle at the end of the dashed vertical line in Figure 5. Denoting the descent rates by 1–3 and the initial surfaces by a–c, the nine investigated cases will be abbreviated as follows: CaseA2c, for instance, denotes the system where the rings are charged from the wall to the center (labelled A) using the middle burden descent-rate pattern of Figure 4 and the V-shaped initial burden surface profile of Figure 5. The charging program was repeated for six passes to make the distribution of upper layers reach a quasi-stationary state, leading to a state where the initial bed had descended to the z ≈ 8 m level in the shaft.
The effects of different initial burden surfaces and descent-rate profiles on the layer structure in the upper shaft are shown in Figure 6, where the yellow arrowed dashed line represents that the descent distance (at the radial position of the radar) of the bed is the same in the nine cases. The top panels of the figure show the resulting layer structure for the case with a uniform descent rate and the central panels represent the results for the case where the descent rate varies moderately in the radial direction, while the bottom panels represent the results for the most extreme descent-rate distribution (labelled 1–3 in Figure 4). Correspondingly, the left, middle, and right panels of Figure 6 depict the effect of the initial burden surface shape, from the horizontal case to the V-shaped case (labelled a–c in Figure 5).
As the results on all panel rows show, for the same burden descent-rate distribution, the influence of the initial surface profile on the burden distribution gradually decays, and recurring layer patterns occur after about four passes through the charging program. Therefore, the topmost layers (Center coke/Coke/Ore) are identical in the three figures.
If the initial burden surface profile is same (i.e., moving along the columns in Figure 6), compared with the uniform descent-rate profile (top panels), the slope of the burden top surface near the furnace center decreases with the increase of the relative descent rate at the sidewall, and the slope of the ore and coke layer further decreases along with the descent in the shaft, accompanied by the increase in furnace diameter. The green arrowed lines in the middle column highlight how the shape of the upper part of the coke layer (formed by the first two coke dumps in the charging sequence) is affected by the descent-rate distribution. The shape of the upper part of the coke layer forms a center hopper and edge plateau according to the axially symmetric principle when the descent rate is uniform for Case A1b. As the relative descent rate increases linearly from the center to the wall, the shape is transformed into a center plateau and edge hopper shape for Case A2b or an Λ shape for Case A3b during the descending process.
An example of the gradual changes experienced in the burden top surface profile and in the radial ore/coke distribution is depicted in Figure 7, which shows the conditions for Case A1c. It can be seen that the top-layer profile rapidly converges: Figure 7a indicates that the layer profile only changes marginally after two passes through the charging program. The difference volume ∆V between the top surfaces after two consecutive passes through the charging program can be taken as a criterion used to judge whether the burden distribution has reached a (quasi-)stationary state. The changes in volume, ∆V, between two such consecutive batches, are reported in the upper left part of Figure 7a. The second batch is ∆V = 19.11 m3 larger than the first one and the third is 4.28 m3 smaller than the second one, but the difference between the sixth and fifth batch is only ∆V = 0.08 m3, i.e., completely marginal. Therefore, one may use a condition, e.g., |∆V| < 0.2 m3, as an indication that a quasi-stationary condition has been reached in the model. The corresponding changes in the ore/coke thickness ratio distribution are shown in Figure 7b. The ore/coke ratio of the first batch is fundamentally different from that of the latter ones, which are seen to rapidly converge. The reason for the large change experienced between the first two batches is, naturally, that the initial burden profile differs from that corresponding to the quasi-stationary state.
Therefore, in the calculation of the burden distribution for a charging matrix, a sufficient number of passes through the charging program is needed to stabilize the system. Otherwise, the result may be misleading and differ considerably for the true conditions. Based on the above results, it may be concluded that the effects of the initial burden surface and the descent-rate profile should be considered in simulations and physical experiments.

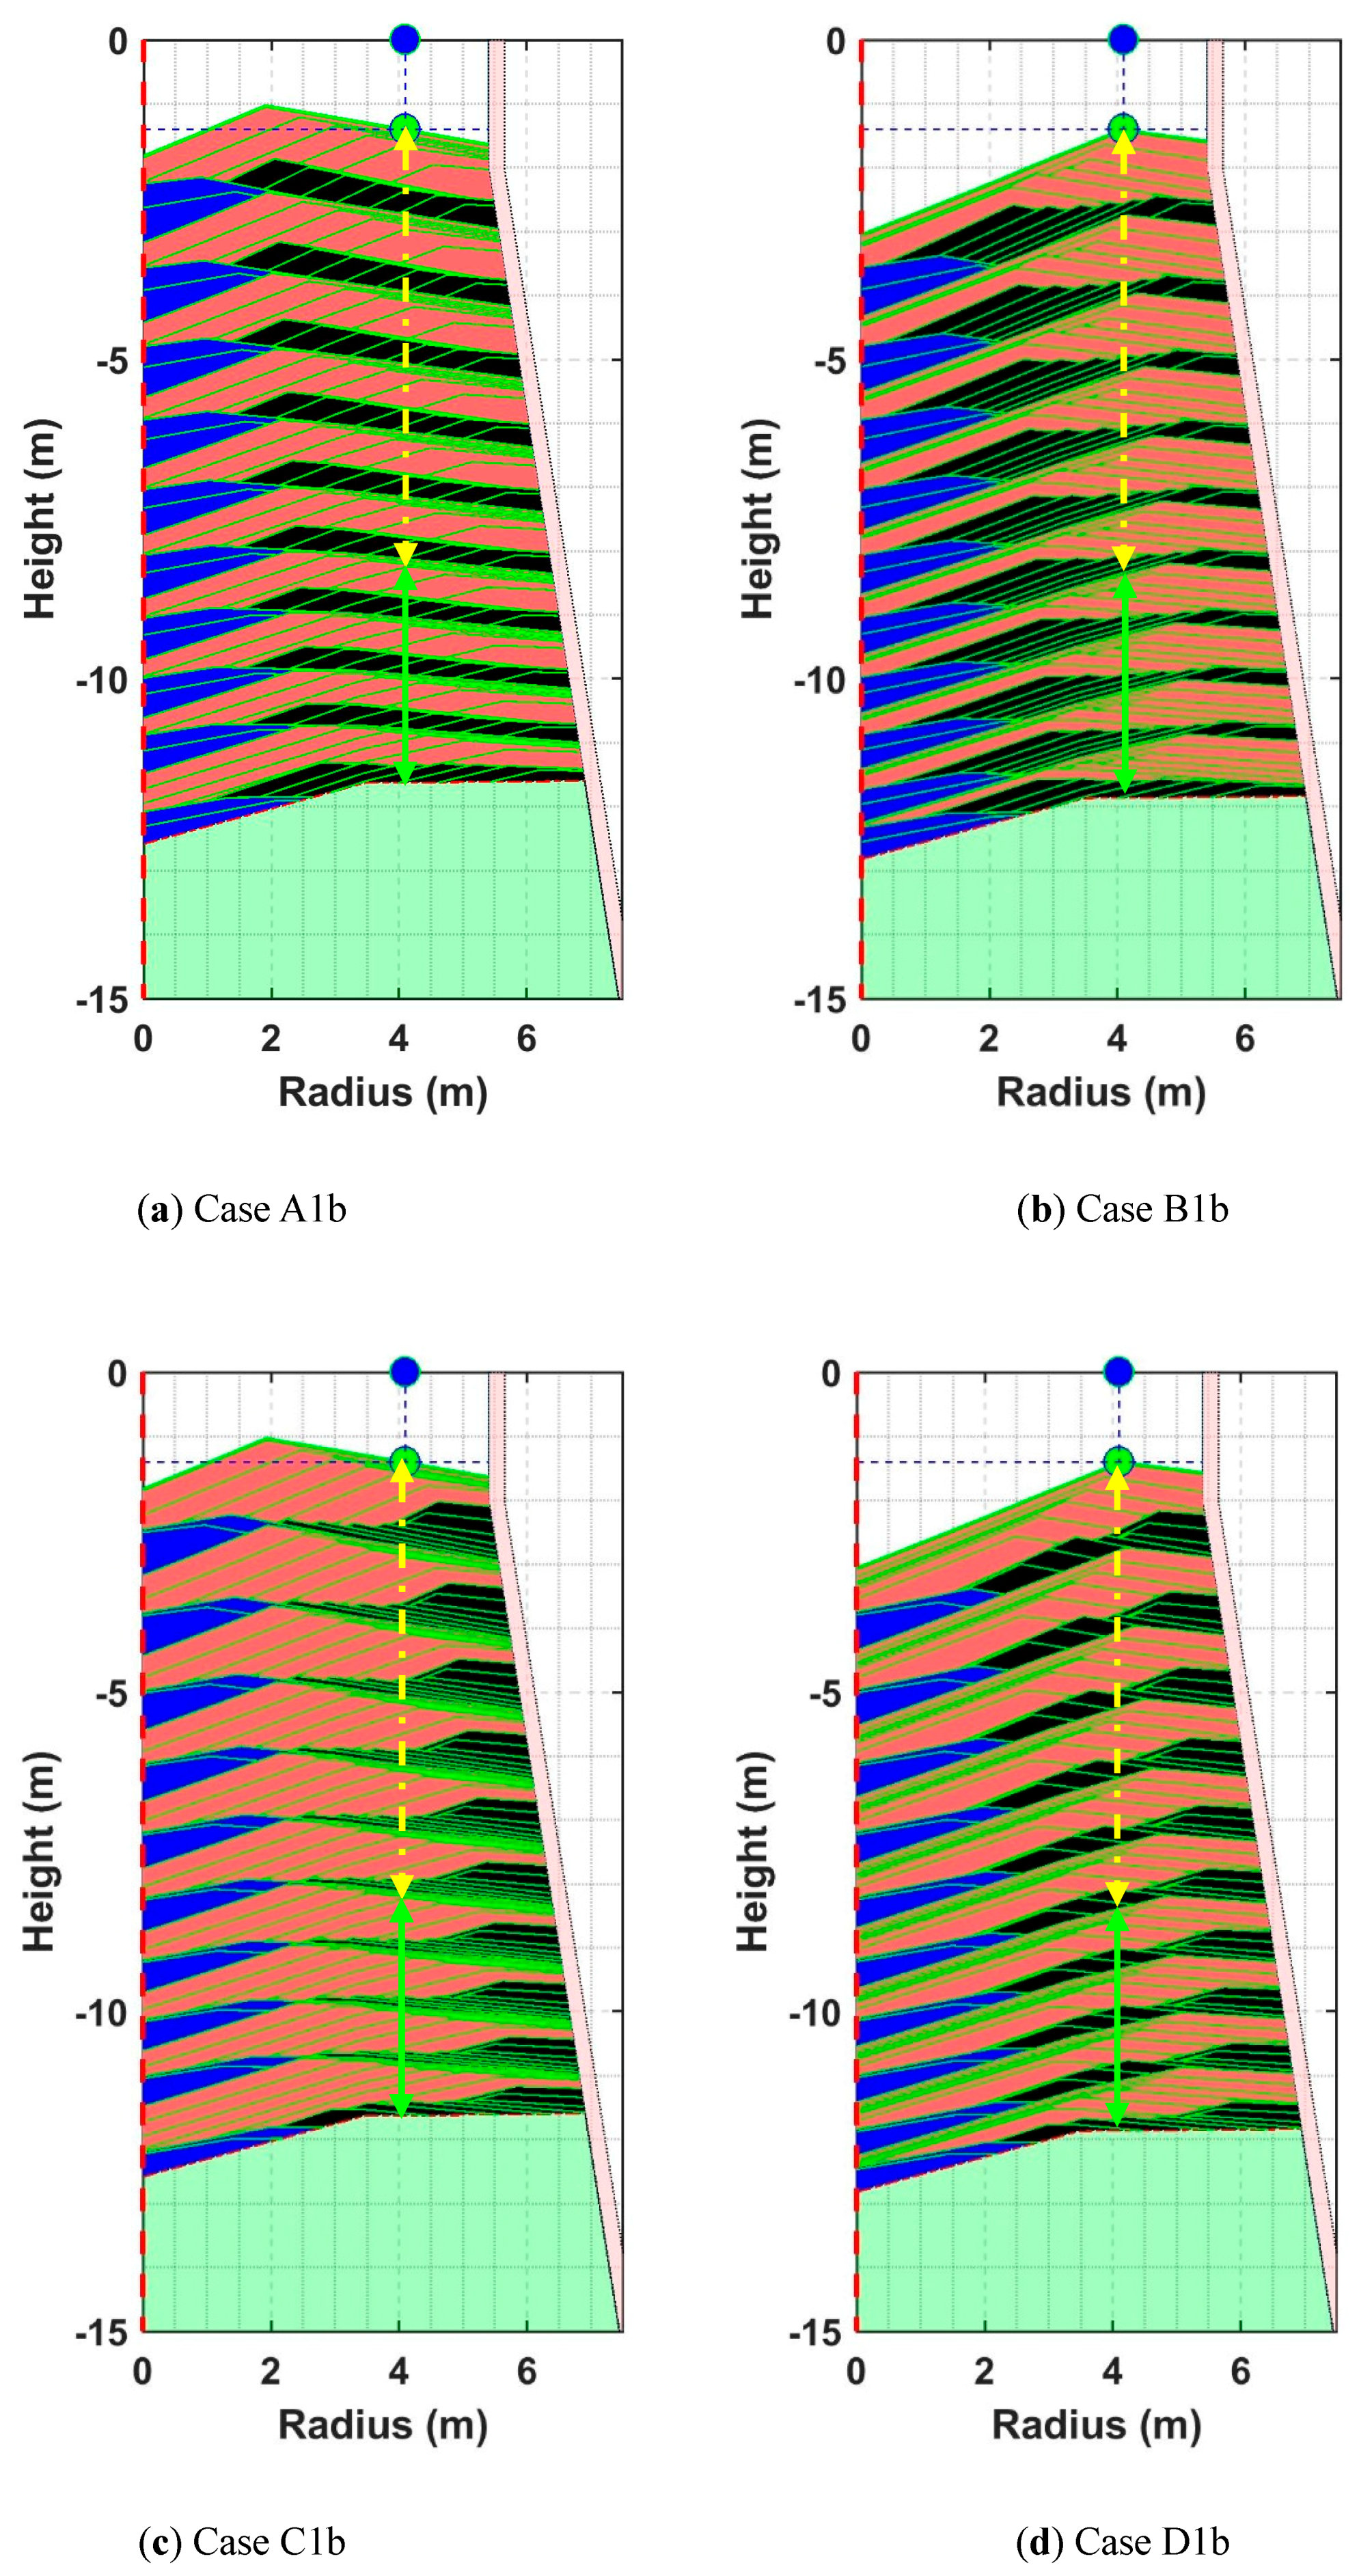
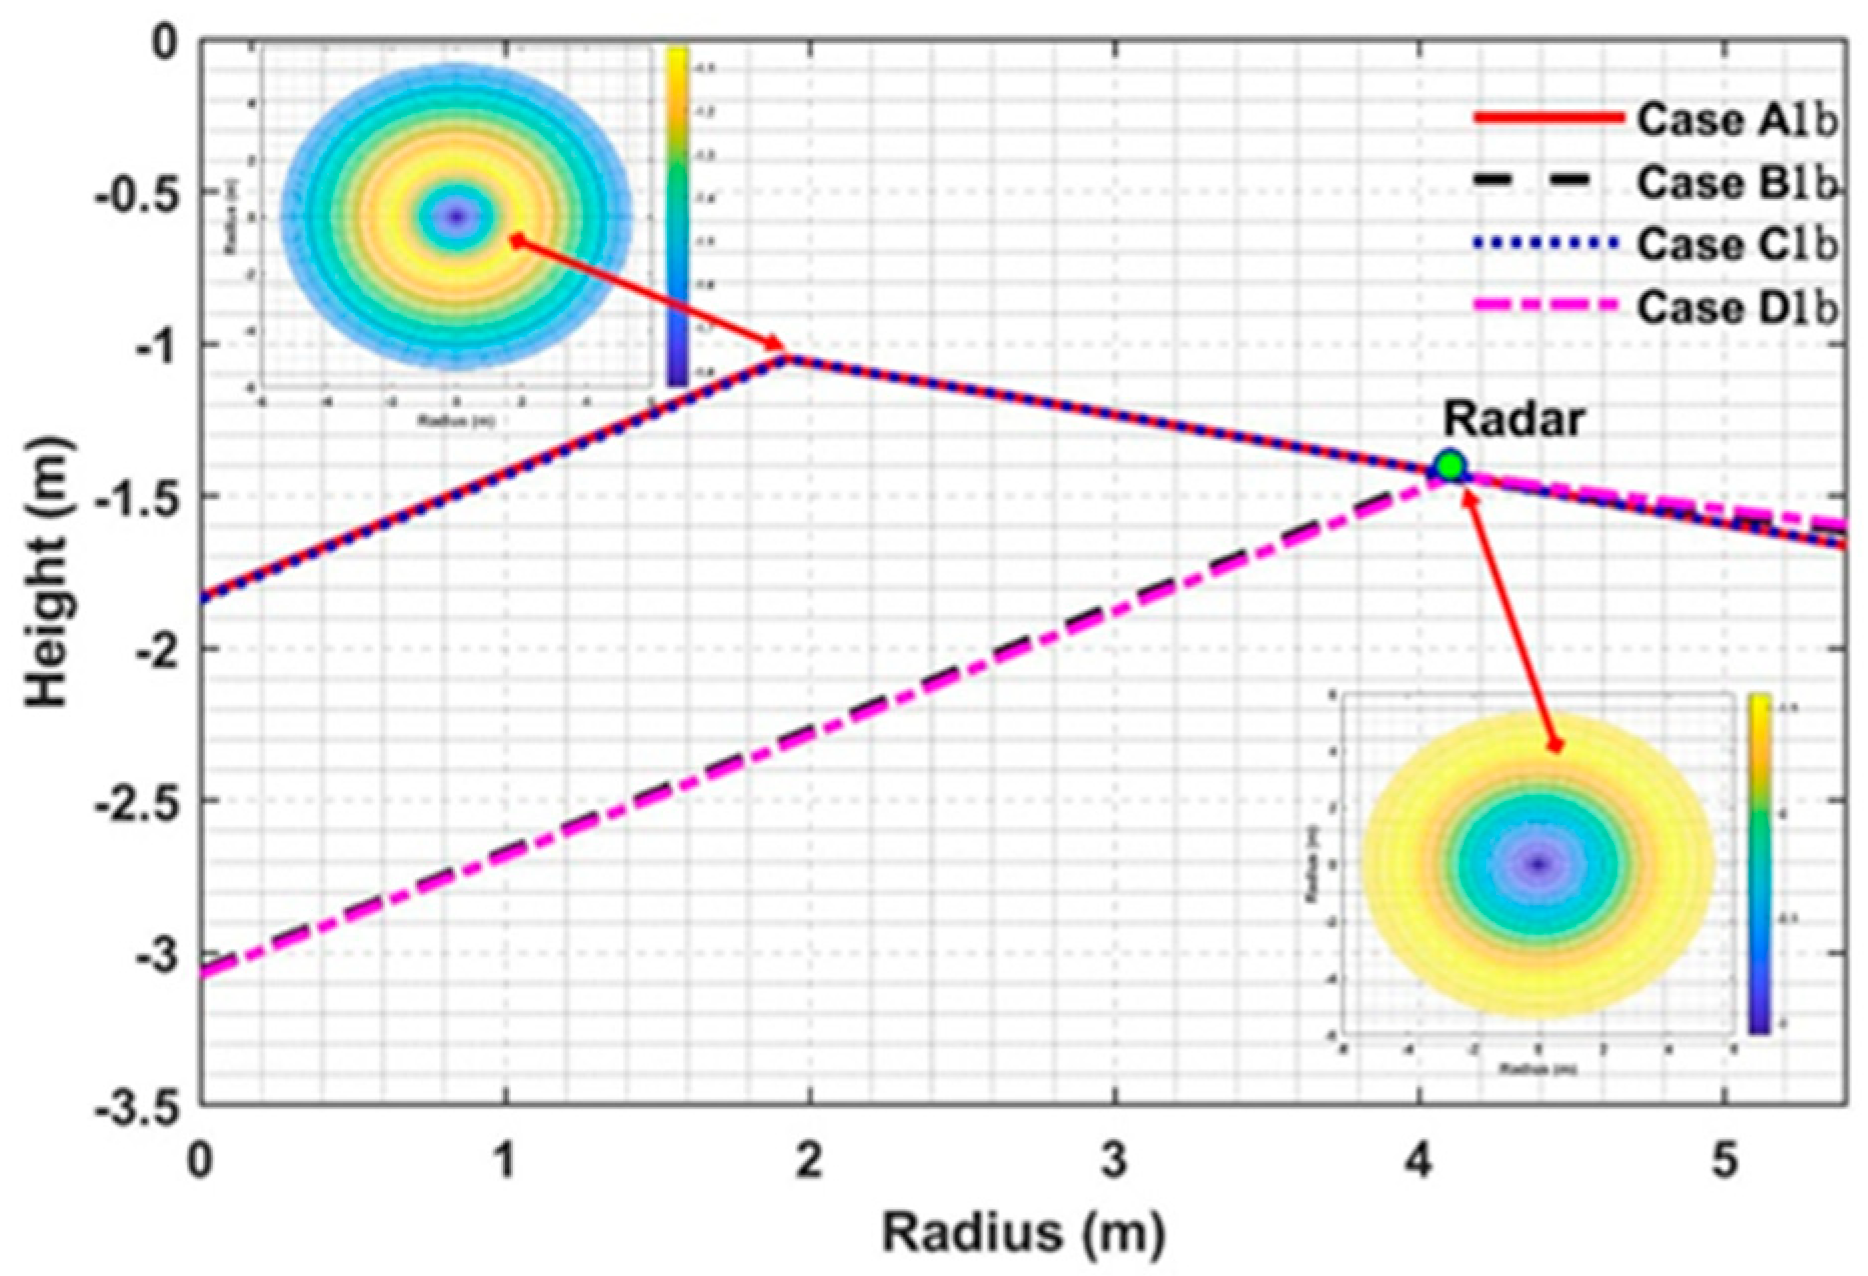
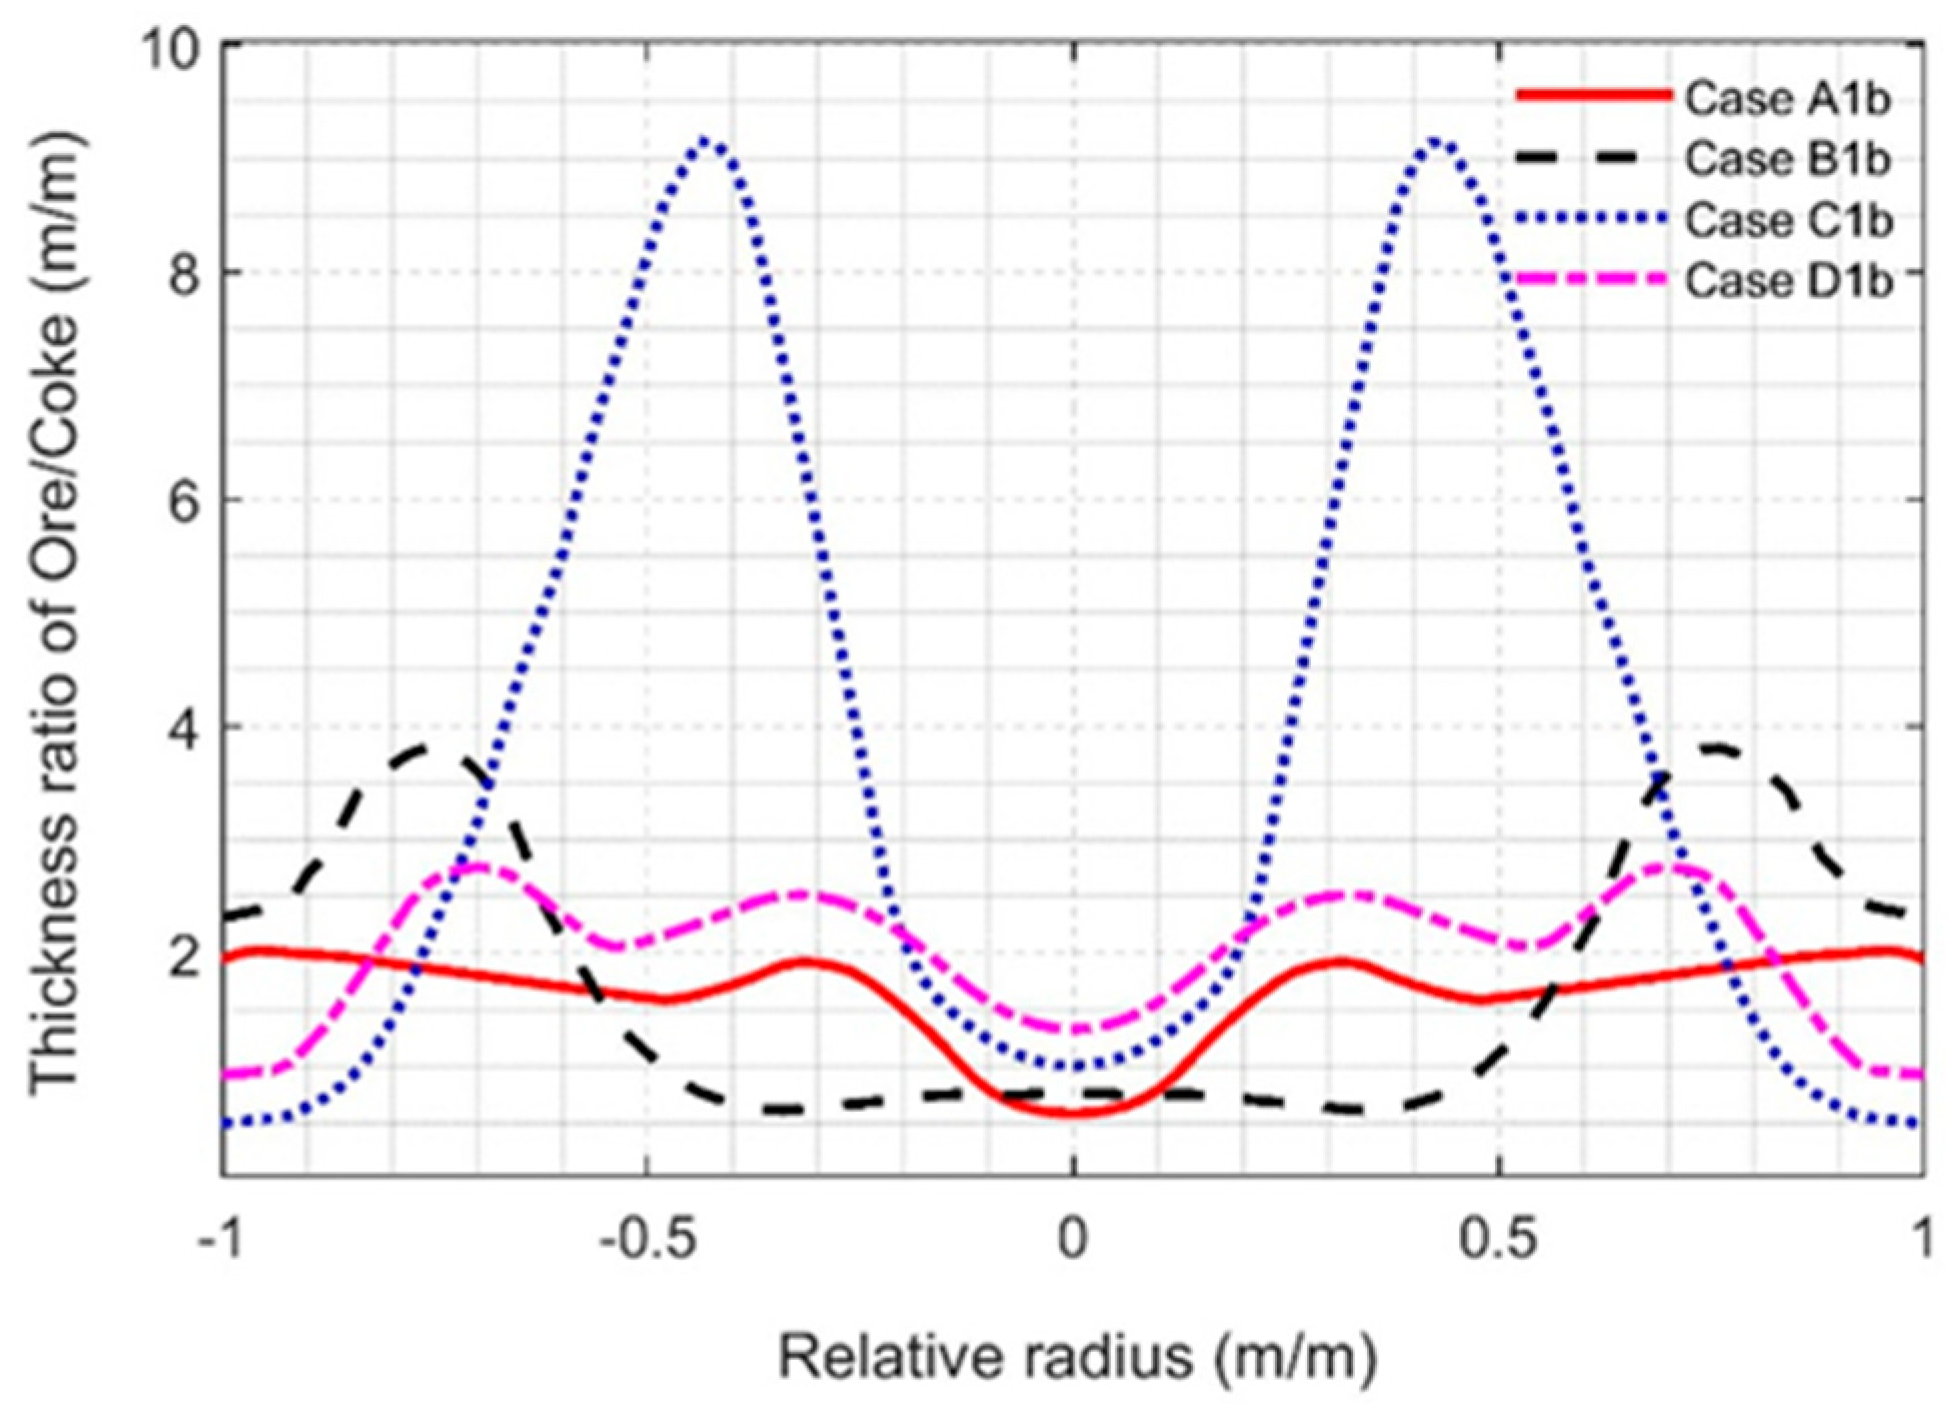
3.3. Effect of Charging Direction

The direction in which the chute moves when rings of a burden dump are formed on the burden surface, here called the charging direction, is either outward from the center to the wall (C → W) or inward from the wall to the center (C → W). Furthermore, charging programs may be designed where a mixed charging direction is applied, i.e., charging some dumps in one direction and some in the other. The effect of the charging direction on the arising burden layer structure is smaller for charging programs where the dump size is small, since there are fewer rings. However, as the BFs grow in size, the dump size increases gradually, and therefore also the number of rings in the charging program, which emphasizes the effect of the charging direction. Here, the effect is illustrated by four simulations, where the charging matrix of Table 1 is applied using a uniform descent-layer distribution and the initial burden surface with a plateau at the wall. Table 3 presents the conditions denoted by Cases A1b–D1b.
In order to eliminate the effect of the initial burden surface profile in the illustration, four additional passes through the charging programs were included. The arising burden layer distributions for the cases are shown in Figure 8. For the purpose of illustration, the results are divided into two parts, where the zone spanned by the green arrowed line represents the dynamic region where a stable burden surface is established, and the region spanned by the dashed yellow line represents the quasi-stationary state. Analyzing the region spanned by the yellow dashed lines in the figure, the effects of the charging directions on the arising burden-layer structure can be explored.
Analyzing the region spanned by the yellow dashed lines in Figure 8, the effects of four cases with different charging directions on the arising burden-layer structure can be analyzed. The figure clearly shows that the charging direction plays a very important role in the distribution of the layers. Comparing Case A1b and Case B1b (cf. Figure 8a,b), where the only difference is the charging direction of the ore rings, the burden distribution changes substantially: from a case with a rather uniform distribution of ore and coke, the pattern changes to a distribution where clearly more coke is charged into the central region, while the share of ore increases in the outer part of the shaft. This would lead to considerable changes in the gas distribution, partly due to changes in the gas permeability in the lumpy zone and partly due to changes in the coke slits in the cohesive zone.
The change between Case A1b and Case C1b, where the charging direction is flipped, leads to more dramatic changes in the burden distribution (cf. Figure 8c): the center coke and the following coke dump are split into two almost distinct parts due to the separating action of the ore layer, the apex of which falls between the two coke layers. This gives rise to a rather extreme distribution, with very little coke in the intermediate region and very little ore in the peripheral region. The effect on the coke slits is expected to be even more dramatic, forcing the gas to the central and peripheral region.
Finally, the case with an opposite charging direction, from the center to the wall, for all dumps (Figure 8d), gives rise to a relatively uniform distribution of ore and coke over the radius, but still with a fundamentally different layer formation than in Case A1b.
A detailed scrutiny of the rings and layers shows how the charging order affects the gradually stacked layer structure and how this influences the outcome if the layer is formed from the center to the wall or from the wall to the center, due to the overlapping effect of the rings. It is also interesting to note that the surface of the ore layer is practically equal in Cases A1b and C1b, as well as in Cases B1b and D1b. Therefore, for these pairs, coke is charged on the same burden surface (cf. Figure 9), but the internal structures of the cases in a pair are fundamentally different. This is seen in Figure 10, which presents the radial ore/coke layer thickness distribution. This graph shows that the base case (Case A1b) gives rise to a relatively uniform distribution, followed by Case D1b and Case B1b, while Case C1b is the clearly most non-uniform one.
Even though the examples presented concern a simple three-dump charging program, the options provided by changing the charging direction highlighted the inherent flexibility in the design of charging programs that aim at obtaining a desired layer structure. Summarizing the findings, the design of charging programs is a very complicated process and different burden distributions may arise, even though the burden surface profile for certain dumps is identical.

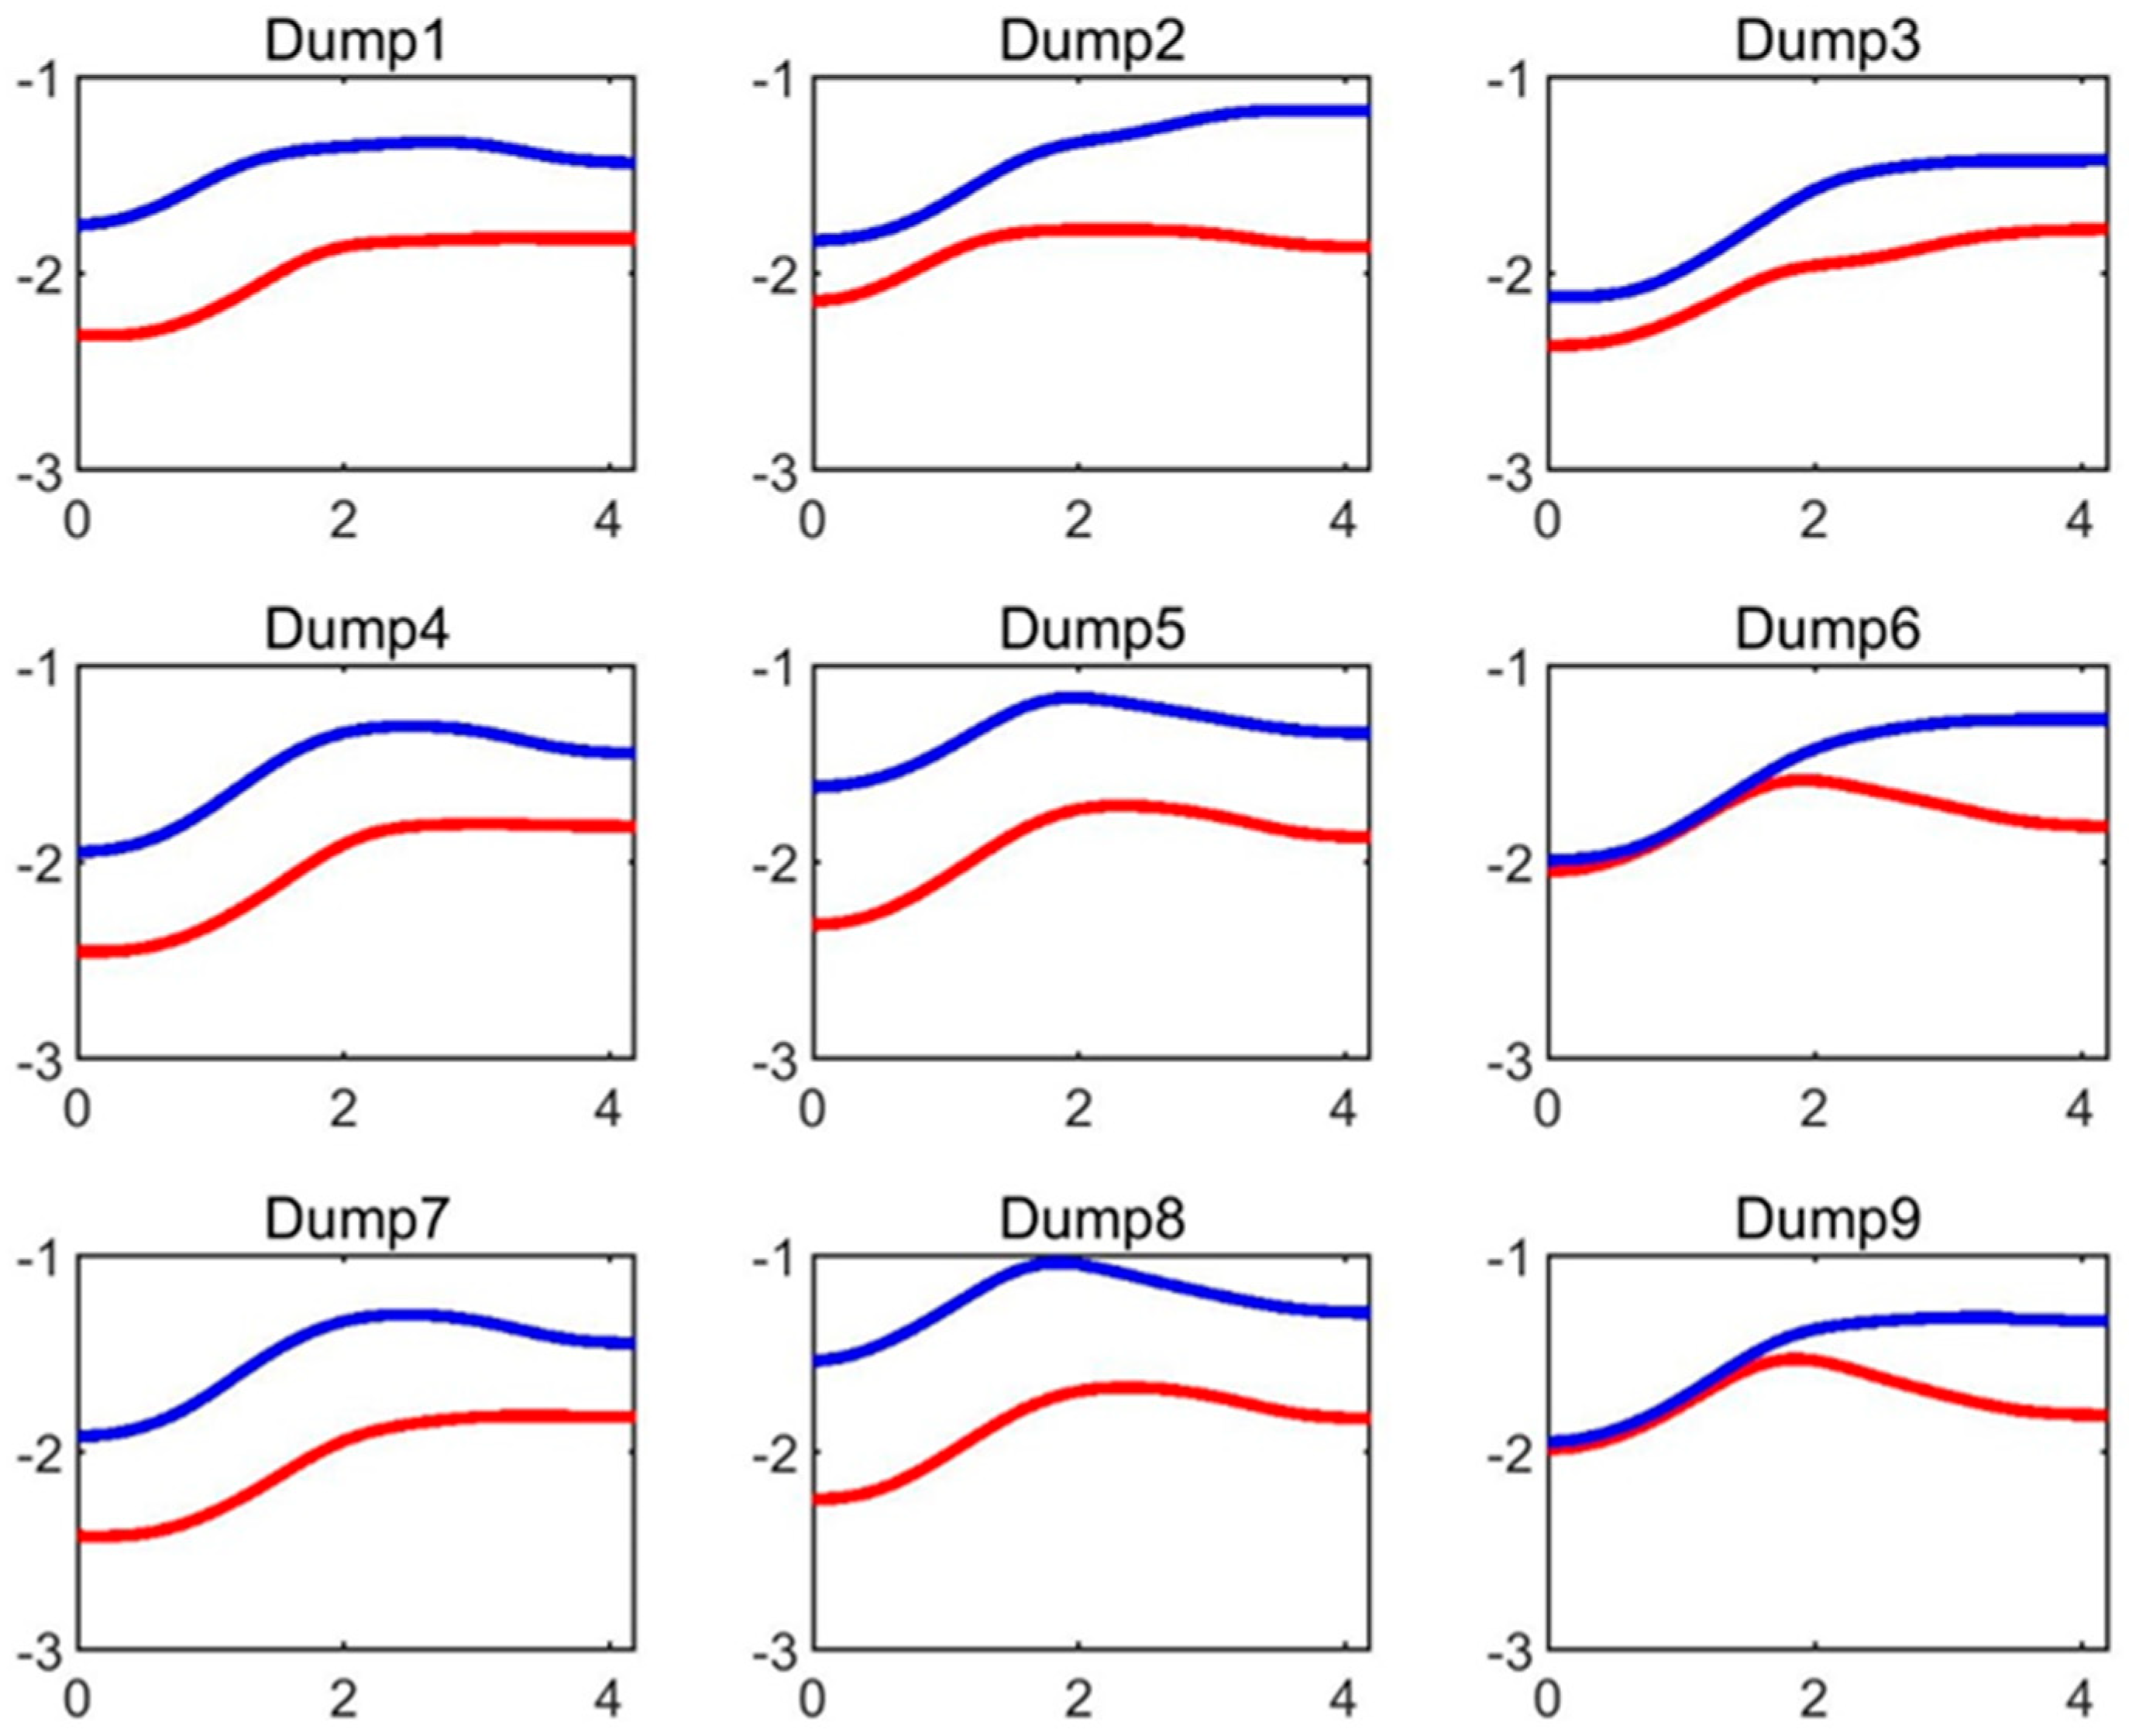
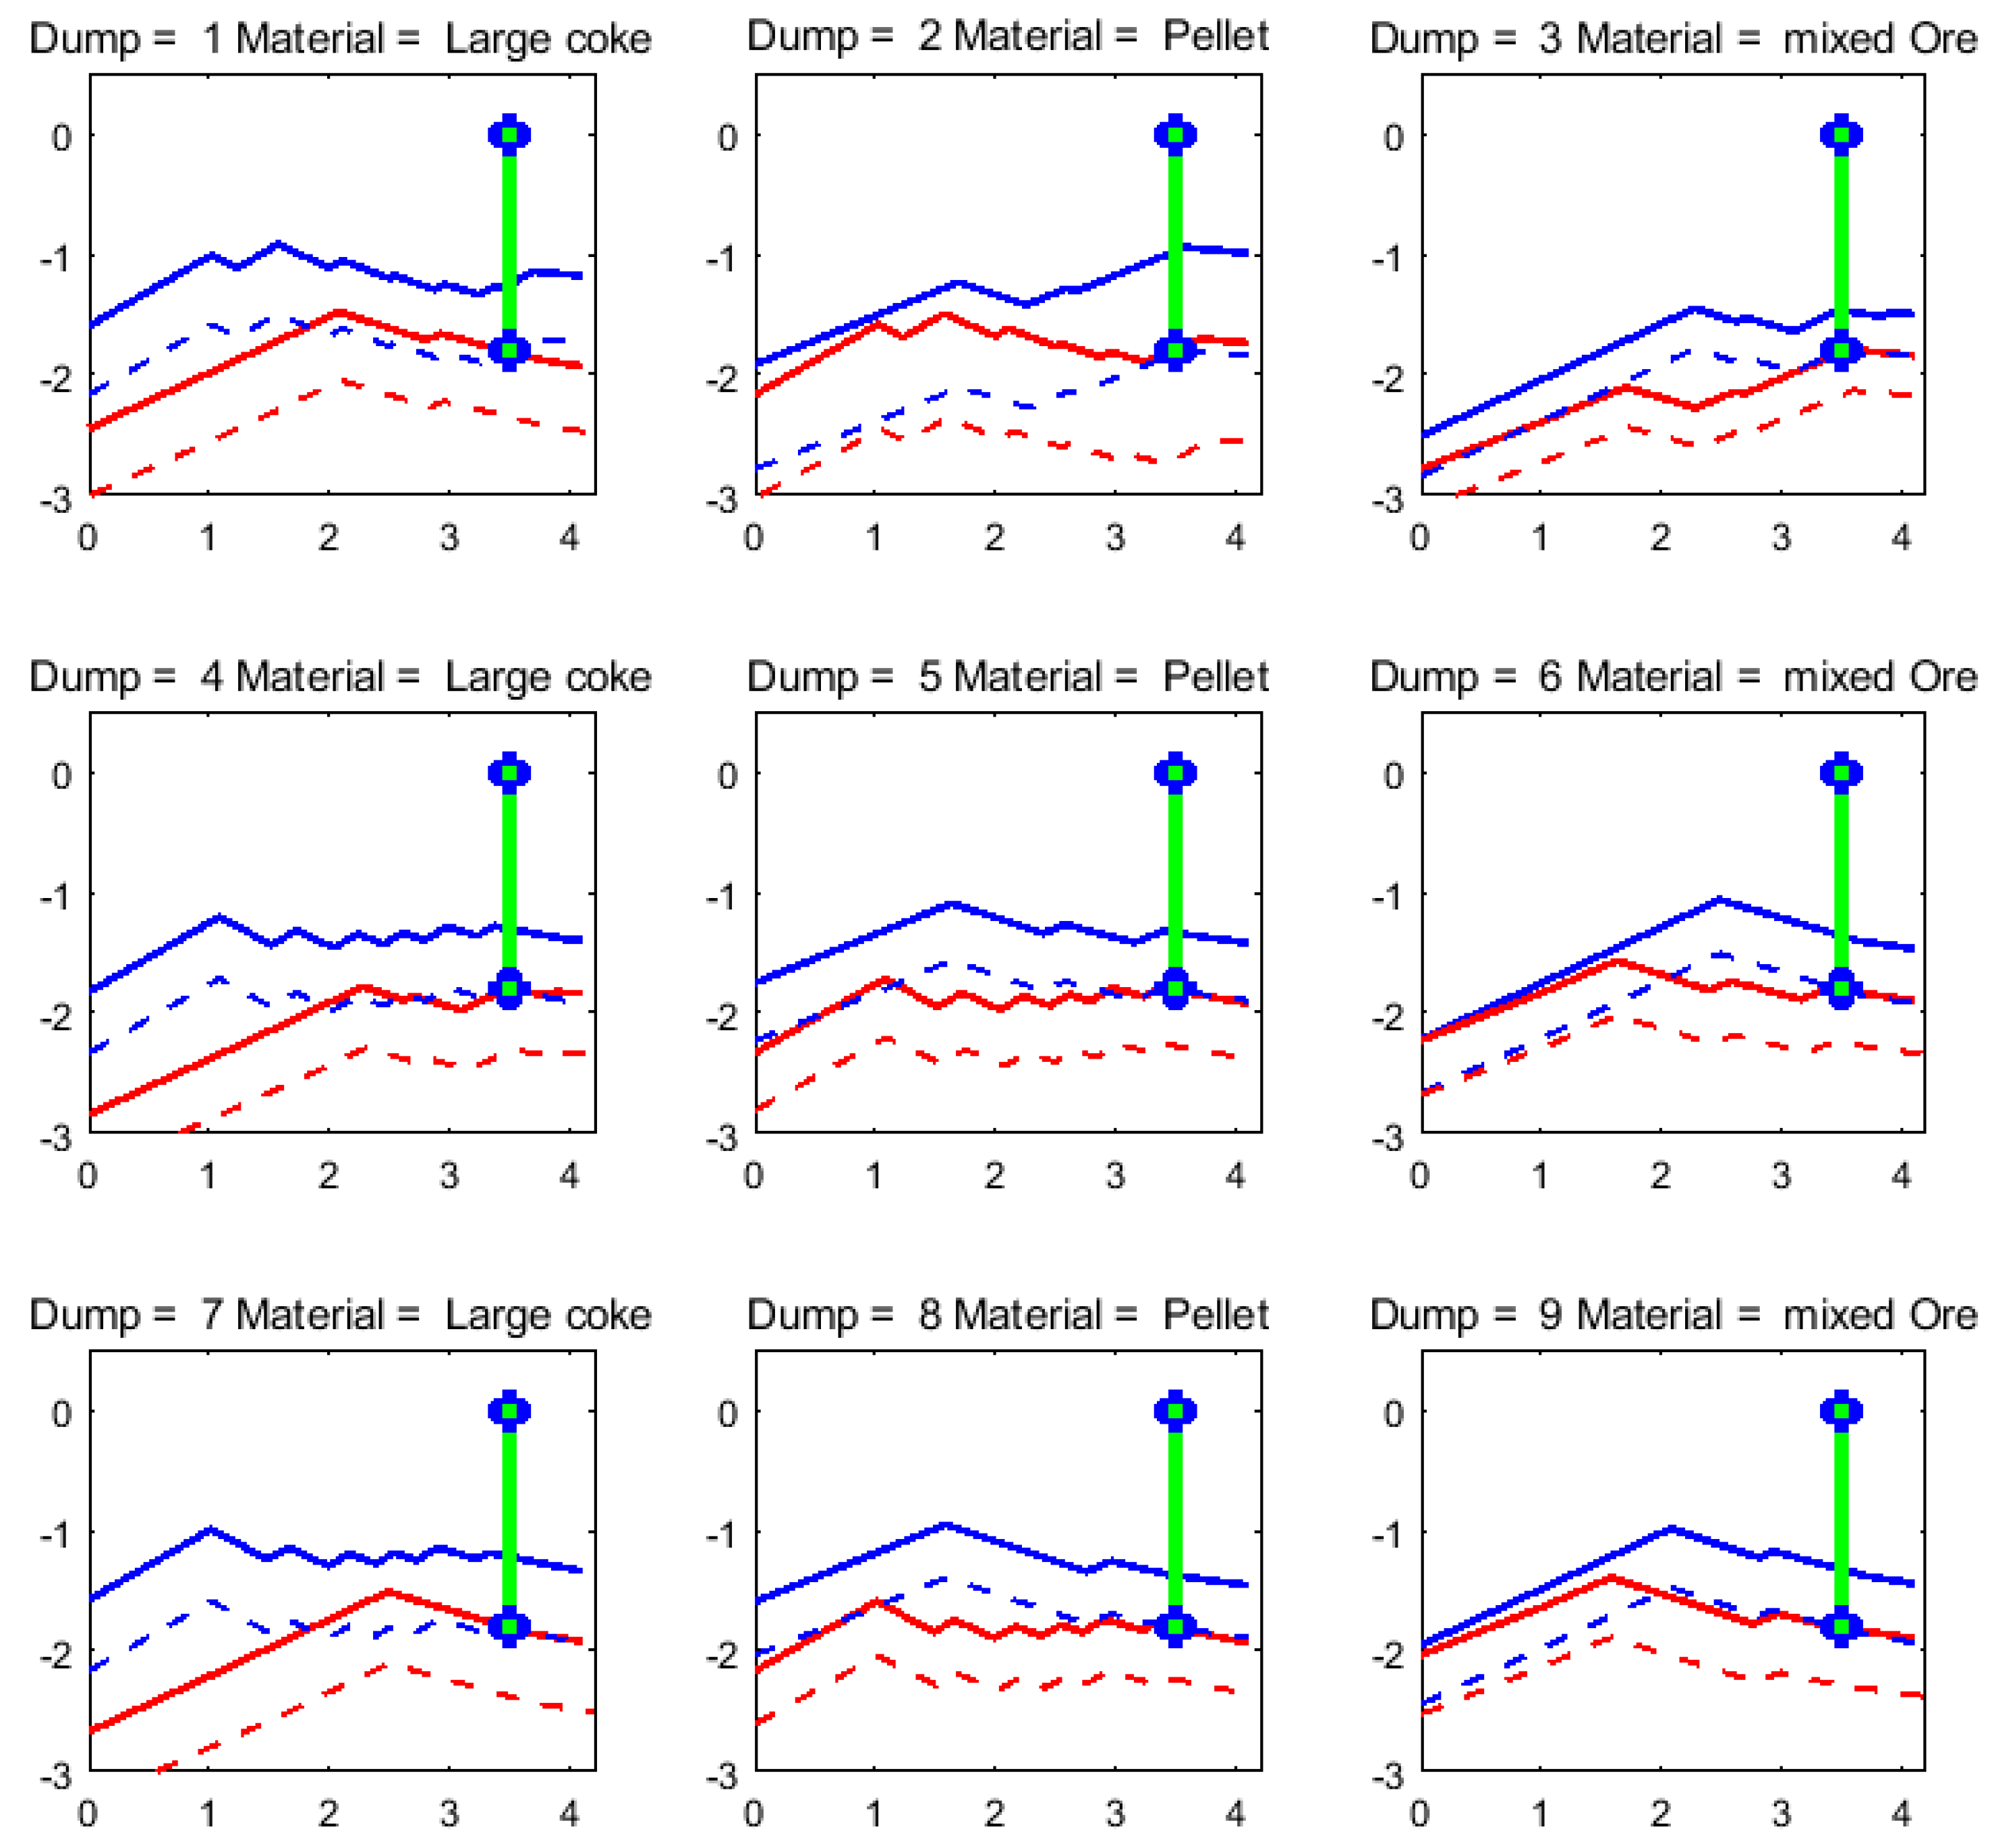
3.4. Validation of the Model

In order to validate the model, it was applied to data from a real BF operated with pellets and coke as the main burden materials. In this furnace, the burden surface profile is measured by a 3D top scanner every 20 s. The results from one day of operation will be illustrated, where the furnace was run under the nine-dump charging program presented in Table 4. The charging program consisted of a three-dump subsequence (Coke/Pellets/Pellets + Coke), which was repeated three times, with the main difference being that the first two dumps in the first subsequence were charged from the center to the wall, while all other dumps were charged from the wall to the center.
The top scanner data for the day was preprocessed to yield estimates of the average radial burden surface profile before and after each dump, with the results shown in Figure 11. The corresponding results of the simulation model are presented in Figure 12, which shows that the model has been able to reconstruct the layer distribution fairly well: the three dumps of the first subsequence (Dumps 1–3) are seen to distribute differently, due to the different charging directions employed for the first two dumps. The different distributions of these layers are also clearly seen in the profiles from the top scanner. The latter two subsequences, in turn, give rise to almost identical results, which is expected due their strong similarities. Overall, despite some discrepancies, the model is seen to be quite successful in predicting the distribution of burden layers in the top of the throat. The simulated layer distribution for the last three passes through the charging program is depicted in Figure 13. The figure shows how the layers gradually get thinner and how their angles decrease along with the descent in the furnace. The results of the model can thus be used to track the layers deeply into the BF and could also be used as a starting point for computational fluid dynamics (CFD) simulations of the thermal and flow conditions in the shaft.

4. Conclusions and Future Perspectives

A model of charging, burden distribution, and burden descent in the BF shaft has been developed. The model calculates the burden stream trajectory under different chute angles, solves the distribution of rings on the burden surface, and simulates the descent of the layers. The charging matrix, initial burden surface, burden descent-rate distribution, and chute direction during charging can be specified and the model estimates the arising layer structure. The model, which has been validated by a comparison of its results with top scanner information from an operating BF, has been applied to study the effect of some user-specified parameters in order to gain a better understanding of the complex engineering system at hand. On the basis of the results, some conclusions can be drawn, as follows:
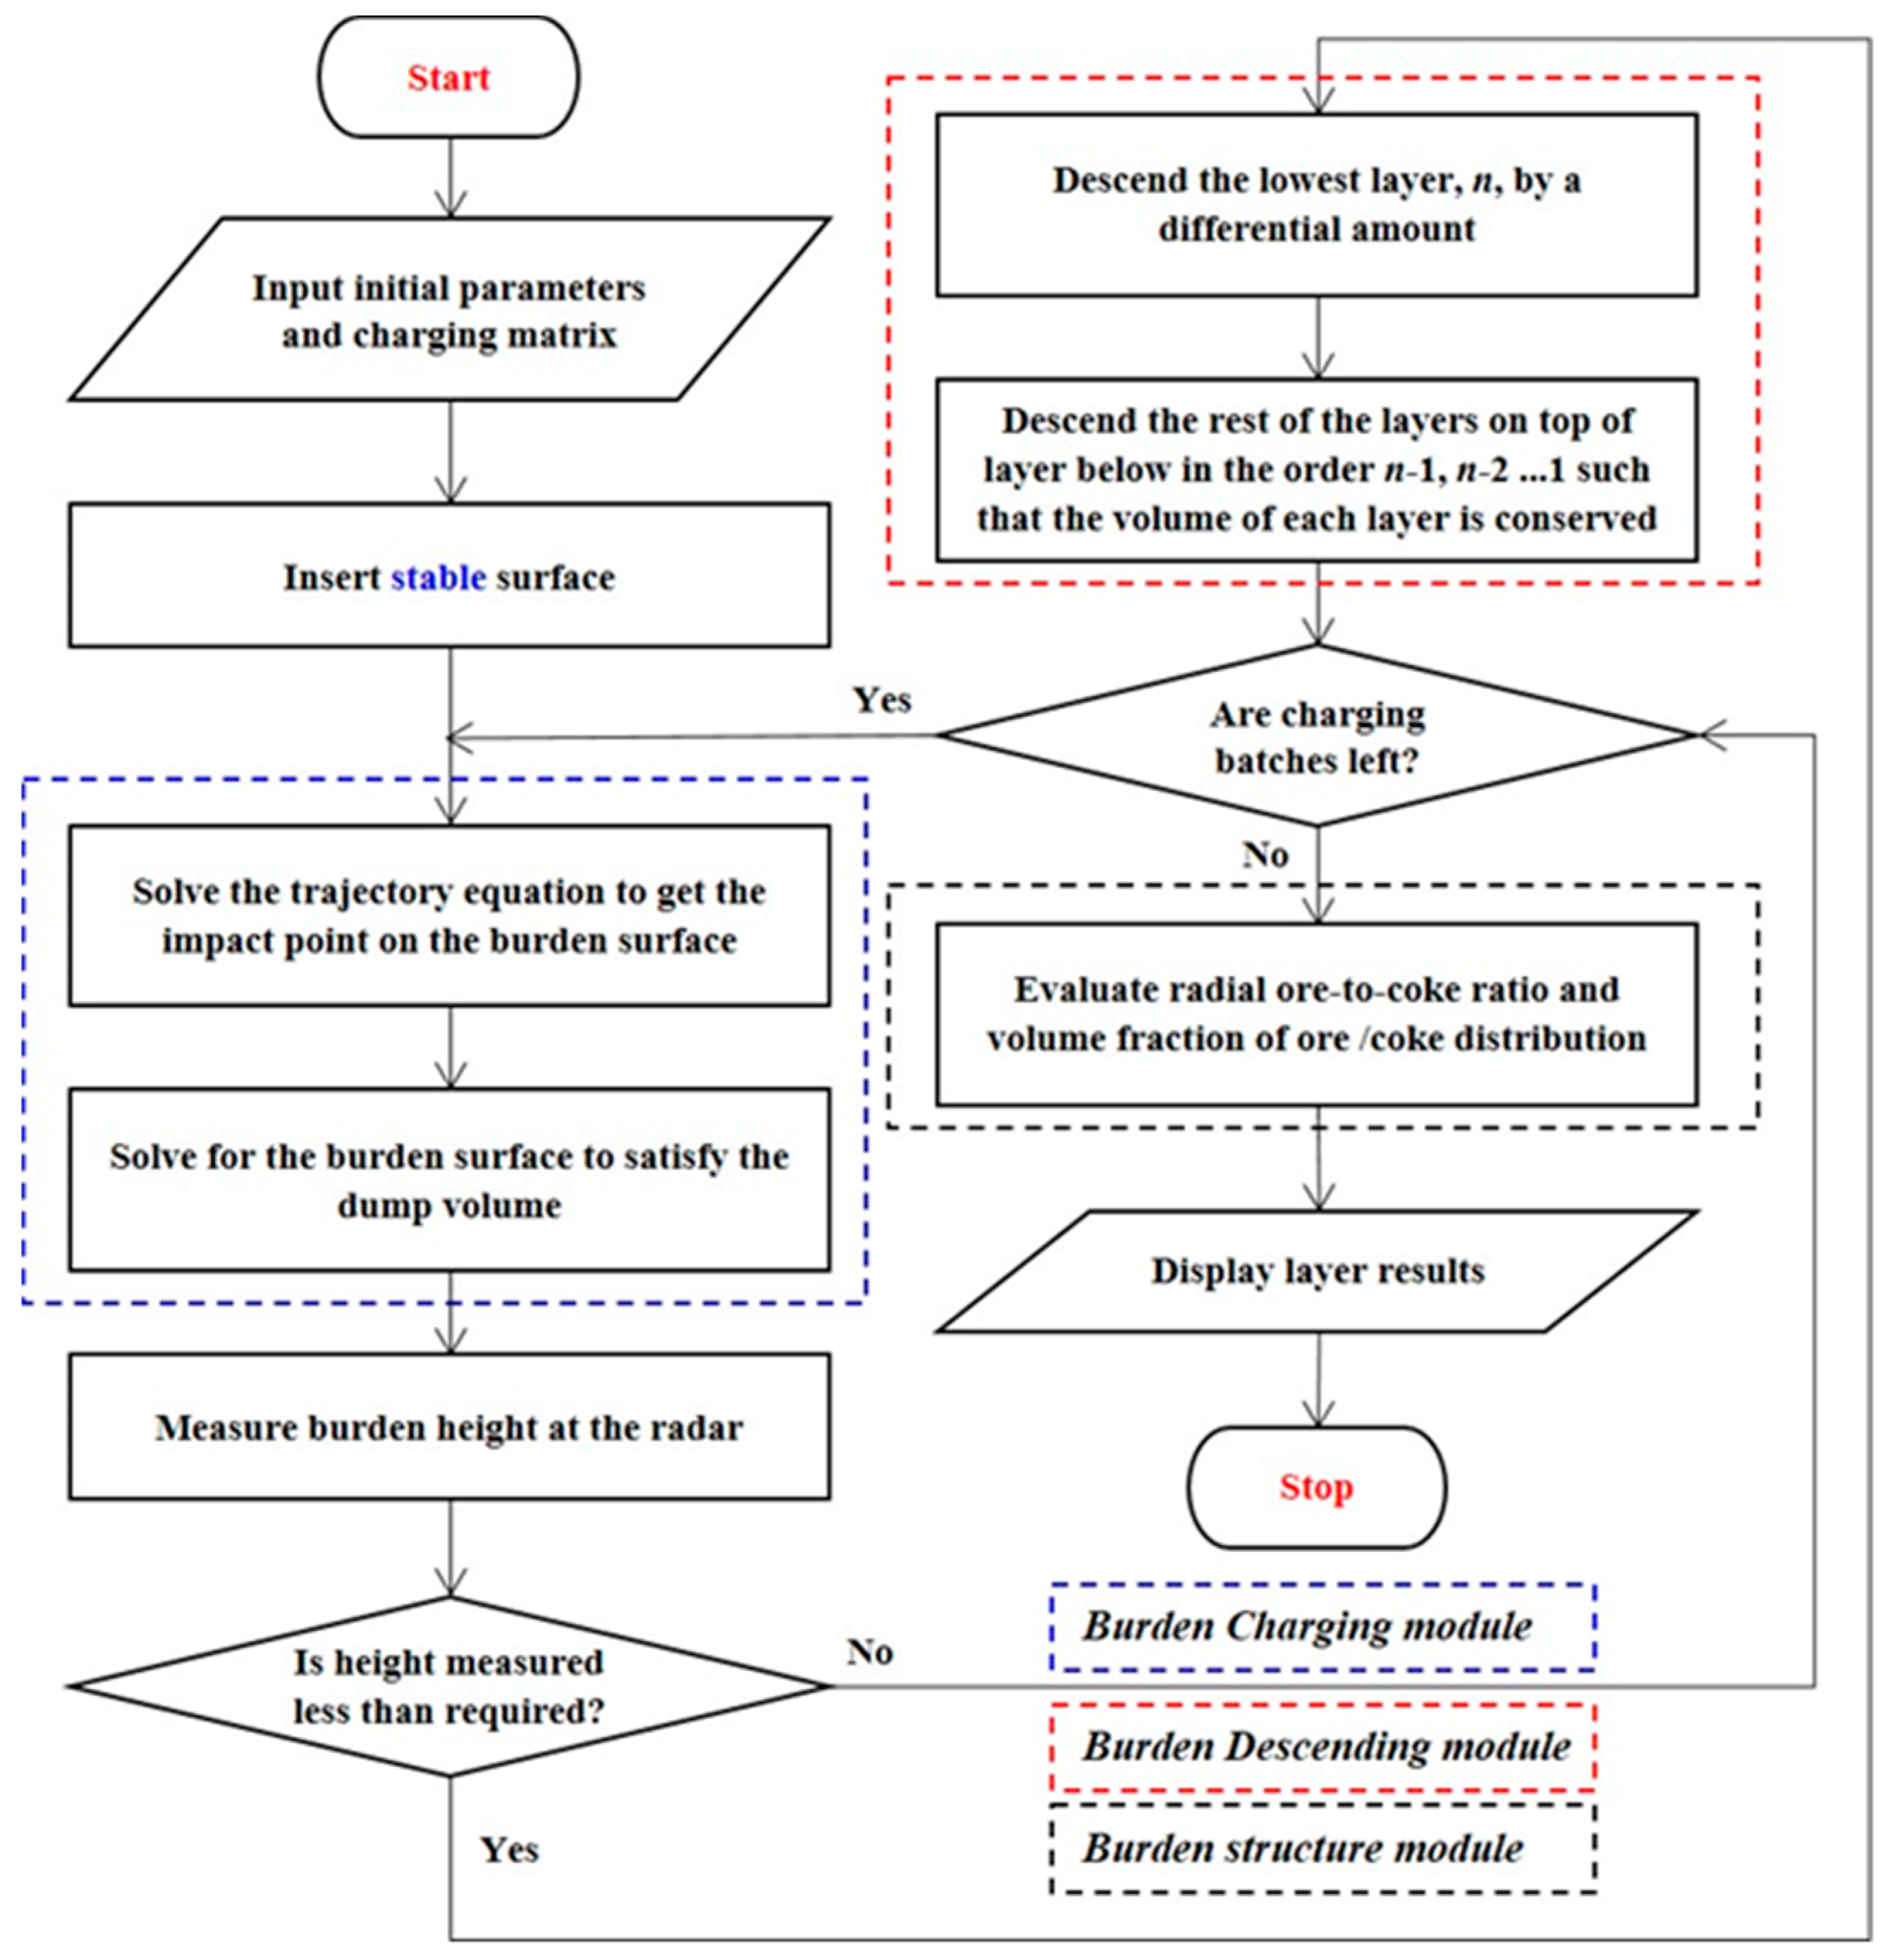
  • Compared with previous versions of the model [12], a sub-model was established for calculating the stable burden top surface using an arbitrary initial surface, which yields information about the conditions in the shaft under a quasi-stationary state. The calculation results showed that the initial burden surface typically affects the results for about five dumps, after which asymptotic behavior of the radial layer distribution will be reached;
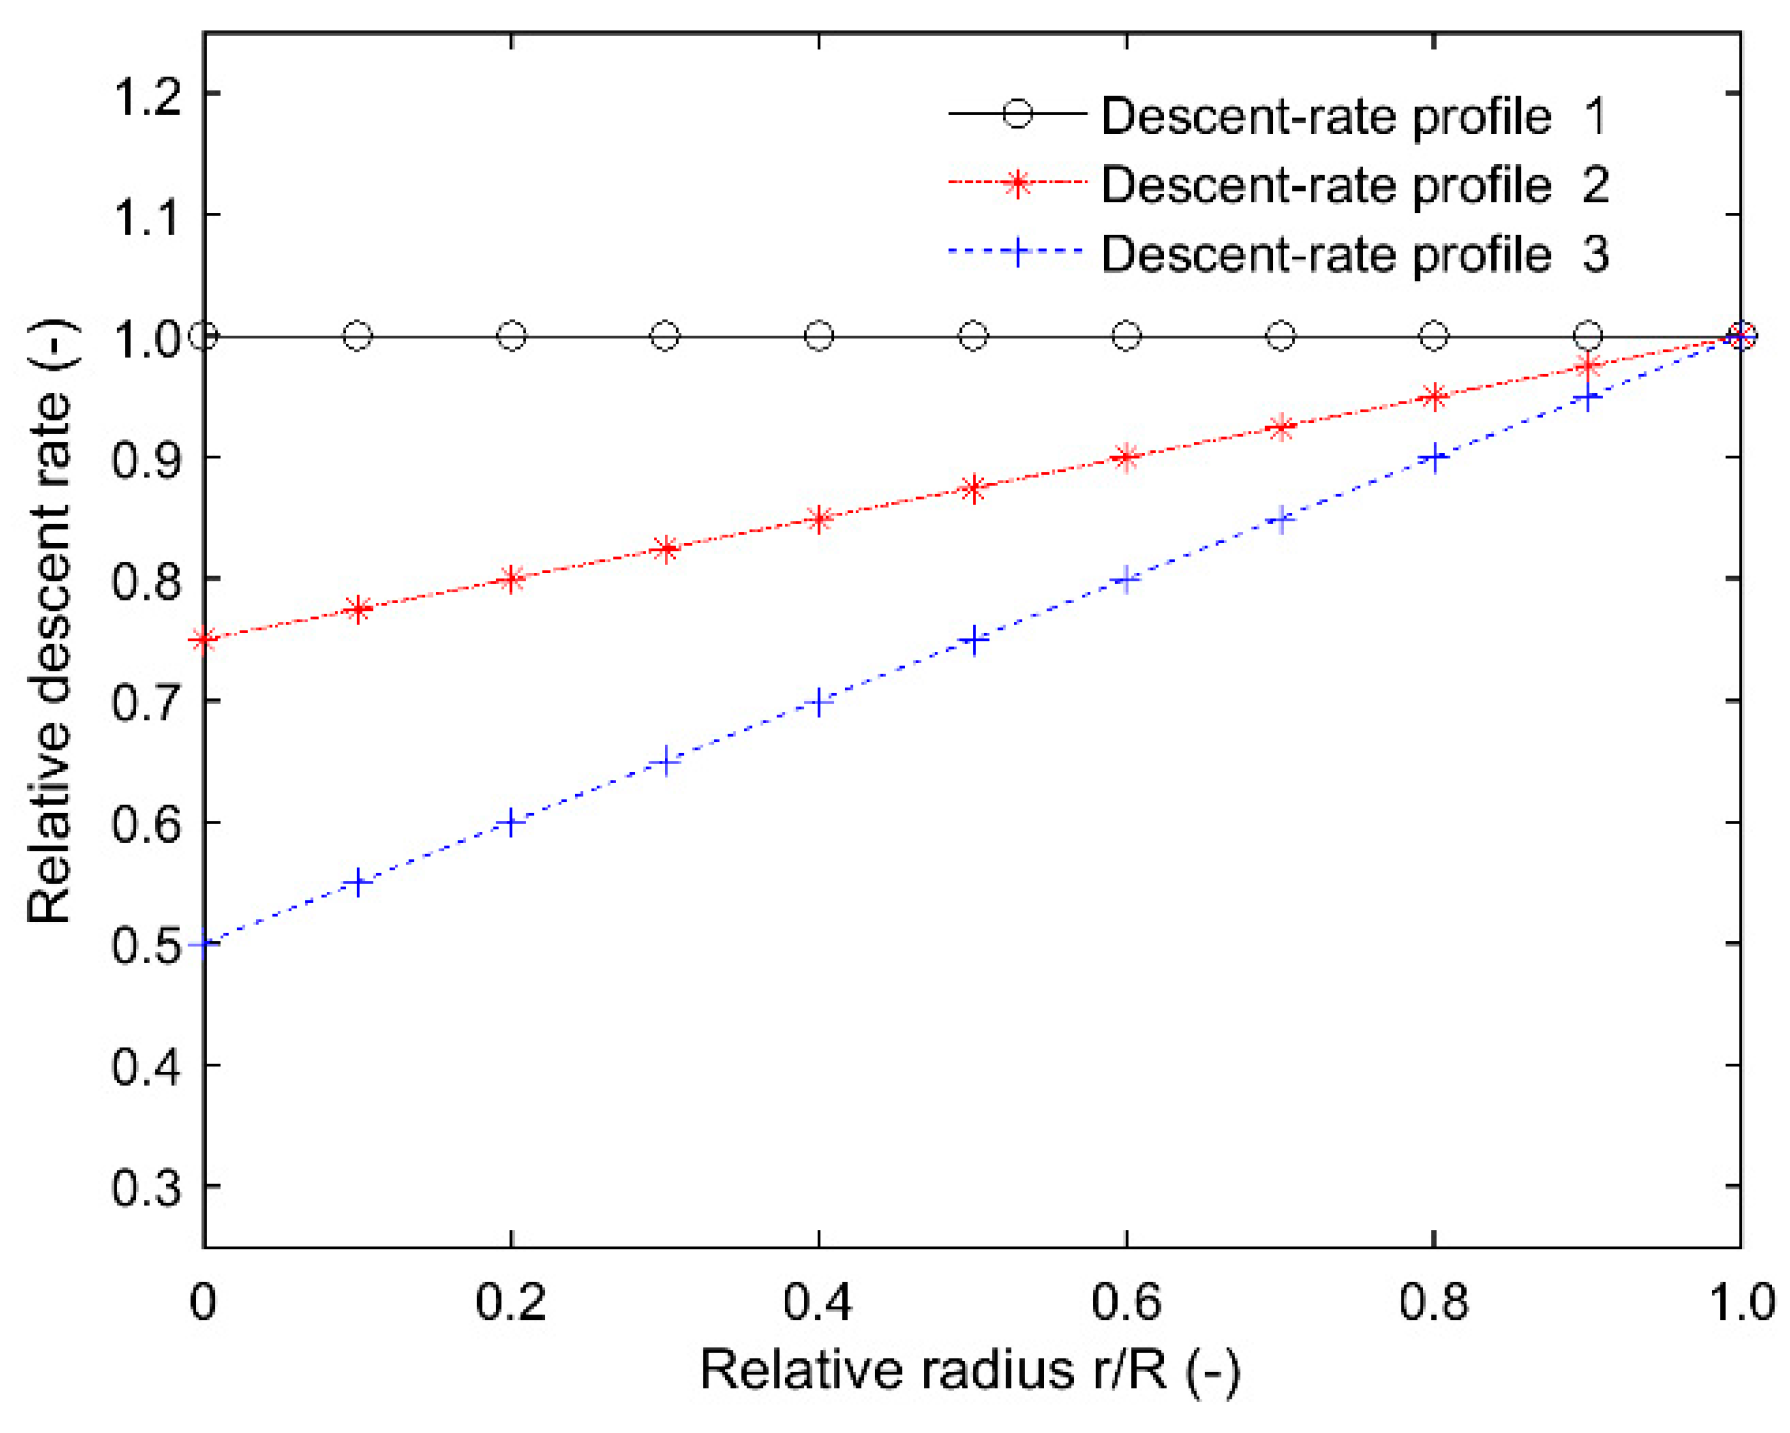
  • The effect of different radial descent-rate profiles on the arising burden layer structure has been analyzed, and it has been demonstrated that the distribution plays an important role in the internal layers in the shaft, but only marginally affects the radial distribution of the top layers in the throat;
  • The charging direction, i.e., the direction in which the chute moves (center to wall, or wall to center) when the rings of a dump are distributed on the burden surface plays a key role. This strong effect is due to the material overlapping, which becomes accentuated in a large BF with large dump sizes, where each dump is split into several rings. By changing the direction, fundamentally different layer distributions can be obtained.
In the future, the model will be applied for multiple purposes, including the design of charging programs fulfilling requirements set on the arising burden distribution. Another use of the model would be to apply it to an on-line simulation of charged layers in the shaft, tracking their position with time. In this way, one may realize an intelligent soft sensor by which the shaft state may be monitored and visualized for better understanding and control. It would also be interesting to explore the possibilities of an automatic combination of signals from a top scanner with the model of layer descent in the bed, particularly after disturbances (e.g., slips) that upset the burden distribution in the furnace. Yet another option is to extend the model to consider heat transfer and gas flow in the lumpy zone.

Author Contributions

Conceptualization, H.L., H.S. and Z.Z.; data curation, H.L., H.S. and W.L.; funding acquisition, Z.Z.; investigation, W.L. and L.S.; methodology, W.L.; project administration, H.S.; resources, H.S.; software, H.L.; supervision, H.S. and Z.Z.; writing—original draft, H.L.; writing—review and editing, H.S., Z.Z. and L.S.

Funding

This research was funded by National Natural Science Foundation of China, grant number 51604068, 51574064. The APC was funded by Åbo Akademi University.

Acknowledgments

Financial support provided by the National Natural Science Foundation of China (Grants number 51604068, 51574064) and China Scholarship Council (CSC No. 201706085021) is gratefully acknowledged.

Conflicts of Interest

The authors declare no conflict of interest.

Nomenclature

adescent-rate coefficient at furnace center-
bslope coefficient of descent rate from furnace center to furnace wall-
Ccentrifugal forceN
dpivot of distance from centerm
ffrictional forceN
Fnet forceN
ggravitational acceleration constantm2/s
Ggravity forceN
h0height of down-comerm
k1collision correction coefficient-
k2buoyancy correction coefficient-
leffective length of the chutem
lchute directionm
Llength of the chutem
mmass of the particlek
Ncounteracting forceN
Rthroat radiusm
ttime of particle movement in free boards
udescent rate along the vertical direction-
V0exit velocity along the direction of chutem/s
V1velocity at the end of chutem/s
αchute angle in the vertical directionrad
ωrotation speed of the chuterad/s
μfriction factor between material and chute-
βrepose anglerad

Subscript

iore or coke-
rccenter to particle stream (cf. Figure 1)
ininner repose angle-
minminimum-
maxmaximum-
outouter repose angle-
rhorizontal (radial) direction-
yvertical (altitudinal) direction-
zrotation (tangential) direction-

References

  1. Zhou, C.Q. Minimization of Blast Furnace Fuel Rate by Optimizing Burden and Gas Distribution; Technical Report: Project No. DE-FG36-07GO17041; Purdue University: Hammond, IN, USA, 2012. [Google Scholar]
  2. Huang, D.; Andrade, M.; White, D.; Maude, J. Blast Furnace Above-Burden Infrared Camera. Iron Steel Tech. 2017, 14, 44–56. [Google Scholar]
  3. Kuang, S.B.; Li, Z.Y.; Yu, A.B. Review of modeling and simulation of blast furnace. Steel Res. Int. 2018, 89, 1700071. [Google Scholar] [CrossRef]
  4. Yang, Y.L.; Yin, Y.X.; Wunsch, D.; Zhang, S.; Chen, X.Z.; Li, X.L.; Cheng, S.S.; Wu, M.; Liu, K.Z. Development of Blast Furnace Burden Distribution Process Modeling and Control. ISIJ Int. 2017, 57, 1350–1363. [Google Scholar] [CrossRef] [Green Version]
  5. Li, Z.Y.; Kuang, S.B.; Liu, S.D.; Gan, J.Q.; Yu, A.B.; Li, Y.T.; Mao, X.M. Numerical investigation of burden distribution in ironmaking blast furnace. Powder Technol. 2019, 353, 385–397. [Google Scholar] [CrossRef]
  6. Nishio, H.; Ariyama, T. Analysis on Formation Processes of Burden Distribution in Blast Furnace. Tetsu-to-Hagane. 1982, 68, 2330–2337. [Google Scholar] [CrossRef] [Green Version]
  7. Kajiwara, Y.; Jimbo, T.; Sakai, T. Development of a simulation model for burden distribution at blast furnace top. Trans. ISIJ. 1983, 23, 1045–1052. [Google Scholar] [CrossRef]
  8. Hattori, M.; Iino, B.; Shimomura, A.; Tsukiji, H.; Ariyama, T. Development of burden distribution simulation model for bell-less top in a large blast furnace and its application. ISIJ Int. 1993, 33, 1070–1077. [Google Scholar] [CrossRef]
  9. Radhakrishnan, V.R.; Ram, K.M. Mathematical model for predictive control of the bell-less top charging system of a blast furnace. J. Proc. Control. 2001, 11, 565–586. [Google Scholar] [CrossRef]
  10. Saxén, H.; Hinnelä, J. Model for Burden Distribution Tracking in the Blast Furnace. Min. Process Extr. Metall. Rev. 2004, 25, 1–27. [Google Scholar] [CrossRef]
  11. Park, J.I.; Jung, H.J.; Jo, M.K.; Oh, H.S.; Han, J.-W. Mathematical Modeling of the Burden Distribution in the Blast Furnace Shaft. Met. Mater. Int. 2011, 17, 485–496. [Google Scholar] [CrossRef]
  12. Mitra, T.; Saxén, H. Model for Fast Evaluation of Charging Programs in the Blast Furnace. Metall. Mater. Trans. B 2014, 45, 2382–2394. [Google Scholar] [CrossRef]
  13. Fu, D. Numerical Simulation of Ironmaking Blast Furnace Shaft. Ph.D. Thesis, Purdue University, West Lafayette, IN, USA, 2014. [Google Scholar]
  14. Li, H.F.; You, Y.; Zhou, H.; Luo, Z.G.; Zou, Z.S. Study on Burden Pile Profile Prediction Model for COREX-3000 Melter Gasifier. J. Chongqing Univ. 2015, 38, 39–44. (In Chinese) [Google Scholar]
  15. Hinnelä, J.; Saxén, H. Neural network model of burden layer formation dynamics in the blast furnace. ISIJ Int. 2001, 41, 142–150. [Google Scholar] [CrossRef]
  16. Su, X.L.; Zhang, S.; Yin, Y.X.; Liu, Y.N.; Xiao, W.D. Data-driven prediction model for adjusting burden distribution matrix of blast furnace based on improved multilayer extreme learning machine. Soft Comput. 2018, 22, 3575–3589. [Google Scholar] [CrossRef]
  17. Li, Y.J.; Zhang, S.; Zhang, J.; Yin, Y.X.; Xiao, W.D.; Zhang, Z.Q. Data-driven multi-objective optimization for burden surface in blast furnace with feedback compensation. IEEE Trans. Ind. Inform 2019, in press. [Google Scholar] [CrossRef]
  18. Saxén, H.; Nikus, M.; Hinnela, J. Burden Distribution Estimation in the Blast Furnace from Stockrod and Probe Signals. Steel Res. Int. 1998, 69, 406–410. [Google Scholar] [CrossRef]
  19. Zhou, Z.Y.; Zhu, H.P.; Yu, A.B.; Wright, B.; Pinson, D.; Zulli, P. Discrete Particle Simulation of Solid Flow in a Model Blast Furnace. ISIJ Int. 2005, 45, 1828–1837. [Google Scholar] [CrossRef] [Green Version]
  20. Mio, H.; Kadowaki, M.; Matsuzaki, S.; Kunitomo, K. Development of particle flow simulator in charging process of blast furnace by discrete element method. Min. Eng. 2012, 33, 27–33. [Google Scholar] [CrossRef]
  21. Li, H.F.; Luo, Z.G.; Zou, Z.S.; Sun, J.J.; Han, L.H.; Di, Z.X. Mathematical Simulation of Burden Distribution in COREX Melter Gasifier by Discrete Element Method. J. Iron Steel Res. Int. 2012, 19, 36–42. [Google Scholar] [CrossRef]
  22. Liu, S.D.; Zhou, Z.Y.; Dong, K.J.; Yu, A.B.; Pinson, D.; Tsalapatis, J. Numerical investigation of burden distribution in a blast furnace. Steel Res. Int. 2015, 86, 651–661. [Google Scholar] [CrossRef]
  23. Mitra, T.; Saxén, H. Discrete Element Simulation of Charging and Mixed Layer Formation in the Ironmaking Blast Furnace. Comput. Part. Mech. 2016, 3, 541–555. [Google Scholar] [CrossRef]
  24. Fu, D.; Chen, Y.; Zhou, C.Q. Mathematical Modeling of Blast Furnace Burden Distribution with Non-uniform Descending Speed. Appl. Math. Model. 2015, 39, 7554–7567. [Google Scholar] [CrossRef]
  25. Mitra, T.; Saxén, H. Evolution of Charging Programs for Achieving Required Gas Temperature Profile in a Blast Furnace. Mater. Manuf. Process. 2015, 30, 474–487. [Google Scholar] [CrossRef]
  26. Liu, Y.C. Burden Distribution Law in Blast Furnace, 3rd ed.; Metallurgical Industry Press: Beijing, China,, 2005; pp. 25–30. (In Chinese) [Google Scholar]
  27. Ichida, M.; Nishihara, K.; Tamura, K.; Sugata, M.; Ono, H. Influence of Ore/Coke Distribution on Descending and Melting Behavior of Burden in Blast Furnace. ISIJ Int. 1991, 31, 505–514. [Google Scholar] [CrossRef]
  28. Ichida, M.; Takao, M.; Kunitomo, K.; Matsuzaki, S.; Deno, T.; Nishihara, K. Radial Distribution of Burden Descent Velocity near Burden Surface in Blast Furnace. ISIJ Int. 1996, 35, 493–502. [Google Scholar] [CrossRef]
  29. Lu, Y.X.; Jiang, Z.Y.; Zhang, X.R.; Wang, J.S.; Zhang, X.X. Vertical Section Observation of the Solid Flow in a Blast Furnace with a Cutting Method. Metals 2019, 9, 127. [Google Scholar] [CrossRef]
  30. Zhou, P.; Shi, P.Y.; Song, Y.P.; Tang, K.L.; Fu, D.; Zhou, C.Q. Evaluation of Burden Descent Model for Burden Distribution in Blast Furnace. J. Iron Steel Res. Int. 2016, 23, 765–771. [Google Scholar] [CrossRef]
  31. Fu, D.; Huang, F.; Tian, F.; Zhou, C.Q. Burden Descending and Redistribution in a Blast Furnace. In Proceedings of the AISTech 2010, Iron & Steel Technology Conference, Pittsburgh, PA, USA, 3–6 May 2010; Association for Iron and Steel Technology: Warrendale, PA, USA, 2010; Volume 1, pp. 693–700. [Google Scholar]
Figure 1. Schematic illustration of the steps considered in the burden distribution model.
Metals 09 01003 g001
Figure 2. Burden path lines in the blast furnace (BF).
Metals 09 01003 g002
Figure 3. Flowchart of the mathematical model.
Metals 09 01003 g003
Figure 4. Three different descent-rate profiles at the stock line level.
Metals 09 01003 g004
Figure 5. Initial surfaces with three different plateau widths. Green solid circle at the end of the vertical dashed line indicates the charging level, i.e., the level of the burden where charging is triggered.
Metals 09 01003 g005
Figure 6. Effect of burden descent-rate distribution (rows) and initial burden surface (columns) on the arising burden layer structure for the charging program of Table 1.
Metals 09 01003 g006aMetals 09 01003 g006b
Figure 7. Evolution of (a) the burden top surface after the ore dump and (b) the distribution of the ore/coke layer thickness ratio for the six batches during the charging process for Case A1c.
Metals 09 01003 g007
Figure 8. Evolution process of burden layer distribution in the shaft for the cases in Table 3, (a) Case A1b, (b) Case B1b, (c) Case C1b, and (d) Case D1b.
Metals 09 01003 g008
Figure 9. Burden surface profiles after the ore dump for Cases A1b–D1b.
Metals 09 01003 g009
Figure 10. Ore/coke thickness ratio distribution of Cases A1b–D1b.
Metals 09 01003 g010
Figure 11. Average radial stock profile before (red) and after (blue) each dump reconstructed from top scanner data.
Metals 09 01003 g011
Figure 12. Radial stock profile before (red) and after (blue) each dump simulated by the model. Dashed lines show the corresponding position of the uppermost layer just before the next layer is charged.
Metals 09 01003 g012
Figure 13. Simulated layer structure in the shaft of the reference BF operated under the charging program of Table 4.
Metals 09 01003 g013
Table 1. Charging matrix of the illustration case. The charging direction (here wall → center) and charging level (here, z = −1.4 m) have to be specified. The final column refers to the layer colors in Figure 6.
MaterialMass/ton1234567891011Color
Center Coke2.62-11--------
Large Coke21.0----2222233
Mixed Ore (Sinter and Pellet and Lump Ore)136.0----222233-
Table 2. Simulation schemes with different descent-rate and initial burden surface profiles (cf. Figure 4 and Figure 5). The rings of the charging matrix of Table 1 were charged from the wall to the center (denoted by A).
Initial Burden Surfaceabc
Descent-Rate Profile
1Case A1aCase A1bCase A1c
2Case A2aCase A2bCase A2c
3Case A3a Case A3bCase A3c
Table 3. Cases studied employed to illustrate the effect of the charging direction.
MaterialCenter CokeCokeMixed Ore
Case
Case A1bW → CW → CW → C
Case B1bW → CW → CC → W
Case C1bC → WC → WW → C
Case D1bC → WC → WC → W
Table 4. Charging matrix of the validation case from an operating BF, with z = −1.8 m as the charging level.
MaterialMass/TonDirection1234567891011Color
1. Coke15.5C → W--5.51.31.31.31.32.62.2--
2. Pellets60.4C → W---16.3-15.2-14.514.4--
3. Pellets and Coke40.7W → C--- 9.19.9-10.611.1--
4. Coke15.6W → C--1.31.81.81.71.73.53.8--
5. Pellets60.2W → C---14.2-14.7-15.216.1--
6. Pellets and Coke40.9W → C--- -11.010.310.39.3--
7. Coke15.5W → C--1.31.81.71.71.83.43.8--
8. Pellets60.4W → C---11.411.5-12.312.113.1--
9. Pellets and Coke40.7W → C--- 11.3-10.010.19.3--

