Article

Effect of Heat Input and Undermatched Filler Wire on the Microstructure and Mechanical Properties of Dissimilar S700MC/S960QC High-Strength Steels

Laboratory of Welding Technology, Lappeenranta-Lahti University of Technology, P.O. Box 20, 53851 Lappeenranta, Finland
*
Author to whom correspondence should be addressed.
Metals 2019, 9(8), 883; https://doi.org/10.3390/met9080883
Submission received: 8 July 2019 / Revised: 7 August 2019 / Accepted: 8 August 2019 / Published: 12 August 2019

Abstract

:
The effect of heat input on the microstructure and mechanical properties of dissimilar S700MC/S960QC high-strength steels (HSS) using undermatched filler material was evaluated. Experiments were performed using the gas metal arc welding process to weld three samples, which had three different heat input values (i.e., 15 kJ/cm, 7 kJ/cm, and 10 kJ/cm). The cooling continuous temperature (CCT) diagrams, macro-hardness values, microstructure formations, alloy element compositions, and tensile test analyses were performed with the aim of providing valuable information for improving the strength of the heat-affected zone (HAZ) of both materials. Micro-hardness measurement was conducted using the Vickers hardness test and microstructural evaluation by scanning electron microscopy and energy-dispersive X-ray spectroscopy. The mechanical properties were characterized by tensile testing. Dissimilar welded samples (S700MC/S960QC) with a cooling rate of 10 °C/s (15 kJ/cm) showed a lower than average hardness (210 HV5) in the HAZ of S700MC than S960QC. This hardness was 18% lower compared to the value of the base material (BM). The best microstructure formation was obtained using a heat input of 10 kJ/cm, which led to the formation of bainite (B, 60% volume fraction), ferrite (F, 25% volume fraction), and retained austenite (RA, 10%) in the final microstructure of S700MC, and B (55%), martensite (M, 45%), and RA (10%), which developed at the end of the transformation of S960QC. The results showed the presence of 1.3 Ni, 0.4 Mo, and 1.6 Mn in the fine-grain heat-affected zone of S700MC. The formation of a higher carbide content at a lower cooling rate reduced both the hardness and strength.

1. Introduction

Emerging technologies in various manufacturing applications (e.g., construction of facilities, piping systems of nuclear power plants, and automotive power plants) now require and could significantly benefit from joining different steel grades. Welding dissimilar materials is not without its difficulties, and this challenge has caused researchers to explore new materials. The potential advantages of these new materials are that they could be environmentally beneficial, have lower manufacturing and maintenance costs, and their thermal properties may make them easier to use in hot or cold climates [1,2,3]. For instance, in the construction of many structures such as vehicles (i.e, automobiles), reducing the weight has a significant impact on durability, effectiveness, and operating costs. Improved characteristics in the weld joint can lead to the beneficial outcomes of lower weight and increased rigidity. In dissimilar welding of high-strength steels (HSS), knowledge of the correlation between heat input data and alloy elements formed in the heat-affected zone (HAZ) may enable selection of welding material and welding parameters such that essential mechanical properties of the weld joint (i.e., hardness and strength) can be maintained. Structural steels with a yield strength greater than or equal to 900 MPa are classified as ultra-high-strength steels (UHSS). Those with an ultimate yield strength of less than 900 MPa and greater than or equal to 450 MPa are classified as high-strength advanced steels (AHSS), and those with an ultimate yield strength of less than 450 MPa are classified as HSS [4,5,6].
Gas metal arc (GMA) welding is a process in which an electric arc is formed continuously or discontinuously between the consumable electrode and the workpiece [7,8]. Karkhin et al. [9] indicated that the shielding of inert or active gases (Ar, He, CO2, CO2 + O2) needs to be compatible with the chemical characteristics of the base materials and the geometry of the weld joint. Utilization of a thermomechanically controlled process to regulate the mechanical behavior of HSS, which have a relatively low carbon content, greatly reduces the duration of the welding process. The reduction in the welding process time is made possible by decreasing the preheating temperature, which has an impact on the relative stability of the alloy element in the HAZ.
The thermomechanically controlled welding process for HSS S700MC requires the consideration of several factors, such as mechanical properties, chemical composition, welding process, and choice of filler wire [10,11,12,13,14,15]. Guo et al. [16] used autogenous laser welding (ALW) and multi-pass ultra-narrow gap laser welding (NGLW) in the evaluation of the mechanical properties and microstructure of a welded joint of S700MC and S960QC HSS. The authors noted that the fast cooling rate of both welding processes resulted in hard martensite (M) formation in the fusion zone (FZ) and HAZ. This formation improves the strength of the weld joint but decreases the toughness of S700MC and S960QC. Much research has analyzed the effect of heat input and undermatched filler wire on the mechanical properties of S960MC steel. It has been noted that when using the GMA welding process with undermatched filler wire, softening will increase in the HAZ. This softening may be due to the heat input values, the dilution percentage or the mixture of alloy element compositions in the base material (BM), and filler wire. A number of authors have observed a lack of M formation at the end of transformation processes with low heat input values. An experiment was carried out to determine the usability of welded HSS S960QC in arctic regions (where the ambient temperature is approximately −25 °C to −30 °C during winter). The researchers found that using a heat input of 5 to 6.5 kJ/cm increased the hardness but caused a brittle fracture in the HAZ of the weld joints [17,18,19]. To avoid this undesirable phenomenon, preheating and post-weld heat treatment of the weld joint during the welding process are required. It is also recommended that a suitable choice of welding process be made. Further, the type of filler wire is of significance. By applying high heat input values when welding dissimilar HSS API X56 PSI and duplex stainless-steel UNS32750, the authors noted an increase in the strength in the HAZ of HSS API X65 PSI, which resulted in the formation of pearlite and ferrite within the austenite grain. A decrease in the heat input caused a decrease in the strength and the formation of ferrite (F) and bainite (B) in the microstructure [20,21,22,23,24]. The same behaviors were observed when Tasalloti et al. [25] used the GMA welding process to weld S960QC/S32205 HSS and duplex stainless steel. They demonstrated that there is a relationship between the welding parameters and the microstructure behavior, especially for HSS in the HAZ of the weld joint. Remarkably, this suggests that when welding high-strength low alloy steel (HSLA), an increase in the cooling rate leads to an increase in the formation of M. This increase in M has a negative effect on the mechanical properties of the welds. Yan et al. [26] confirmed this argument by analyzing the micro-alloying elements, such as carbone, manganese, and silicon, on the microstructure of quenching and partitioning (Q&P) steels. They noted that an increase in the yield strength of molybdenum (Mo)–niobium (Nb) micro-alloyed steel, treated by Q&P, was caused by the precipitation strengthening of NbC (niobium–carbon) and a refinement of the martensitic structure. Based on these results, it can be observed that improvement of the mechanical properties (i.e., strength, toughness, and elongation) in the HAZ of dissimilar HSS welded joints is a significant challenge. This improvement depends on parameters such as the chemical composition of the materials (base materials and filler wire), the welding parameters (heat input, welding speed, current, voltage, and gas flow), geometry of the weld sample, and the mechanical properties of the base materials.
This study aimed to investigate the effect of heat input and undermatched filler wire on the microstructure composition and mechanical properties of the heat-affected zone of dissimilar high-strength steels S700MC/S960QC. The specimens were welded using GMA welding and the thermal profiles were defined to evaluate the cooling times when using different heat input values. The cooling time was added to the continuous cooling temperature (CCT) diagrams step-by-step, which enabled the determination of the start and end of the transformation in both materials. The CCT diagrams of the investigated steels were plotted using JMatPro software (JMatPro 2018, University of Leicester, Leicester, UK) which permitted identification of the different phase transformation stages during the cooling process. Based on the CCT diagram of S700MC and the CCT diagram of S960QC, the thermal profiles of both diagrams were used to evaluate the cooling time differences among them (t8/5).
The HV5 macro-hardness measurements were made using a Wilson Wolpert 452SVD Vickers hardness tester with a load of 5 kgf [27]; the dwell time measurements were 20 s. At least 45 random measurements across the samples were used after polishing. The microstructure of the samples used for the hardness tests was characterized using optical microscopy (OM) and scanning electron microscopy (SEM) with a voltage of 15 kV and a resolution of 20 µm. The volume fraction of the microstructure formation was determined using ImageJ pro software (ImageJ 2013, NIH, Bethesda, MD, USA). To determine the chemical constituents in the austenite grain, energy-dispersive X-ray spectroscopy (EDS) using area scan analysis with a step size of 2.5 µm was conducted for samples cooled at 21 °C/s. The sample for EDS was prepared by repolishing the microstructure of the sample and etching with picric acid of 4 vol %, followed by fresh Nital solution of 2 vol % for 20 s.
The tensile test was conducted using ZWICK/ROZ Z 330 RED equipment (Zwick Rowell, Ulm, Germany) with a maximum load capacity of 100 kN according to the EN ISO 6892-1:2016 standard [28].

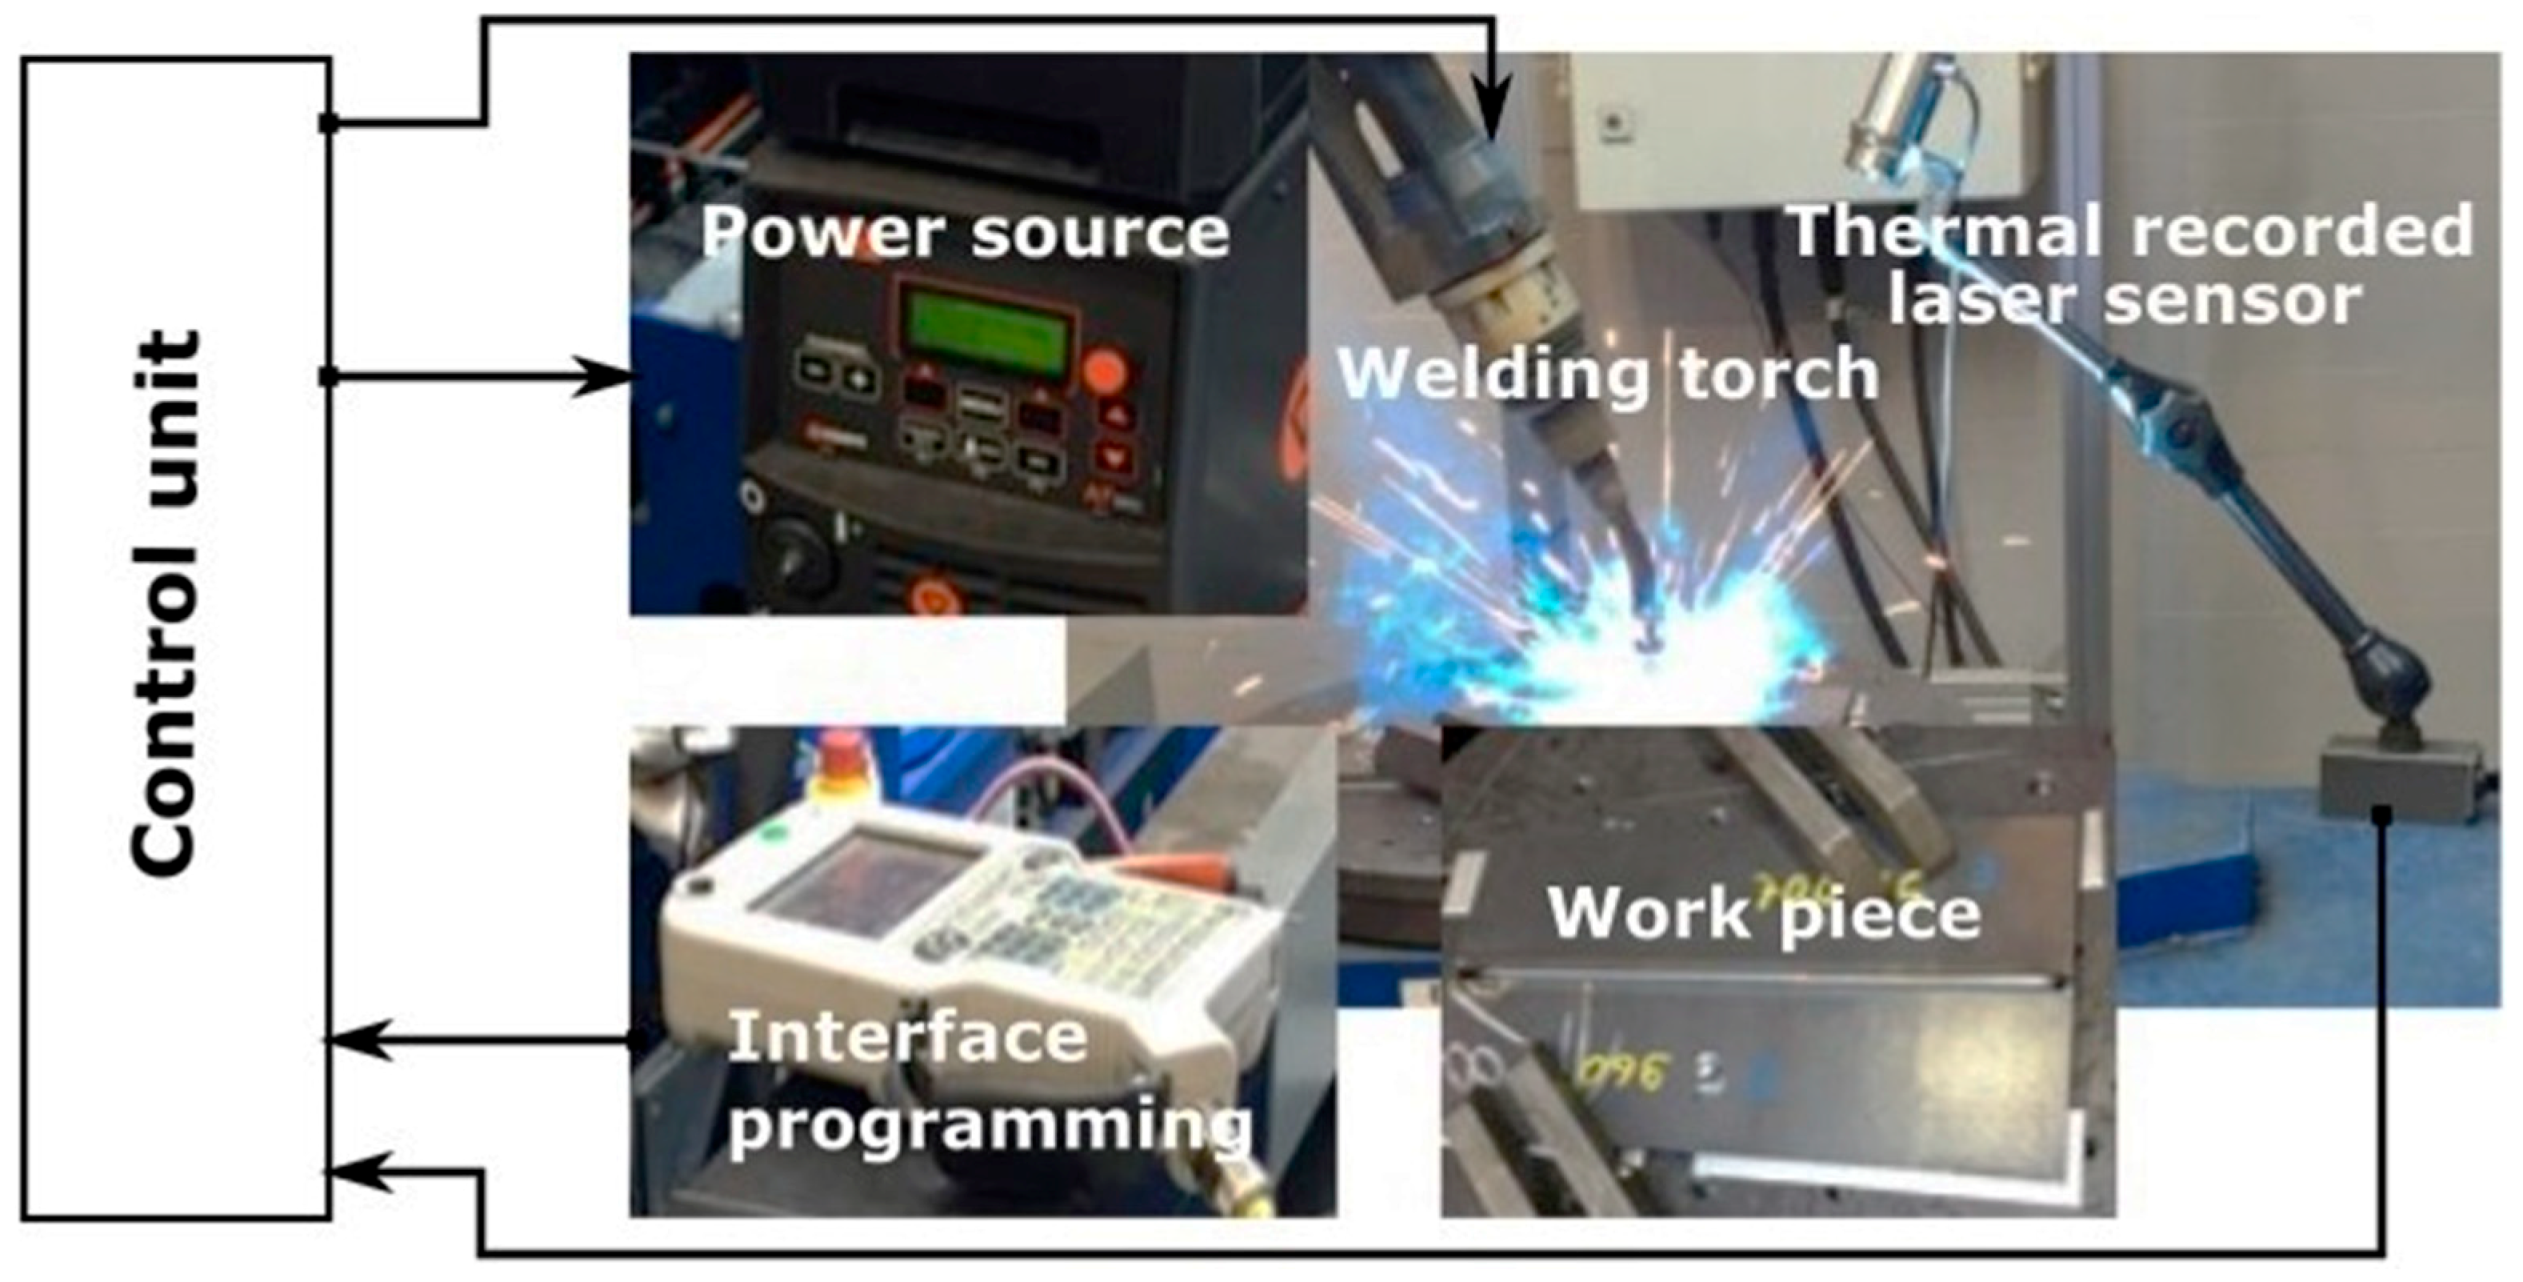
2. Experimental Setup

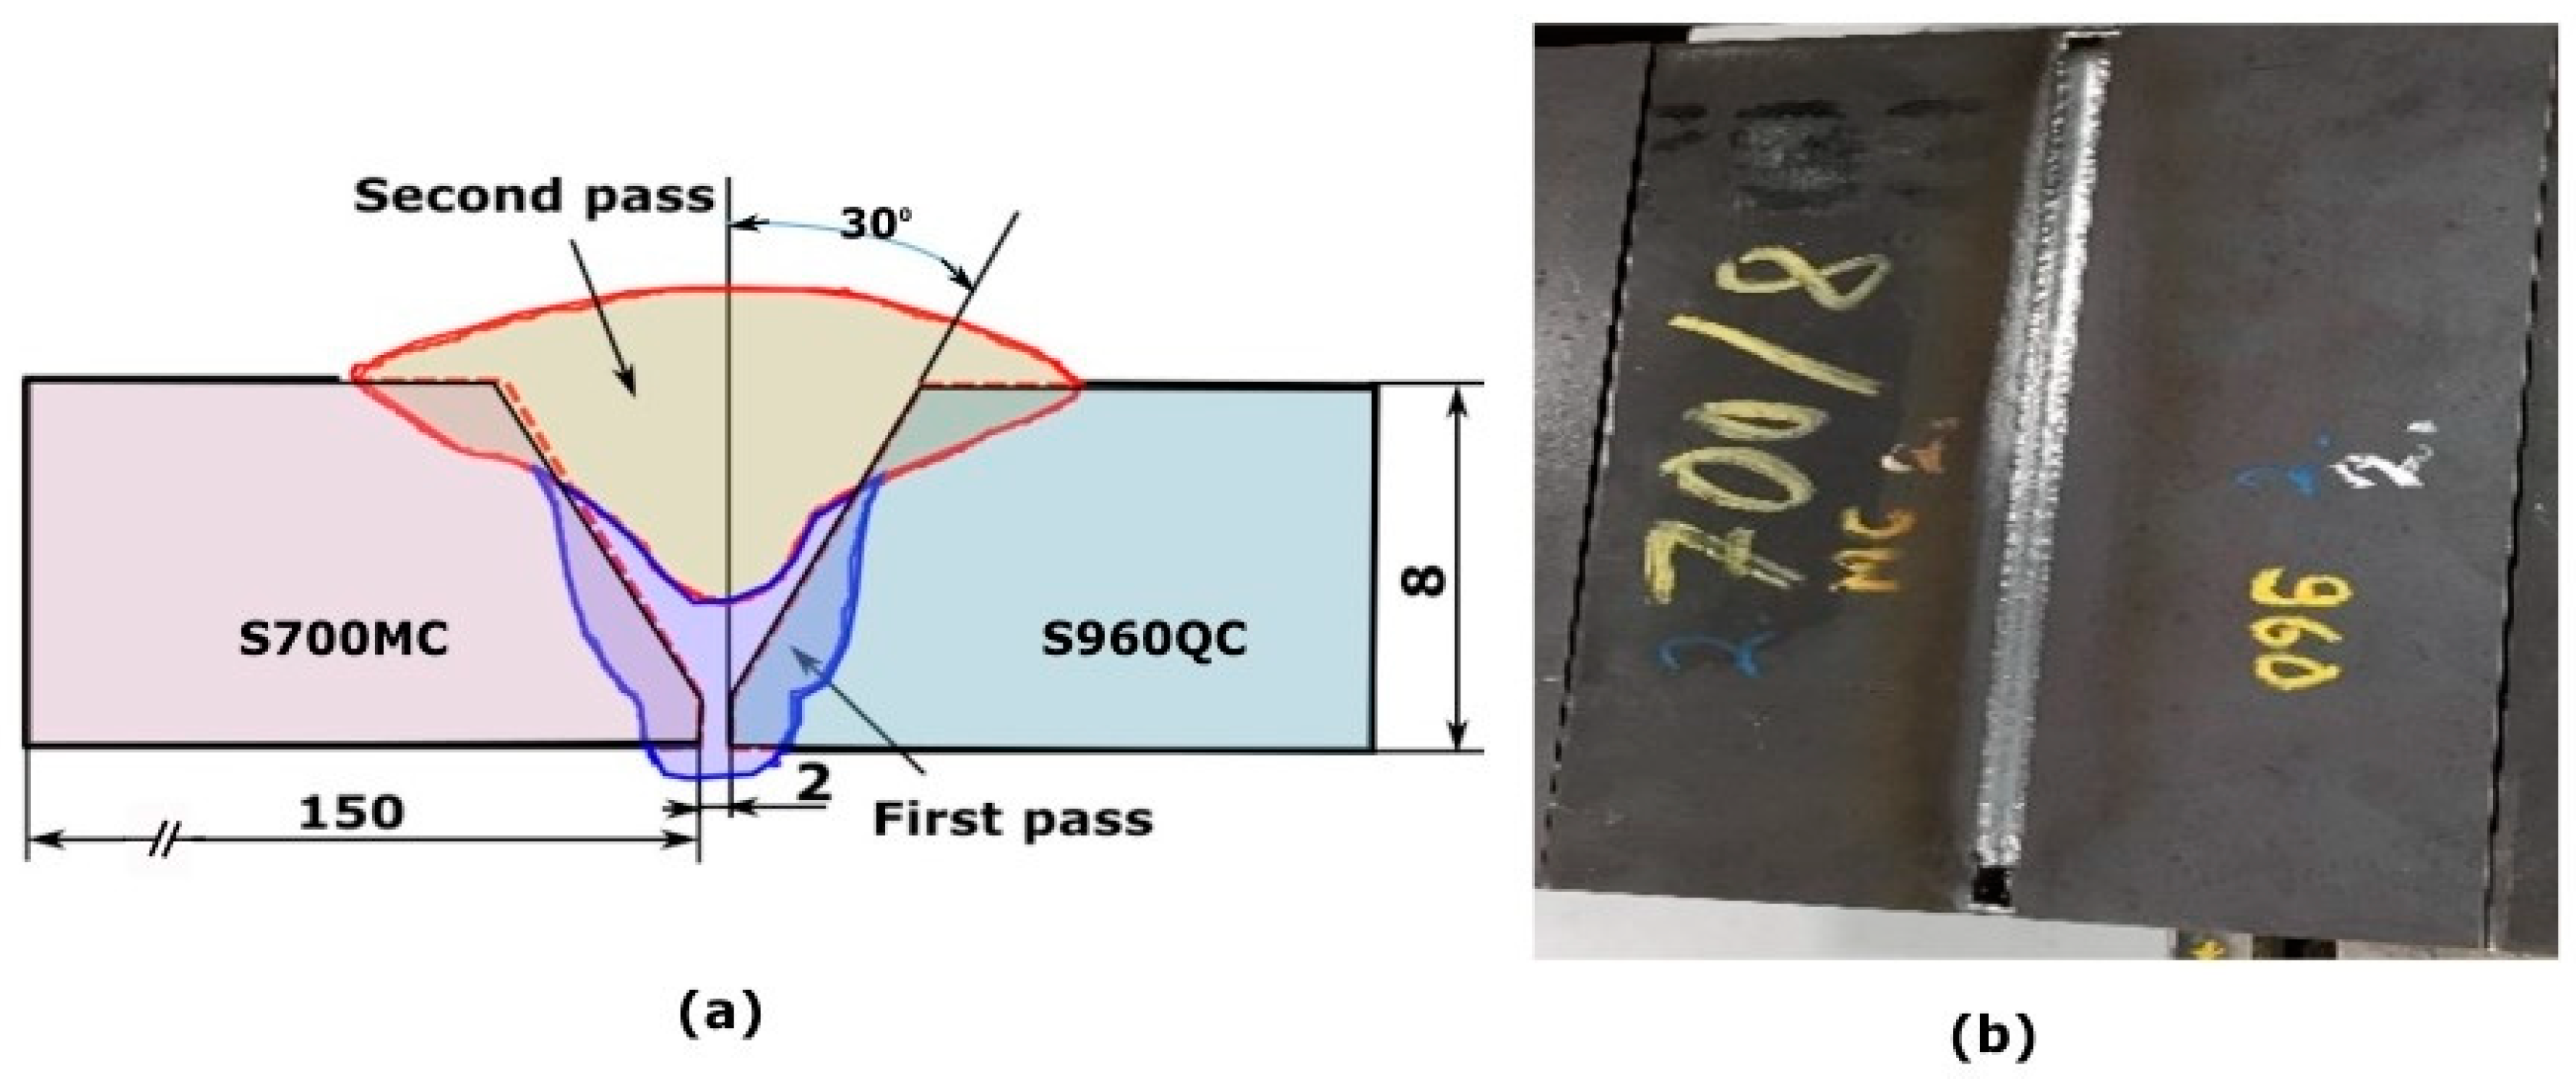
2.1. Welding Procedure

The experiments were conducted using S700MC and S960QC dissimilar materials. Gas metal arc welding using a shielding gas of Ar + 18% CO2, with a flow rate of 17 L/min, and an automatic robotic system equipped with a digital laser sensor allowing for the intuitive reading and evaluation of the t8/5 cooling time during the welding process were used. The equipment, illustrated in Figure 1, was integrated into the central unit and interconnected the interface programming system, the robot system, the thermal recorded laser sensor, and the power source. The parts to be welded were placed in a cabinet at both ends. Changes in the heat input automatically changed the speed of the welding torch. Table 1 shows the different parameters used for the heat input. As the welding processes were used on two passes, the first pass remained constant at a value of 7 kJ/cm for all samples. The second weld pass had three heat input values, which were applied to the three samples, and which allowed for the determination of the cooling curves during the welding process and for the calculation of cooling rates favorable to the different samples.
The arc efficiency of the GMA welding process used for determination of the heat input values was 0.8. A laser sensor was used to measure and record the thermal profile at the different phases of welding. The measured thermal profile data were saved in the central unit of the welding equipment, where the captured weld seam data were stored for subsequent import to LabVIEW software (LabVIEW 2018, NI, Austin, TX, USA) for thermal profile distribution analysis.
Three specimens of dissimilar structural steels (S700MC/S960QC) with dimensions of 300 × 200 × 8 mm3 and a V-groove butt joint with an angle of 60° and a 2 mm gap were produced (Figure 2a,b). Several welds were made with different heat input values. Figure 2b represents the configuration of the welded sample. The samples were made using a filler wire Union NiMoCr with a 1 mm diameter. Table 2 shows the chemical composition of the base materials and filler wire, obtained according to the weight % (wt %) and mechanical properties, and characterized by the yield strength (YS), ultimate yield strength (UTS), elongation (A5%), and Vickers hardness (HV5). The carbon equivalent (CE) of the investigated steels was calculated according to the following equation [17]:
C E = C + M n 6 + ( C r + M o + V ) 5 + ( N i + C u ) 15

2.2. Tests of Weld Joints

In this study, the specimens were tested using non-destructive and destructive methods. The welded samples were machined and polished such that they had smooth surfaces suitable for use in microscopic analysis. All samples used were prepared according to the ISO 17637-2017 standard [29].

2.2.1. Conducted Non-Destructive Tests

A hardness test was conducted for a line of measurement using a Wilson Wolpert 452SVD Vickers hardness tester (ITW, Chicago, IL, USA) according to ISO 6507-1:2018. These measurements were taken point-by-point over the entire length of the sample.
Optical microscopy (OM) was applied using different positions of the sample to determine the microstructure of the welded sample.
Scanning electron microscopy analysis using a Hitachi SU3500 (Hitachi High-Technologies America, Chicago, IL, USA) scanning electron microscope was conducted to analyze the specimens etched in a first etchant (4% solution of HNO3 in ethanol).
The EDS analysis using the Hitachi SU3500 equipment (Hitachi High-Technologies America, Chicago, IL, USA) was used to identify the variation in the composition of the alloy elements in the specific areas of the HAZ of both materials.

2.2.2. Conducted Destructive Tests

The destructive test in this analysis was a tensile test using ZWICK/ROZ Z 330 RED equipment. Six specimens were prepared, i.e., two per weld sample.

3. Results

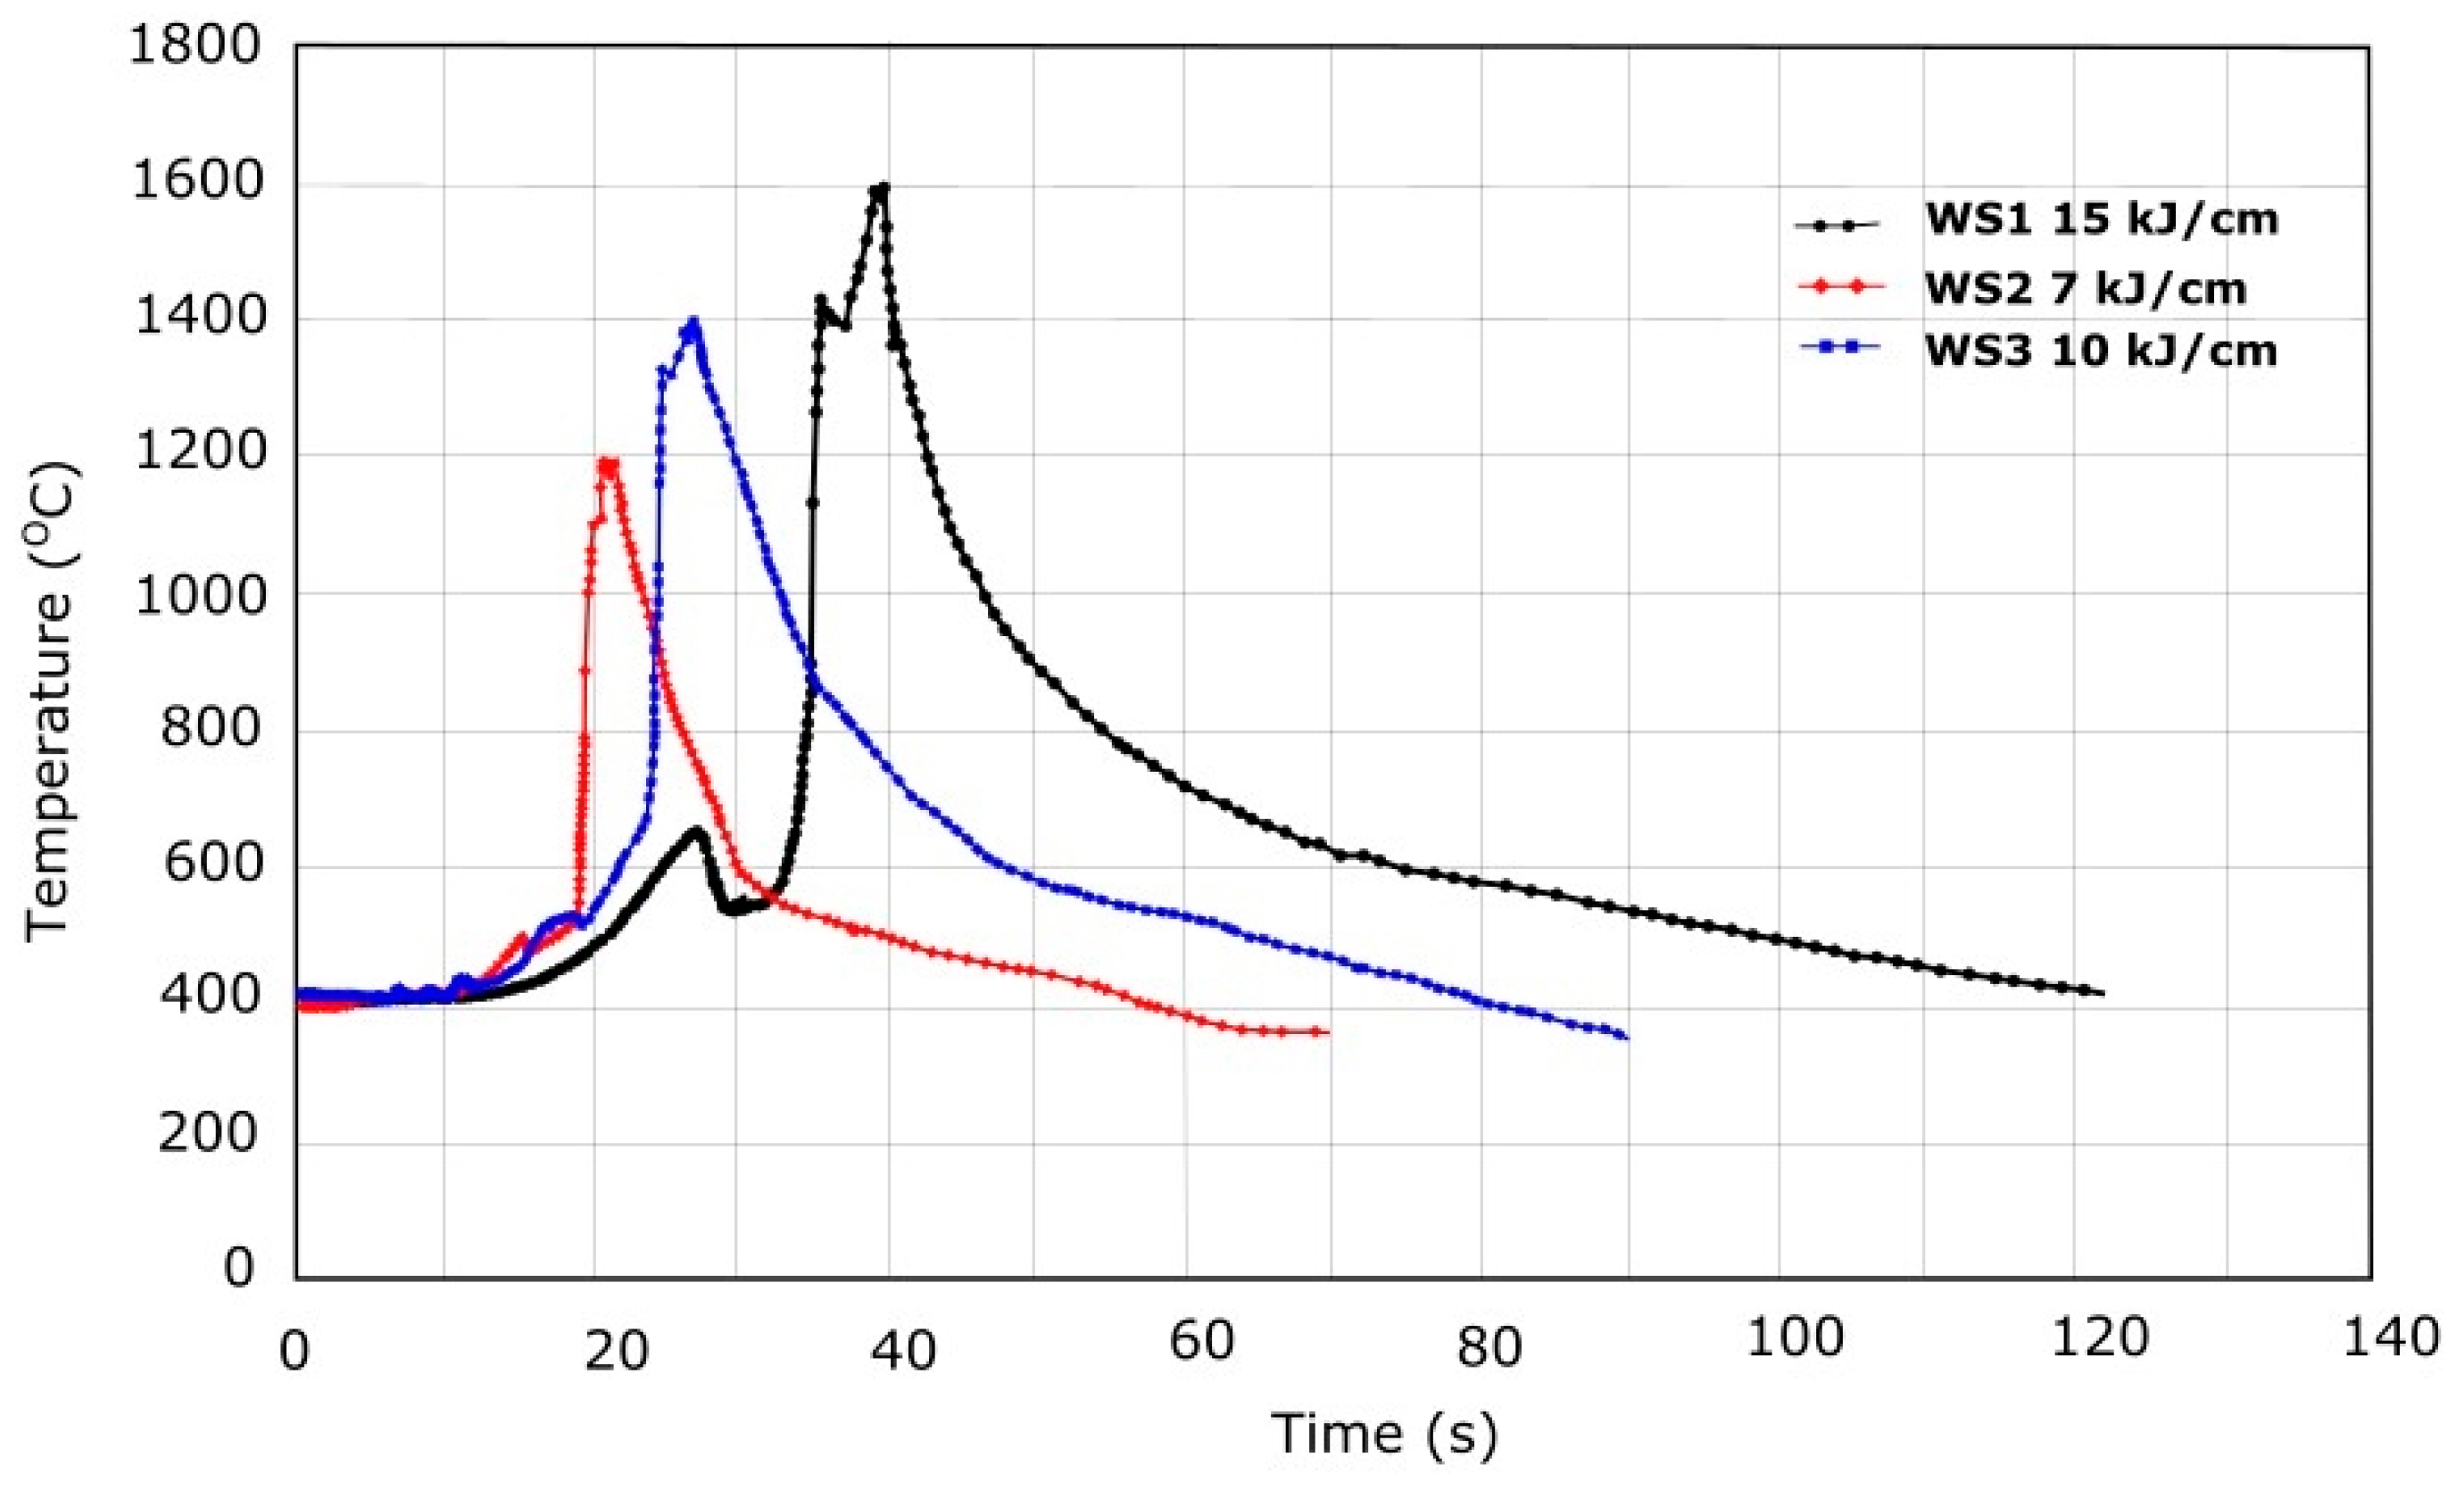
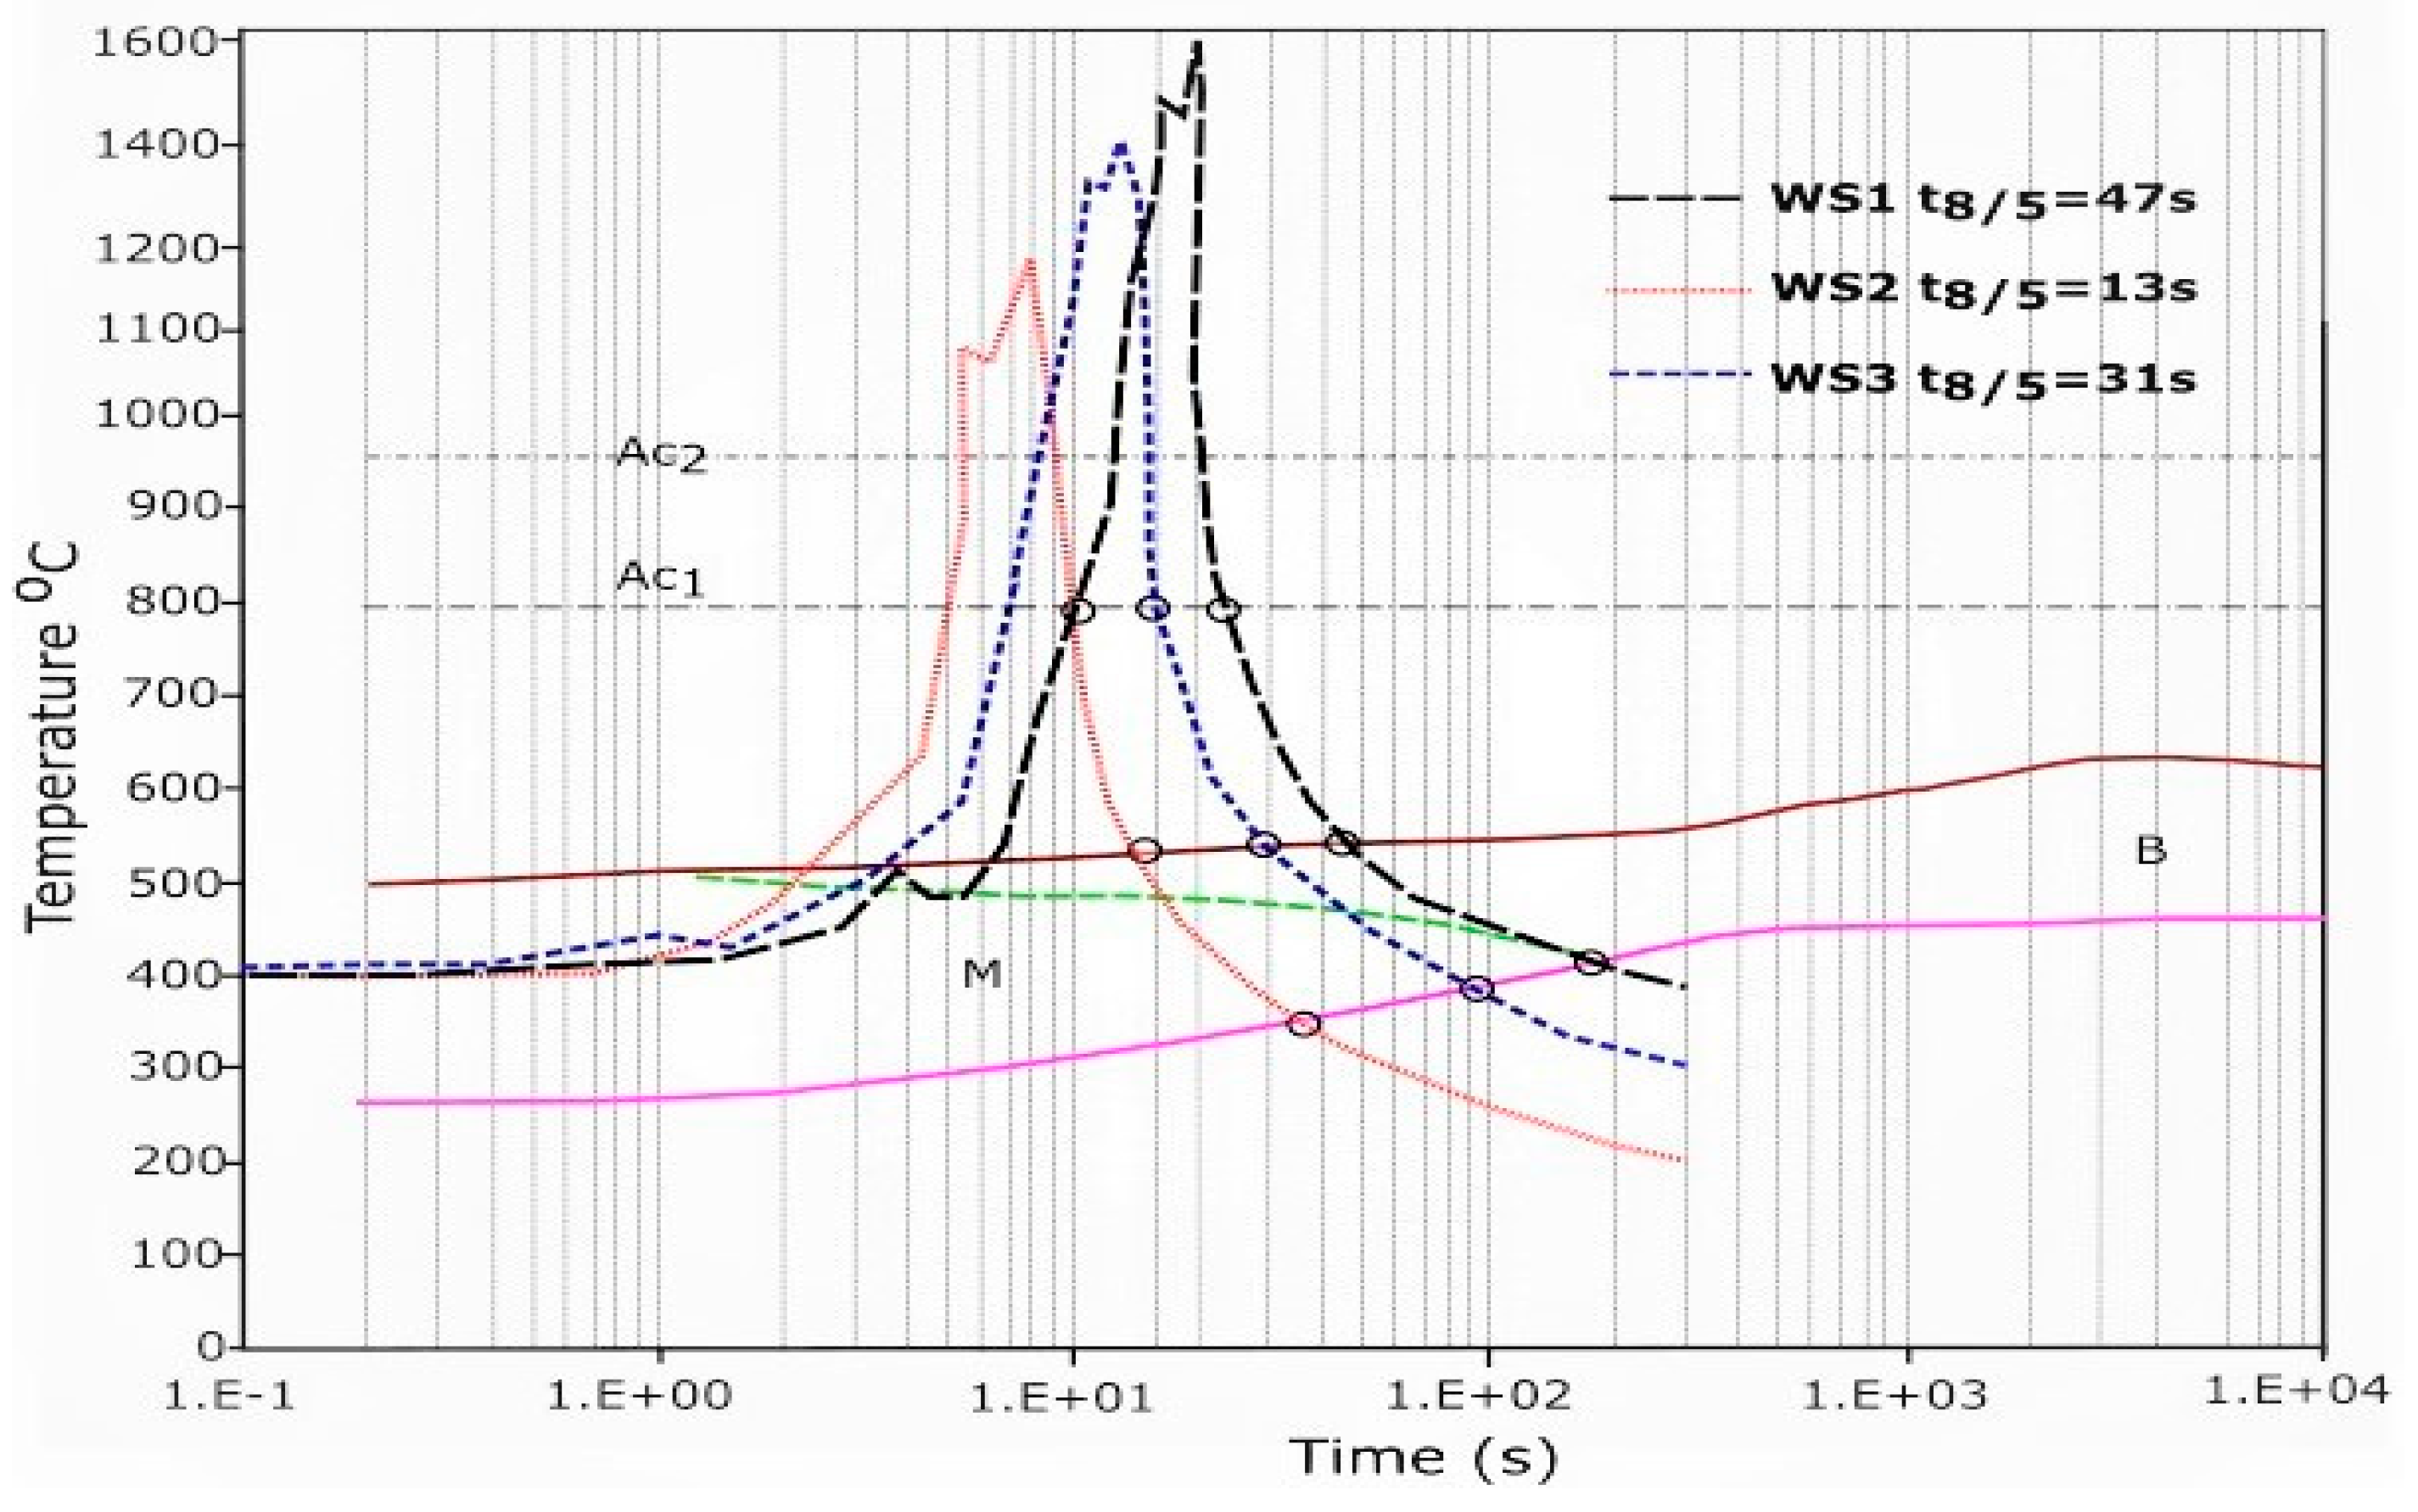
3.1. Thermal Profile

Figure 3 presents the thermal profile registered after welding dissimilar HSS of S700MC/S960QC. The cooling time (t8/5) was obtained by evaluating the time during the interval between the temperatures of 800 °C and 500 °C. The first curve (in black) shows the thermal profile using the heat input of 15 kJ/cm (WS1). From this curve, the peak temperature observed was 1600 °C, and the cooling time registered was t8/5 = 41 s. The reason for this cooling time was the increase in the heat input rather than changes in other values. The second curve (in red) presents the thermal profile using the heat input of 7 kJ/cm (WS2). The peak temperature observed was 1200 °C, which was less than the value for the other experiments and the cooling time was t8/5 = 13 s. The only reason for this cooling time was the decrease in the heat input value. The last curve (in blue) presents the thermal profile using the heat input of 10 kJ/cm (WS3). The results here show the peak temperature at 1400 °C, which produced a cooling time of t8/5 = 33 s.
The final microstructure, the HAZ behavior, and the mechanical properties depend greatly on the cooling rate and the peak temperature reached during the welding temperature cycle. For low-carbon steels, like S700MC and S960QC, the temperature that was used to calculate the cooling rate was 550 °C. In the experimental analysis, the cooling time (t8/5) for the interval of 800 °C to 500 °C was measured during the welding process and is shown in Table 3. In the literature, researchers have presented an empirical relation, using low-alloy carbon steels, to evaluate the cooling time–temperature from 800 °C to 500 °C during a welding process [9,30]:
Δ t 8 5 = ( 0.67 0.0005 T 0 ) q s o u r c e v ( 1 500 T 0 1 800 T 0 )
or
Δ t 8 5 = ( 0.043 4.3 × 10 5 T 0 ) ( q s o u r c e v h ) 2 ( 1 ( 500 T 0 ) 2 1 ( 800 T 0 ) 2 )
where q s o u r c e v is the heat input per unit length, obtained by the heat source, and T 0 is the preheating temperature (initial temperature). Equation (1) is applied for three dimensions and Equation (2) for two dimensions. To evaluate the cooling rate (R500), the initial temperature T 0 is assumed to be constant, with or without preheating. The peak temperature T m a x can be defined as in Equation (3) [9,30]:
T m a x ( y ) T 0 = 1 2 π e q ( v h ) c ρ 1 y
where y is the distance from the weld line in the HAZ (mm), e is the thickness of the workpiece (mm), and c ρ is the specific heat capacity per unit of volume ( 0.005   J / mm 3 K ).
Knowing the mode of heat propagation of the preheating temperature T 0 and the expression of q v , the cooling rate R 500 can be defined by [9,30]:
R 500 = T ( 0 , T ) t = 2 π λ c ρ ( T m a x T 0 ) 3 [ q ( v h ) ] 2
where R 500 (°C/s) is the cooling rate at 500 °C, which can increase with the value of ( T m a x T 0 ) and decrease with the heat density ( q v ). λ is the thermal conductivity (W·m−1·K−1), v is the welding speed (mm/s), and h (mm) is the thickness of the weld joint.
Table 3 presents the results of the cooling rates obtained for the three heat inputs in the various welded joints. A slow cooling rate was observed for the first heat input, which was considered high compared to the others. The heat input of 15 kJ/cm, after measuring the cooling time t8/5 (47 s), gave a cooling rate of approximately 10 °C/s at a temperature of 500 °C R500, after calculation. A fast cooling rate was observed in welding sample 2 (WS2), which had a heat input of 7 kJ/cm.

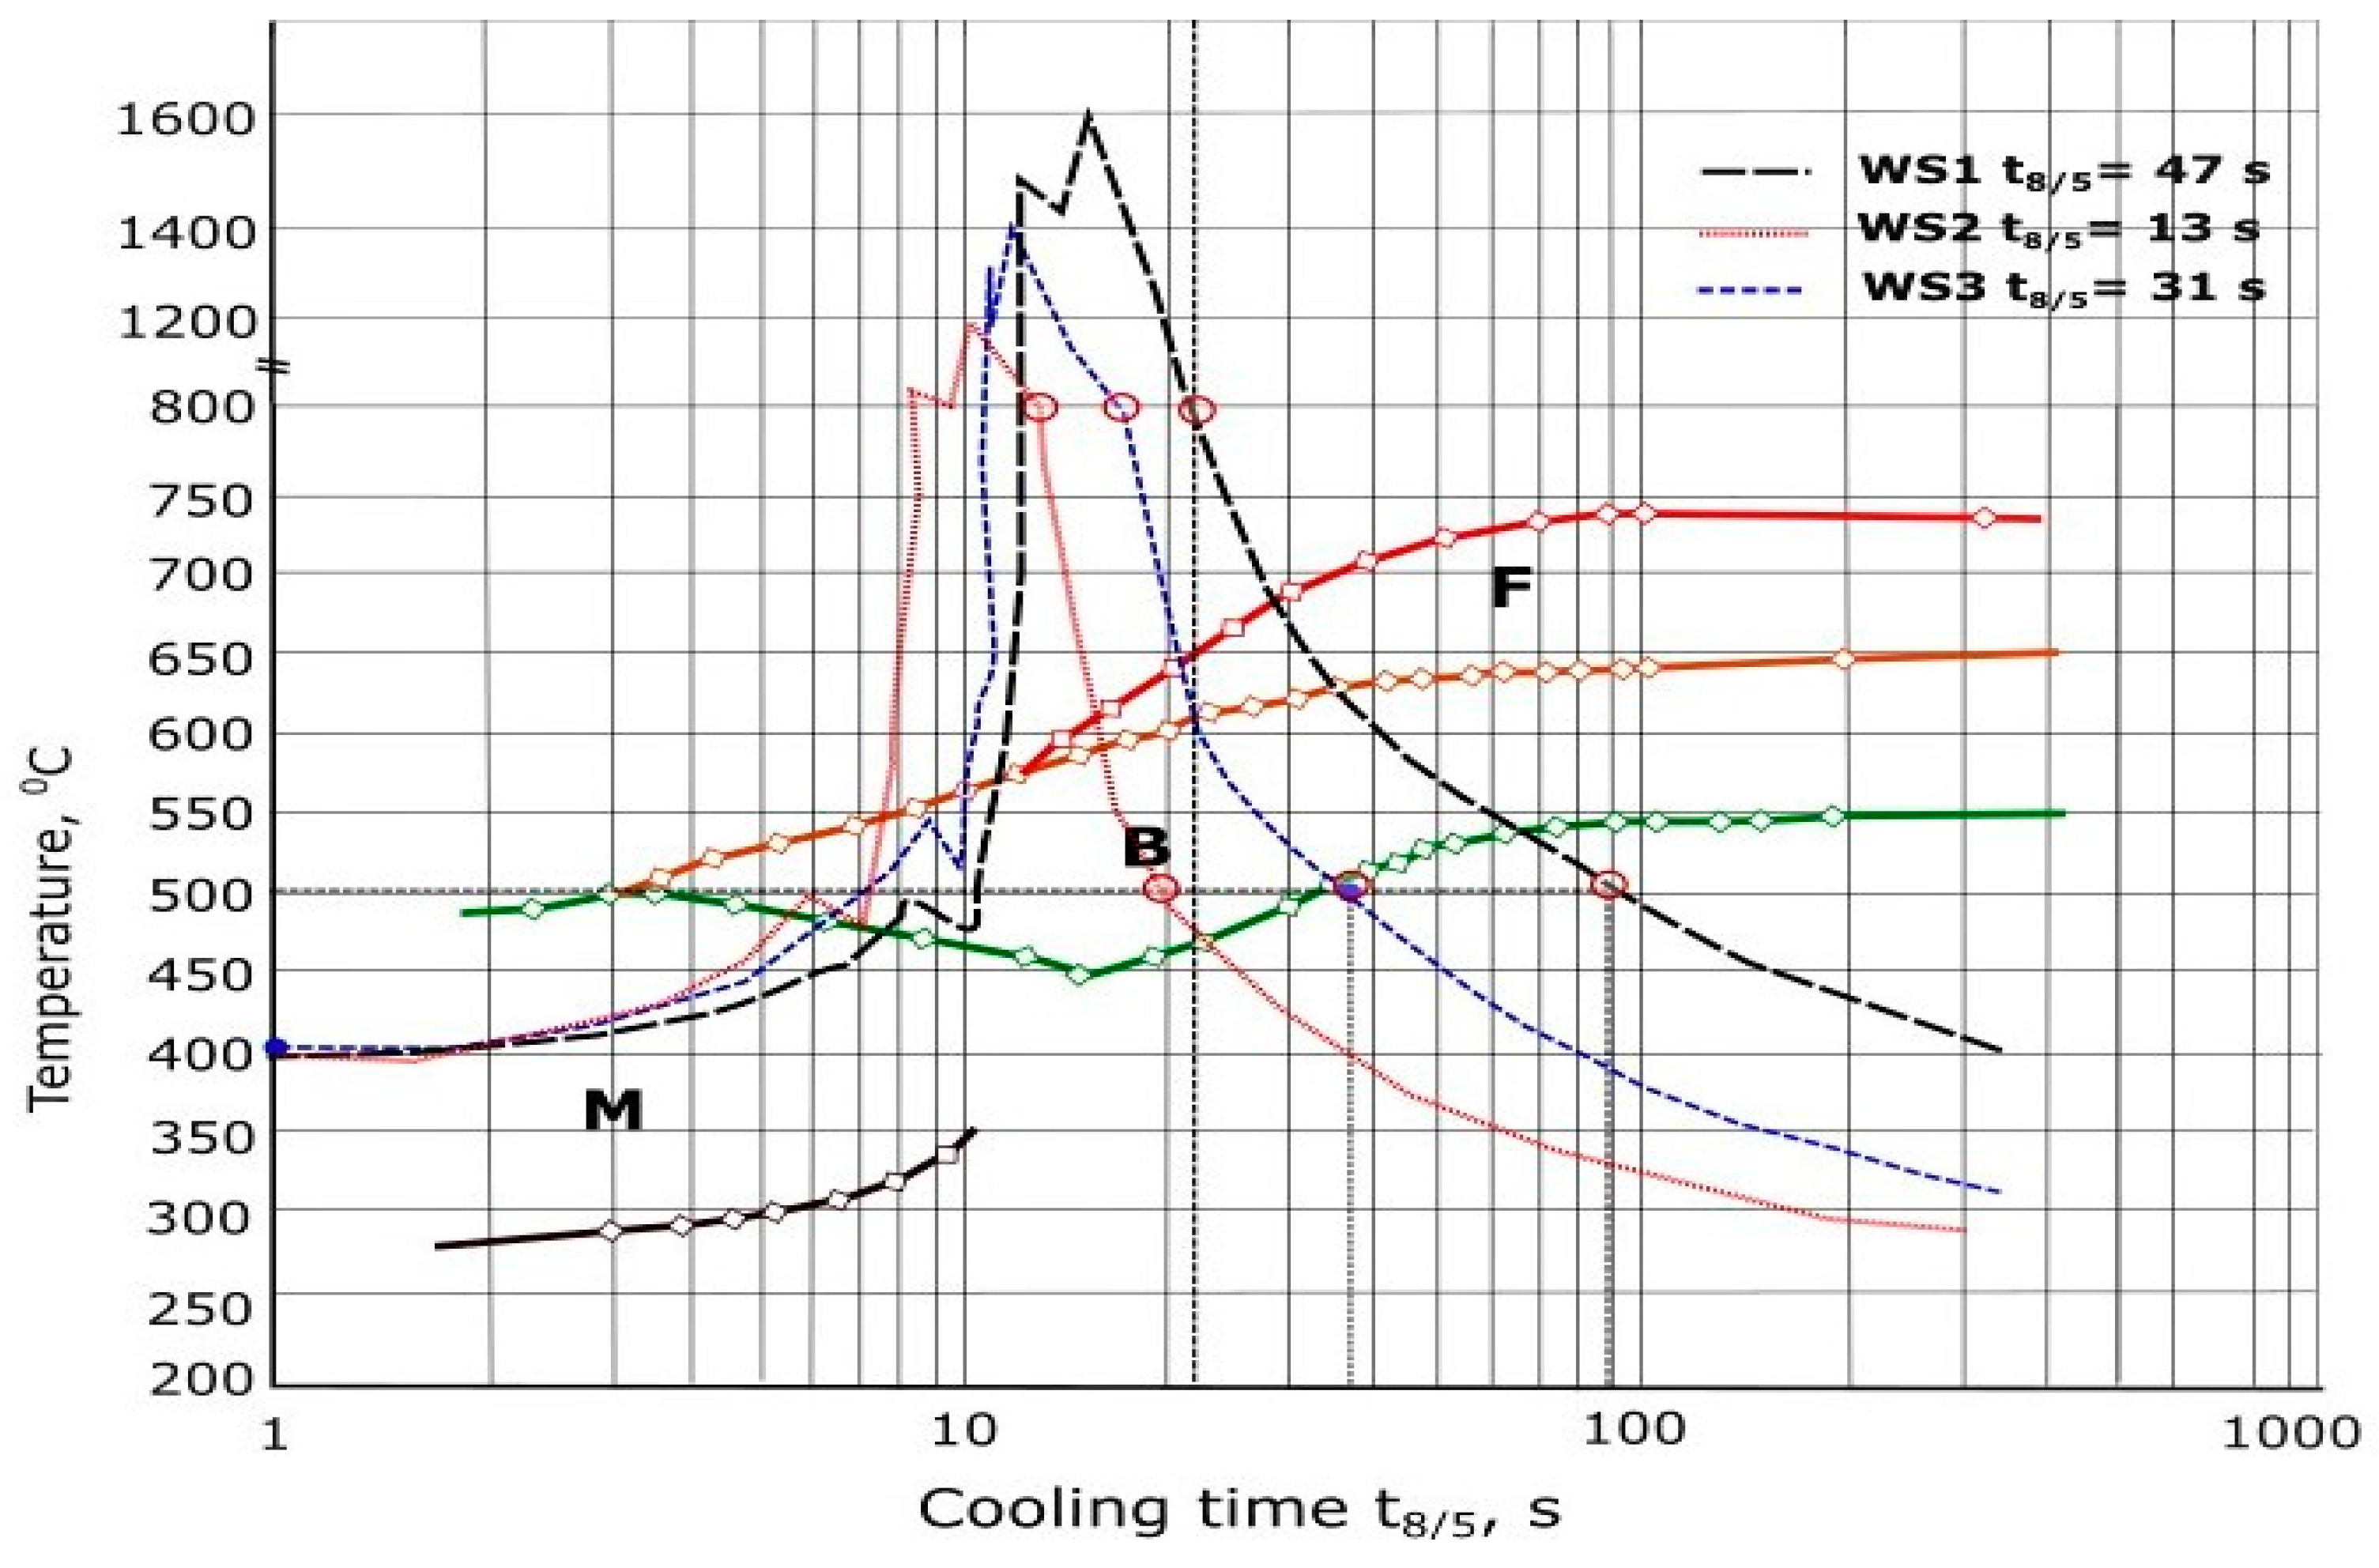
3.2. CCT Diagram of S700MC Steel

The CCT diagram of S700MC was calculated based on the cooling time (t8/5) for the three heat inputs obtained during the welding operation, and the cooling curves are represented by the heat inputs of WS1 t8/5 = 47 s, WS2 t8/5 = 13 s, and WS3 t8/5 = 31 s. From this CCT diagram, it can be observed that in WS1, the transformation starts at a temperature of between 700 °C and 520 °C. The cooling curves were recorded from the austenitization temperature Ac3 (800 °C) to the temperature after the transformation (400 °C). Using the cooling time values and the formations, the cooling rate can be evaluated (R500 = 10 °C/s). The consequence of having a lower R500 is an increase of the transformation temperature and the favoring of a predominance of F, with some B at a higher temperature. It is also clear that this increase in the heat input leads to a much bigger HAZ [31]. The faster cooling rate (R500 = 33 °C/s), which was found in WS2, leads to a decrease in the temperature transformation from 550 °C to 450 °C. The temperature transformation favors the formation of a predominance of B and a little F. So far, with the cooling observed, there was no M formation because, according to the CCT diagram, this cooling rate was still a little slow compared to the results produced in Reference [32] using a laser welding process with a heat input of 1.7 kJ/cm. The cooling rate of 21 °C/s, which was applied for WS3, has a temperature transformation that starts at a temperature of between 650 and 500 °C. Due to the medium heat input of this sample, the microstructure was mainly comprised of B, with some F, as shown in Figure 4.

3.3. CCT Diagram of S960QC Steel

Figure 5 presents a CCT diagram of S960QC showing the cooling time of the welded samples. The temperature was recorded from the austenite to the solidification. A slow cooling rate (R500 = 10 °C/s), when the heat input of 15 kJ/cm was used, led to the formation of B in the microstructure. There was no observed formation of M. In WS2, which had a fast cooling rate (R500 = 33 °C/s), a decrease in the temperature transformation in the CCT diagram (500 °C to 280 °C) was observed. A predominance of M, with some B during the transformation, can be observed. The cooling rate R500 = 21 °C/s, which is a medium cooling rate, has a formation of 50% of B and 50% of M (see Figure 5). The temperature transformations started at between 520 °C and 320 °C.

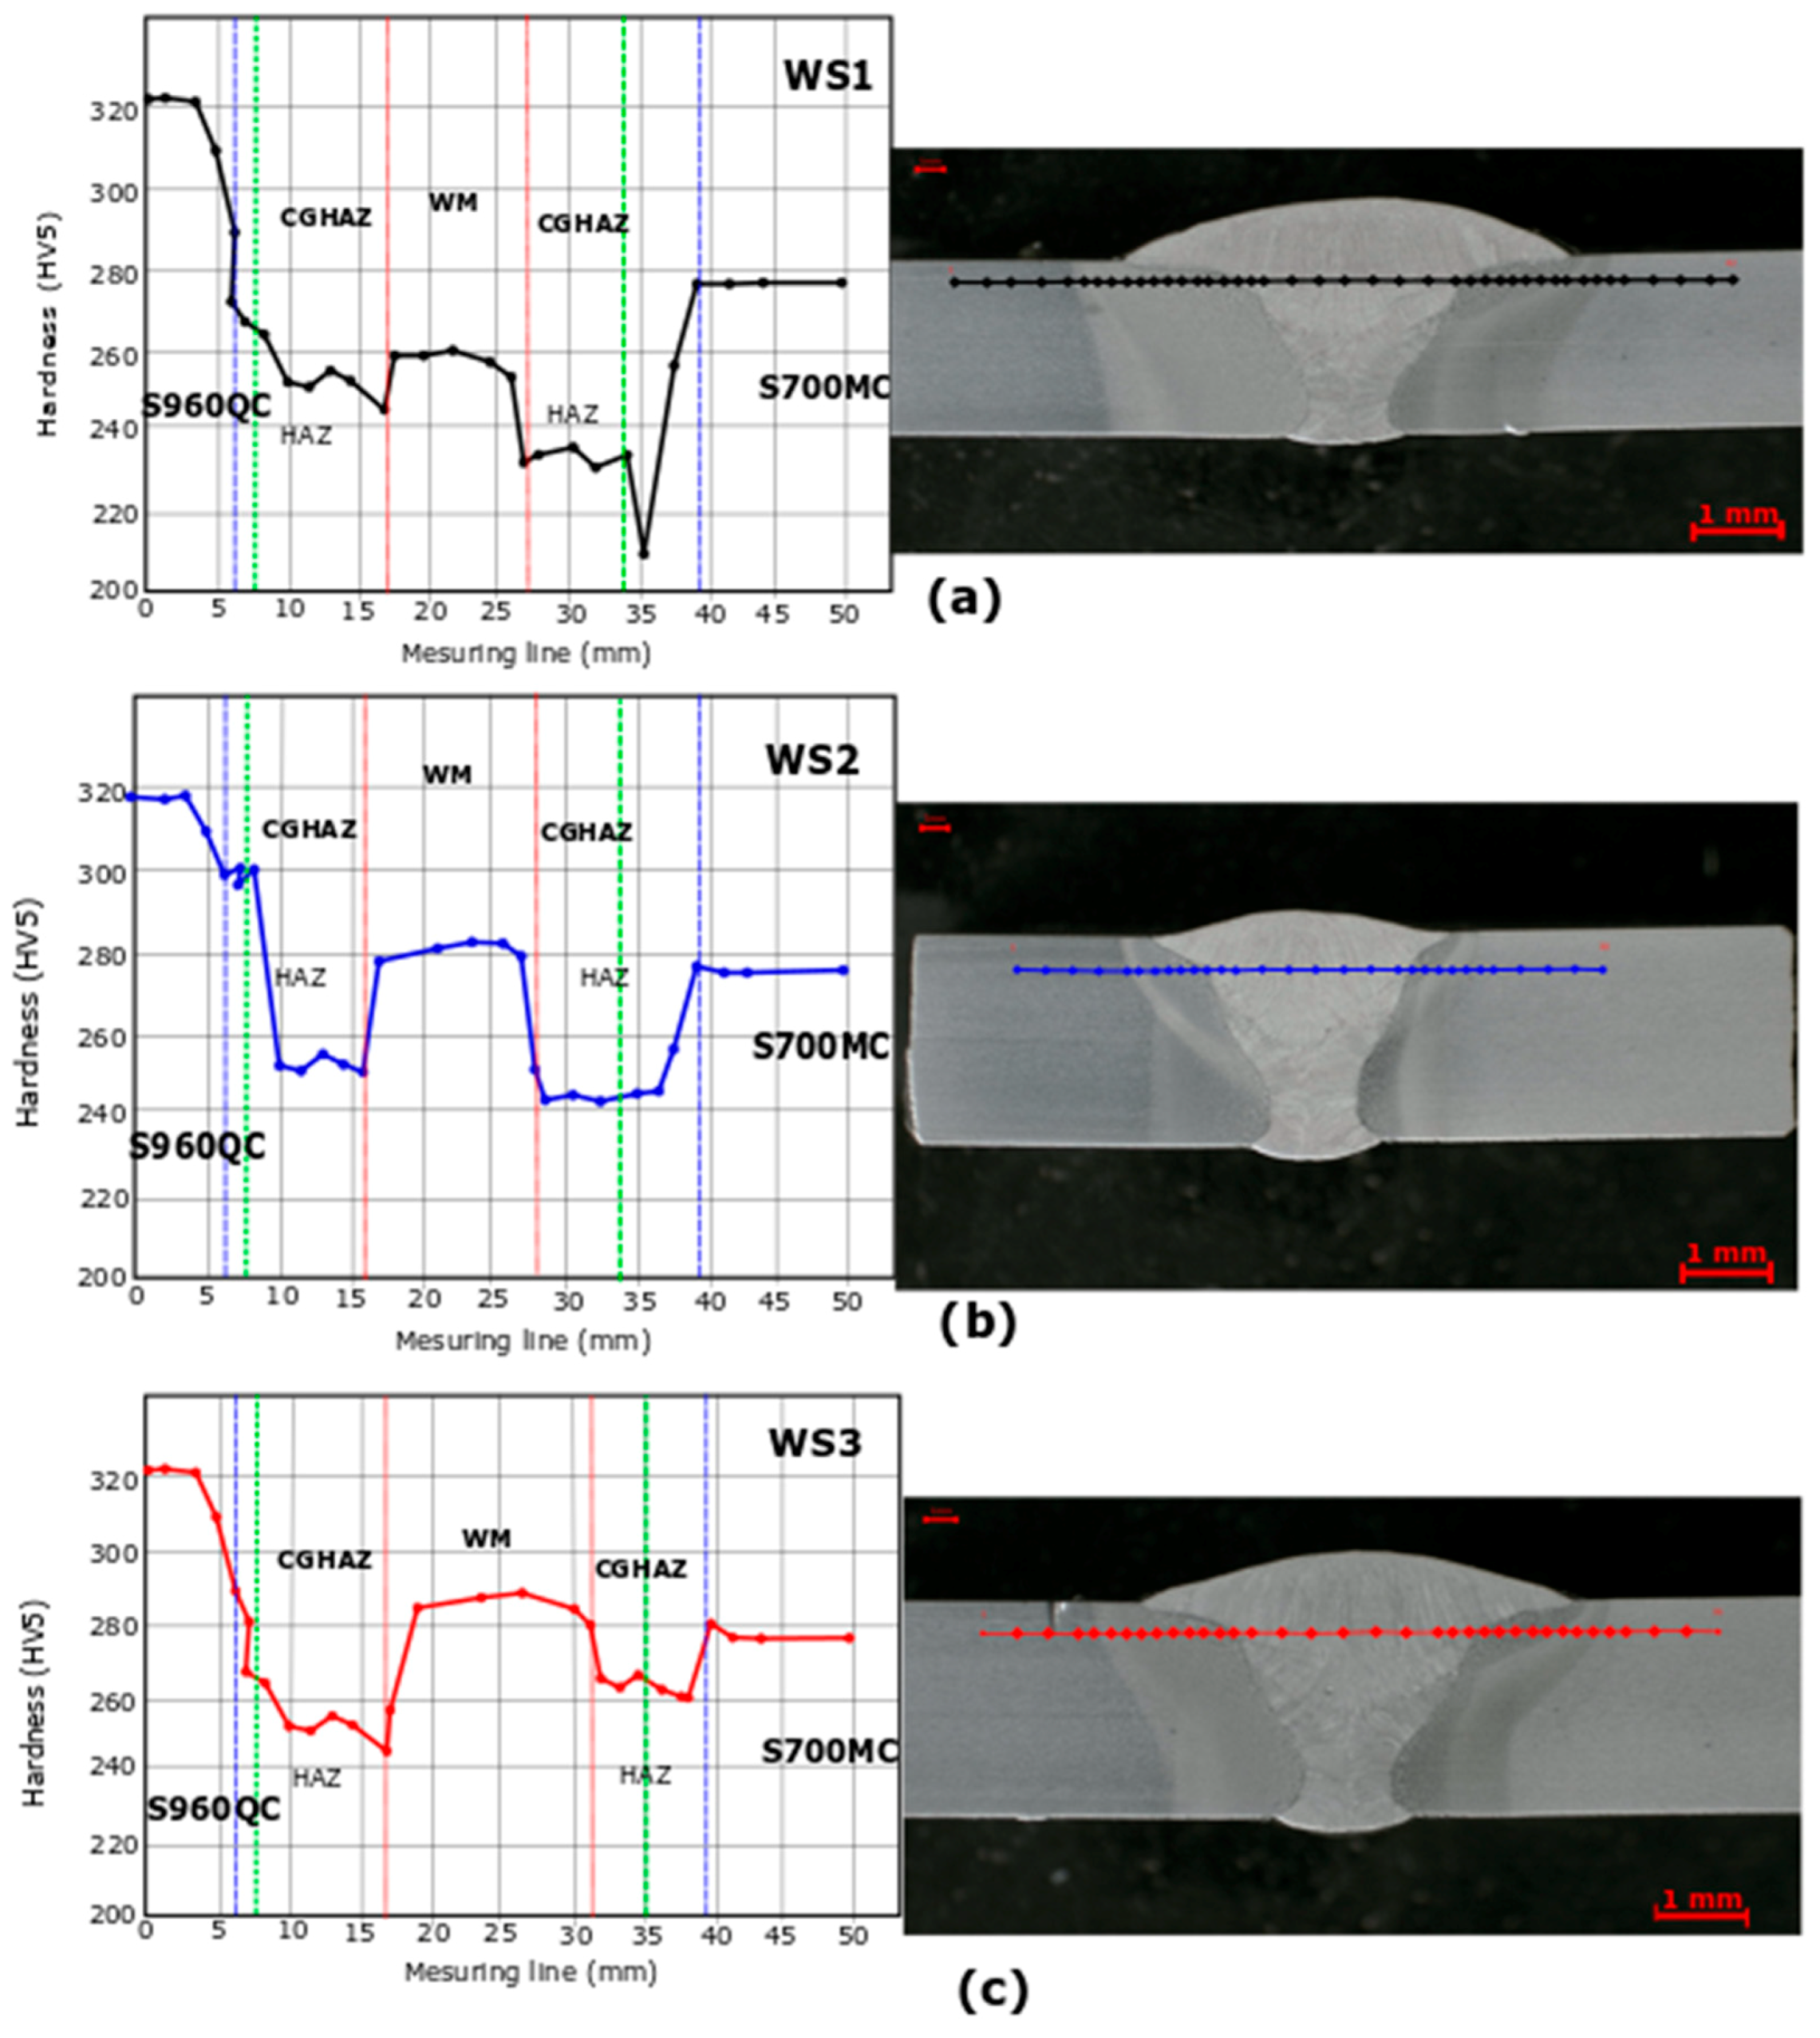
3.4. Hardness Analysis of the Dissimilar Weld Joints

Figure 6 shows the hardness profile of the dissimilar welded samples after the samples were welded. It was measured using a Wilson Wolpert 452SVD Vickers hardness tester according to the ISO 6507-1:2018 standard [22]. The Vickers hardness mapping profiles across the welded joints were measured using a load of 5 kgf. The loading rate was 0.50 N/min, the unloading rate was 0.50 N/min, and the dwell time of measurements was 20 s. At least 45 random measurements across the samples were used to determine the characteristic average values. Figure 6a (left) presents the hardness profile, which had a different area of the HAZ for both the materials and the weld material. On the right side, the figure presents, in red, the measurement line, which provides a dotted representation of the different positions of the indents. The measurement line is 2 mm from the top of the weld joint.
For the first sample (WS1), the lowest hardness occurred in the fine-grain heat-affected zone (FGHAZ) of S700MC, with a value of 210 HV5. The average hardness in the HAZ of S700MC was 225 HV5. For S960QC, the lowest hardness occurred in the course-grain heat-affected zone (CGHAZ) (240 HV5) near the fusion line (between the CGHAZ and the WM). The hardness values in the weld metal of this sample were not significantly increased (260 HV5). When comparing the two base materials using WS1 (Figure 6a), the influence of the heat input value and the undermatching filler wire can be seen. The use of undermatching filler wire leads to a significant hardness drop in both sides of the welded joint [33]. This may be important as increasing the alloy content of the filler wire may enable the required hardness and strength of the weld metal to be obtained.
When the heat input was reduced, using 7 kJ/cm (Figure 6b), the average hardness value of the base S700MC steel as approximately 270–280 HV5. A decrease in the hardness value of 8% to 260 HV5 was observed near the CGHAZ. On the S960QC side, the average hardness meseared was 300 HV5 lower compare to the BM (320 HV5). The average hardness of the weld metal was increased to 285 HV5. The reason for the hardness increase was the reduction of the heat input, which can lead to the formation of hard martensite (M) in the HAZ.
Figure 6c shows the hardness profile and a micrograph for the heat input of the WS3. A decrease in the average hardness of S700MC to 250 HV5 in the HAZ can be observed. The cause may be the increase in the heat input values, which favors a relatively faster cooling rate (21 °C/s). On the S960QC side, the peak hardness value was attributed to the FGHAZ, which was almost 300 HV5 and less than the BM. The reason was that the characteristic of the weld metal (mechanical and chemical composition) was less favorable to hardness than that of the BM (undermatched weld metal). The decrease in the heat input value in this sample also contributed to this result. One of the solutions to increase the hardness in this area is to increase the alloying content of the WM, which will increase the strength when using the GMA welding process and can lead to the desired hardness and strength in the weld metal [34].

3.5. Effect of the Welding Process on the Microstructure of the Dissimilar Joint

3.5.1. Base Materials

Figure 7 shows the microstructure corresponding to the thermomechanical-controlled process of S700MC steel and the quenched and tempered S960QC steel. The microstructure of S700MC was principally composed of approximately 70% B and 30% F (Figure 7a). The particularity of this steel is the microstructural control technique, which is a combination of controlled rolling and controlled cooling (accelerated cooling) during the production process. The microstructure of S700MC is subject to low alloy elements and may need almost no preheating, resulting in an improvement in the weldability using the GMA welding process. The typical SEM microstructure of 960QC steel is illustrated in Figure 7b, which shows a composition of fine M and B formed in the rolling direction. The appearance of M as a form of elongation prior to austenite grains in the rolling direction is also observed [35].

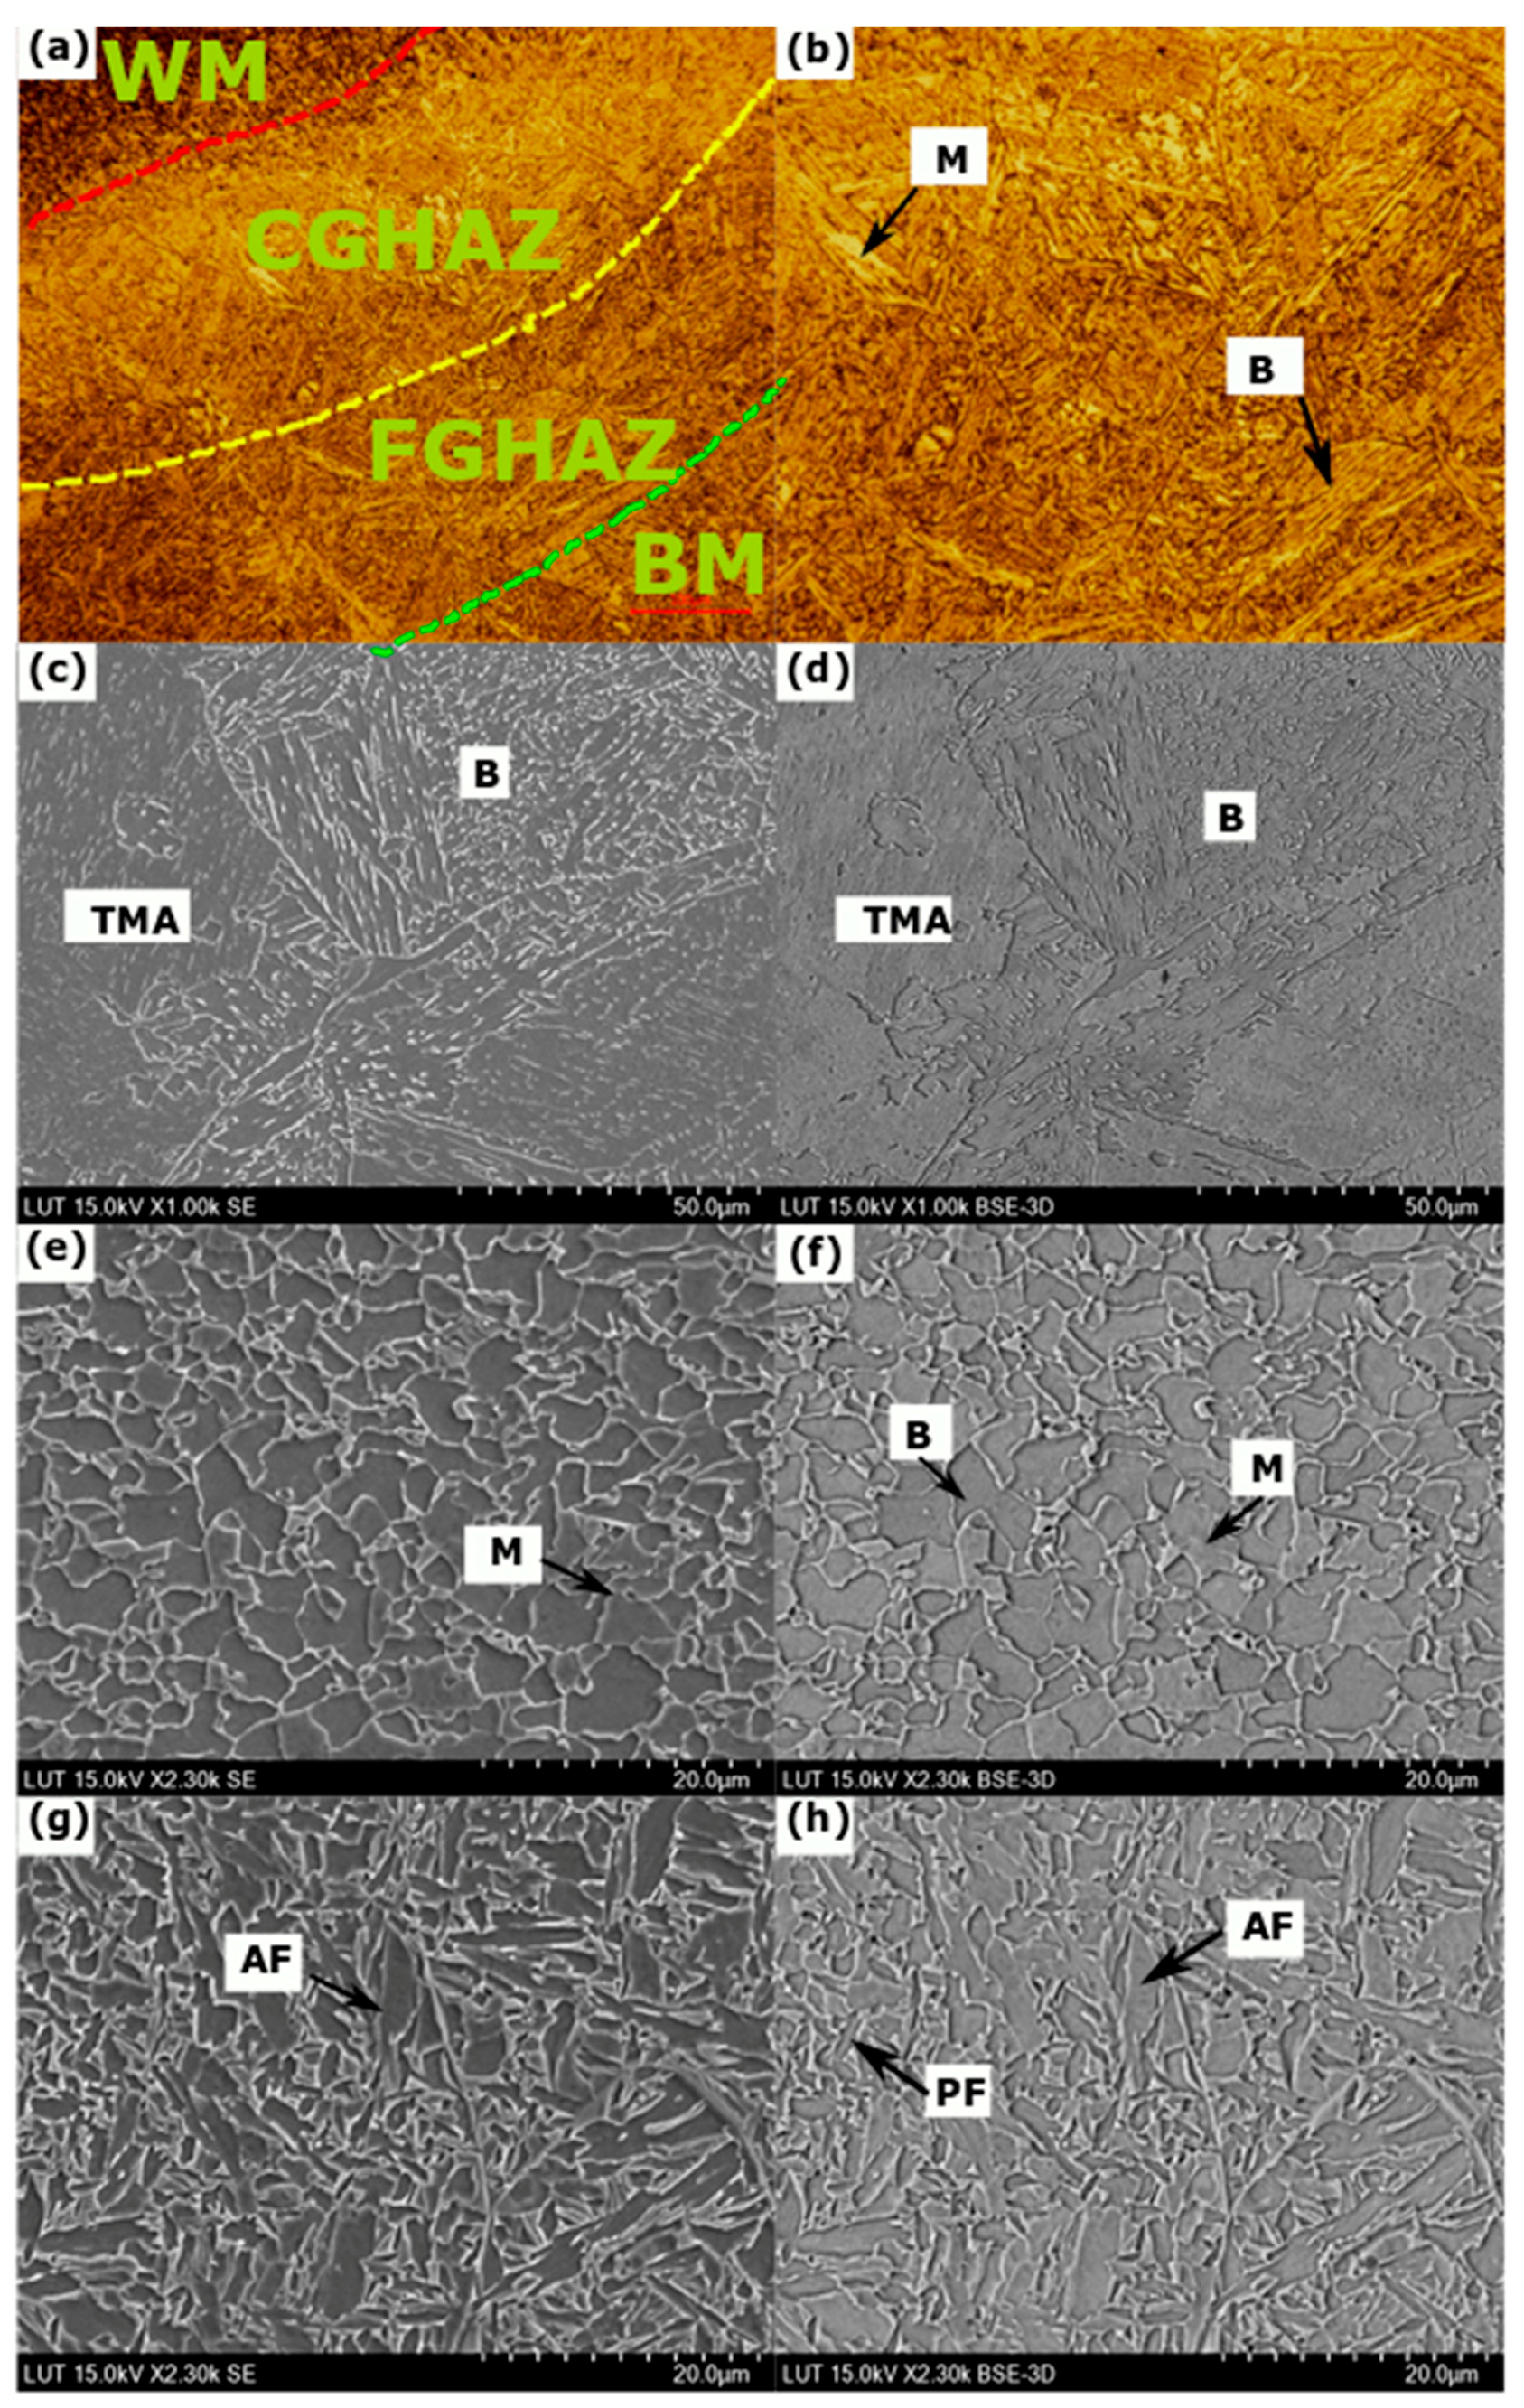
3.5.2. Microstructure Behavior of S700MC HAZ

The thermomechanically controlled HSS with a yield strength (YS) of 700 MPa had a low-carbon percentage (0.05%) and a composition of B and F in its base microstructure. The welding process (GMA welding) had a thermal impact on the microstructure of the HAZ, which was controlled by the peak temperature diffusion from the weld line to the base material. The weld sample used for the microstructure analysis was WS3 (10 kJ/cm). The microstructures have been described as sub-zones, which were identified in this analysis as the coarse-grain heat-affected zone (CGHAZ) and fine-grain heat-affected zone (FGHAZ) for both materials. The microstructures were examined using the OM and SEM images to investigate the austenite transformation from F to B for S700MC, and from B to M for S960QC. Figure 8a shows the examined sub-zone microstructure of S700MC, presenting the weld metal (WM), CGHAZ, FGHAZ, and BM. The WM and CGHAZ were subjected to the high peak temperature, which can lead to the development of a re-austenization of the grain structure. Figure 8b presents an OP image of CGHAZ of S700MC, which resulted from the highest temperature above the austenization temperature (800 °C) and during an extended period, achieved by increasing the grain size (Figure 8c,d). Figure 8e,f shows the microstructure of S700MC in the FGHAZ region of the HAZ. From this SEM image, a decrease in the austenite grain due to the increase in the distance from the fusion line to the BM can be seen.
Examination using SEM images with a resolution of 20 µm of the CGHAZ and FGHAZ allowed the different microstructural compositions in the sub-division zones of the HAZ of S700MC to be identified (see Figure 8c–f). Based on the examination, the CGHAZ austenite transformed to F, because of the higher peak temperature near the fusion line (800 °C), and B at 550 °C. The peak temperature in the FGHAZ was lower than in the CGHAZ (550 °C) and the austenite was transformed into B, while the other austenite parts were transformed into RA. A larger amount of B and a mixture of RA and F were seen. Figure 8c indicates that B sheaves in the austenite grain accrue in the same direction and plate morphologies appear. This figure also shows an existing feature of B, which corresponds to its concentration volume fraction and which can be defined as bainite–ferrite (BF).
In the FGHAZ (420 °C), the decrease in the temperature leads to austenite transformation to B and some of F to RA because of the incomplete transformation.

3.5.3. Microstructure Behavior of S960QC HAZ

The S960 QC steel was quenched and tempered at 960 MPa and had a composition of 60% B and 40% M in its BM. The sub-regions inspected in the HAZ were the WM, CGHAZ, and FGHAZ. The same phenomenon was observed in the heat diffusion from the melting point to the base material. The microstructure of the sub-zones (WM, CGHAZ, and FGHAZ) of S960QC were analyzed using OM images and SEM images. The EDS analysis was performed to evaluate the alloy element composition and its influence on the mechanical properties of the sub-zones of both materials. The CGHAZ was observed to have the lowest peak temperature, lower than that of S700MC, and remained at 500 °C, leading to a decrease in the grain size, compared to S700MC, when using the same resolution (20 µm). Compared to S700MC, S960QC had a smaller grain size, which continuously decreased with the distance from the melting zone.
The different phases identified by the SEM images using a resolution of 20 µm are shown in Figure 9c,d for the CGHAZ, Figure 9e,f for the FGHAZ, and Figure 9g,h for the WM. After the GMA welding process and based on the SEM images, the CGHAZ austenite transformed completely to B at a temperature of 450 °C and to M at 360 °C. Some of this M then transformed to tempered martensite (TM) due to the tempering after the welding process. The WM is the part in which the peak temperature is accrued due to the heat input concentration. Figure 9g,h shows the microstructure of the WM in the dissimilar joint, where two types of ferrite can be observed: pro-eutectoid ferrite (PF) and acicular ferrite (AF) at a temperature of approximately 800 °C, at which solidification starts.
Based on the sampling of the SEM micrographs, measurements were carried out directly on the images of both materials focusing on the area of the CGHAZ and FGHAZ. The cooling temperatures used in the analysis were 615 °C and 420 °C for S700MC and 470 °C and 400 °C for S960QC. The images were uploaded to the image processing software (ImageJ Pro) for identification of the different grain surfaces in the image. Figure 10a–c shows the original picture, the representation of the block B (in grey), the surfaces formed by the deduction of the retained austenite (colored manually in yellow) and, finally, the infiltration ferrite + cementite (colored in red) for S700MC. The variable XT is the total area mapped; X1 is the surface area occupied by B (grey); X2 is the surface area of the RA (colored manually in yellow); and X3 is the space occupied by ferrite + cementite particles (in red). The ImageJ software (ImageJ 2013, NIH, Bethesda, MD, USA) first determined the overall surface of the sampled XT, after which a measurement process was used to discover X2 and X3. The following relationship determines the volume fraction (X1) not occupied by B:
X 1 = X T ( X 2 + X 3 )
The same measurement method was applied for S960QC steel. The transformation was identified mainly as the cooling time of B, and M had temperatures of 470 °C and 400 °C. Figure 10a presents the original SEM image. The variable XT is the total area of the sample resolution; X1 is the part occupied by B (black), measured in Figure 10b; X2 presents the ferrite particles and cementite (in red) obtained from the same figure as X2; and X3 is M, manually measured from the ImageJ Pro software (ImageJ 2013, NIH, Bethesda, MD, USA). The results of the analysis, providing the volume fraction as a function of the temperature points identified, are presented in Figure 11.
Figure 11a shows that the maximum value of the volume fraction of B was approximately 60%, which was observed at a temperature of 500 °C. Figure 11b presents two results separately: (1) the volume fraction of the ferrite, which had a maximum value of 25% at a temperature of 615 °C, corresponding to the beginning of the solidification of the weld sample; and (2) the volume fraction of RA, with a maximum value of 10% at 420 °C. Figure 11c shows the volume fraction of B, produced in S960QC, which peaked at around 55% at a temperature of 470 °C. Figure 11d has two graphs which show the respective volume fractions of RA and M. As found in previous data, the volume fraction of M increases when the temperature slows down by 45%. During the transformation, incomplete processing of austenite grain is transformed into RA, which has a reduced temperature change to M, estimated to be 10% of its maximum value (less than 400 °C).
For analysis of the micro-alloy elements, EDS was applied to the two sides of the weld. Figure 12a shows the mapping and spectra records for the alloy elements in S700MC and Figure 12b shows the same information for S960QC. The EDS was calibrated at a voltage of up to 15 kV, with mapping at 20 kV, and the resolution of the image was 1024 by 768 for 2.5 µm. To perform EDS analysis, the specimens were polished and cleaned using an ultrasonic bath of hot C3H6O and C2H6O to ensure any impurities were removed. The data were recorded in weight %, which presents the percentages of C transforms, Si, Cr, Mn, Fe, Ni, and Mo. Figure 12a,b shows the proportions of the weights of the micro-elements of the alloys obtained [36]. An absence of Ni and Mo in the microstructure of the S960QC (Figure 12a), a decrease in the weight % of Cr (0.1%), and an increase of Mn (1.8%) can be seen. These three alloy elements play a significant role in the relation between the microstructure behavior and mechanical properties of the weld joint, particularly regarding the HAZ.
The obtained weights of Mn, Ni, and Mo were 1.6, 1.3, and 0.4 for S700MC, and 1.8, 0, and 0 for S960QC, respectively. The absence of Ni in the CGHAZ of S960QC can cause softening in this area, even though there is a small increase in the weight % of Mn. As observed in the evaluation of the phase transformations, the rise in Mn promoted the appearance of M at the end of the transformation phase of S960QC. In the S700MC, the formation of the alloy elements of Mn, Ni, and Mo enabled the composition of B at 615 °C and M at 400 °C, as indicated in the previous results, showing a high-volume fraction of B (B = 60%). This high value of B, resulting from the appearance of the alloy elements, was the source of the softening in the CGHAZ, which was confirmed during the hardness analysis and showed the link between the microstructure behavior of the weld joint and the mechanical behavior of the weld.
Based on the estimation of the weight percentages of the alloy elements, it was possible to formulate a relationship to estimate the increase in the strain zones ( σ p ) in both materials, which led to the reinforcement of precipitation in the areas analyzed using the EDS results:
ρ p = 0.538 G b f B 1 2 X l n ( X 2 b )
where G is the modulus of elasticity (in MPa), b (mm) is the vector of Burgers [24], f B is the volume fraction of the particle bainite (B) of both materials, and X is the precipitation diameter of the B formation into austenite grain. After different evaluations, an increase in the yield strength, compared to the experimental values, which can be obtained by tensile test, was observed. For example, the precipitation strengthening (ρp) was 23.2 MPa for S700MC and 27 MPa for S960QC.

3.6. Tensile Test Analysis

Figure 13 shows all of the test specimens in which a fracture was visible. The tests were conducted according to EN ISO 6892-1:2010. The analysis was carried out using a ZWICK/ROZ Z 330 RED test machine. The dimensions of the samples and the results are summarized in Table 4. The samples in Figure 13a correspond to the heat input of WS1, the samples in Figure 13b correspond to the heat input of WS2, and the samples in Figure 13c correspond to the heat input of WS3. The elongation of S700MC (with an average of 7.8%) was lower than that of the BM (12%). The apparent elongation for S960QC may be the same or greater depending on the tensile strength applied to the different samples. It was difficult to evaluate the average elongation in the S960QC, because all fractures in the test samples were on the S700MC side (in the HAZ close to FGHAZ).
Performing the measurements required some preliminary analysis. After preparation of the samples, calibration of the equipment for the study was needed. As a result, the parameters used in the table were required. First, the lengths of the different samples needed to be determined (Lo). An empirical relationship linked the initial length of a sample to the So. Equation (6) presents the length Lo function of So:
L 0 = 5.65 × s q r t   ( S 0 )
With the final length (Lu), the calculations more easily determined the value of the elongation (A %) by applying the expression of Equation (7):
A % = L u L 0 L 0
By applying the tensile strength (Fe) at both ends, it was possible to determine the yield strength by calculation based on the value of the area (So) stressed in the tension. Equation (8), as shown above, presents the relationship between the yield strength (Re) and the section:
R e = F e S 0
Subsequently, the relationship shown in Equation (9) was applied to determine the breakage limit. By imposing a force (Fm), causing shear of the sample and section (S0) of the rupture zone, the following relation was established:
R m = F m S 0
The tensile test results are summarized in Table 4, which lists the average values of the ultimate tensile strength (UTS), yield strength (YS), tensile strength (TS), elongation (A5%), the rupture area, the initial length (Lo), total length (Lu), and the average of the whole results (Av.).
Based on these results, using the sample WS1 (15 kJ/cm), the average yield strength (Re) after the two tests was 699.5 MPa, the ultimate yield strength (Rm) was 769.7 MPa, and the apparent average elongation for the welded joint was 6.6%. The YS, UTS, and elongation for this welded joint were observed to be lower than for the base materials. Using the welded sample WS2 (7 kJ/cm), the average YS, UTS, and elongation were found to be 756.1, 815.5, and 9.9%, respectively. For S960QC, YS, UTS, and apparent elongation were observed to be lower than the BM. For S700MC, YS, UTS, and apparent elongation were observed to be the same as the BM. When investigating the third specimen, WS3, the average YS, UTS, and elongation were found to be 707.9, 808.7, and 6.9%, respectively. The YS, UTS, and elongation of S700MC were found to be almost the same as those of the BM, which had a YS of 768 MPa and UTS of 822 MPa. However, the average elongation was found to be ≈36% lower than that of the BM. For S960QC, the YS and UTS were found to be lower the those of the BM, which had a YS of 960 MPa and UTS of 1000 MPa. All the tensile failures were in the HAZ on the S700MC side. The tensile tests of the samples confirmed the softening in the HAZ of S700MC observed in the macro-hardness tests. One reason for the softening was the choice of filler wire and heat input values, which had an impact on the chemical and mechanical characteristics of the weld joints. The hardness, YS, and UTS increased as the temperature dropped with the increasing cooling rate [37]. This phenomenon was due to the parameters, such as the alloy element compositions of both materials and the filler wire. Furthermore, the microstructure formations during the transformations also impacted the characteristics of the weld joint. The observations are supported by Yan et al. [25], who defined the micro-alloying elements (Ni, Cr, and Mo) as the key components that affect the mechanical and microstructure formation in the HAZ. Ali et al. [38] noted that the YS and UTS of low-carbon bainitic steel increase due to the refinement of prior austenite grain size. In addition, low hardness and strength in the S700MC steel result from the appearance of possible bainite with pro-eutectoid carbides at the boundary. The choice of heat input and filler wire (by increasing the amount of alloys, such as Ni, Cr, and Mo) are the key solutions to improving the hardness and strength of the HAZ of the weld samples.

4. Conclusions

The effect of different heat input values (15, 7, and 10 kJ/cm) on weld joints of S700MC/S960QC steel were investigated using weld specimens of 300 × 200 × 8 mm3 of the base material. Filler wire with a diameter of 1.0 mm and a composition NiCrMo700 was used in the experiment. Microstructure, hardness, and tensile test analyses were carried out to analyze the effect of heat input and undermatched filler wire on the strength of the weld joint. The following conclusions can be drawn:
  • Experimental analysis of the heat effects in welding dissimilar S700MC/S960QC using an undermatched filler wire enabled measurement of the hardness behavior of the weld joint and evaluation of the formation of B, F, M, and RA in the HAZ region of both BMs. The same reference samples were used to evaluate the volume fraction of microstructure formations at the end of the transformation and to evaluate the mechanical behavior in the HAZ.
  • Heat input of 7 kJ/cm resulted in a faster cooling rate (33 °C/s), which slightly decreased the average hardness in the HAZ of both materials. In the FGHAZ of S700MC, it was observed that there was a decrease in hardness of 11% to 245 HV5 versus 270 HV5 for the BM. In the S960QC steel, the lowest hardness was found in the FGHAZ, which decreased by 22% to 268 HV5 versus 320 HV5 for the BM. In the FGHAZ, using the whole sample, the hardness of both steels underwent a decrease of 15% for S700MC and 20% for S960QC.
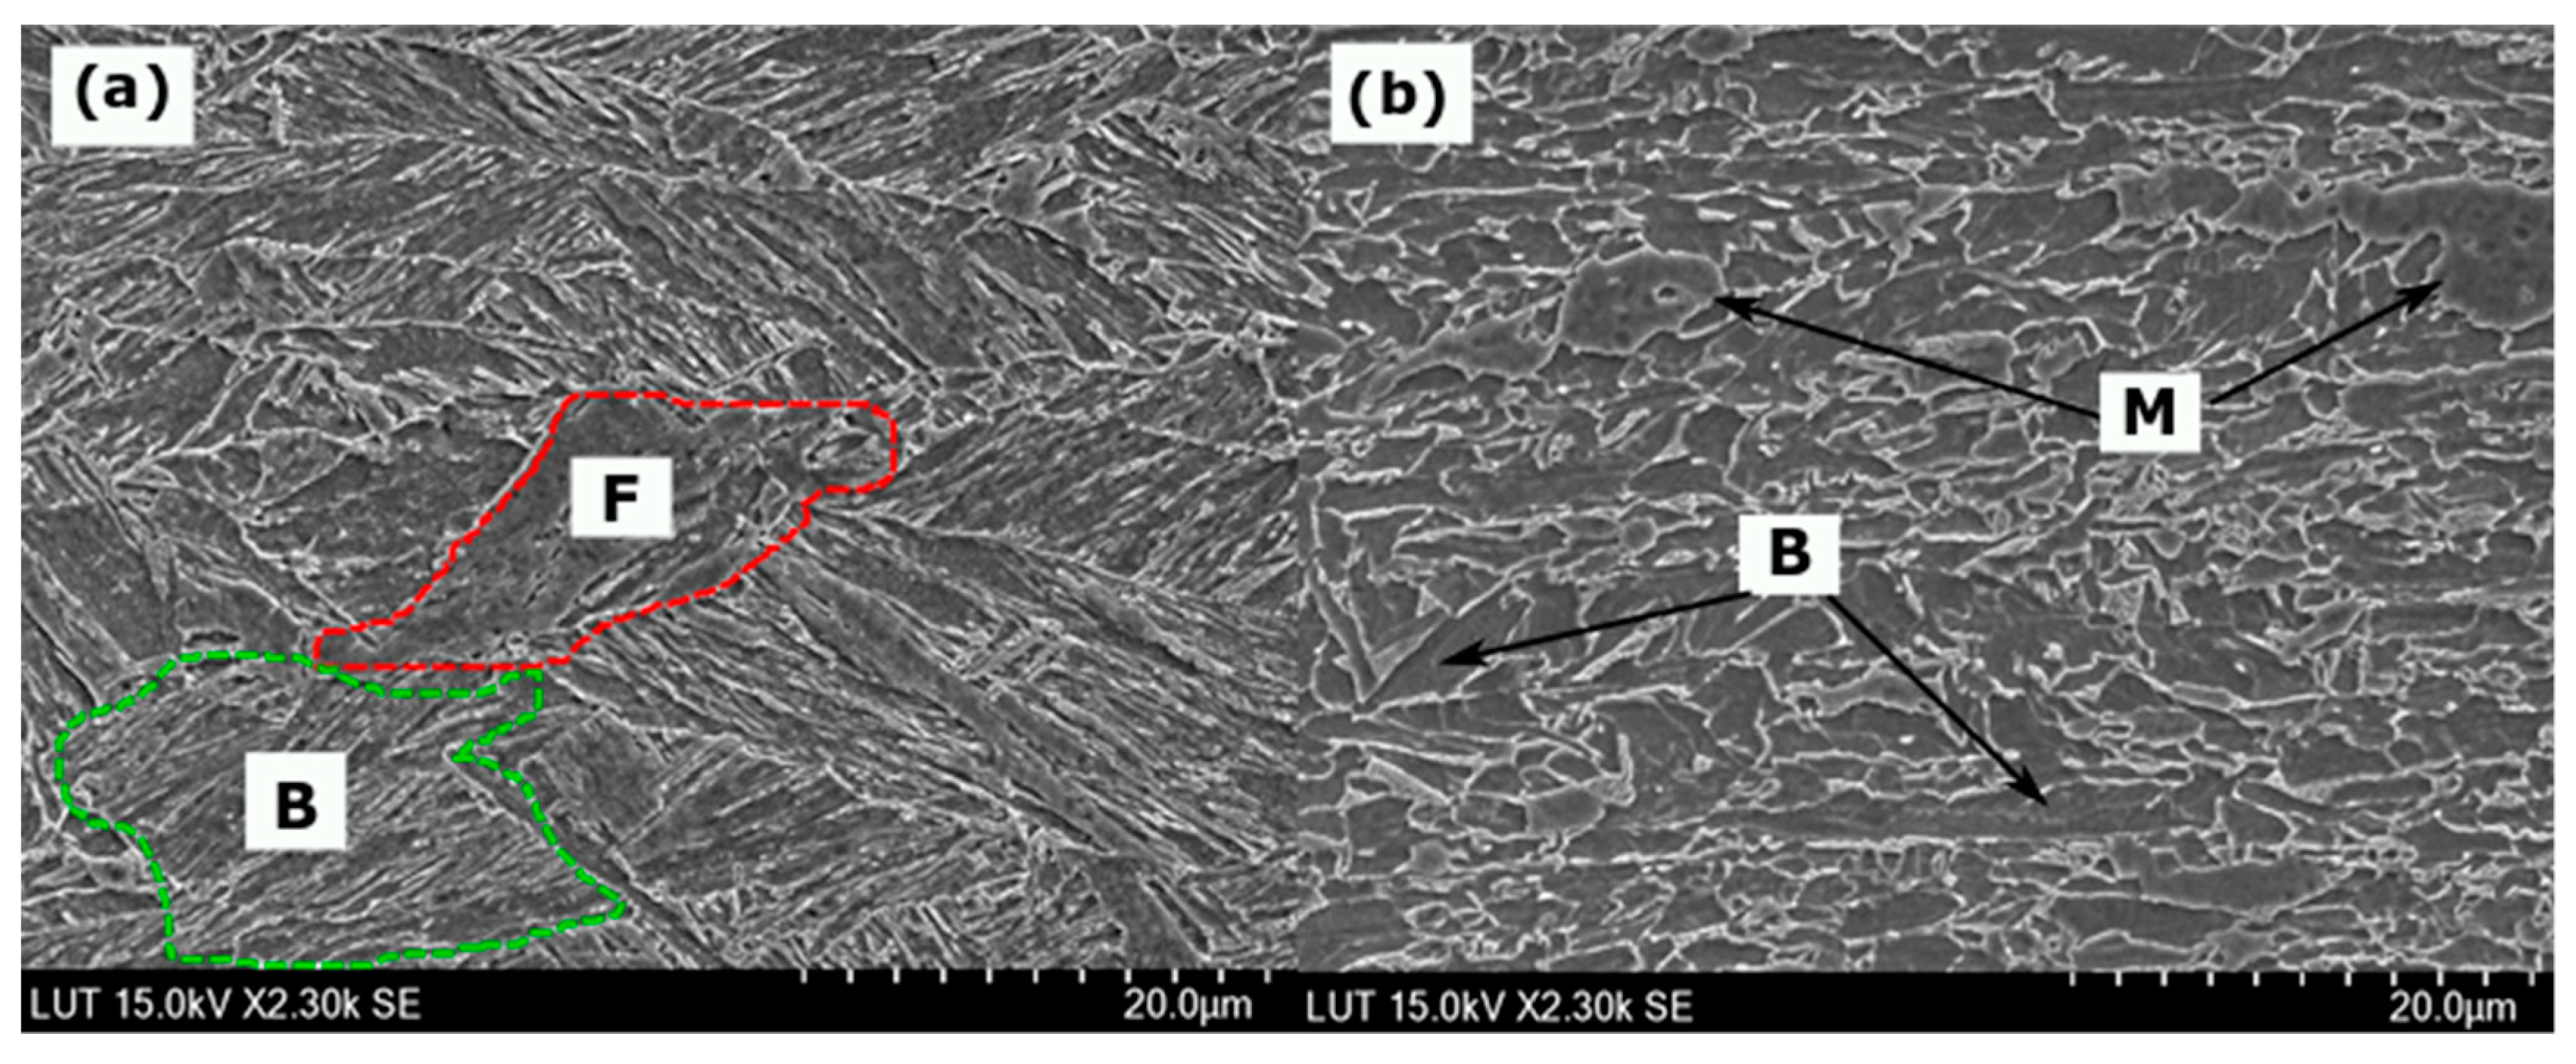
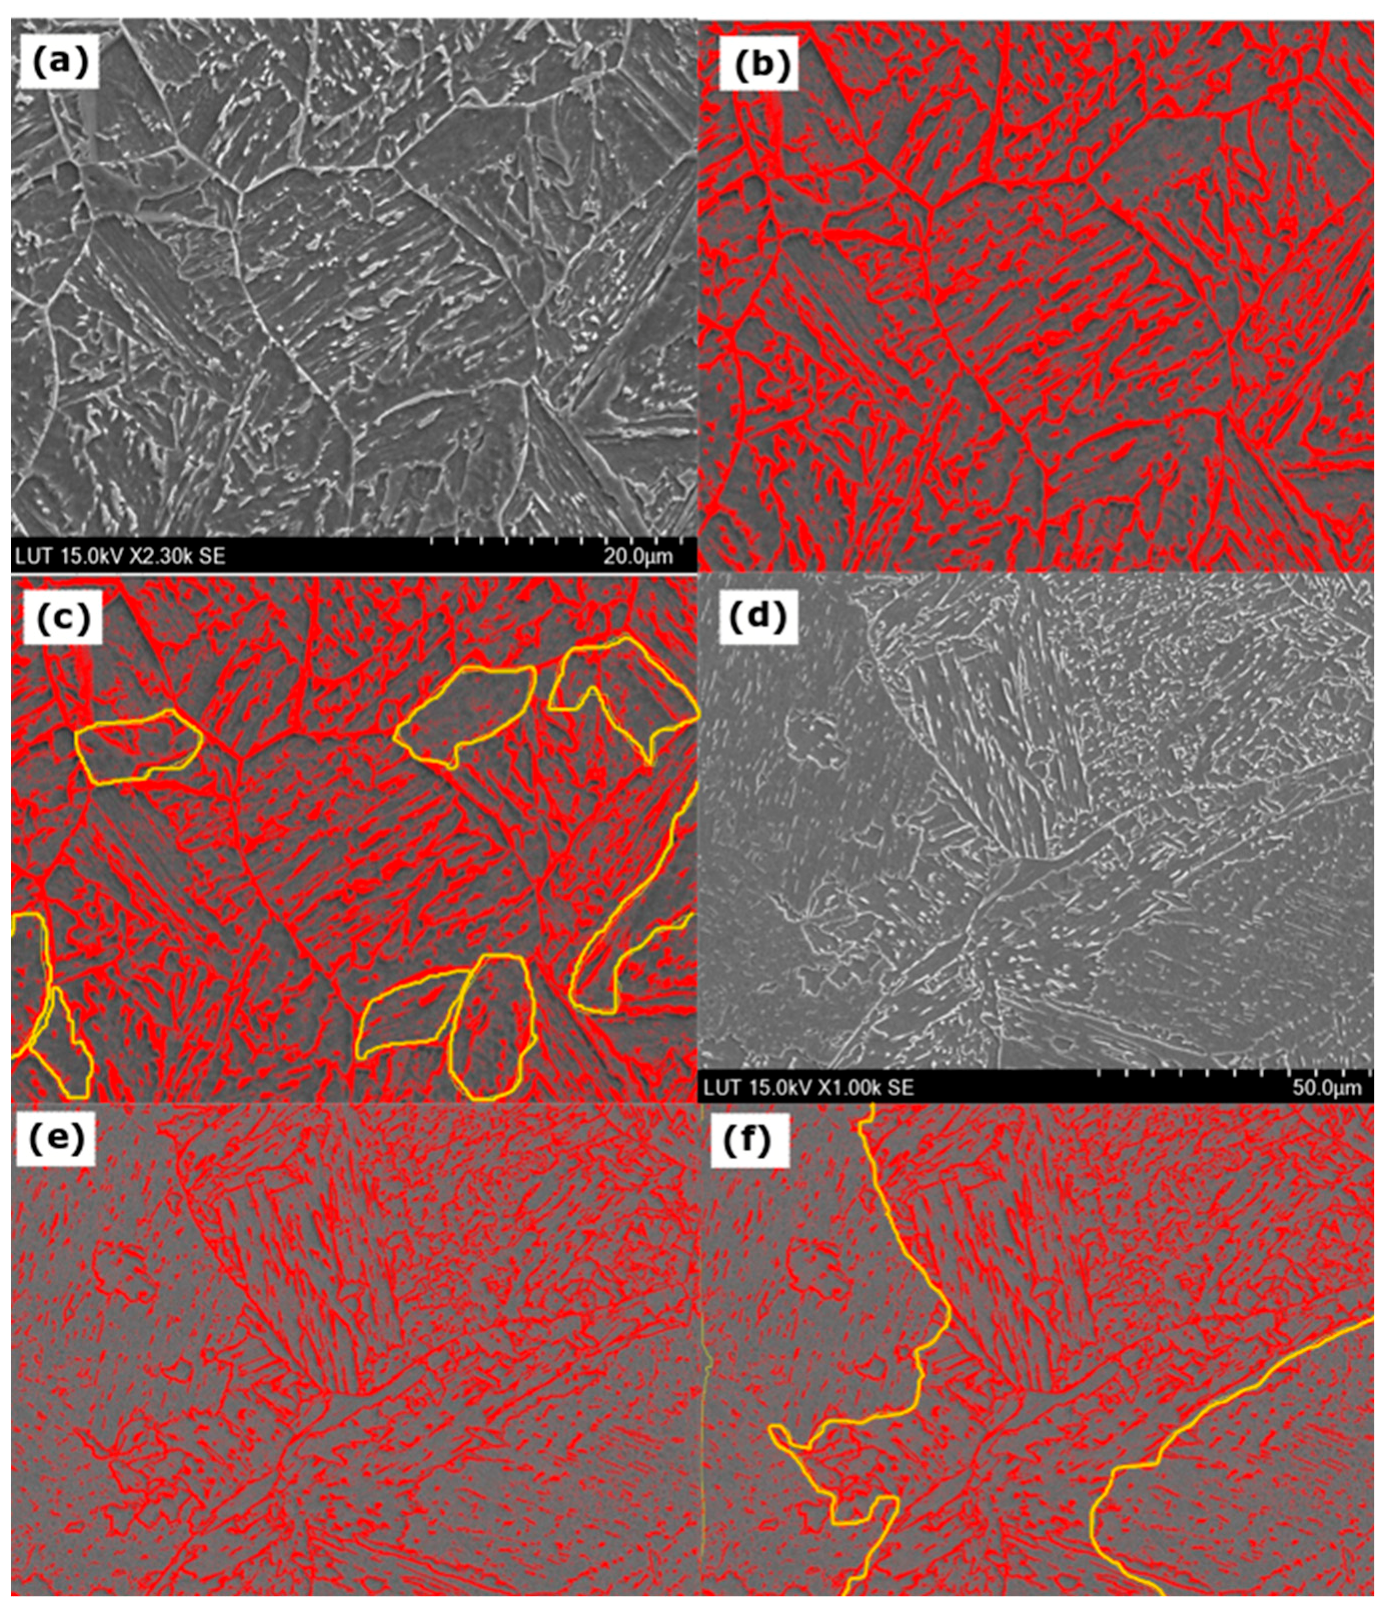
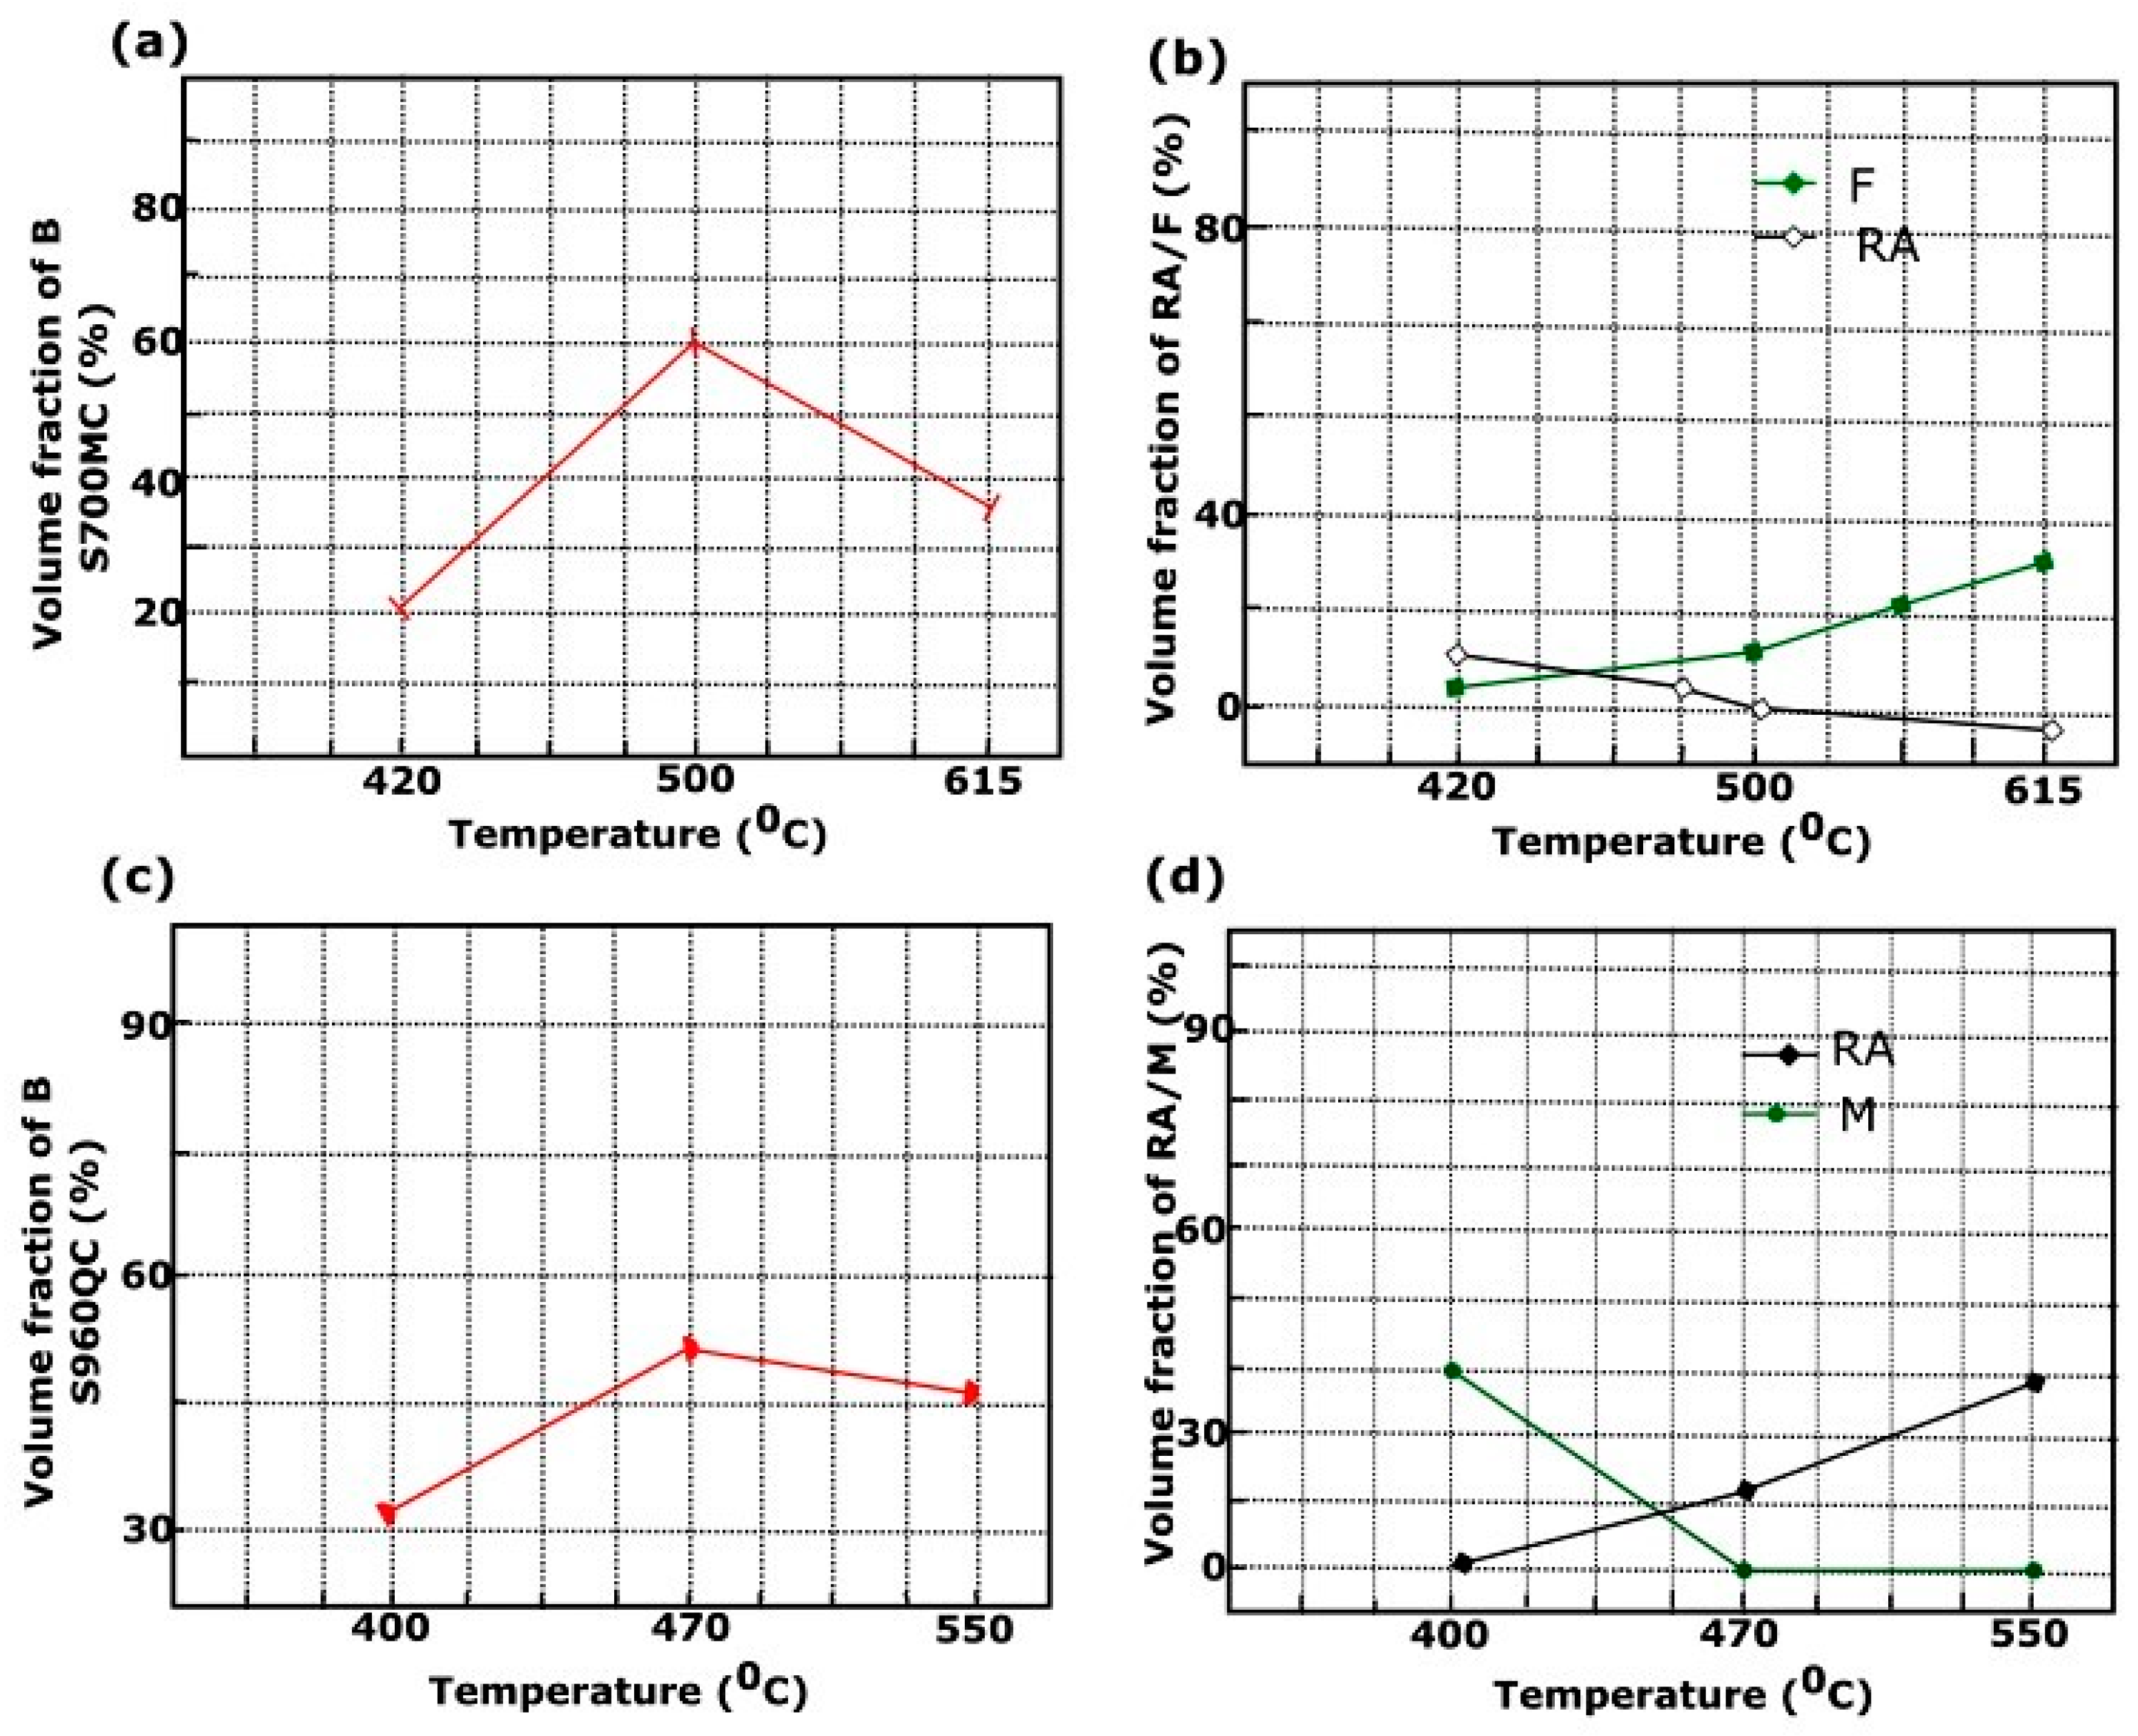
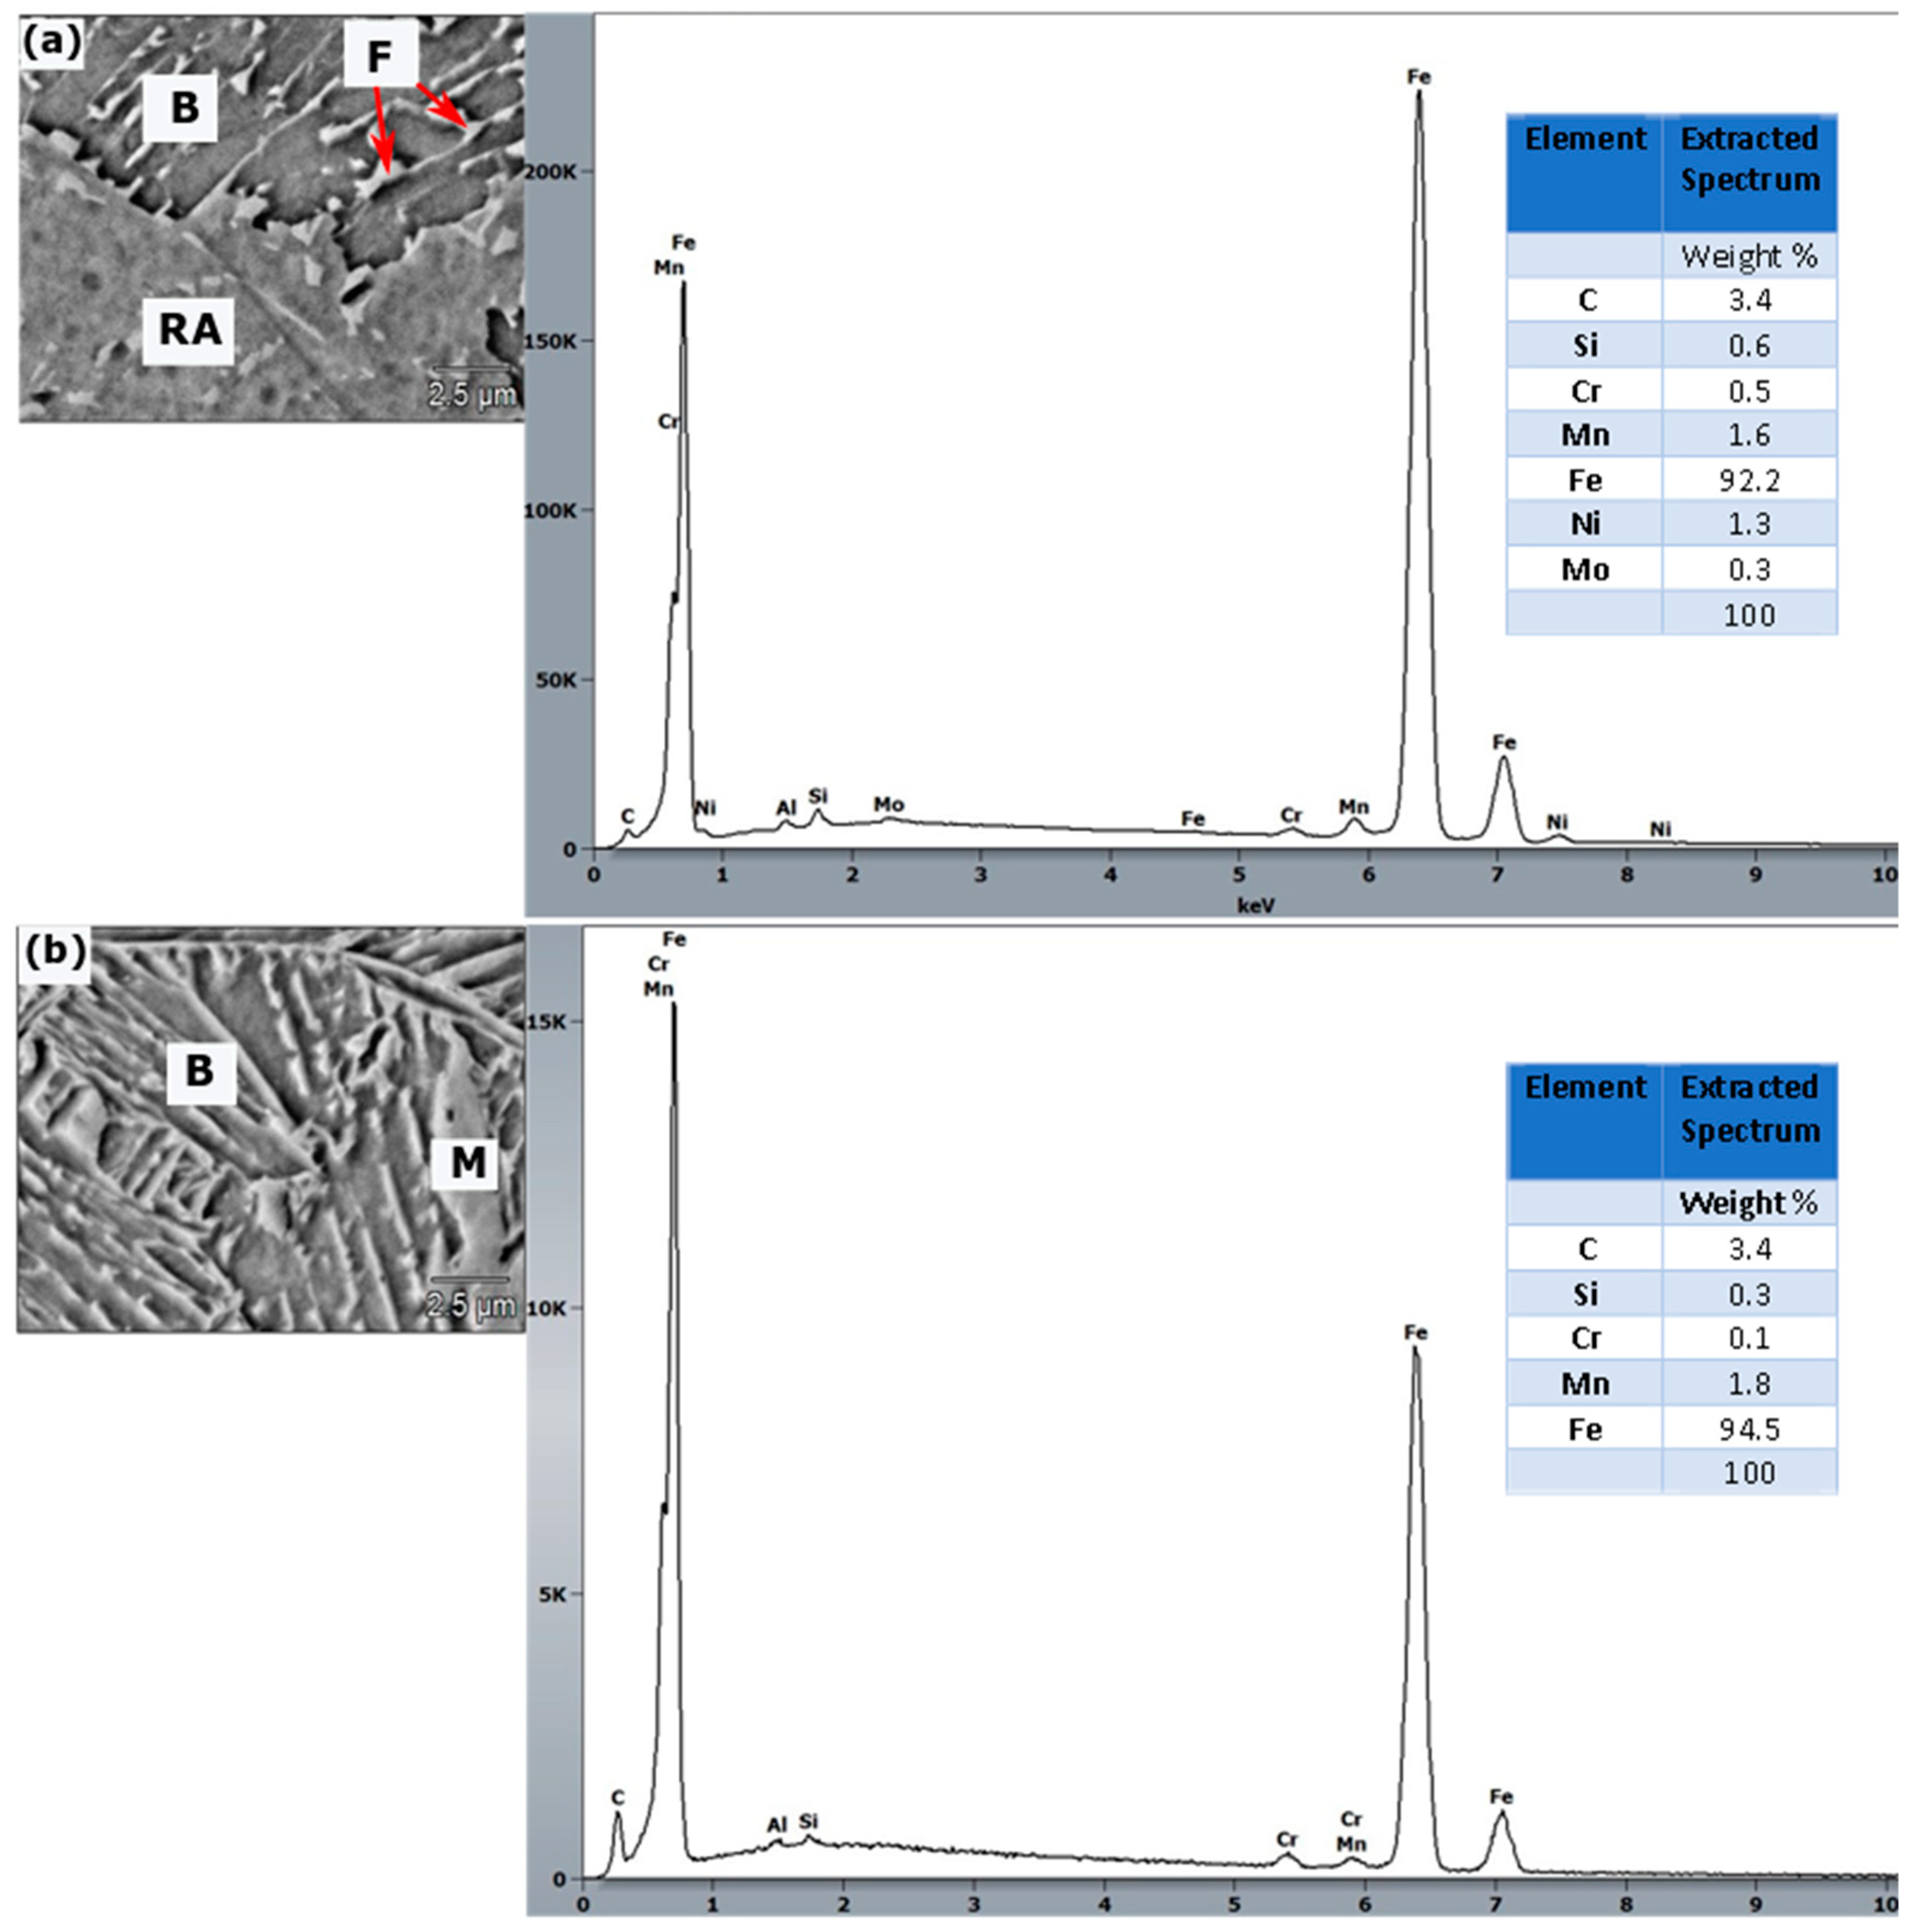
  • When considering the microstructures obtained with a cooling rate of 21 °C/s, the B–F constituent formed at the interface of S700MC austenite grains and some lath B morphology was observed. For S960QC, the formation of B, M, and RA was observed during the transformation. In the microstructure with a carbon content of 0.09% (S960QC), the highest volume fractions of RA (18%), bainite (55%), and M (27%) were observed.
  • In the microstructure of S700MC with a carbon content of 0.056%, the highest volume fractions of B (60%), F (approximately 35%), and RA (5%) resulted in the composition of 1.3 Ni, 0.4 Mo, 1.6 Mn in the CGHAZ. Application of a heat input of 10 kJ/cm resulted in the best combination of alloy elements, which led to a slight increase in the hardness to 260 HV5 and a slight increase in the strength of the welded joint.
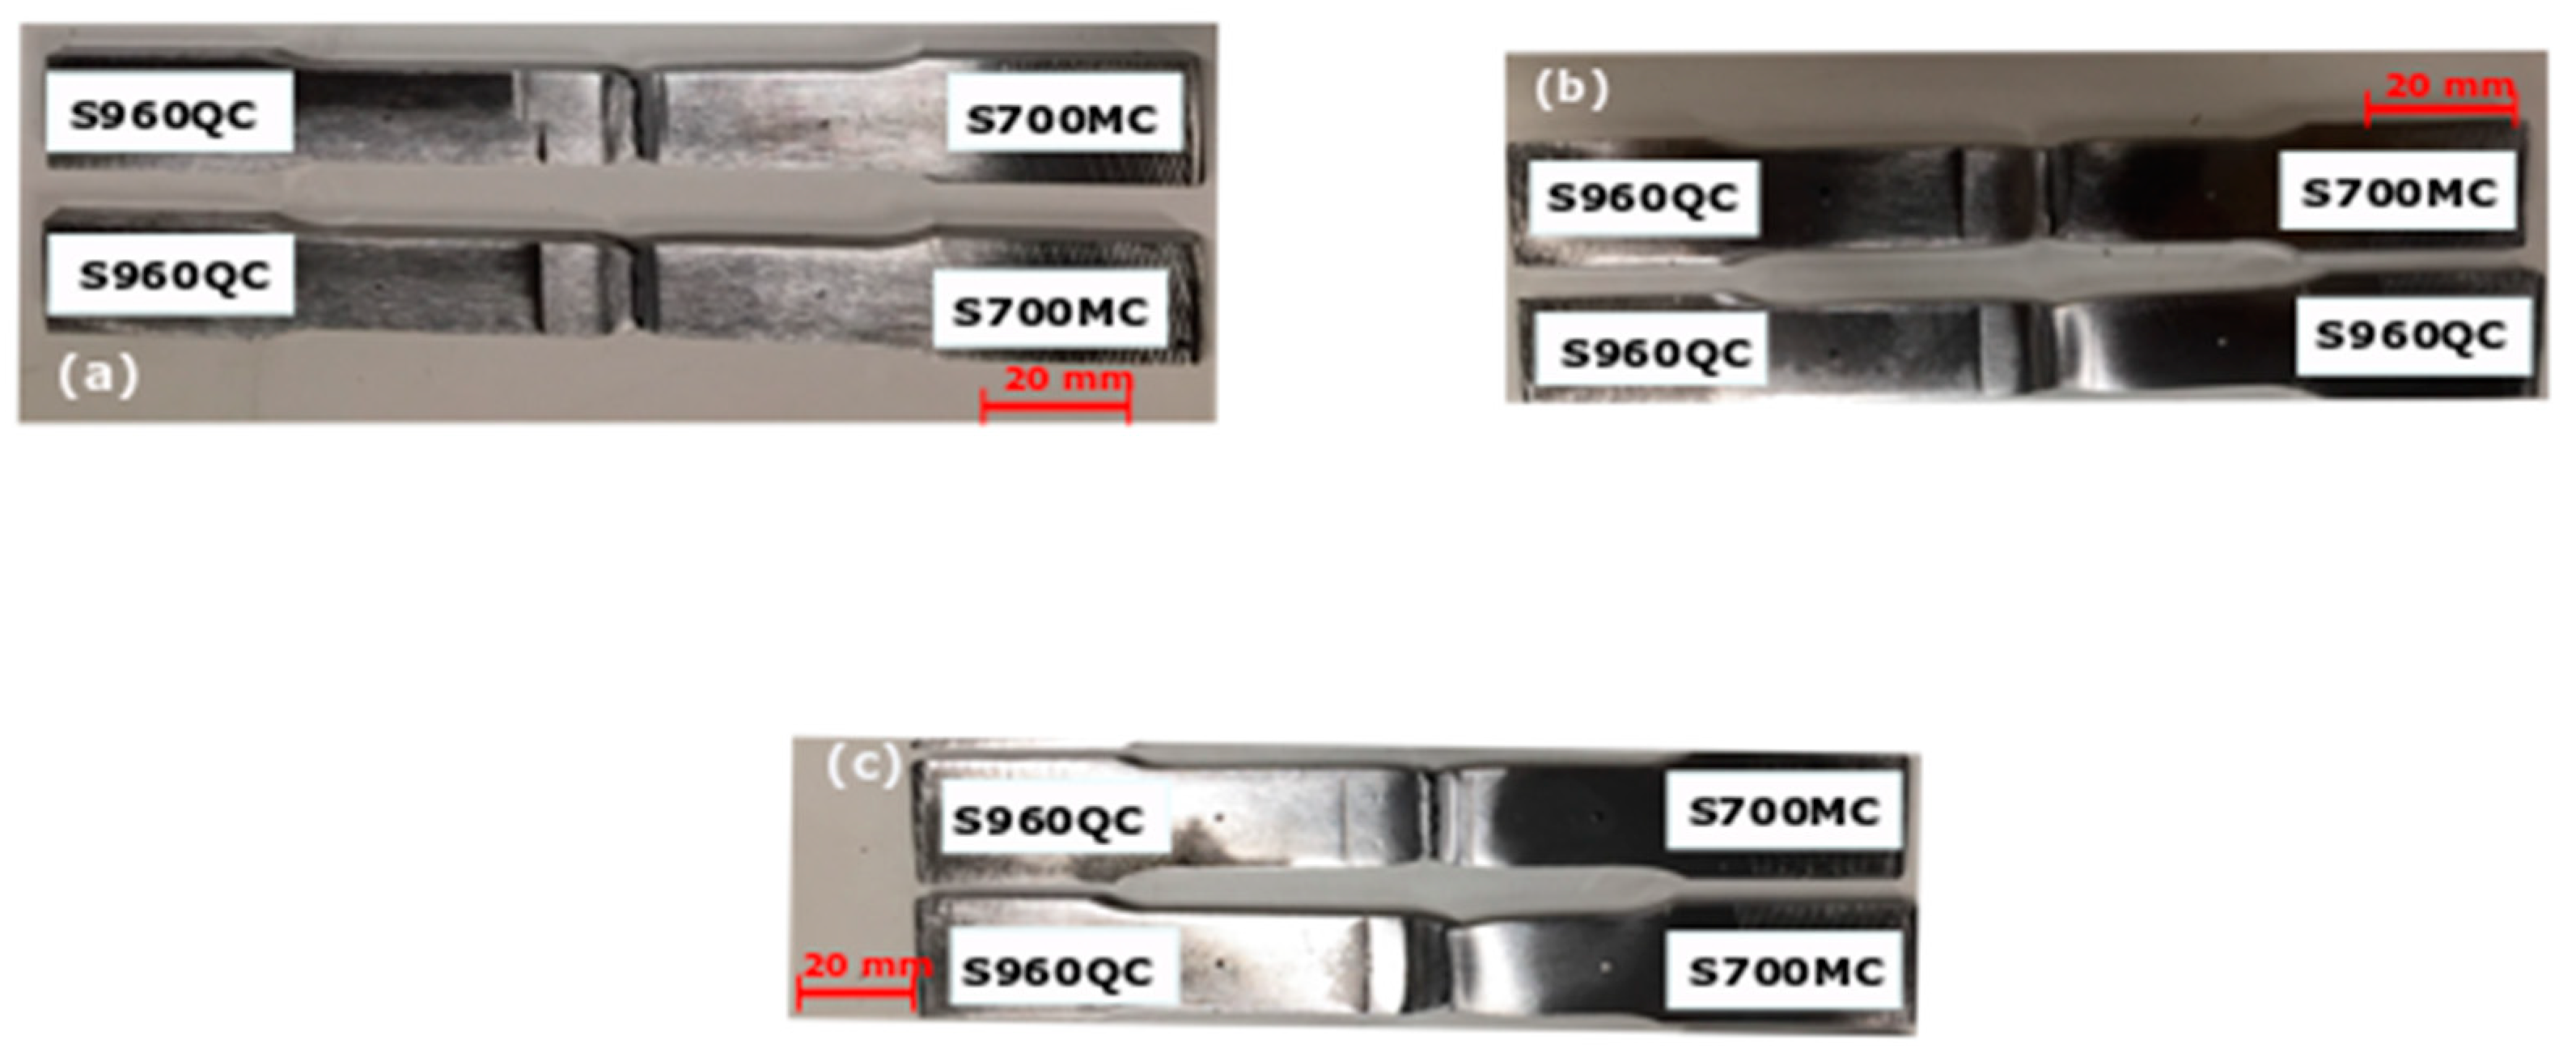
  • The tensile strength of GMA welded dissimilar S700MC and S960QC steel specimens had different values compared to the strength of the BM, and all the welded specimens failed in the HAZ of the S700MC side. The elongation of the specimens differed from that of the BM for all the studied cooling rates. The average elongation indicated a 17% decrease when compared to the BM.
  • The best combination of hardness and strength was achieved by choosing a cooling rate of 21 °C/s, which achieved an equilibrium of B, F, and M in the dissimilar S700MC/S960QC weld, reducing the formation of proeutectoid grain boundary carbide.
  • To improve the hardening ability and strength of the dissimilar S700MC/S960QC welded samples using GMA welding, an increase in the number of alloy elements in the filler wire, such as Ni, Cr, and Mo, is required.

Author Contributions

F.N.B. performed the experiment analysis, wrote the entire manuscript, and corrected the manuscript following discussion with the other authors. P.K. reviewed the draft for publication. B.M. created the design of the experiments and provided suggestions. P.L. provided critical feedback and additional input.

Funding

The research was funded by Energy-Efficient Systems Based on Renewable Energy of Arctic Conditions “EFREA” (Grant number K51054) and the Finnish Cultural Foundation (Grant number 190749).

Acknowledgments

The authors would like to thank Esa Hiltunen, Anti Heikkinen, Toni Väkiparta, and Antti Kähkönen for their support in the arrangement of the experimental work.

Conflicts of Interest

The authors declare no conflicts of interest.

References

  1. Mvola, B.; Kah, P.; Martikainen, J.; Suoranta, R. Dissimilar high-strength steels: Fusion welded joints, mismatches, and challenges. Rev. Adv. Mater. Sci. 2016, 44, 146–159. [Google Scholar]
  2. Monika, K.; Bala, M.; Nanda, K.; Prahalada, R. The Effect of Heat input on the Mechanical Properties of MIG welded Dissimilar Joint. Inter. J. Eng. Res. Tech. 2013, 2, 1406–1413. [Google Scholar]
  3. Sarizam, M.; Yu-Ichi, K. Effect of cooling rate invariant selection during bainite transformation in heat affected zone of Cr-Mo steel. J. Eng. Appl. Sci. 2015, 10, 9481–9486. [Google Scholar]
  4. Laitinen, R. Improvement of Weld HAZ touGhness at Low Heat Input by Controlling the Distribution of M-A Constituents. Ph.D. Dissertation, Acta Universitatis Ouluensis, Oulu, Finland, 2006. [Google Scholar]
  5. Tadashi, F.; Shin-ya, A.; Goro, M. Anisotropic Ferrite Growth and Substructure Formation du Bainite Transformation in Fe-9Ni-C alloys: In-Situ Measurement. Mat. Trans. 2018, 59, 214–223. [Google Scholar]
  6. Njock Bayock, F.; Kah, P.; Mvola, B.; Pavel, L. Experimental review of the thermal analysis of dissimilar high-strength steel. Rev. Adv. Mater. Sci. 2019, 58, 38–49. [Google Scholar] [CrossRef]
  7. Wei, G.; Lin, L.; Shiyun, D.; Dave, C.; Alan, T. Comparison of microstructure and mechanical properties of ultra-narrow gap laser and gas-metal-arc welded S960 high strength steel. Opt. Lasers Eng. 2017, 91, 1–15. [Google Scholar]
  8. Gaspar, M.; Balogh, A. GMAW experiments for advanced (Q+T) high strength steels. Prod. Pro. Syst. 2013, 6, 9–24. [Google Scholar]
  9. Karkhin, V.; Michailov, V.; Petrov, P. Principles of Welding; St.Petersburg Polytechnic University Publishing: St. Petersburg, Russia, 2016. [Google Scholar]
  10. Porter, D.; Laukkanen, A.; Nevasmaa, P.; Rahka, K.; Wallin, K. Performance of TMCP steel for mechanical properties after cold forming and post-forming heat treatment. Int. J. Press. Vessel Pip. 2004, 81, 867–877. [Google Scholar] [CrossRef]
  11. Siltanen, J.; Tihinen, S. Position welding of 960 MPa ultra-high-strength steel. J. Laser Appl. 2012. [Google Scholar] [CrossRef]
  12. Ndiwe, B.; Mvola, B.; Kah, P.; Njock Bayock, F. Effect of consumable filler wire composition to mismatches of high-Mn steels welded joints. In Proceedings of the International Ocean and Polar Engineering Conference, San Francisco, CA, USA, 25–30 June 2017. [Google Scholar]
  13. Schneide, R.C.; Ernst, W.; Schnitzer, R.; Staufer, H.; Vallant, R.; Enzinger, N. Welding of S960MC with undermatching filler material. Weld. World 2018, 62, 801–809. [Google Scholar] [CrossRef] [Green Version]
  14. Gorka, J. Assessment of Steel Subjected to the Thermomechanical Control Process with Respect to Weldability. Metals 2018, 8, 169. [Google Scholar] [CrossRef]
  15. Gorka, J. Analysis of simulated welding thermal cycles S700MC using thermal imaging camera. Adv. Mater. Res. 2014, 837, 375–380. [Google Scholar] [CrossRef]
  16. Gorka, J. Microstructure and properties of the high-temperature (HAZ) of thermo-mechanically treated S700MC high-yield-strength steel. Mat. Tehnol. 2016, 50, 617–621. [Google Scholar] [CrossRef]
  17. Guo, W.; Crowther, D.; Francis, J.A.; Thompson, A.; Liu, Z.; Li, L. Microstructure and mechanical properties of laser welded S960 high strength steel. Mat. Des. 2015, 85, 534–548. [Google Scholar] [CrossRef]
  18. Njock Bayock, F.; Kah, P.; Layus, P.; Karkhin, V. Numerical and experimental investigation of the heat input effect on the mechanical properties and microstructure of dissimilar weld joints of 690-MPa QT and TMCP steel. Metals 2019, 9, 355. [Google Scholar] [CrossRef]
  19. Talas, S. The assessment of carbon equivalent formulas in predicting the properties of steel weld metals. Mater. Des. 2010, 31, 2649–2653. [Google Scholar] [CrossRef]
  20. Changfei, W.; Zhaodong, W.; Xiangtao, D.; Guodong, W.; Raja, D. Effect of heat input on the microstructure and mechanical properties of low alloy ultra-high strength structural steel welded joint. Steel Res. Int. 2018, 89, 1–9. [Google Scholar]
  21. Gyasi, E.; Kah, P. Structure integrity analysis of the usability of high strength steel (HSS). Rev. Adv. Mater. Sci. 2016, 2, 39–52. [Google Scholar]
  22. Sadeghan, M.; Shamanian, M.; Shafyei, A. Effect of heat input on microstructure and mechanical properties of dissimilar joints between super duplex stainless steel and high strength steel. Mat. Des. 2014, 60, 678–684. [Google Scholar] [CrossRef]
  23. Zhuangfei, W.; Minghao, S.; Shuai, T.; Guodong, W. Effect of heat input and M-A constituent on microstructure evolution and mechanical properties of heat affected zone in low carbon steel. J. Wuhan Univ. Tech. Mat. Sci. Educ. 2017, 32, 1163–1170. [Google Scholar]
  24. Radaj, D. Heat Effects of Welding; Springer: Berlin, Germany, 1992. [Google Scholar]
  25. Tasalloti, H.; Kah, P.; Martikainen, J. Effect of heat input on dissimilar welds of ultra-high-strength steel and duplex stainless steel: Microstructural and compositional analysis. Mat. Charact. 2017, 123, 29–41. [Google Scholar] [CrossRef]
  26. Yan, S.; Liu, X.; Liang, T.; Chen, J.; Zhao, Y. Effect of micro-alloying elements on microstructure and mechanical properties in C-Mn-Si Quenching and Partitioning (Q&P) steels. Steel Res. Int. 2019, 90, 1–10. [Google Scholar]
  27. ISO. Standard Test Methods for Micro Indentation Hardness of Materials; ISO 6507-1:2018; ISO: Geneva, Switzerland, 2018. [Google Scholar]
  28. ISO. International Standard Test Methods for Tensile Testing of Metallic Materials; ISO 6892-1: 2016; ISO: Geneva, Switzerland, 2016. [Google Scholar]
  29. ISO. Non-Destructive Testing of Weld-Visual Testing of Fusion-Welded Joint; ISO 17637–2017; ISO: Geneva, Switzerland, 2017. [Google Scholar]
  30. Poorhaydari, K.; Patchett, B.; Ivey, D. Estimation of cooling rate in the welding of plates with intermediate thickness. Wel. J. 2005, 84, 149–155. [Google Scholar]
  31. Xiuzhi, Y.; Lichao, Z.; Yusheng, S.; Shengfu, Y.; Chunfa, D. Effective microstructure unit in control of impact toughness in CGHAZ for high strength bridge steel. J. Wuhan Univ. Tech. Mat. Sci. Educ. 2018, 33, 177–184. [Google Scholar]
  32. Hamada, M. Control of strength and toughness at the heat affected zone. Weld. Inter. 2003, 17, 265–270. [Google Scholar] [CrossRef]
  33. Guo, W.; Li, L. Laser welding of high strength steels (S960 and S700) with medium thickness. J. Laser Appl. 2016, 28, 1–10. [Google Scholar] [CrossRef]
  34. Hochhauser, F.; Ernest, W.; Rauch, R.; Vallant, R.; Enzinger, N. Influence of the soft zone on the strength of welded modern HSLA steels. Weld. World 2006, 56, 77–85. [Google Scholar] [CrossRef]
  35. In, K.; Hyunbin, N.; Myungjin, L.; Daegeun, N.; Yeong-do, P.; Namhyun, K. Effect of Martensite-Austenite constituent on low-temperature toughness in YS 500 MPa Grade Steel Welds. Metals 2018, 8, 1–11. [Google Scholar]
  36. ASTM. Standard Practice for Radiographic Examination of Weldments Using X-Ray Film; ASTM E1032–19; ASTM: West Conshohocken, PA, USA, 2019. [Google Scholar]
  37. Tian, J.; Xu, G.; Zhou, M.; Hu, H. Refined bainite microstructure and mechanical properties of high-strength low-carbon bainitic steel treated by austempering below and above Ms. Steel Res. Int. 2018, 89, 1–10. [Google Scholar] [CrossRef]
  38. Ali, M.; Porter, D.; Kömi, J.; Eissa, M.; El Faramawy, H.; Mattar, T. Effect of cooling rate and composition on microstructure and mechanical properties of ultrahigh-strength steels. J. Iron Steel Res. Int. 2019. [Google Scholar] [CrossRef]
Figure 1. Automatic robot gas metal arc (GMA) welding process using a recorded laser thermal profile, ABB IRC 5 robot control unit.
Metals 09 00883 g001
Figure 2. Weld geometry: (a) weld joint geometry, (b) welded appearance of one specimen.
Metals 09 00883 g002
Figure 3. Thermal profile of the three weld samples.
Metals 09 00883 g003
Figure 4. The cooling continuous temperature (CCT) diagram of S700MC (obtained using JMatPro software), including the cooling time curve values of the three heat input parameters.
Metals 09 00883 g004
Figure 5. CCT diagram of S960QC steel (obtained using JMatPro software), including the cooling time curve values of the three heat input parameters.
Metals 09 00883 g005
Figure 6. Hardness profile across the weld samples (WS): (a) hardness profile of WS1, (b) hardness profile of WS2, (c) hardness profile of WS3.
Metals 09 00883 g006
Figure 7. SEM micrographs of the base materials: (a) S700MC and (b) S960QC high-strength steels.
Metals 09 00883 g007
Figure 8. Optical microscopy (OM) and SEM micrographs showing the microstructures of S700MC steel in different sub-zones of the welded joint: (a) description of different sub-zones of the welded joint, (b) OM image of the coarse-grain heat-affected zone (CGHAZ) of S700MC, (cd) SEM image of CGHAZ, and (ef) SEM image of fine-grain heat-affected zone (FGHAZ).
Metals 09 00883 g008
Figure 9. OM and SEM micrographs showing the microstructures of S960QC steel in the different sub-zones of the welded joint: (a) OM image showing the different sub-zones of the welded joint, (b) OM image of the CGHAZ of S960QC, (cd) SEM image of CGHAZ using a resolution of 20 µm, (ef) SEM image of the FGHAZ of S700MC, and (gh) SEM image of the weld metal.
Metals 09 00883 g009
Figure 10. Evaluation of the volume fraction of bainite (B), martensite (M), retained austenite (RA), and ferrite using ImageJ Pro software: (a) original SEM image of S700MC, (b) darker area to measure B, red area to measure the volume fraction of ferrite, and cementite, (c) geometries of RA areas to measure the volume fraction of RA, shown in yellow, (d) original SEM image of S960QC, (e) darker area to measure the B volume fraction and red zone to measure the volume fraction of ferrite, and (f) geometries of the M areas to measure M, shown in yellow.
Metals 09 00883 g010
Figure 11. Volume fraction of B, F, and M for both materials: (a) volume fraction of B of S700MC, (b) volume fraction of RA and F of S700MC, (c) volume fraction of B of S960QC, and (d) volume fraction of M of S960QC.
Metals 09 00883 g011
Figure 12. EDS analysis and elemental composition mapping: (a) S700MC and (b) S960QC.
Metals 09 00883 g012
Figure 13. Tensile test results showing the fracture locations in different samples: (a) tensile test of WS1, (b) tensile test of WS2, and (c) tensile test of WS3.
Metals 09 00883 g013
Table 1. Welding conditions.
Welded SamplesPass 1Pass 2
Current (A)Voltage (V)Welding Speed (cm/min)Heat Input Q (kJ/cm)Current (A)Voltage (V)Welding Speed (cm/min)Q (kJ/cm)
WS121525.337.3721126.71815
WS221525.337.3720326.637.57
WS321525.337.3720826.72410
Table 2. Chemical composition and mechanical properties of S700MC and S960QC steels and filler material NiCrMo700. Chemical composition, wt %.
Chemical Composition, wt %
MaterialsСSiMnAlBNbTiVСuCrNiMoNPSCE
S700MC0.0560.161.180.0270.0020.0440.120.0060.020.0620.0660.01500.0050.010.0050.38
S960QC0.090.211.050.030.0020.0030.0320.0080.0250.820.040.04-0.010.0040.49
Filler wire0.080.601.40---0.05-≤0.300.302.500.45---0.45
Mechanical Properties
MaterialsYield Strength, MPaUltimate Tensile Strength, MPaElongation A5, %Hardness HV5
S700MC76882212280
S960QC960100018320
Filler wire78083017270
Table 3. Calculated cooling rates for the three heat inputs.
Weld Heat InputCooling Time (t8/5)Cooling Rate (R500)
WS1 (15 kJ/cm)47 s10 °C/s
WS2 (7 kJ/cm)13 s33 °C/s
WS3 (10 kJ/cm)31 s21 °C/s
Table 4. Results for six samples of the three specimens (WS1, WS2, and WS3).
SampleDimensions (mm)So
(mm2)
Fe
(kN)
YS (MPa)TS Fm (kN)UTS (MPa)Lo (mm)Lu (mm)A5%Place of Rupture
1A24.9 × 8199.2138692.8153.2769.17983.86.1HAZ S700MC
1B24.6 × 8196.8139706.3151.6770.379.284.97.2HAZ S700MC
Av.---699.5-769.7--6.6-
2A24.7 × 8197.6150759.1161.6817.879.487.410HAZ S700MC
2B24.9 × 8199.2150753.0162813.379.687.49.8HAZ S700MC
Av.---756.1-815.5--9.9-
3A24.8 × 8198.4142715.7157.6794.479.685.37.2HAZ S700MC
3B25 × 8200140700166.382379.7856.6HAZ S700MC
Av.---707.9-808.7--6.9-

