Abstract
Bimodal microstructures where globular α and acicular α phases are embedded in the β matrix are commonly used in industry-relevant Ti-55531. To optimize the performance of Ti-55531 through heat treatment, it is crucial to understand and control the phase transformation in the as-received bimodal Ti-55531 as well as its microstructure evolution. In this work, the isochronal phase transformations and microstructure evolution in the bimodal Ti-55531 during the continuous heating were systematically studied by combining dilatometry, XRD phase analyses, and SEM observation. The β → α transformation occurred at 678 K only with the acicular α. When the temperature was higher than 788 K, α → β transformation took place in two separate stages (i.e., αacicular → β and αglobular → β transformation). The dissolution of αglobular occurred after the dissolution of αacicular was completed. Due to the difference in the chemical composition and interface curvature between αacicular and αglobular, the average activation energy for αacicular → β transformation was lower than that for the αglobular → β transformation. The isochronal phase transformation and microstructure evolution during continuous heating in the present work could be used to optimize heat treatment procedures for desired mechanical properties.
1. Introduction
Ti-55531, one of the near-β titanium alloys, shows properties of high strength, good toughness, and remarkable hardenability, and has thus been commercially used in aircraft components [1,2,3,4,5,6,7,8,9,10]. It is well known that the properties of near-β titanium alloys are closely related to the microstructure features of the α phase, including size, shape, chemical composition distribution, and so on. The shape of α phase in commonly used Ti-55531 is globular, lamellar, and/or acicular. Alloys containing globular α phase have superior ductility [11,12] due to the relatively soft nature and high damage tolerance of globular α [13]. Alloy with a high volume fraction of fine acicular α show high strength because of the precipitation-strengthening effect [11,12]. The combination of globular α and acicular α together with the β matrix give rise to a balance between ductility and strength [13]. The bimodal microstructure has been widely used in the industry.
The formation of bimodal microstructures and balanced mechanical properties are controlled by the β ↔ α phase transformation intrinsically in physics, while being achieved via mechanical deformation and heat treatment in processing. Ti-55531 has a large processing window in the (α + β) phase region [14,15]. The globular α is obtained via a complete hot-forging in the α + β phase region. The acicular α is introduced via air cooling after hot-forging. Finally, heat treatments need to be performed on the bimodal alloy. This is done to tailor the microstructure for comprehensive mechanical performance. The transformation behaviors of the preset phases in the bimodal state (including β, globular α, and acicular α) must be different from those in other states, which have effects on microstructure tuning during the heat treatment. Therefore, it is crucial to understand and control the phase transformation and microstructure evolution in bimodal Ti-55531, in order to explore a well-designed heat treatment procedure. In the present work, the isochronal phase transformation and microstructure evolution in bimodal Ti-55531 are systematically studied by combining dilatometry, XRD-based phase analyses, and microstructure observation in the condition of a constant heating rate. The dissolution behaviors of globular α and acicular α are discussed via experiments and thermodynamic principles.
2. Materials and Methods
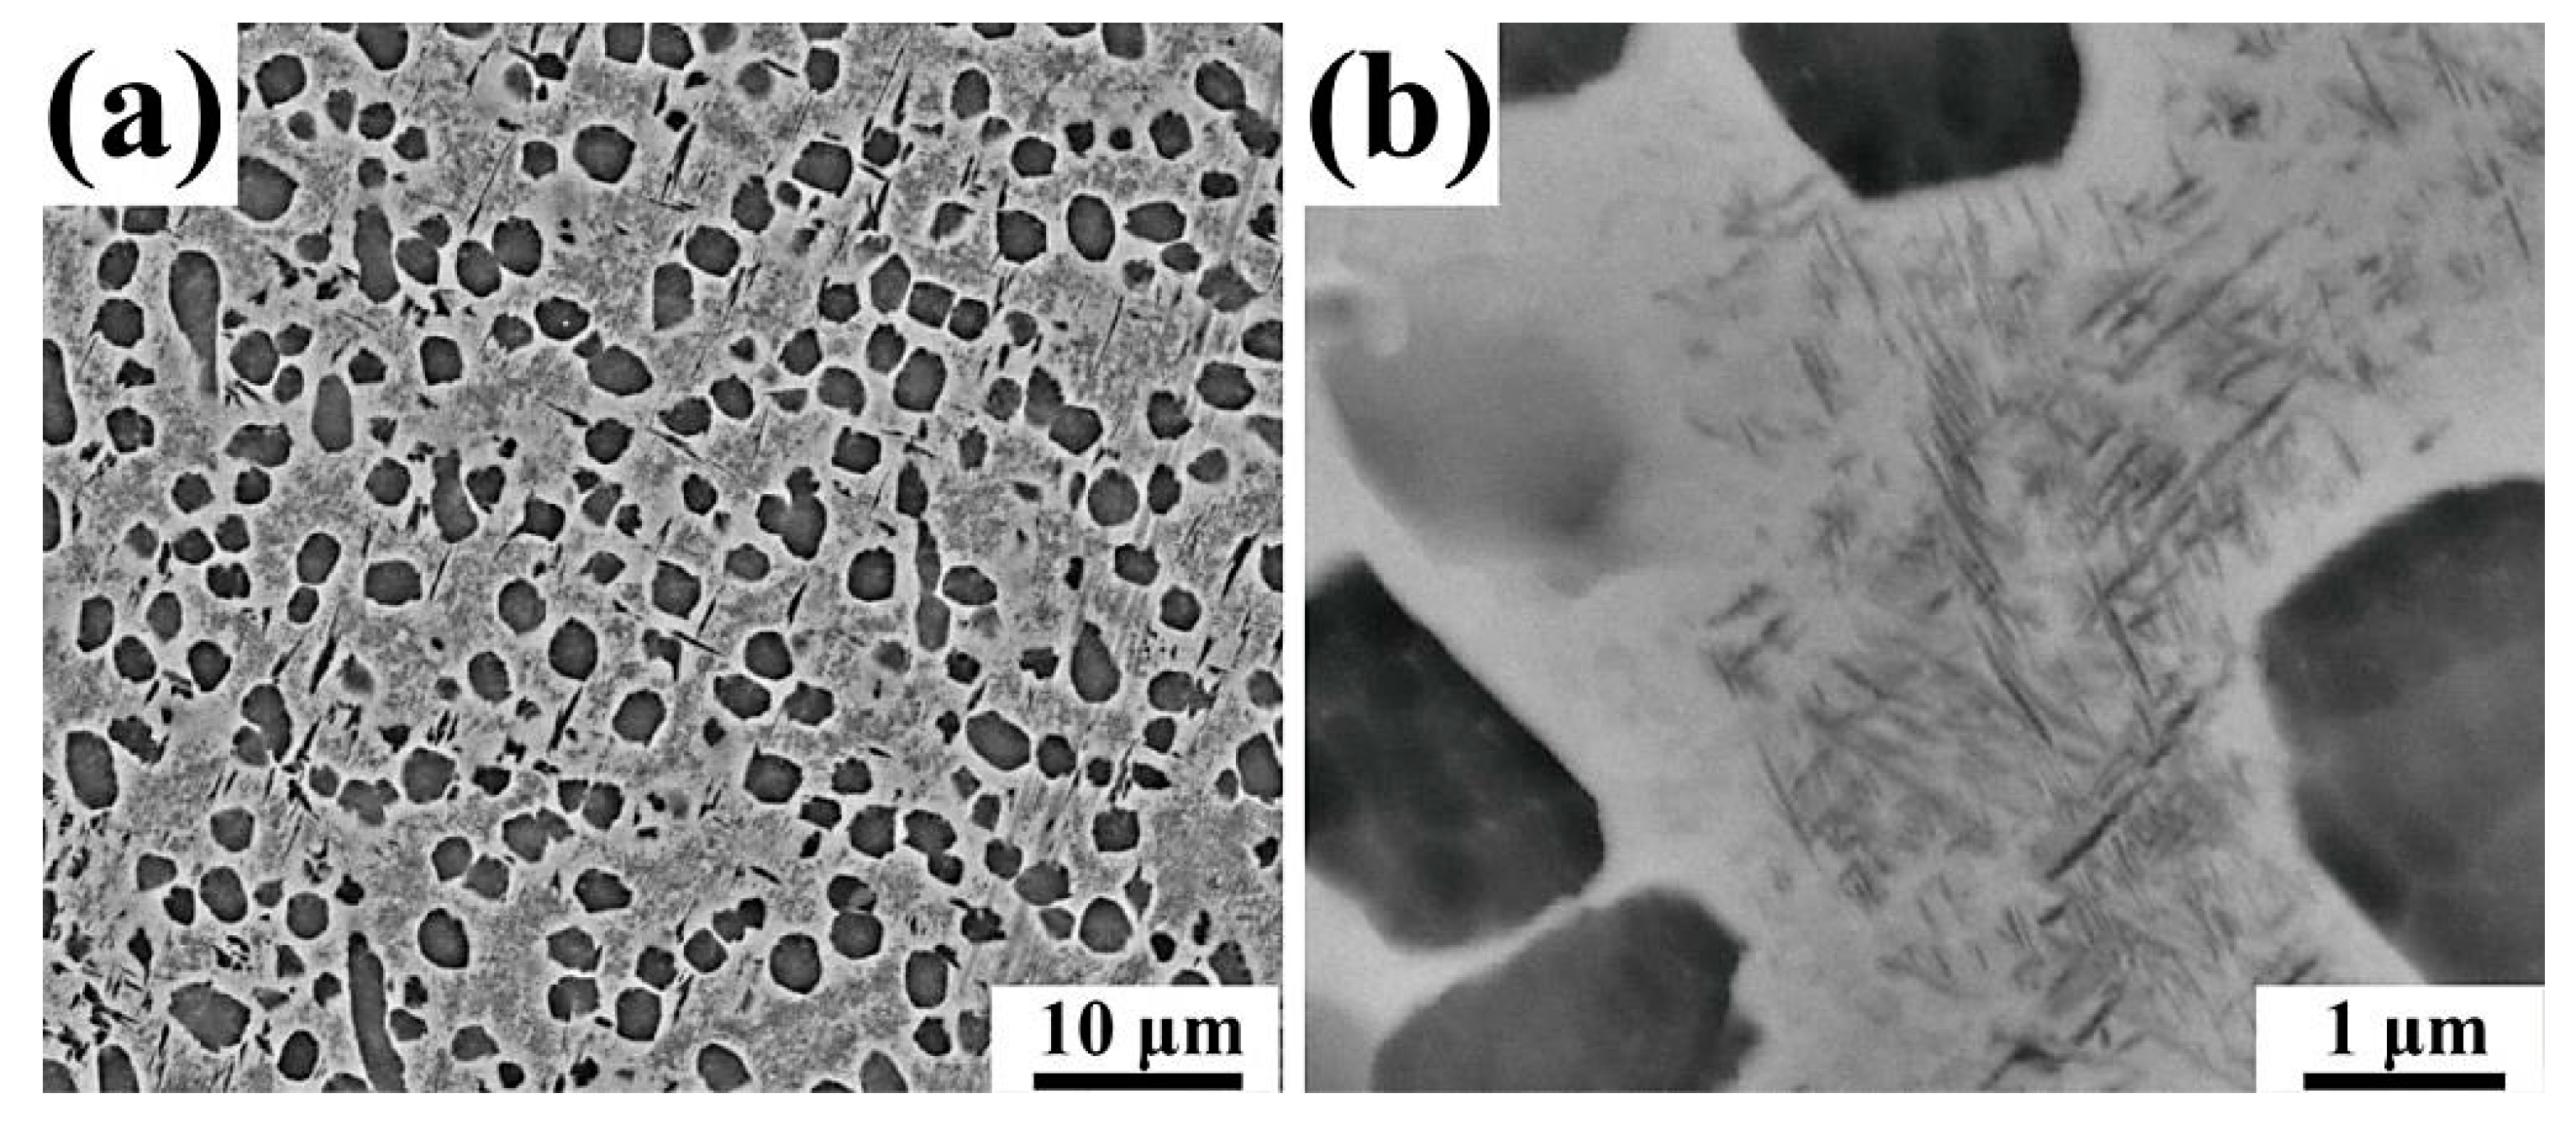
A Φ 200 mm Ti-55531 billet (Hunan Goldsky Titanium Industry Technology Co. Ltd, Changde, China) was used as the starting material. The chemical composition of the as-received alloy was detected by a PS-6 inductively coupled plasma. The results are listed in Table 1. The as-received alloy exhibited bimodal microstructure (Figure 1). The globular α phase showed an average diameter of 1.49 μm, and an average volume fraction of 27.02 vol. %. The acicular α had an average length of 0.097 μm and 0.050 μm average width, and the phase fraction of acicular α was 24.48 vol. %.

Table 1.
Chemical composition of the as-received Ti-55531 alloy.
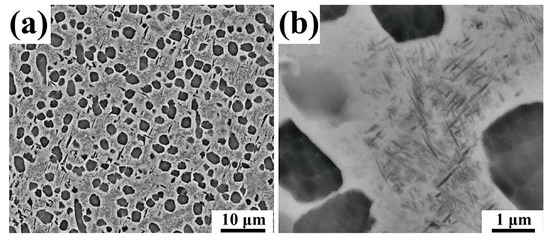
Figure 1.
SEM back-scattered electron images of the as-received bimodal Ti-55531 alloy: (a) overview; (b) enlarged.
The as-received bimodal Ti-55531 alloy was subjected to a dilatometric test on a Netzsch® DIL-402C under an argon atmosphere (99.999%). The alloy was cut, machined, and polished into Φ 5 mm × 25 mm cylinders. The cylinders were then continuously heated to 1273 K at the rates of 1, 3, 5, and 8 K/min, respectively. The length change of specimens with respect to temperature was recorded on the dilatometric curve, and the derivative curve was correspondingly plotted to determine the onset temperature of phase transformation more precisely.
In order to identify phase transformation reactions and to establish a one-to-one mapping between the reactions and the temperatures detected in the dilatometric test, the Ti-55531 samples were individually heated to the temperatures of the dilatometric readings with the heating rate of 1 K/min followed by a water quench to preserve the high-temperature microstructure. The phase constitution and fraction were analyzed via XRD. The XRD was carried out at room temperature in step-scanning mode with a step size of 0.02 ° (2θ), a counting time of 2.4 s per step, and a 2θ range of 30–65° on a Bruker D8 diffractometer using Cu Kα radiation (λ = 1.5406 Å) at 40 kV, 40 mA. The microstructure was observed by SEM on NOVATM Nano SEM 230 (FEI, Hillsboro, OR, USA). The specimens for SEM were etched by 1.5 mL HF + 3 mL HNO3 + 100 mL H2O.
With the SEM images, the phase fractions and size of globular and acicular α phases were obtained by using Image-Pro Plus software (Media Cybernetics, Inc., Rockville, MD, USA). Contrast filters based on fast Fourier transformation followed by spatial and morphological filtering operations were used to filter the noises, refine the image, and enhance the phase information in detail. In addition, the morphological filtering of the binary transformed image was assisted to act as filters of shape. The hit-and-miss transform can derive information on how the globular/acicular α phase is related to the surroundings. The caliper tool was used to detect edges (i.e., the phase boundary between α and β phases). Threshold and segmentation tools were employed to extract globular α and acicular α, and to distinguish them from the β matrix. The thresholding was tested using a triangle algorithm. The mean shift segmentation was done by trial and error using different bandwidths. With the tools equipped in the software, the area of individual phases, diameter of the globular α phase, and length and width of the acicular α phase were automatically measured and statistically analyzed. It is noteworthy that the phase fraction and size of α phases were repetitively measured in different areas and/or samples; thus, the values of average phase fraction and average size of α phases are of statistical significance.
3. Results
3.1. Dilatometric Behaviors
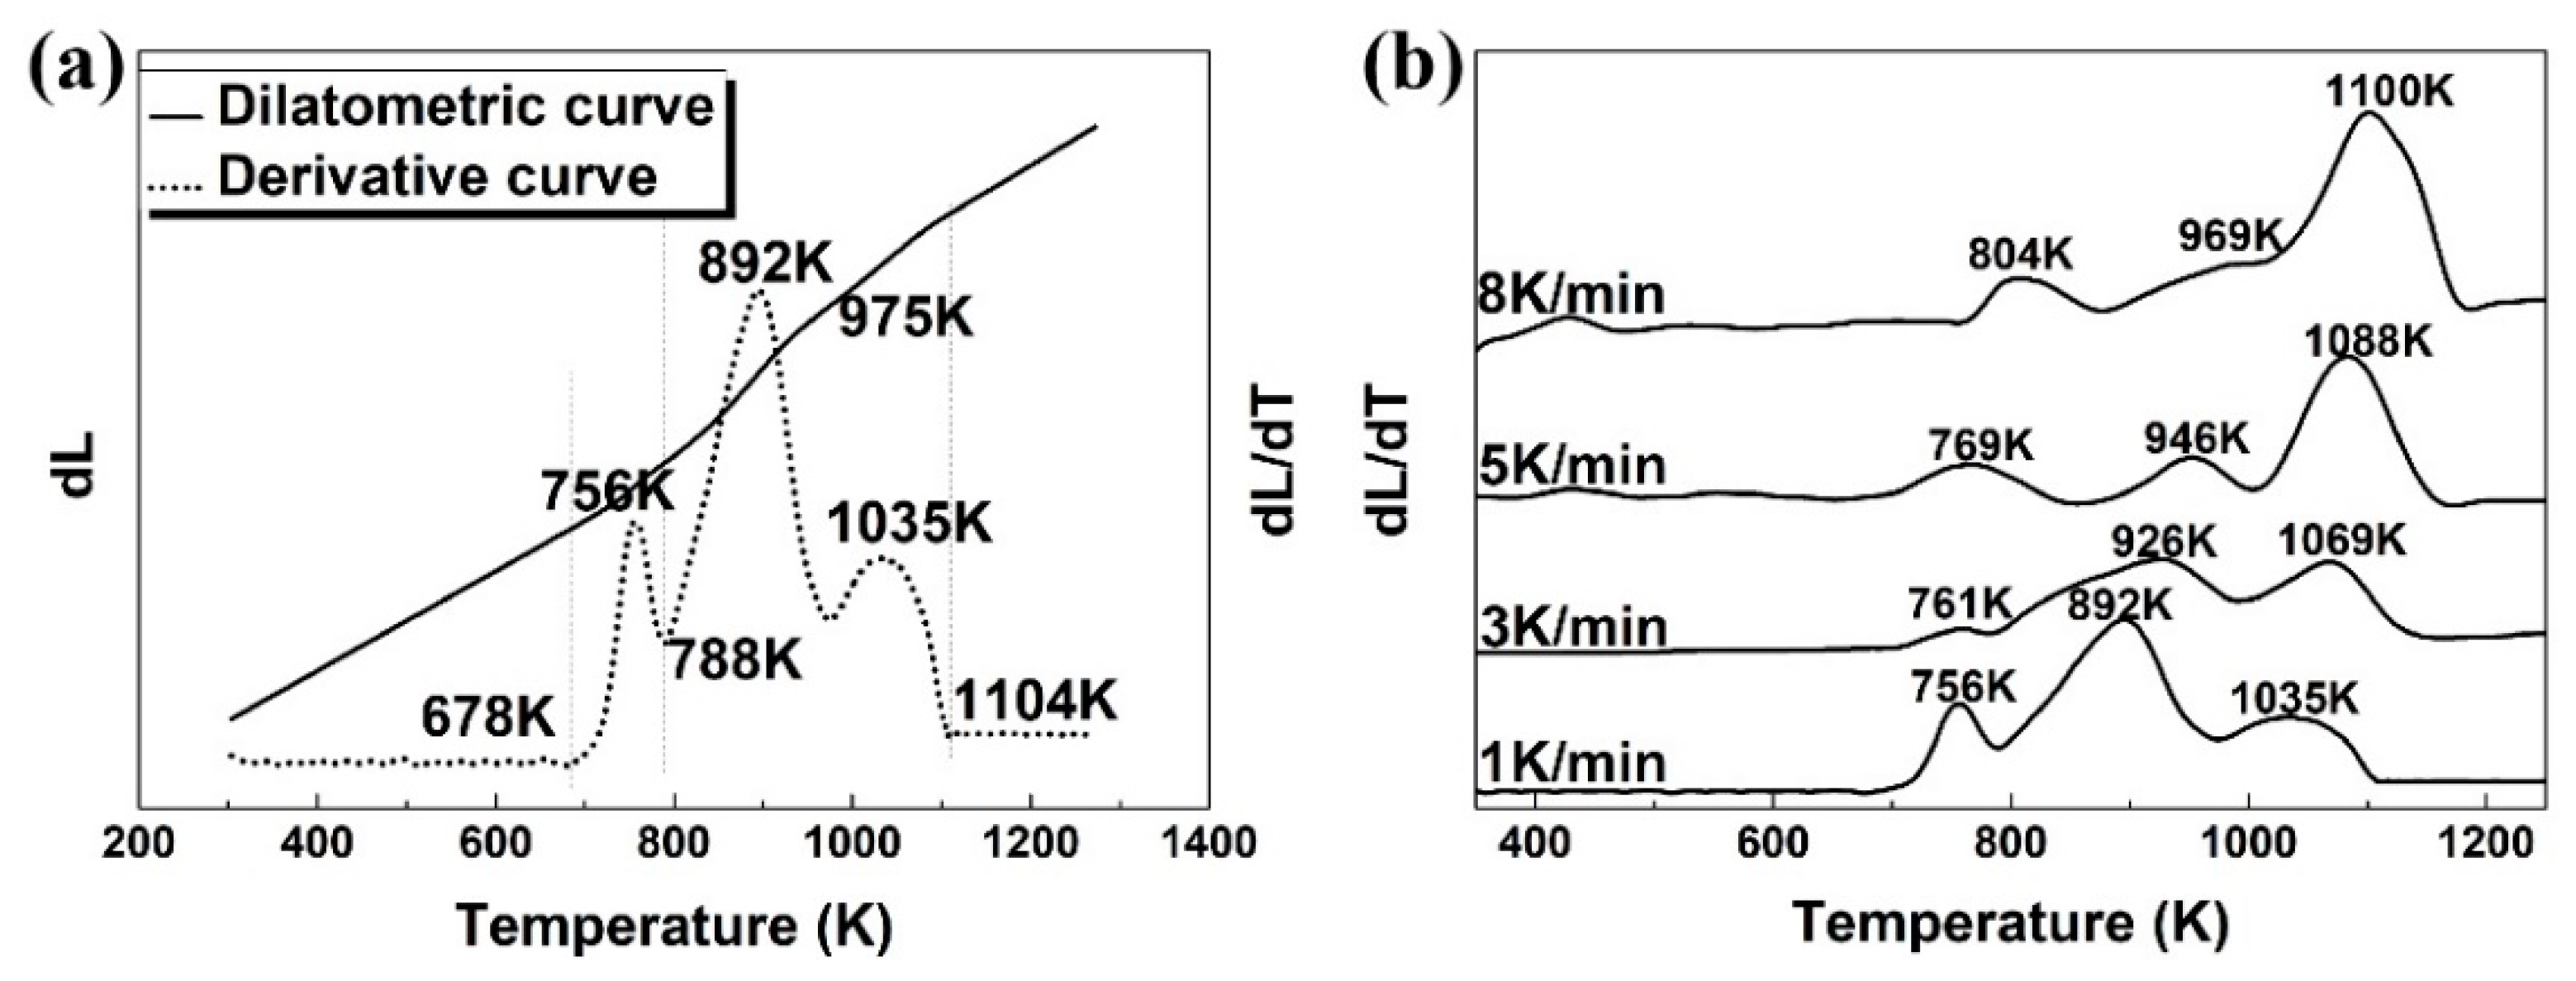
The dilatometric curve (solid curve) and its derivative (dotted curve) are shown in Figure 2a with a heating rate of 1 K/min as the representative. In the dilatometric curve, there are kinks that deviate from linearity, which are associated with the phase transformations. These dilatometric readings are more clearly shown on the derivative curves. The peak on the derivative curve is referred to as an ”expansion” response. Obviously, there were three expansions:
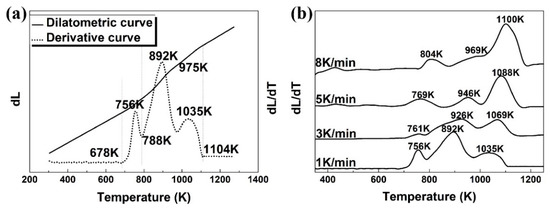
Figure 2.
(a) Dilatometric curve (solid line) and its derivative (dotted curve) at 1 K/min to depict the length change with respect to temperature in the continuous heating. (b) Derivative dilatometric curves at heating rates of 1, 3, 5, and 8 K/min.
(1) Expansion between 678 and 788 K with a peak at 756 K;
(2) Expansion between 788 and 975 K with a peak at 892 K;
(3) Expansion between 975 and 1104 K with a maximum at 1035 K.
To identify the phase transformation reactions occurring at the temperatures of dilatometric readings, the samples were heated to 678, 756, 788, 892, 938, 975, 990, 1038, and 1123 K at 1 K/min individually, followed by water quench for microstructure observation and phase identification. Figure 2b shows the derivative dilatometric curves at the heating rates of 1, 3, 5, and 8 K/min. They all show a similar shape with three peaks, indicating the occurrences of phase transformations in the same types. The shift of peak temperature with the heating rate will be discussed later in calculating activation energy.
3.2. Microstructure Observation
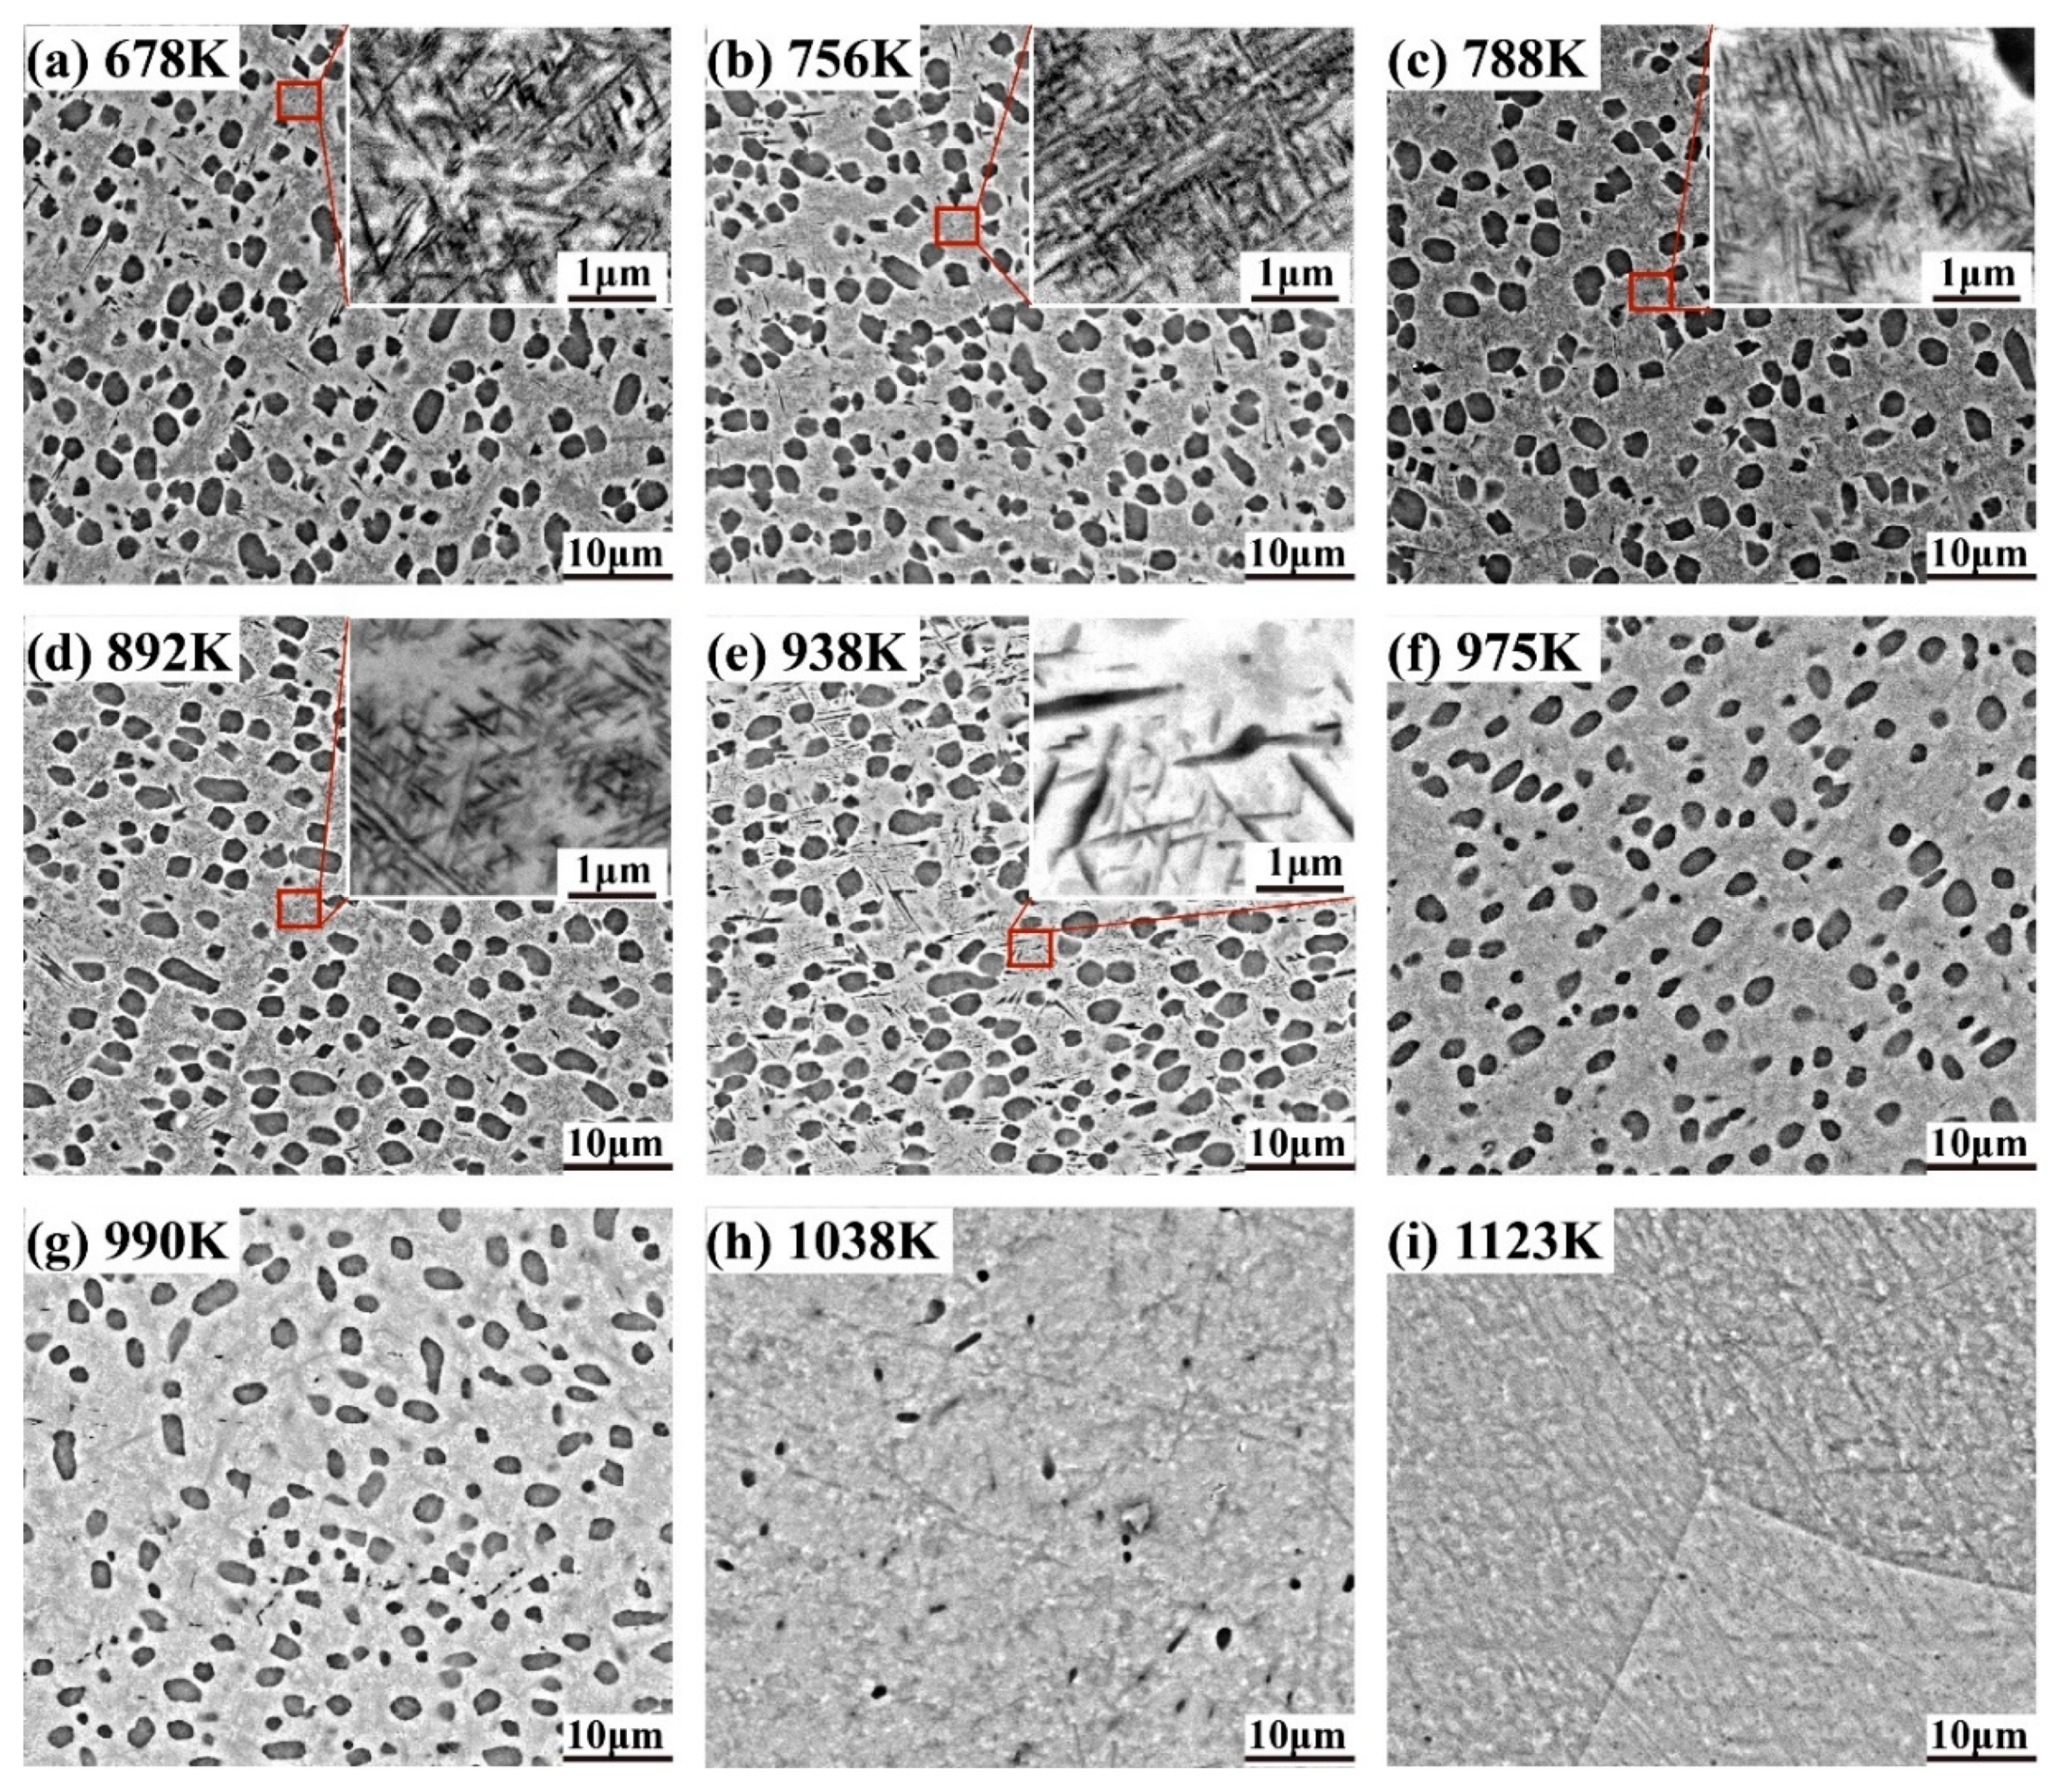
Figure 3 shows the microstructure of the frozen bimodal Ti-55531 alloy at 678, 756, 788, 892, 938, 975, 990, 1038, and 1123 K after 1 K/min heating (corresponding to the temperatures in dilatometric test). The phases in dark-grey are α, showing globular and acicular shapes. The matrix in light-grey is β phase. There is a precipitation free zone of β phase surrounding the globular α phase, which is associated with the complete and incomplete wetting of phase boundaries [16,17]. The phase size and volume fraction changed with temperature in different ways in globular and acicular α phases. The variation tendencies are shown in Figure 4, and the statistical data are summarized in Table 2. The preset globular α phase remained unchanged in shape and volume fraction from room temperature to 975 K, but the acicular α phase experienced growth and dissolution in the same temperature range.
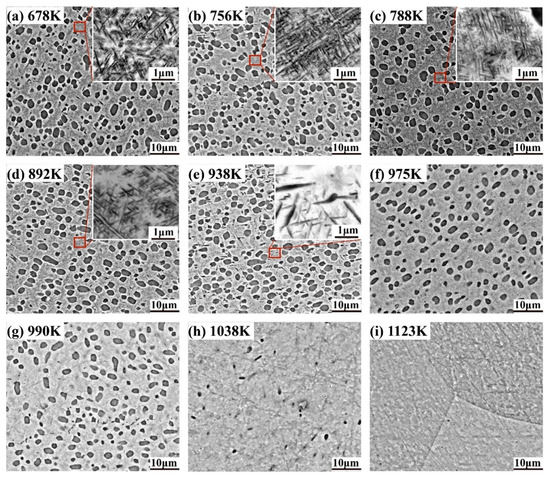
Figure 3.
The microstructure of frozen bimodal Ti-55531 at (a) 678 K, (b) 756 K, (c) 788 K, (d) 892 K, (e) 938 K, (f) 975 K, (g) 990 K, (h) 1038 K, and (i) 1123 K during 1 K/min heating.
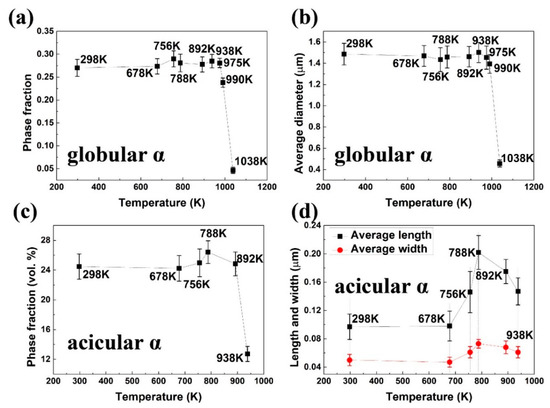
Figure 4.
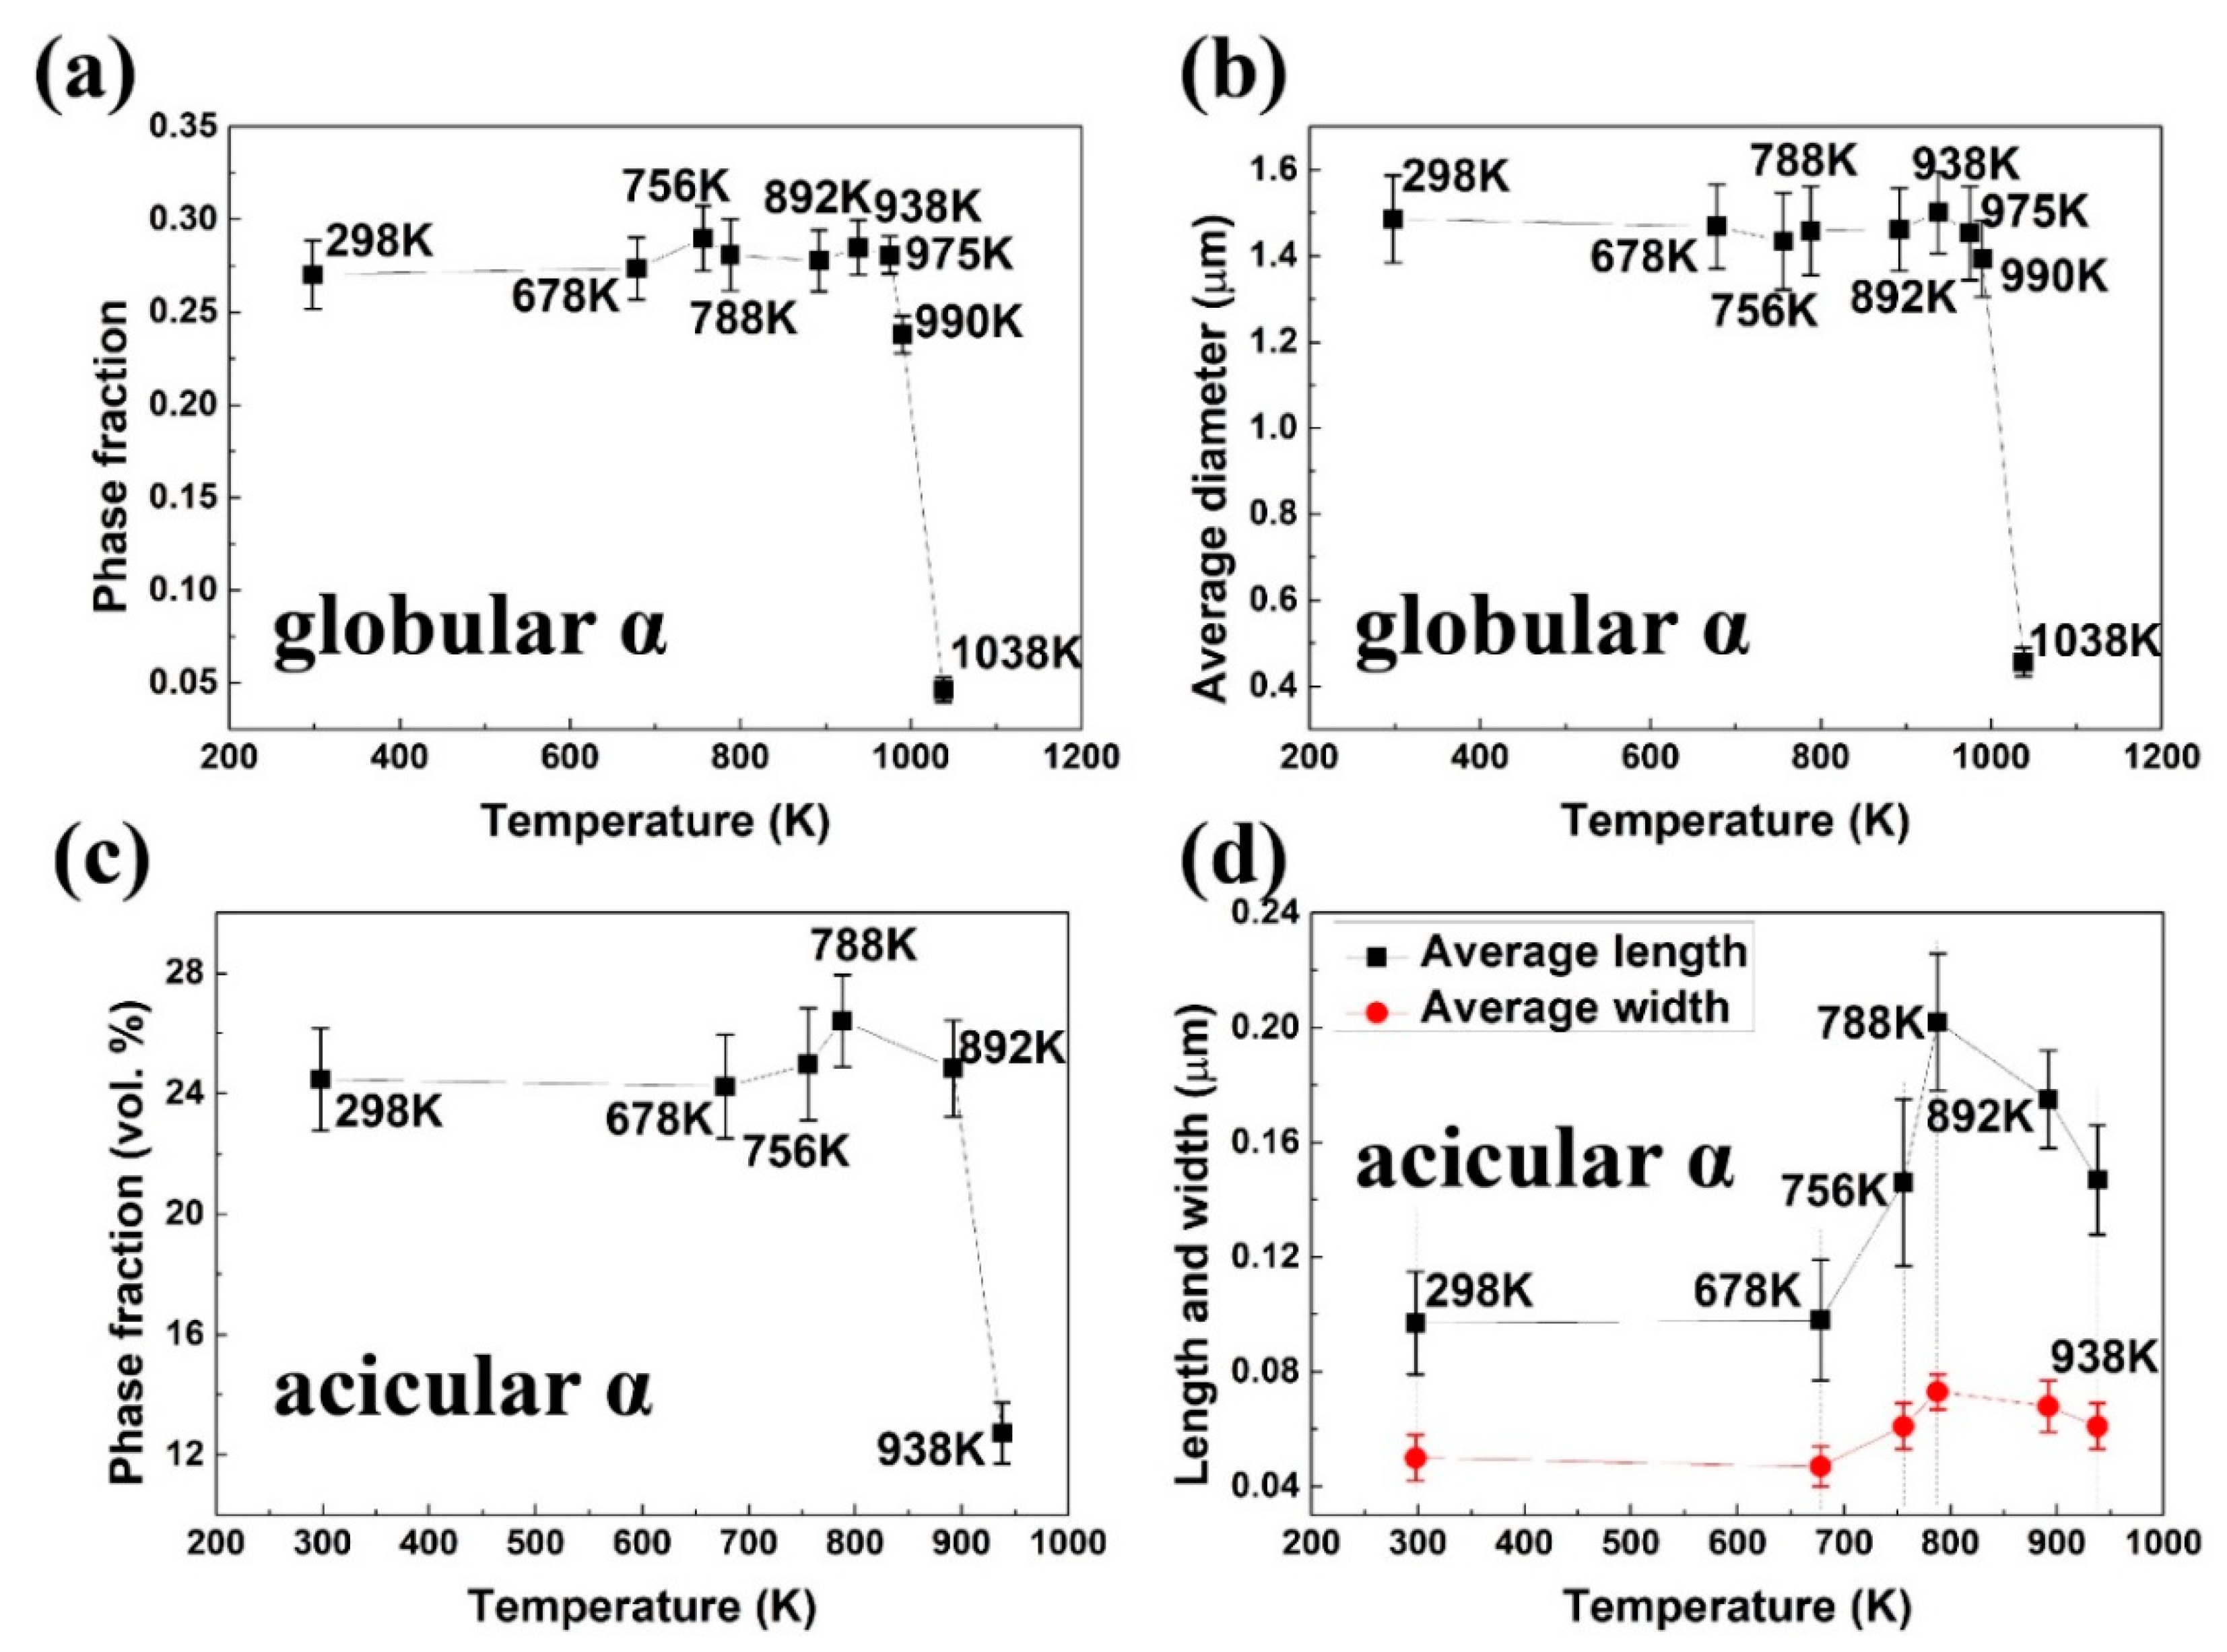
The variation of (a) volume fraction and (b) average diameter of globular α with changing temperature. Variation of (c) volume fraction and (d) average length and width of acicular α phase with changing temperature.
Table 2.
Microstructure features of Ti-55531 alloy quenched from different temperatures.
In detail, the alloy quenched from 678 K maintained a bimodal microstructure almost identical to that in the as-received alloy. The volume fraction and average diameter of globular α, as well as the volume fraction, average length, and average width of acicular α, hardly changed—as depicted in Figure 3a and Figure 4. The nucleation and growth of acicular α phase took place first when the alloy was heated up to 756 K, and continued to 788 K. It was evidenced by lengthening and thickening of the acicular α phase in Figure 3b,c. The acicular α grew into 0.061 μm in average width and 0.146 μm in average length with 24.98 vol. % at 756 K. At 788 K, the morphological features increased to 0.073 μm average width and 0.202 μm average length, with 26.41 vol. %. The microstructure of the alloy frozen at temperatures higher than 788 K showed a significant decrease in the volume fraction of acicular α phase as the temperature increased. The volume fraction of acicular α was measured 24.84 vol. % at 892 K and decreased to 12.73 vol. % at 938 K. It can be inferred that the acicular α phase started to dissolve at 788 K. In line with the volume fraction, the average length of acicular α decreased to 0.175 μm at 892 K and 0.147 μm at 938 K, respectively. The average width decreased to 0.068 μm at 892 K and 0.061 μm at 938 K. In the alloy frozen at 975 K, the acicular α phase disappeared in the SEM image (see Figure 3f and Table 2), indicating a complete redissolution back into the β matrix.
In contrast, the morphological parameters of globular α were nearly unchanged. The phase fraction and diameter merely exhibited slight fluctuations at temperatures below 975 K. The dissolution of the globular α phase came about at 975 K. The phase fraction dramatically decreased from 28.08 vol. % at 975 K to 23.80 vol. % at 990 K, and further to 4.63 vol. % at 1038 K. The average diameter of globular α decreased from 1.45 μm (975 K) to 1.39 μm (990 K), and further to 0.46 μm (1038 K). At 1123 K, both globular and acicular α disappeared (Figure 3i). In summary, the growth of acicular α phase took place in the range 678–788 K. The redissolution of acicular α occurred within the range 788–975 K, and that of globular α phase proceeded between 975 and 1104 K.
3.3. Phase Identification
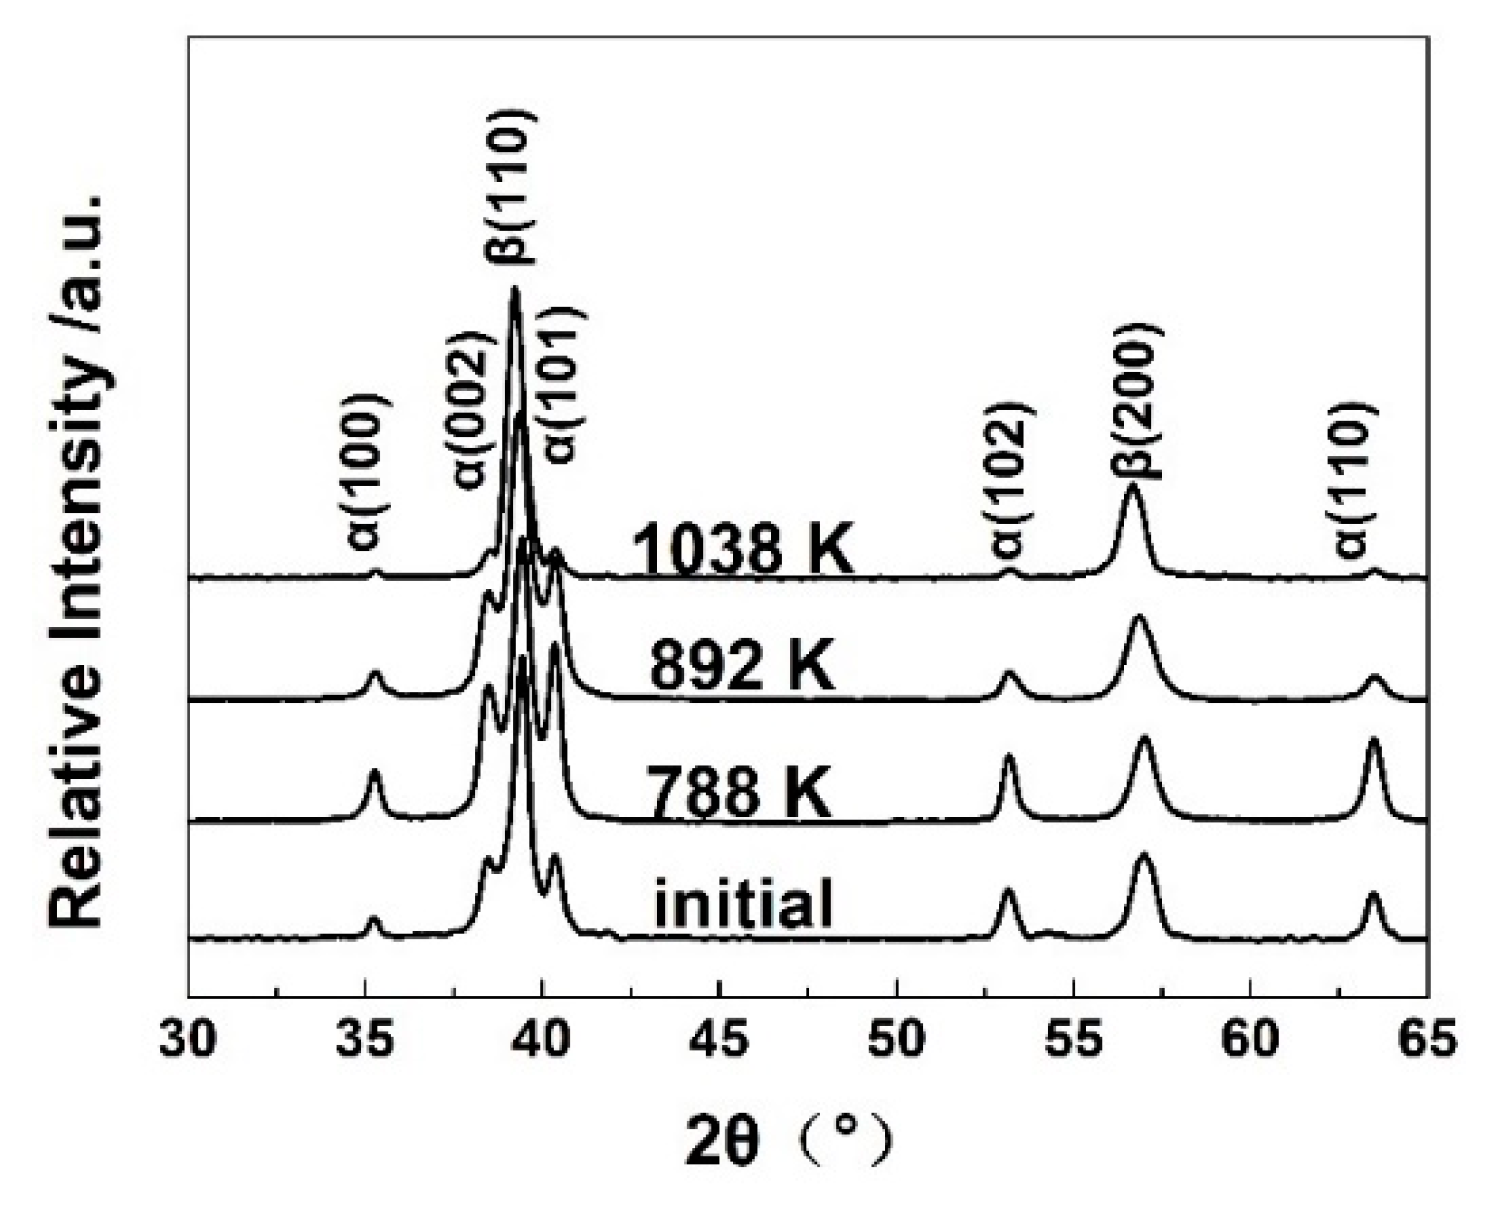
Figure 5 shows the XRD patterns of the bimodal Ti-55531 alloy quenched from 788, 892, and 1038 K. The intensity of α reflection increased from room temperature to 788 K, but gradually decreased from 788 to 1038 K. The XRD results suggest the α phase precipitated in the temperature range below 788 K, and underwent redissolution above 788 K. Moreover, the phase fractions of α and β phases could be calculated via the relative intensity of XRD peaks with the help of JADE software. The results are listed in Table 3. The calculated α phase fraction from XRD showed a good agreement with that obtained from SEM in Figure 6. The XRD results verify the determined phase transformation from SEM observation and dilatometer test. The consistency among the results derived from different characterizations indicates the reliability of our experimental data. The determined phase transformation reactions and temperatures are summarized in Table 3, alongside the dilatometric responses based on the above experiments and analyses.

Figure 5.
XRD patterns of the Ti-55531 alloys quenched from different temperatures.
Table 3.
Dilatometric behaviors and phase transformations during 1 K/min heating.
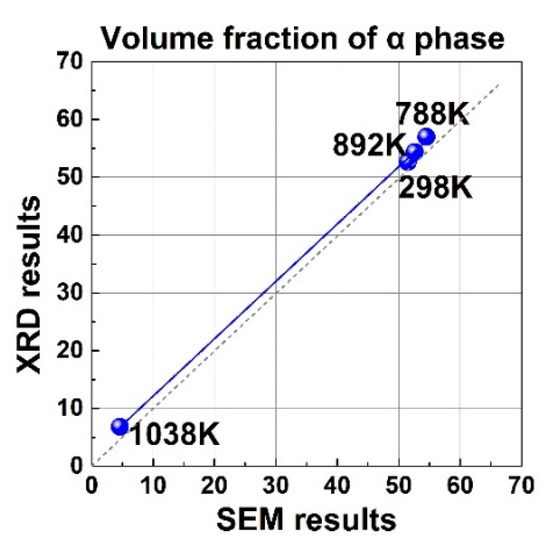
Figure 6.
Linear regression of the α phase fraction derived from XRD versus those from SEM.
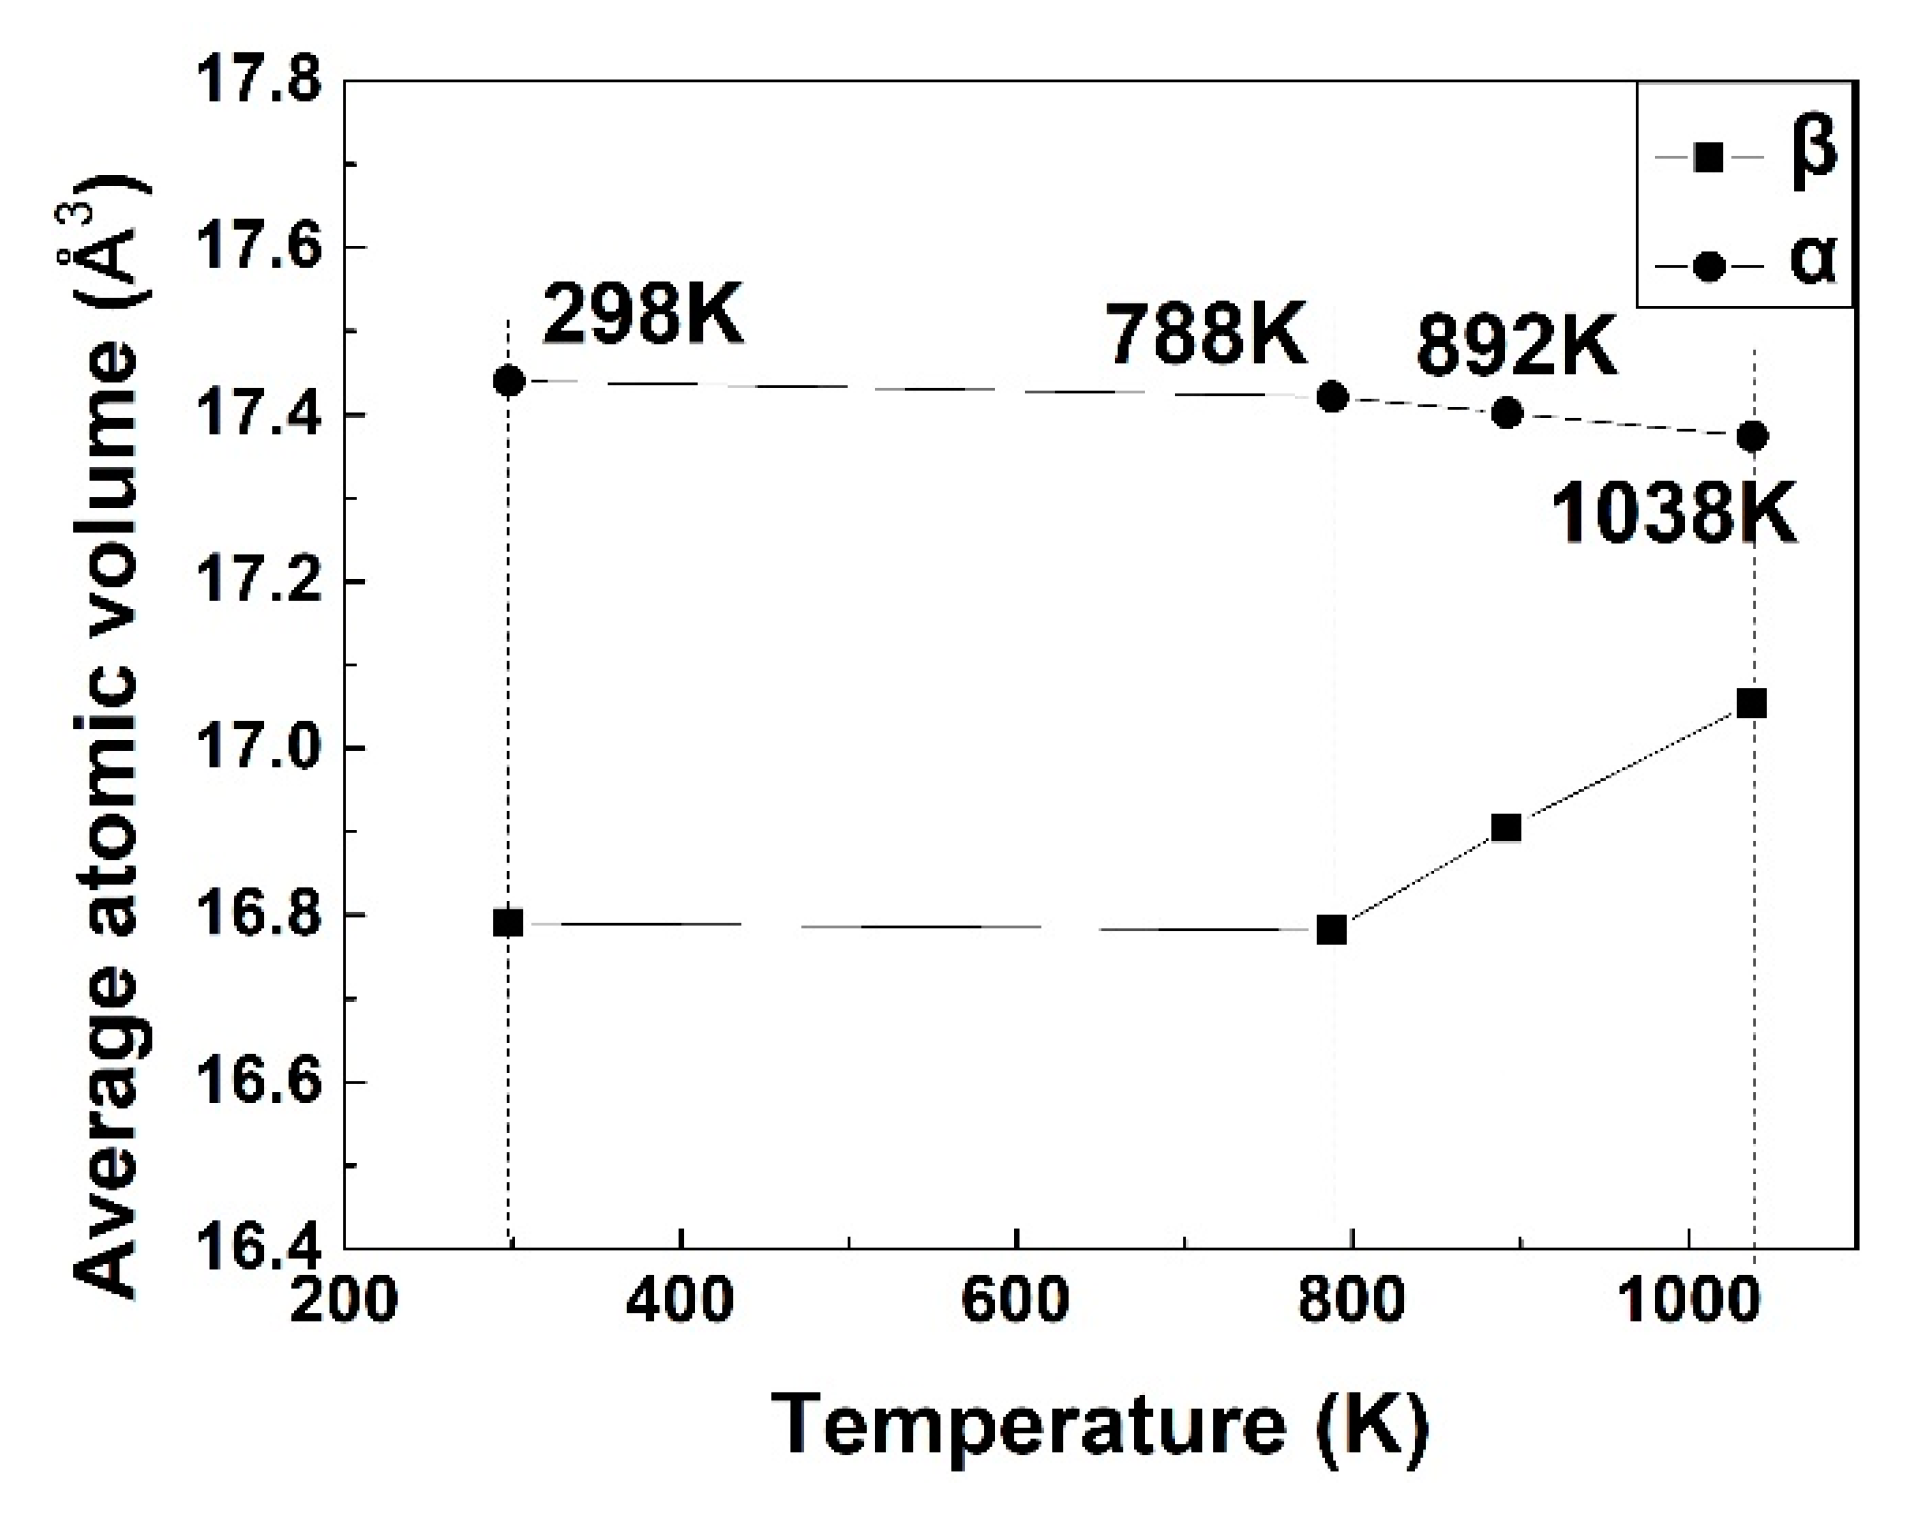
The shift of peak positions could be observed on XRD patterns for both α and β phases, indicating the expansion or contraction of the lattice. Based on the positions of XRD peaks, the average atomic volumes of α and β phase were calculated and then plotted in Figure 7. The figure shows that the average atomic volume of β phase was nearly unchanged below 788 K, followed by a monotonous increase. The average atomic volume of α was larger than that of β. It exhibited a slight decrease from 788 to 1038 K. The macro expansion in the temperature range of 678–788 K (Figure 2) was made from the formation of α phase with a larger average atomic volume than β phase. Above 788 K, the composition partitioning was more obvious than for lower temperatures. α → β transformation leads to Al atoms diffusing from α to β, while β-stabilizers diffuse in the opposite direction. The remarkable increase of average atomic volume in β phase not only offset the volume shrinkage due to the slight decrease of average atomic volume in α phase, but also gave rise to an overall expansion [6]. This is a synergistic effect of the thermodynamics and kinetics of the diffusional α → β transformation, leading to the macro expansion on the dilatometric curve above 788 K (Figure 2).
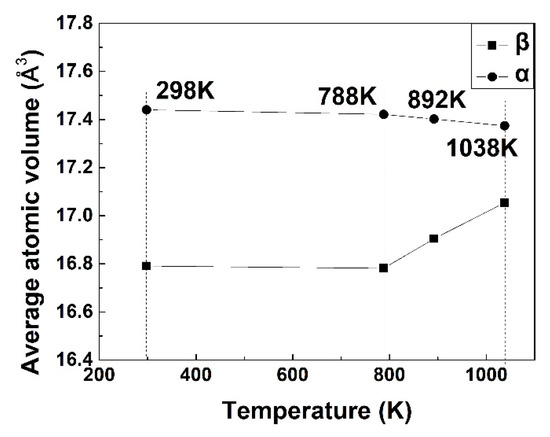
Figure 7.
The average atomic volume of α and β in the bimodal Ti-55531 alloys which were heated to the target temperatures at 1 K/min followed by water quench.
4. Discussion
In Section 3, the dilatometric signals in continuous heating were successively correlated to the phase transformations β → αacicular, αacicular → β, and αglobular → β. The acicular α underwent dissolution prior to the globular α, indicating that morphology plays an important role in the thermodynamics and kinetics of dissolution. Here, the Kissinger method [18] was employed to analyze the activation energy of α redissolution:
ln((Tp2)/H) = C + E/RT.
In Equation (1), Tp is the peak temperature (K), H denotes heating rate (K/s), E denotes the activation energy, and C is a constant.
Since the maximum phase transformation rate coincides with the peak on the derivative curve in the dilatometric test, the activation energy for the dissolution of acicular α and globular α can be derived separately. Table 4 presents the peak temperatures corresponding to the redissolution of acicular α and globular α at different heating rates. The peak temperature increased with the heating rate. This effect is explained by the diffusive nature of α redissolution. The element partitioning between the α and β can be achieved more completely at a lower heating rate, thus the overheating is less significant.
Table 4.
The measured peak temperatures of bimodal Ti-55531 at various heating rates.
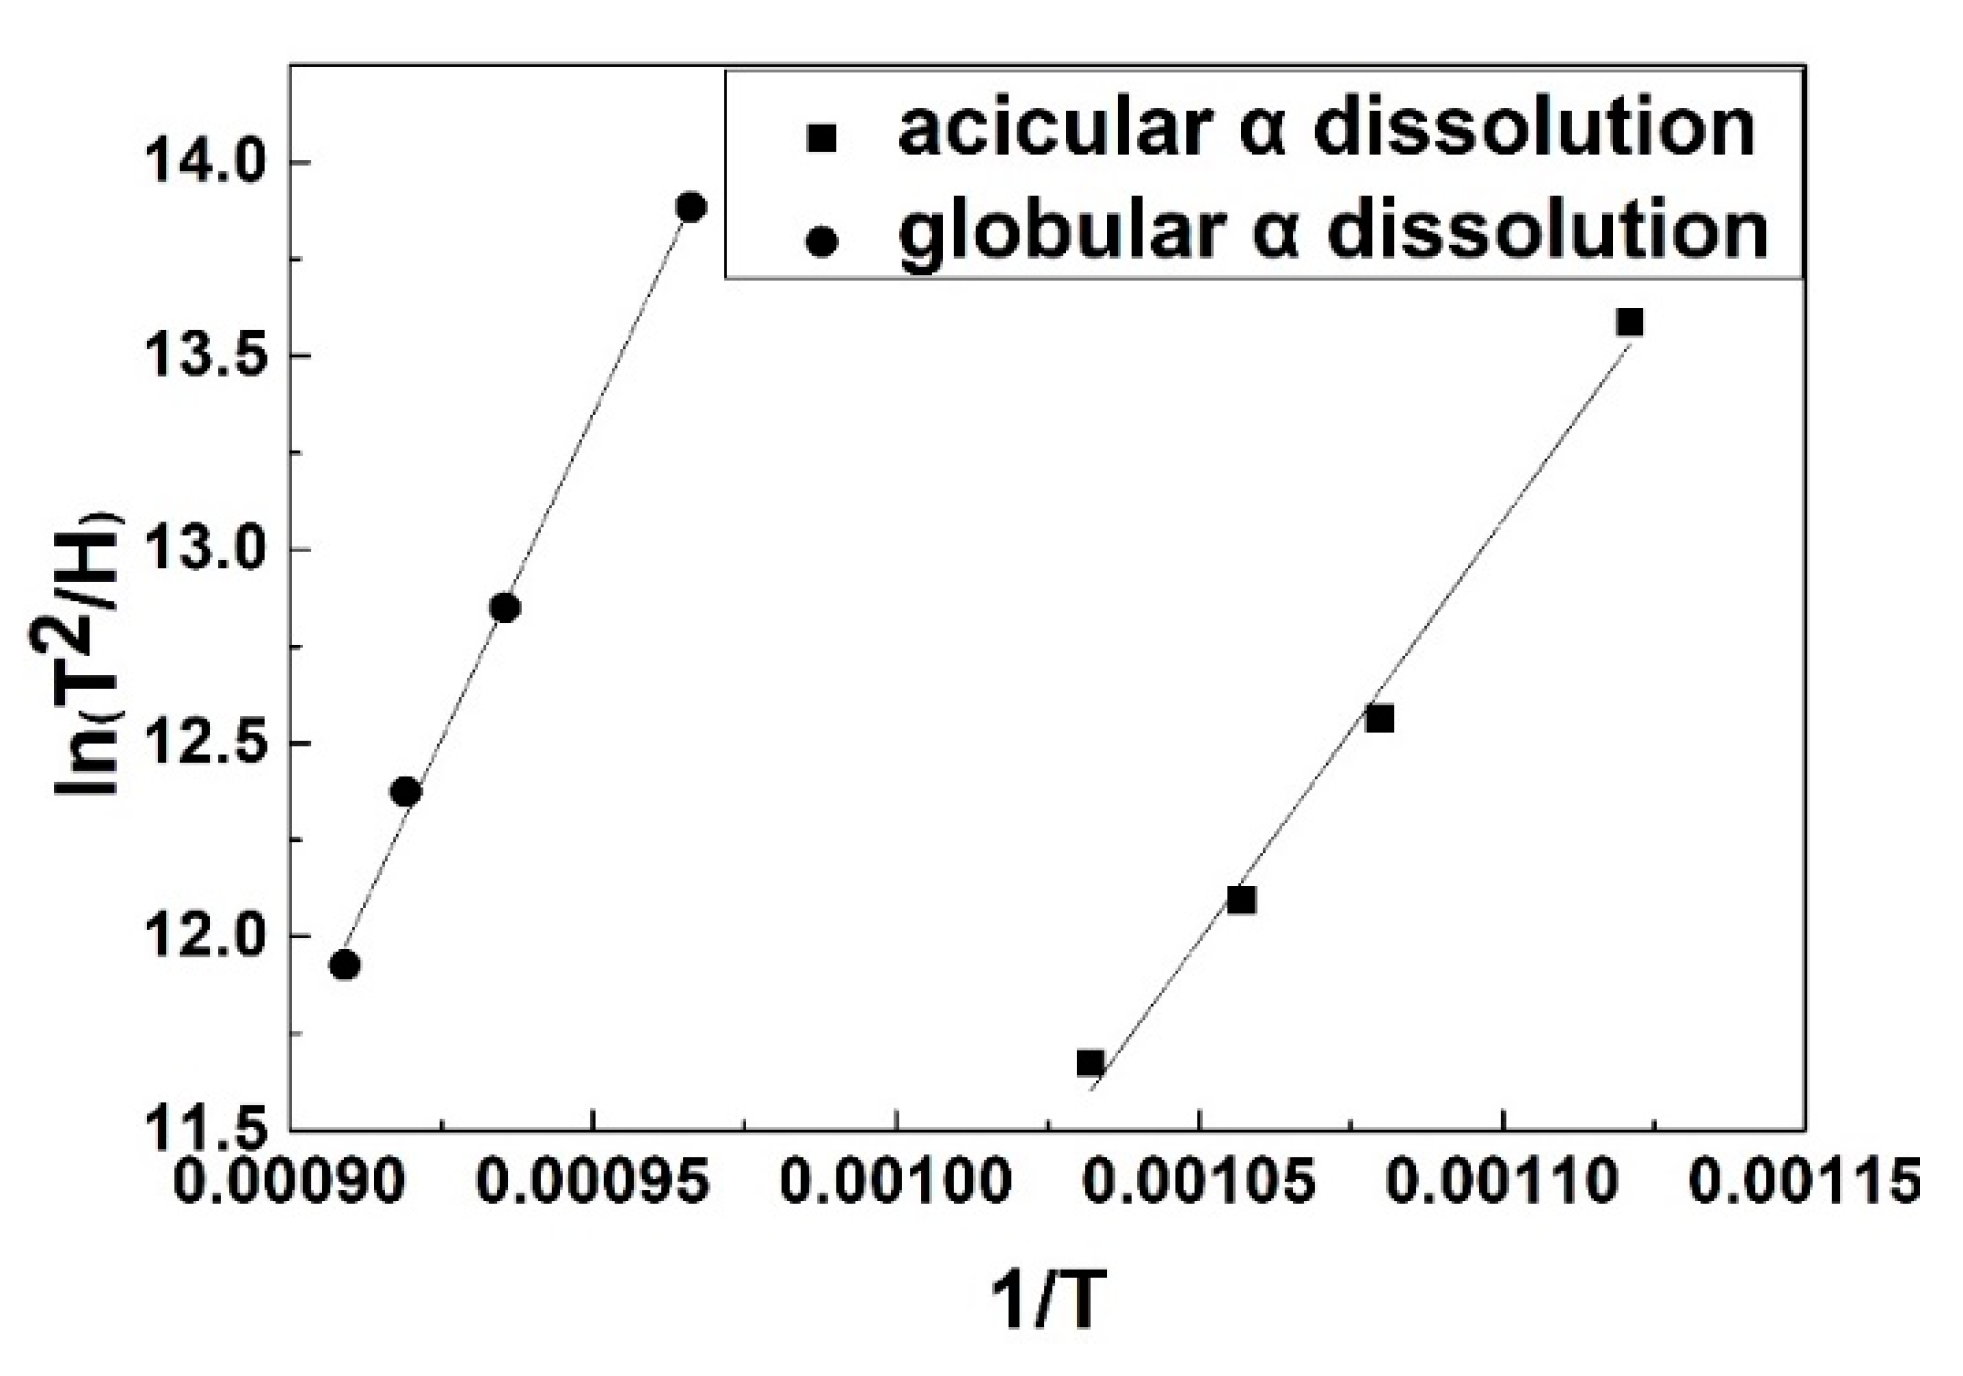
By implementing linear regressions of ln((Tp2)/H) vs. (1/T) for the scatter data, the slope of the line can be estimated (Figure 8). The activation energy for the acicular α dissolution was deduced from the slope of the regression lines. The calculated activation energy was 176.58 kJ/mol for the dissolution of acicular α and 269.65 kJ/mol for that of globular α, respectively. Wang [19] believed the minor composition difference between globular and acicular α phases led to the difference in the activation energy. It also resulted in the acicular α dissolving prior to the globular α in TC21. However, Gridnev [20] found different kinetics in VT23 and VT6 alloys. The α → β transformation was accomplished more rapidly in the alloys with a globular α structure than that with a lamellar α when the thickness of lamellar α was equal to the diameter of globular α. We considered that the phenomenon may be explained through the Gibbs-Thomson effect. The broad face of lamellar α is an approximate planar interface without the Gibbs-Thomson effect. However, the tips of lamellar α have a large curvature with the Gibbs-Thomson effect. It reduces the thermodynamic stability of tips and facilitates dissolution. When two tips of lamellar α embrace the same interface curvature as globular α, the dissolution rate of lamella tips is identical to that of globular α. However, the existence of a broad face in lamellar α would slow down the rate of the α dissolution. This explanation applies to acicular α and globular α phases in this work. The difference in the activation energy and the dissolution rate could be ascribed to minor composition and interface curvature between acicular α and globular α.
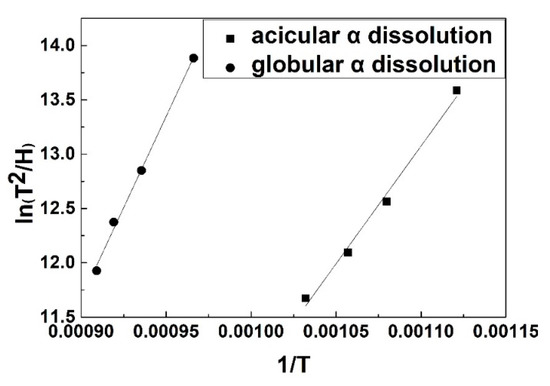
Figure 8.
The plot of activation energy for globular and acicular α dissolution in bimodal Ti55531 alloy.
5. Conclusions
In this work, the isochronal phase transformations of the bimodal Ti-55531 in the condition of continuous heating at a constant rate were investigated by combining dilatometric measurement, XRD phase analyses, and microstructure observation. The following conclusions can be made:
- Only β → αacicular transformation took place at 678 K, and the αglobular was not involved. When heated up to 788 K, α → β transformation occurred. The α → β phase transformation included two stages; αacicular → β and αglobular → β transformations dominated in different temperature ranges. The dissolution of αacicular terminated before the start of αglobular dissolution.
- The expansion/contraction behaviors in the dilatometry test were the thermal presentations of phase transformation. α precipitation was associated with expansion due to the increase of α volume. The expansion in the dissolution of α was associated with the synergetic effect of thermodynamics and kinetics on elements partitioning between α and β phases.
- The dissolution of α was affected by the morphology. The average activation energy for αacicular → β transformation was 176.58 kJ/mol, while that of the αglobular → β transformation was 269.65 kJ/mol in the Ti-55531 alloy. The differences in activation energy and rate originated from the difference in the chemical composition and interface curvature between two α phases.
Author Contributions
Conceptualization, H.C. and K.Z.; methodology, F.C. and G.X.; validation, F.C. and G.X.; formal analysis, F.C.; investigation, F.C.; data curation, F.C.; writing—original draft preparation, F.C.; writing—review and editing, G.X.; visualization, F.C. and G.X.; project administration, K.Z. and H.C.; funding acquisition, G.X., F.C., and K.Z.
Funding
This research was funded by the Natural Science Funds of China (Grants No. 51801101 and 51701094), Chinese Postdoctoral Science Fund (Grant No. 2019M651812), and National Defense Fundamental Research Fund (JCKY2018414C020). K. Zhou acknowledges the support of Independent Project from State Key Laboratory of Powder Metallurgy and Innovation Driving Project from Central South University. G. Xu acknowledges the support from Natural Science Funds of Jiangsu Province Grant No. BK20171014.
Conflicts of Interest
The authors declare no conflict of interest.
References
- Cotton, J.D.; Briggs, R.D.; Boyer, R.R.; Tamirisakandala, S.; Russo, P.; Shchetnikov, N.; Fanning, J.C. State of the art in beta titanium alloys for airframe applications. JOM 2015, 67, 1281–1303. [Google Scholar] [CrossRef]
- Boyer, R.R. An overview on the use of titanium in the aerospace industry. Mater. Sci. Eng. A 1996, 213, 103–114. [Google Scholar] [CrossRef]
- Raghunathan, S.L.; Stapleton, A.M.; Dashwood, R.J.; Jackson, M.; Dye, D. Micromechanics of Ti–10V–2Fe–3Al: In situ synchrotron characterisation and modelling. Acta Mater. 2007, 55, 6861–6872. [Google Scholar] [CrossRef]
- Ivasishin, O.M.; Markovsky, P.E.; Matviychuk, Y.V.; Semiatin, S.L.; Ward, C.H.; Fox, S. A comparative study of the mechanical properties of high-strength β-titanium alloys. J. Alloys Comp. 2008, 457, 296–309. [Google Scholar] [CrossRef]
- Barriobero-Vila, P.; Requena, G.; Schwarz, S.; Warchomicka, F.; Buslaps, T. Influence of phase transformation kinetics on the formation of α in a β-quenched Ti–5Al–5Mo–5V–3Cr–1Zr alloy. Acta Mater. 2015, 95, 90–101. [Google Scholar] [CrossRef]
- Chen, F.; Xu, G.; Zhang, X.; Zhou, K. Exploring the Phase Transformation in β-Quenched Ti-55531 alloy during continuous heating via dilatometric measurement, microstructure characterization, and diffusion analysis. Metall. Mater. Trans. A 2016, 47, 5383–5394. [Google Scholar] [CrossRef]
- Chen, F.W.; Xu, G.; Zhang, X.Y.; Zhou, K.C.; Cui, Y. Effect of α morphology on the diffusional β↔α transformation in Ti–55531 during continuous heating: Dissection by dilatometer test, microstructure observation and calculation. J. Alloys Comp. 2017, 702, 352–365. [Google Scholar] [CrossRef]
- Huang, C.; Zhao, Y.; Xin, S.; Zhou, W.; Li, Q.; Zeng, W. Effect of microstructure on tensile properties of Ti–5Al–5Mo–5V–3Cr–1Zr alloy. J. Alloys Comp. 2017, 693, 582–591. [Google Scholar] [CrossRef]
- Huang, C.; Zhao, Y.; Xin, S.; Zhou, W.; Li, Q.; Zeng, W.; Tan, C. High cycle fatigue behavior of Ti–5Al–5Mo–5V–3Cr–1Zr titanium alloy with bimodal microstructure. J. Alloys Comp. 2017, 695, 1966–1975. [Google Scholar] [CrossRef]
- Huang, C.; Zhao, Y.; Xin, S.; Tan, C.; Zhou, W.; Li, Q.; Zeng, W. High cycle fatigue behavior of Ti–5Al–5Mo–5V–3Cr–1Zr titanium alloy with lamellar microstructure. Mater. Sci. Eng. A 2017, 682, 107–116. [Google Scholar] [CrossRef]
- Clément, N. Phase Transformations and Mechanical Properties of the Ti-5553 Beta-Metastable Titanium Alloy. Ph.D Thesis, Polytech Louvain, Louvain, Belgium, 2010; p. 324. [Google Scholar]
- Welk, B.A. Microstructural and Property Relationships in Titanium Alloy Ti–5553. Ph.D. Thesis, The Ohio State University, Columbus, OH, USA, 2010. [Google Scholar]
- Xin, S.W.; Zhao, Y.Q. Discussion about the heat treatment and precipitated phases of titanium alloy. Heat Treat. Met. 2006, 31, 39–42. [Google Scholar]
- Warchomicka, F.; Poletti, C.; Stockinger, M. Study of the hot deformation behaviour in Ti–5Al–5Mo–5V–3Cr–1Zr. Mater. Sci. Eng. A 2011, 528, 8277–8285. [Google Scholar] [CrossRef]
- Qin, D.; Lu, Y.; Guo, D.; Zheng, L.; Liu, Q.; Zhou, L. Tensile deformation and fracture of Ti–5Al–5V–5Mo–3Cr–1.5 Zr–0.5 Fe alloy at room temperature. Mater. Sci. Eng. A 2013, 587, 100–109. [Google Scholar] [CrossRef]
- Straumal, B.B.; Kogtenkova, O.A.; Straumal, A.B.; Kuchyeyev, Y.O.; Baretzky, B. Contact angles by the solid-phase grain boundary wetting (coverage) in the Co–Cu system. J. Mater. Sci. 2010, 45, 4271–4275. [Google Scholar] [CrossRef]
- Mazilkin, A.A.; Abrosimova, G.E.; Protasova, S.G.; Straumal, B.B.; Schütz, G.; Dobatkin, S.V.; Bakai, A.S. Transmission electron microscopy investigation of boundaries between amorphous “grains” in Ni50Nb20Y30 alloy. J. Mater. Sci. 2011, 46, 4336–4342. [Google Scholar] [CrossRef]
- Kissinger, H.E. Variation of peak temperature with heating rate in differential thermal analysis. J. Res. Natl. Bur. Stand. 1956, 57, 217–221. [Google Scholar] [CrossRef]
- Wang, Y.; Kou, H.; Chang, H.; Zhu, Z.; Su, X.; Li, J.; Zhou, L. Phase transformation in TC21 alloy during continuous heating. J. Alloys Comp. 2009, 472, 252–256. [Google Scholar] [CrossRef]
- Gridnev, V.N.; Ivasishin, O.M.; Markovskii, P.E. Influence of heating rate on the temperature of the (α + β)→β-transformation of titanium alloys. Met. Sci. Heat Treat. 1985, 27, 43–48. [Google Scholar] [CrossRef]

© 2019 by the authors. Licensee MDPI, Basel, Switzerland. This article is an open access article distributed under the terms and conditions of the Creative Commons Attribution (CC BY) license (http://creativecommons.org/licenses/by/4.0/).