Ultrasonic Vibration as a Primary Mixing Tool in Accelerating Aluminum–Copper Alloys Preparation from Their Pure Elements


Abstract
1. Introduction
2. Materials and Methods
2.1. Materials
2.2. Expermintal Set-Up of Melt Processing
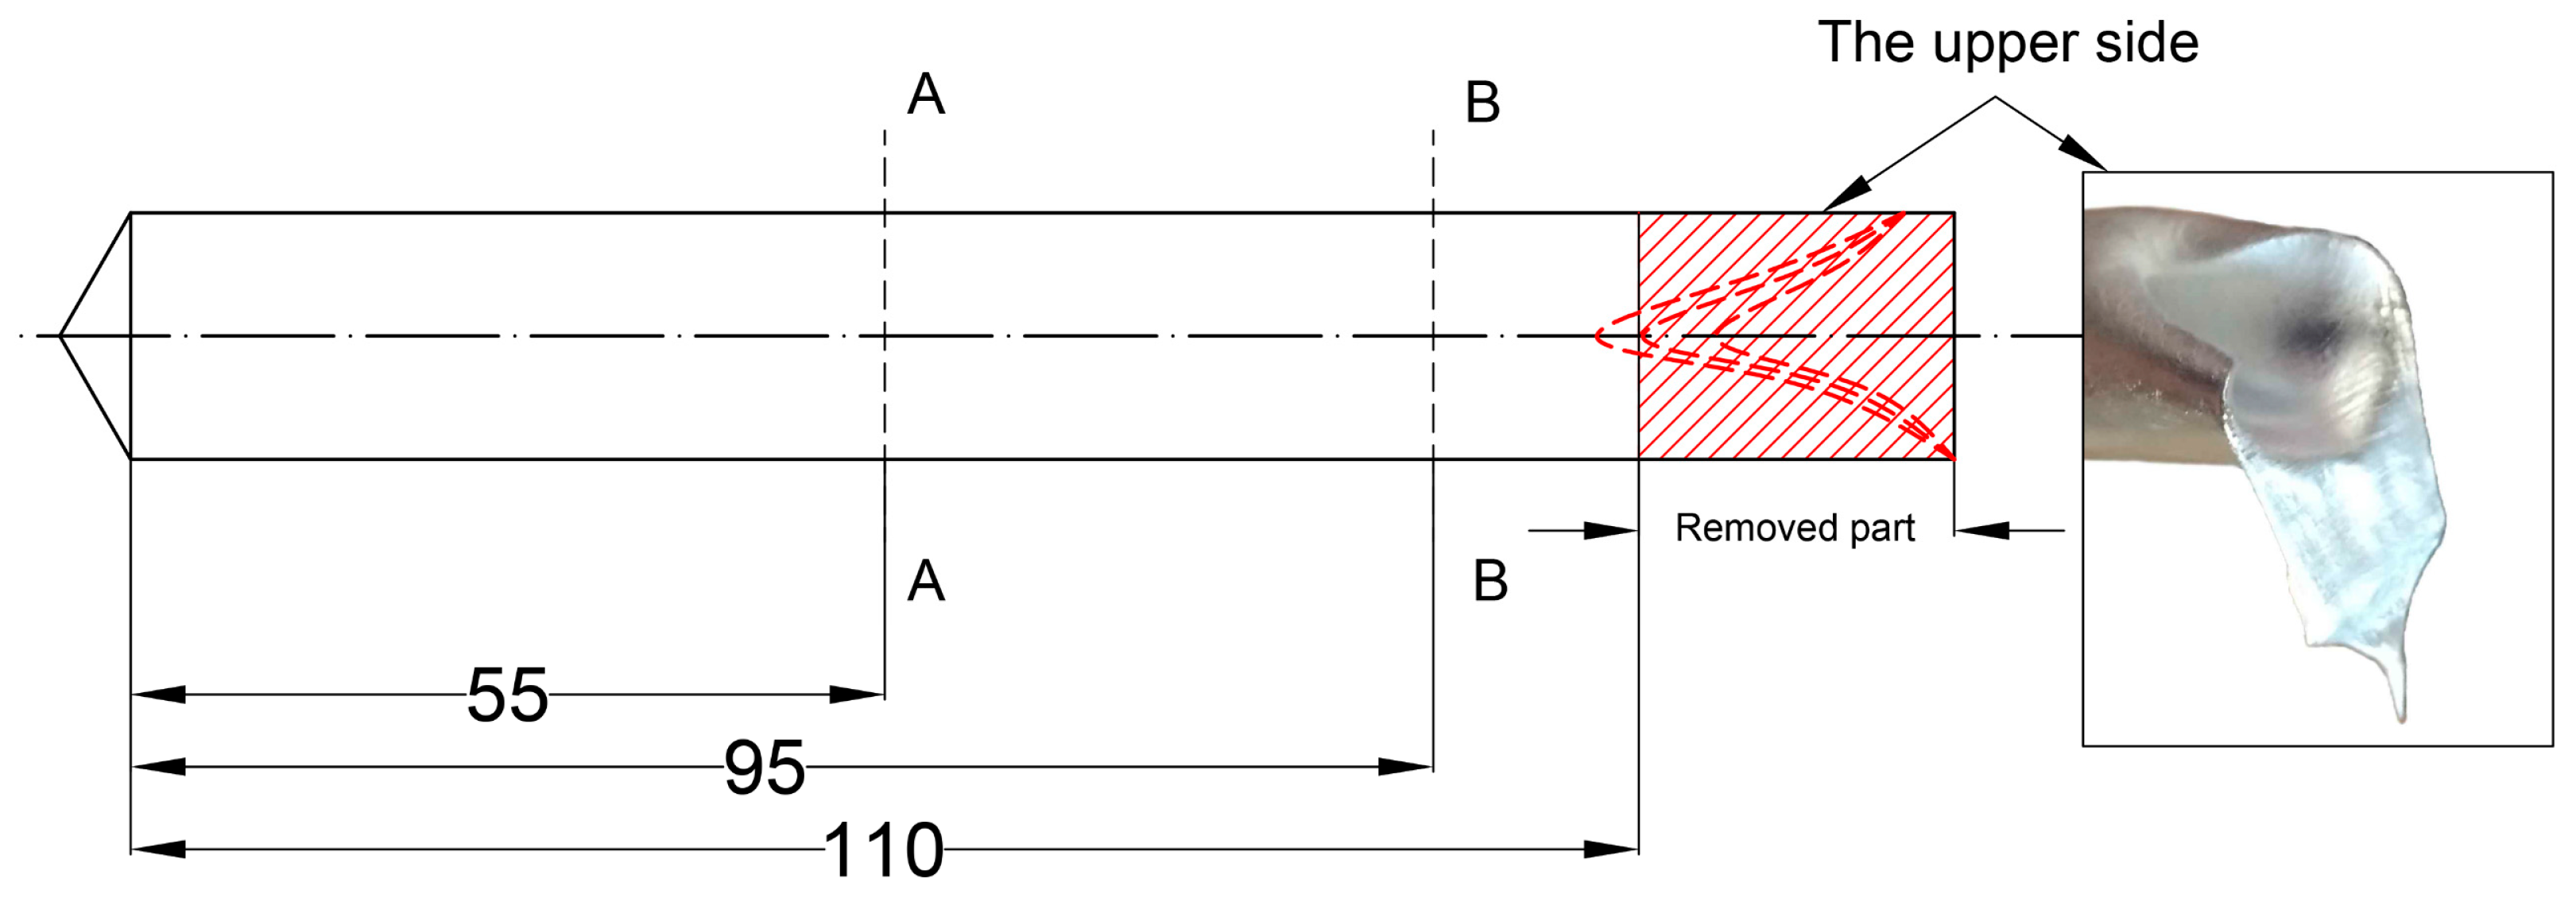
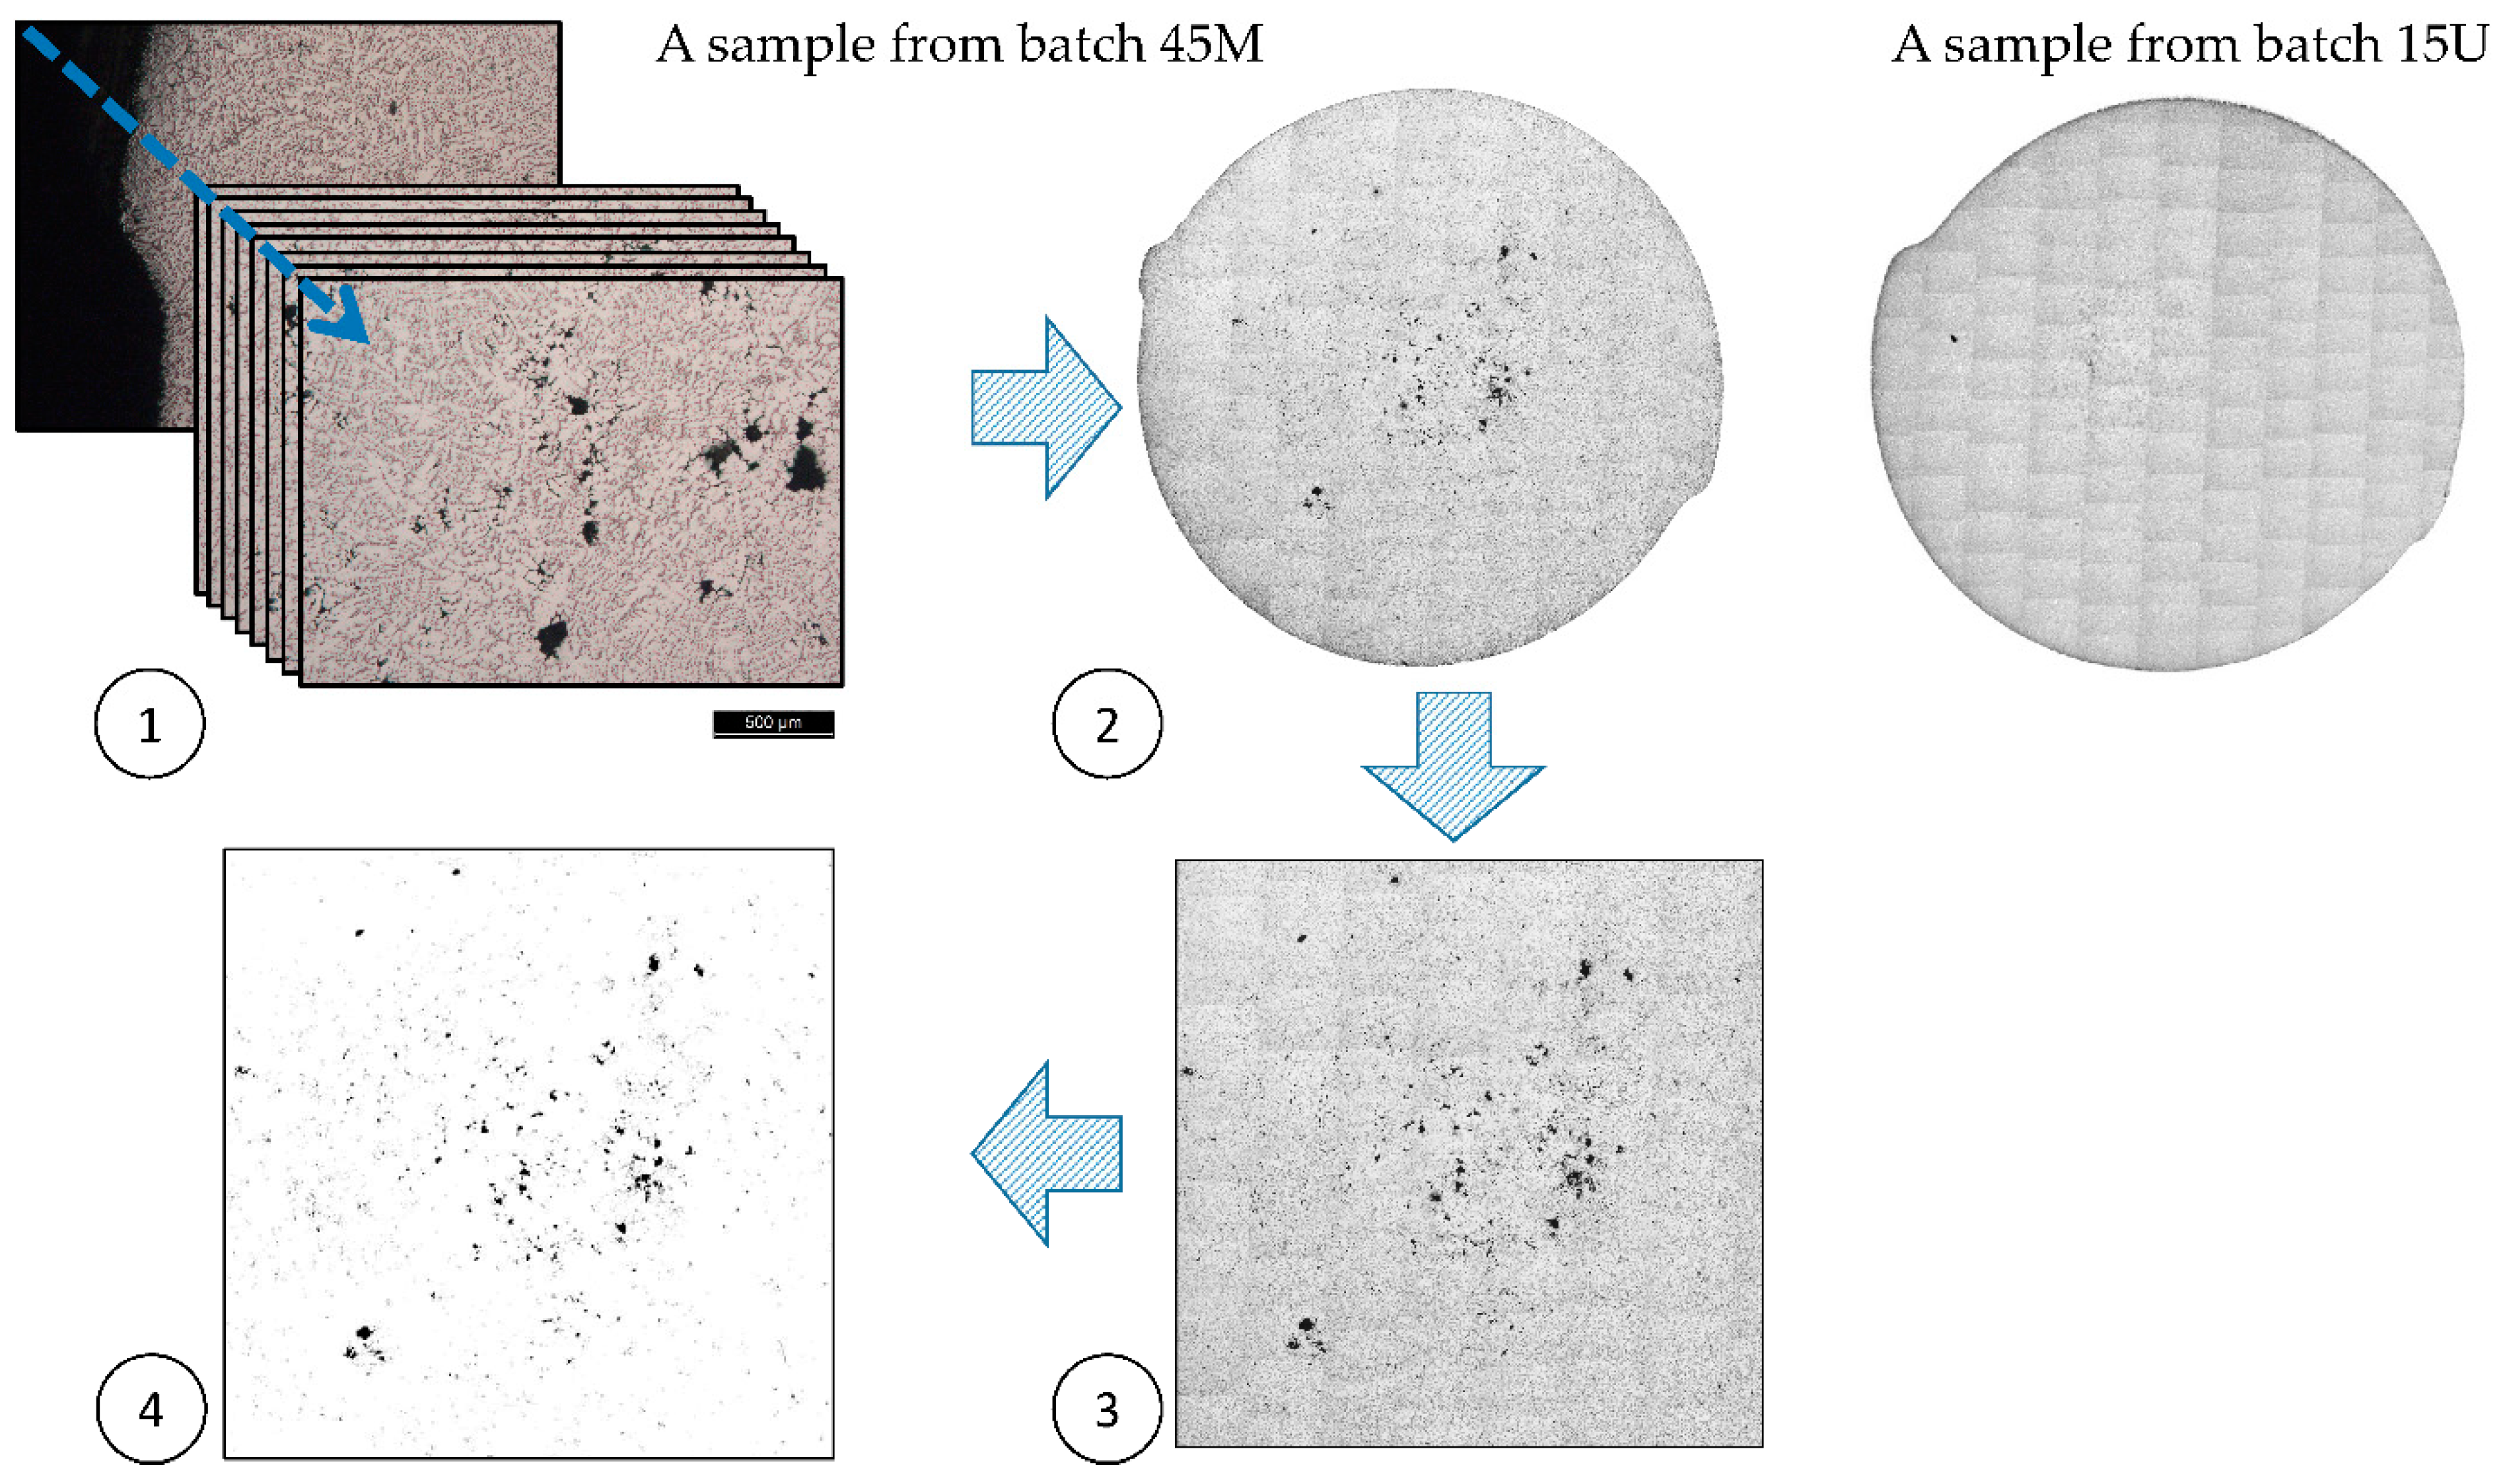
2.3. Microstructure, Impurities, and the Associated Porosity Characterization
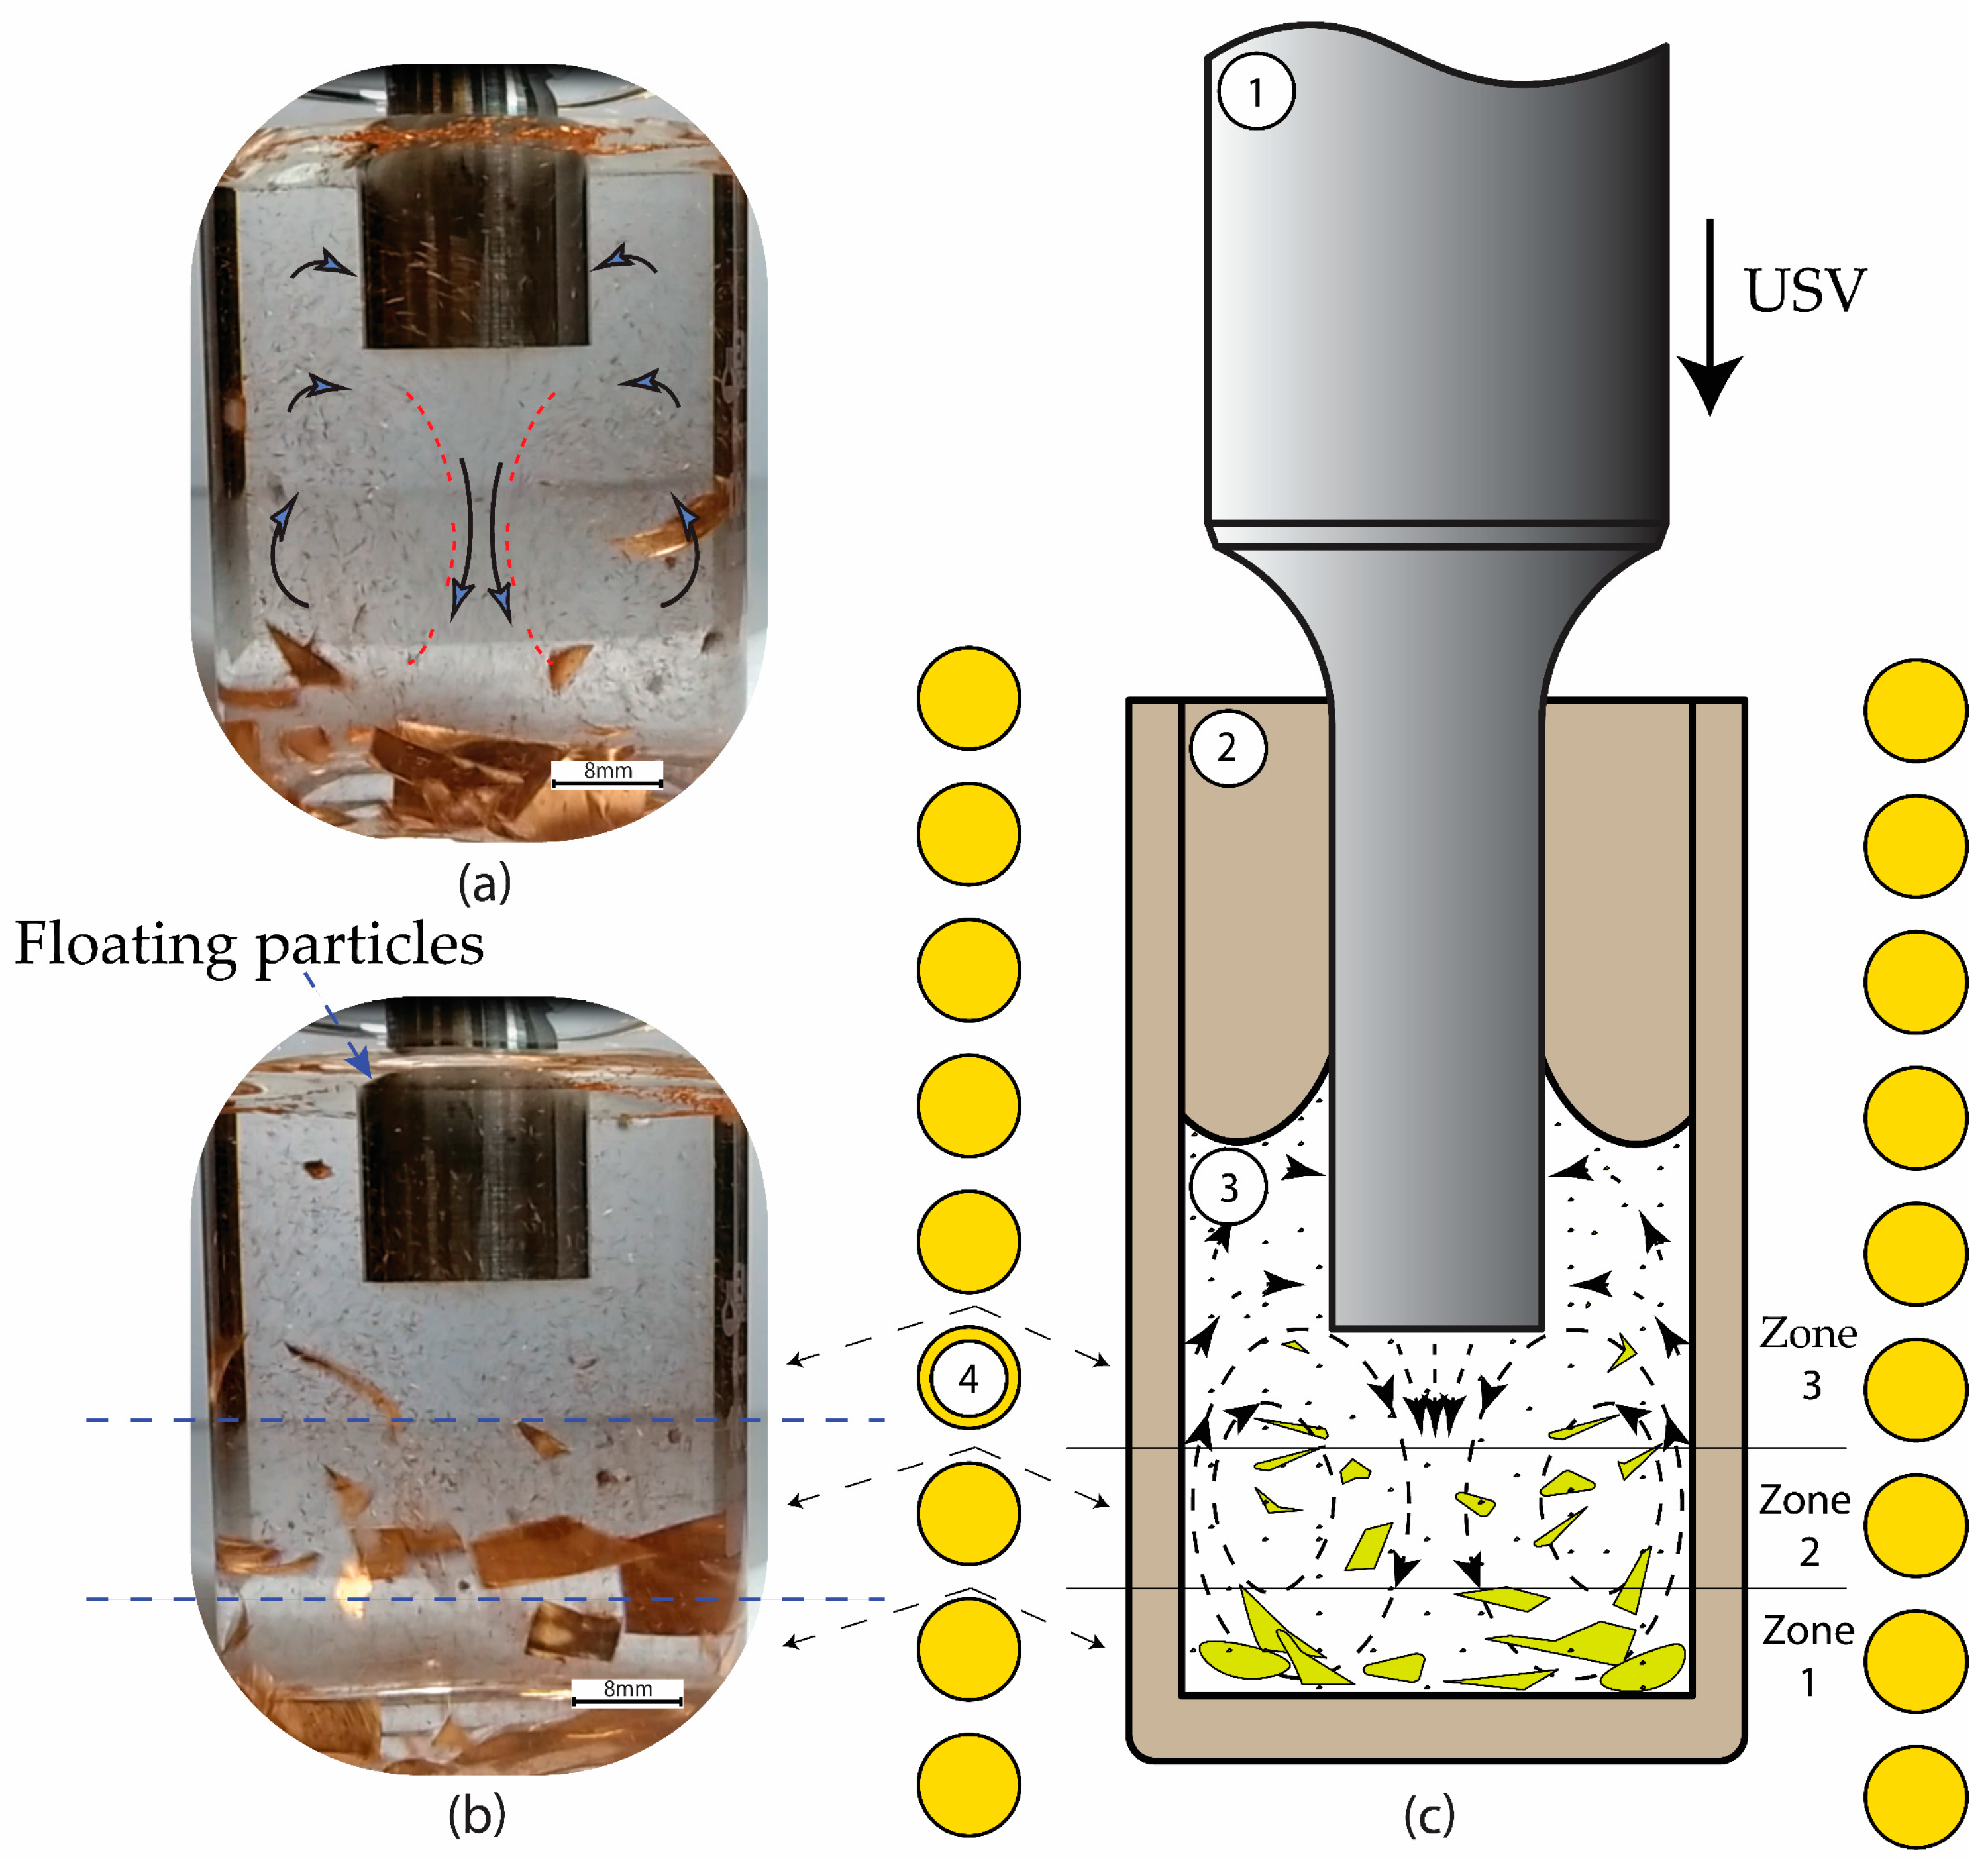
2.4. Expermintal Set-Up of USV in Water
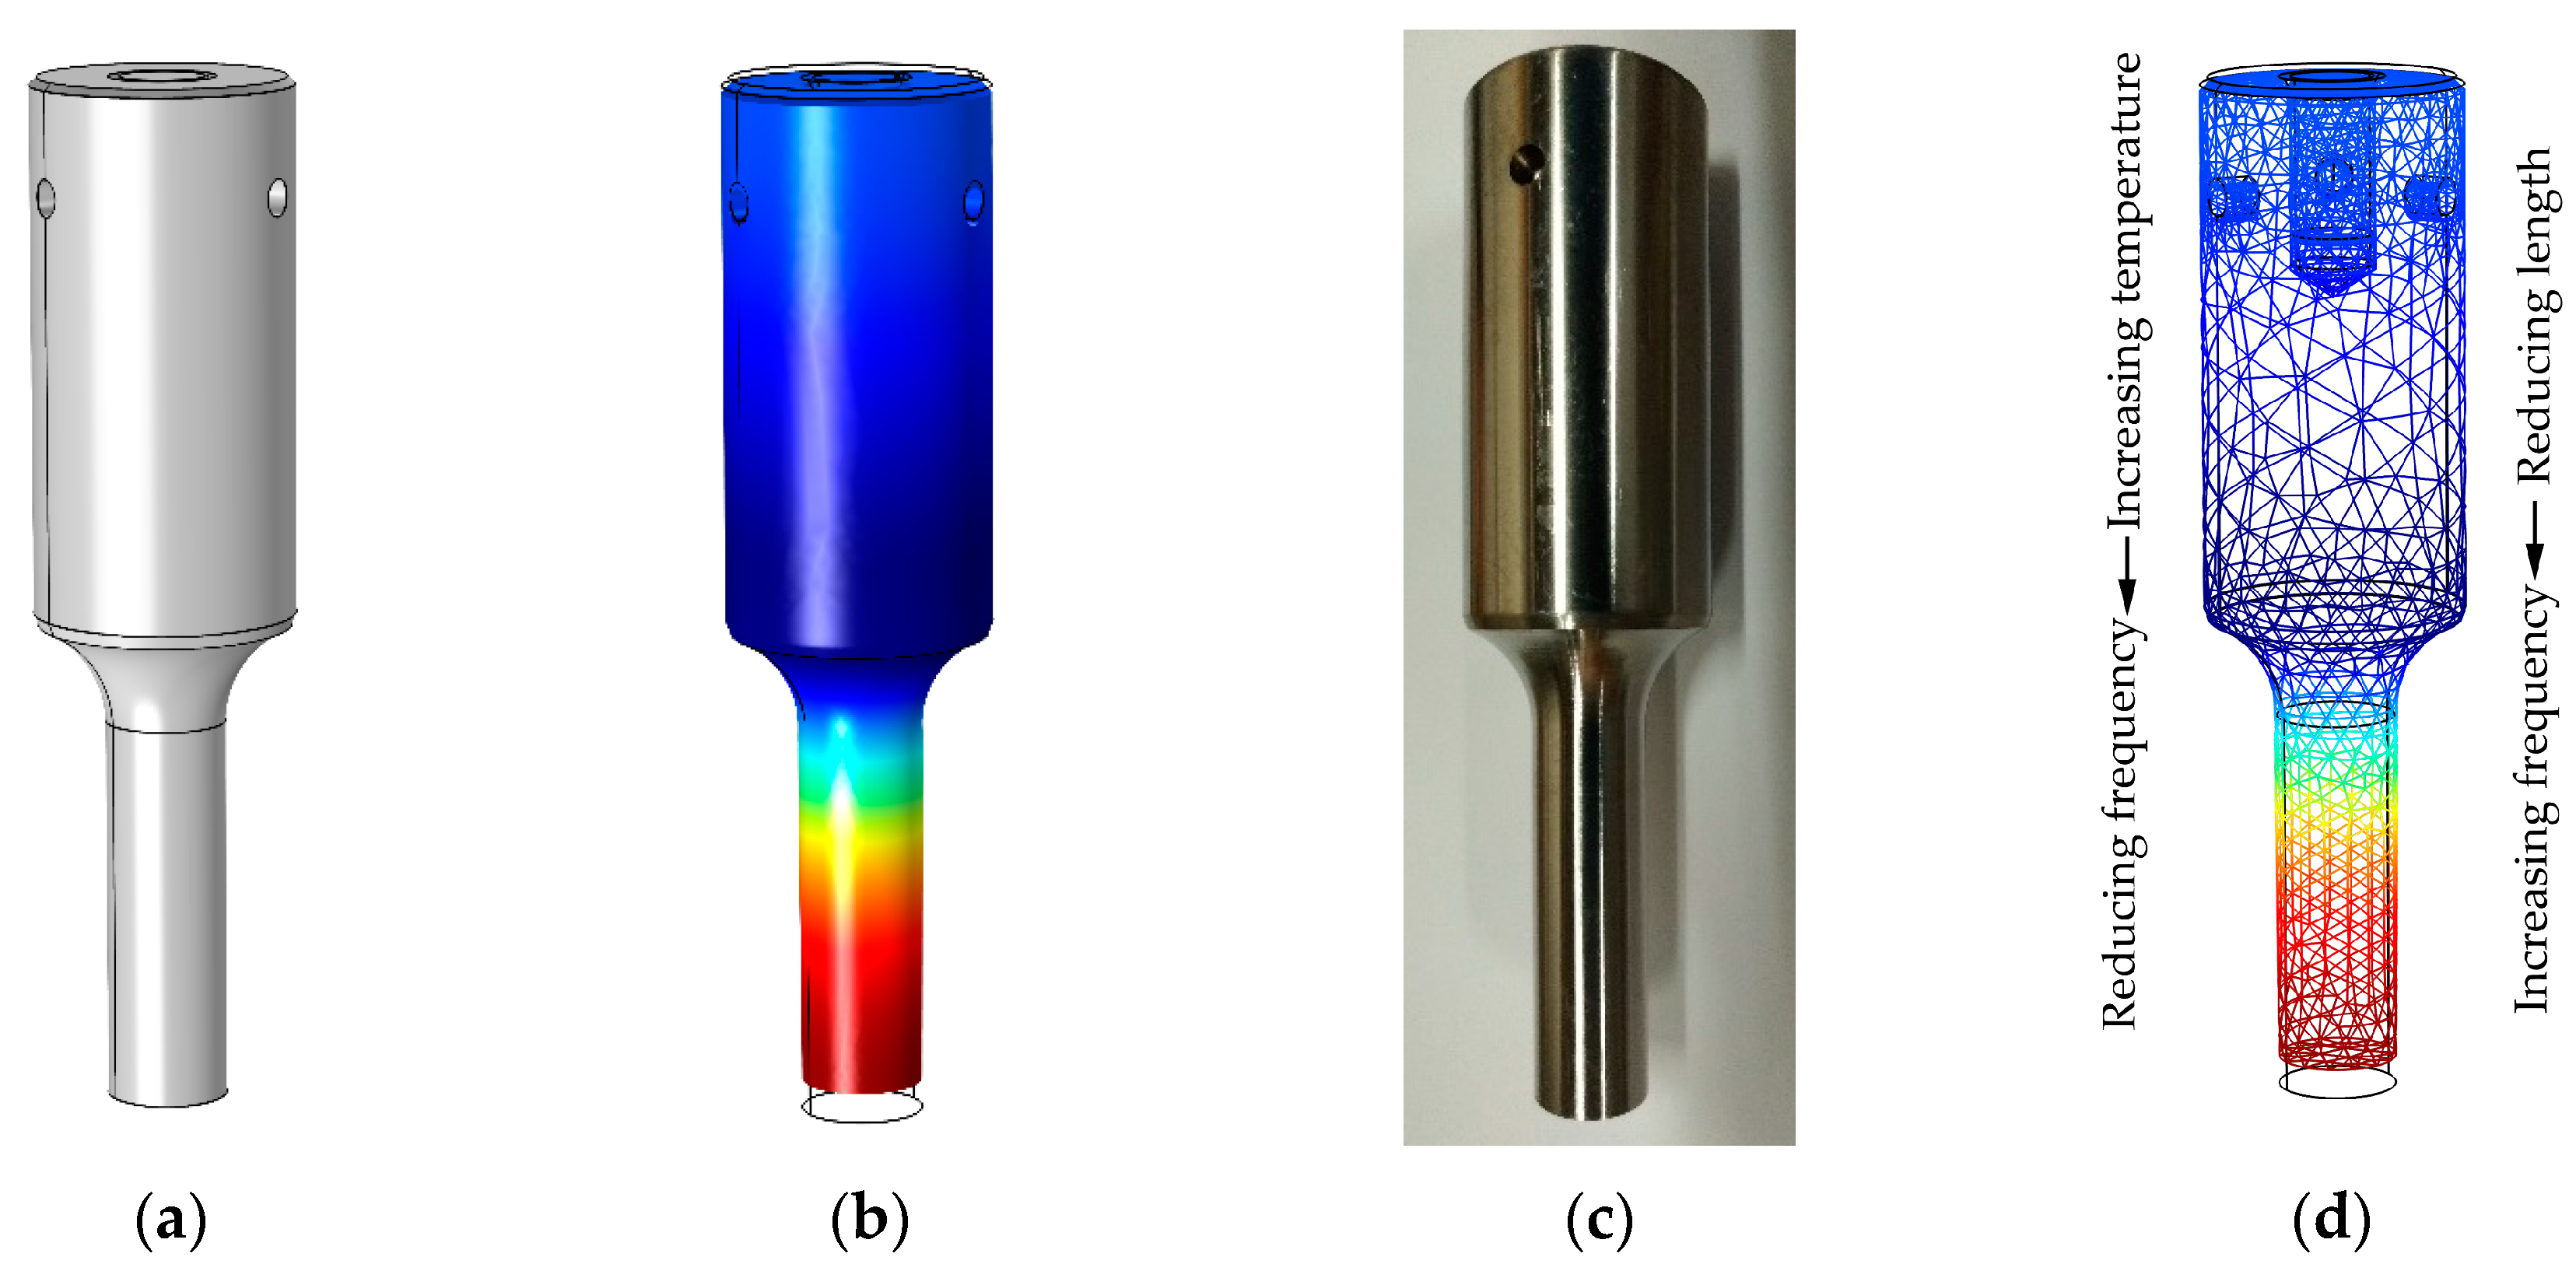
2.5. FE Optimization of the Sonotrode
3. Results and Discussion
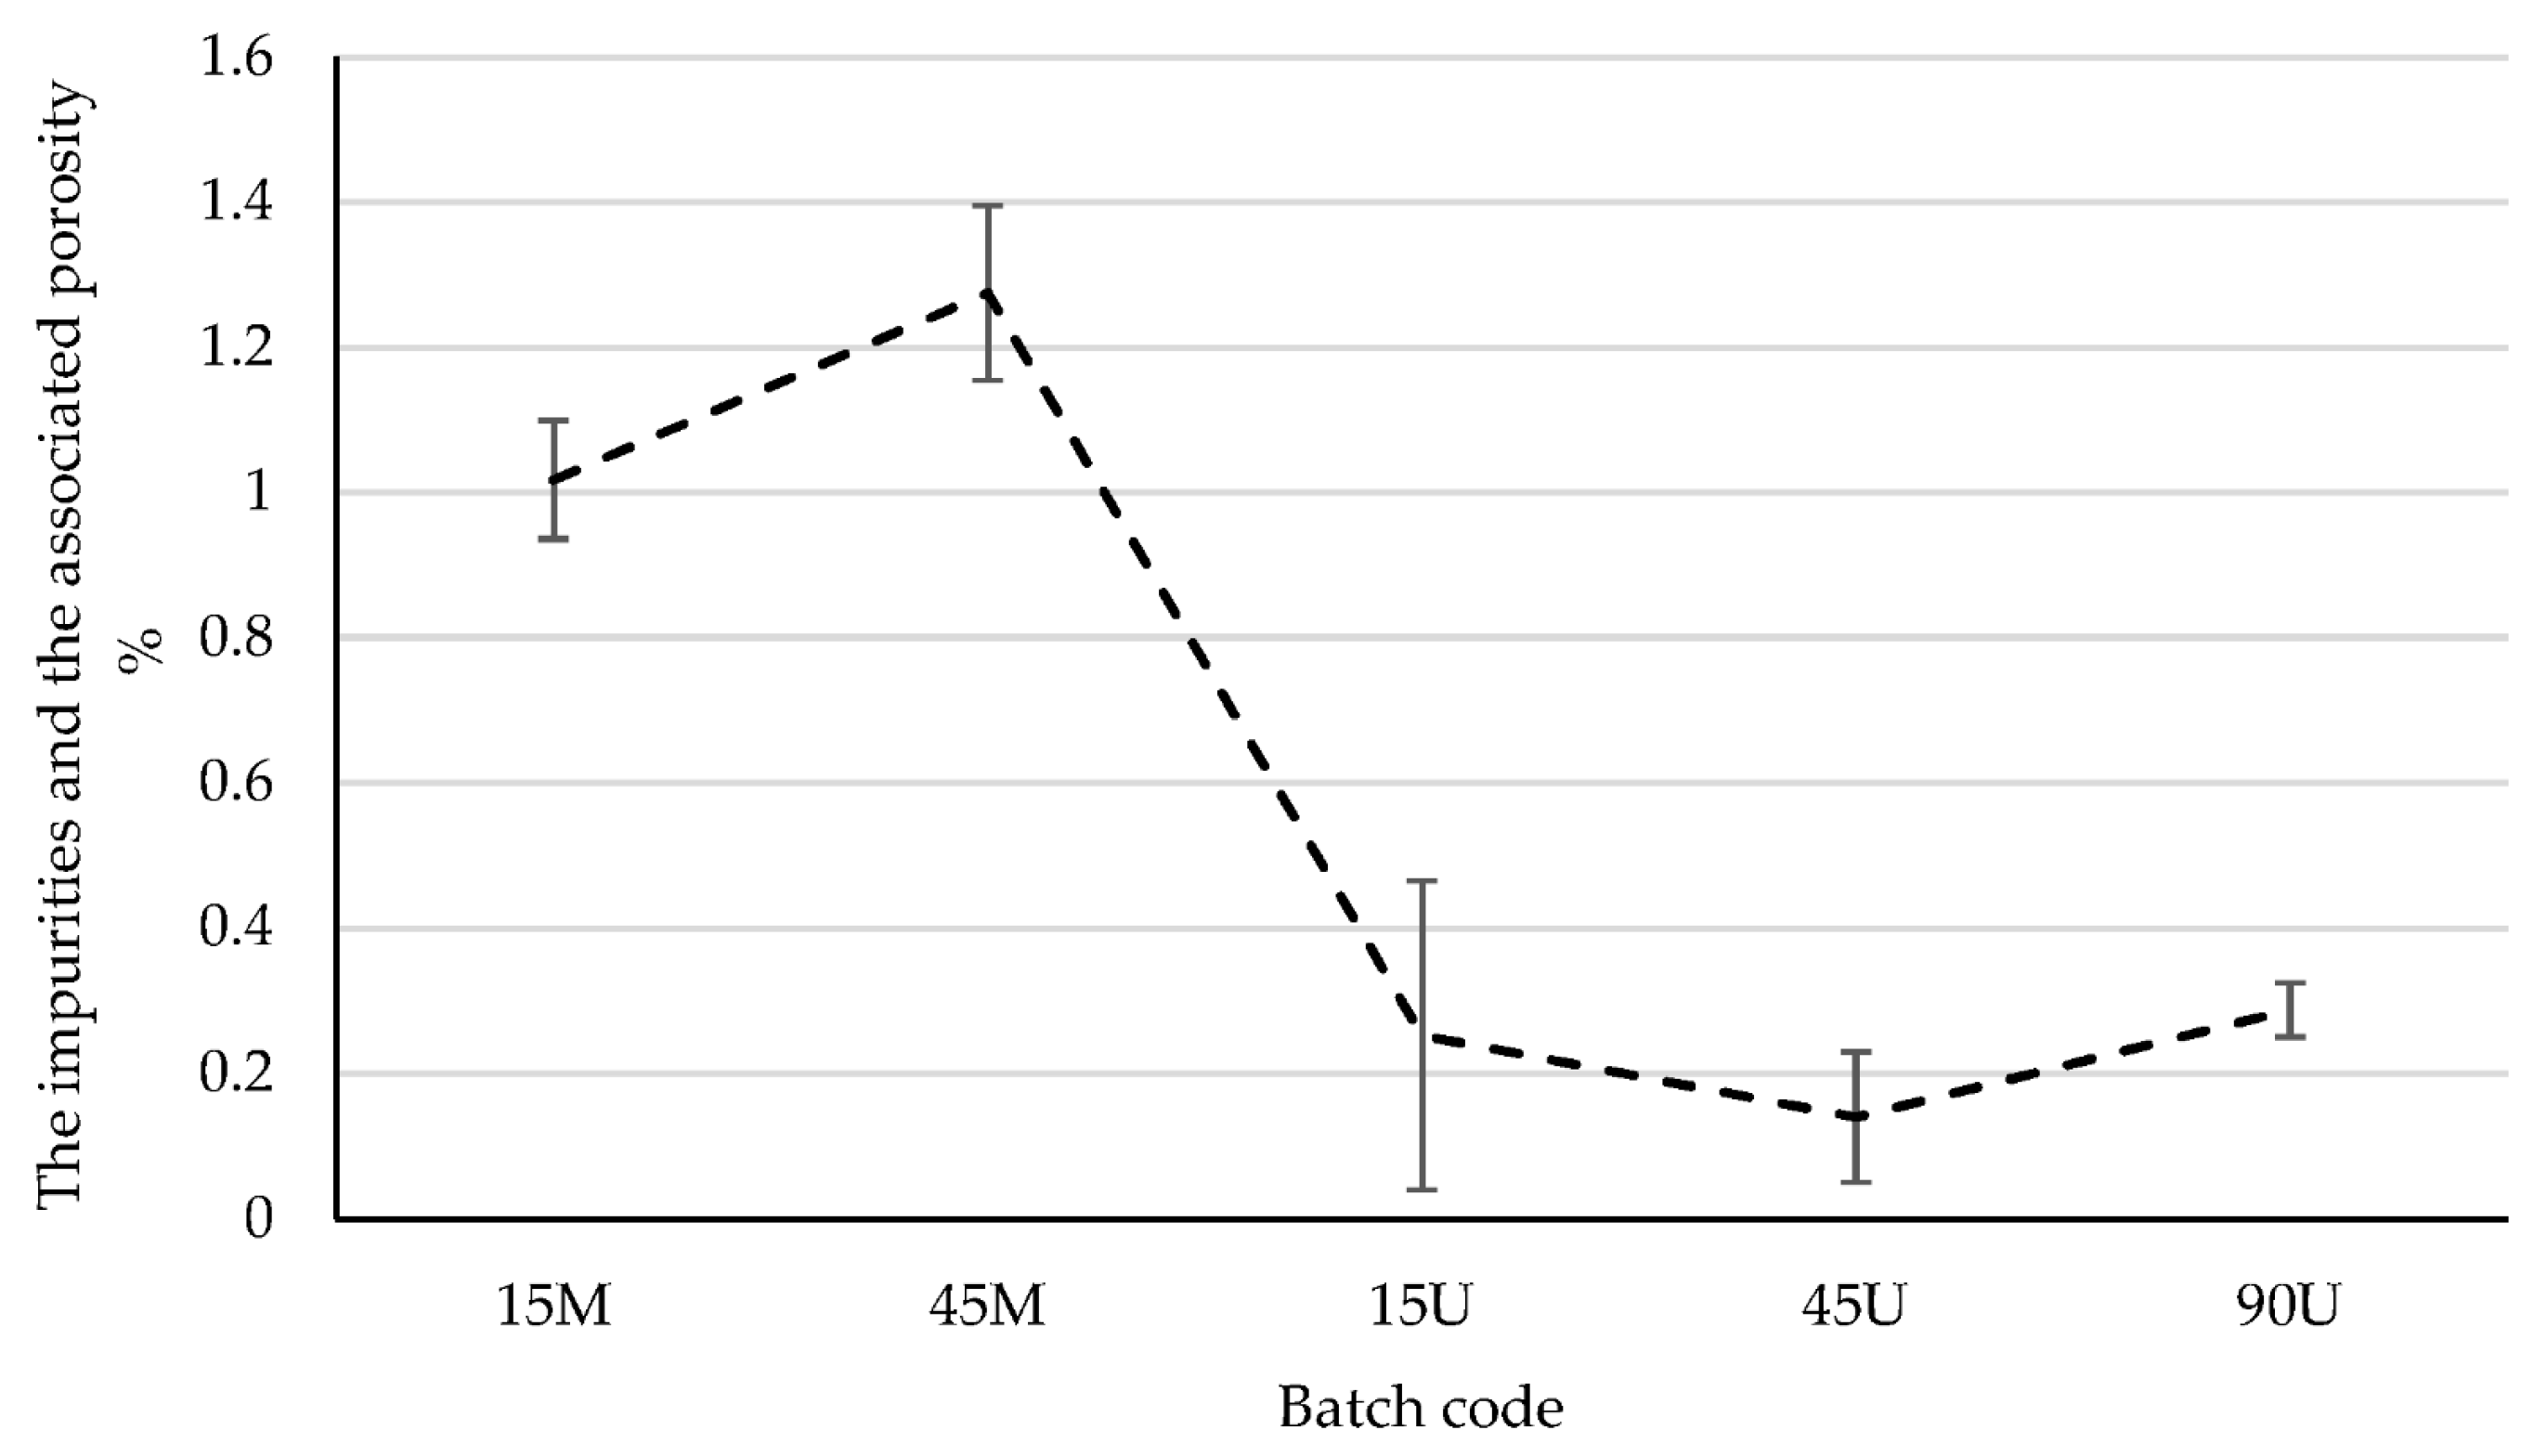
3.1. The Impurities and the Associated Surface Porosity Content
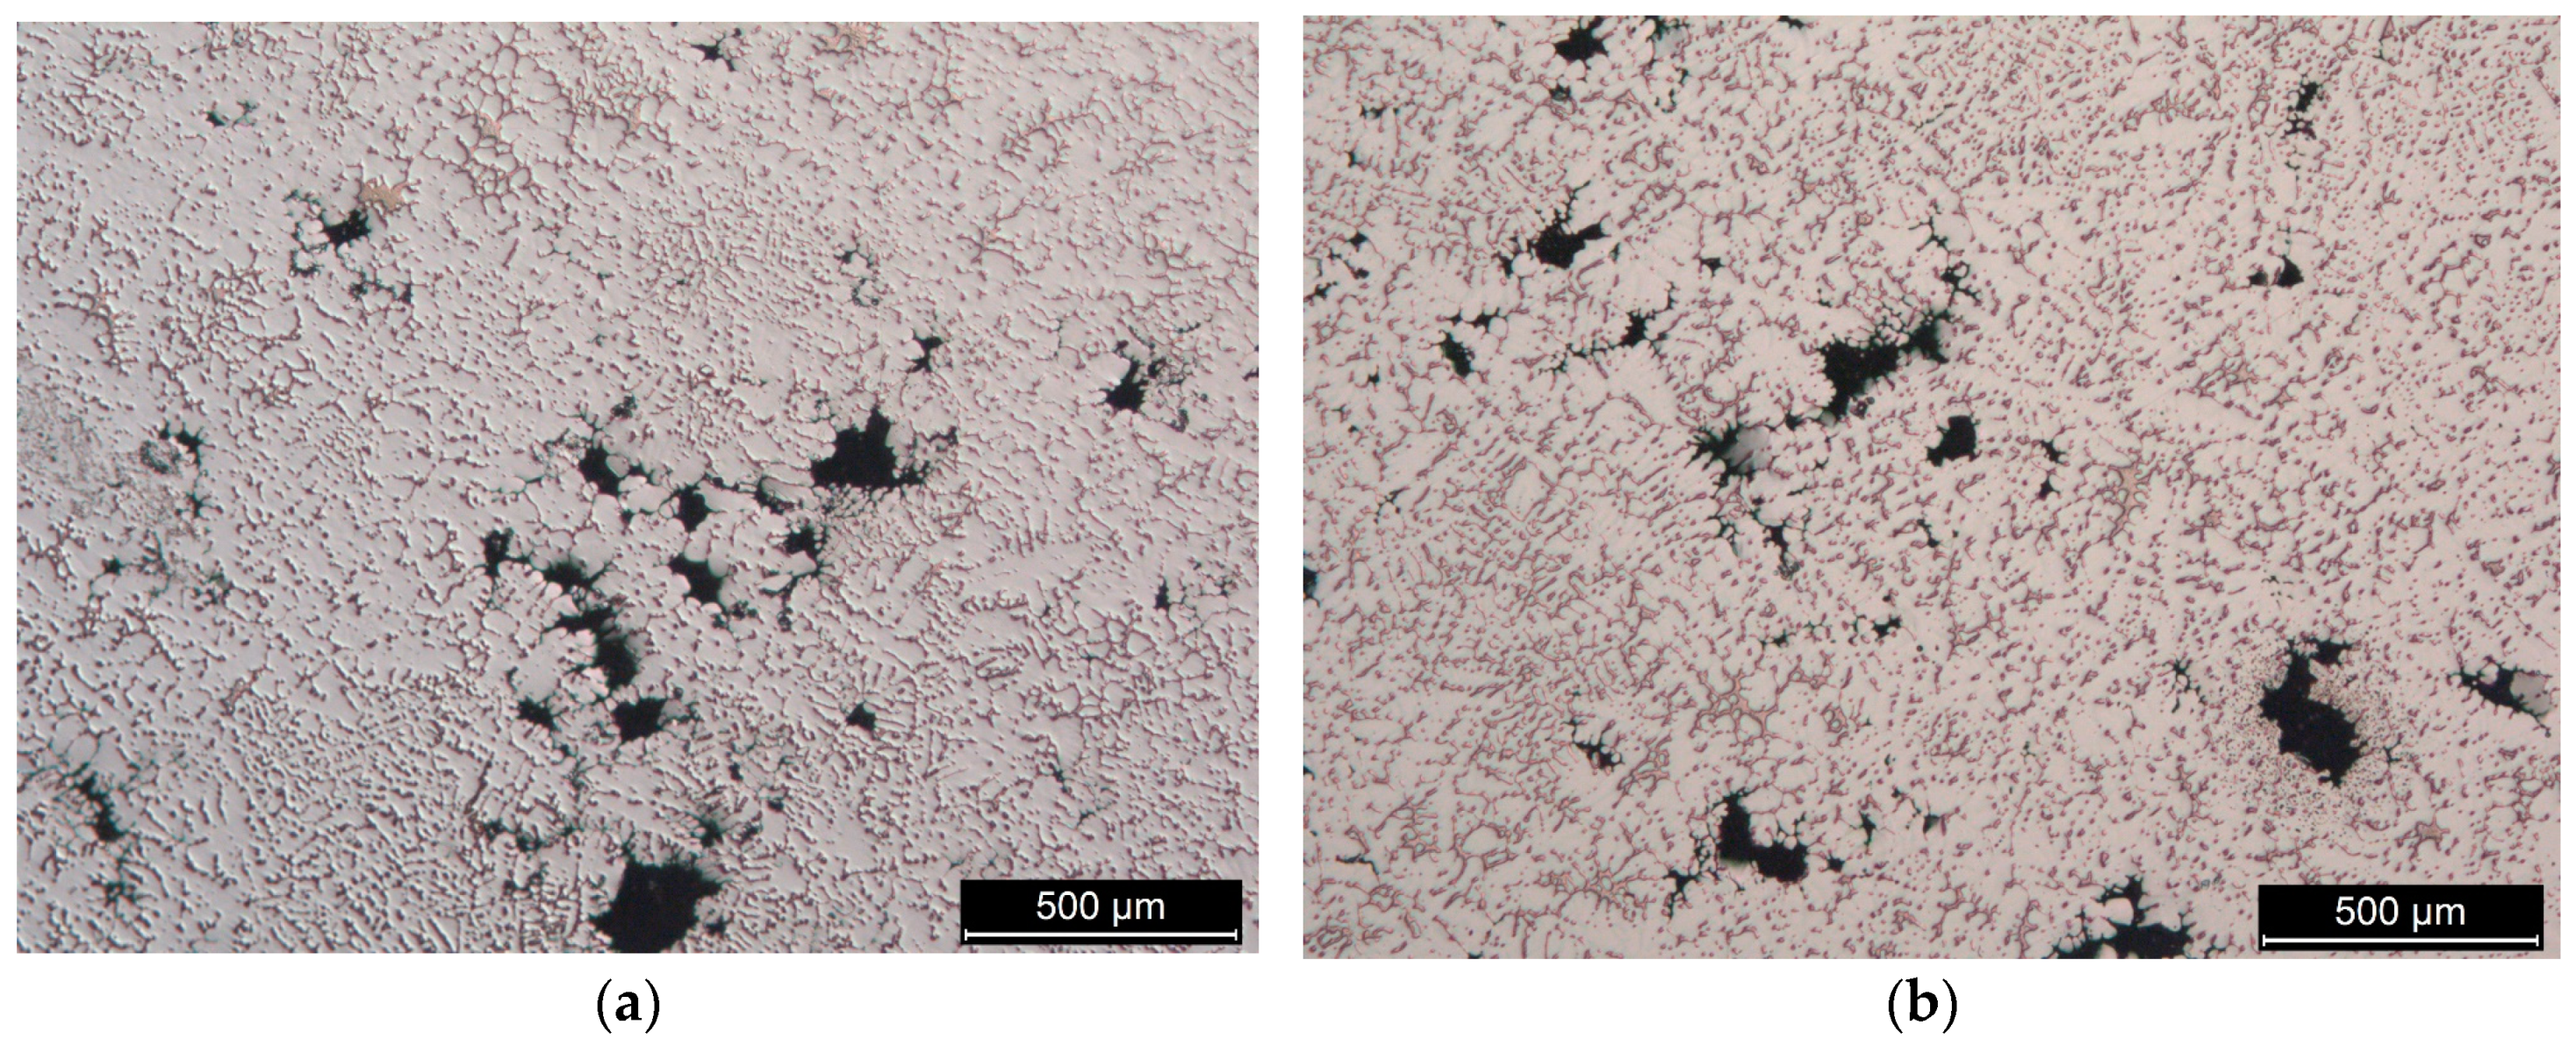
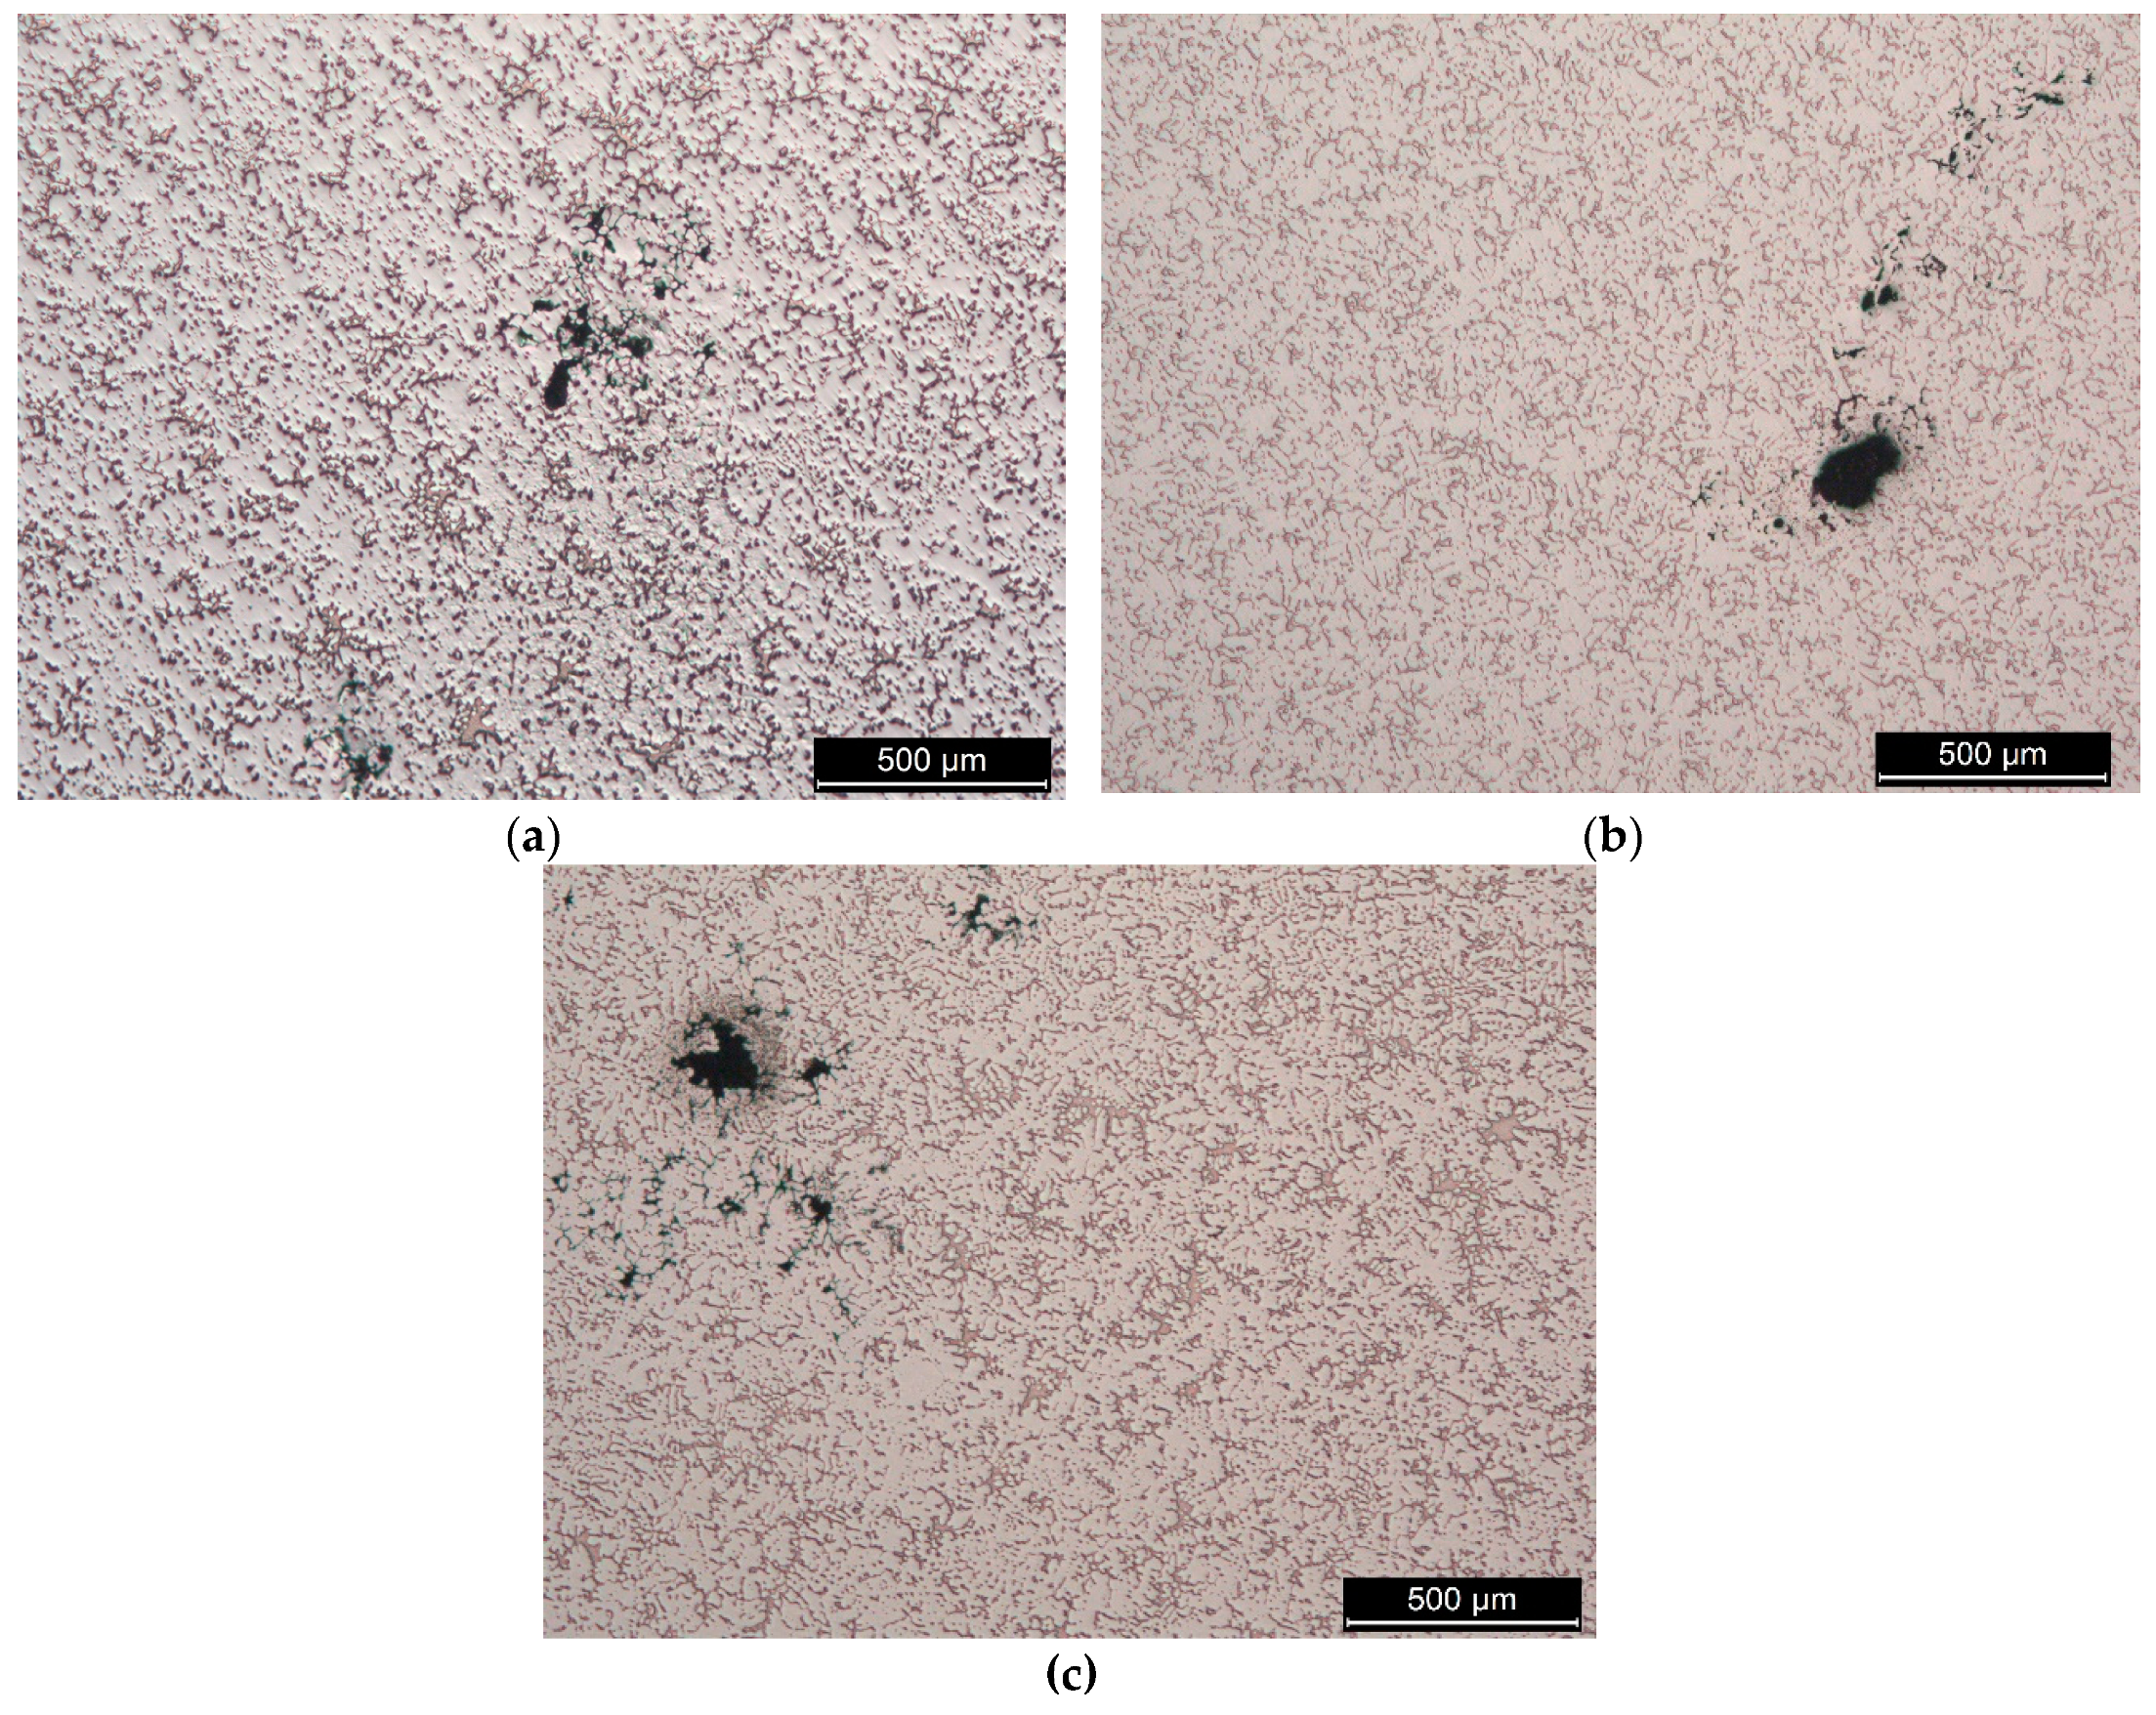
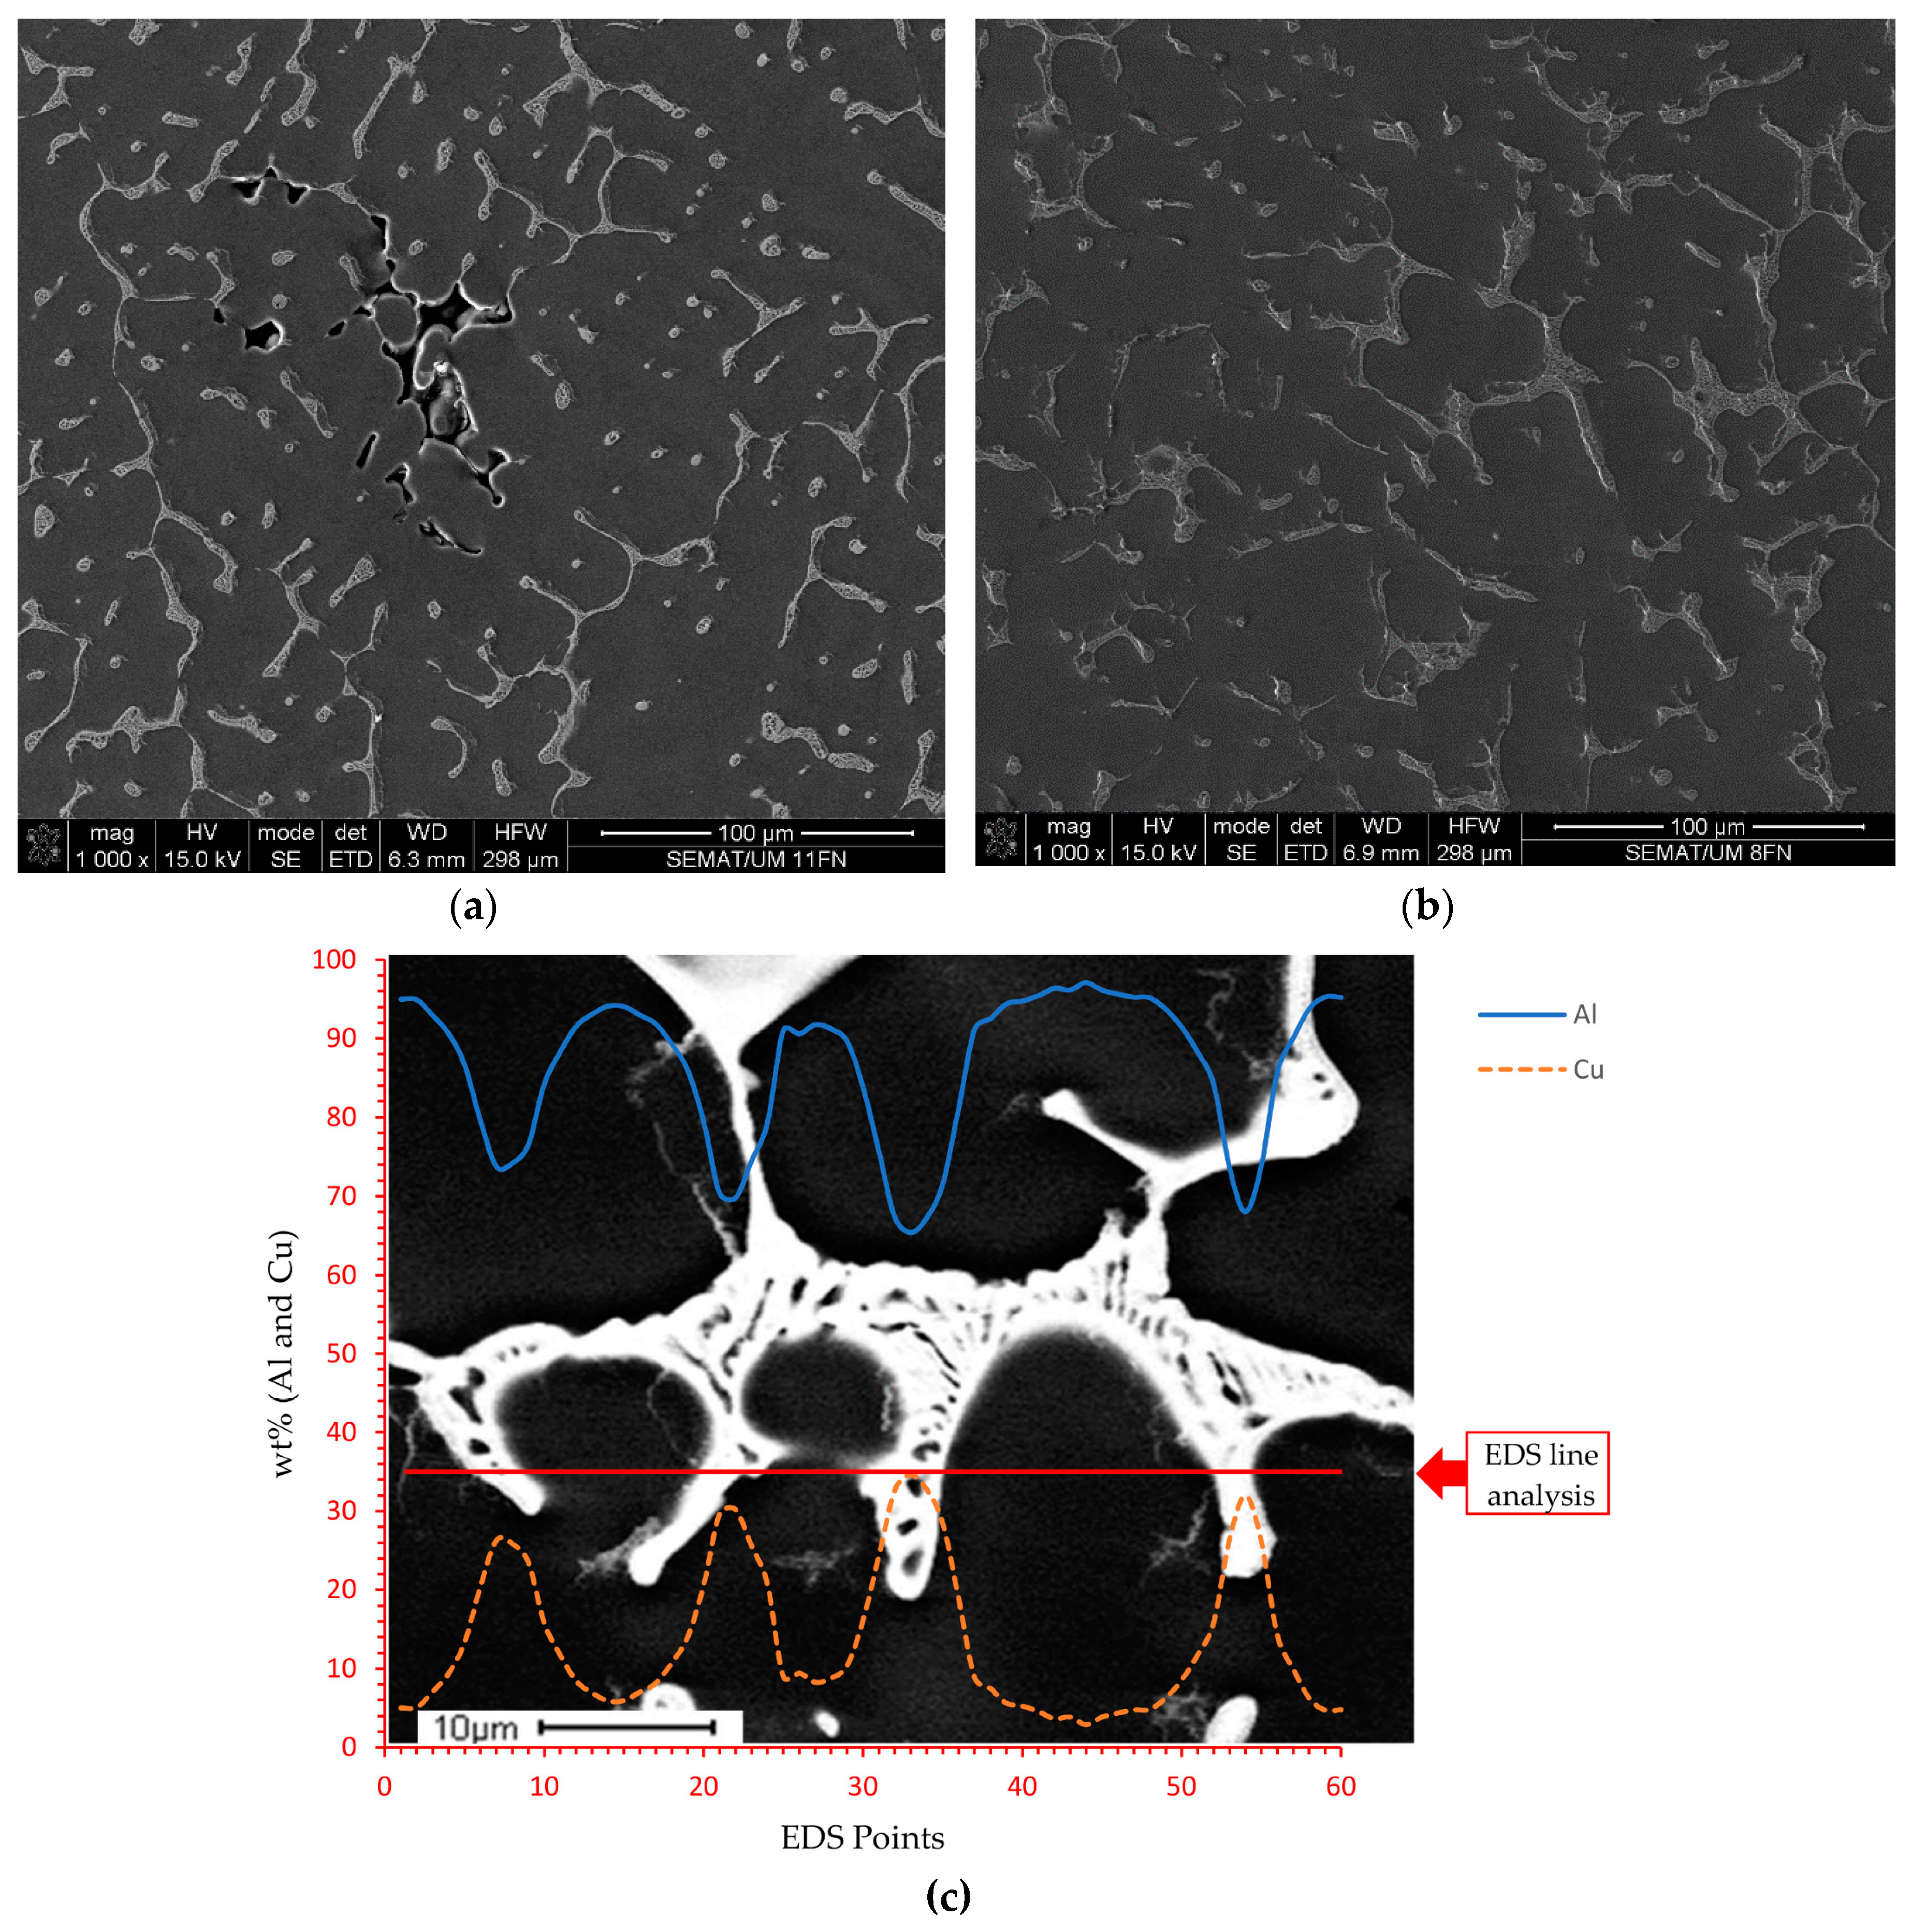
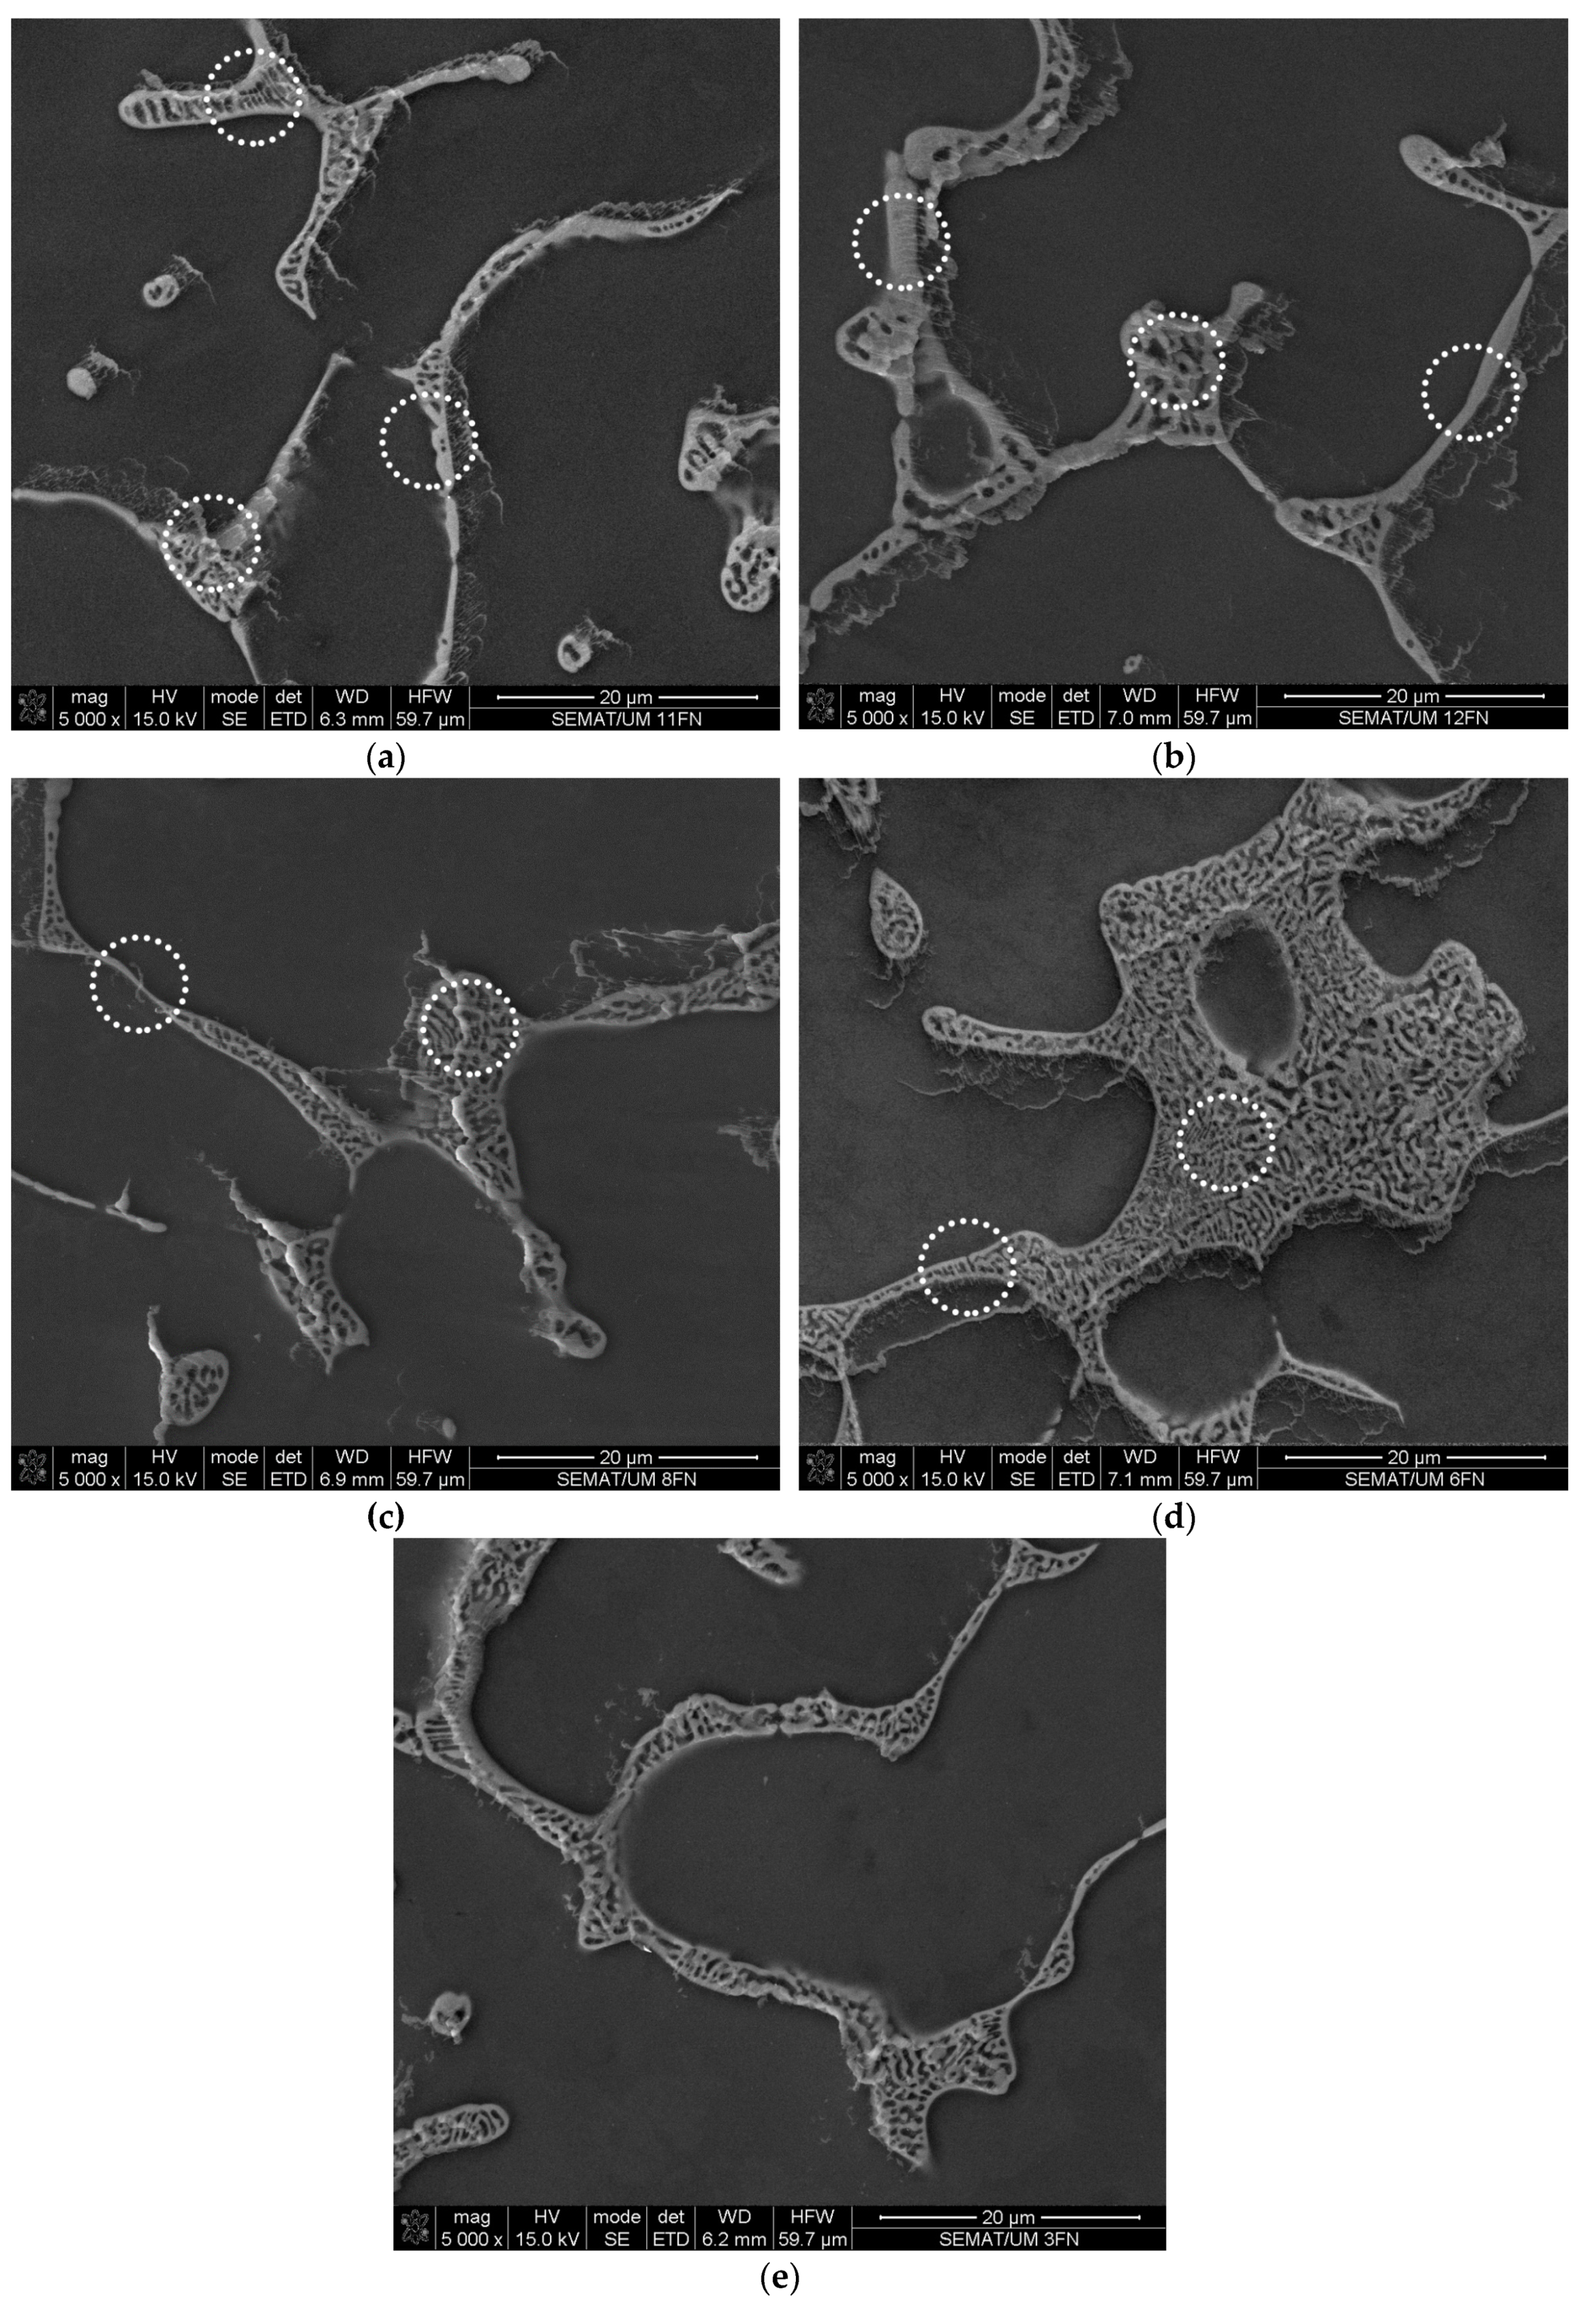
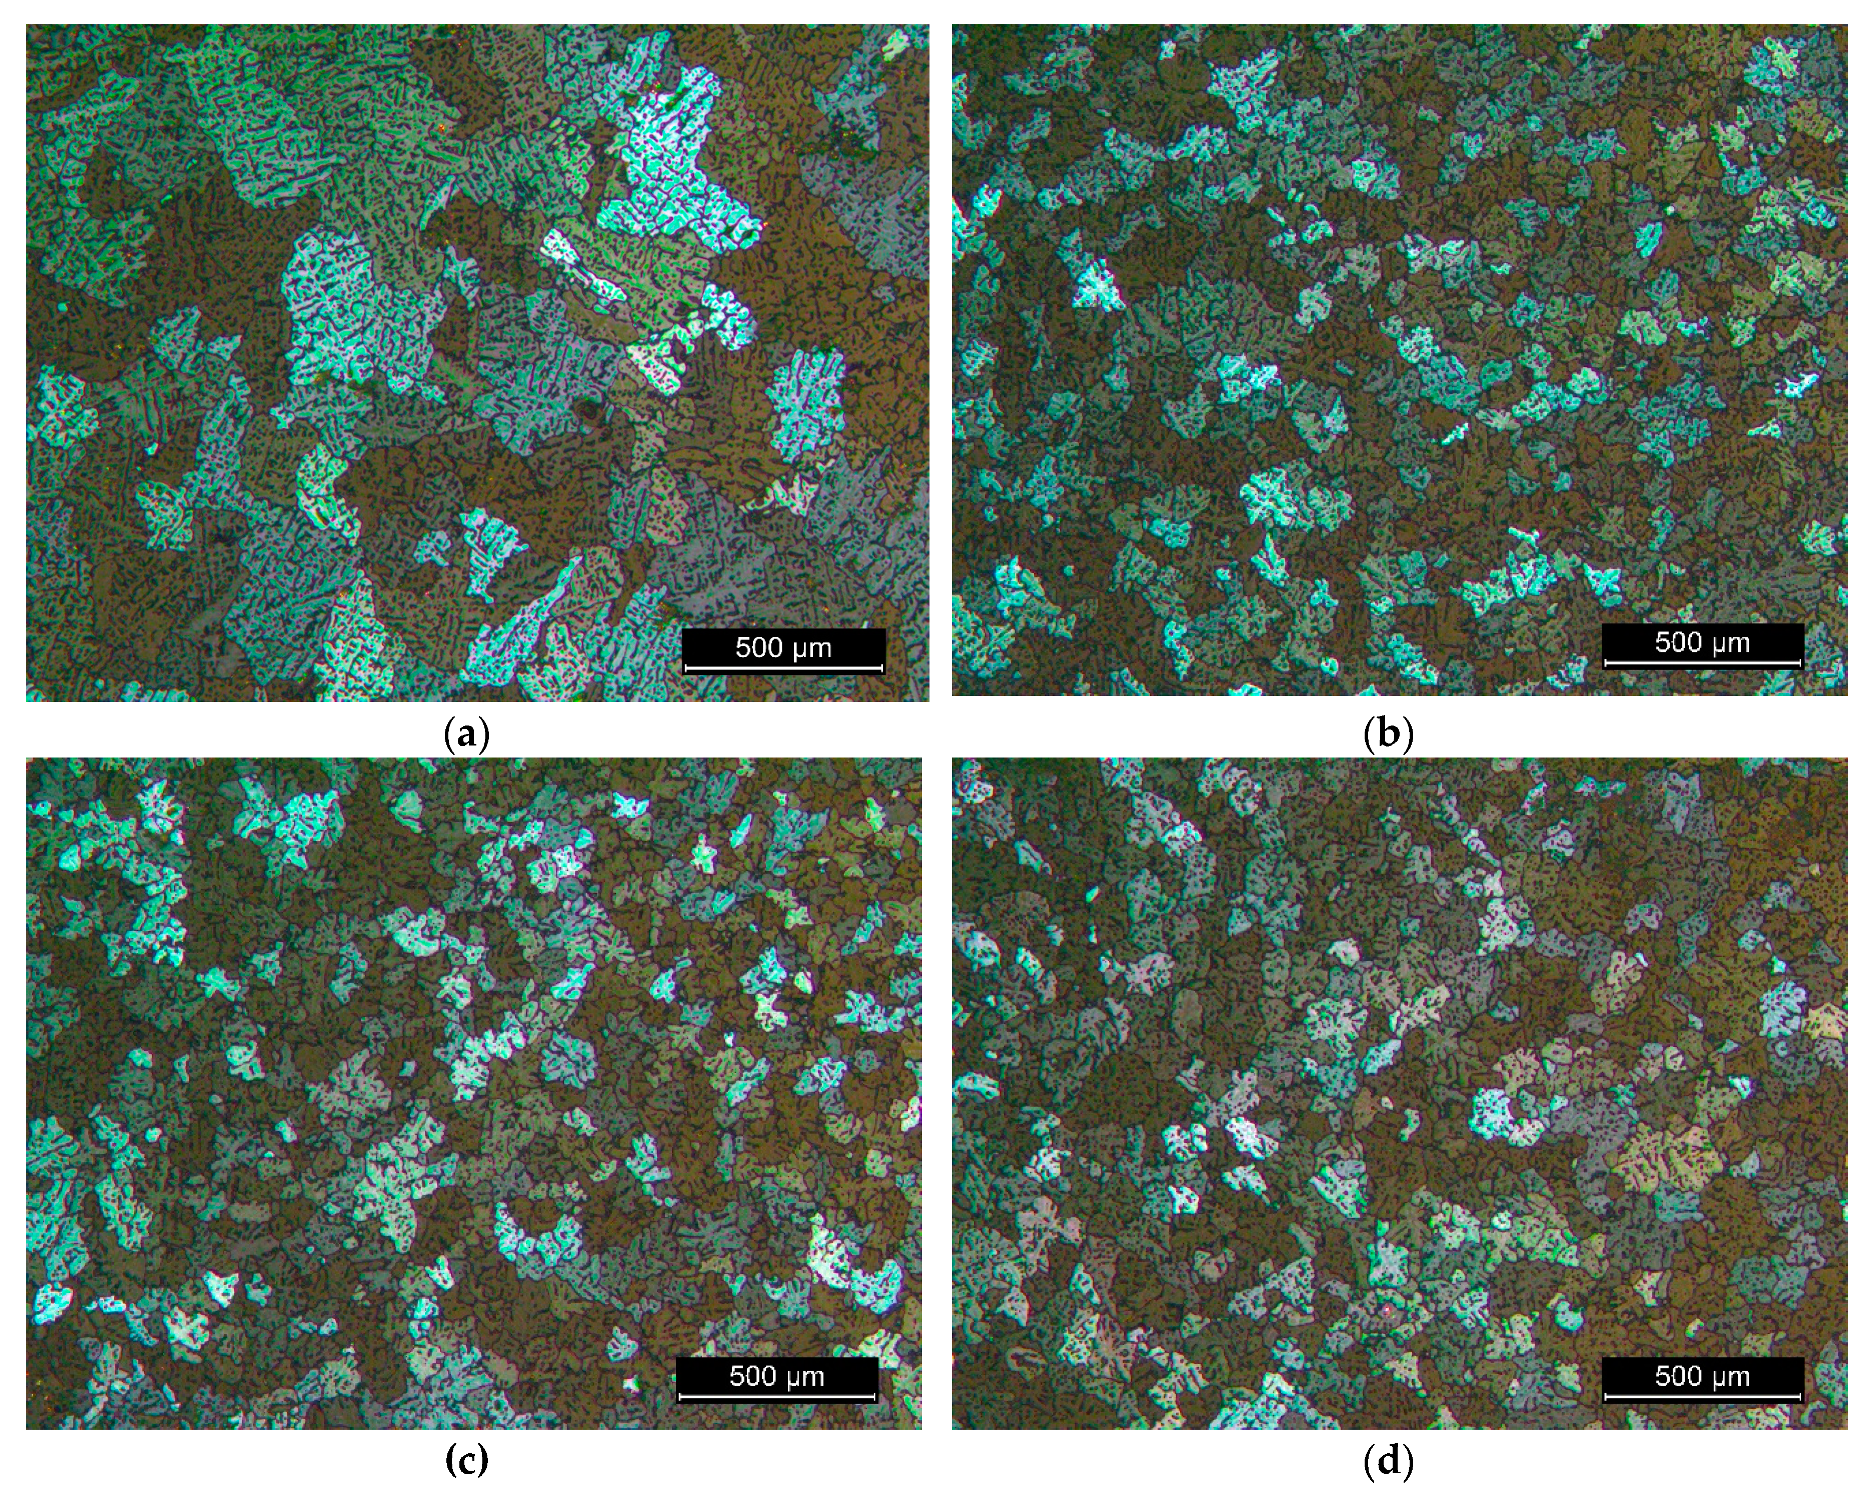
3.2. The Microstructure of the Produced Alloys
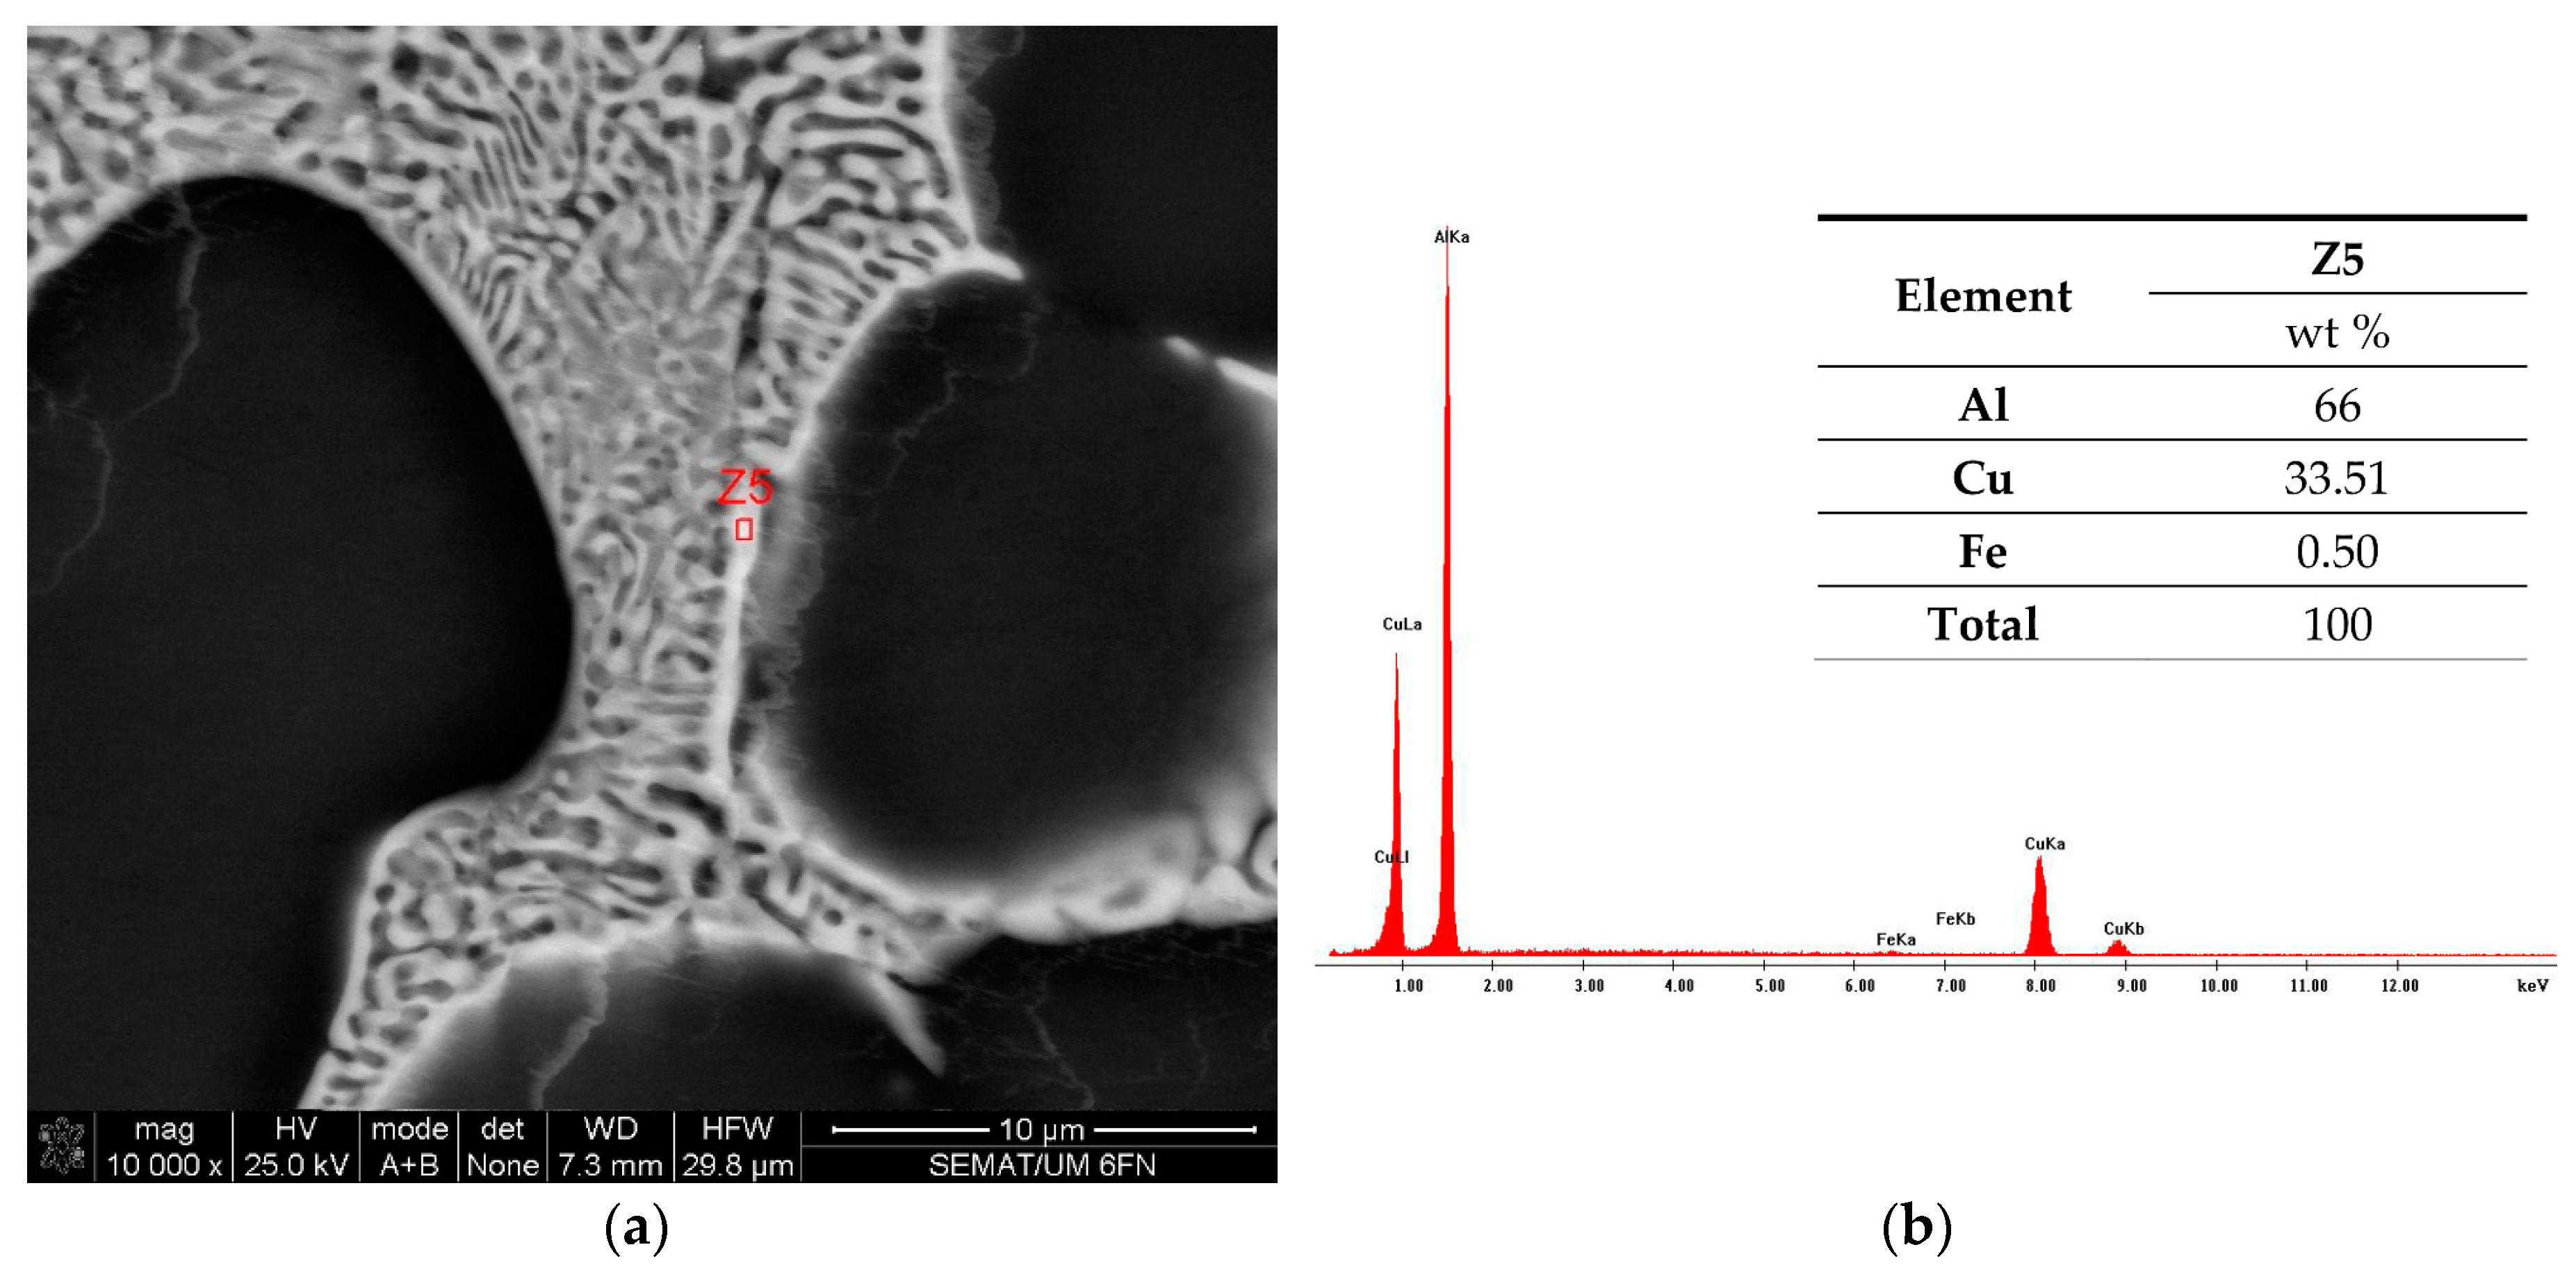
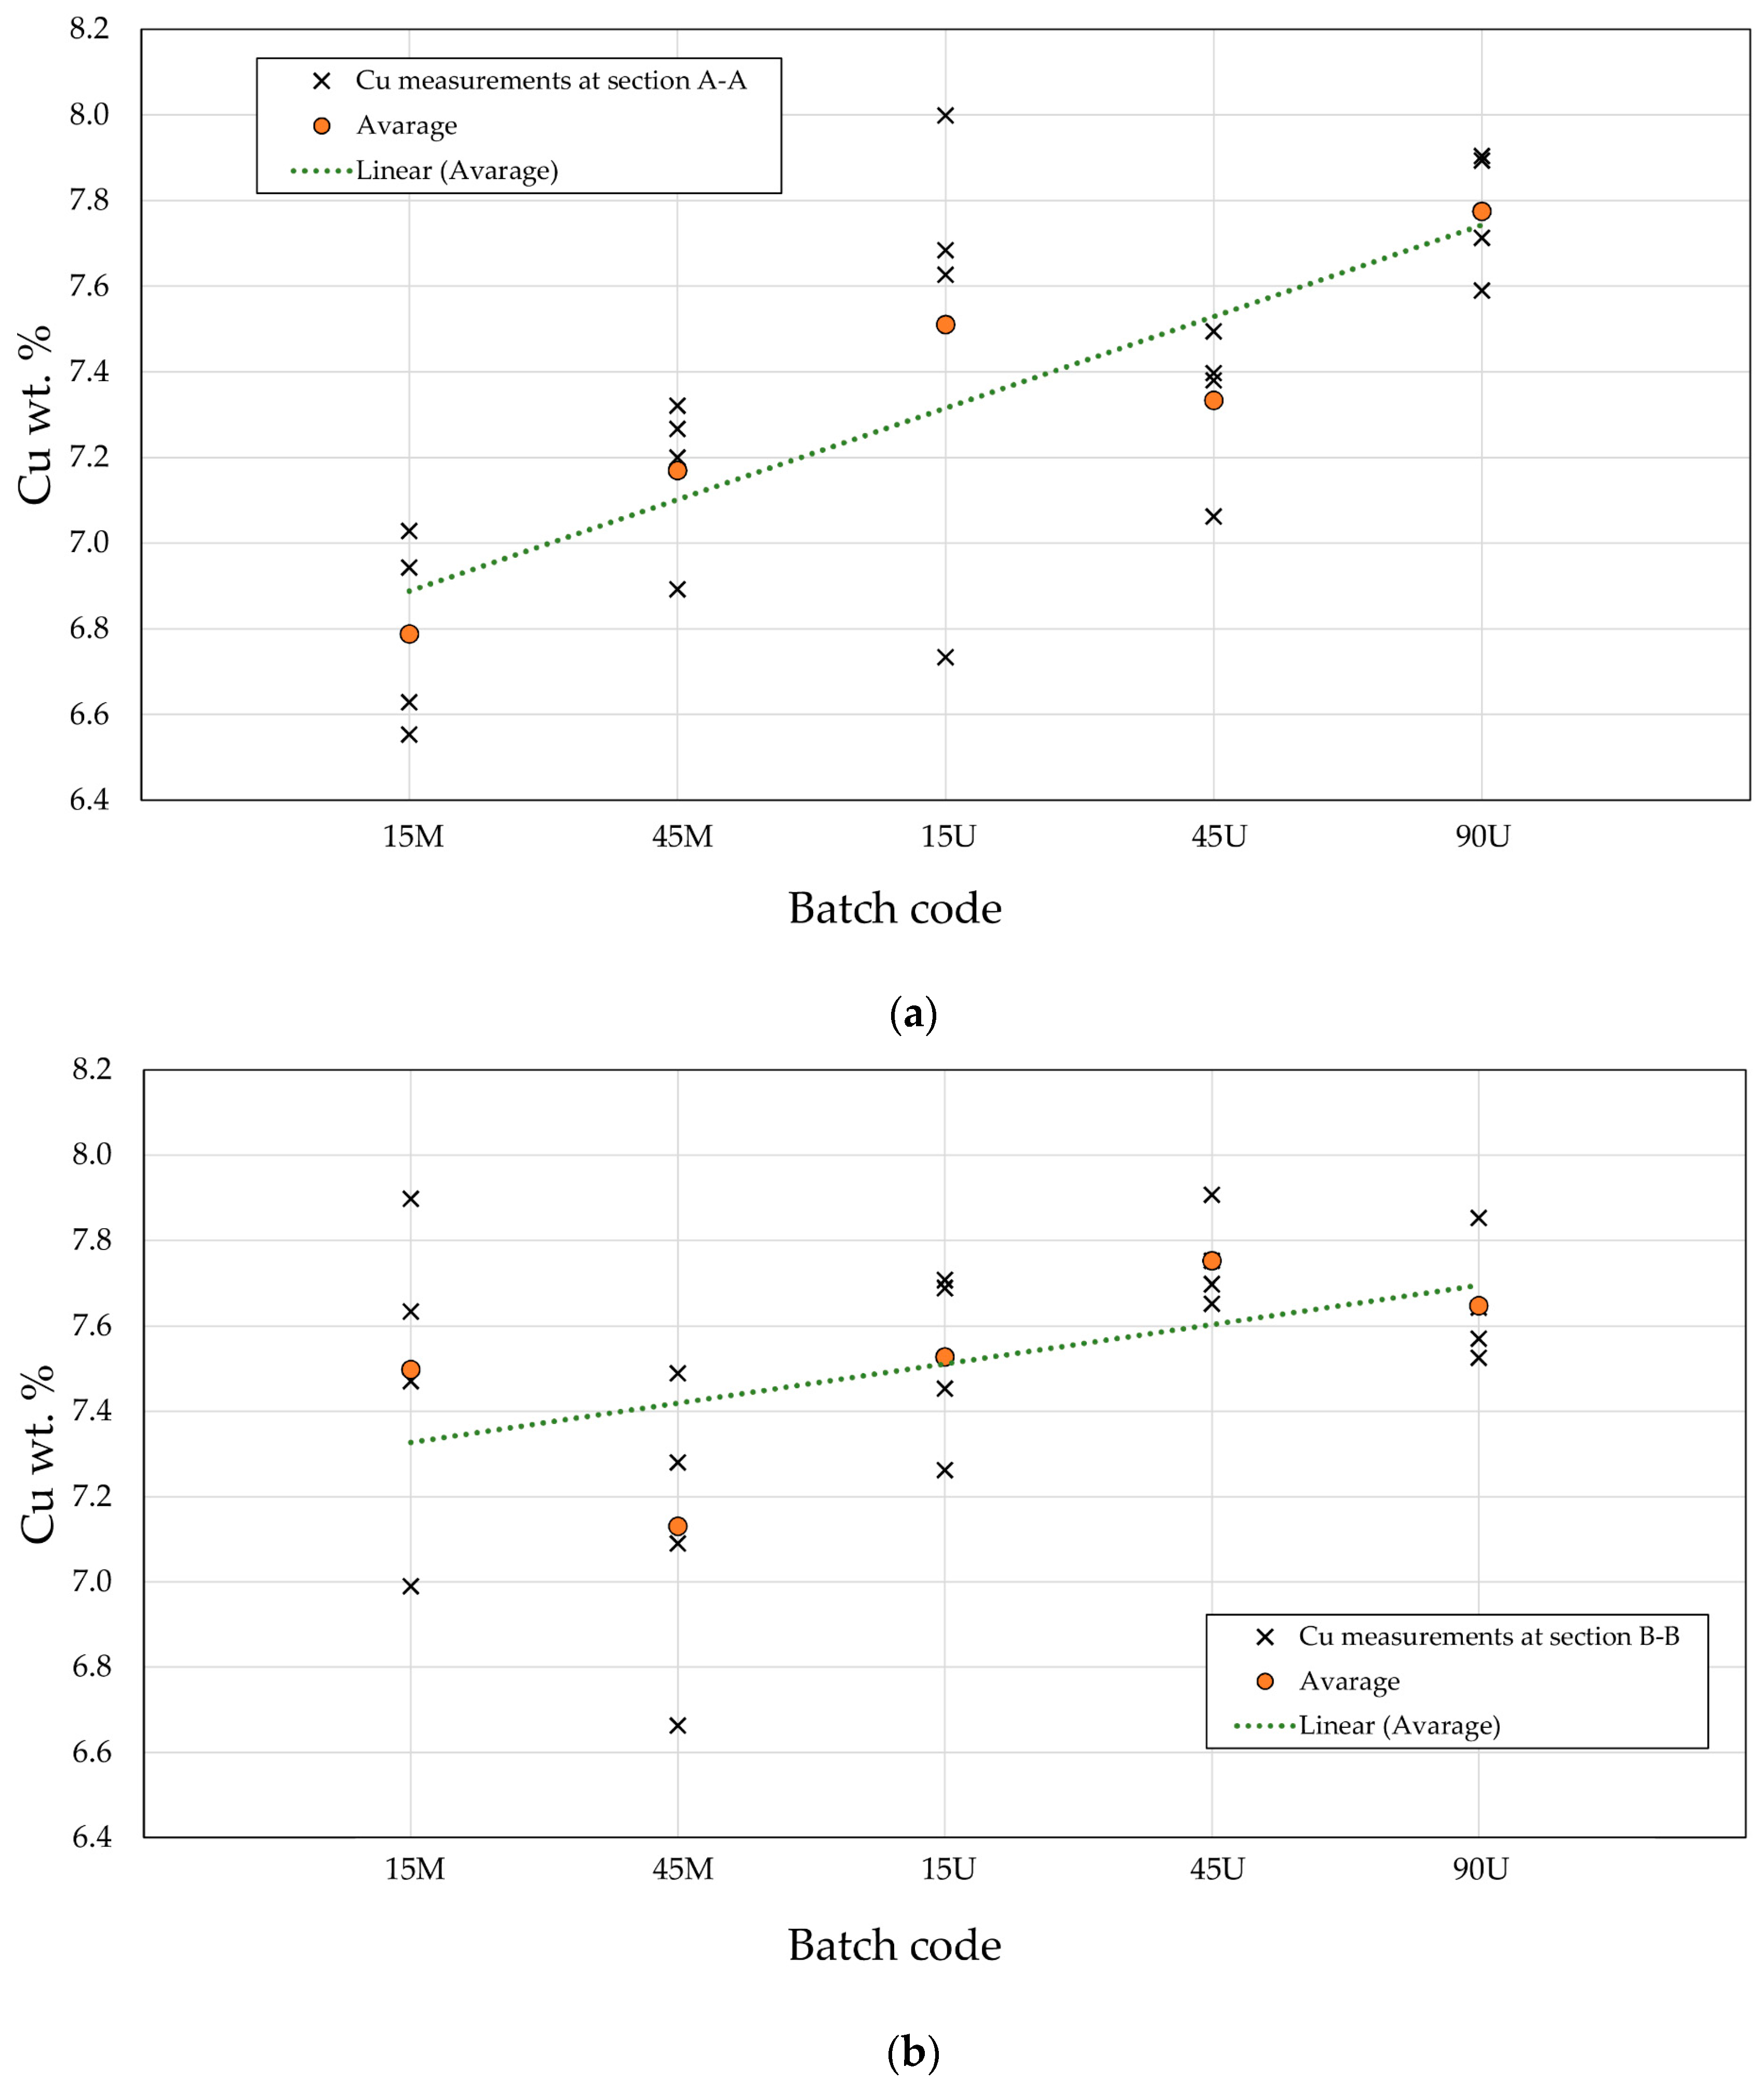
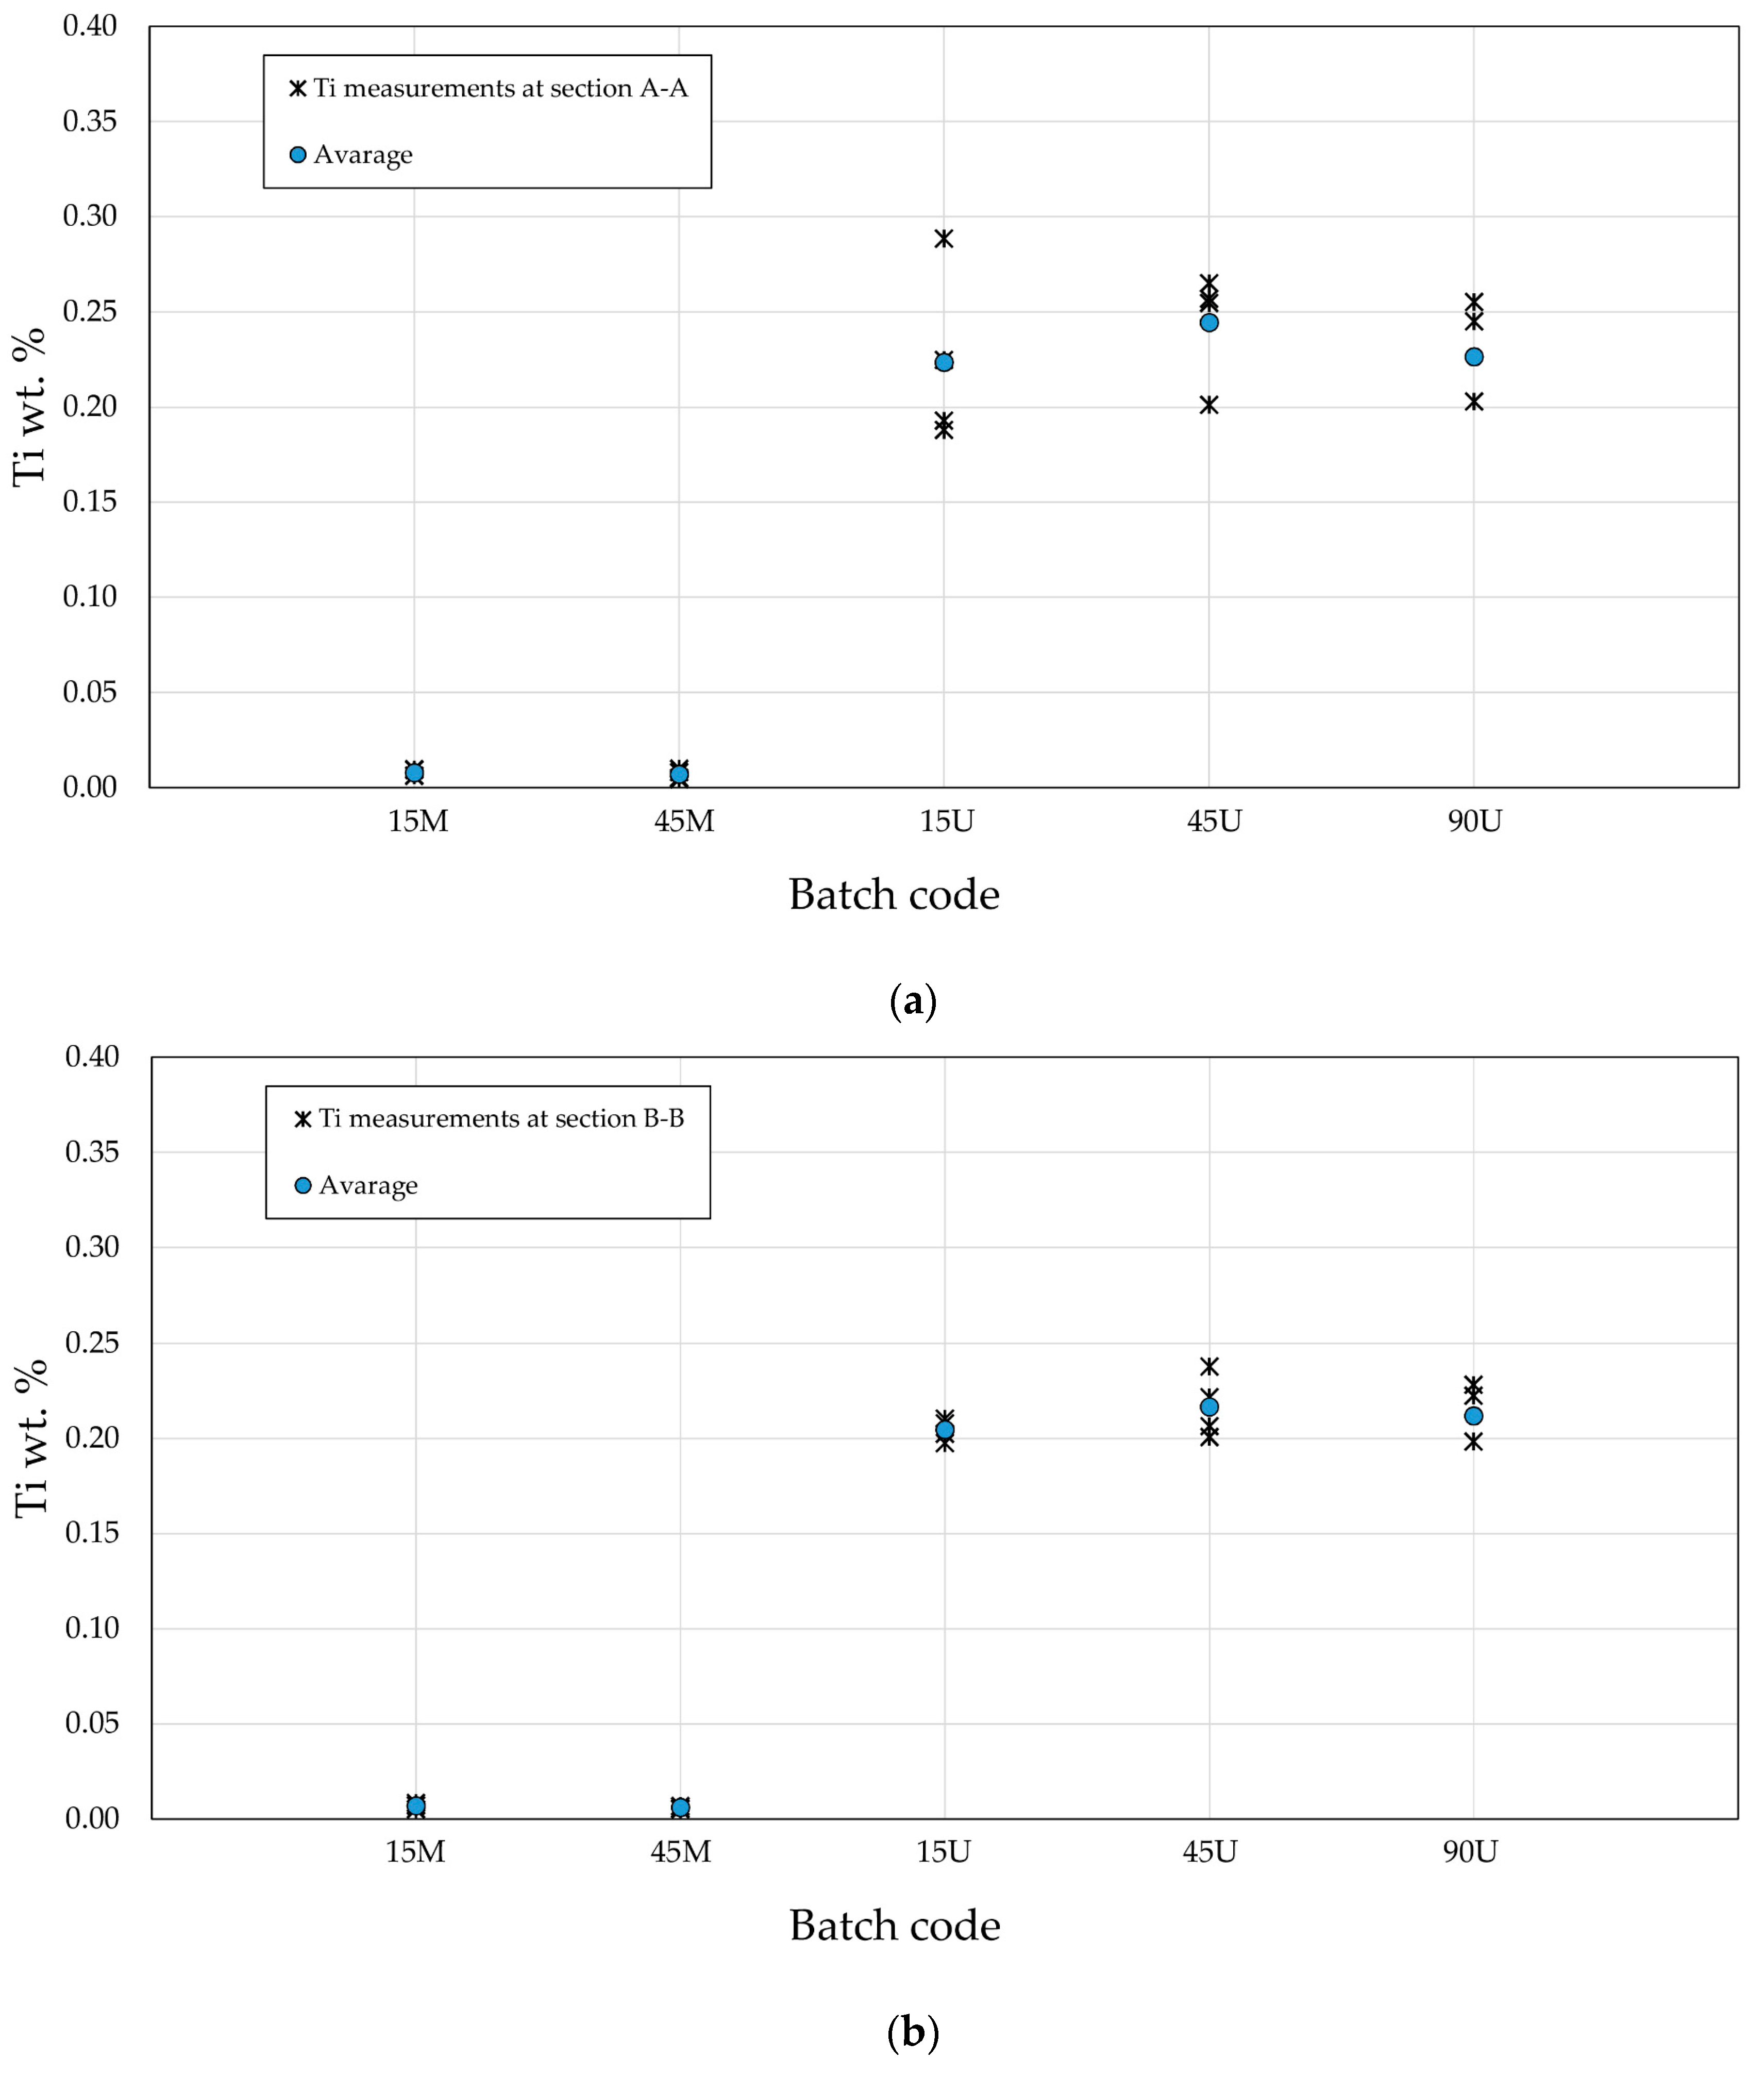
3.3. The Cu and Ti Content in the Produced Alloys
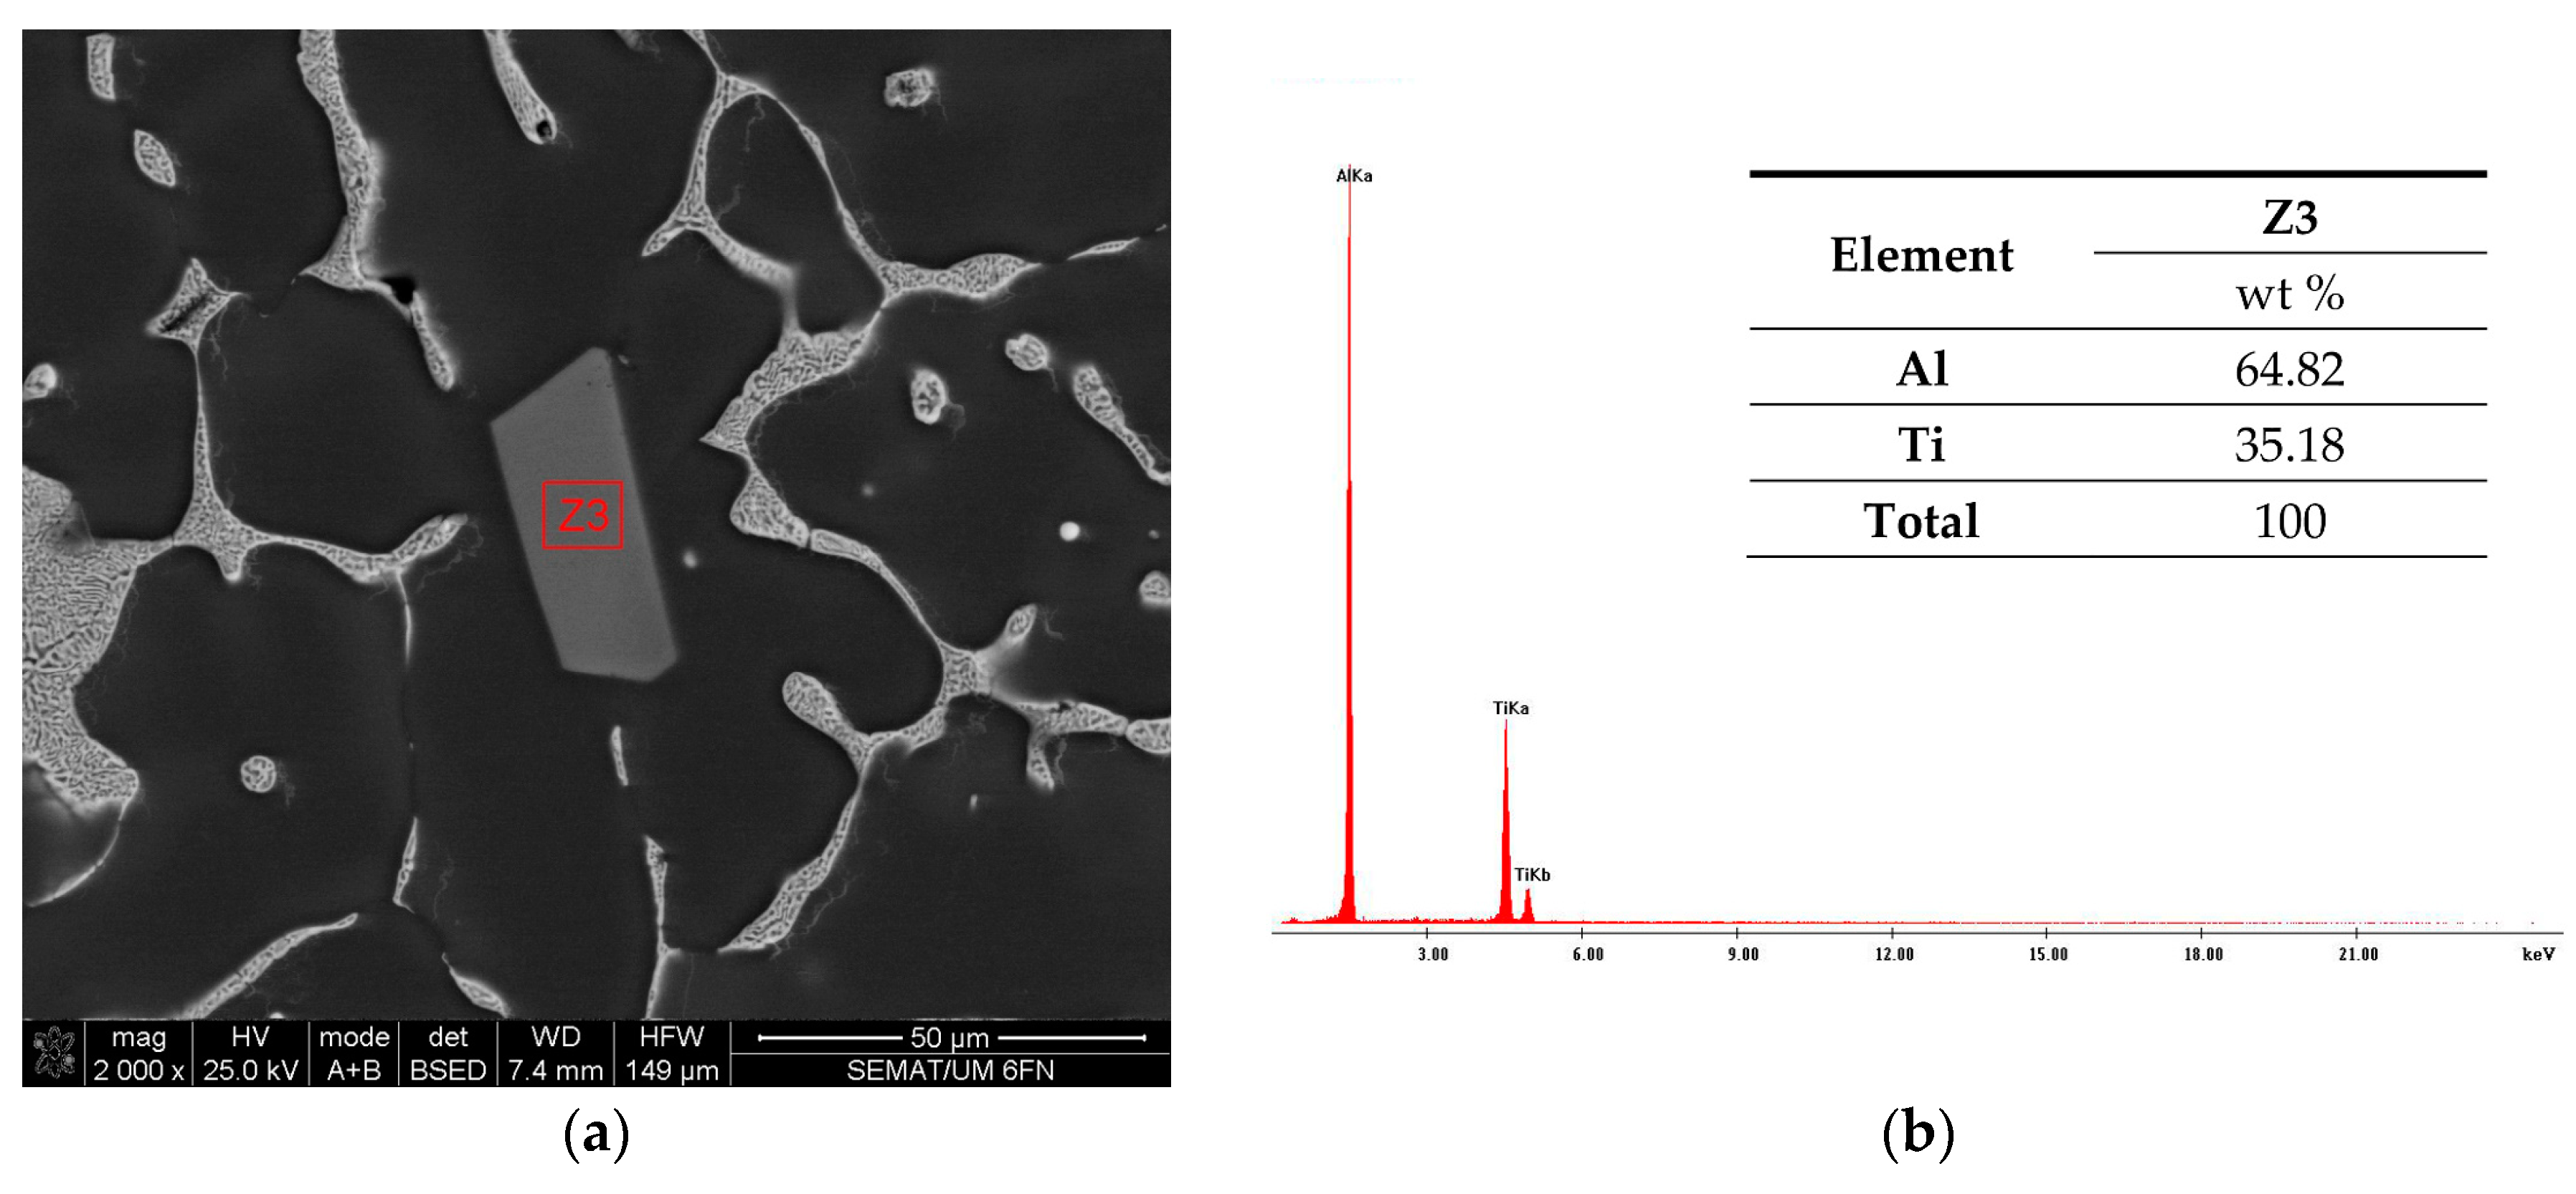
3.4. The Role of Sonotrode Erosion
4. Conclusions
Author Contributions
Funding
Acknowledgments
Conflicts of Interest
References
- Muhrat, A.; Puga, H.; Barbosa, J. Low-Temperature Brazing of Titanium Using Al-Based Filler Alloys. Adv. Mater. Sci. Eng. 2018, 2018, 1–16. [Google Scholar] [CrossRef]
- Takemoto, T.; Okamoto, I. Intermetallic compounds formed during brazing of titanium with aluminium filler metals. J. Mater. Sci. 1988, 23, 1301–1308. [Google Scholar] [CrossRef]
- Chen, X.; Xie, R.; Lai, Z.; Liu, L.; Zou, G.; Yan, J. Ultrasonic-assisted brazing of Al–Ti dissimilar alloy by a filler metal with a large semi-solid temperature range. Mater. Des. 2016, 95, 296–305. [Google Scholar] [CrossRef]
- Winiowski, A.; Majewski, D. Brazing of Titanium with Aluminium Alloys. Arch. Metall. Mater. 2017, 62, 763–770. [Google Scholar] [CrossRef]
- Dispinar, D.; Campbell, J. Critical assessment of reduced pressure test. Part 1: Porosity phenomena. Int. J. Cast Met. Res. 2004, 17, 280–286. [Google Scholar] [CrossRef]
- El-Sayed, M.A.; Hassanin, H.; Essa, K. Bifilm defects and porosity in Al cast alloys. Int. J. Adv. Manuf. Technol. 2016, 86, 1173–1179. [Google Scholar] [CrossRef]
- Pehlke, R.D. Formation of Porosity During Solidification of Cast Metals. In Foundry Processes; Katz, S., Landefeld, C.F., Eds.; Springer: Boston, MA, USA, 1988; pp. 427–445. ISBN 978-1-4612-8292-1. [Google Scholar]
- Eskin, G.I.; Eskin, D.G. Ultrasonic Treatment of Light Alloy Melts, 2th ed.; CRC Press: Florida, FL, USA, 2014. [Google Scholar]
- Puga, H.; Barbosa, J.; Gabriel, J.; Seabra, E.; Ribeiro, S.; Prokic, M. Evaluation of ultrasonic aluminium degassing by piezoelectric sensor. J. Mater. Process. Technol. 2011, 211, 1026–1033. [Google Scholar] [CrossRef]
- Barbosa, J.; Puga, H.; Oliveira, J.; Ribeiro, S.; Prokic, M. Physical modification of intermetallic phases in Al–Si–Cu alloys. Mater. Chem. Phys. 2014, 148, 1163–1170. [Google Scholar] [CrossRef][Green Version]
- Gao, D.; Li, Z.; Han, Q.; Zhai, Q. Effect of ultrasonic power on microstructure and mechanical properties of AZ91 alloy. Mater. Sci. Eng. A 2009, 502, 2–5. [Google Scholar] [CrossRef]
- Zheng, D.; Chen, R.; Ma, T.; Ding, H.; Su, Y.; Guo, J.; Fu, H. Microstructure modification and mechanical performances enhancement of Ti44Al6Nb1Cr alloy by ultrasound treatment. J. Alloy. Compd. 2017, 710, 409–417. [Google Scholar] [CrossRef]
- Eskin, G.I.; Makarov, G.S.; Pimenov, Y.P. Effect of ultrasonic processing of molten metal on structure formation and improvement of properties of high-strength Al-Zn-Mg-Cu-Zr alloys. Adv. Perform. Mater. 1995, 2, 43–50. [Google Scholar] [CrossRef]
- Eskin, G.I. Principles of ultrasonic treatment: Application for light alloys melts. Adv. Perform. Mater. 1997, 4, 223–232. [Google Scholar] [CrossRef]
- Friedrich, B.; Kräutlein, C.; Krone, K. Melt Treatment of Copper and Aluminium—The Complex Step Before Casting. In Continuous Casting; Müller, H.R., Ed.; Wiley-VCH Verlag GmbH & Co. KGaA: Weinheim, Germany, 2006; pp. 1–22. ISBN 978-3-527-60796-9. [Google Scholar]
- Riani, P.; Arrighi, L.; Marazza, R.; Mazzone, D.; Zanicchi, G.; Ferro, R. Ternary Rare-Earth Aluminum Systems with Copper: A Review and a Contribution to Their Assessment. J. Phase Equilibria Diffus. 2004, 25, 22–52. [Google Scholar] [CrossRef]
- Liu, X.J.; Ohnuma, I.; Kainuma, R.; Ishida, K. Phase equilibria in the Cu-rich portion of the Cu–Al binary system. J. Alloy. Compd. 1998, 264, 201–208. [Google Scholar] [CrossRef]
- Instone, S.; Buchholz, A.; Gruen, G.U. Inclusion Transport Phenomena in Casting Furnaces. TMS Miner. Met. Mater. Soc. Light Met. 2008, 2008, 811. [Google Scholar]
- Schindelin, J.; Arganda-Carreras, I.; Frise, E.; Kaynig, V.; Longair, M.; Pietzsch, T.; Preibisch, S.; Rueden, C.; Saalfeld, S.; Schmid, B.; et al. Fiji: An open-source platform for biological-image analysis. Nat. Methods 2012, 9, 676. [Google Scholar] [CrossRef] [PubMed]
- Tzanakis, I.; Lebon, G.S.B.; Eskin, D.G.; Pericleous, K.A. Characterizing the cavitation development and acoustic spectrum in various liquids. Ultrason. Sonochem. 2017, 34, 651–662. [Google Scholar] [CrossRef] [PubMed]
- Tzanakis, I.; Lebon, G.S.B.; Eskin, D.G.; Pericleous, K.A. Characterisation of the ultrasonic acoustic spectrum and pressure field in aluminium melt with an advanced cavitometer. J. Mater. Process. Technol. 2016, 229, 582–586. [Google Scholar] [CrossRef]
- Fang, Y.; Yamamoto, T.; Komarov, S. Cavitation and acoustic streaming generated by different sonotrode tips. Ultrason. Sonochem. 2018, 48, 79–87. [Google Scholar] [CrossRef]
- Courtney, T.H. Mechanical Behavior of Materials; Waveland Press: Long Grove, IL, USA, 2005. [Google Scholar]
- Astashev, V.K.; Babitsky, V.I.; Khusnutdinova, K. Ultrasonic Processes and Machines: Dynamics, Control and Applications; Foundations of Engineering Mechanics; Springer: Berlin, Germany, 2007; ISBN 978-3-540-72060-7. [Google Scholar]
- Grabalosa, J.; Ferrer, I.; Martínez-Romero, O.; Elías-Zúñiga, A.; Plantá, X.; Rivillas, F. Assessing a stepped sonotrode in ultrasonic molding technology. J. Mater. Process. Technol. 2016, 229, 687–696. [Google Scholar] [CrossRef]
- Xu, H.; Jian, X.; Meek, T.T.; Han, Q. Degassing of molten aluminum A356 alloy using ultrasonic vibration. Mater. Lett. 2004, 58, 3669–3673. [Google Scholar] [CrossRef]
- Brujan, E.A. Jets from pulsed-ultrasound-induced cavitation bubbles near a rigid boundary. J. Phys. Appl. Phys. 2017, 50, 215302. [Google Scholar] [CrossRef]
- Chen, X.; Yan, J.; Ren, S.; Wei, J.; Wang, Q. Microstructure and mechanical properties of Ti–6Al–4V/Al1060 joints by ultrasonic-assisted brazing in air. Mater. Lett. 2013, 95, 197–200. [Google Scholar] [CrossRef]
- Zhang, Y.; Li, R.; Li, X.; Yang, Y.; Chen, P.; Dong, F.; Jiang, R. Possible Effects and Mechanisms of Ultrasonic Cavitation on Oxide Inclusions during Direct-Chill Casting of an Al Alloy. Metals 2018, 8, 814. [Google Scholar] [CrossRef]
- Samuel, A.M.; Samuel, F.H. Effect of melt treatment, solidification conditions and porosity level on the tensile properties of 319.2 endchill aluminium castings. J. Mater. Sci. 1995, 30, 4823–4833. [Google Scholar]
- Mirgaux, O.; Bellot, J.; Waz, E.; Ablitzer, D. Aluminium Flotation in Stirred Reactor: A Mathematical Model and a Computer Simulation Coupling CFD and Population Balance. Light Metals 2009, 2009, 7. [Google Scholar]
- Ludwig, A.; Wu, M.; Kharicha, A. On Macrosegregation. Metall. Mater. Trans. A 2015, 46, 4854–4867. [Google Scholar] [CrossRef]
- Leong, T.; Ashokkumar, M.; Kentish, S. The fundamentals of power ultrasound—A review. Acoust. Aust. 2001, 39, 10. [Google Scholar]
- Beckermann, C. Macrosegregation. Encycl. Mater. Sci. Technol. 2001, 47, 4733–4739. [Google Scholar]
- Ghosh, A. Segregation in cast products. Sadhana 2001, 26, 5–24. [Google Scholar] [CrossRef]
- Yan, M.; Fan, Z. Review Durability of materials in molten aluminum alloys. J. Mater. Sci. 2001, 36, 285–295. [Google Scholar] [CrossRef]
- Dong, F.; Li, X.; Zhang, L.; Ma, L.; Li, R. Cavitation erosion mechanism of titanium alloy radiation rods in aluminum melt. Ultrason. Sonochem. 2016, 31, 150–156. [Google Scholar] [CrossRef] [PubMed]
- Easton, M.; StJohn, D. Grain refinement of aluminum alloys: Part I. the nucleant and solute paradigms—a review of the literature. Metall. Mater. Trans. A 1999, 30, 1613–1623. [Google Scholar] [CrossRef]
- Kashyap, K.T.; Chandrashekar, T. Effects and mechanisms of grain refinement in aluminium alloys. Bull. Mater. Sci. 2001, 24, 345–353. [Google Scholar] [CrossRef]
- Hunt, J.D.; Jackson, K.A. Nucleation of Solid in an Undercooled Liquid by Cavitation. J. Appl. Phys. 1966, 37, 254–257. [Google Scholar] [CrossRef]
- Alba-Baena, N.; Pabel, T.; Villa-Sierra, N.; Eskin, D.G. Effect of Ultrasonic Melt Treatment on Degassing and Structure of Aluminium Alloys. Mater. Sci. Forum 2013, 765, 271–275. [Google Scholar] [CrossRef]
- Atamanenko, T.V.; Eskin, D.G.; Zhang, L.; Katgerman, L. Criteria of Grain Refinement Induced by Ultrasonic Melt Treatment of Aluminum Alloys Containing Zr and Ti. Metall. Mater. Trans. A 2010, 41, 2056–2066. [Google Scholar] [CrossRef]
- Eskin, G.I. Broad prospects for commercial application of the ultrasonic (cavitation) melt treatment of light alloys. Ultrason. Sonochem. 2001, 8, 319–325. [Google Scholar] [CrossRef]
- Dantzig, J.A.; Rappaz, M. Solidification; 2nd Edition—Revised & Expanded; Engineering Sciences; EPFL Press: Lausanne, Switzerland, 2016; ISBN 978-2-940222-97-1. [Google Scholar]
- Babu, N.K.; Dayou, P.; Zheng, S.; Jun, W.; Talari, M.K. Influence of Titanium-Boron Additions on Grain Refinement of AA2219 Gas Tungsten Arc Welds. In Light Metals 2012; Springer: Cham, Switzerland, 2012; pp. 487–491. [Google Scholar]
- Rohatgi, S.; Tiwari, M.; Rathi, A.; Sharma, A. Solute Particles on Grain Refinement of. Indian Foundry J. 2015, 61, 7. [Google Scholar]


| Element | Si | Cu | Fe | Zn | Al |
|---|---|---|---|---|---|
| CP Al | 0.055 | 0.008 | 0.059 | - | Bal. |
| CP Cu | - | Bal. | - | 0.296 | - |
| Using Manual Stirring | ||||||
| Batch Code | Mixing | Holding | Manual Stirring | Holding | Manual Stirring | Holding |
| min | ||||||
| 15M | 5 | 15 | 2 | 5 | - | - |
| 45M | 5 | 15 | 2 | 45 | 2 | 5 |
| Using Ultrasonic Vibration (USV) | ||||||
| Batch Code | Mixing | Holding | USV | Holding | USV | - |
| min | ||||||
| 15U | 5 | 15 | 2 | - | - | - |
| 45U | 5 | 15 | 2 | 45 | 2 | - |
| 90U | 5 | 15 | 2 | 90 | 2 | - |
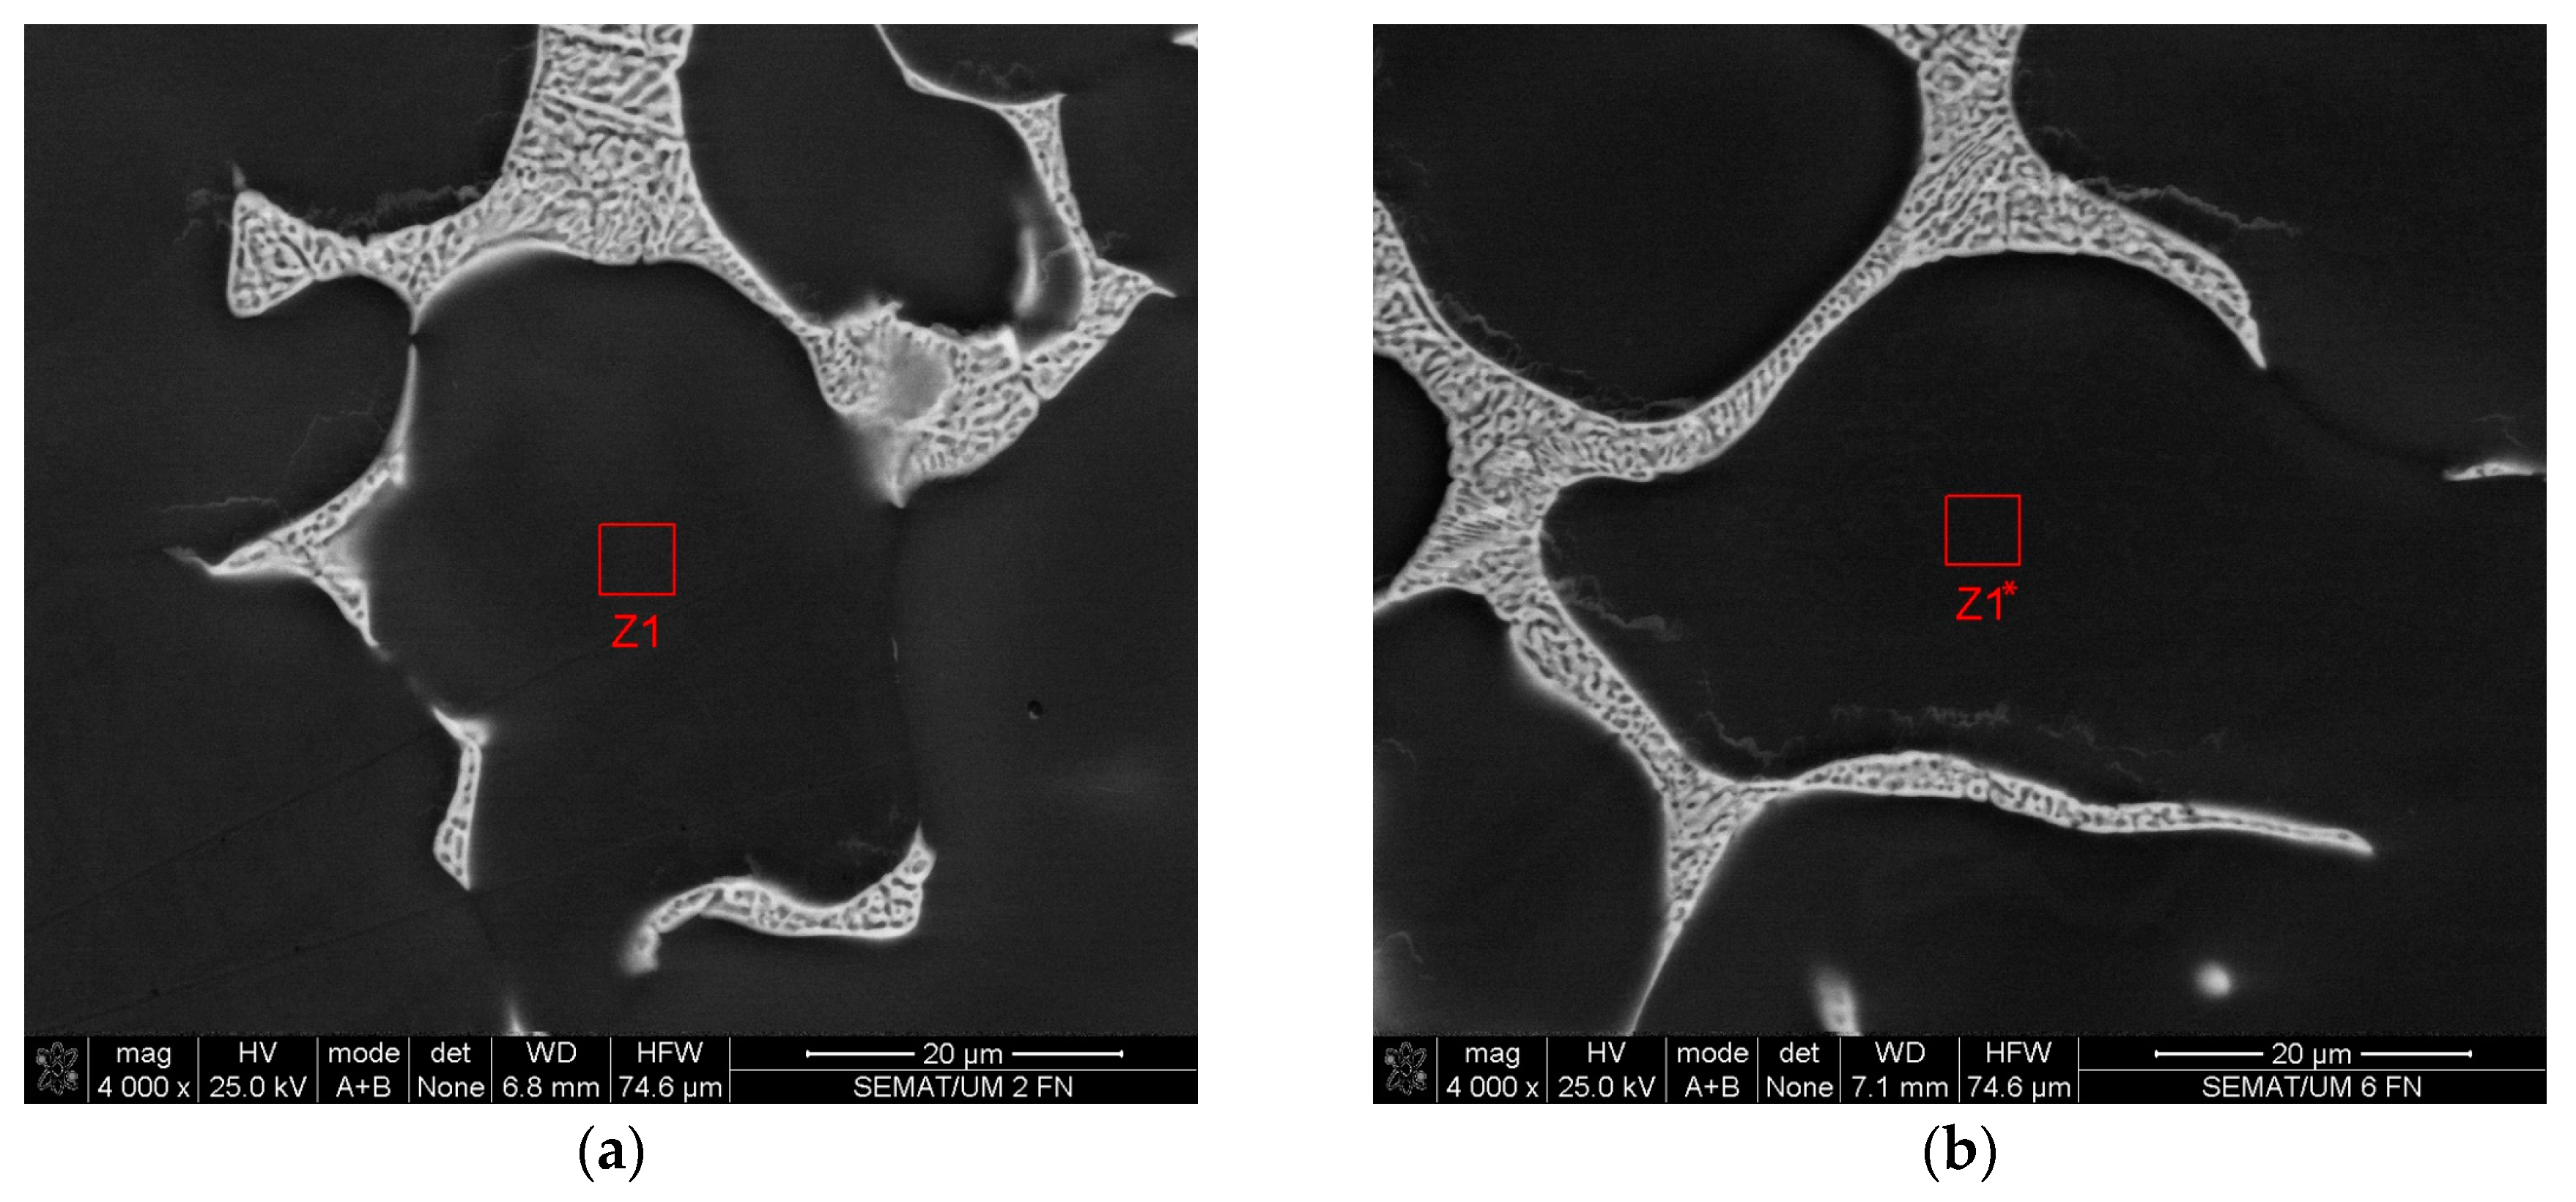
| Element | Z1 | Z1* |
|---|---|---|
| Batch 45U | ||
| wt.% | ||
| Al | 96.36 | 96.99 |
| Cu | 2.90 | 2.11 |
| Ti | 0.74 | 0.90 |
| Total | 100 | 100 |
© 2019 by the authors. Licensee MDPI, Basel, Switzerland. This article is an open access article distributed under the terms and conditions of the Creative Commons Attribution (CC BY) license (http://creativecommons.org/licenses/by/4.0/).
Share and Cite
Muhrat, A.; Puga, H.; Barbosa, J. Ultrasonic Vibration as a Primary Mixing Tool in Accelerating Aluminum–Copper Alloys Preparation from Their Pure Elements. Metals 2019, 9, 781. https://doi.org/10.3390/met9070781
Muhrat A, Puga H, Barbosa J. Ultrasonic Vibration as a Primary Mixing Tool in Accelerating Aluminum–Copper Alloys Preparation from Their Pure Elements. Metals. 2019; 9(7):781. https://doi.org/10.3390/met9070781
Chicago/Turabian StyleMuhrat, Abdulsalam, Hélder Puga, and Joaquim Barbosa. 2019. "Ultrasonic Vibration as a Primary Mixing Tool in Accelerating Aluminum–Copper Alloys Preparation from Their Pure Elements" Metals 9, no. 7: 781. https://doi.org/10.3390/met9070781
APA StyleMuhrat, A., Puga, H., & Barbosa, J. (2019). Ultrasonic Vibration as a Primary Mixing Tool in Accelerating Aluminum–Copper Alloys Preparation from Their Pure Elements. Metals, 9(7), 781. https://doi.org/10.3390/met9070781