Kinetics and Energy Consumption for a Three-Stage Electrocoagulation Process for the Recovery of Au and Ag from Cyanide Leachates

 and
and
Abstract
:
1. Introduction
1.1. Electrocoagulation (EC)
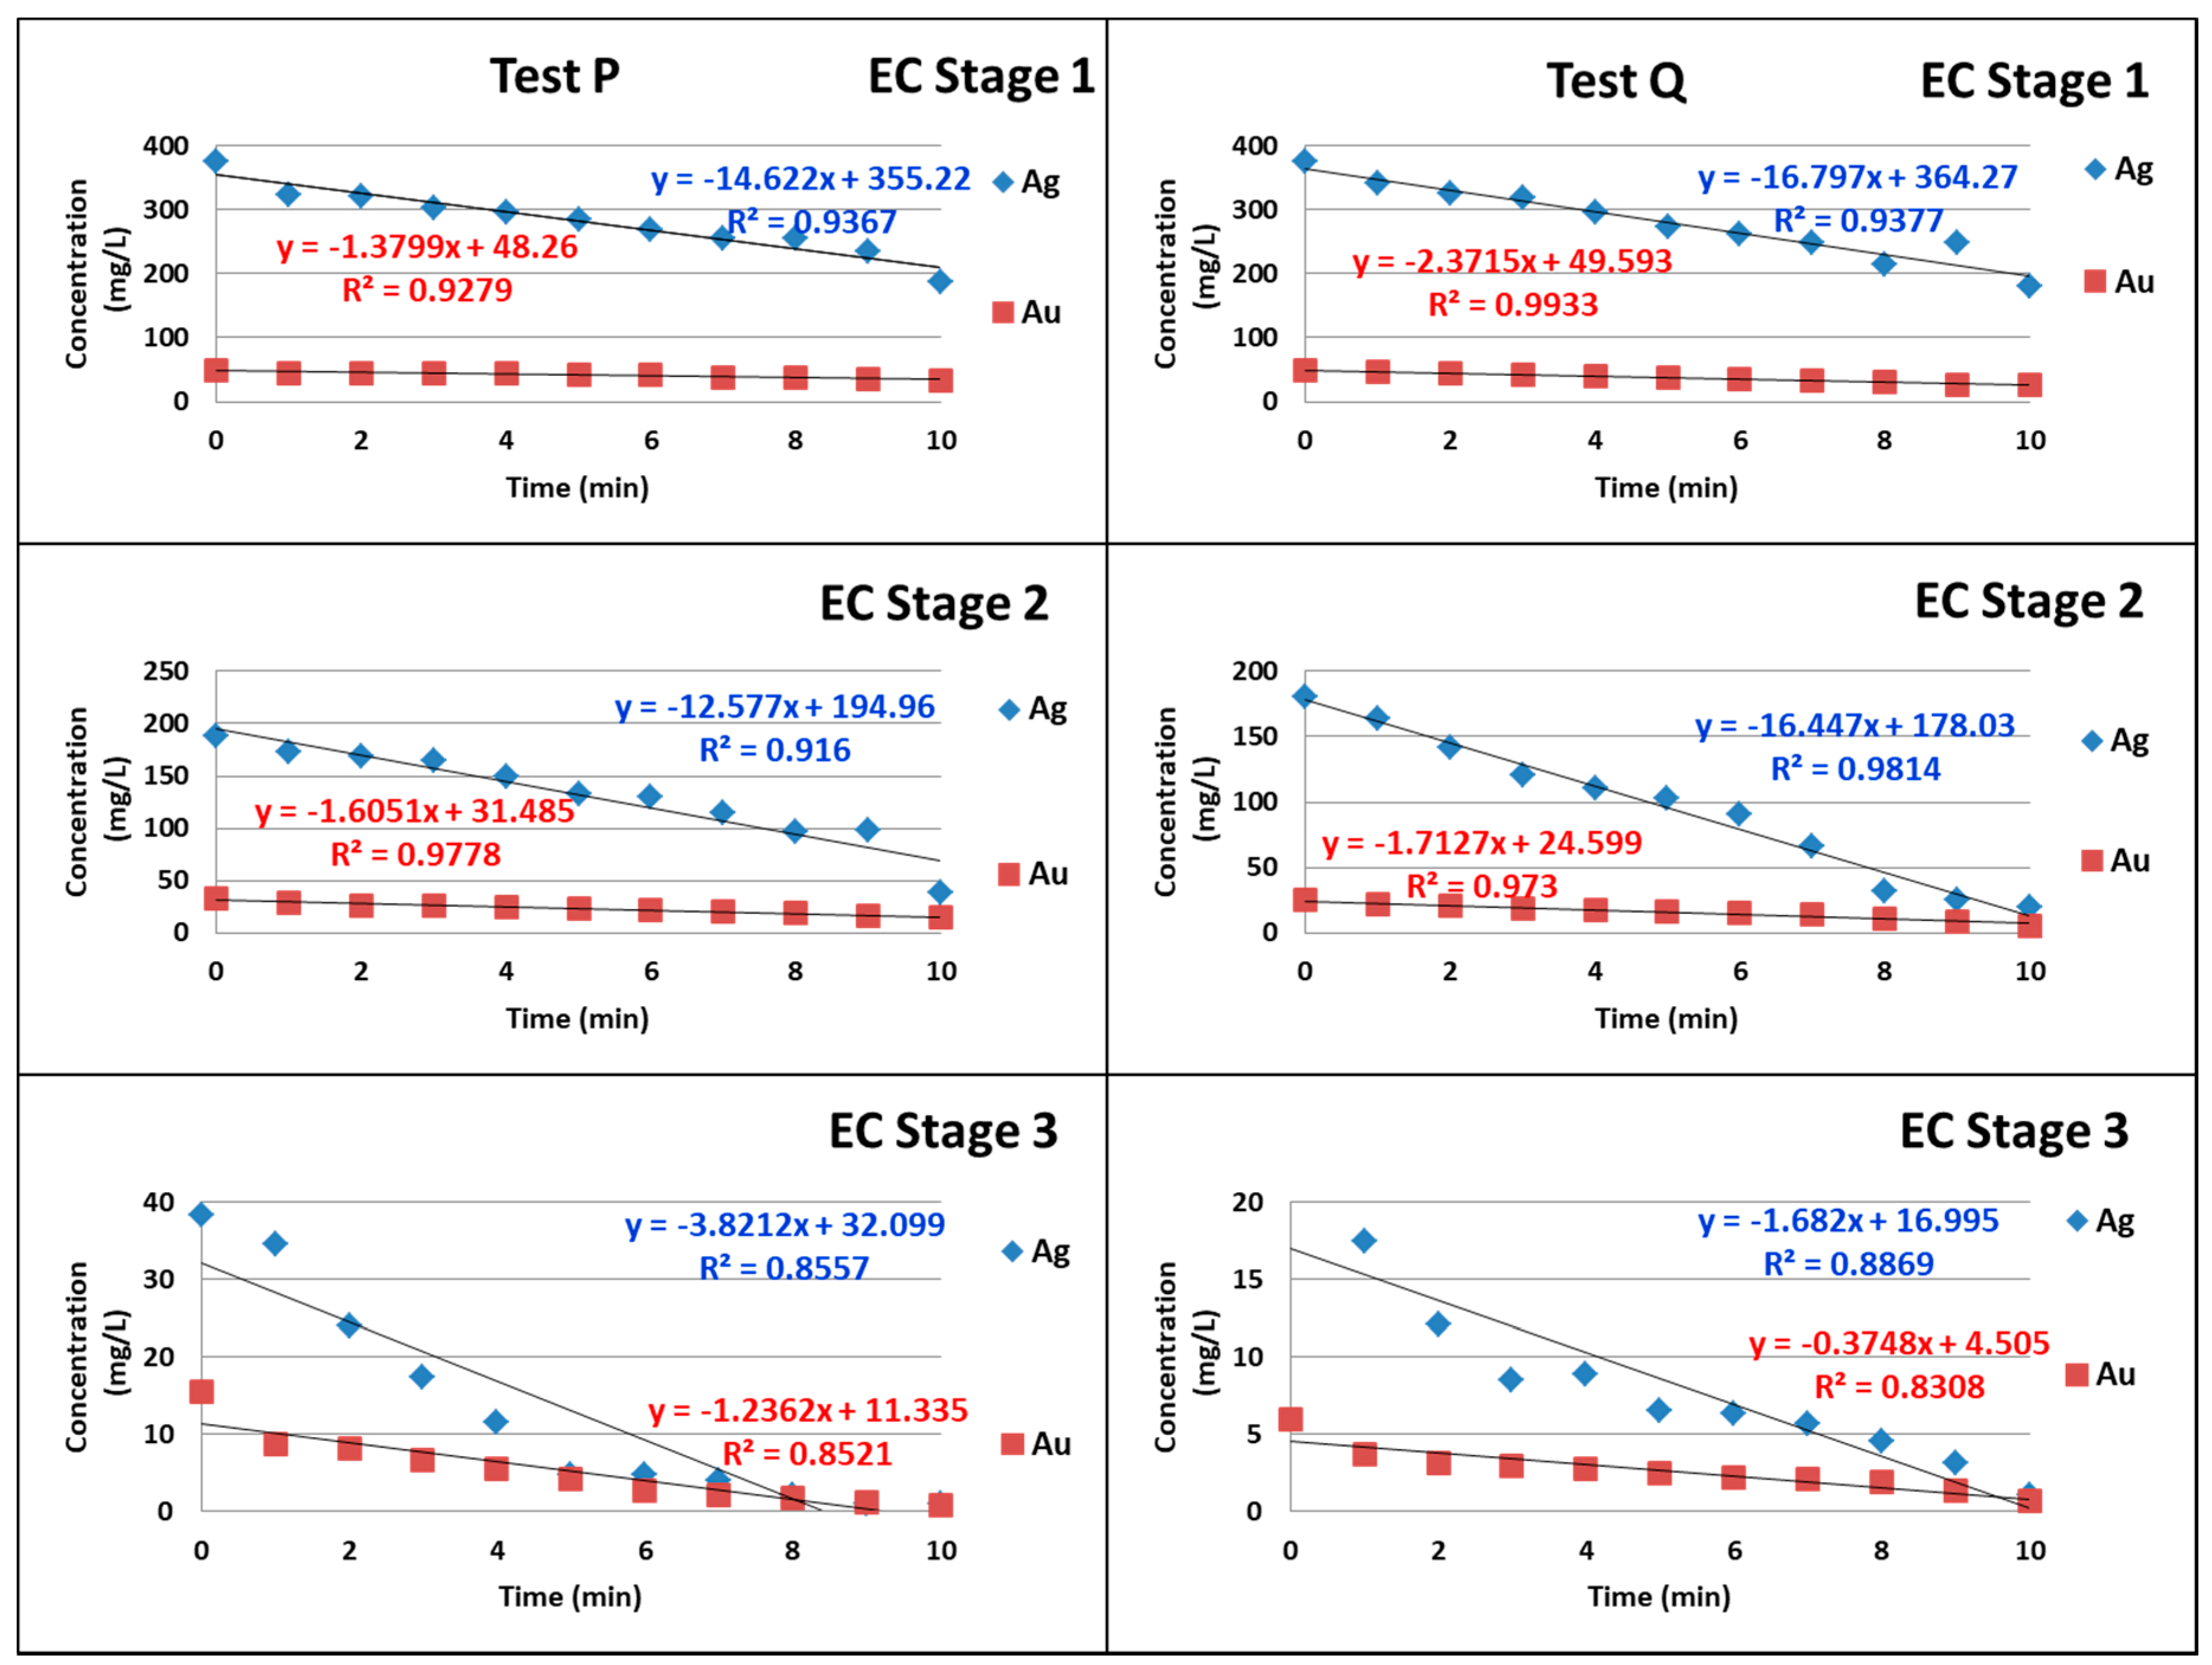
1.2. Kinetics and Reaction Rates
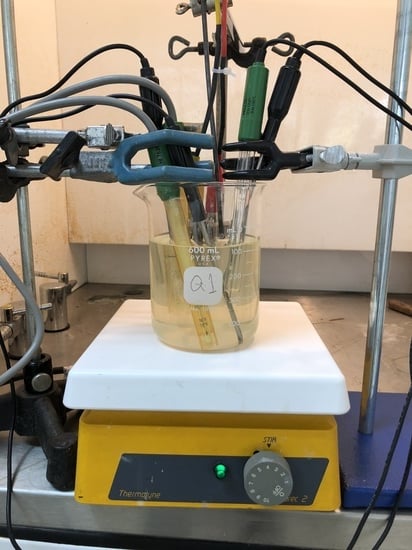
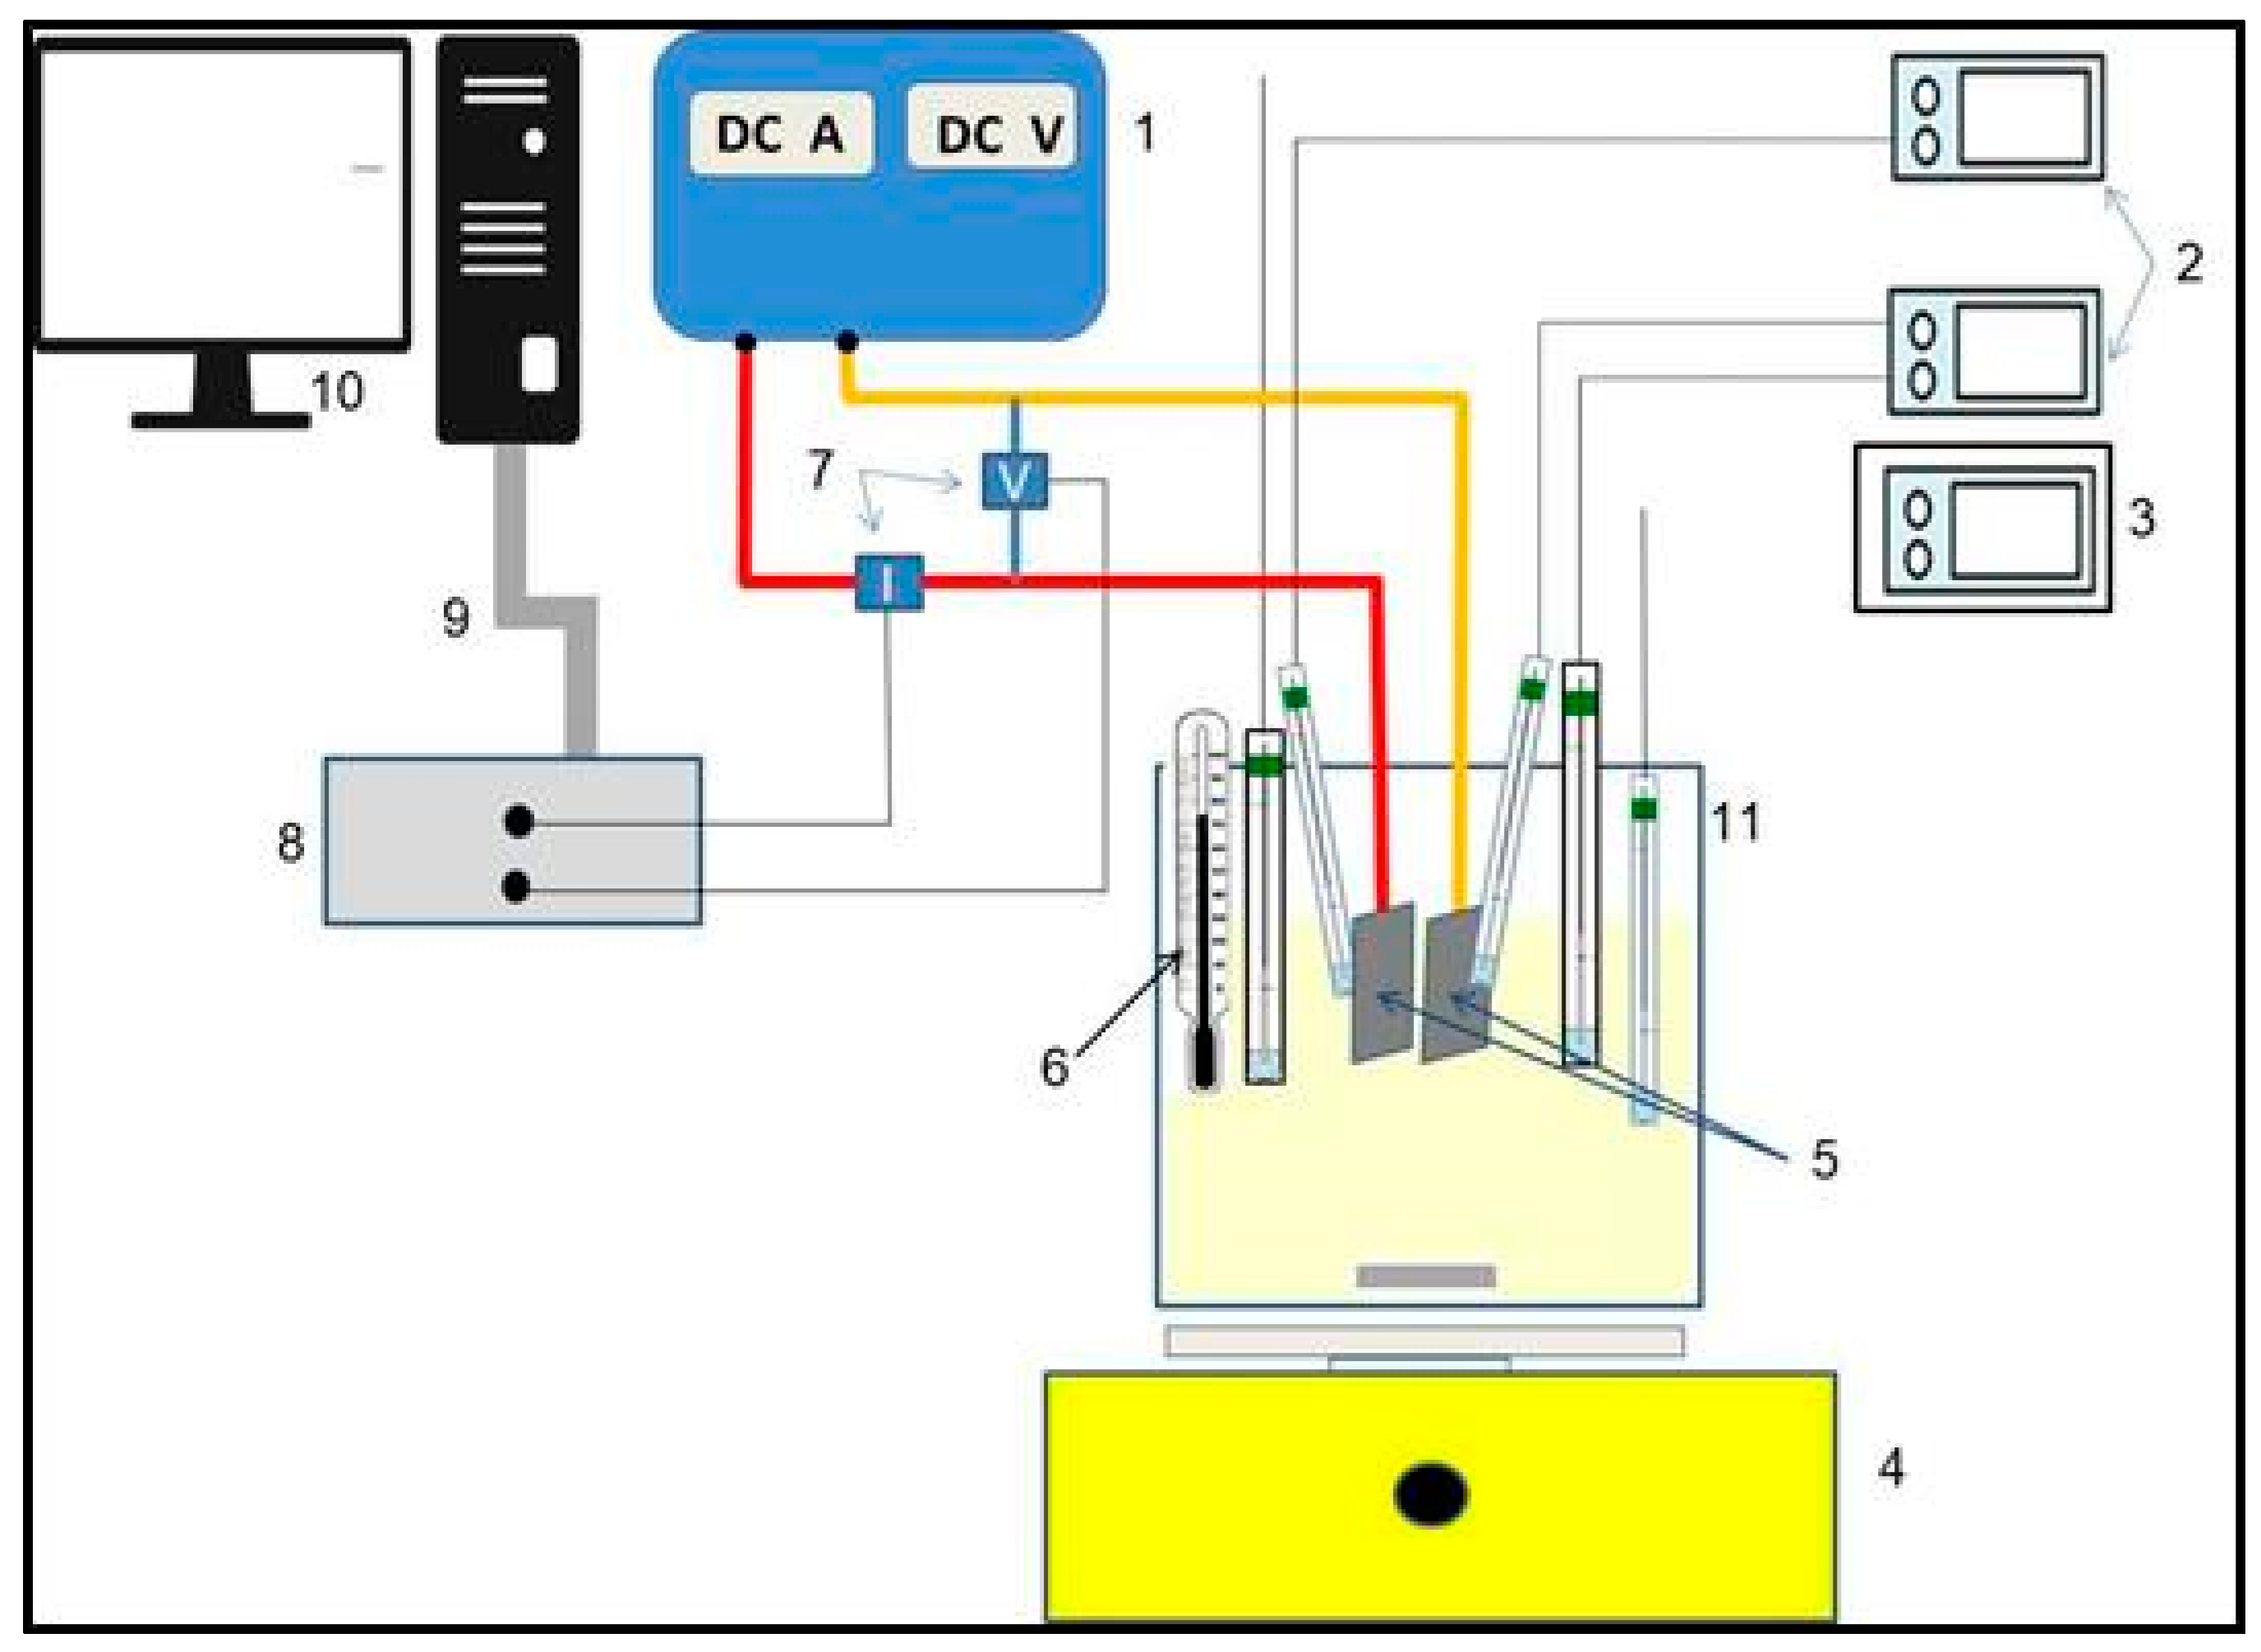
2. Experimental
2.1. Materials and Instruments
2.2. Methods
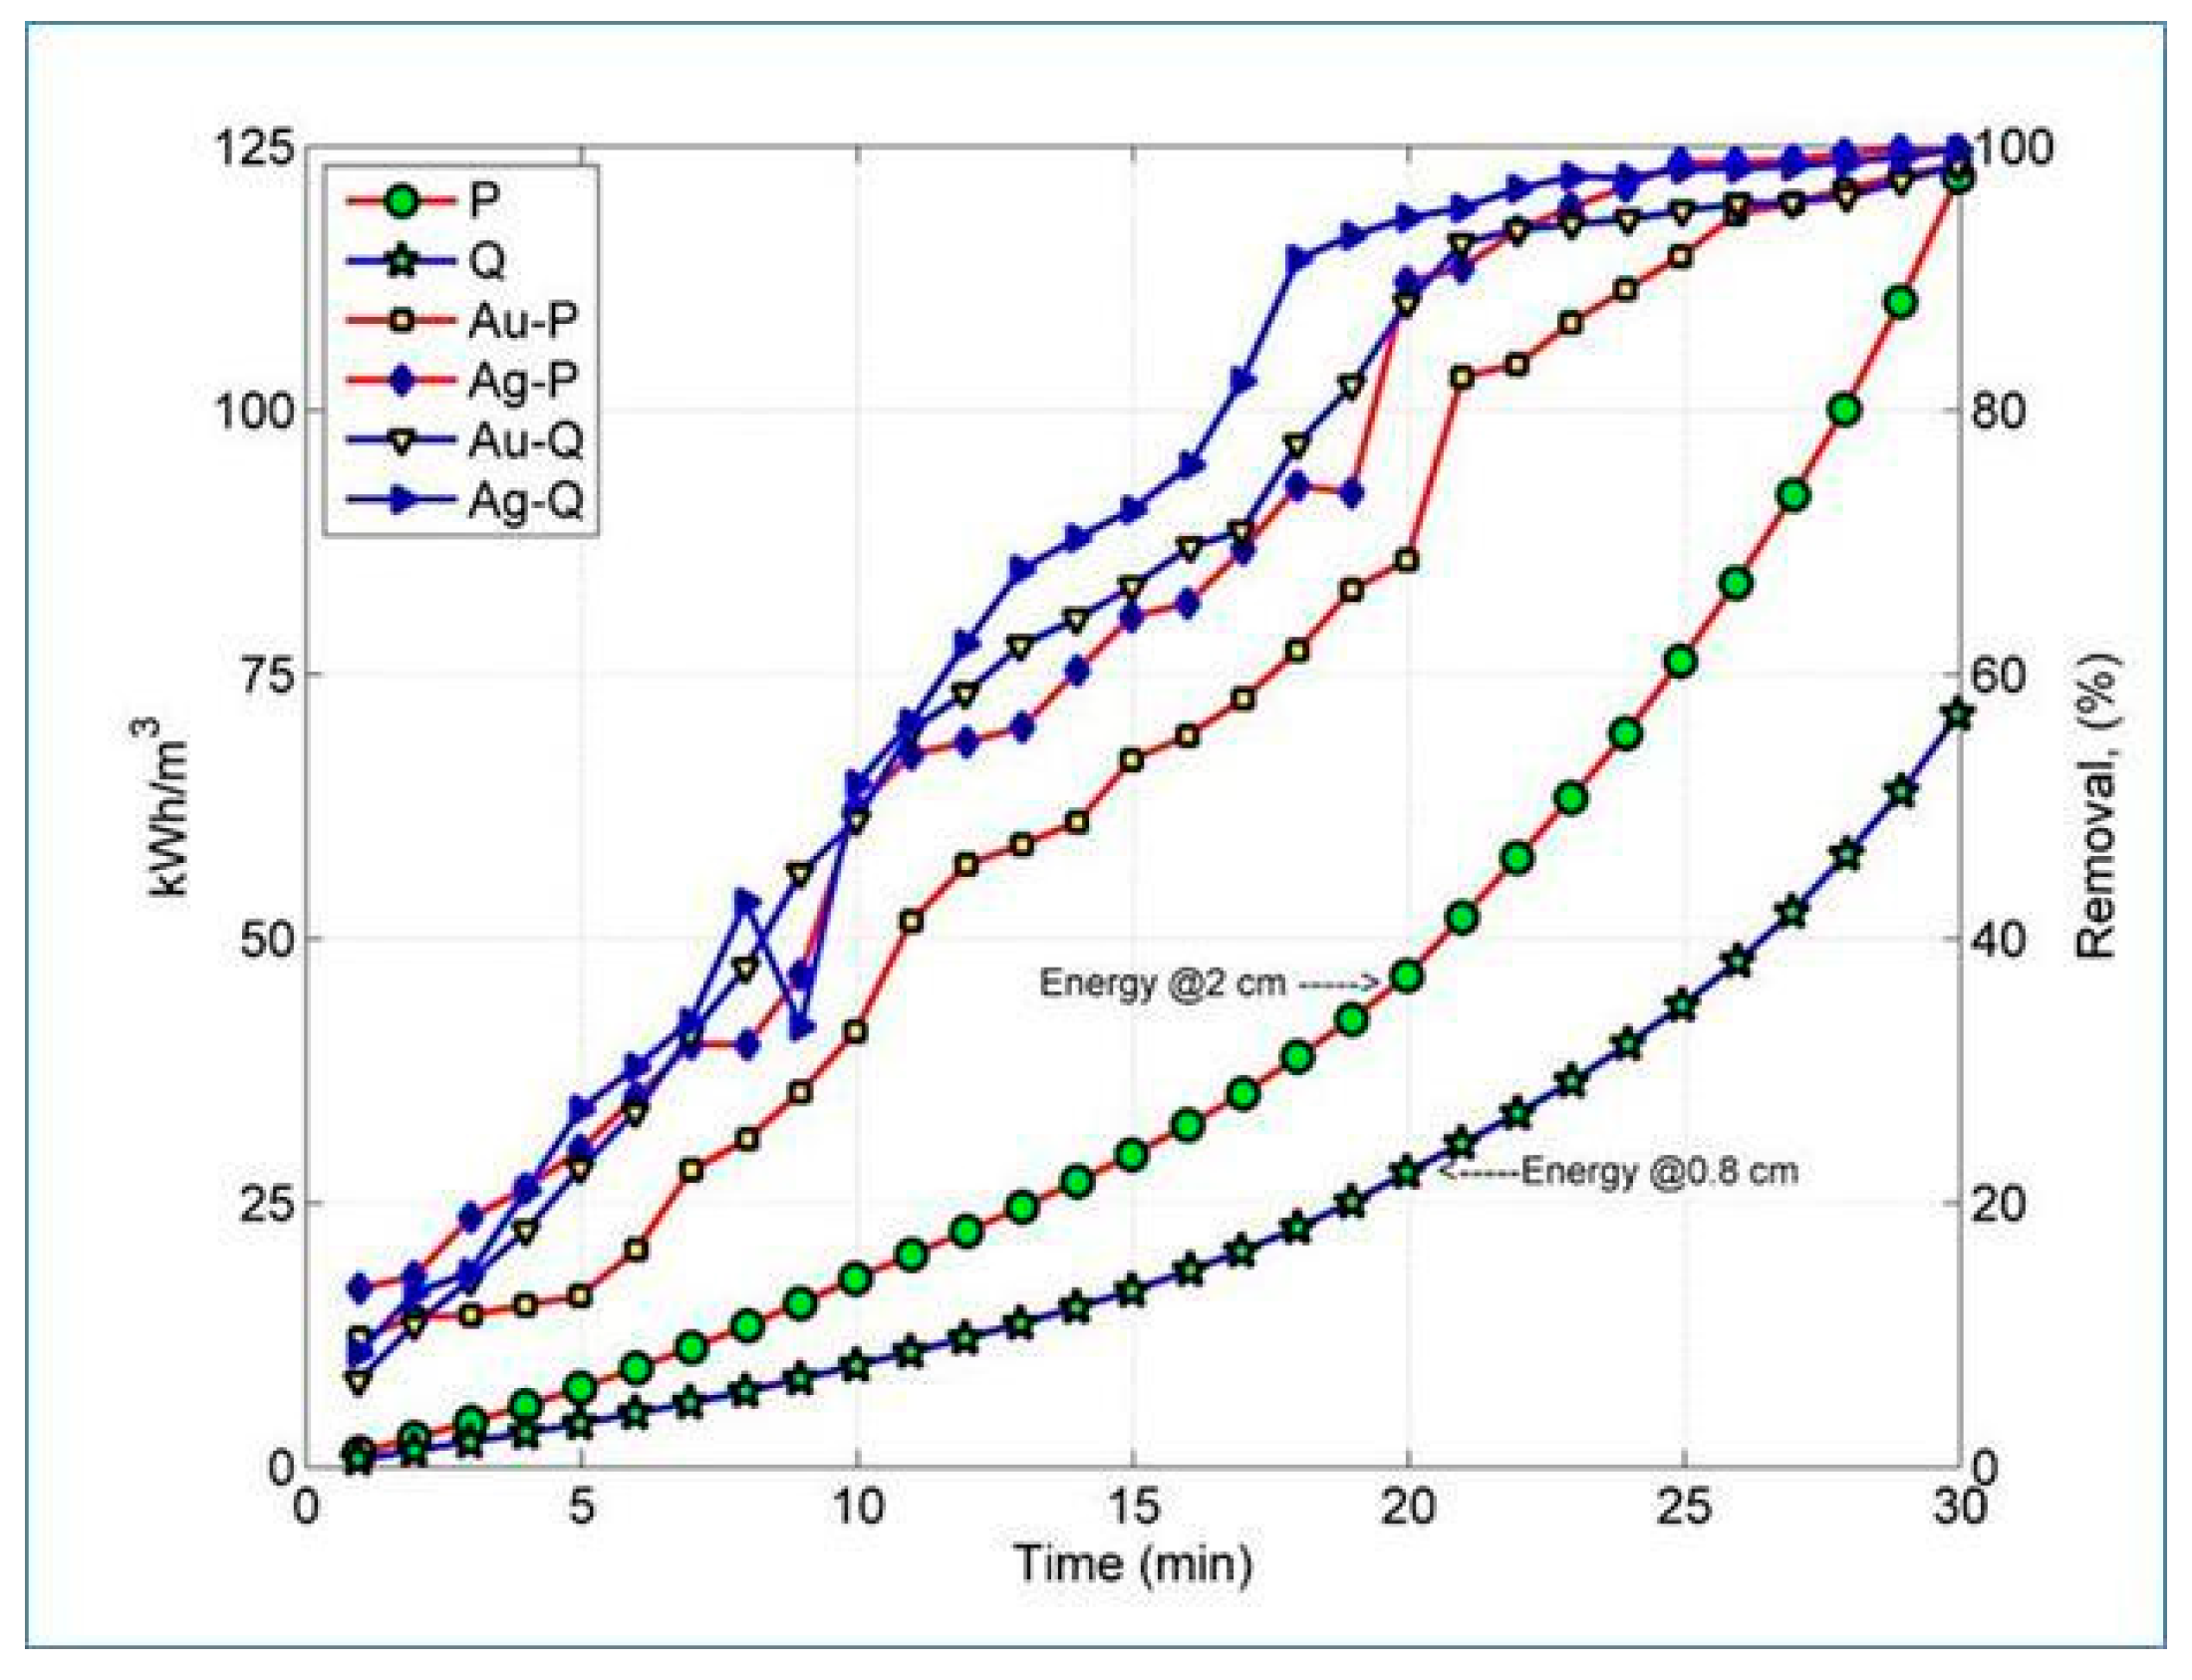
3. Results and Discussion
4. Conclusions
Author Contributions
Funding
Acknowledgments
Conflicts of Interest
References
- Parga, J.R.; Cocke, D.L.; Valenzuela, J.L.; Gomes, J.A.; Kesmez, M.; Irwin, G.; Moreno, H.; Weir, M. Arsenic Removal Via EC from Heavy Metal Contaminated Groundwater in La Comarca Lagunera Mexico. J. Hazard. Mater. 2005, 124, 247–254. [Google Scholar] [CrossRef] [PubMed]
- Parga, J.R.; Rodríguez, M.; Vazquez, V.; Valenzuela, J.L.; Moreno, H. Recovery of Silver and Gold from Cyanide Solution by Magnetic Species Formed in the Electrocoagulation Process. Miner. Procesing Extr. Metall. Rev. 2012, 33, 363–373. [Google Scholar] [CrossRef]
- Adams, M.D. Advances in Gold Ore Processing; Elsevier, B.V.: Amsterdam, The Netherlands, 2016; pp. 102–104. [Google Scholar]
- Logan, S.R. Fundamentos De Cinética Química; Addiso Wesley Iberoamericana: Boston, MA, USA, 2000; pp. 1–14. [Google Scholar]
- Moreno, C.H.A.; Cocke, D.L.; Gomes, J.A.G.; Morkovsky, P.; Parga, J.R.; Peterson, E.; Garcia, C. Electrochemical Reactions for Electrocoagulation Using Aluminum Electrodes; The Minerals, Metals & Materials Society: Warrendale, PA, USA, 2007; pp. 23–35. [Google Scholar]
- Arango Ruiz, A. La electrocoagulación: Una alternativa para el tratamiento de aguas residuales. In Revista Lasallista De Investigación; Corporación Universitaria Lasallista: Antioquia, Colombia, 2005; Volume 2, pp. 49–56. [Google Scholar]
- Cuicas, J.R.P.; Cuadra, R.L.A. Evaluación De La Electrocoagulación En El Tratamiento De Agua Potable; Química Viva Universidad de Buenos Aires: Buenos Aires, Argentina, 2017; Volume 16, pp. 56–69. [Google Scholar]
- Piña Soberanis, M.; Martín Domínguez, A.; González Ramírez, C.A.; Prieto García, F.; Guevara Lara, A.; García Espinoza, J.E. Revisión de Variables de Diseño y Condiciones de Operación en la Electrocoagulación. In Revista Mexicana de ingeniería química; Universidad Autónoma Metropolitana, Unidad Iztapalapa: Mexico City, Mexico, 2011; Volume 10, pp. 257–271. [Google Scholar]
- Moreno Casillas, H. Mechanisms, Chemical Pathways, and Optimization of Electrochemical Water Treatment by Electrocoagulation for Sustainable Water Utilization. Thesis, Lamar University, Beaumont, TX, USA, 2007. [Google Scholar]
- García Carrillo, M.C.; Parga Torres, J.R.; Moreno Casillas, H.A.; Paredes Soto, J. Determinación de los factores que influyen en la recuperación de oro y plata de soluciones del proceso de cianuración mediante electrocoagulación, aplicando diseño de experimentos 23. In Revista de Energía Química y Física; Ecorfan: Bolivia, South America, 2016; Volume 3, pp. 40–49. [Google Scholar]
- Parga Torres, J.R.; García Carrillo, M.C.; Valenzuela García, J.L.; Sánchez Valdéz, E.; Moreno Casillas, H.A. Adsorption of Gold and Silver on Magnetic Species Formed during the Electrocoagulation Process. In Revista Internacional de Investigación e Innovación Tecnológica; Centro Kappa de Conocimiento: Saltillo, Coah, Mexico, 2018; Volume 5, pp. 1–12. [Google Scholar]
- Smith, J.M. Ingeniería de la Cinética Química; Décimo tercera reimpresión; Compañía Editorial Continental: México, North America, 2001; pp. 26–28. [Google Scholar]
- Castellan Gilbert, W. Fisicoquímica, 2nd ed.; Addison-Weslwy Iberoamericana: Boston, MA, USA, 1987; pp. 841–855. [Google Scholar]
- Ray, M. How Can a Zero Order Reaction be Possible? How Can a Reaction Not Depend on Its Reactant? Available online: https://www.quora.com/How-can-a-zero-order-reaction-be-possible-How-can-a-reaction-not-depend-on-its-reactant (accessed on 24 June 2019).


| Test | P | Q | R | T |
|---|---|---|---|---|
| Parameters | ||||
| Constant I or V applied Direct Current | 4 A | 4 A | 5 V | 5 V |
| Distance between electrodes (cm) | 2.0 | 0.8 | 2.0 | 0.8 |
| Parameter | Test | 1st stage | 2nd stage | 3rd stage | Average | Total |
|---|---|---|---|---|---|---|
| Accumulated removal of Au (%) | P (4 A, 2 cm) | 33 | 68.8 | 98.6 | - | - |
| Q (4 A, 0.8 cm) | 49 | 88.1 | 98.6 | - | - | |
| R (5 V, 2 cm) | 42.2 | 69.3 | 84 | - | - | |
| T (5 V, 0.8 cm) | 57.3 | 81.7 | 99.4 | - | - | |
| Accumulated removal of Ag (%) | P | 49.8 | 89.7 | 99.7 | - | - |
| Q | 51.7 | 94.6 | 99.7 | - | - | |
| R | 45 | 69.8 | 88.3 | - | - | |
| T | 59.8 | 88.9 | 99.4 | - | - | |
| Weight loss in electrodes (g) | P | 0.375 | 0.3811 | 0.4148 | 0.39 | 1.1709 |
| Q | 0.3567 | 0.3911 | 0.4358 | 0.39 | 1.1836 | |
| R | 0.184 | 0.1448 | 0.1661 | 0.16 | 0.4949 | |
| T | 0.3306 | 0.2562 | 0.3488 | 0.31 | 0.9356 | |
| Temperature increase (°C) | P | 12.9 | 18 | 43.2 | 24.70 | - |
| Q | 8.4 | 12.1 | 25.6 | 15.37 | - | |
| R | 3.1 | 4.3 | 10 | 5.80 | - | |
| T | 5.5 | 6.7 | 10.2 | 7.47 | - | |
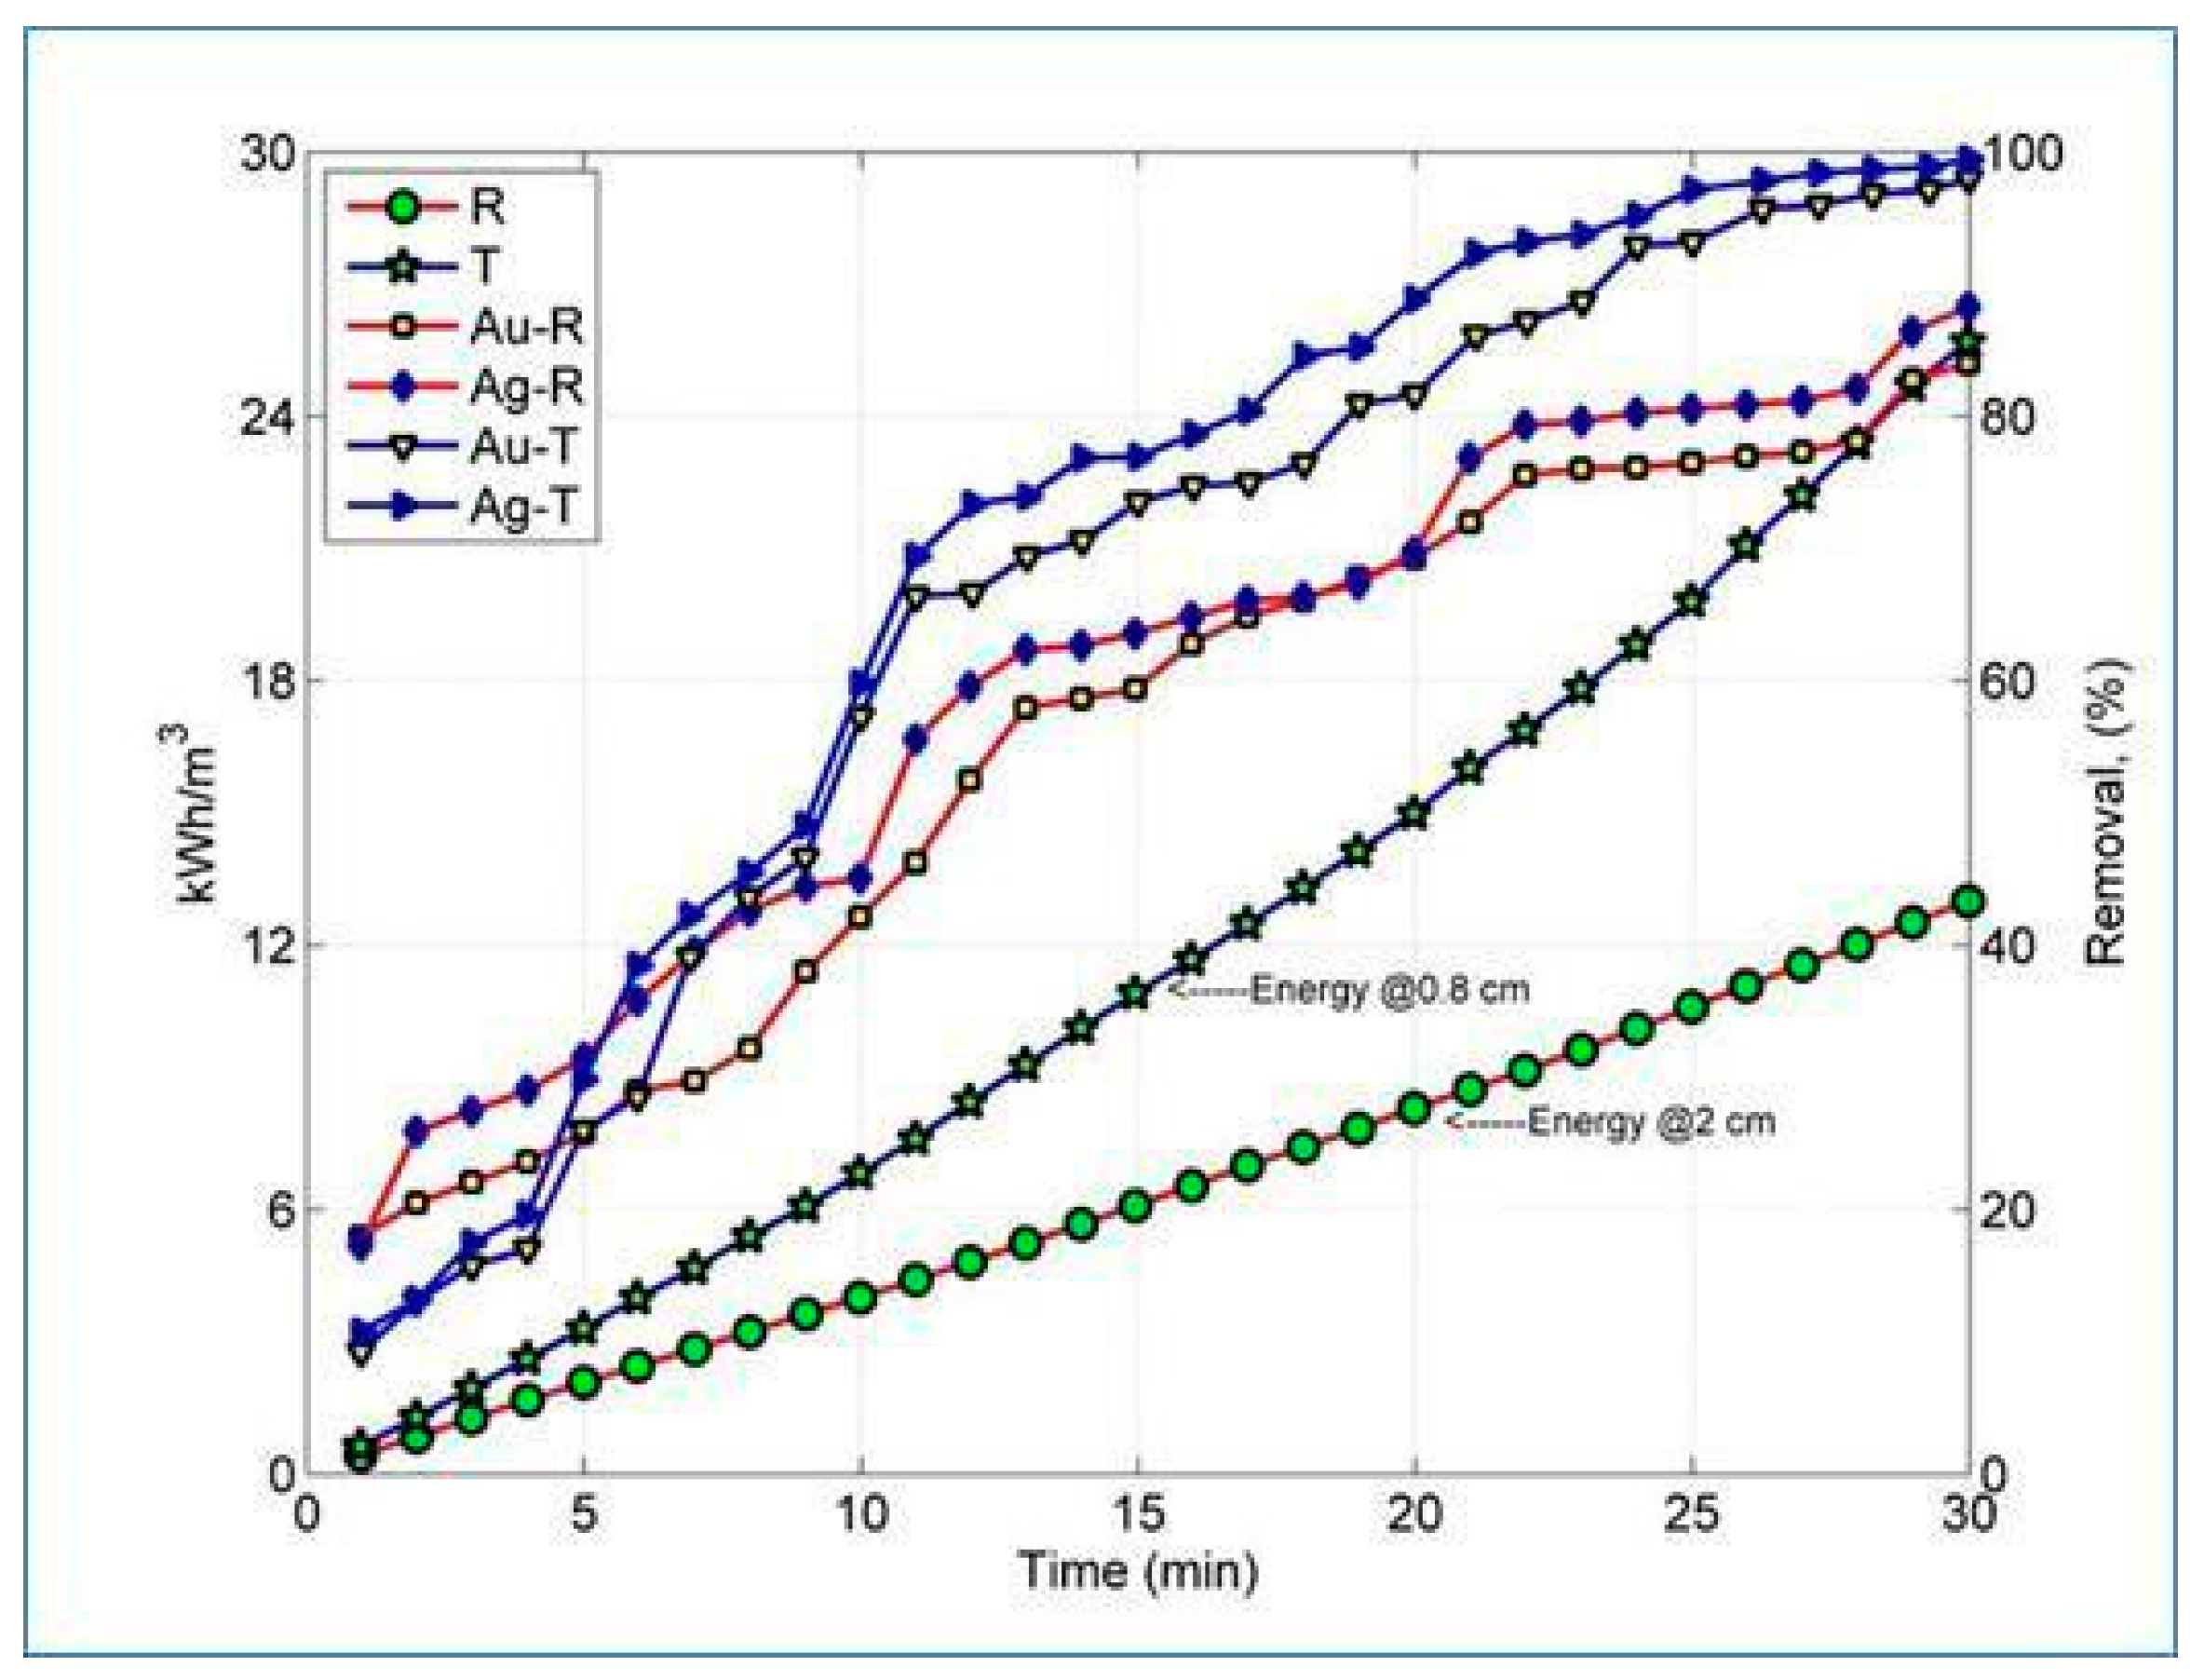
| Energy consumption (kWh/m3) | P | 17.8 | 28.7 | 75.6 | - | - |
| Accumulated | 17.8 | 46.5 | 122.1 | - | - | |
| Q | 9.6 | 18.3 | 43.4 | - | - | |
| Accumulated | 9.6 | 27.9 | 71.3 | - | - | |
| R | 4.0 | 4.3 | 4.7 | - | - | |
| Accumulated | 4 | 8.3 | 13 | - | - | |
| T | 6.8 | 8.2 | 10.7 | - | - | |
| Accumulated | 6.8 | 15 | 25.7 | - | - |
© 2019 by the authors. Licensee MDPI, Basel, Switzerland. This article is an open access article distributed under the terms and conditions of the Creative Commons Attribution (CC BY) license (http://creativecommons.org/licenses/by/4.0/).
Share and Cite
García-Carrillo, C.; Parga-Torres, J.; Moreno-Casillas, H.; Sellschopp-Sanchez, F.S. Kinetics and Energy Consumption for a Three-Stage Electrocoagulation Process for the Recovery of Au and Ag from Cyanide Leachates. Metals 2019, 9, 758. https://doi.org/10.3390/met9070758
García-Carrillo C, Parga-Torres J, Moreno-Casillas H, Sellschopp-Sanchez FS. Kinetics and Energy Consumption for a Three-Stage Electrocoagulation Process for the Recovery of Au and Ag from Cyanide Leachates. Metals. 2019; 9(7):758. https://doi.org/10.3390/met9070758
Chicago/Turabian StyleGarcía-Carrillo, Cristina, José Parga-Torres, Héctor Moreno-Casillas, and Francisco S. Sellschopp-Sanchez. 2019. "Kinetics and Energy Consumption for a Three-Stage Electrocoagulation Process for the Recovery of Au and Ag from Cyanide Leachates" Metals 9, no. 7: 758. https://doi.org/10.3390/met9070758
APA StyleGarcía-Carrillo, C., Parga-Torres, J., Moreno-Casillas, H., & Sellschopp-Sanchez, F. S. (2019). Kinetics and Energy Consumption for a Three-Stage Electrocoagulation Process for the Recovery of Au and Ag from Cyanide Leachates. Metals, 9(7), 758. https://doi.org/10.3390/met9070758