Abstract
Low variability in mechanical properties is required for pipeline project designs to meet a strain-based design, which is used in regions of large ground movements. The objective of this study is to elucidate the influence of centerline segregation in continuously cast slab on variability in the mechanical property of pipeline steel, and controlling centerline segregation can meet the requirements of a strain-based design. Mannesmann rating method was used to evaluate the degree of segregation of two slabs and its effect on variability in mechanical properties of corresponding plates. Microstructural characterization indicated that bainite/martensite was formed in a segregated area where the content of C and Mn enriched. The mechanical property results indicated that controlling the degree of centerline segregation can reduce tensile strength variability and improve ductile-brittle transition temperature (DBTT).
1. Introduction
With the rapid development of the oil and gas pipeline industry, pipeline projects need to traverse harsh environments [1,2], including discontinuous permafrost, seismic activity, iceberg scour, and landslides which require pipelines that can sustain plastic deformation as a result of large ground movements. To ensure pipeline integrity in environmentally sensitive areas and overall cost effectiveness, a strain-based design approach needs to be considered. Low fluctuations in strength, low yield ratios, and high uniform elongation are often used as new requirements for pipeline designs to meet a strain-based design [3].
The high performance of pipeline steel is determined by fiber structure. Microstructure uniformity is a necessary method for achieving the above mentioned high performance. However, for multi-phase microstructure uniformity control, continuous casting slab uniformity (macro internal quality) is an important factor affecting the fiber uniformity of hot rolled steel plates. Centerline segregation is the major internal defect of continuously cast slab. It is difficult to eliminate during heating and rolling [4,5]. Many studies [6,7,8,9,10,11,12,13,14,15,16] suggested that centerline segregation decreases the mechanical performance of final products, such as: Low temperature toughness, weldability, and resistance to sour gas worsen; delamination fracture and band structure increase. References [17,18,19,20] suggested that control of centerline segregation in continuously cast slab can effectively improve low temperature toughness and elongation of pipeline steel. Because it is impossible to make the continuous casting slab absolutely uniform, it is necessary to recognize the quantitative relationship between degree of segregation of slabs and the performance stability of plates. This paper presents a method to reduce fluctuation of mechanical properties through controlling centerline segregation, which can be applied in the strain-based design of pipeline steels.
2. Materials and Methods
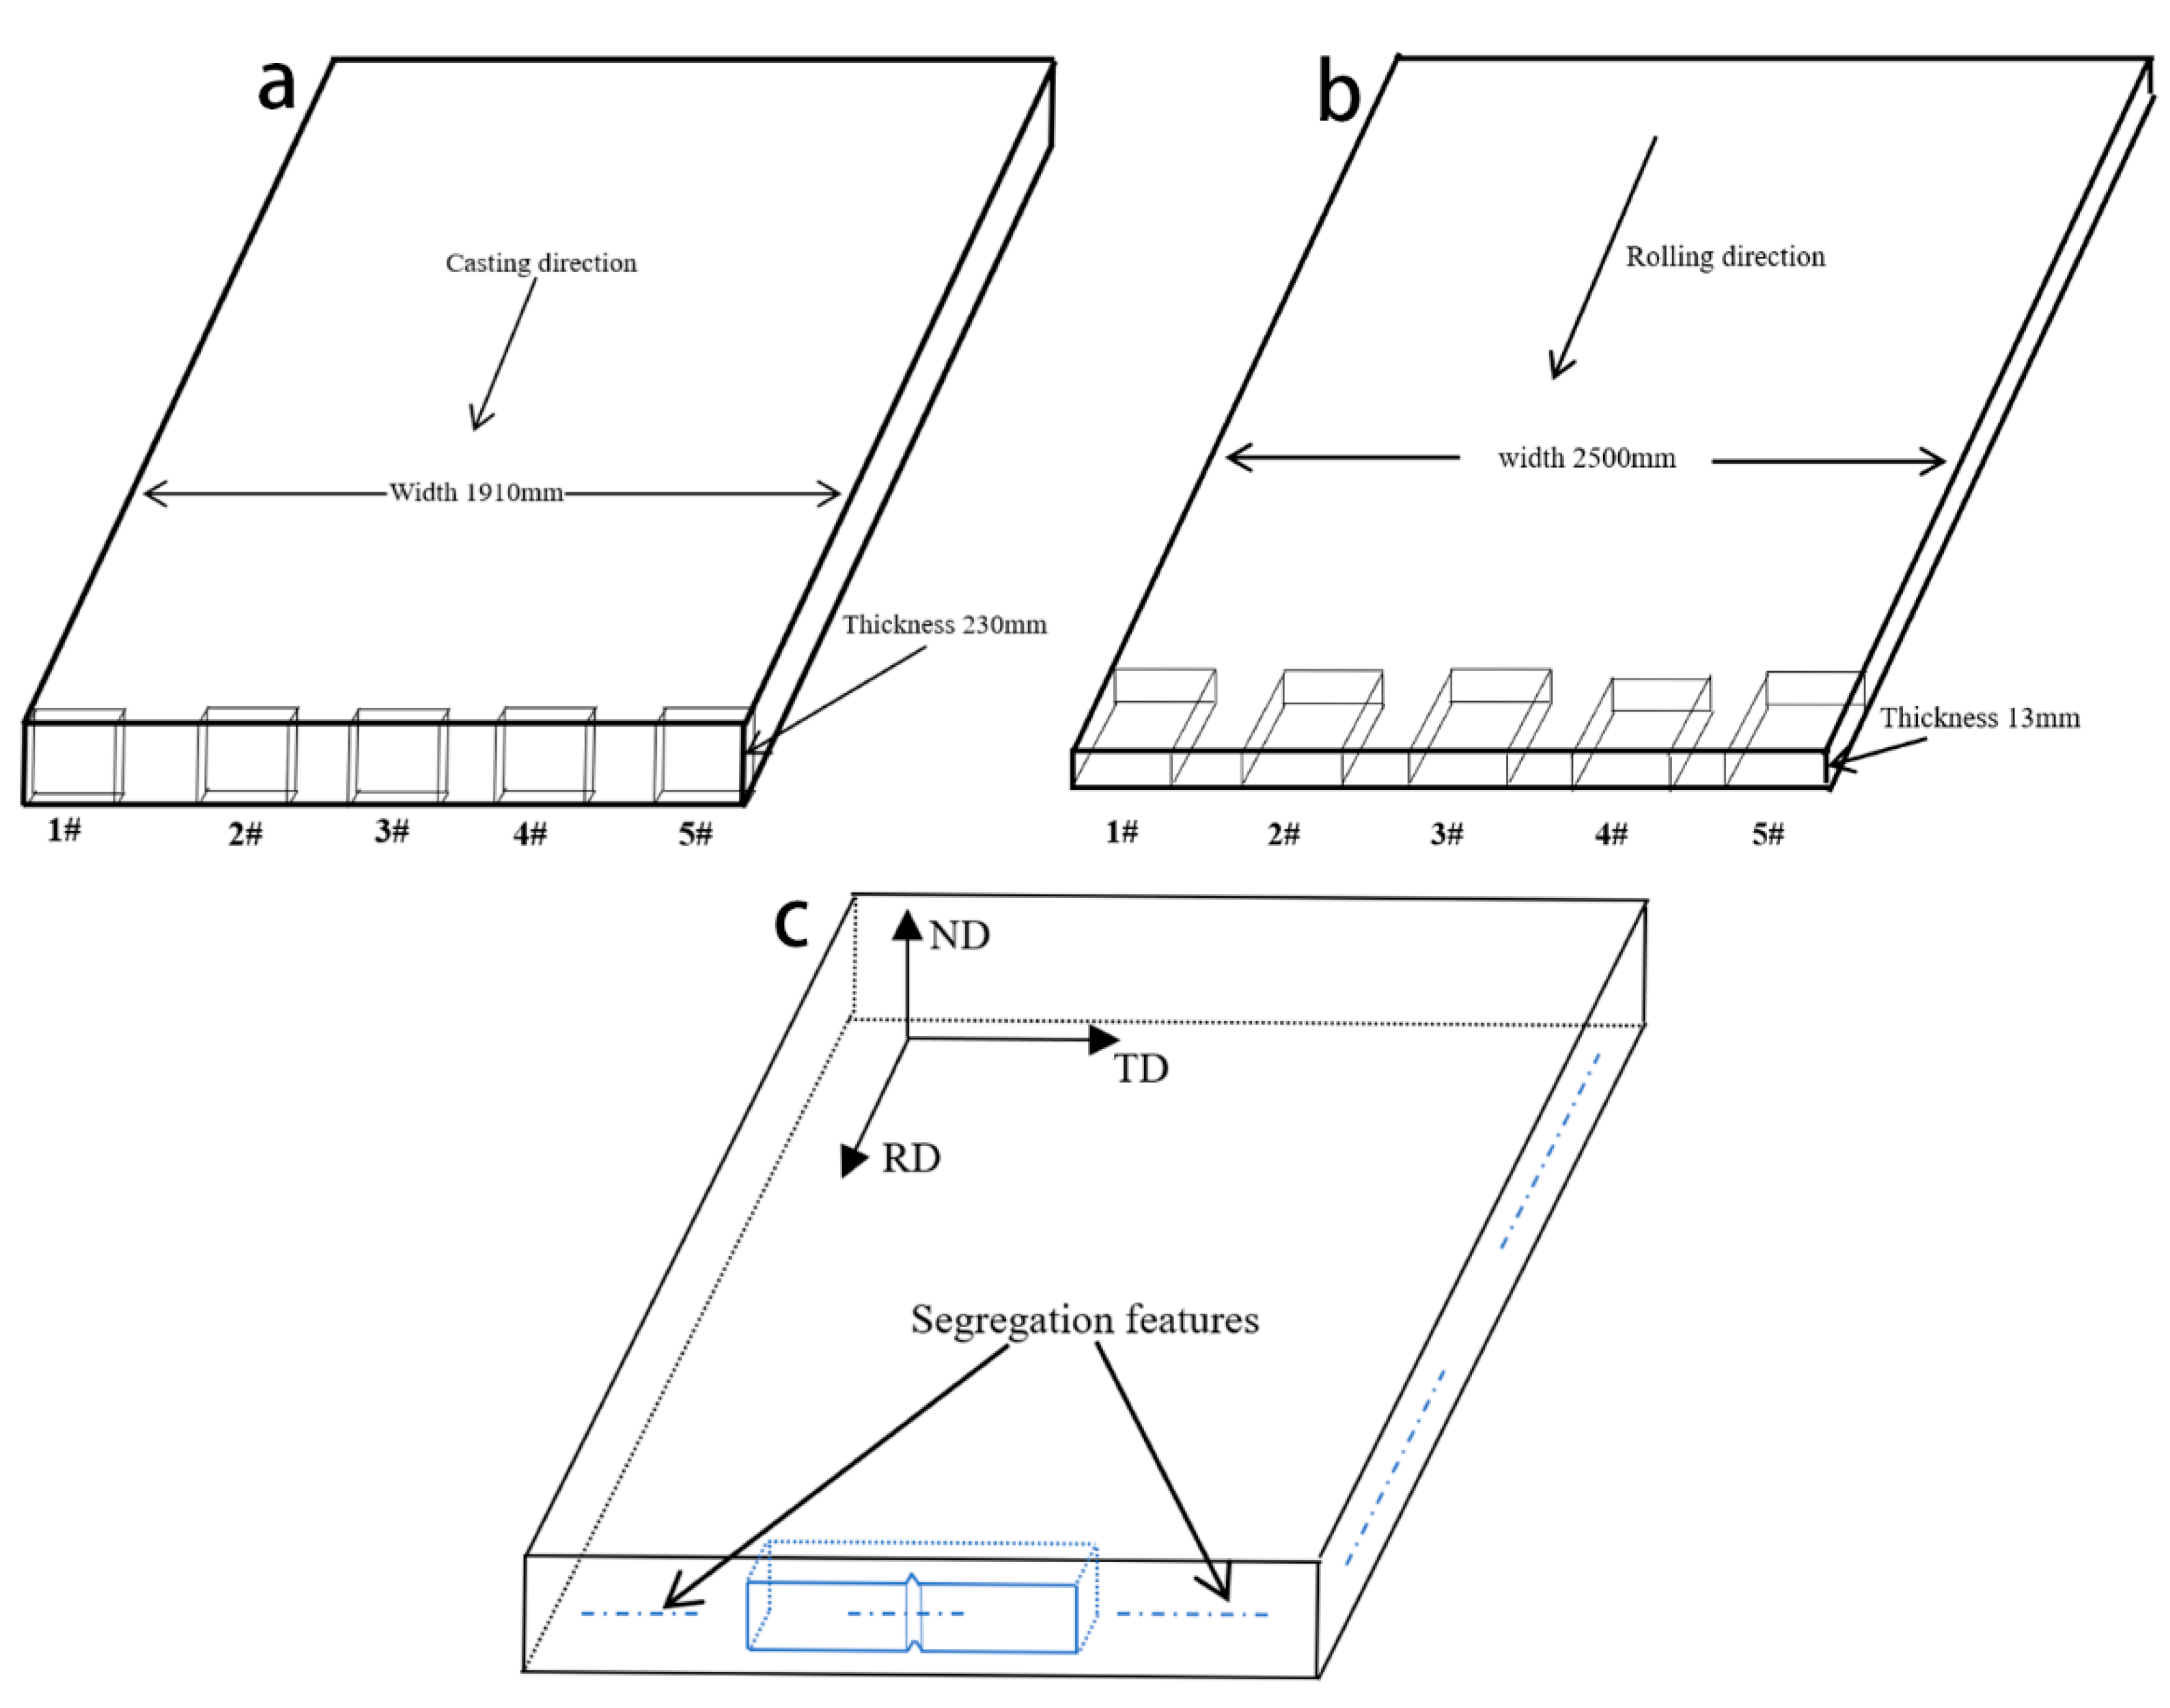
The material used in this study is X70 pipeline steel, which chemical composition in weight percent (wt.%) is 0.045C-1.7Mn-0.1Si-0.41(Mo + Cr + Ni)-0.073(Nb + Ti)-0.012P-0.003S [20]. Two slabs and corresponding plates were studied in this paper and were named slab A and slab B, respectively. The steel plates (13 mm) were rolled using same rolling condition from the two continuously cast slabs with a thickness of 230 mm and a width of 1910 mm, which were produced by using the same continuous casting machine. Slab samples for the evaluation of centerline segregation were taken from the head part of the slab. Each cross section of slab and plate is divided into 5 smaller parts and marked with number 1# (left), 2# (left quarter), 3# (center), 4# (right quarter), and 5# (right), as shown in Figure 1a,b. Centerline segregation in slabs was etched with ~50 pct HCl at ~80 °C for ~30 min, and macro-etched images were taken by a digital camera. The plate samples were taken from the head of plates which were rolled from the corresponding slabs, used for determination of mechanical properties and microstructure. Impact toughness was determined using the Charpy V-notch specimen (55 mm × 10 mm × 10 mm) from each position of two plates, machined according to ISO 148-1 standard from the mid-thickness of plates in the cross-section (Figure 1c), conducting at temperatures of −40, −60, −80, and −100 °C. Vickers micro-hardness (by VMHT 30M, Leica, Wetzlar, Gemany) of the segregation band was measured using a load of 50 g and a dwell time of 15 s. The load was selected to ensure a relatively small indent size.

Figure 1.
Sampling schematic of continuously cast slab and rolled plate: (a) Continuous casting slab; (b) rolled plate; (c) Charpy V-notch specimen.
Samples for microstructure observation were cut from the middle area of the thickness of the plates and then mounted and mechanically polished using standard metallographic procedure. The microstructure of specimens was characterized via a combination of an optical microscope (OM), a scanning electron microscope (ULTRA-55field SEM, ZEISS, Jena, Germany), and a transmission electron microscope (Tecnai G2 F20, FEI, Hillsboro, OR, USA). TEM was carried out using 3 mm disks ground to a thickness of 50 μm and were then twin-jet electropolished with an electrolyte of 10% perchloric acid and 90% ethanol. The diagram of time temperature transformation was calculated by the software JMatPro 7.0 according to the alloy content measured by an electron probe micro-analyzer (EPMA).
3. Results
3.1. Segregation Evaluation of Slabs
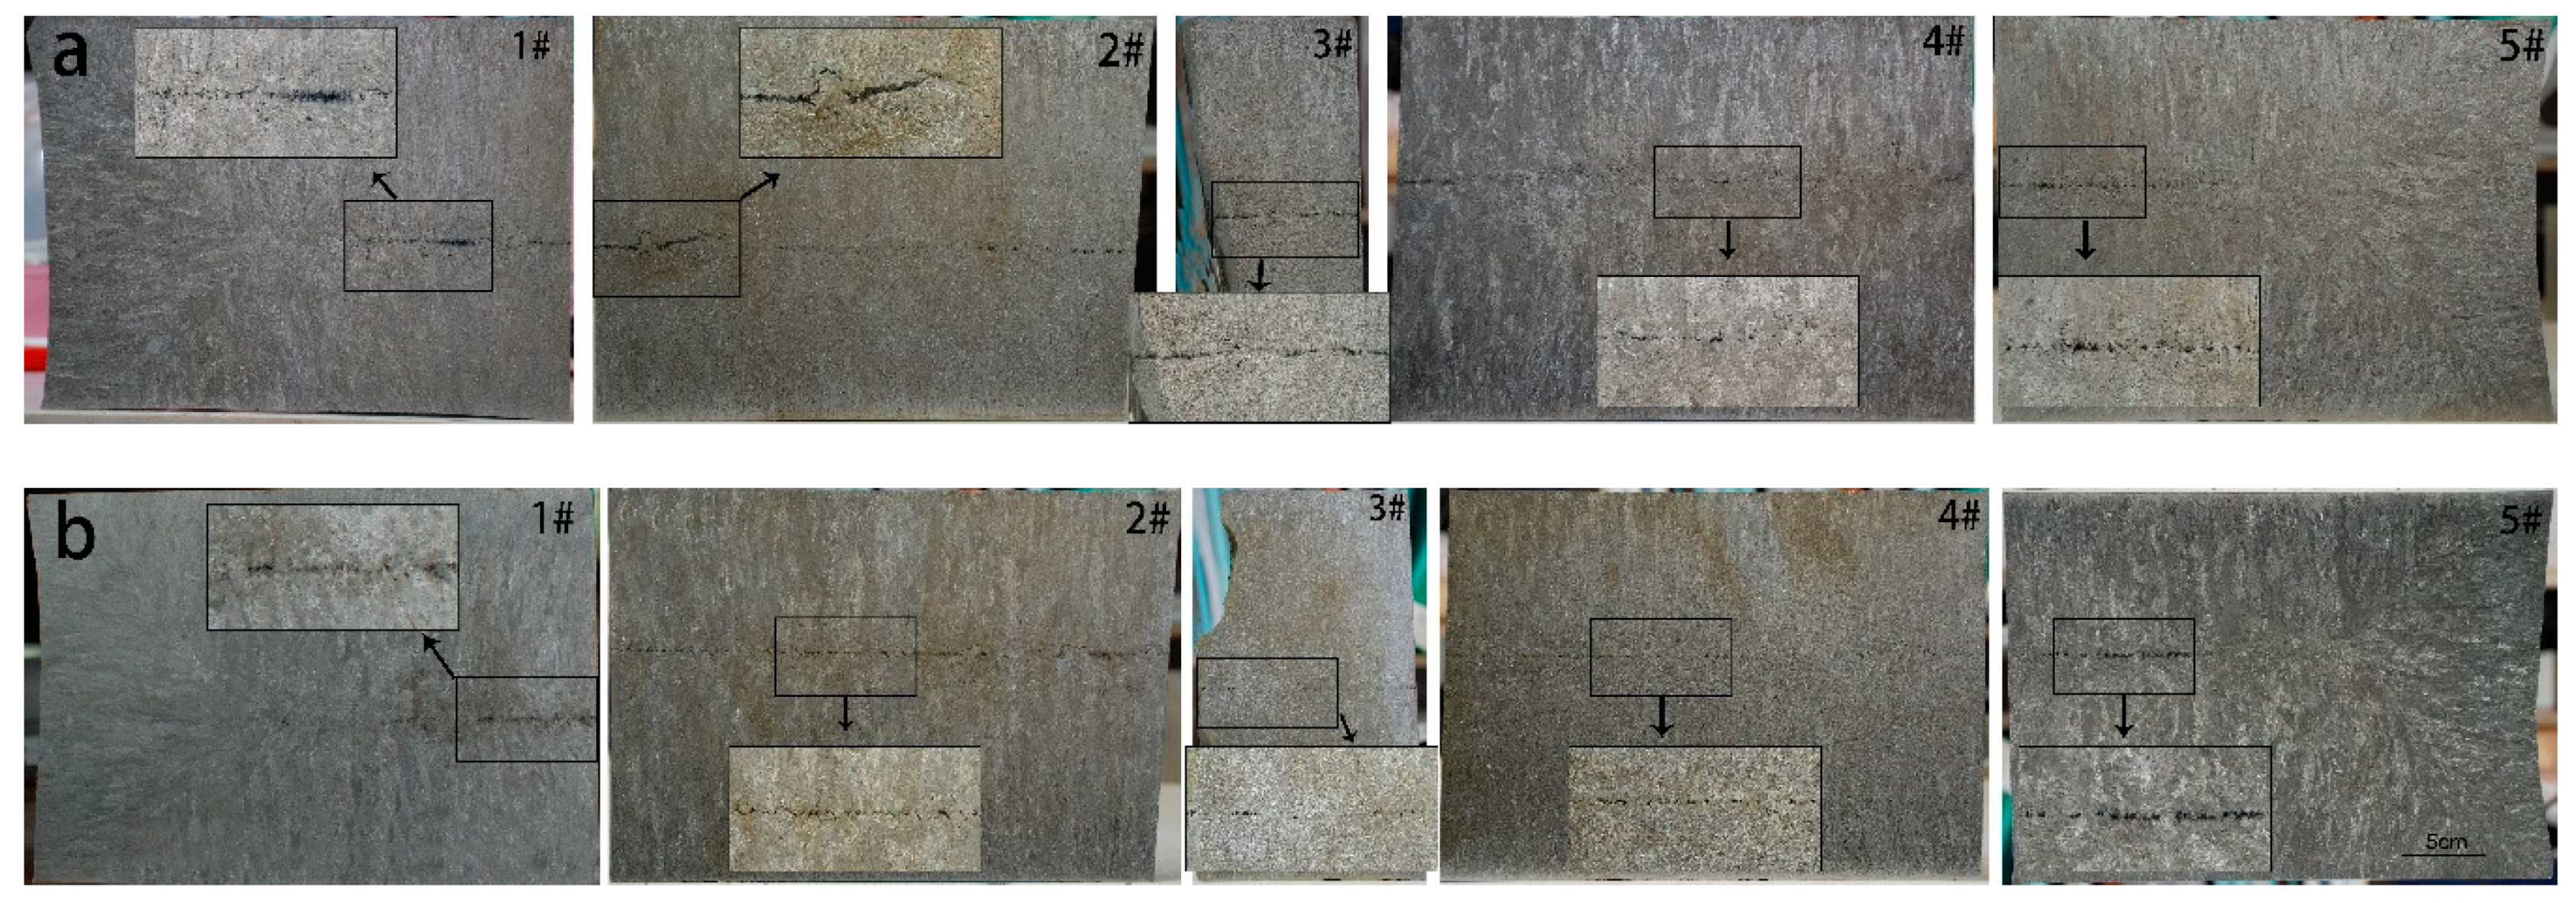
Shown in Figure 2 are the macro-etched slab images with the distribution of the centerline segregation of the slab uneven. In slab A (Figure 2a), the degree of centerline segregation at position 2# and 3# was more severe and rated at Mannesmann class 3.5 [21], while position 1# was the best one in this slab rated at class 2.5. In slab B (Figure 2b), the degree of segregation for the majority of the positions was rated at class 2 except for position 5# which was rated at class 3. The degree of segregation of these two slabs is summarized in Table 1, the segregated severity of slab B was better than slab A, indicating that the distribution of centerline segregation was uneven across the transverse section.
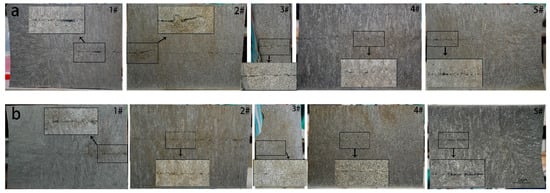
Figure 2.
Images of the macro-etched slab: (a) Slab A; (b) slab B.

Table 1.
Centerline segregation degree rated by the Mannesmann rating method (class).
3.2. Low Temperature Toughness
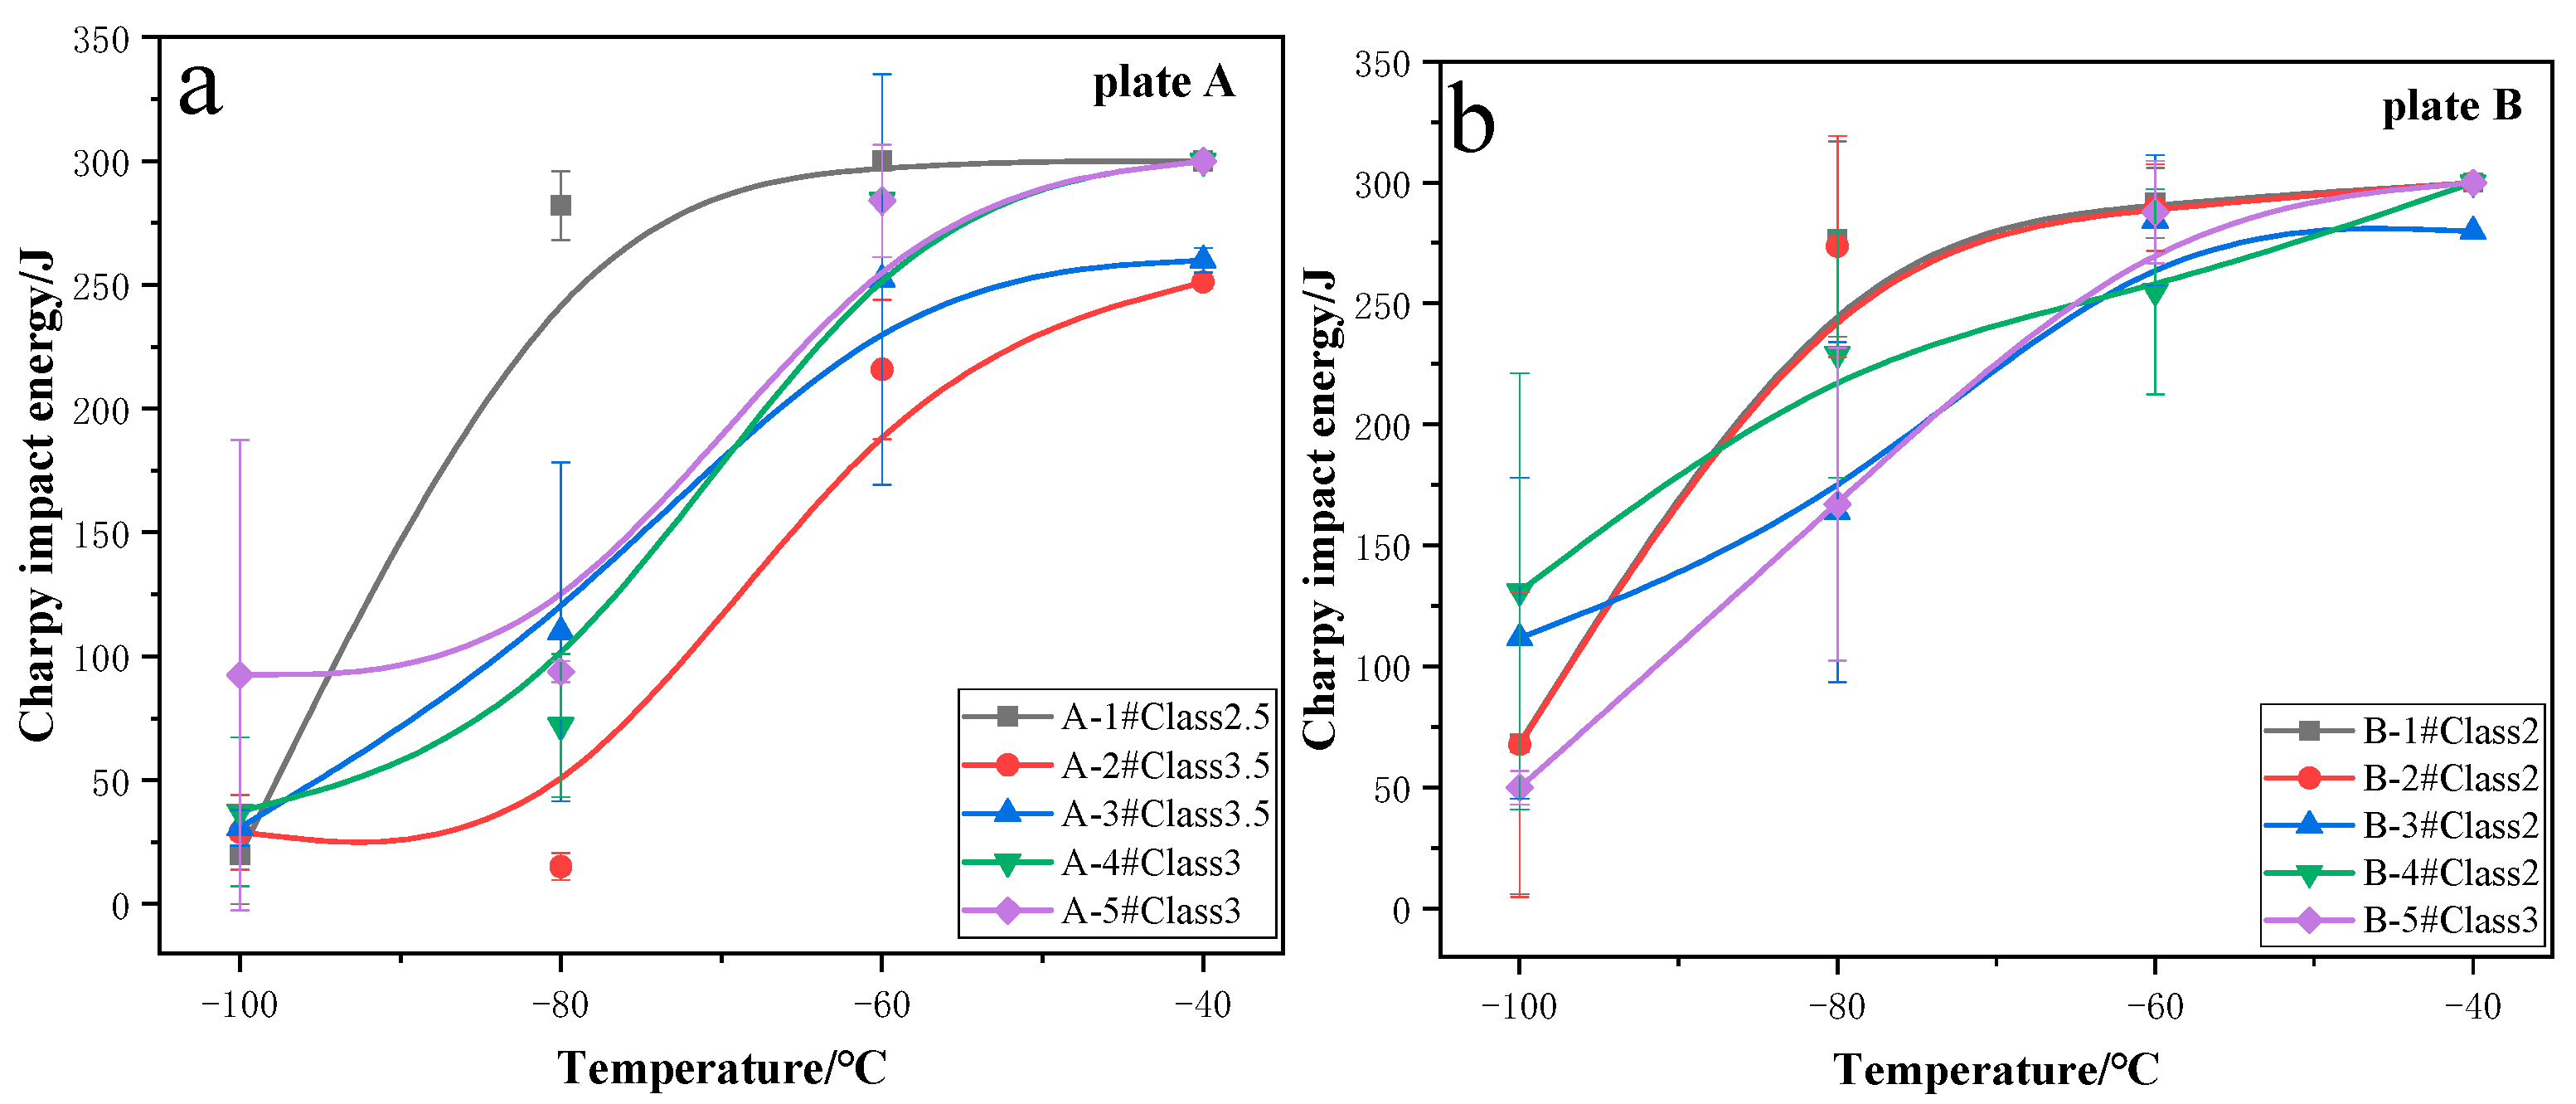
A total of two Charpy tests were performed for each position of two plates which were rolled from each Mannesmann sample location. The results of the Charpy impact test are shown in Figure 3. These ten samples with different segregation degrees and positions from two plates all exhibited good impact toughness. However, the low temperature toughness of these samples was significantly different. Sample A-2# (red line) and A-3# (blue line) with a high severity of centerline segregation (Mannesmann class 3.5) exhibited the lowest impact energy and the ductile-brittle transition temperature (DBTT) of these two samples was ~−65 °C, while sample B-1#, B-2#, B-3#, and B-4# with the lowest degree of segregation (class 2) had the highest impact energy and DBTT of these four samples were ~−90 °C. The DBTT of the remaining samples was between ~−65 °C and ~−90 °C. Therefore, impact energy decreases and DBTT increases as the degree of centerline segregation increases.
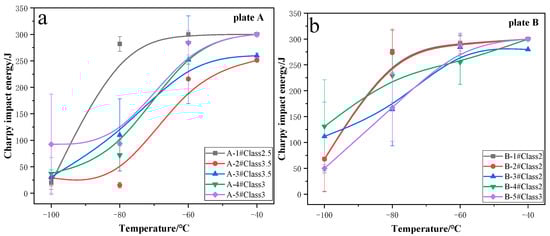
Figure 3.
Charpy impact energy of strips from slabs with different segregation degrees: (a) Plate A; (b) plate B.
In plate A, sample A-2# (class 3.5) exhibited the lowest impact energy, while sample A-1# (class 2.5) had the highest impact energy in the same transverse section of the plate. In plate B, sample B-5# (class 3) exhibited the lowest impact energy, while the remaining three samples had similar impact energy, significantly higher than sample B-5#. At −60 °C, the variability range in toughness of plate A (~75 J) was higher than plate B (~40 J); at −80 °C, the variability range in toughness of plate A (~260 J) was higher than plate B (~75 J). Therefore, the variability in toughness in the same plate was caused by centerline segregation of the slab. This result is consistent with Su et al. [22,23] who suggested that centerline segregation in continuously cast slabs increased variability in mechanical properties of steel plates.
3.3. Tensile Properties
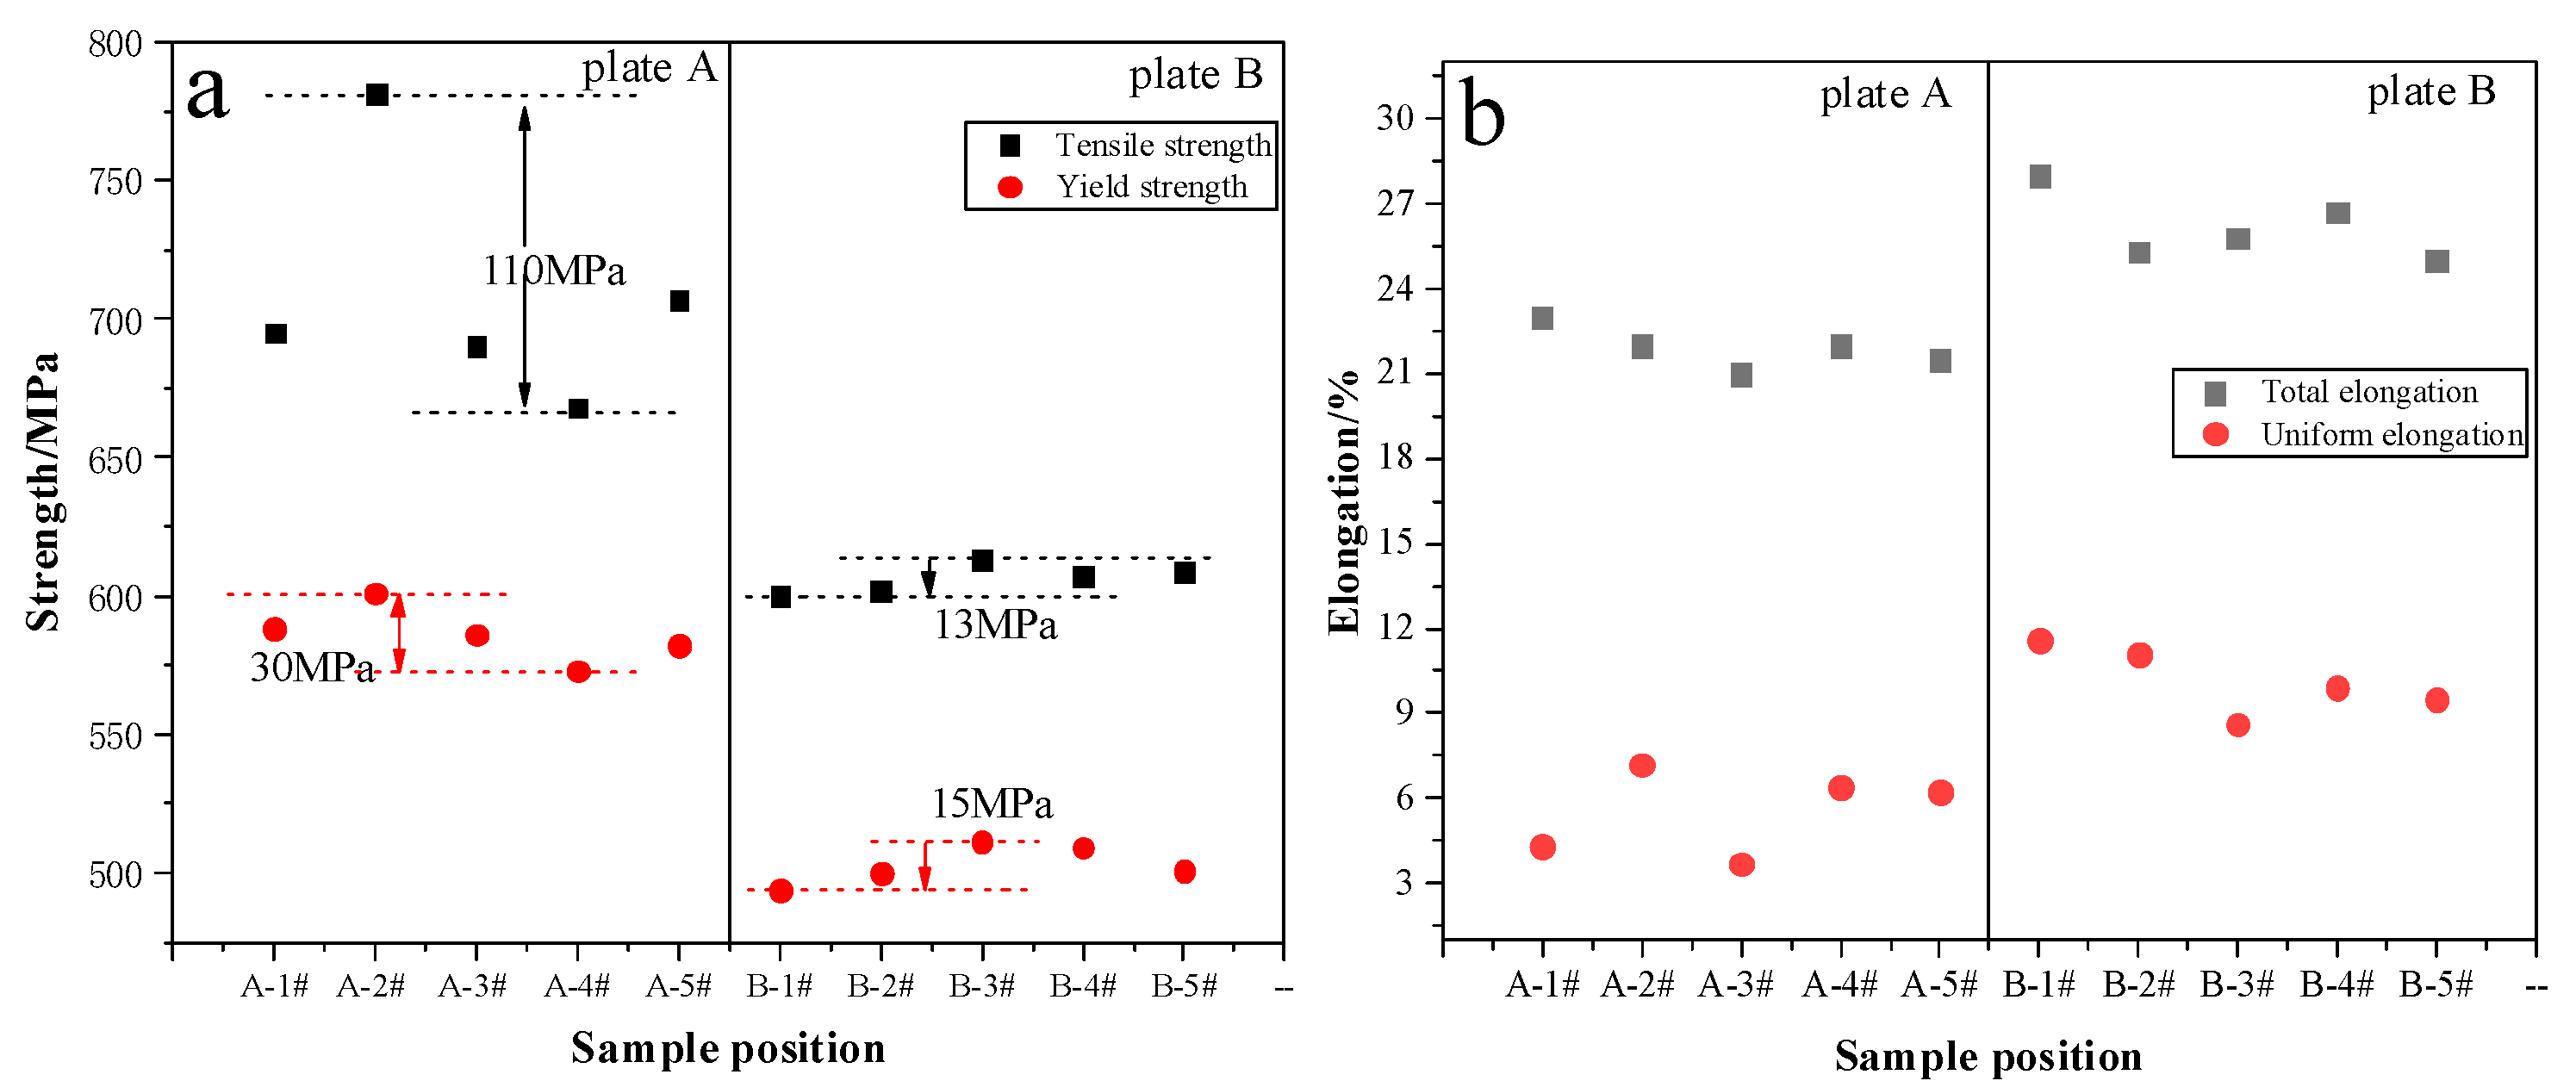
A similar trend was observed in tensile strength and yield strength (Figure 4a), which increase with the increase of the degree of segregation. In plate A, the degree of segregation was from Mannesmann class 2.5 to class 3.5, the variability range of tensile strength and yield strength were ~110 MPa and ~30 MPa, respectively, while in plate B, the degree of segregation was from Mannesmann class 2 to class 3, the variability range of tensile strength and yield strength were ~13 MPa and ~15 MPa, respectively. Therefore, the severity in centerline segregation not only increases the tensile and yield strength, but also increase the variability in tensile strength. Meanwhile, an identical trend was observed for total and uniform elongation, which decreased as the degree of segregation was increased. The total and uniform (Figure 4b) elongation of plate A were significantly lower than plate B because of severity in centerline segregation.
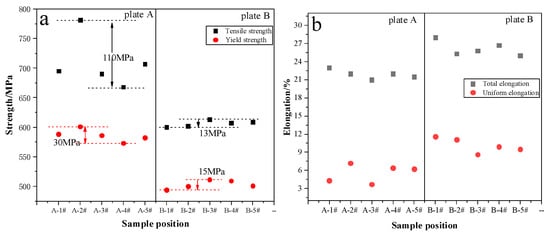
Figure 4.
Tensile test result of plates from slabs with different segregation degree: (a) Tensile and yield strength, (b) total and uniform elongation.
3.4. Microstructure in Segregated Region
Three samples with different degrees of segregation were selected to investigate the impact of segregation on the microstructure. Samples B-4# (Mannesmann class 2), A-4# (class 3), and A-2# (class 3.5) were selected. The microstructure of the segregated area of plates as characterized by OM and SEM is shown in Figure 5. A large amount of lath-like martensite was present in sample A-2# (Figure 5c,f). Lath-like bainite can also be observed in sample A-4# (Figure 5b,e), but its proportion was less than sample A-2#. The microstructure was dominated by polygonal ferrite and a small amount of martensite/austenite constituent (MA) in sample B-4#.
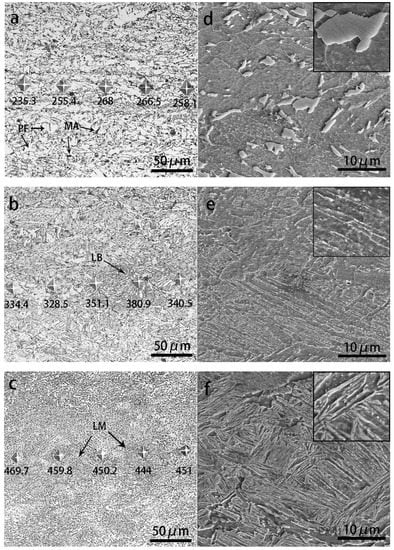
Figure 5.
Microstructure in the segregated region as seen through an optical microscope and a scanning electron microscope: (a) And (d) for sample B-4#; (b) and (e) for sample A-4#; (c) and (f) for sample A-2#.
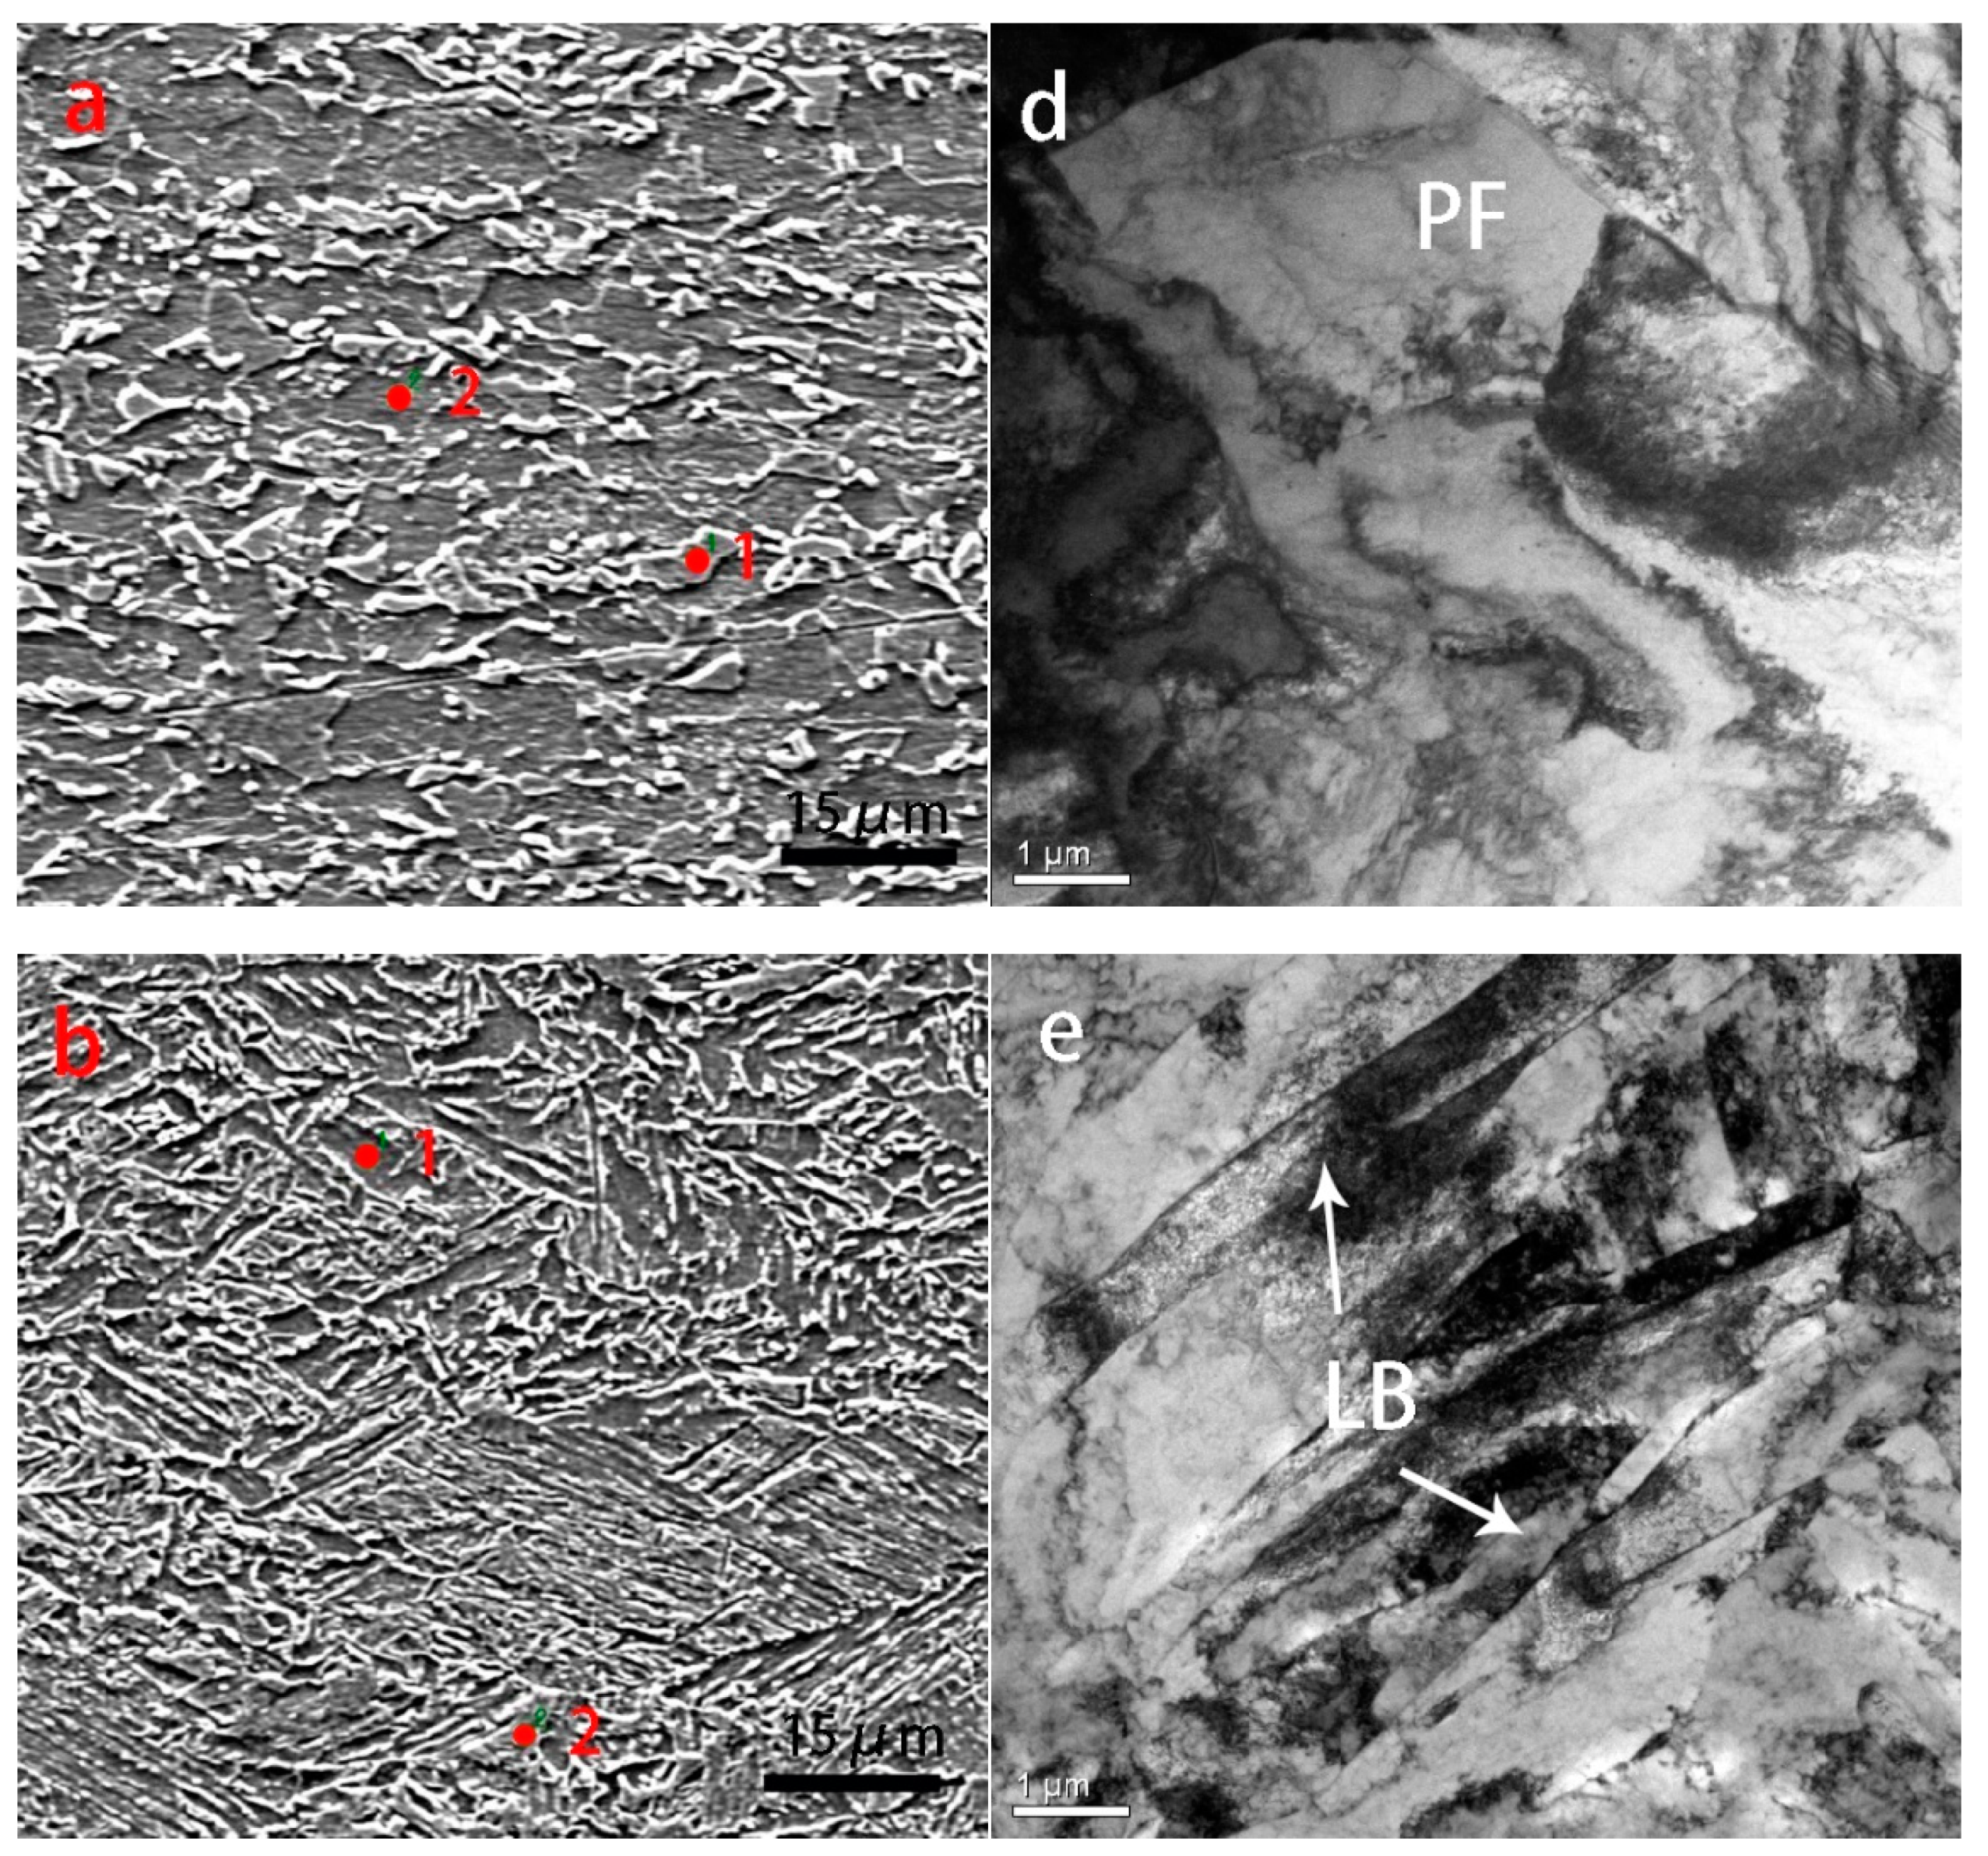
The detailed microstructure of the segregated areas was further characterized by TEM. The microstructure of sample B-4# was polygonal ferrite and MA (Figure 6d), and lath bainite and martensite with different width were observed in samples A-4# and A-2# (Figure 6e,f), respectively. In addition, the size of lath martensite/bainite was measured, with the average width of lath in samples A-4# and A-2# was ~1.24 μm and ~0.87 μm, respectively. Microhardness data confirmed that the microstructures in the segregated region were polygonal ferrite (~256.6 HV), lath bainite (~347.1 HV), and lath martensite (~454.9 HV), respectively.
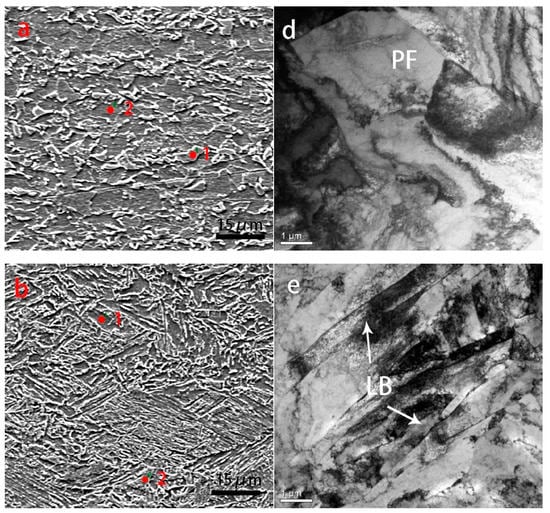
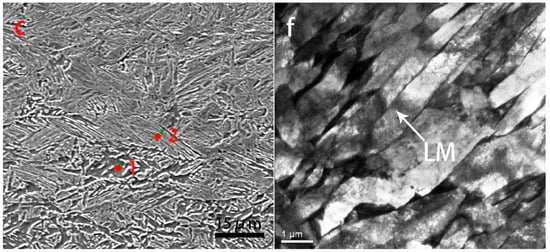
Figure 6.
Measurements of segregated spots in the segregated area by an electron probe micro-analyzer and a transmission electron microscope: (a) And (d) for sample B-4#, (b) and (e) for sample A-4#, (c) and (f) for sample A-2#.
3.5. Enrichment of Elements in Segregated Region
Figure 6a–c shows that the concentration of alloying elements located in the segregated region was measured by EPMA, and the measured spots are the black dots with numbers. Table 2 shows the results of chemical composition (without S and P) in the segregated region of samples B-4#, A-4#, A-2#, S, P composition, which were difficult to be examined by EPMA. The results indicated that all the alloying elements were not segregated except for C and Mn. The content of C in the centerline of plates increased with the increase of the degree of segregation of the corresponding slabs, i.e., for sample B-4# (class 2), sample A-4# (class 3), and sample A-2# (class 3.5), the maximum carbon was 0.47 wt.%, 0.527 wt.%, and 0.732 wt.%, respectively. It should be pointed out that the carbon content is not accurate, because it is a light element, but the carbon content has a meaning. The content of Mn in the centerline of plates had the same trend as the carbon content, i.e., for sample B-4#, sample A-4#, and sample A-2#, the maximum Mn content was 1.813 wt.%, 2.382 wt.%, and 2.385 wt.%, respectively.
Table 2.
Alloy component in the segregated region measured by electron probe micro-analyzer (wt.%).
A previous study [24] reported that the content of Mn was at 1.82 wt.% or 1.76 wt.%, the corresponding microstructure was ferrite, while the content of Mn was up to 2.9 wt.%, its microstructure was bainite/martensite. Literature [25] also suggested that segregation is caused by an enrichment of Mn in the centerline region of plates.
4. Discussion
4.1. Influence of Degree of Segregation on the Microstructure
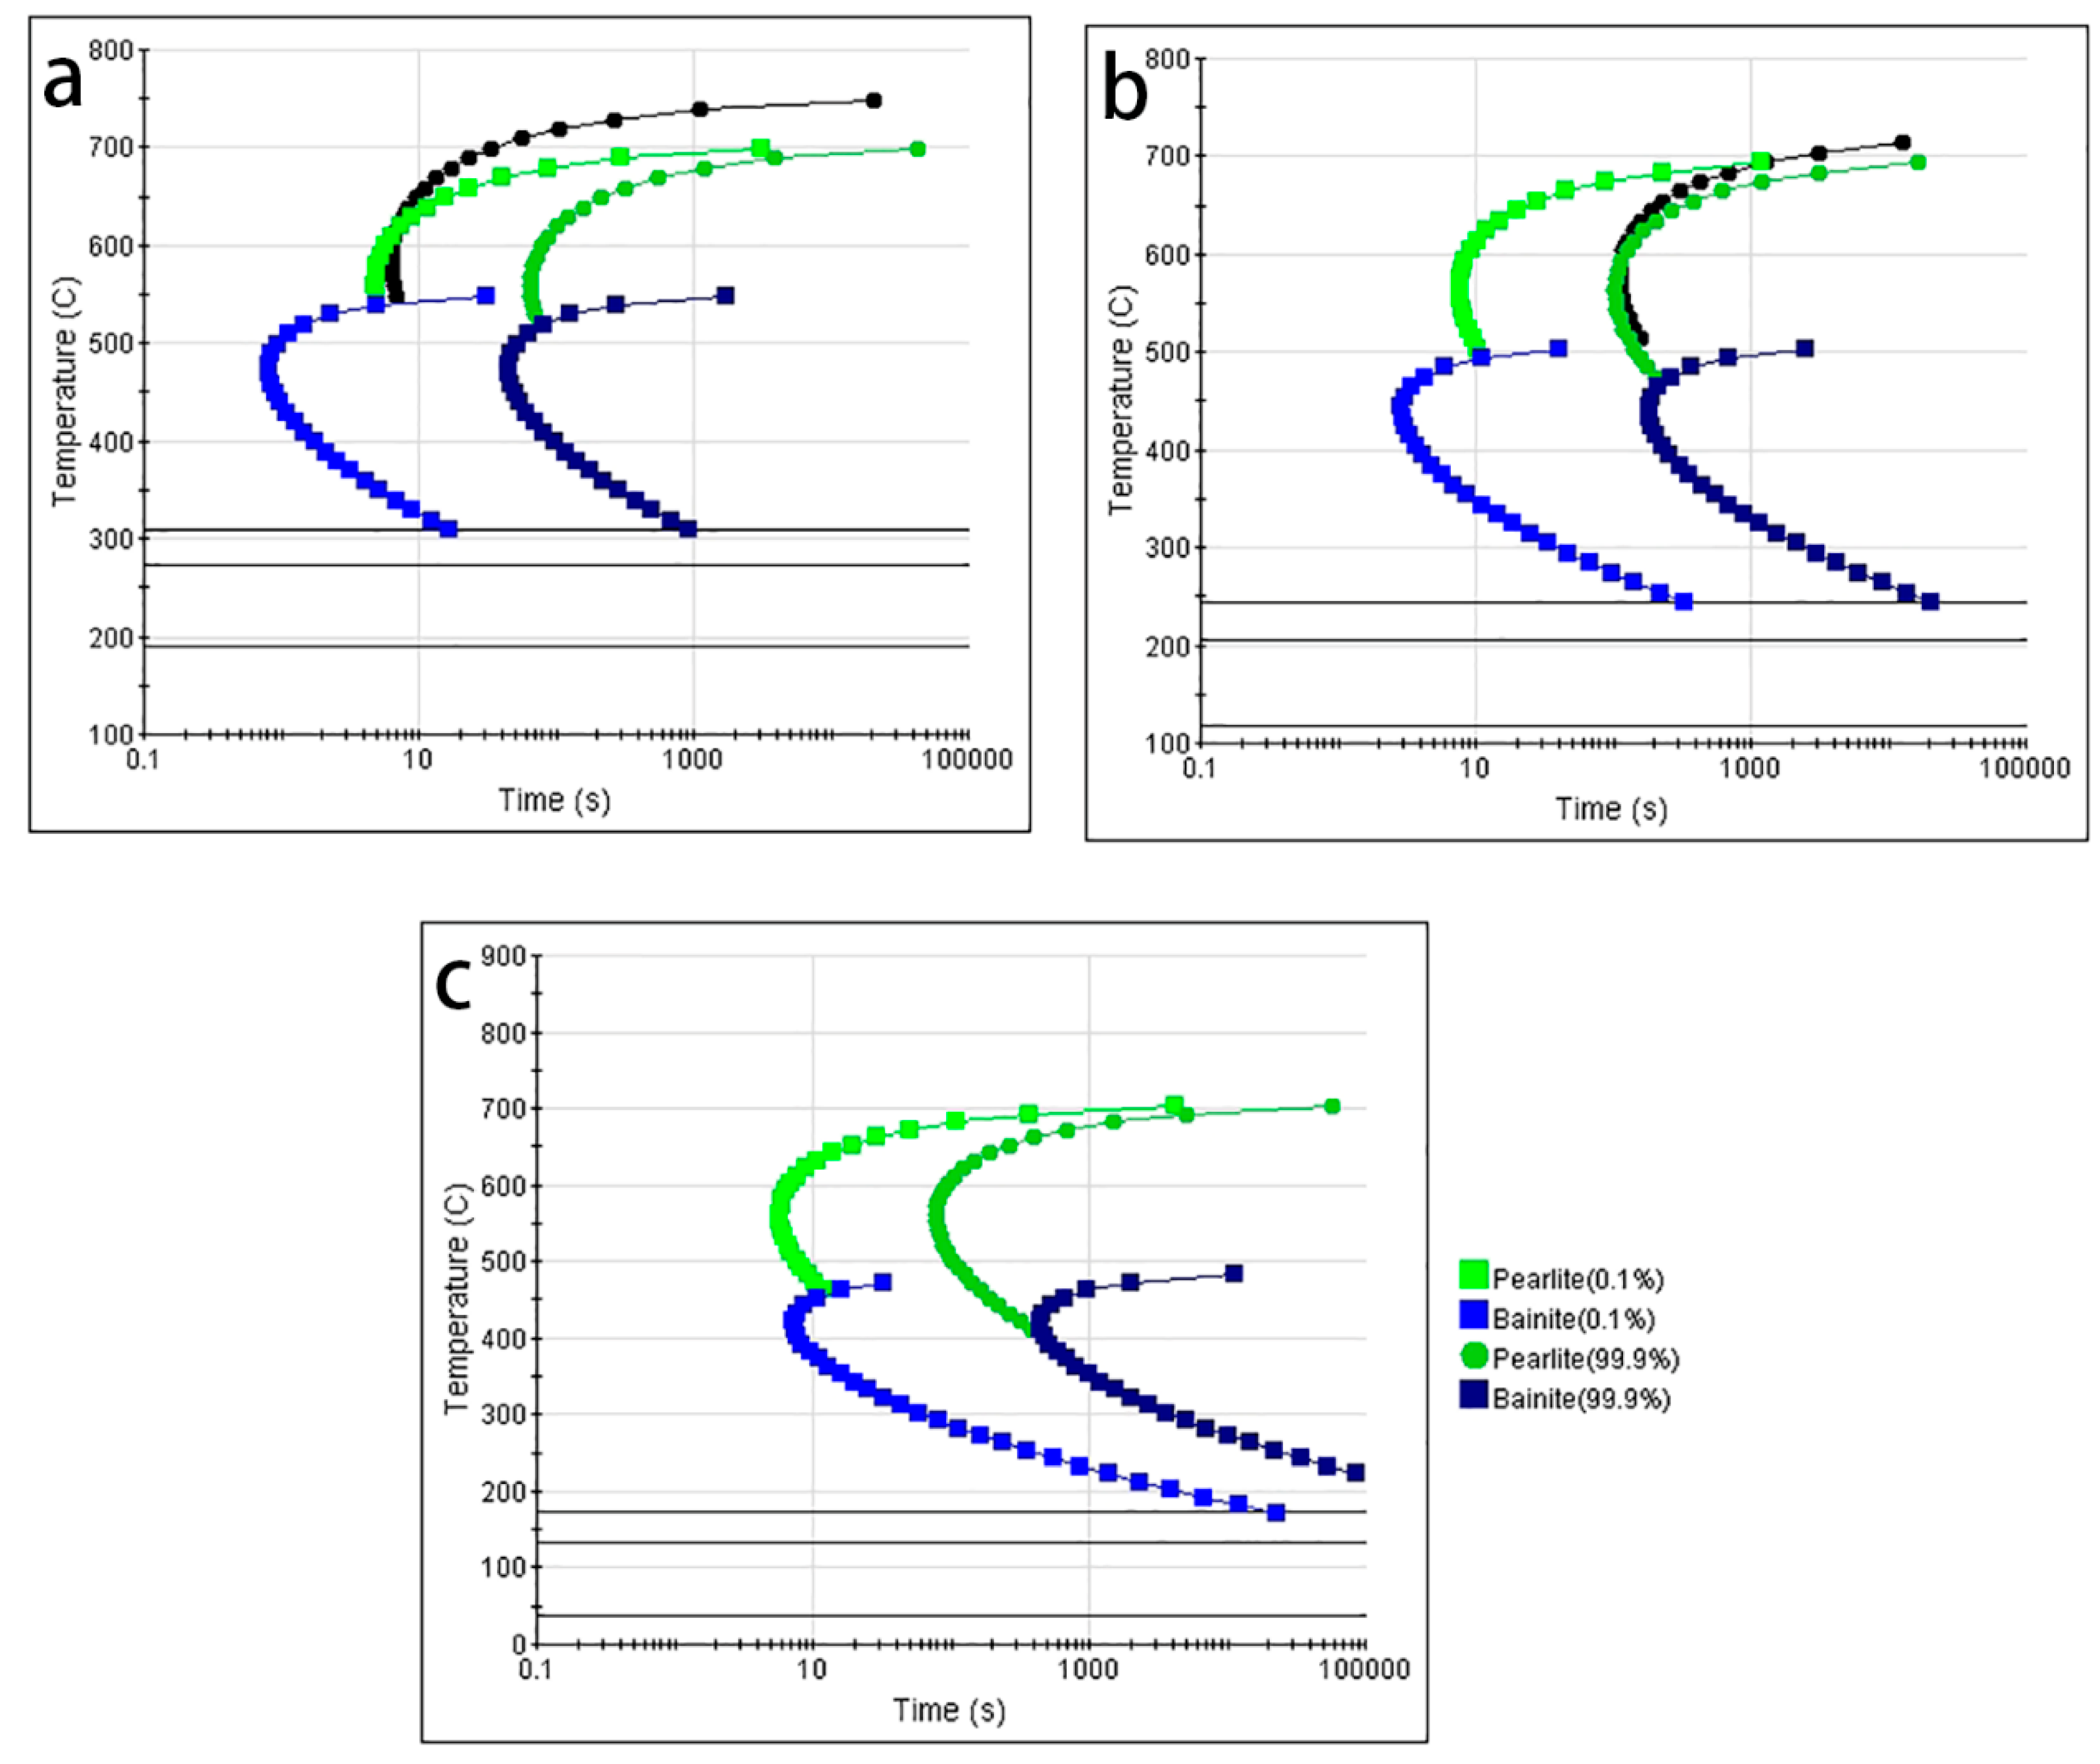
Since a direct correlation between the degree of segregation and mechanical properties was obtained, the following evaluation scale is proposed. The variability range of degree of segregation was from Mannesmann class 2.5 to class 3.5 in slab A, while from class 2 to class 3 in slab B. A total of three plate samples (B-4#, A-4#, and A-2#) with different degrees of segregation (class 2, class 3, and class 3.5, respectively) were selected for further study. The EPMA results (Table 2) show that the content of enriched elements (C and Mn) in the plate centerline region was higher with an increased degree of segregation of corresponding slabs. The transformation temperature can be varied because of the content of enrichment of alloying elements. Previous studies [26,27,28] suggested that Mn in solid solution has an important influence on supercooled austenite transformation. On the one hand, it changes the free energy difference between the phases and varies the temperature of phase transformation point, causing the pearlite transformation curve and the bainite transformation curve to move downward (Figure 7). On the other hand, C and Mn are stabilized austenite elements, while Mn increases the diffusion activation energy of C in austenite, affecting the nucleation and growth process of pearlite transformation and bainite transformation and causing the pearlite transformation curve and the bainite curve to move to the right (Figure 7). At the same cooling rate, the microstructure with different content of alloying elements could be different [22]. Therefore, the microstructure in the centerline region of plates can vary because of segregation.
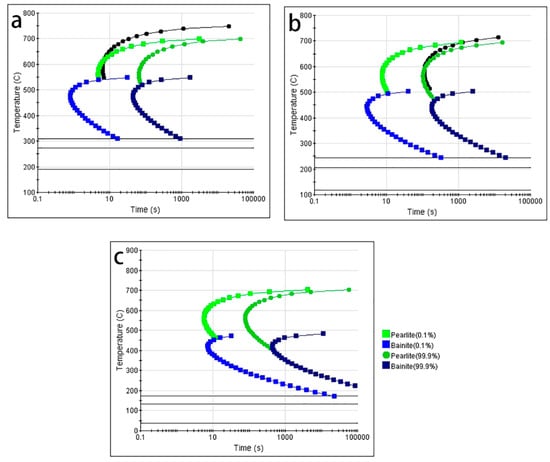
Figure 7.
Time temperature transformation diagram of centerline region of strips: (a) Sample B-4#, (b) sample A-4#, (c) sample A-2#.
4.2. Relationship between Microstructure and Variability on Mechanical Properties
The variability in mechanical properties is often due to the difference in the microstructure, which was caused by the degree of segregation of corresponding slabs. Although samples in plate A all show good low temperature toughness, the variability in toughness was significant. The range of degree of segregation is from class 2.5 to class 3.5, the DBTT increased from −90 °C to −65 °C. However, the low temperature toughness of plate B was better than that of plate A, because the degree of segregation of samples in slab B were all class 2, except for B-5# with class 3, so the toughness variability in plate B was smaller than plate A. At the same time, a similar trend appeared in the tensile test. Comparing with plate B, variability in tensile strength was observed, the strength of plate A was significantly higher than the strength of plate B, and the uniform elongation and total elongation of plate A were lower than in plate B, but variability in uniform was not observed. The reason for variability in strength and toughness is caused by the difference in microstructure in the segregated region and explained by a different degree of segregation. The microstructure in the segregation area of sample B-4# was dominated by polygonal ferrite, while that of sample A-4# and A-2# were lath bainite and lath martensite, respectively. On the other hand, the elongation and toughness of ferrite was better than bainite and martensite. This also explains why the variability in toughness and strength of plate B was small, and the elongation was higher. Through the characterization of microstructure, it is also clearly explained that the variability in the performance of plates in industrial production is mainly caused by centerline segregation heredity of continuous casting slabs.
Based on the strain-based design, the anti-large deformation pipeline steel can withstand large deformations and has some characteristics in terms of structure and performance. Such as the requirements of DNV2000 [29] for pipeline steel, the measured yield strength cannot exceed 100 MPa than the standard specified value, the measured yield ratio is ≤0.85, and the total elongation is ≥25%. Obviously, sample B-4# of which the degree of segregation is at or lower than Mannesmann class 2 can meet the requirements, while the elongation of A-2# and A-4# cannot meet the requirements. Especially the yield strength of plate A-2# exceeds 126 MPa over the standard yield strength. Therefore, controlling the centerline segregation of the continuous casting slab can effectively improve the service performance of the pipeline steel for adapting harsh environments.
5. Conclusions
- (1)
- The relationship between the degree of centerline segregation and mechanical properties indicates that controlling the centerline segregation of continuous casting slab can achieve the requirements of a strain-based design, such as small fluctuations in strength, low yield ratio, high elongation, and better toughness at low temperatures;
- (2)
- As the degree of centerline segregation increases, impact energy decreases gradually and DBTT increases. Meanwhile, the variability in impact toughness becomes larger, especially when the degree of segregation exceeds Mannesmann class 2; i.e., at −60 °C, the variability range in toughness (~75 J) of plate A (segregation degree higher than class 2) was higher than plate B (~40 J, segregation degree almost at class 2); at −80 °C, the variability range in toughness of plate A (~260 J) is higher than plate B (~75 J);
- (3)
- With an increase in the degree of segregation, the tensile and yield strength increased; elongation decreased, the variability in strength increased. When the degree of centerline segregation is higher than the Mannesmann class 2, the variability range of tensile strength ranges from ~13 MPa to ~110 MPa;
- (4)
- When the degree of centerline segregation in the continuous casting slab exceeds the Mannesmann class 2, the microstructure in the centerline of the corresponding rolling plate is transformed from ferrite and pearlite into bainite/martensite.
Author Contributions
C.S., R.D.K.M., and X.W. designed and supervised the research; W.L. performed the experiments; F.G. analyzed the data and wrote the paper.
Funding
This research was funded by National Key Research and Development Plan project of China, grant number 2017YFB0304700.
Acknowledgments
This research was financially supported by Anshan Iron and Steel Group Company and National Key Research and Development Plan project of China (2017YFB0304700).
Conflicts of Interest
The authors declare no conflict of interest.
References
- Macia, M.L.; Kibey, S.A.; Arslan, H. Approaches to Qualify Strain-Based Design Pipelines. In Proceedings of the 8th International Pipeline Conference, American Society of Mechanical Engineers, Calgary, AB, Canada, 27 September–1 October 2010; pp. 365–374. [Google Scholar]
- Zhou, J.; Horsley, D.; Rothwell, B. Application of strain-based design for pipelines in permafrost areas. In Proceedings of the 2006 International Pipeline Conference. American Society of Mechanical Engineers, Calgary, AB, Canada, 25–29 September 2006; pp. 899–907. [Google Scholar]
- Liu, B.; Liu, X.J.; Zhang, H.J. Strain-based design criteria of pipelines. J. Loss Prev. Proc. 2009, 22, 884–888. [Google Scholar] [CrossRef]
- Beckermann, C. Macrosegregation ASM Handbook; American Society of Metals: Geauga County, OH, USA, 2008; Volume 15, pp. 4733–4738. [Google Scholar]
- Flemings, M.C. Our understanding of macrosegregation: Past and present. ISIJ Int. 2000, 40, 833–841. [Google Scholar] [CrossRef]
- Fujda, M. Centerline segregation of continuously cast slabs influence on microstructure and fracture morphology. J. Metal Mater. Miner. 2005, 15, 45–51. [Google Scholar]
- Ueyama, S.; Niizuma, M.; Yonezawa, K. Development of High Quality Heavy Plates on Steelmaking Process at Kimitsu Works. Nippon Steel Tech. Rep. 2013, 104, 102–108. [Google Scholar]
- Bor, A.S. Effect of pearlite banding on mechanical properties of hot-rolled steel plates. ISIJ Int. 1991, 31, 1445–1446. [Google Scholar] [CrossRef]
- Osamu, H.; Hidenari, K.; Yasuhiro, H.; Setsuo, K.; Hajime, B.; Shoji, S. Macro-and semi-macroscopic features of the centerline segregation in CC slabs and their effect on product quality. ISIJ Int. 1984, 24, 891–898. [Google Scholar]
- Mendoza, R.; Alanis, M.; Perez, R.; Alvarez, O.; Gonzalez, C.; Juarez-Islas, J.A. On the processing of Fe–C–Mn–Nb steels to produce plates for pipelines with sour gas resistance. Mater. Sci. Eng. A 2002, 337, 115–120. [Google Scholar] [CrossRef]
- Lin, B.Y.; Chen, E.T.; Lei, T.S. The effect of segregation on the austemper transformation and toughness of ductile irons. J. Mater. Eng. Perform. 1998, 7, 407–419. [Google Scholar] [CrossRef]
- Tushal, K.; Shant, J.R.; Rajesh, K.G.; Kathayat, T.S. Understanding the Delamination and Its Effect on Charpy Impact Energy in Thick Wall Linepipe Steel. J. Mater. Metall. Eng. 2014, 4, 31–39. [Google Scholar]
- Bhattacharya, D.; Roy, T.K.; Mahashabde, V.V. A study to establish correlation between intercolumnar cracks in slabs and off-center defects in hot-rolled products. J. Fail. Anal. Prev. 2016, 16, 95–103. [Google Scholar] [CrossRef]
- Loucif, A.; Fredj, E.B.; Harris, N.; Shahriari, D.; Jahazi, M.; Lapierre-Boire, L.-P. Evolution of A-type macrosegregation in large size steel ingot after multistep forging and heat treatment. Metall. Mater. Trans. B 2018, 49, 1046–1055. [Google Scholar] [CrossRef]
- Tao, J.; Hu, S.; Yan, F.; Zhang, Y.; Langley, M. A study of the mechanism of delamination fracture in bainitic magnetic yoke steel. Mater. Des. 2016, 108, 429–439. [Google Scholar] [CrossRef]
- Zhang, G.; Yang, X.; He, X.; Li, J.; Hu, H. Enhancement of mechanical properties and failure mechanism of electron beam welded 300M ultrahigh strength steel joints. Mater. Des. 2013, 45, 56–66. [Google Scholar] [CrossRef]
- Ji, Y.; Lan, P.; Geng, H.; He, Q.; Shang, C.; Zhang, J. Behavior of Spot Segregation in Continuously Cast Blooms and the Resulting Segregated Band in Oil Pipe Steels. Steel Res. Int. 2018, 89, 1700331. [Google Scholar] [CrossRef]
- Su, L.; Li, H. The assessment of centreline segregation in continuously cast line pipe steel slabs using image analysis. In Proceedings of the 6th International Pipeline Technology Conference, American Society of Mechanical Engineers Ostend, Ostend, Belgium, 7–9 October 2013; Volume 1. [Google Scholar]
- Collins, L.E. Effects of Segregation on the Mechanical Performance of X70 Line Pipe. In Proceedings of the 11th International Pipeline Conference, American Society of Mechanical Engineers, Calgary, AB, Canada, 26–30 September 2016; Volume 1. [Google Scholar]
- Guo, F.; Wang, X.; Liu, W.; Shang, C.; Misra, R.D.K.; Wang, H.; Zhao, T.; Peng, C. The Influence of Centerline Segregation on the Mechanical Performance and Microstructure of X70 Pipeline Steel. Steel Res. Int. 2018, 89, 1800407. [Google Scholar] [CrossRef]
- No. SN 960: 2009. Classification of Defects in Materials-Standard Charts and Sample Guide; SMS Demag AG Mannesmann: Düsseldorf, Germany, 2009. [Google Scholar]
- Nayak, S.S.; Misra, R.D.K.; Hartmann, J.; Siciliano, F.; Gray, J.M. Microstructure and properties of low manganese and niobium containing HIC pipeline steel. Mater. Sci. Eng. A 2008, 494, 456–463. [Google Scholar] [CrossRef]
- Su, L.; Li, H.; Lu, C.; Li, J.; Fletcher, L.; Simpson, I.; Barbaro, F.J.; Zheng, L.; Bai, M.; Shen, J.; et al. Transverse and z-direction CVN impact tests of X65 line pipe steels of two centerline segregation ratings. Metall. Mater. Tran. A 2016, 47, 3919–3932. [Google Scholar] [CrossRef]
- Bhattacharya, D.; Poddar, G.P.; Misra, S. Centreline defects in strips produced through thin slab casting and rolling. Mater. Sci. Tech. 2016, 32, 1354–1365. [Google Scholar] [CrossRef]
- Lee, H.; Jo, M.C.; Sohn, S.S.; Zargaran, A.; Ryu, J.H.; Kim, N.J.; Lee, S. Novel medium-Mn (austenite + martensite) duplex hot-rolled steel achieving 1.6 GPa strength with 20% ductility by Mn-segregation-induced TRIP mechanism. Acta Mater. 2018, 147, 247–260. [Google Scholar] [CrossRef]
- Mukherjee, M.; Chintha, A.R.; Kundu, S.; Misra, S.; Singh, J.; Bhanu, C.; Venugopalan, T. Development of stretch flangeable ferrite–bainite grades through thin slab casting and rolling. Mater. Sci. Tech. 2016, 32, 348–355. [Google Scholar] [CrossRef]
- Zhang, H.; Cheng, X.; Bai, B.; Fang, H. The tempering behavior of granular structure in a Mn-series low carbon steel. Mater. Sci. Eng. A 2011, 528, 920–924. [Google Scholar] [CrossRef]
- Feng, R. Research on Internal Quality and Its Influencing Factors of Ferrite/Pearlite Steel Plate. Ph.D. Thesis, Shandong University, Shandong, China, 30 October 2013. [Google Scholar]
- DNV-OS-F101: 2000. Offshore Standard Submarine Pipeline Design; Det Norske, Veritas: Oslo, Norway, 2000. [Google Scholar]


© 2019 by the authors. Licensee MDPI, Basel, Switzerland. This article is an open access article distributed under the terms and conditions of the Creative Commons Attribution (CC BY) license (http://creativecommons.org/licenses/by/4.0/).