Effect Range of the Material Constraint-II. Interface Crack


Abstract
:1. Introduction
2. Materials and Models’ Design
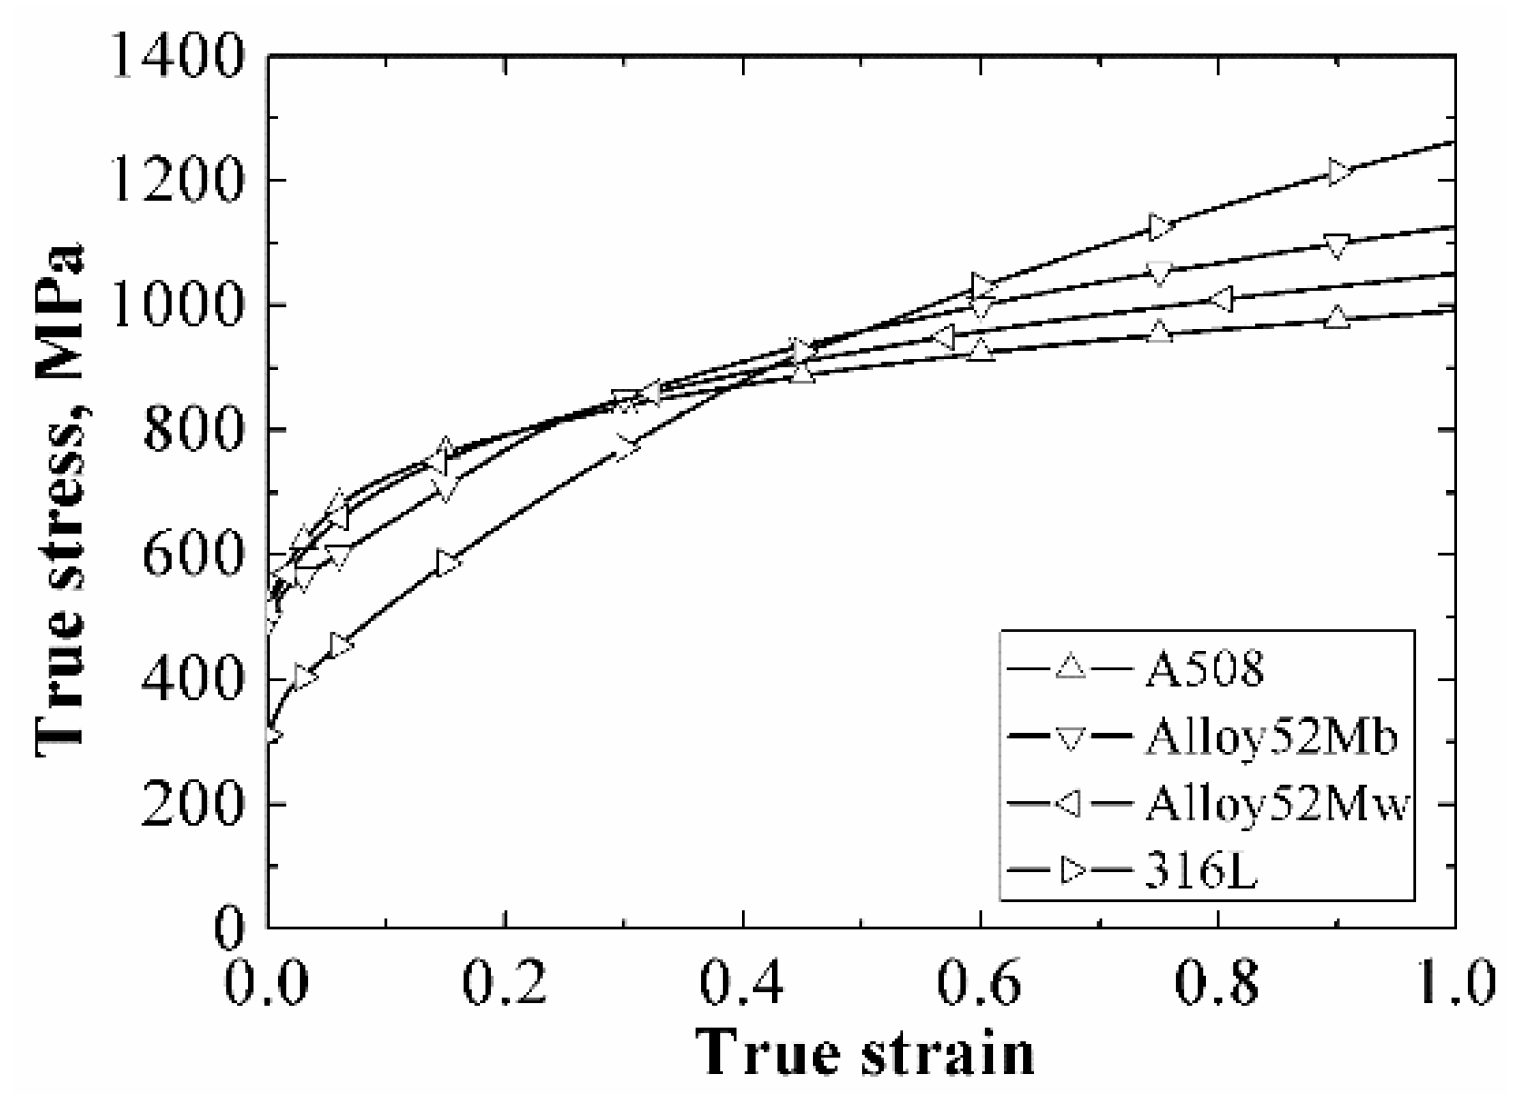
2.1. Materials
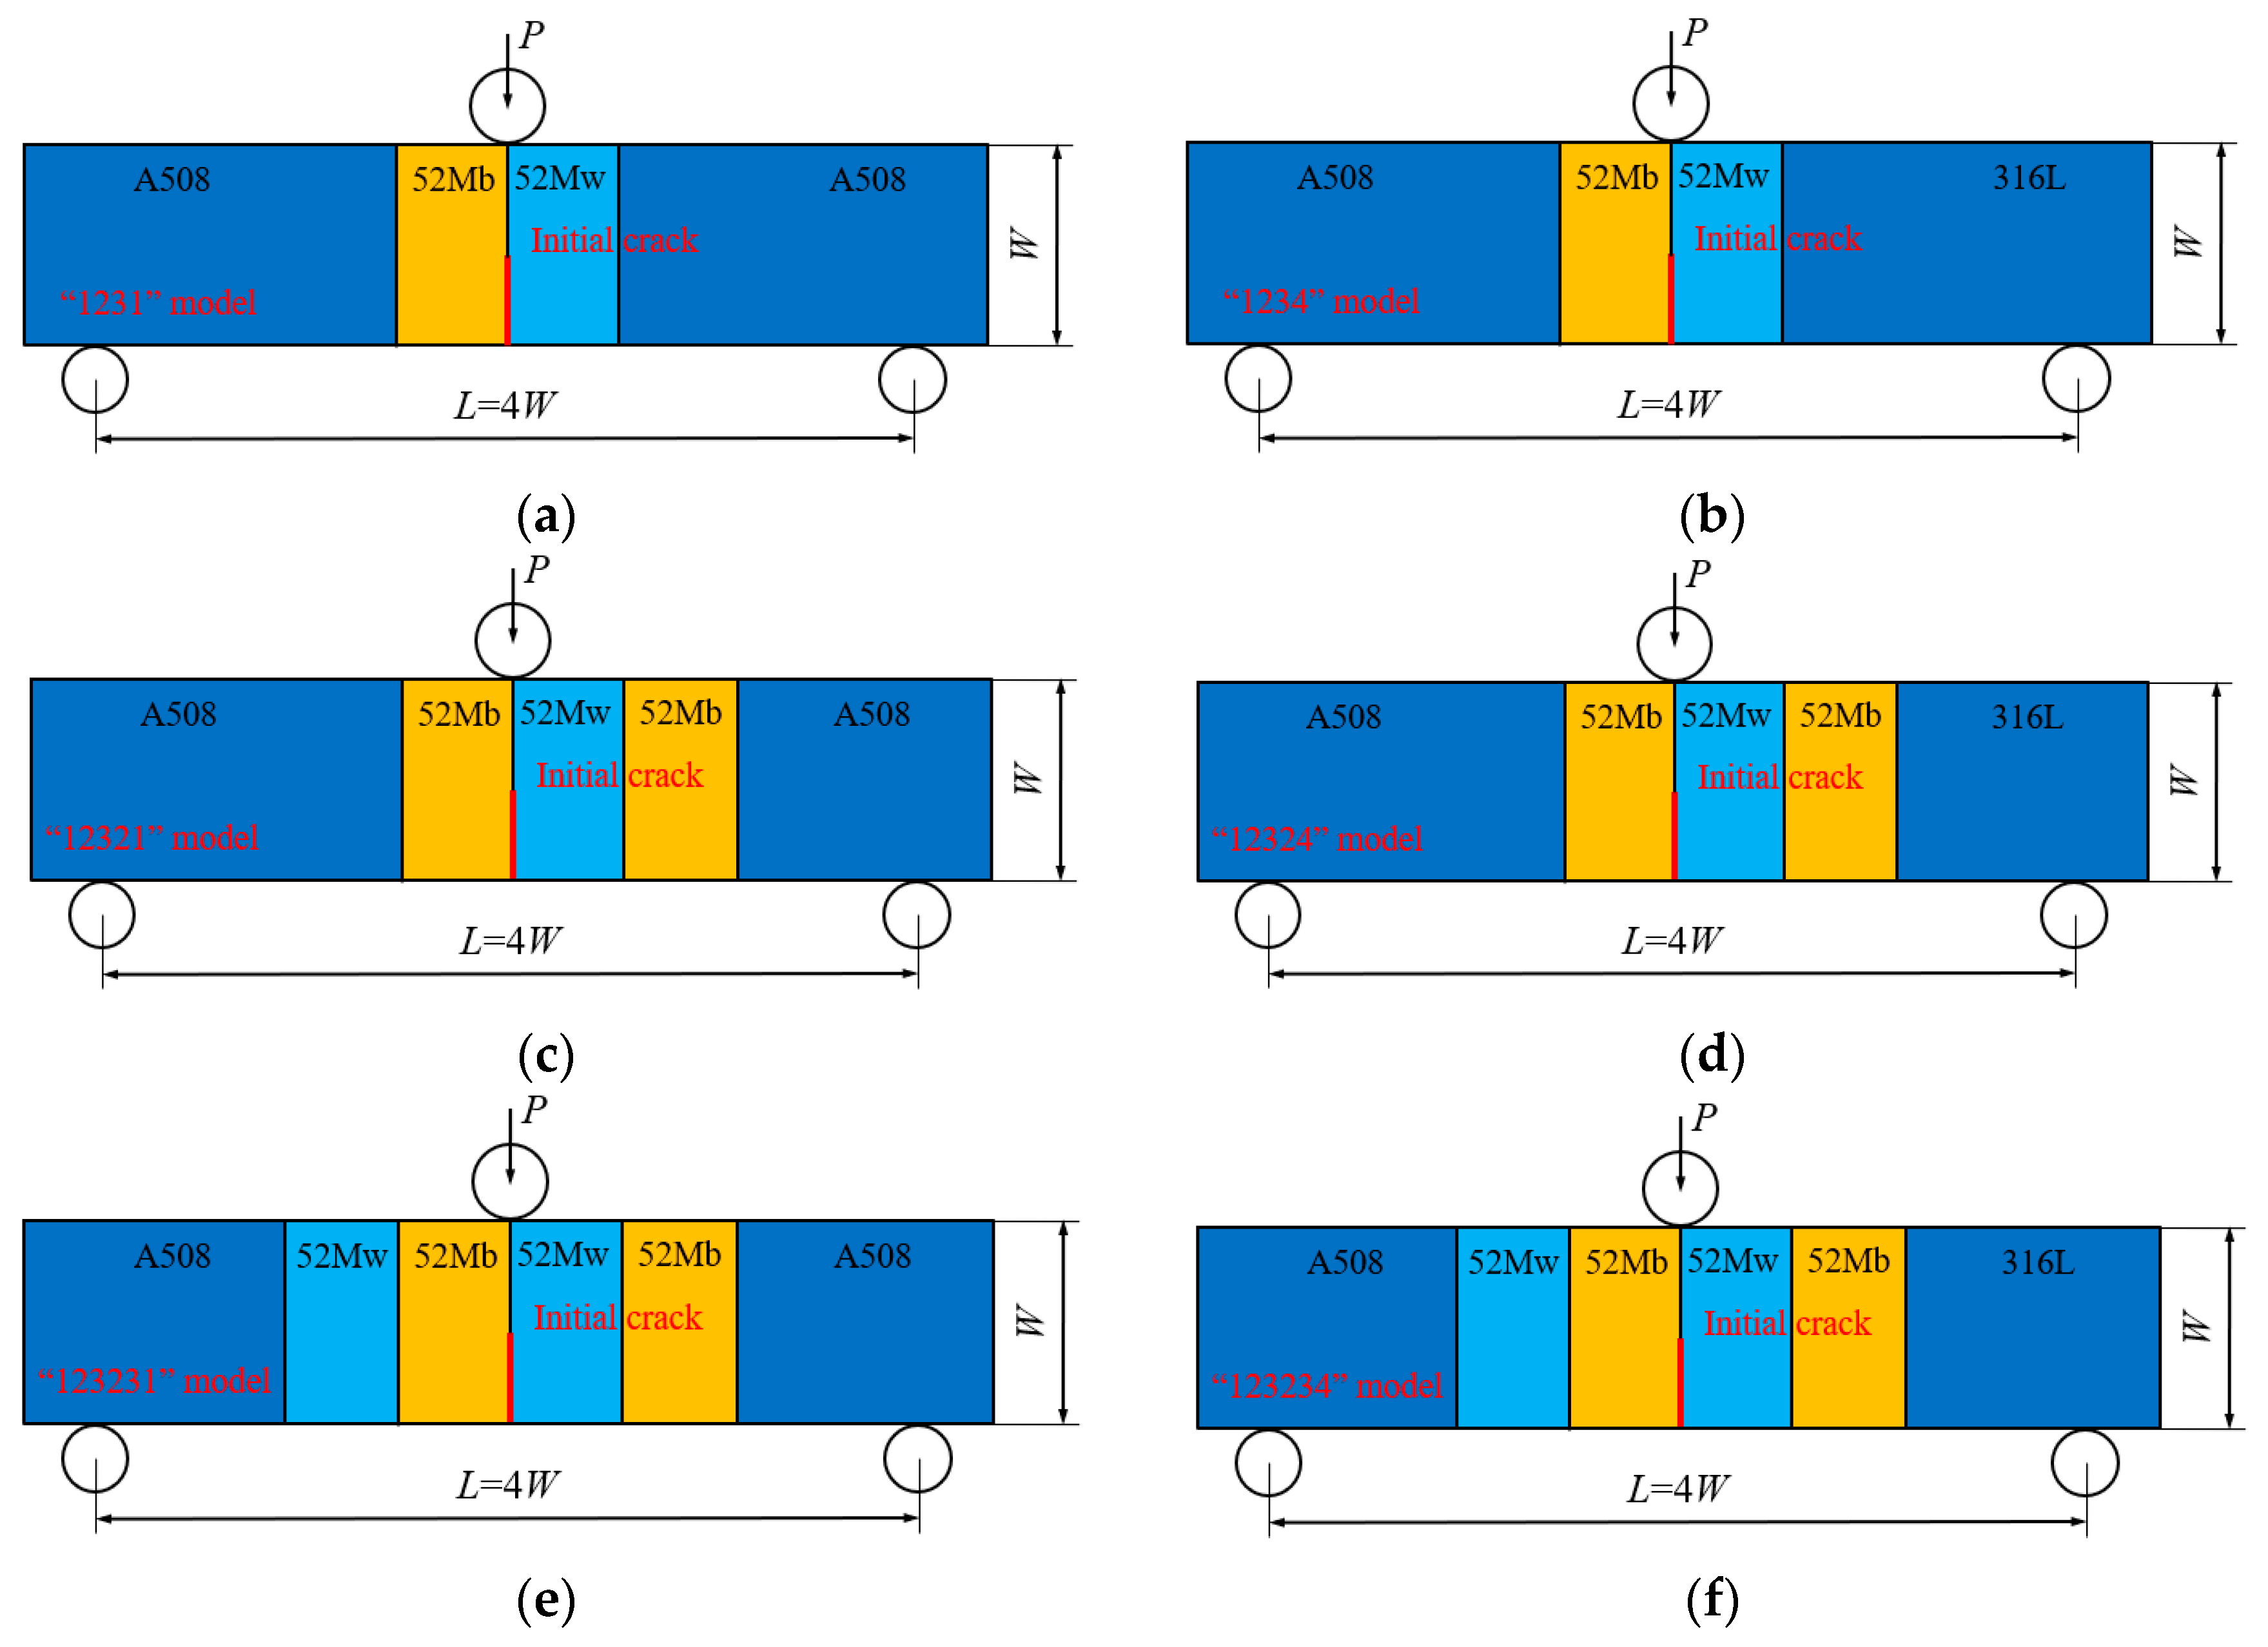
2.2. Model Designs
2.3. GTN Damage Model
3. Results and Discussion
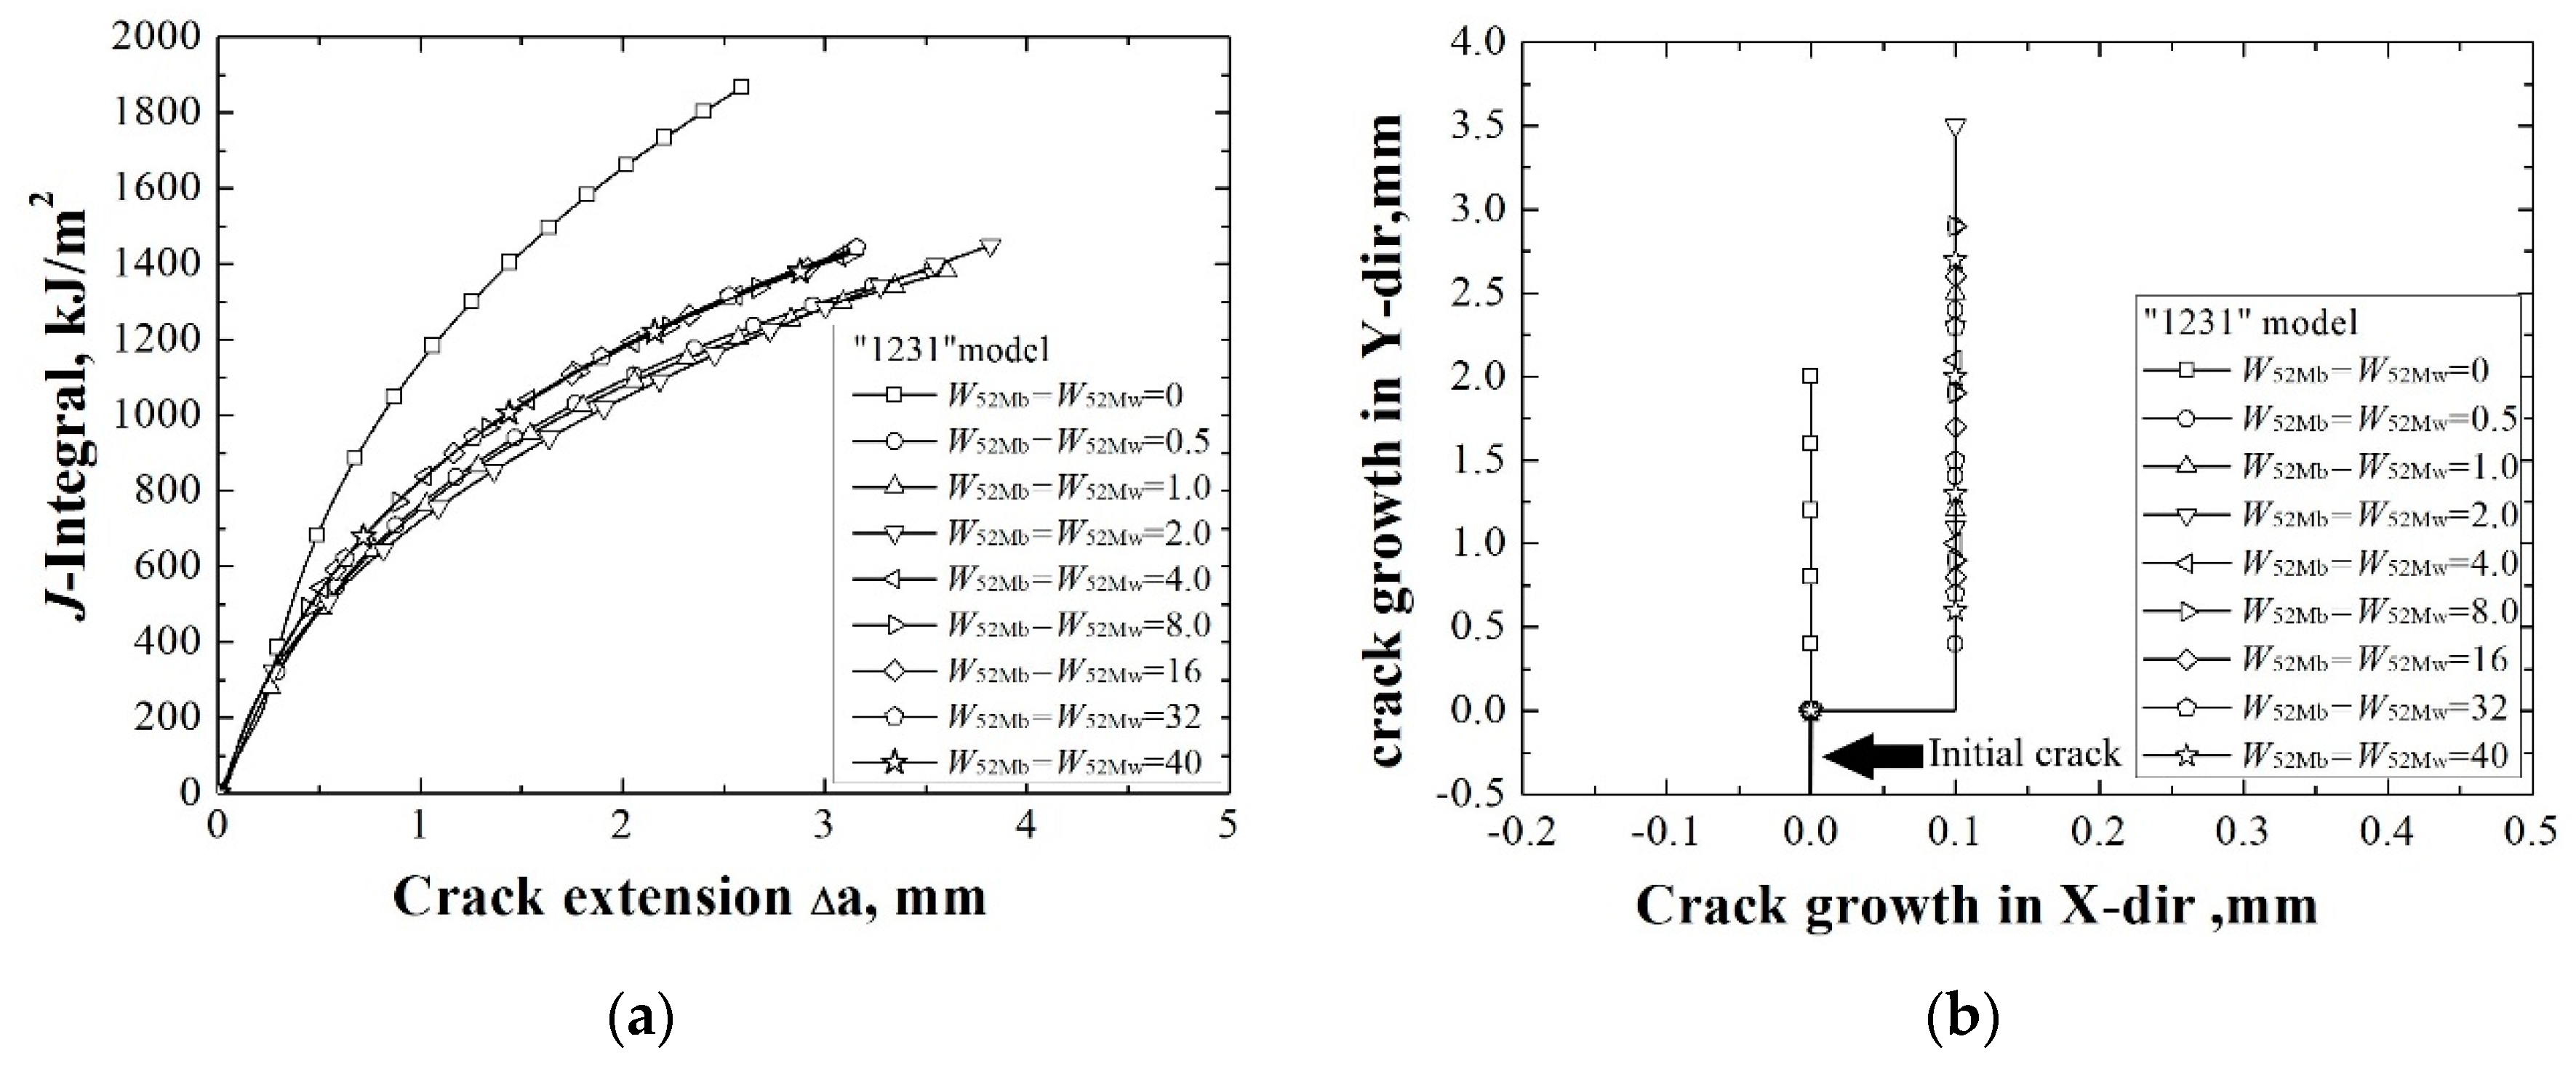
3.1. “1231” Model
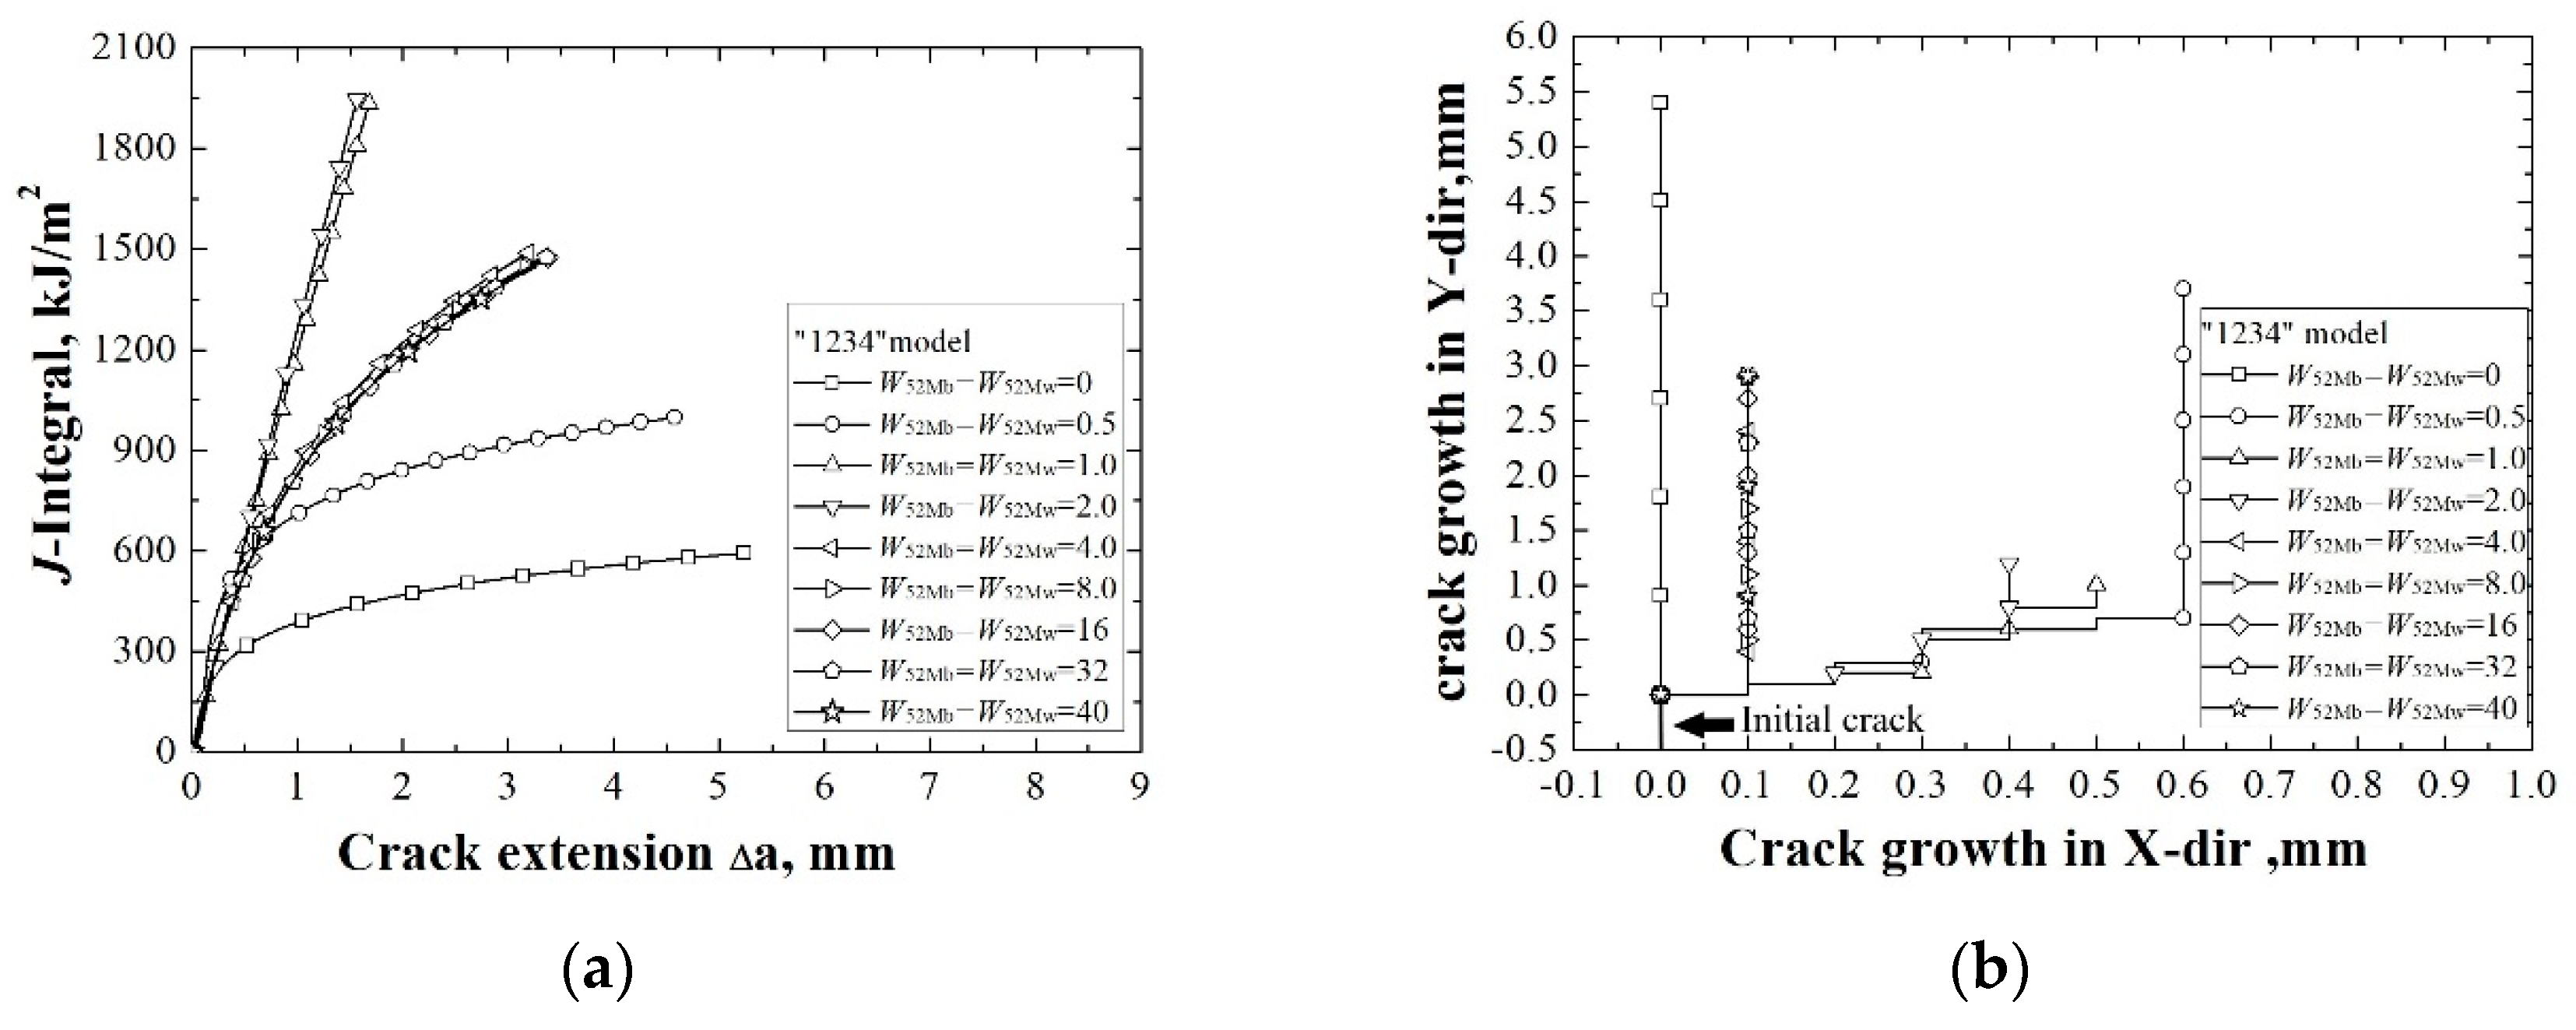
3.2. “1234” Model
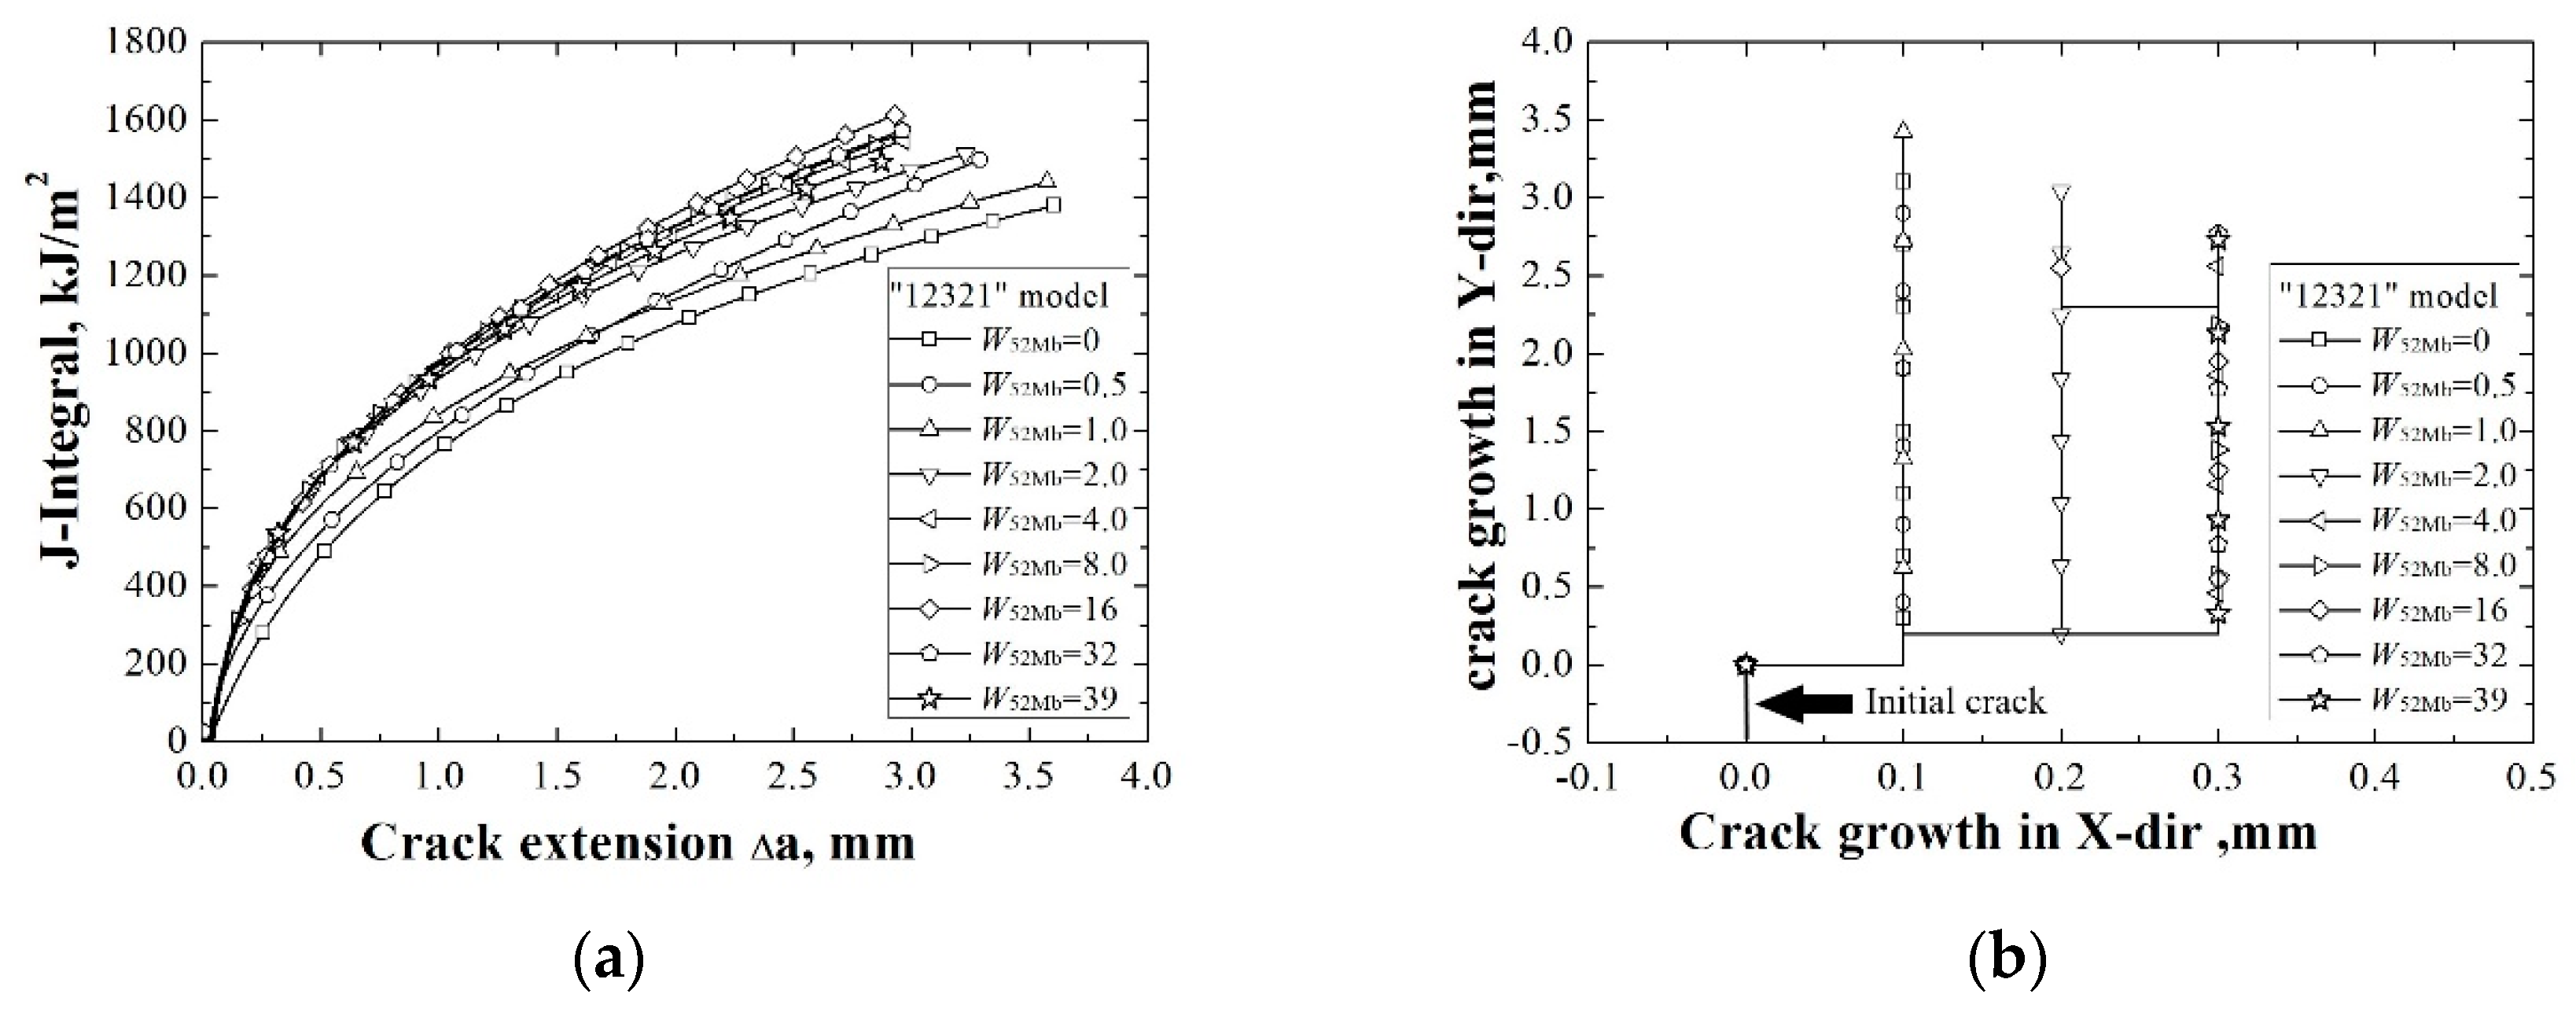
3.3. “12321” Model
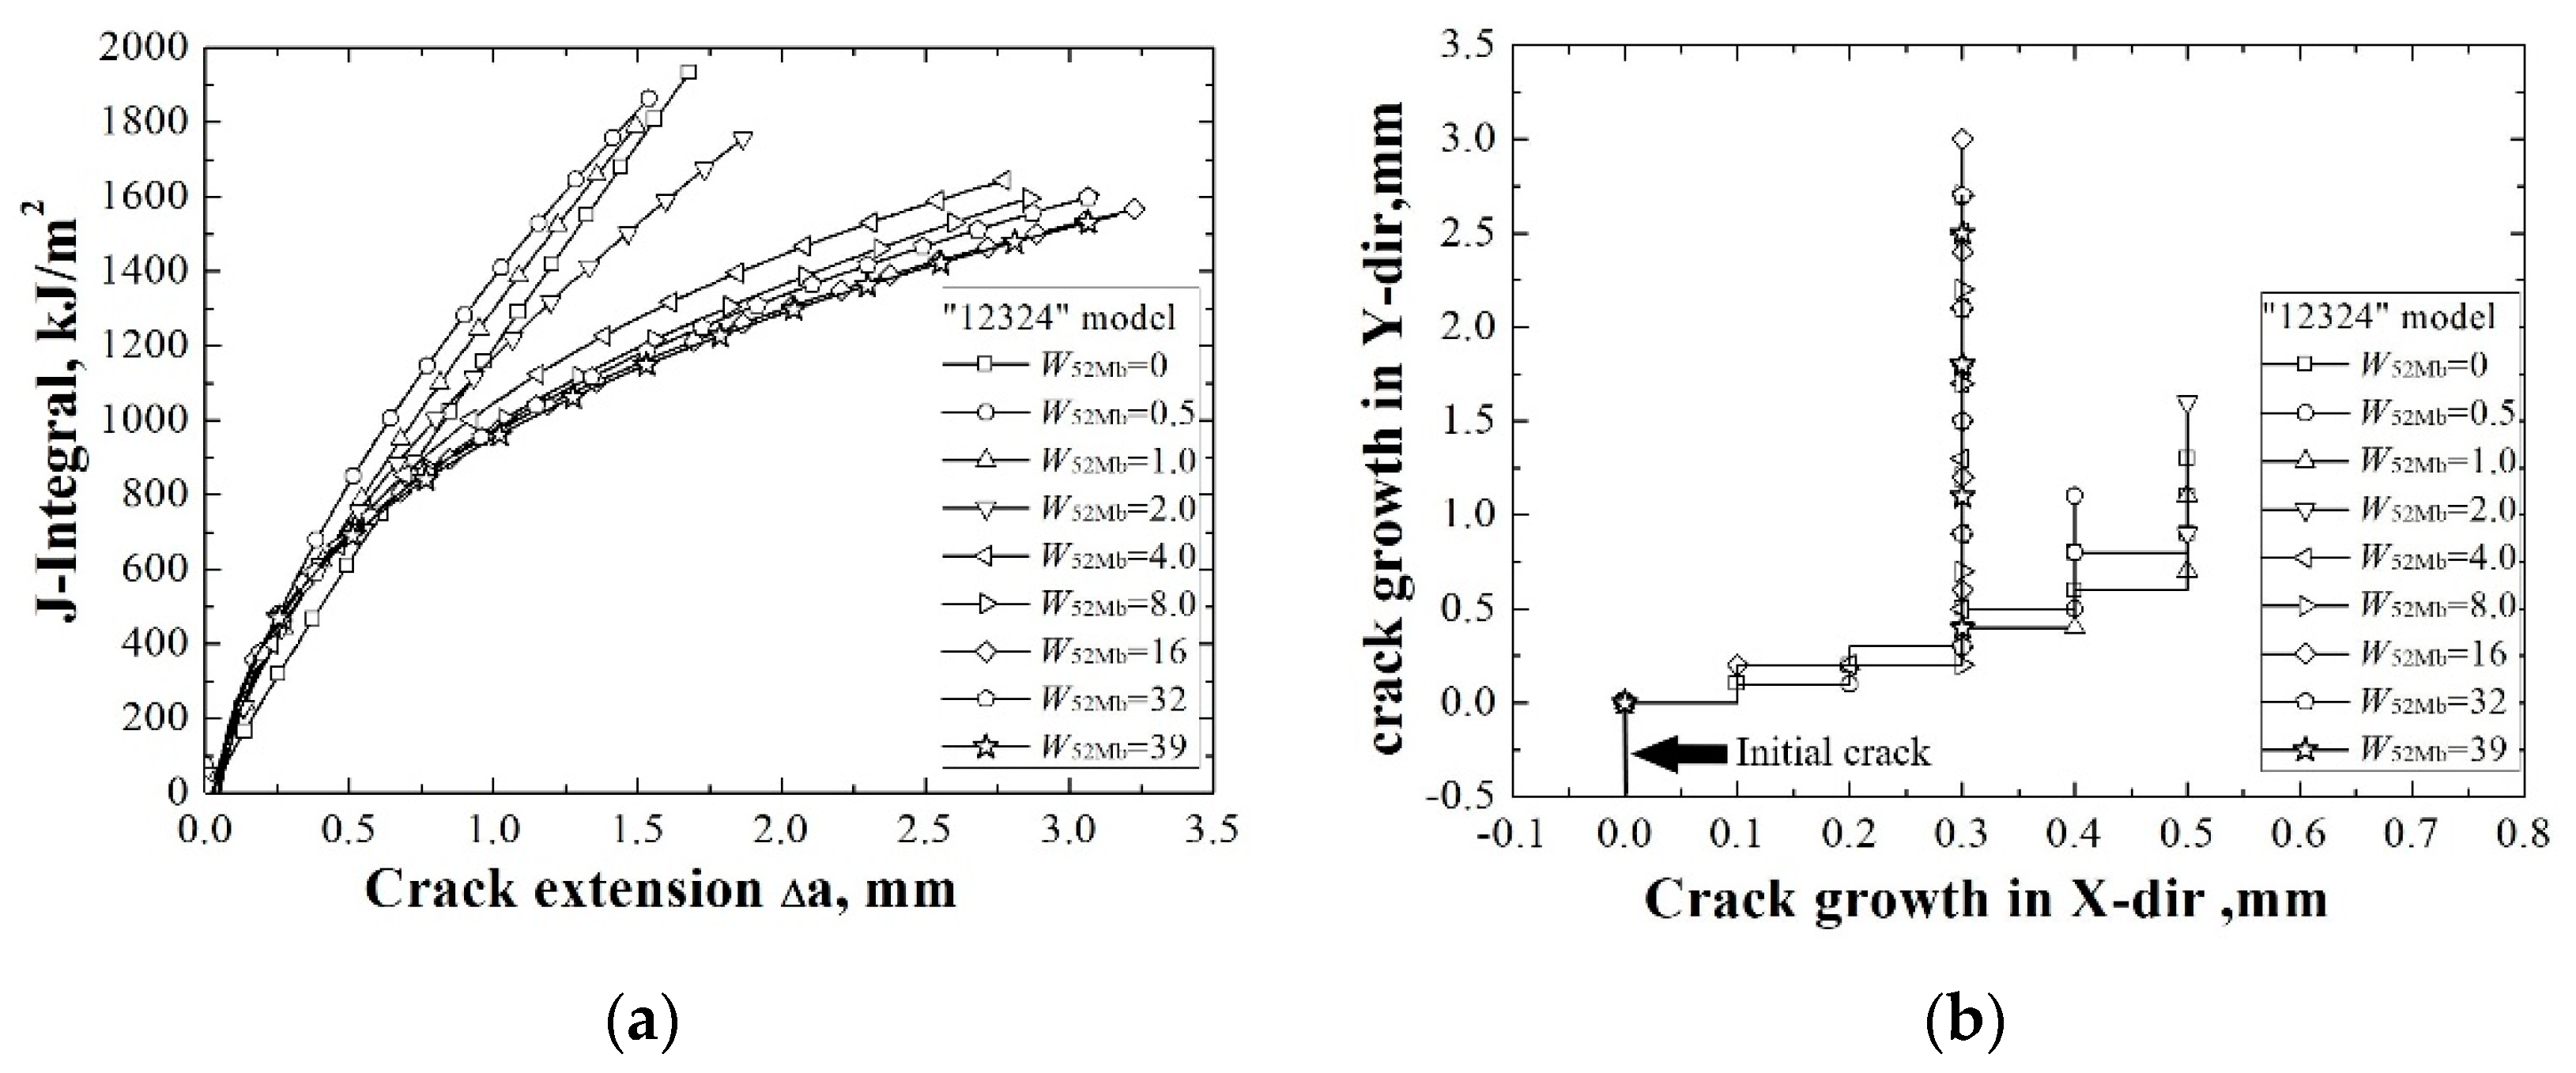
3.4. “12324” Model
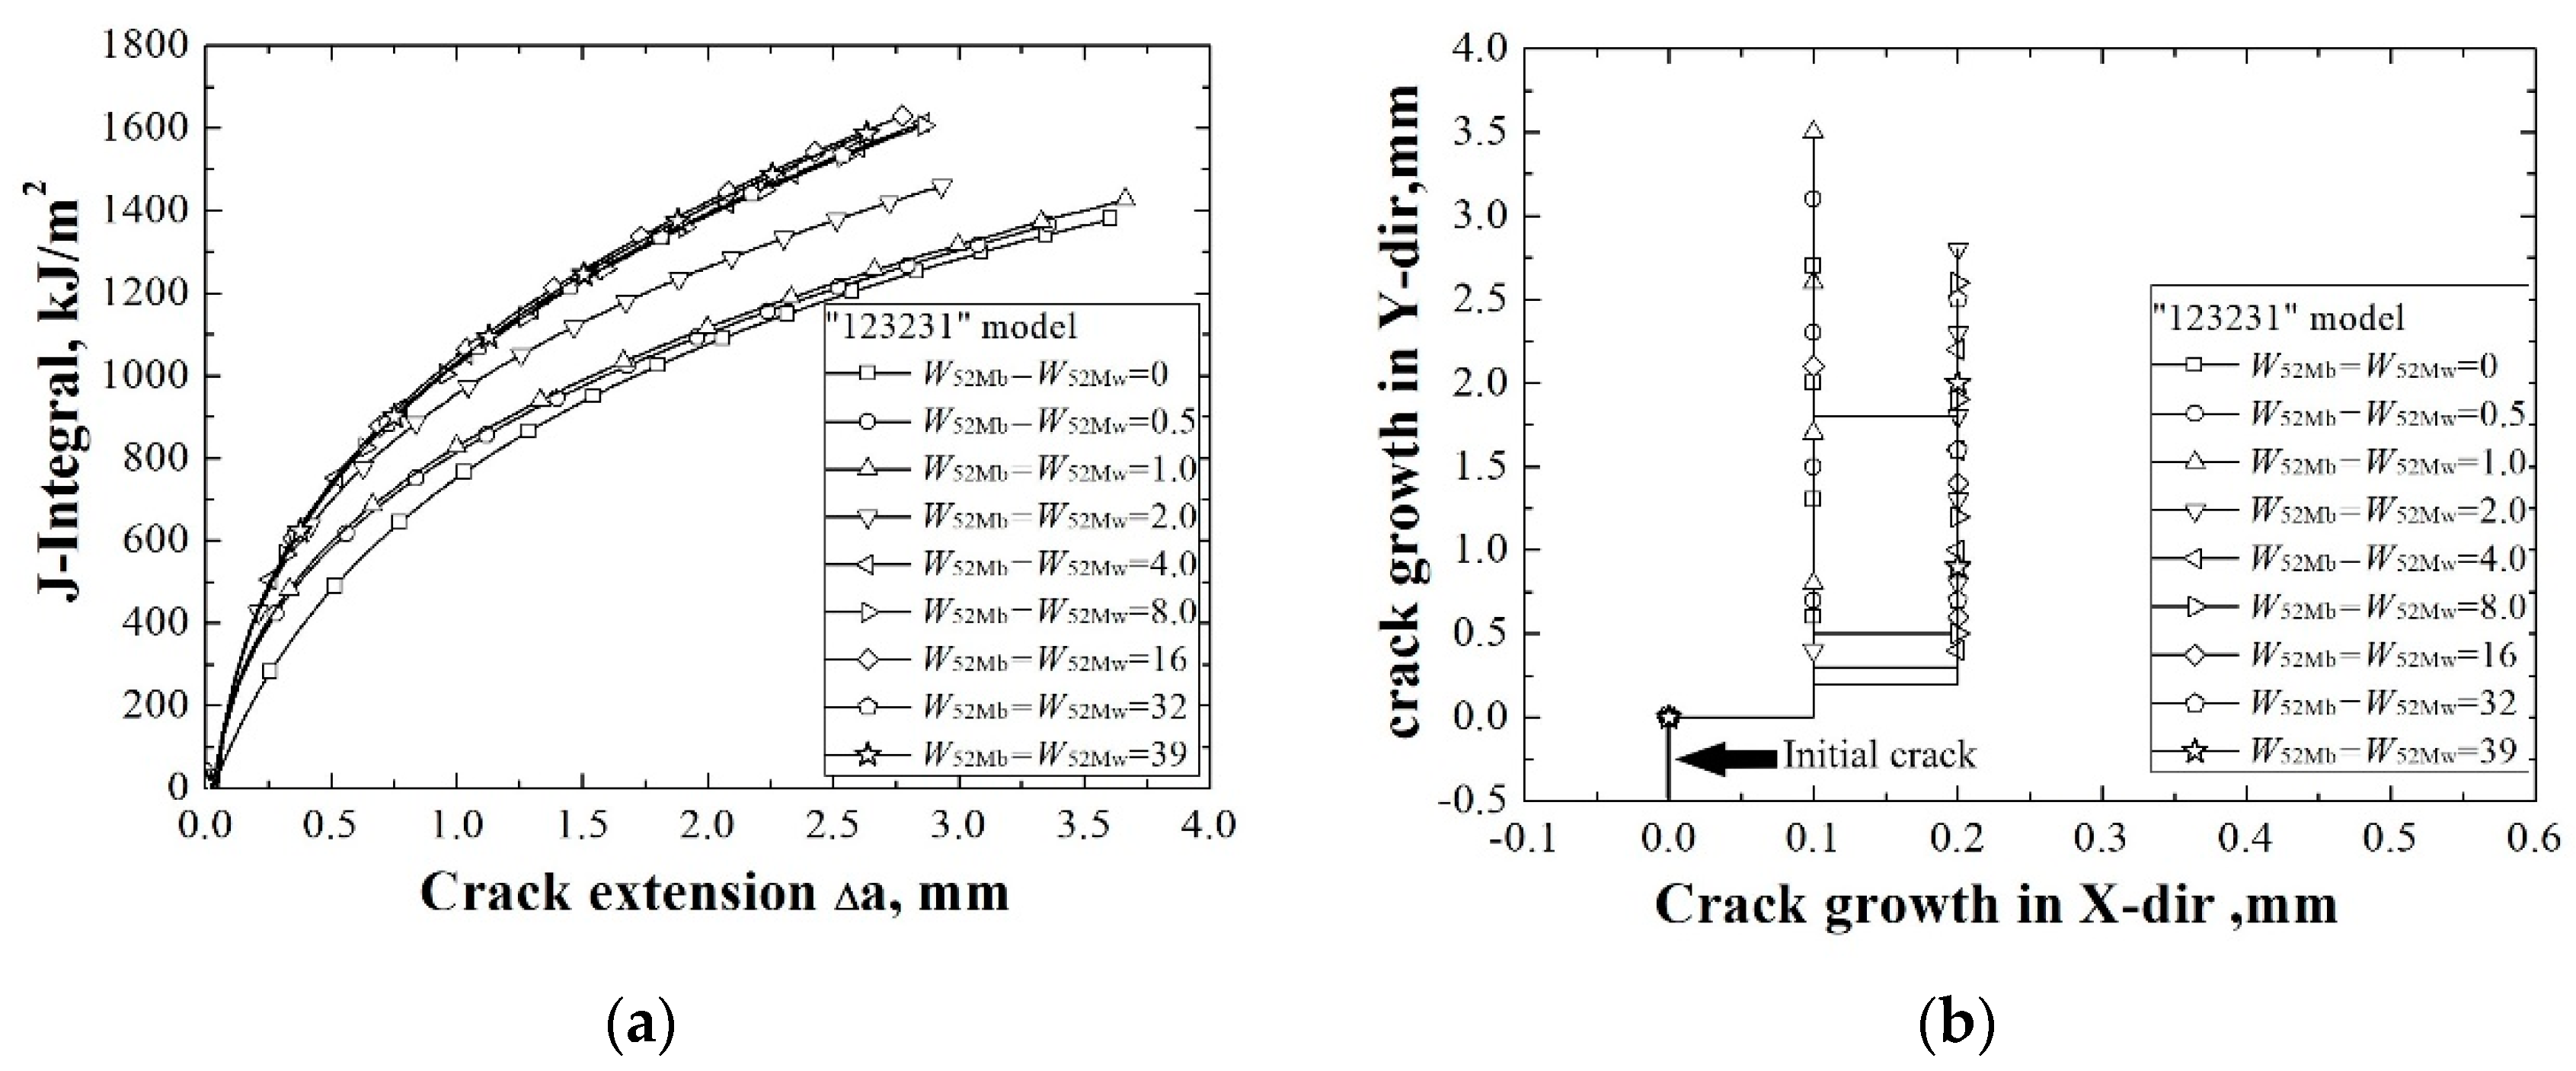
3.5. “123231” Model
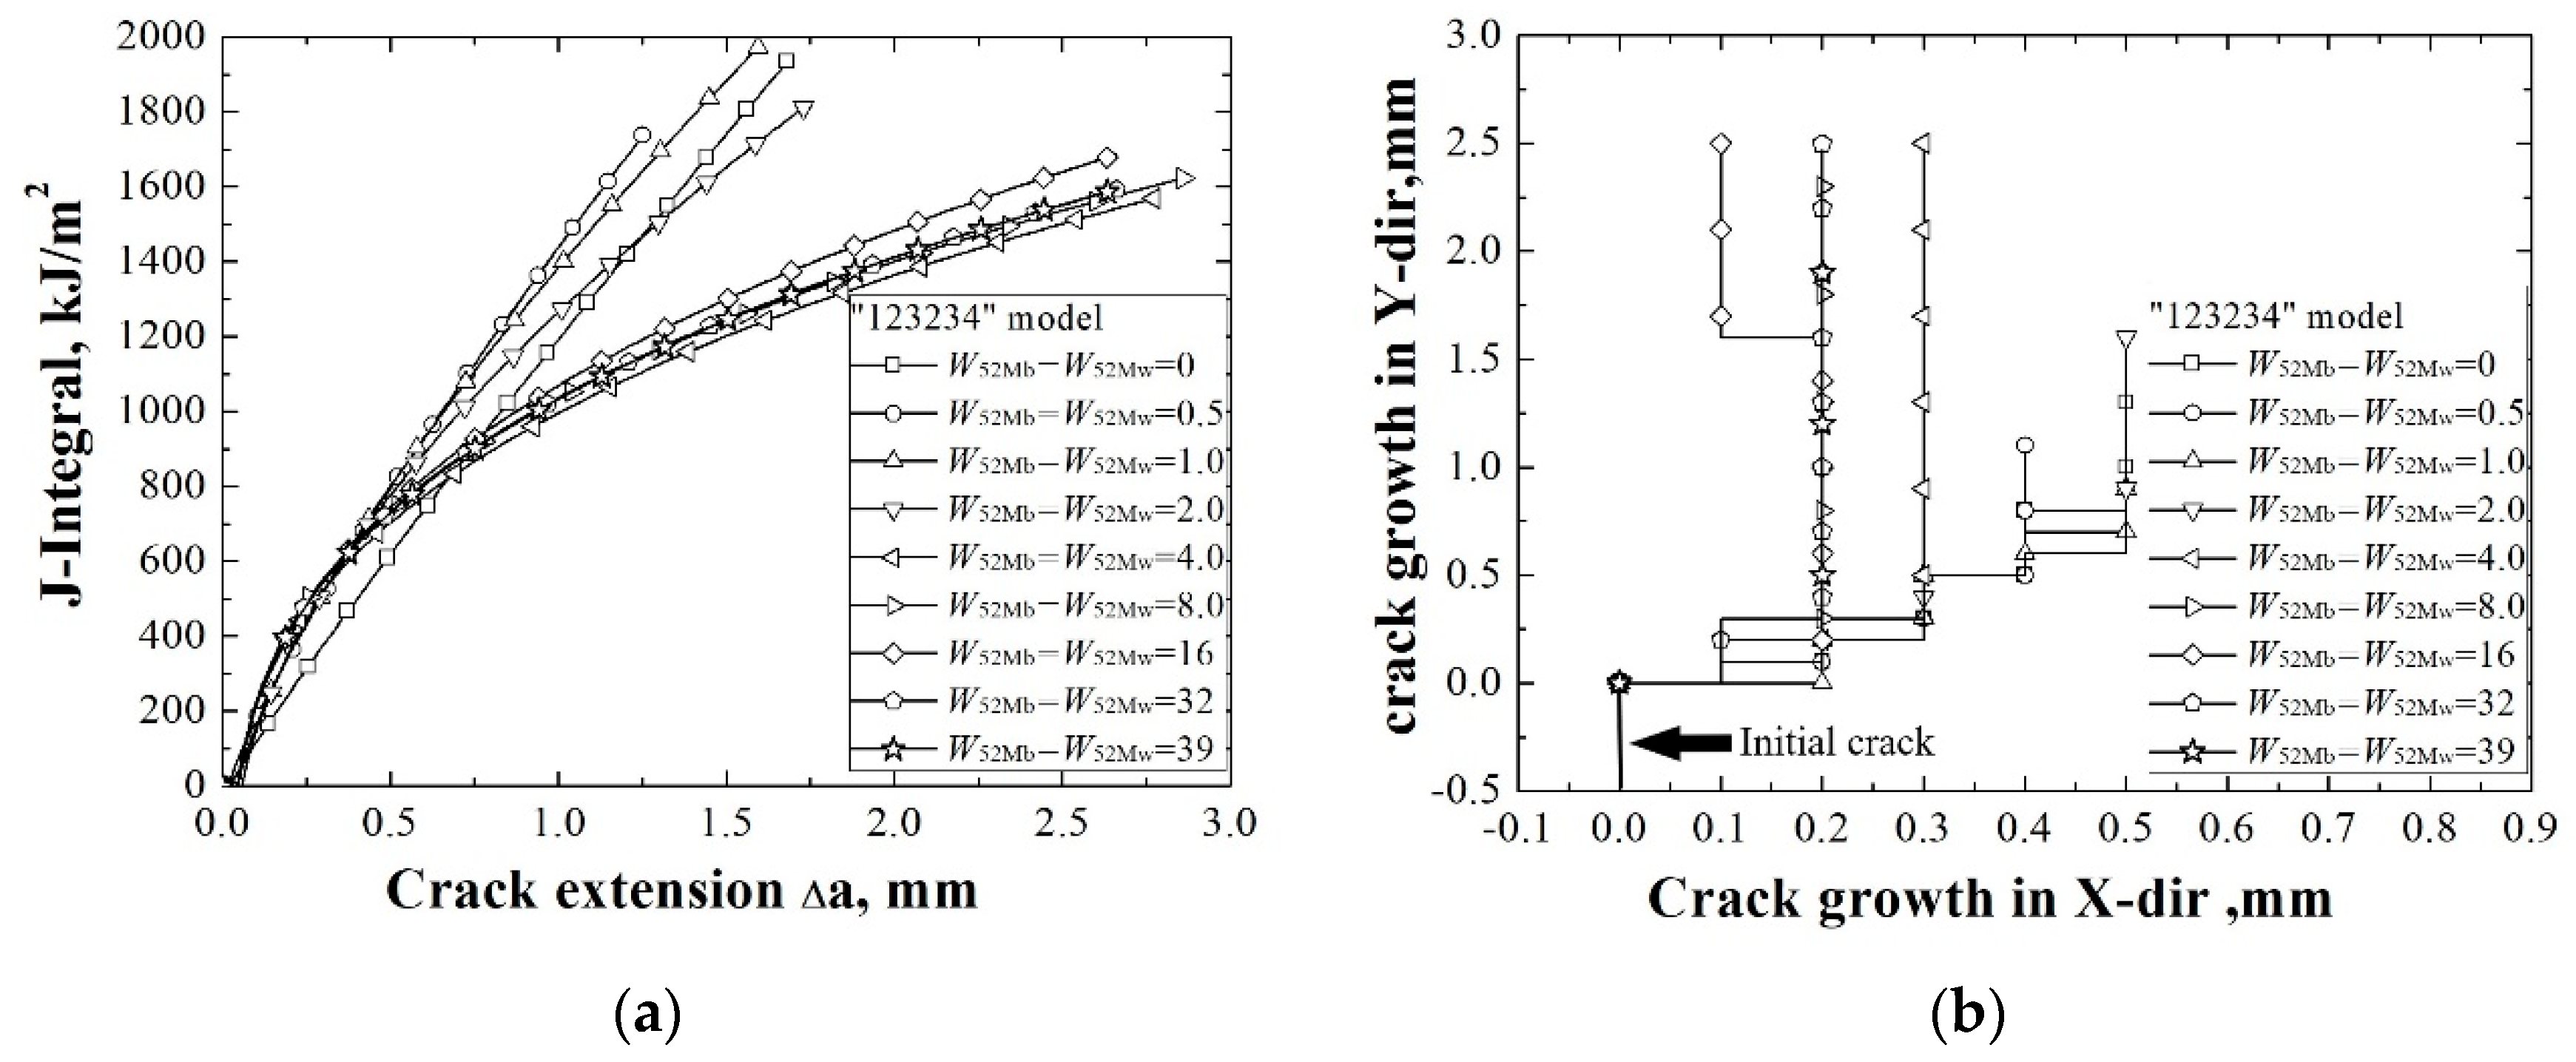
3.6. “123234” Model
3.7. Influence of the Material Constraint’s Effect Range on the Structure Integrity Assessment
4. Conclusions
- (1)
- The same with the models with a center crack, for all the models with an interface crack, the effect ranges of the material constraint also exist. The effect ranges of the material constraint for a center crack and an interface crack have the same characteristics.
- (2)
- Different from the models with a center crack, for the models with an interface crack, when the model changes from a homogeneous material to a bimetallic welded joint, the J-resistance curves of the models first decrease, even though the strength of the weld metal is higher than the base metal. A bimetallic welded joint with an interface crack is very dangerous.
- (3)
- For the models with an interface crack, the J-resistance curves are obviously affected by the non-adjacent material, while the crack propagation paths are mainly influenced by the materials adjacent to the crack.
- (4)
- This study, together with the previous study about the center crack, clarified the effect range of the material constraint and provided an additional basis for an accurate structure integrity assessment.
Author Contributions
Funding
Conflicts of Interest
References
- Betegón, C.; Peñuelas, I. A constraint based parameter for quantifying the crack tip stress fields in welded joints. Eng. Fract. Mech. 2006, 73, 1865–1877. [Google Scholar] [CrossRef]
- Yang, J.; Wang, G.Z.; Xuan, F.Z.; Tu, S.T. Unified characterisation of in-plane and out-of-plane constraint based on crack-tip equivalent plastic strain. Fatigue Fract. Eng. Mater. Struct. 2013, 36, 504–514. [Google Scholar] [CrossRef]
- Yang, J.; Wang, G.Z.; Xuan, F.Z.; Tu, S.T. Unified correlation of in-plane and out-of-plane constraints with fracture toughness. Fatigue Fract. Eng. Mater. Struct. 2014, 37, 132–145. [Google Scholar] [CrossRef]
- Yang, J.; Wang, G.Z.; Xuan, F.Z.; Tu, S.T. Unified correlation of in-plane and out-of-plane constraint with fracture resistance of a dissimilar metal welded joint. Eng. Fract. Mech. 2014, 115, 296–307. [Google Scholar] [CrossRef]
- Wang, H.T.; Wang, G.Z.; Xuan, F.Z.; Liu, C.J.; Tu, S.T. Local mechanical properties of a dissimilar metal welded joint in nuclear power systems. Mater. Sci. Eng. A 2013, 568, 108–117. [Google Scholar] [CrossRef]
- Wang, H.T.; Wang, G.Z.; Xuan, F.Z.; Tu, S.T. An experimental investigation of local fracture resistance and crack growth paths in a dissimilar metal welded joint. Mater. Des. 2013, 44, 179–189. [Google Scholar] [CrossRef]
- Fan, K.; Wang, G.Z.; Tu, S.T.; Xuan, F.Z. Geometry and material constraint effects on fracture resistance behavior of bi-material interfaces. Int. J. Fract. 2016, 201, 143–155. [Google Scholar] [CrossRef]
- Fan, K.; Wang, G.Z.; Xuan, F.Z.; Tu, S.T. Effects of work hardening mismatch on fracture resistance behavior of bi-material interface regions. Mater. Des. 2015, 68, 186–194. [Google Scholar] [CrossRef]
- Fan, K.; Wang, G.Z.; Xuan, F.Z.; Tu, S.T. Local fracture resistance behavior of interface regions in a dissimilar metal welded joint. Eng. Fract. Mech. 2015, 136, 279–291. [Google Scholar] [CrossRef]
- Sarikka, T.; Ahonen, M.; Mouginot, R.; Nevasmaa, P.; Karjalainen-Roikonen, P.; Ehrnstén, U.; Hänninen, H. Effect of mechanical mismatch on fracture mechanical behavior of SA508 e Alloy 52 narrow gap dissimilar metal weld. Int. J. Press. Vessels Pip. 2017, 157, 30–42. [Google Scholar] [CrossRef]
- Samal, M.K.; Balani, K.; Seidenfuss, M.; Roos, E. An experimental and numerical investigation of fracture resistance behaviour of a dissimilar metal welded joint. Proc. Inst. Mech. Eng. C 2009, 223, 1507–1523. [Google Scholar] [CrossRef]
- Yang, F.Q.; Xue, H.; Zhao, L.Y.; Fang, X.R. Effects of Welded Mechanical Heterogeneity on Interface Crack Propagation in Dissimilar Weld Joints. Adv. Mater. Sci. Eng. 2019, 2019. [Google Scholar] [CrossRef]
- Lindqvist, S.; Sarikka, T.; Ahonen, M.; Hänninen, H. The effect of crack path on tearing resistance of a narrow-gap Alloy 52 dissimilar metal weld. Eng. Fract. Mech. 2018, 201, 130–143. [Google Scholar] [CrossRef]
- Kumar, S.; Singh, P.K.; Karn, K.N.; Bhasin, V. Experimental investigation of local tensile and fracture resistance behaviour of dissimilar metal weld joint: SA508 Gr.3 Cl.1 and SA312 Type 304LN. Fatigue Fract. Eng. Mater. Struct. 2016, 40, 190–206. [Google Scholar] [CrossRef]
- Jang, C.; Lee, J.; Kim, J.S.; Jin, T.E. Mechanical property variation within inconel 82/182 dissimilar metal weld between low alloy steel and 316 stainless steel. Int. J. Press. Vessels Pip. 2008, 85, 635–646. [Google Scholar] [CrossRef]
- Xue, H.; Sun, J. Study on micro region of crack tip of welded joints under different matches of yield stress. Hot Work. Technol. 2016, 45, 239–245. [Google Scholar]
- Zhu, Z.Q.; Jing, H.Y.; Ge, J.G.; Chen, L.G. Effects of strength mis-matching on the fracture behavior of nuclear pressure steel A508-III welded joint. Mater. Sci. Eng., A 2005, 390, 113–117. [Google Scholar] [CrossRef]
- Younise, B.; Rakinb, M.; Gubeljakc, N.; Medjob, B.; Sedmakd, A. Effect of material heterogeneity and constraint conditions on ductile fracture resistance of welded joint zones—Micromechanical assessment. Eng. Fail. Anal. 2017, 82, 435–445. [Google Scholar] [CrossRef]
- Laukkanen, A.; Nevasmaa, P.; Ehrnstén, U.; Rintamaa, R. Characteristics relevant to ductile failure of bimetallic welds and evaluation of transferability of fracture properties. Nucl. Eng. Des. 2007, 237, 1–15. [Google Scholar] [CrossRef]
- Xue, H.; Ogawa, K.; Shoji, T. Effect of welded mechanical heterogeneity on local stress and strain ahead of stationary and growing crack tips. Nucl. Eng. Des. 2009, 239, 628–640. [Google Scholar] [CrossRef]
- Yang, J.; Wang, L. Effect Range of the Material Constraint-I. Center Crack. Materials 2019, 12, 67. [Google Scholar] [CrossRef] [PubMed]
- Østby, E.; Thaulow, C.; Zhang, Z.L. Numerical simulations of specimen size and mismatch effects in ductile crack growth-Part I: Tearing resistance and crack growth paths. Eng. Fract. Mech. 2007, 74, 1770–1792. [Google Scholar] [CrossRef]
- Kim, Y.J.; Schwalbe, K. Mismatch effect on plastic yield loads in idealised weldments: I. Weld centre cracks. Eng. Fract. Mech. 2001, 68, 163–182. [Google Scholar] [CrossRef]
- Kim, Y.J.; Schwalbe, K.H. Mismatch effect on plastic yield loads in idealised weldments: II. Heat affected zone cracks. Eng. Fract. Mech. 2001, 68, 183–199. [Google Scholar] [CrossRef]
- Kim, Y.J.; Schwalbe, K.H. Compendium of yield load solutions for strength mis-matched DE(T), SE(B) and C(T) specimens. Eng. Fract. Mech. 2001, 68, 1137–1151. [Google Scholar] [CrossRef]


© 2019 by the authors. Licensee MDPI, Basel, Switzerland. This article is an open access article distributed under the terms and conditions of the Creative Commons Attribution (CC BY) license (http://creativecommons.org/licenses/by/4.0/).
Share and Cite
Dai, Y.; Yang, J.; Wang, L. Effect Range of the Material Constraint-II. Interface Crack. Metals 2019, 9, 696. https://doi.org/10.3390/met9060696
Dai Y, Yang J, Wang L. Effect Range of the Material Constraint-II. Interface Crack. Metals. 2019; 9(6):696. https://doi.org/10.3390/met9060696
Chicago/Turabian StyleDai, Yue, Jie Yang, and Lei Wang. 2019. "Effect Range of the Material Constraint-II. Interface Crack" Metals 9, no. 6: 696. https://doi.org/10.3390/met9060696
APA StyleDai, Y., Yang, J., & Wang, L. (2019). Effect Range of the Material Constraint-II. Interface Crack. Metals, 9(6), 696. https://doi.org/10.3390/met9060696