Abstract
The selection of fracture behaviors used in the structure integrity assessment has significant implications on the accuracy of the assessment. The effect range of the material constraint is an important factor which effects the fracture behaviors of structures and exists in the different kinds of welded joints with the center crack. However, for the material constraint induced by an interface crack, which also appears widely in the welded joints, it is not clear whether the effect range exists or not. The further study of the effect range of the material constraint for the welded joints with interface crack is meaningful. Thus, in this study, different basic models with interface crack were designed, the fracture behaviors of these basic models under different material constraints were calculated, and the effect range of the material constraint induced by interface crack were studied. This study about the interface crack and the previous study about the center crack provide an additional basis for an accurate structure integrity assessment.
1. Introduction
It is well-known that material constraints, which are induced by strength mismatch, are an important factor which effects the fracture behavior of specimens and structures. In recent years, many scholars have focused their studies on the characterization of material constraints, and more researchers are concerned with the effect of material constraints on the fracture behaviors of specimens and structures.
For the characterization of the material constraint, some constraint parameters [,,,] have been established. Betegón et al. [] established a parameter to quantify the material constraint. Yang et al. [,,] established a unified constraint parameter to quantify both geometry constraints and material constraints.
For the effect of the material constraints, the J-resistance curves [,,,,,], crack growth paths [,], fracture toughness [,,], and stress and strain fields at crack tip [,,,,] under different material constraints have been widely studied. Wang et al. [,] studied the J-resistance curves of a dissimilar metal welded joint at different crack positions with different material constraints. Fan et al. [,,] studied the J-resistance curves of the bi-material welded joint under different work hardening mismatches. Sarikka et al. [] studied the effect of mechanical mismatch on the J-resistance curves of SA508-Alloy52 narrow gap dissimilar metal weld. Samal et al. [] investigated the altering of the crack growth path in the bi-material interface region under different material constraints. Yang et al. [] investigated the effects of material constraint induced by welded mechanical heterogeneity on the interface crack propagation in dissimilar weld joints. Lindqvist et al. [] studied the fracture toughness of specimens with different material constraints. Kumar et al. [] studied the fracture toughness properties of dissimilar metal weld joints between SA508Gr.3 Cl.1 and SA312 Type 304LN pipe. Jang et al. [] studied the fracture toughness of specimens at the bottom, middle, and top of the inconel 82/182 dissimilar metal weld joint. Xue et al. [] investigated the stress and strain distributions of the micro region at the crack tip of a dissimilar metal welded joint influenced by welding material yield strength mismatch. Zhu et al. [] investigated the stress fields at the crack tip of nuclear pressure steel A508-III where a dissimilar metal welded joint was affected by material constraint. Younise et al. [] investigated the effect of material heterogeneity and constraint conditions on the stress fields at the crack tip of a welded joint. Laukkanen et al. [] investigated the stress distributions for 3PB (three point bend) specimens at different microstructural regions. Xue et al. [] investigated the effect of welded mechanical heterogeneity on the local stress and strain ahead of stationary and growing crack tips.
In the previous study [], the authors found that there exists an effect range of the material constraint in welded joints with a center crack, and the effect range is an important factor which effects the fracture behavior of the welded joints. The most important thing is when the crack locates the effect range of the material constraint, and the fracture resistance curves of the weld joints no longer are influenced by the material constraint. This is of significance in optimizing joint design and the structure integrity assessment.
Compared with the center crack, the interface crack is another kind of dangerous defect and appears frequently in weld joints, thus, it is meaningful and practical to clarify the effect range of the material constraint for welded joints with an interface crack.
In this study, different basic models which reflect different welded joints with an interface crack were designed, and the J-resistance curves and the crack propagation paths of different basic models under different material constraints were calculated. Based on the results, the effect range of the material constraint in the welded joints with an interface crack was investigated.
2. Materials and Models’ Design
2.1. Materials
The same materials (A508, 52Mb, 52Mw and 316L) as the previous study were selected in this study. The true stress–strain curves of the four materials at room temperature [] were shown in Figure 1. The measured Young’s modulus E of them are 202, 410 MPa; 178, 130 MPa; 178, 130 MPa; and 156, 150 MPa, respectively, and the Poisson’s ratios ν is 0.3 for all of them [].
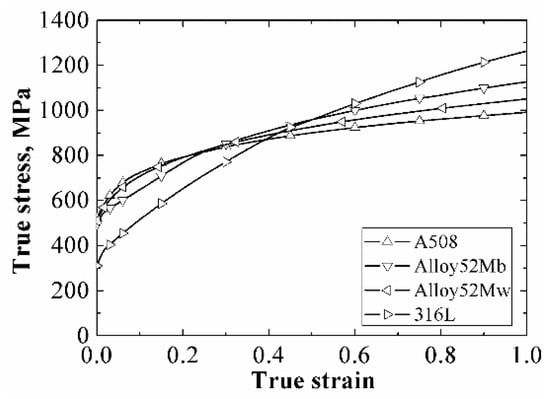
Figure 1.
The true stress–strain curves of the four materials. Data from [].
2.2. Model Designs
To reflect different conditions of welded joints with an interface crack, six different basic models were designed; they include “1231” model, “1234” model, “12321” model, “12324” model, “123231” model and “123234” model, as shown in Figure 2. These basic models are similar to sandwiches, and for all the models, the numbers “1”, “2”, “3” and “4” represent the four different kinds of materials, respectively. That is, the “1231” model means the model contains three kinds of materials, and the materials in the model from left to right are “1”, “2”, “3” and “1”; the “123234” model means the model contains four kinds of materials, and the materials in the model from left to right are “1”, “2”, “3”, “2”, “3”and “4”.
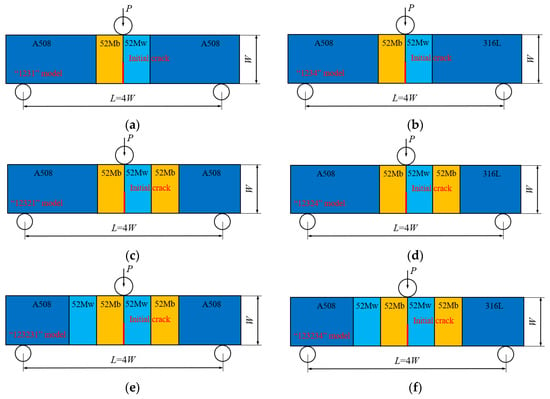
Figure 2.
Six different basic models, (a) “1231” model, (b) “1234” model, (c) “12321” model, (d) “12324” model, (e) “123231” model, (f) “123234” model.
The “1231” model represents the structure of a single metallic welded joint with heat effect zone and fusion zone; the “1234” model represents the structure of a bimetallic welded joint with heat effect zone and fusion zone; the “12321” model represents the structure of a single metallic welded joint with heat effect zone, fusion zone and near interface zone; the “12324” model represents the structure of a bimetallic welded joint with heat effect zone, fusion zone and near interface zone; the “123231” and “123234” models represent the structure of a dissimilar metal welded joint.
Single-edge-notched bend (SENB) specimens were used in this study. For all the models, the specimen widths were 14.4 mm (W = 14.4 mm), the loading spans were 57.6 mm (L = 4W), the specimen thickness B was 12.0 mm, and the initial crack lengths were 7.2 mm (a/W = 0.5). The initial crack was located in the middle of the specimen, and the loading was applied at the load roll by prescribing a displacement of 6.0 mm.
Different material constraints were obtained by changing the width of 52 Mb or 52 Mw in each model. For the “1231” and “1234” models, the widths were changed from 52 Mb and 52 Mw to 0.0 mm to 40.0 mm at the same time. For the “12321” and “12324” models, fixing the widths of 52 Mb at the left side of the crack and 52 Mw to 1.0 mm, and changing the width of 52 Mb at the right side of the crack from 0.0 mm to 39.0 mm. For the “123231” and “123234” models, fixing the widths of 52 Mw at the right side of the crack and 52 Mb at the left side of the crack to 1.0 mm, and changing the widths of 52 Mb at the right side of the crack and 52 Mw at the left side of the crack from 0.0 mm to 39.0 mm at the same time.
2.3. GTN Damage Model
To obtain the fracture behaviors of different basic models, the ABAQUS code (6.14, Dassault Systèmes group company, Shanghai, China) was selected, and the FEM (finite element method) simulation based on the GTN (Gurson–Tvergaard–Needleman) damage model was used in this study. There are nine parameters in the GTN damage model, and the parameters used in this study are the same as in the previous study [].
During the finite element analysis, the 3D eight-node isoperimetric element with reduced integration (C3D8R) was used. The same mesh partition used in the previous study [] was used as well; the minimum size of the mesh in the crack propagation region was 0.1 mm × 0.1 mm [].
3. Results and Discussion
3.1. “1231” Model
The J-resistance curves of different “1231” models under different material constraints are shown in Figure 3a. It can be found that by increasing the widths of 52 Mb and 52 Mw, the J-resistance curves of the “1231” model first decreases, then increases, and finally remains stable. When the widths of 52 Mb and 52 Mw are 0.0 mm, the model is the same with the homogeneous material A508, and the “1231” model has the maximum J-resistance curve. When the widths of 52 Mb and 52 Mw are 2.0 mm, the J-resistance curve of the “1231” model is the lowest. When the widths of 52 Mb and 52 Mw increase from 0.0 mm to 2.0 mm gradually, the J-resistance curves decrease. This is because the model changes from a homogeneous material to an inhomogeneous material, though the materials 52 Mb and 52 Mw have higher strength than material A508, the changing of materials will weaken the material’s fracture resistance for the material with an interface crack. This is different from the material with a center crack, which does not have the descent stage of the fracture resistance.
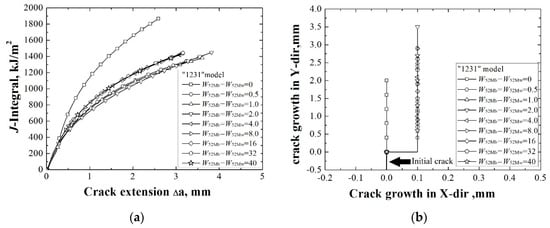
Figure 3.
The J-resistance curves (a) and the crack propagation paths (b) of different “1231” models.
By increasing the widths of 52 Mb and 52 Mw from 2.0 mm to 4.0 mm, the J-resistance curves increase. When the widths of 52 Mb and 52 Mw increase to 4.0 mm, the J-resistance curve will not change with an increase in width of 52 Mb and 52 Mw. This means that the crack is out of the effect range of the material constraint induced by the A508/52 Mb and 52 Mw/A508 interface. In this condition, no matter the strength of the material beyond the effect range is low or high. That is, when the crack is located out of the effect range of the material constraint, the J-resistance curve of the weld joint is no longer influenced by the material constraint. This is the same with weld joints with a center crack.
The crack propagation paths of different “1231” models under different material constraints are shown in Figure 3b. It can be found that when the widths of 52 Mb and 52Mw are 0.0 mm, the crack propagates along the interface. When the widths of 52 Mb and 52 Mw are greater than 0.0 mm, the crack propagation paths deviate to the side of the material 52 Mw, which has a lower strength than the material 52 Mb.
3.2. “1234” Model
The J-resistance curves of different “1234” models under different material constraints are shown in Figure 4a. It can be found that by increasing the widths of 52 Mb and 52 Mw, the J-resistance curves of the models first increased, then decreased and remained steady at last. When the widths of 52 Mb and 52 Mw are 0.0 mm, the model has the lowest J-resistance curve. When the widths of 52 Mb and 52 Mw are 2.0 mm, the model has the highest J-resistance curve. When the widths of 52 Mb and 52 Mw up to 4.0 mm, the J-resistance curve will not change by increasing the widths of 52 Mb and 52 Mw.
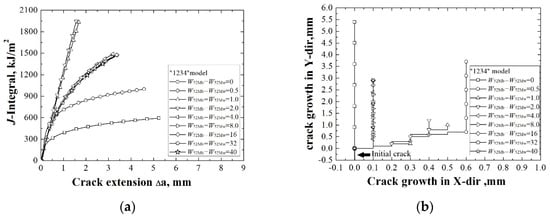
Figure 4.
The J-resistance curves (a) and the crack propagation paths (b) of different “1234” models.
When the widths of 52 Mb and 52 Mw are 0.0 mm, the model is the same as the bimetallic welded joint with an interface crack. In this condition, the model has the lowest J-resistance curve, which shows that the interface crack in a bimetallic welded joint is very dangerous. By increasing the widths of 52 Mb and 52 Mw, the J-resistance curve of the model increases. When the widths of 52 Mb and 52 Mw are 2.0 mm, there exists an optimal width and the model has the highest J-resistance curve. Then, the J-resistance curves of the models decrease and remain steady at last.
Similar to the “1231” model, when the widths of 52 Mb and 52 Mw are up to a value, the J-resistance curve of the model will not change. That is, an effect range also exists. This is in contrast with the “1231” model; when the widths of 52 Mb and 52 Mw are 2.0 mm, the model “1231” and the model “1234” have different J-resistance curves. This indicates that within the effect range, the J-resistance curve will be affected by the non-adjacent material.
The crack propagation paths of different “1234” models under different material constraints are shown in Figure 4b. When the widths of 52 Mb and 52 Mw are 0.0 mm, the crack propagates along the interface. By increasing the widths of 52 Mb and 52 Mw, the crack propagation paths deviate to the side of the material 52 Mw (the right side), which has a lower strength than the material 52 Mb. When the crack is located beyond the effect range of the material constraint, the crack propagation paths no longer change.
3.3. “12321” Model
The J-resistance curves of different “12321” models under different material constraints are shown in Figure 5a. It can be found that with increasing the width of 52 Mb which is non-adjacent to the crack from 0.0 mm to 39.0 mm, the J-resistance curves of the models first increase and then almost remain steady. This is mainly because the strength of 52 Mb is higher than the A508, within the effect range of the material constraint, the J-resistance curves of the models increase with a decrease in the A508′s width and increase of the 52 Mb’s width; beyond the effect range of the material constraint, the J-resistance curves remain steady.

Figure 5.
The J-resistance curves (a) and the crack propagation paths (b) of different “12321” models.
Combined with the crack propagation paths in the Figure 5b, it can be found that all the cracks deviate to the right side. This means that the deviation of the cracks are mainly influenced by the materials which are adjacent to the crack. In addition, the deflections are within the range of 52 Mw (shorter than 1.0 mm); this may be influenced by the same material on both sides of the 52 Mw, and the material mismatch on both sides of the crack is not high enough to impel the crack to cross the interface.
3.4. “12324” Model
The J-resistance curves of different “12324” models under different material constraints are shown in Figure 6a. It can be found that by increasing the width of 52 Mb which is non-adjacent to the crack from 0.0 mm to 39.0 mm, though there is a little increase of J-resistance curve from 0.0 mm to 0.5 mm, the whole J-resistance curves of the models first decrease and then remain steady. This is mainly because the strength of 52 Mb is lower than the 316L, within the effect range of the material constraint, the J-resistance curves of the models decrease with decreasing of the 316L’s width and increasing of the 52 Mb’s width; beyond the effect range of the material constraint, the J-resistance curves remain steady.
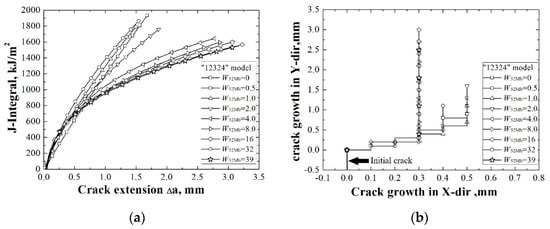
Figure 6.
The J-resistance curves (a) and the crack propagation paths (b) of different “12324” models.
Combined with the crack propagation paths in Figure 6b, it can be found that all the cracks deviate to the right side, which means that the deviation of the cracks are mainly influenced by the materials which are adjacent to the crack. The deflections are within the range of 52 Mw (shorter than 1.0 mm) also, which means that the material mismatch on both sides of the crack is not high enough to impel the crack to cross the interface.
Compared with the “12321” model and the “12324” model, different trends of the J-resistance curves indicate that within the effect range, the J-resistance curve will be obviously affected by the non-adjacent material.
3.5. “123231” Model
The J-resistance curves of different “123231” models under different material constraints are shown in Figure 7a. It can be found that by increasing the widths of 52 Mb and 52 Mw which are non-adjacent to the crack, the J-resistance curves of the “123231” models first increase then remain stable. Since the strengths of 52 Mb and 52 Mw are higher than A508, by increasing the widths of 52 Mb and 52 Mw and decreasing the width of A508, the J-resistance curve increases. When the widths of 52 Mb and 52 Mw are up to 4.0 mm, the crack is out of the material constraint’s effect range, and by increasing the widths of 52 Mb and 52 Mw, the J-resistance curves remain steady.
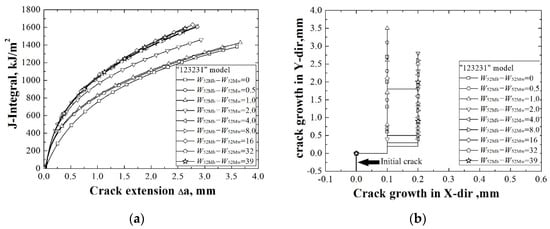
Figure 7.
The J-resistance curves (a) and the crack propagation paths (b) of different “123231” models.
The crack propagation paths of different “123231” models under different material constraints are shown in Figure 7b. It can be found that all the cracks deviate to the right side; this also means that the deviation of the cracks is mainly influenced by the materials which are adjacent to the crack. The deflections are also within the range of 52 Mw (shorter than 1.0 mm), which means that the material mismatch on both sides of the crack is not high enough to impel the crack to cross the interface. When the crack is located beyond the effect range of material constraint, the crack propagation paths no longer change.
3.6. “123234” Model
The J-resistance curves of different “123234” models under different material constraints are shown in Figure 8a. It can be found that by increasing the widths of 52 Mb and 52 Mw which are non-adjacent to the crack, though there is a little increase of J-resistance curve from 0.0 mm to 0.5 mm, the whole J-resistance curves of the “123234” models first decrease then remain stable. The strengths of 52 Mb and 52 Mw are higher than A508, but much lower than 316L; by increasing the widths of 52 Mb and 52 Mw and decreasing the widths of A508 and 316L, the reason the J-resistance curve decreases may be due to the deviation of the crack propagation path, as shown in Figure 8b. It can be found from Figure 8b that all the cracks deviate to the right side, and the strength decreases with an increase of the width of 52 Mb and decrease of the width of 316L. When the widths of 52 Mb and 52 Mw are up to 32.0 mm, the crack is out of the material constraint’s effect range, and the J-resistance curves remain steady.
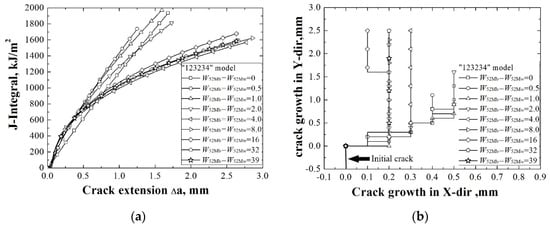
Figure 8.
The J-resistance curves (a) and the crack propagation paths (b) of different “123234” models.
The crack propagation paths of different “123234” models under different material constraints also reflect that the deviation of the cracks is mainly influenced by the materials which are adjacent to the crack. When the crack is located beyond the effect range of the material constraint, the crack propagation paths no longer change.
Compared with the “123231” model and the “123234” model, different trends of the J-resistance curves also indicate that within the effect range, the J-resistance curve will be obviously affected by the non-adjacent material.
3.7. Influence of the Material Constraint’s Effect Range on the Structure Integrity Assessment
The selection of J-resistance curve and crack propagation path to be used in the structure integrity assessment has significant implications on the outcome of the analysis. The use of adequate and precise input parameters based on the fracture behaviors are particularly essential to describe and predict the critical condition in structures.
Based on the results in this study and the previous study [], the effect range of material constraint is certainly an important factor which effects the fracture behaviors of strucutres. The most direct effect is beyond the effect range, the J-resistance curves and the crack propagation paths are no longer influenced by the materials which are out of the effect range. This means that it does not matter even though the strength of the material beyond the effect range is low or high. Conversely, within the effect range, the J-resistance curves and the crack propagation paths are influenced by all the materials within the range, no matter whether the material is adjacent to the crack or not.
Compared with a series of studies [,,] about the mismatch effect on the plastic yield loads in idealized weldments with weld center cracks and heat affected zone cracks, this study and the previous study [] change the view angle from the strength mismatch at both sides of crack to the effect range of the material constraint, and take into account different basic models which reflect different welded joints. The obtained results provide an additional basis for an accurate structure integrity assessment.
4. Conclusions
- (1)
- The same with the models with a center crack, for all the models with an interface crack, the effect ranges of the material constraint also exist. The effect ranges of the material constraint for a center crack and an interface crack have the same characteristics.
- (2)
- Different from the models with a center crack, for the models with an interface crack, when the model changes from a homogeneous material to a bimetallic welded joint, the J-resistance curves of the models first decrease, even though the strength of the weld metal is higher than the base metal. A bimetallic welded joint with an interface crack is very dangerous.
- (3)
- For the models with an interface crack, the J-resistance curves are obviously affected by the non-adjacent material, while the crack propagation paths are mainly influenced by the materials adjacent to the crack.
- (4)
- This study, together with the previous study about the center crack, clarified the effect range of the material constraint and provided an additional basis for an accurate structure integrity assessment.
Author Contributions
Conceptualization, J.Y.; methodology, J.Y.; software, Y.D. and L.W.; validation, Y.D., J.Y. and L.W.; writing—original draft preparation, Y.D.; writing—review and editing, J.Y.
Funding
This research was funded by the National Natural Science Foundation of China, grant number 51605292.
Conflicts of Interest
The authors declare no conflict of interest.
References
- Betegón, C.; Peñuelas, I. A constraint based parameter for quantifying the crack tip stress fields in welded joints. Eng. Fract. Mech. 2006, 73, 1865–1877. [Google Scholar] [CrossRef]
- Yang, J.; Wang, G.Z.; Xuan, F.Z.; Tu, S.T. Unified characterisation of in-plane and out-of-plane constraint based on crack-tip equivalent plastic strain. Fatigue Fract. Eng. Mater. Struct. 2013, 36, 504–514. [Google Scholar] [CrossRef]
- Yang, J.; Wang, G.Z.; Xuan, F.Z.; Tu, S.T. Unified correlation of in-plane and out-of-plane constraints with fracture toughness. Fatigue Fract. Eng. Mater. Struct. 2014, 37, 132–145. [Google Scholar] [CrossRef]
- Yang, J.; Wang, G.Z.; Xuan, F.Z.; Tu, S.T. Unified correlation of in-plane and out-of-plane constraint with fracture resistance of a dissimilar metal welded joint. Eng. Fract. Mech. 2014, 115, 296–307. [Google Scholar] [CrossRef]
- Wang, H.T.; Wang, G.Z.; Xuan, F.Z.; Liu, C.J.; Tu, S.T. Local mechanical properties of a dissimilar metal welded joint in nuclear power systems. Mater. Sci. Eng. A 2013, 568, 108–117. [Google Scholar] [CrossRef]
- Wang, H.T.; Wang, G.Z.; Xuan, F.Z.; Tu, S.T. An experimental investigation of local fracture resistance and crack growth paths in a dissimilar metal welded joint. Mater. Des. 2013, 44, 179–189. [Google Scholar] [CrossRef]
- Fan, K.; Wang, G.Z.; Tu, S.T.; Xuan, F.Z. Geometry and material constraint effects on fracture resistance behavior of bi-material interfaces. Int. J. Fract. 2016, 201, 143–155. [Google Scholar] [CrossRef]
- Fan, K.; Wang, G.Z.; Xuan, F.Z.; Tu, S.T. Effects of work hardening mismatch on fracture resistance behavior of bi-material interface regions. Mater. Des. 2015, 68, 186–194. [Google Scholar] [CrossRef]
- Fan, K.; Wang, G.Z.; Xuan, F.Z.; Tu, S.T. Local fracture resistance behavior of interface regions in a dissimilar metal welded joint. Eng. Fract. Mech. 2015, 136, 279–291. [Google Scholar] [CrossRef]
- Sarikka, T.; Ahonen, M.; Mouginot, R.; Nevasmaa, P.; Karjalainen-Roikonen, P.; Ehrnstén, U.; Hänninen, H. Effect of mechanical mismatch on fracture mechanical behavior of SA508 e Alloy 52 narrow gap dissimilar metal weld. Int. J. Press. Vessels Pip. 2017, 157, 30–42. [Google Scholar] [CrossRef]
- Samal, M.K.; Balani, K.; Seidenfuss, M.; Roos, E. An experimental and numerical investigation of fracture resistance behaviour of a dissimilar metal welded joint. Proc. Inst. Mech. Eng. C 2009, 223, 1507–1523. [Google Scholar] [CrossRef]
- Yang, F.Q.; Xue, H.; Zhao, L.Y.; Fang, X.R. Effects of Welded Mechanical Heterogeneity on Interface Crack Propagation in Dissimilar Weld Joints. Adv. Mater. Sci. Eng. 2019, 2019. [Google Scholar] [CrossRef]
- Lindqvist, S.; Sarikka, T.; Ahonen, M.; Hänninen, H. The effect of crack path on tearing resistance of a narrow-gap Alloy 52 dissimilar metal weld. Eng. Fract. Mech. 2018, 201, 130–143. [Google Scholar] [CrossRef]
- Kumar, S.; Singh, P.K.; Karn, K.N.; Bhasin, V. Experimental investigation of local tensile and fracture resistance behaviour of dissimilar metal weld joint: SA508 Gr.3 Cl.1 and SA312 Type 304LN. Fatigue Fract. Eng. Mater. Struct. 2016, 40, 190–206. [Google Scholar] [CrossRef]
- Jang, C.; Lee, J.; Kim, J.S.; Jin, T.E. Mechanical property variation within inconel 82/182 dissimilar metal weld between low alloy steel and 316 stainless steel. Int. J. Press. Vessels Pip. 2008, 85, 635–646. [Google Scholar] [CrossRef]
- Xue, H.; Sun, J. Study on micro region of crack tip of welded joints under different matches of yield stress. Hot Work. Technol. 2016, 45, 239–245. [Google Scholar]
- Zhu, Z.Q.; Jing, H.Y.; Ge, J.G.; Chen, L.G. Effects of strength mis-matching on the fracture behavior of nuclear pressure steel A508-III welded joint. Mater. Sci. Eng., A 2005, 390, 113–117. [Google Scholar] [CrossRef]
- Younise, B.; Rakinb, M.; Gubeljakc, N.; Medjob, B.; Sedmakd, A. Effect of material heterogeneity and constraint conditions on ductile fracture resistance of welded joint zones—Micromechanical assessment. Eng. Fail. Anal. 2017, 82, 435–445. [Google Scholar] [CrossRef]
- Laukkanen, A.; Nevasmaa, P.; Ehrnstén, U.; Rintamaa, R. Characteristics relevant to ductile failure of bimetallic welds and evaluation of transferability of fracture properties. Nucl. Eng. Des. 2007, 237, 1–15. [Google Scholar] [CrossRef]
- Xue, H.; Ogawa, K.; Shoji, T. Effect of welded mechanical heterogeneity on local stress and strain ahead of stationary and growing crack tips. Nucl. Eng. Des. 2009, 239, 628–640. [Google Scholar] [CrossRef]
- Yang, J.; Wang, L. Effect Range of the Material Constraint-I. Center Crack. Materials 2019, 12, 67. [Google Scholar] [CrossRef] [PubMed]
- Østby, E.; Thaulow, C.; Zhang, Z.L. Numerical simulations of specimen size and mismatch effects in ductile crack growth-Part I: Tearing resistance and crack growth paths. Eng. Fract. Mech. 2007, 74, 1770–1792. [Google Scholar] [CrossRef]
- Kim, Y.J.; Schwalbe, K. Mismatch effect on plastic yield loads in idealised weldments: I. Weld centre cracks. Eng. Fract. Mech. 2001, 68, 163–182. [Google Scholar] [CrossRef]
- Kim, Y.J.; Schwalbe, K.H. Mismatch effect on plastic yield loads in idealised weldments: II. Heat affected zone cracks. Eng. Fract. Mech. 2001, 68, 183–199. [Google Scholar] [CrossRef]
- Kim, Y.J.; Schwalbe, K.H. Compendium of yield load solutions for strength mis-matched DE(T), SE(B) and C(T) specimens. Eng. Fract. Mech. 2001, 68, 1137–1151. [Google Scholar] [CrossRef]
© 2019 by the authors. Licensee MDPI, Basel, Switzerland. This article is an open access article distributed under the terms and conditions of the Creative Commons Attribution (CC BY) license (http://creativecommons.org/licenses/by/4.0/).